Embed Size (px)
Citation preview
A New Methodology to Derive Objective Quality Assessment
Metrics for Scalable Multi-view 3D Video Coding1 HODA ROODAKI
1, MAHMOUD REZA HASHEMI
1, SHERVIN SHIRMOHAMMADI
2, 1
1University of Tehran, 2University of Ottawa
With the growing demand for 3D video, efforts are underway to incorporate it in the next generation of broadcast and streaming applications and
standards. 3D video is currently available in games, entertainment, education, security, and surveillance applications. A typical scenario for multi-view 3D consists of several 3D video sequences captured simultaneously from the same scene with the help of multiple cameras from different
positions and through different angles. Multi-view video coding provides a compact representation of these multiple views by exploiting the large
amount of inter-view statistical dependencies. One of the major challenges in this field is how to transmit the large amount of data of a multi-view sequence over error prone channels to heterogeneous mobile devices with different bandwidth, resolution, and processing/battery power, while
maintaining a high visual quality. Scalable Multi-view 3D Video Coding (SMVC) is one of the methods to address this challenge; however, the evaluation of the overall visual quality of the resulting scaled-down video requires a new objective perceptual quality measure specifically designed
for scalable multi-view 3D video. Although several subjective and objective quality assessment methods have been proposed for multi-view 3D
sequences, no comparable attempt has been made for quality assessment of scalable multi-view 3D video. In this paper, we propose a new
methodology to build suitable objective quality assessment metrics for different scalable modalities in multi-view 3D video. Our proposed
methodology considers the importance of each layer and its content as a quality of experience factor in the overall quality. Furthermore, in addition
to the quality of each layer, the concept of disparity between layers (inter-layer disparity) and disparity between the units of each layer (intra-layer disparity) is considered as an effective feature to evaluate overall perceived quality more accurately. Simulation results indicate that by using this
methodology, more efficient objective quality assessment metrics can be introduced for each multi-view 3D video scalable modalities.
Categories and Subject Descriptors: H.5.1 [Information Interfaces and Presentation]: Multimedia Information Systems—
Evaluation/methodology. I.4.5 [Image Processing and Computer Vision]: Reconstruction
General Terms: Design
Additional Key Words and Phrases: Multi-view 3D video, mobile 3D video, objective quality assessment, scalable modalities.
1. INTRODUCTION
Stereo-paired video for 3D viewing (a.k.a 3D video) has recently become a significant contributor to the
entertainment industry and consumer electronic market, and has subsequently attained a high level of interest from the
research community as well. 3D video provides viewers with a more realistic experience compared to traditional 2D
video. Through advances in 3D display and transmission technology, noticeable increase in the production of 3D
content has occurred. Several 3D video formats have been introduced in the literature (Do et al. 2010, Muller et al.
2011, Tanimoto 2009, ISO/IEC JTC 2005). The simplest format is stereoscopic 3D that provides two distinct views,
one for each eye (Do et al. 2010). The sensation of depth is supported by projecting slightly different signals for the
viewer’s left and right eyes (Muller et al. 2011). At the same time, recent advances in 3D display technology have
made it possible to generate true 3D displays that provide 3D perception without the need for special glasses (Zhu.
2009). Using this new technology, one can introduce an extended version of stereoscopic 3D video, referred to as
multi-view autostereoscopic 3D video. Autostereoscopic displays are used to achieve the capability of showing
different images on the same plane from different points of view." (Dodgson 2005). One application of 3D video is
free viewpoint video which enables the user to select its viewpoint freely and interactively. To support this
application, multi-view 3D, also known as FTV, has been introduced as another type of 3D video (Tanimoto 2009).
Authors’ addresses: H. Roodaki and M.R. Hashemi, Multimedia Processing Laboratory, School of Electrical and Computer Engineering, College of
Engineering, University of Tehran, Iran; email: [email protected], [email protected]. S. Shirmohammadi, Distributed and Collaborative Virtual Environments Research Laboratory (DISCOVER Lab), School of Information
Technology and Engineering, University of Ottawa, Canada; email: [email protected]. Multimedia Processing Laboratory, School of
Electrical and Computer Engineering, College of Engineering, University of Tehran, Iran; email: [email protected] Permission to make digital or hardcopies of part or all of this work for personal or classroom use is granted without fee provided that copies are not
made or distributed for profit or commercial advantage and that copies show this notice on the first page or initial screen of a display along with the
full citation. Copyrights for components of this work owned by others than ACM must be honored. Abstracting with credits permitted. To copy otherwise, to republish, to post on servers, to redistribute to lists, or to use any component of this work in other works requires prior specific
permission and/or a fee. Permissions may be requested from Publications Dept., ACM, Inc., 2 Penn Plaza, Suite 701, New York, NY 10121-0701
USA, fax +1 (212) 869-0481, or [email protected]. @2010 ACM 1544-3558/2010/05-ART1 $10.00
DOI10.1145/0000000.0000000 http://doi.acm.org/10.1145/0000000.0000000
Multi-view Video Coding (MVC) is one of the latest amendments to the H.264/AVC standard (ITU-T Rec. H.264
2010) that allows us to compress stereoscopic and multi-view 3D video streams more efficiently. MVC has gained
much popularity in recent years with a variety of multi-view 3D applications such as immersive teleconferencing,
3DTV, and FTV having made their way to the market. A typical multi-view 3D sequence consists of multiple videos
captured simultaneously from the same scene by several cameras that are located at different positions (Do et al.
2010, Ho and Oh 2007). In immersive video communication applications, such as free viewpoint and 3D television,
the amount of data that has to be stored or transmitted increases proportionally with the number of cameras, hence
efficient compression of multi-view 3D video data is crucial. One approach to reduce the amount of data is the
scalability of the coded bitstream, which is particularly useful for the transmission of multi-view 3D video in
heterogeneous environments where receivers have different bandwidth, display size, and processing power. Scalable
Video Coding (SVC) enables the decoding of partial bitstreams (called layers) to provide video sequences with lower
temporal/spatial resolutions or reduced quality (Schwarz et al. 2007). Typically, a “Base” layer is built which carries
the minimum amount of video information that is necessary. One or more “Enhancement” layers can be built to
increase the quality on top of the base layer. As a result, a receiver that receives just part of the original stream
(consisting of the base layer plus few enhancement layers) is still able to reconstruct the content at lower quality,
resolution, frame rate or number of views. For instance, a 5-view video can be scaled down to a stereoscopic 3D
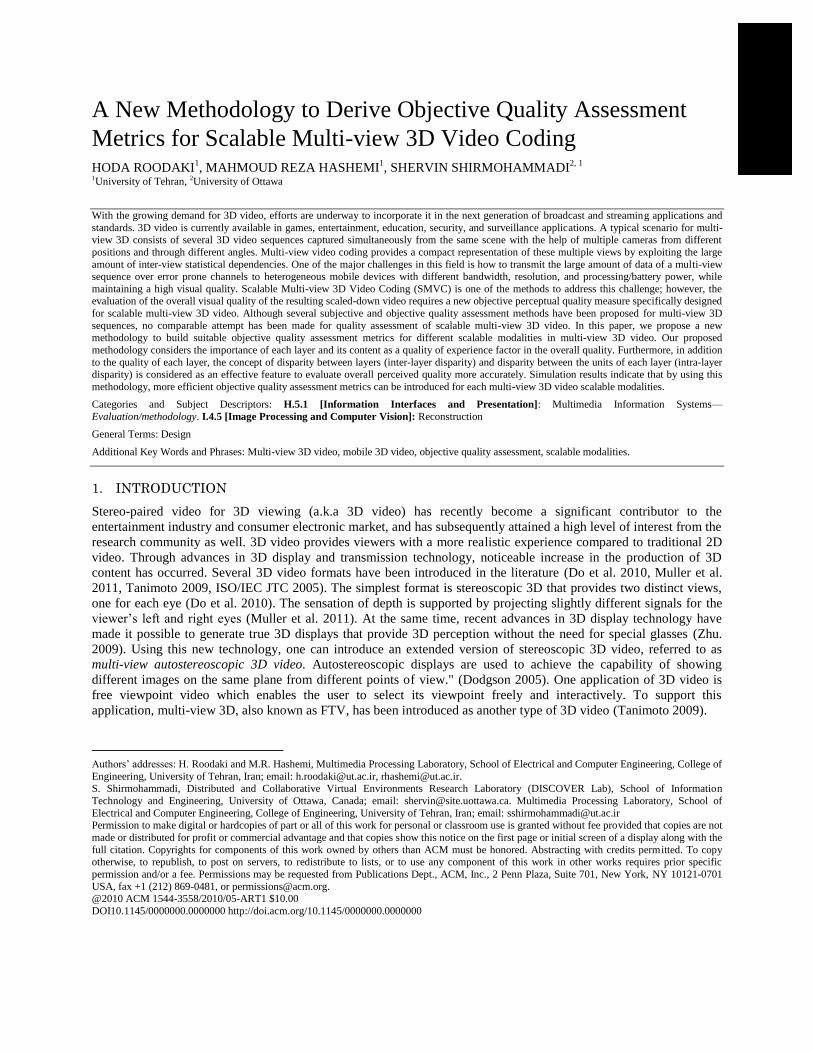
video suitable for a mobile device with limited bandwidth and processing power. The example is illustrated in Fig. 1
where a scene is being captured by multiple cameras, leading to a multi-view 3D video. The video then needs to be
adapted to the capabilities of each receiver. For a mobile phone with limited processing power and bandwidth, only a
scaled down stereoscopic 3D version, consisting of two views that are encoded with MVC or view plus depth
information, can be transmitted. A portable tablet with more resources may receive 4 views out of the available 5 of
this example.
Fig. 1. An example for SMVC. (a) A portable tablet receives 4 views, and (b) a mobile phone receives stereoscopic 3D video transmitted as one
view plus depth information, or as two views
While SMVC can help support heterogeneous mobile receivers, how to apply it in a given type of scalability in
order to achieve the highest quality of experience for the user is not trivial. For instance, in the previous example for
view scalability, we still need to determine which 2 out of the 5 available views should be selected to form the scaled
down stereoscopic 3D video while achieving the highest quality on the mobile phone (Roodaki et al. 2011).
Before being able to answer this question, a definition of quality must first exist. Furthermore, to guarantee a
sustainable quality in error prone environments, continuous quality assessment is necessary (Feghali et al. 2007). This
means that there is a need to objectively assess the quality of SMVC: a capability that is currently missing.
The quality assessment of scalable multi-view 3D video has several challenges. Although different subjective and
objective video quality assessment methods have been proposed for multi-view 2D and 3D video, none of them can
be generalized to SMVC easily and efficiently. Furthermore, subjective quality assessment methods are very time
consuming and hence not practical in real-time applications. In fact, the goal of objective quality evaluation is to
provide an automatic and reliable way to estimate the quality of video as perceived by the user. For this purpose, the
new concept of Quality of Experience (QoE) should be considered essentially in objective quality assessment.
In this paper, we propose a methodology to build proper objective quality metrics for scalable multi-view 3D
video. This systematic approach consists of two distinct steps: the evaluation of the quality of each layer, and then the
overall quality assessment of the SMVC video.
A weighted sum approach has been used for each step, since it can consider the user experience more effectively
in objective quality assessment. This has been complemented with the introduction of the concepts of disparity
(a)
(b)
between layers, referred to hereafter as inter-layer disparity (Inter-LD), and disparity between units within each layer,
referred to hereafter as intra-layer disparity (Intra-LD), as the main characteristics of multi-view 3D video scalability.
Our methodology specifies these concepts for each scalable modality, accordingly. Next it uses these specified
disparities to find the proper weights for overall quality assessment of each layer and also to combine the quality of
various layers in order to estimate the objective quality of the overall SMVC. Simulation results examine the
effectiveness of the objective quality metrics that were derived using the proposed methodology for two sample multi-
view 3D video scalable modalities. The good correlation between the objective quality results of the derived metric,
and subjective quality assessment results demonstrate the effectiveness of our proposed methodology in deriving
suitable objective quality measures for each multi-view 3D video scalable modalities.
The rest of this paper is organized as follows: Section 2 presents the related methods for scalable video coding
and quality assessment of multi-view 3D video. Some new scalable modalities for multi-view 3D video that are used
in this paper to evaluate the proposed methodology and in some cases explain its steps have been introduced in
Appendix A. The proposed methodology to build objective quality assessment metrics for SMVC is presented in
section 3. Performance evaluation results for the new objective quality assessment methods that were derived using
the proposed methodology for various scalable modalities are presented in section 4. The details of the procedure of
our subjective test are described in Appendix B. Finally, the paper ends in section 5 with the concluding remarks.
2. RELATED WORK
2.1 Scalability in Multi-view 3D Video
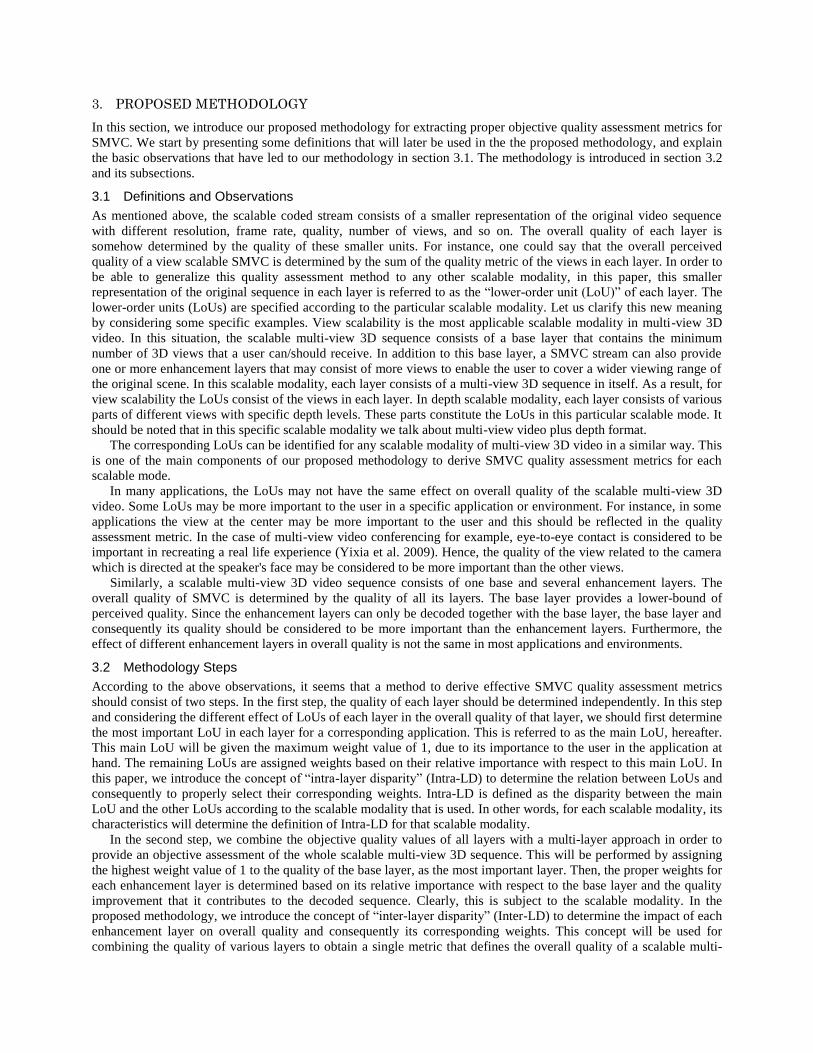
As mentioned in the previous section, scalability is an effective approach to reduce the amount of data in multi-view
3D video applications and to efficiently transmit video in heterogeneous environments such as mobile applications.
Several scalable modalities for single view and multi-view 3D video have been introduced in the literature. In single
view video, temporal, spatial and quality scalability and various combinations of them have been used frequently in
order to produce scalable bitstreams (Schwarz et al. 2007). Temporal scalability, allows the extraction of multiple
layers with different frame rates from a single coded stream. In spatial scalability, video is coded in various layers
with different spatial resolutions. SNR scalability provides layers with different quality levels. Region-Of-Interest
(ROI) and object-based scalability are two other scalable modalities that have been used in some specific applications
in single view video (Grois et al. 2010).
In addition to the above single-view scalabilities, several other scalable modalities have been proposed specifically
for multi-view 3D video. For instance, view scalability enables the decoder to pick the number of desired views that
should be decoded according to its own available resources (Shimizu et al. 2007). In another approach, free view-
point scalability provides a scalable bitstream structure to access partial bitstreams that generate selected views at the
decoder side (Yo-Sung Ho and Kwan-Jung Oh 2007). In stereoscopic video, scalability usually refers to keeping the
non-stereoscopic bitstream as the base layer and putting the residual stereoscopic signal in one or more enhancement
layers. Finally, frame compatible video format is a 3D video format in which the left and right views are packed
together in a single frame and with half the resolution of the full coded frame (Vetro et al. 2011). This structure for
representing 3D video facilitates the extension of conventional scalable modalities of single-view to multi-view 3D
(Vetro and Tourapis et al. 2011). Fig. 2 illustrates some of these various scalable modalities visually.
According to the literature, multi-view 3D scalability modes have been either extended from single view by
applying the single view modes to each view independently, or defined for one specific multi-view 3D application.
This approach cannot guarantee that all useful modalities for all multi-view 3D applications are defined. We have
introduced some new scalable modalities that were derived using the Grounded Theory as a qualitative research
approach in Appendix A such as depth scalability. In this paper we will propose a methodology for objective quality
assessment in SMVC that can be generalized to any scalable modality, including depth scalability.
2.2 Quality Assessment in Multi-view 3D video
The goal of video quality assessment is to estimate the viewer’s perception and satisfaction of a video. This can be
done in two ways: subjective assessment, and objective assessment. Subjective quality assessment, where the viewer
explicitly scores a sequence according to its perceived quality, provides a more accurate estimate of a user’s
experience. Unfortunately, subjective video quality tests cannot be used practically in real-time and in automatic
calculations in all video applications. Thus, objective video evaluation techniques are used to estimate video quality
by considering mathematical models that approximate the results of subjective quality assessment.
The objective quality assessment metrics are categorized in three major groups referred to in the literature as full-
reference, no-reference and reduced-reference quality metrics (Hewage and Martini 2011). In full-reference methods,
the original video sequence should be available at the receiver side to evaluate the quality. In no-reference quality
metrics, the overall quality measurement is performed only based on the received sequence. Finally, reduced-
reference quality metrics predict the quality degradation by solely relying on partial information from the reference
picture (Li and Wang 2009). The most common method for evaluating the quality of digital video in full-reference
metrics is calculating the peak signal to noise ratio (PSNR) between the original and the processed video. Although
this method works in the majority of cases, experimental results indicate that it does not always align well with human
visual perception due to the non-linear behavior of the human visual system (Lin and Kuo 2011). Therefore, several
other objective metrics such as Structural Similarity Index Method (SSIM) have been introduced that provide a better
estimate. SSIM reflects the structural distortion between the processed and the reference video, and hence provides a
better approximation of perceived quality (Li et al. 2010).
Several subjective quality assessment methods have also been proposed specifically for multi-view 3D video.
(Barkowsky et al. 2010) discuss the influence of transmission distortions and different error concealment strategies on
the subjective perception in the 3D case. (Saygili et al. 2010) consider the effect of asymmetric coding in the
subjective quality of 3D stereo video. (Ozbek et al. 2011) propose another interactive method to measure the
perceptual quality of asymmetric coded video. In (Umar et al. 2011) subjective tests are performed to validate the 3D
video quality and depth perception. These experiments are used to determine more precise objective quality metrics.
Similarly, few methods have been proposed specifically for objective quality assessment of multi-view 3D video.
(Kim et al. 2009) propose a depth map quality metric for stereoscopic and autostereoscopic 3D video. (Leon et al.
2008) present the effect of depth quality on 3D video perception using objective as well as subjective evaluations.
(Joveluro et al. 2010) suggest a perceptual based objective metric for 3D video quality assessment that is more
sensitive to slight changes in image degradation and error quantification. In (Shao et al. 2009) an objective assessment
algorithm is proposed that uses the depth map as well as the stereoscopic views. This method is based on the detection
of edge and color degradations. (Nur et al. 2011) extend the standardized VQM model using the ambient illumination,
and content related features such as motion, structural feature, and luminance contrast to estimate the 3D video
quality.
(Jin et al. 2011) present a quality assessment method for stereoscopic video based on 3D-DCT transform. It
extracts similar blocks from left and right views by block-matching and by analyzing the 3D-DCT. The MSE is
calculated in the 3D-DCT domain. (Ha and Kim. 2011) propose an objective quality assessment metric that considers
the factors that affect human perception of depth and visual comfort, such as temporal variance, disparity variation in
intra-frames, disparity variation in inter-frames and disparity distribution of frame boundary areas.
Finally, QoE in multi-view 3D video has also been considered in recent years. (Yamagishi et al. 2011) claim that
the 3D video QoE depends on encoding video formats such as frame-compatible and frame-sequential formats. They
conducted several subjective assessments for side-by-side and frame-sequential video sequences to compare the
quality and depth perception of these two formats. (Gutierrez et al. 2011) study the impact of transmission errors on
the quality of experience in 3DTV systems. They assumed that video is delivered in side-by-side format over a
packet-based network. (Rodriguez et al. 2009) examine QoE of multi-view video and audio transmission over IP
networks. They compare a scheme where the user watches a single viewpoint with one where the viewpoint can be
chosen. (Liyuan et al. 2011) propose two objective metrics for predicting the stereoscopic QoE. One of them uses the
significant factors of QoE such as scene content, camera baseline, screen size and crosstalk level directly, while the
other one uses perceptual attributes, including crosstalk perception and perceived depth.
In terms of 3D media delivery, quality measures can be used as a feedback to adjust video transmission and
system parameters. In this case, quality should be evaluated at the receiver side even when the original 3D video
sequence is not available. Reduced-reference and no-reference quality metrics are essential to overcome this challenge
(Martini and Hewage 2011). (Mittal et al. 2011) propose a no-reference metric that extracts statistical features from
disparity and disparity gradient maps and spatial activity from images. Then, these spatial features and motion
compensated disparity differences are utilized to predict quality of experience. (Maalouf and Larabi 2010) present a
no-reference objective video quality assessment metric that is presented using wavelet decomposition, inter-frame
coherence and the sharpness of edges in the successive frames. (Hewage and Martini 2010) propose a reduced-
reference quality metric for the depth maps associated with color plus depth 3D video using edge detection. (Hewage
and Martini, 2010) introduce a reduced-reference quality metric for 3D depth map transmission that considers the
extracted edge information.
Although the above methods can be used to quantify the quality of multi-view 3D video, to the best of our
knowledge, a metric to quantify the overall quality in SMVC is still lacking. It should be noted that the above
methods cannot be simply generalized and applied to SMVC. The overall quality in SMVC is in fact determined by
the application, network conditions, and receiver constraints. For instance, in view scalability, the perceived quality of
an SMVC video may not be affected at all by one or more low quality views of enhancement layers, since those views
may be discarded anyway due to network or receiver limitations. Our proposed systematic methodology for scalable
multi-view 3D quality assessment takes into account all of these factors, as explained in details next.
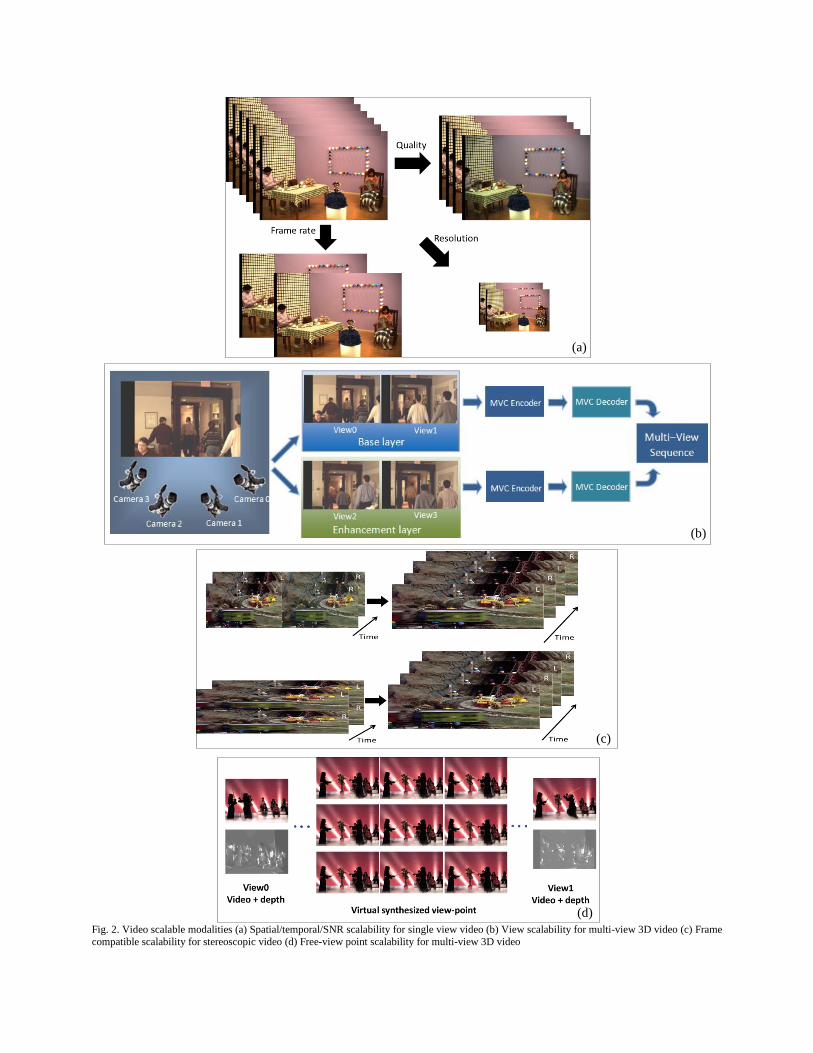
Fig. 2. Video scalable modalities (a) Spatial/temporal/SNR scalability for single view video (b) View scalability for multi-view 3D video (c) Frame
compatible scalability for stereoscopic video (d) Free-view point scalability for multi-view 3D video
(a)
(b)
(c)
(d)
3. PROPOSED METHODOLOGY
In this section, we introduce our proposed methodology for extracting proper objective quality assessment metrics for
SMVC. We start by presenting some definitions that will later be used in the the proposed methodology, and explain
the basic observations that have led to our methodology in section 3.1. The methodology is introduced in section 3.2
and its subsections.
3.1 Definitions and Observations
As mentioned above, the scalable coded stream consists of a smaller representation of the original video sequence
with different resolution, frame rate, quality, number of views, and so on. The overall quality of each layer is
somehow determined by the quality of these smaller units. For instance, one could say that the overall perceived
quality of a view scalable SMVC is determined by the sum of the quality metric of the views in each layer. In order to
be able to generalize this quality assessment method to any other scalable modality, in this paper, this smaller
representation of the original sequence in each layer is referred to as the “lower-order unit (LoU)” of each layer. The
lower-order units (LoUs) are specified according to the particular scalable modality. Let us clarify this new meaning
by considering some specific examples. View scalability is the most applicable scalable modality in multi-view 3D
video. In this situation, the scalable multi-view 3D sequence consists of a base layer that contains the minimum
number of 3D views that a user can/should receive. In addition to this base layer, a SMVC stream can also provide
one or more enhancement layers that may consist of more views to enable the user to cover a wider viewing range of
the original scene. In this scalable modality, each layer consists of a multi-view 3D sequence in itself. As a result, for
view scalability the LoUs consist of the views in each layer. In depth scalable modality, each layer consists of various
parts of different views with specific depth levels. These parts constitute the LoUs in this particular scalable mode. It
should be noted that in this specific scalable modality we talk about multi-view video plus depth format.
The corresponding LoUs can be identified for any scalable modality of multi-view 3D video in a similar way. This
is one of the main components of our proposed methodology to derive SMVC quality assessment metrics for each
scalable mode.
In many applications, the LoUs may not have the same effect on overall quality of the scalable multi-view 3D
video. Some LoUs may be more important to the user in a specific application or environment. For instance, in some
applications the view at the center may be more important to the user and this should be reflected in the quality
assessment metric. In the case of multi-view video conferencing for example, eye-to-eye contact is considered to be
important in recreating a real life experience (Yixia et al. 2009). Hence, the quality of the view related to the camera
which is directed at the speaker's face may be considered to be more important than the other views.
Similarly, a scalable multi-view 3D video sequence consists of one base and several enhancement layers. The
overall quality of SMVC is determined by the quality of all its layers. The base layer provides a lower-bound of
perceived quality. Since the enhancement layers can only be decoded together with the base layer, the base layer and
consequently its quality should be considered to be more important than the enhancement layers. Furthermore, the
effect of different enhancement layers in overall quality is not the same in most applications and environments.
3.2 Methodology Steps
According to the above observations, it seems that a method to derive effective SMVC quality assessment metrics
should consist of two steps. In the first step, the quality of each layer should be determined independently. In this step
and considering the different effect of LoUs of each layer in the overall quality of that layer, we should first determine
the most important LoU in each layer for a corresponding application. This is referred to as the main LoU, hereafter.
This main LoU will be given the maximum weight value of 1, due to its importance to the user in the application at
hand. The remaining LoUs are assigned weights based on their relative importance with respect to this main LoU. In
this paper, we introduce the concept of “intra-layer disparity” (Intra-LD) to determine the relation between LoUs and
consequently to properly select their corresponding weights. Intra-LD is defined as the disparity between the main
LoU and the other LoUs according to the scalable modality that is used. In other words, for each scalable modality, its
characteristics will determine the definition of Intra-LD for that scalable modality.
In the second step, we combine the objective quality values of all layers with a multi-layer approach in order to
provide an objective assessment of the whole scalable multi-view 3D sequence. This will be performed by assigning
the highest weight value of 1 to the quality of the base layer, as the most important layer. Then, the proper weights for
each enhancement layer is determined based on its relative importance with respect to the base layer and the quality
improvement that it contributes to the decoded sequence. Clearly, this is subject to the scalable modality. In the
proposed methodology, we introduce the concept of “inter-layer disparity” (Inter-LD) to determine the impact of each
enhancement layer on overall quality and consequently its corresponding weights. This concept will be used for
combining the quality of various layers to obtain a single metric that defines the overall quality of a scalable multi-
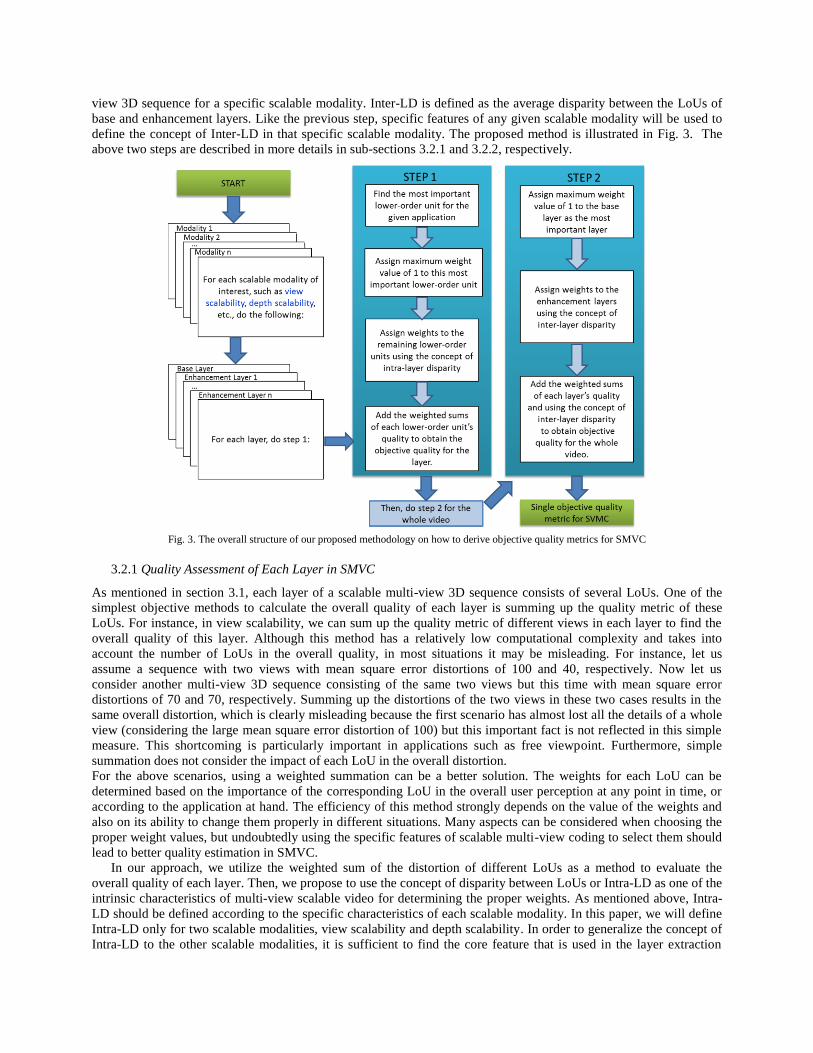
view 3D sequence for a specific scalable modality. Inter-LD is defined as the average disparity between the LoUs of
base and enhancement layers. Like the previous step, specific features of any given scalable modality will be used to
define the concept of Inter-LD in that specific scalable modality. The proposed method is illustrated in Fig. 3. The
above two steps are described in more details in sub-sections 3.2.1 and 3.2.2, respectively.
Fig. 3. The overall structure of our proposed methodology on how to derive objective quality metrics for SMVC
3.2.1 Quality Assessment of Each Layer in SMVC
As mentioned in section 3.1, each layer of a scalable multi-view 3D sequence consists of several LoUs. One of the
simplest objective methods to calculate the overall quality of each layer is summing up the quality metric of these
LoUs. For instance, in view scalability, we can sum up the quality metric of different views in each layer to find the
overall quality of this layer. Although this method has a relatively low computational complexity and takes into
account the number of LoUs in the overall quality, in most situations it may be misleading. For instance, let us
assume a sequence with two views with mean square error distortions of 100 and 40, respectively. Now let us
consider another multi-view 3D sequence consisting of the same two views but this time with mean square error
distortions of 70 and 70, respectively. Summing up the distortions of the two views in these two cases results in the
same overall distortion, which is clearly misleading because the first scenario has almost lost all the details of a whole
view (considering the large mean square error distortion of 100) but this important fact is not reflected in this simple
measure. This shortcoming is particularly important in applications such as free viewpoint. Furthermore, simple
summation does not consider the impact of each LoU in the overall distortion.
For the above scenarios, using a weighted summation can be a better solution. The weights for each LoU can be
determined based on the importance of the corresponding LoU in the overall user perception at any point in time, or
according to the application at hand. The efficiency of this method strongly depends on the value of the weights and
also on its ability to change them properly in different situations. Many aspects can be considered when choosing the
proper weight values, but undoubtedly using the specific features of scalable multi-view coding to select them should
lead to better quality estimation in SMVC.
In our approach, we utilize the weighted sum of the distortion of different LoUs as a method to evaluate the
overall quality of each layer. Then, we propose to use the concept of disparity between LoUs or Intra-LD as one of the
intrinsic characteristics of multi-view scalable video for determining the proper weights. As mentioned above, Intra-
LD should be defined according to the specific characteristics of each scalable modality. In this paper, we will define
Intra-LD only for two scalable modalities, view scalability and depth scalability. In order to generalize the concept of
Intra-LD to the other scalable modalities, it is sufficient to find the core feature that is used in the layer extraction
process in those scalable modalities. For example in SNR scalability, frames with different quality are generated for
various layers. This implies that in this specific scalable modality, the concept of "quality" in terms of SNR is
considered as the main feature to generate various layers. Hence, the difference between the SNR quality levels of
various frames within different layers will be used to define the "disparity" concept in this specific scalable modality,
and will be used in calculating the Intra-LD. As another example, in spatial scalability, spatial resolutions of the
generated frames in various layers are different. Hence, the concept of "resolution" is the key feature to produce
various layers in this modality. Hence, the difference between the resolutions of pictures is considered as the
"disparity" concept in this specific scalable modality, and will be used in calculating the Intra-LD. In other word, all
we need in order to generalize the Intra-LD concept to other scalable modalities is the core feature that is used in the
layer extraction process of each modality, which is trivial to find.
We will explain the details of our suggested approach more clearly by considering two specific multi-view
scalable modalities: view scalability, and depth scalability, as described next.
3.2.1.1. Quality Assessment of Each Layer in View Scalability
In multi-view video coding, each view should be predicted from the most similar views in order for the MVC stream
to be compressed more efficiently. This implies that the distortion of each view is highly correlated with the distortion
of its reference views. Therefore, the weight of the distortion of each view should be less than the weight of their
corresponding reference(s) in the total distortion assessment. By using this approach, the effect of the distortion of
each reference view is not overemphasized by being considered more than once. In multi-view video coding, disparity
compensated prediction exploits the correlation among different views (Ka-Man Wong et al. 2011). Clearly, the
disparity between frames of various views is a good measure to select the proper reference for prediction because it
represents the similarity of different views precisely and can be considered as a measure to illustrate the efficiency of
the prediction process reasonably well. The efficiency of the prediction process has a direct impact on the overall
quality. Hence, the disparity between frames of various views can provide a good estimate for the overall perceived
quality. Consequently, our methodology uses the concept of disparity between frames of various views as the Intra-
LD in this specific scalable modality and then uses it as a criterion to determine the weight values.
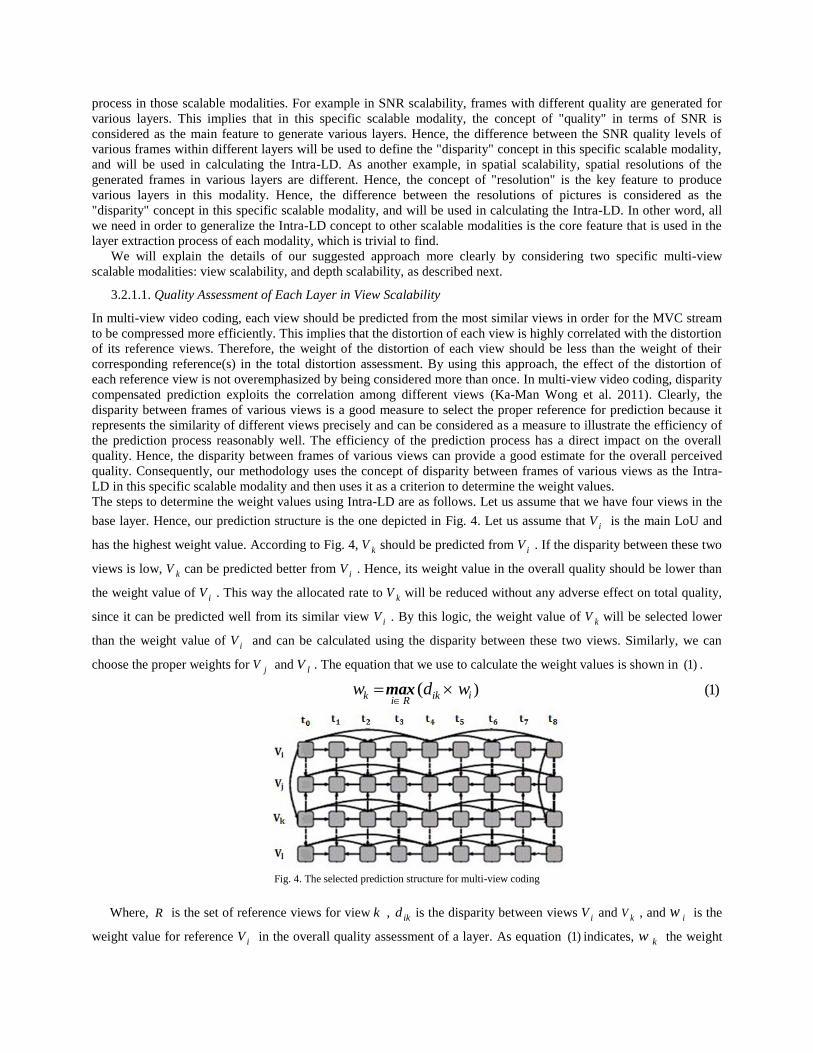
The steps to determine the weight values using Intra-LD are as follows. Let us assume that we have four views in the
base layer. Hence, our prediction structure is the one depicted in Fig. 4. Let us assume that iV is the main LoU and
has the highest weight value. According to Fig. 4, kV should be predicted from iV . If the disparity between these two
views is low, kV can be predicted better from iV . Hence, its weight value in the overall quality should be lower than
the weight value of iV . This way the allocated rate to kV will be reduced without any adverse effect on total quality,
since it can be predicted well from its similar view iV . By this logic, the weight value of kV will be selected lower
than the weight value of iV and can be calculated using the disparity between these two views. Similarly, we can
choose the proper weights for jV and lV . The equation that we use to calculate the weight values is shown in (1) .
(1))( ik iki R
w d w
max
Fig. 4. The selected prediction structure for multi-view coding
Where, R is the set of reference views for view k , ikd is the disparity between views iV and kV , and iw is the
weight value for reference iV in the overall quality assessment of a layer. As equation (1) indicates, kw the weight
value of view kV is calculated using iw the weight value of its corresponding reference iV and according to the
disparity between them. In addition, if according to the prediction structure a view has more than one reference, such
as jV in Fig. 4, this is calculated for each reference view and the maximum is selected. We have used the maximum
function in order to avoid underestimating the effect of the quality of the current view in the overall perceptual quality
due to the presence of less effective references in the prediction structure. Our experiments indicate that the proposed
approach has been able to estimate the overall quality more accurately.
3.2.1.2. Quality Assessment of Each Layer in Depth Scalability
We can apply our proposed methodology to derive an objective quality assessment metric for depth scalability as
well. First, we should select the most important LoU according to our application and our viewers’ preference. For
instance, if the viewer prefers to see the closer parts of the scene more clearly, the LoU which contains parts of the
scene with the corresponding depth levels should be considered as the most important LoU. Then we assign the
maximum weight value of 1 to this LoU. LoUs with a depth level far away from the user specified depth do not
significantly contribute to the viewers’ experience in this application. Contrariwise, the quality of LoUs closer to the
user specified depth will be perceived more. Consequently, our methodology uses the distance between depth levels
of various LoUs as the measure of Intra-LD in this special scalable modality and uses it as a criterion to determine the
weight values. Based on the above, we can calculate the weight of a given LoU k as follows:
(2)ik
ik
1w w
1+d
Where, ikd is the disparity between depth level of LoU k and LoU i , the latter being the most important LoU,
and iw is the weight value for LoU i . Since the denominator of the fraction in equation (2) is always higher than it
nominator, the weight value of all LoUs will be lower than the most important one. Clearly this equation assigns
higher weight values to the LoUs with lower depth disparity respect to the most important LoU. This way, the impact
of the quality of such LoUs will be reflected better in the overall quality assessment.
Similarly, the same weighted sum approach can be used for any other scalable modality to extract the overall
quality of each layer as shown in STEP 1 of Fig. 3.The weights are determined using the specific characteristics of
that scalable modality and the corresponding Intra-LD concept. To determine the weight calculation for any scalable
modality using these two, one should first choose what core feature of that scalability relates the LoUs together and
how. For instance in view scalability LoUs are related to each other through the prediction structure. In depth
scalability this relation is defined by the distance of depth levels. Second, one should determine how this relation
impacts the overall quality. For instance, the prediction structure implies that since a reference has a higher impact in
overall quality it should have a larger weight, as well. This can be expressed in a weight formula similar to (1) for
view scalability. In depth scalability since we defined the relation to be the LoU distance, this implies that LoUs with
a larger distance from the main LoU are less important to the viewer and hence should have a smaller weight value.
This has resulted in a weight formula similar to (2) for this scalable modality.
3.2.2 Overall Quality Assessment of SMVC
In this section, we explain how to merge the quality of each layer to find the overall quality of the scalable multi-view
3D video. We can generalize the proposed method of section 3.2.1 to scalable multi-view 3D video by considering
different weight values for various layers and using their weighted sum for overall quality assessment. Our
methodology suggests that the total number of received layers and the Inter-LD (i.e. the disparity between layers)
should be considered concurrently to provide a better estimate for the overall quality. The concept of Inter-LD should
be defined for each scalable modality. Again in this paper, we will define Inter-LD only for two scalable modalities,
view scalability and depth scalability. But the concept can be generalized to any other scalable modality, such as SNR
scalability, in the same way that was explained in section 3.2.1.
In SMVC, the quality of enhancement layers can affect the overall perceived quality according to their inter layer
disparity with the base layer. When the average disparity between the LoUs of layers is low, the overall viewer
perception can be improved by using higher quality LoUs of enhancement layers. Hence, we should select a higher
weight value for the enhancement layer in this case. Consequently, our methodology suggests using the Inter-LD as a
proper concept to find appropriate weight values for the quality of base and enhancement layers.
Moreover, Inter-LD concept can affect the overall quality perception by changing the quality of re-created layers.
When enhancement layers are discarded due to receiver or network limitations, the corresponding missing LoUs
should be re-created at the receiver side using the available LoUs, which usually means with the base layer LoUs
only. A lower Inter-LD between base and enhancement layers can lead to a better recovery of the corrupted or
dropped LoUs. The above explanations implies that the overall quality perception depends on the number of received LoUs of the
enhancement layer and also the Inter-LD between base and enhancement layer as well as the quality of each layer.
This way, our equation for calculating the overall quality in SMVC has five main parameters ew , bw , bQ , eQ
and avg_inter_LD . These parameters and the method for calculating them are explained below.
bw and ew are the weight values for the quality of base and enhancement layers, respectively. We have assigned
the maximum weight value of 1 to bw , since the base layer is the most important layer. Then the weight value of
enhancement layers will be calculated as follows:
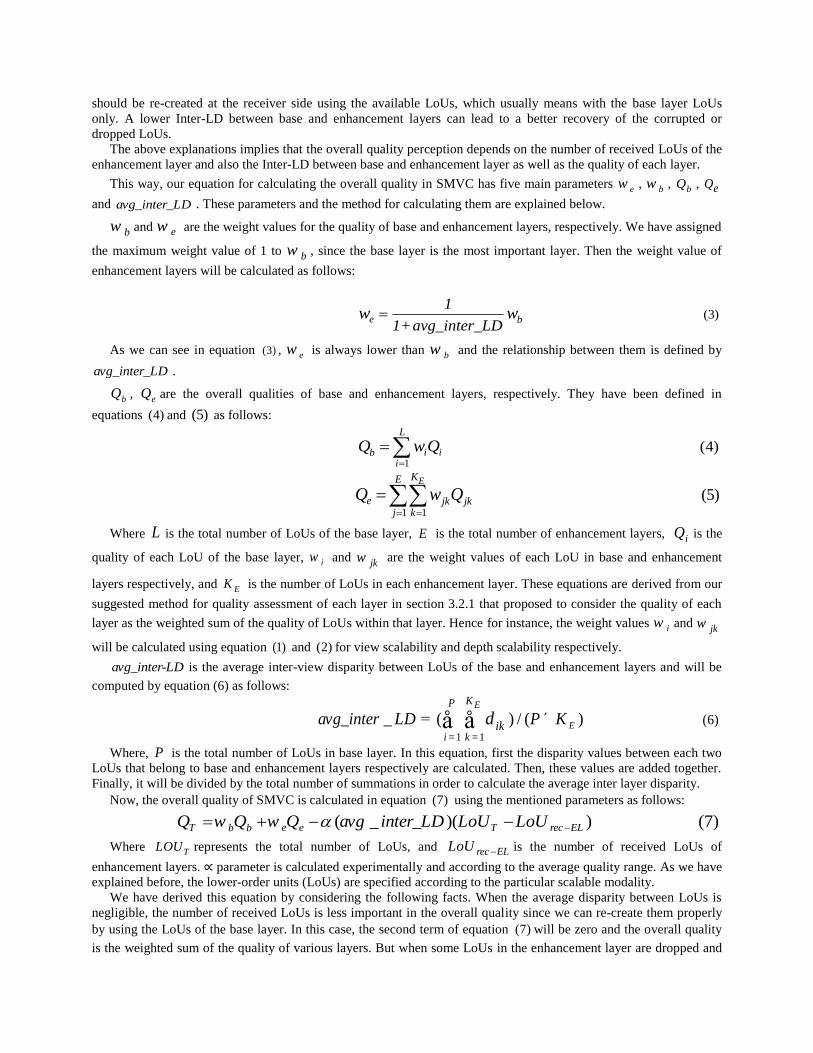
(3)e b
1
1+avg_inter_LDw w
As we can see in equation (3) , ew is always lower than bw and the relationship between them is defined by
avg_inter_LD .
bQ , eQ are the overall qualities of base and enhancement layers, respectively. They have been defined in
equations (4) and (5) as follows:
1
(4)L
i ibi
Q w Q
1 1
(5)EKE
e jk jkj k
Q w Q
Where L is the total number of LoUs of the base layer, E is the total number of enhancement layers, iQ is the
quality of each LoU of the base layer, iw and jkw are the weight values of each LoU in base and enhancement
layers respectively, and EK is the number of LoUs in each enhancement layer. These equations are derived from our
suggested method for quality assessment of each layer in section 3.2.1 that proposed to consider the quality of each
layer as the weighted sum of the quality of LoUs within that layer. Hence for instance, the weight values iw and jkw
will be calculated using equation (1) and (2) for view scalability and depth scalability respectively.
avg_inter-LD is the average inter-view disparity between LoUs of the base and enhancement layers and will be
computed by equation (6) as follows:
1 1
(6)_ ( ) / ( )E
EKP
i kik
avg_inter LD P Kd= =
= ´å å
Where, P is the total number of LoUs in base layer. In this equation, first the disparity values between each two
LoUs that belong to base and enhancement layers respectively are calculated. Then, these values are added together.
Finally, it will be divided by the total number of summations in order to calculate the average inter layer disparity.
Now, the overall quality of SMVC is calculated in equation (7) using the mentioned parameters as follows:
( _ )( ) (7)e eT T rec ELb bQ w Q w Q avg inter_LD LoU LoU
Where TLOU represents the total number of LoUs, and rec ELLoU is the number of received LoUs of
enhancement layers. ∝ parameter is calculated experimentally and according to the average quality range. As we have
explained before, the lower-order units (LoUs) are specified according to the particular scalable modality.
We have derived this equation by considering the following facts. When the average disparity between LoUs is
negligible, the number of received LoUs is less important in the overall quality since we can re-create them properly
by using the LoUs of the base layer. In this case, the second term of equation (7) will be zero and the overall quality
is the weighted sum of the quality of various layers. But when some LoUs in the enhancement layer are dropped and
the average disparity between layers is high, the perceived quality of the dropped LoUs after being re-created is low.
Hence, the weighted sum of the quality of different layers will overestimate the overall quality. The subtraction used
in the last part of the equation (7) will compensate this overestimation. Hence, the overall quality will be closer to the
perceived subjective quality.
Similarly, the same approach can be used for any other scalable modality to extract the overall quality of SMVC
as shown in STEP 2 of Fig. 3 by using the proper concept of Inter-LD according to that specific scalable modality.
4. EVALUATION OF THE PROPOSED METHODOLOGY
In this section, we evaluate the efficiency of our proposed methodology by comparing the results of derived objective
quality assessment metrics for the two scalable modalities of view scalability and depth scalability. For each scalable
modality, first we have conducted an experiment to show the performance of our derived objective quality assessment
metric to evaluate the overall quality of each layer. The results of this experiment show the effectiveness of our
methodology in selecting proper weight values for the LoUs of each layer. Next, the accuracy of our derived objective
quality assessment metric for SMVC is evaluated by comparing it with the results of subjective tests. In view
scalability, we examined the effect of various views and inter and Intra-LD in overall quality assessment using several
multi-view 2D video sequences. We have also tested our derived objective quality assessment metric for one
stereoscopic video in order to consider the stereoscopic perception of observers. Five standard multi-view test
sequences, “Ballet”, “Break-dancer”, “Kendo”, “Balloon” and “Tunnel” from (Microsoft 2012), (Tanimoto 2012) and
(Merl 2012) have been used for our experiments. Since there are no publicly available standard multi-view
3D sequences, we have used multi-view 2D test sequences for evaluating the multi-view aspects. To evaluate the 3D
experience of our proposed quality assessment method, a stereoscopic video sequence has been used and displayed
independently in 3D using red-blue anaglyph glasses. Table 1 summarizes the properties of these sequences. Results
have been obtained using the JMVC reference software version 8.5 (Pandit et al. 2008). The results of objective
quality assessment tests are presented in terms of PSNR and SSIM metrics.
Table 1. Properties of the test sequences
Sequence Frame size Frame rate
(fps)
Number of
Cameras Number of frames
Ballet 1024 x 768 15 8 100
Break-dancer 1024 x 768 15 8 100
Kendo 1024 x 768 15 7 100
Balloons 1024 x 768 15 7 100
Tunnel 720 x 576 25 2 250
It should be noted that the subjective quality of the decoded sequences was assessed using the Double Stimulus
Continuous Quality Scale (DSCQS) method described in ITU-R Recommendation 500 (ITU-R. 1974-1997). The
details of our subjective test procedure are presented in Appendix B.
4.1. Evaluation of the Proposed Method for Quality Assessment of Each Layer
We argued that the overall quality of each layer in SMVC can be estimated more accurately by using a weighted sum
of the quality of its LoUs and also by selecting proper weight values using the disparity between LoUs. This way, the
effect of important LoUs, which affect the overall perception more, can be reflected better in the overall quality. In
order to justify this hypothesis, we have applied five types of noise (Yan Zhang et al. 2010) and (Koumaras et al.
2007) to important and non-important LoUs separately and obtained ten different scenarios of distortions as shown in
Table 2. The noise simulates various kinds of information loss at the receiver side that may occur because of resource
limitations such as network and receiver bandwidth and network errors. The difference between distortion scenarios 1
and 2 is that the most important LoU has been corrupted differently in each scenario.
Then we have calculated the overall quality of the sequence using the derived objective quality assessment metric
and also the method proposed in (Wang et al. 2004, Hewage et al. 2008) that simply sums up the quality of all LoUs.
The results indicate that the effect of the quality of the important LoUs can be reflected better in the overall quality
using our derived metric. The results of our extracted objective quality assessment metrics for two different scalable
modalities are presented in the following subsections.
4.1.1 Evaluation of the Proposed Method for Quality Assessment of Each Layer for View Scalability
In order to evaluate our derived metric for view scalability, we have considered 4 views of the “Ballet” sequence, as
shown in Fig. 5, and we have used the prediction structure of Fig. 4 for coding these four views. Let u assume that we
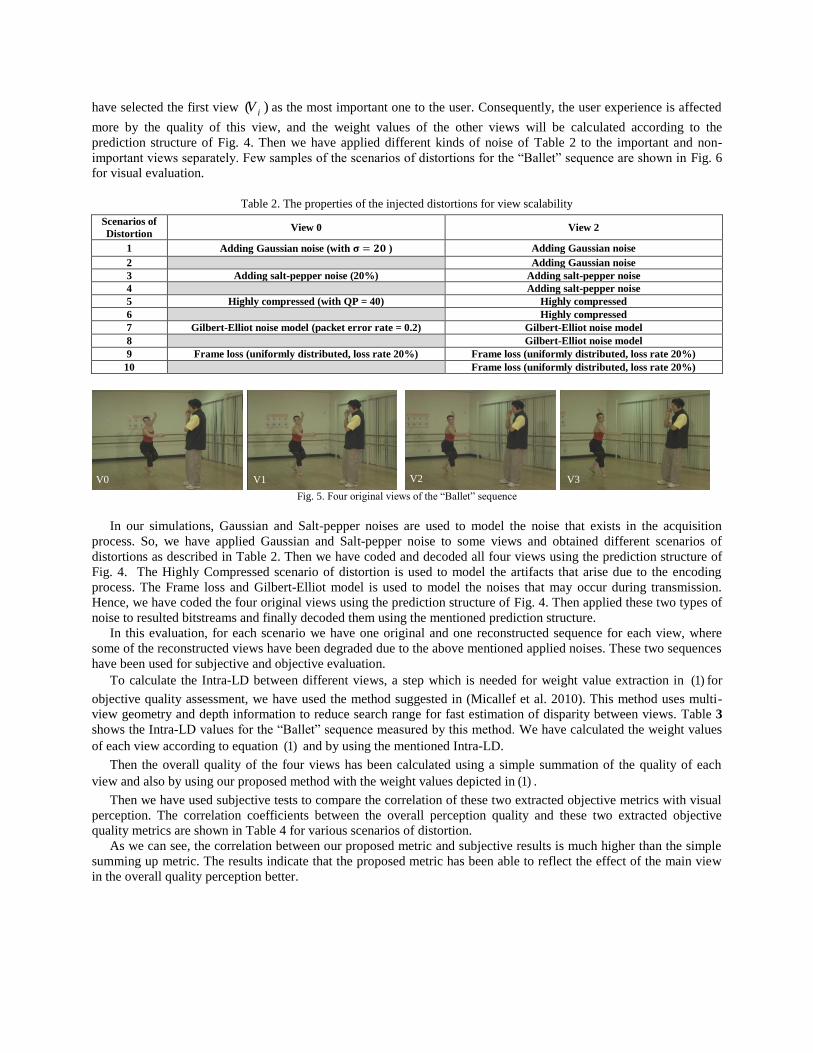
have selected the first view ( )iV as the most important one to the user. Consequently, the user experience is affected
more by the quality of this view, and the weight values of the other views will be calculated according to the
prediction structure of Fig. 4. Then we have applied different kinds of noise of Table 2 to the important and non-
important views separately. Few samples of the scenarios of distortions for the “Ballet” sequence are shown in Fig. 6
for visual evaluation.
Table 2. The properties of the injected distortions for view scalability
Scenarios of
Distortion View 0 View 2
1 Adding Gaussian noise (with ) Adding Gaussian noise
2 Adding Gaussian noise
3 Adding salt-pepper noise (20%) Adding salt-pepper noise
4 Adding salt-pepper noise
5 Highly compressed (with QP = 40) Highly compressed
6 Highly compressed
7 Gilbert-Elliot noise model (packet error rate = 0.2) Gilbert-Elliot noise model
8 Gilbert-Elliot noise model
9 Frame loss (uniformly distributed, loss rate 20%) Frame loss (uniformly distributed, loss rate 20%)
10 Frame loss (uniformly distributed, loss rate 20%)
Fig. 5. Four original views of the “Ballet” sequence
In our simulations, Gaussian and Salt-pepper noises are used to model the noise that exists in the acquisition
process. So, we have applied Gaussian and Salt-pepper noise to some views and obtained different scenarios of
distortions as described in Table 2. Then we have coded and decoded all four views using the prediction structure of
Fig. 4. The Highly Compressed scenario of distortion is used to model the artifacts that arise due to the encoding
process. The Frame loss and Gilbert-Elliot model is used to model the noises that may occur during transmission.
Hence, we have coded the four original views using the prediction structure of Fig. 4. Then applied these two types of
noise to resulted bitstreams and finally decoded them using the mentioned prediction structure.
In this evaluation, for each scenario we have one original and one reconstructed sequence for each view, where
some of the reconstructed views have been degraded due to the above mentioned applied noises. These two sequences
have been used for subjective and objective evaluation.
To calculate the Intra-LD between different views, a step which is needed for weight value extraction in (1) for
objective quality assessment, we have used the method suggested in (Micallef et al. 2010). This method uses multi-
view geometry and depth information to reduce search range for fast estimation of disparity between views. Table 3
shows the Intra-LD values for the “Ballet” sequence measured by this method. We have calculated the weight values
of each view according to equation (1) and by using the mentioned Intra-LD.
Then the overall quality of the four views has been calculated using a simple summation of the quality of each
view and also by using our proposed method with the weight values depicted in (1) .
Then we have used subjective tests to compare the correlation of these two extracted objective metrics with visual
perception. The correlation coefficients between the overall perception quality and these two extracted objective
quality metrics are shown in Table 4 for various scenarios of distortion.
As we can see, the correlation between our proposed metric and subjective results is much higher than the simple
summing up metric. The results indicate that the proposed metric has been able to reflect the effect of the main view
in the overall quality perception better.
V0 V1 V2 V3
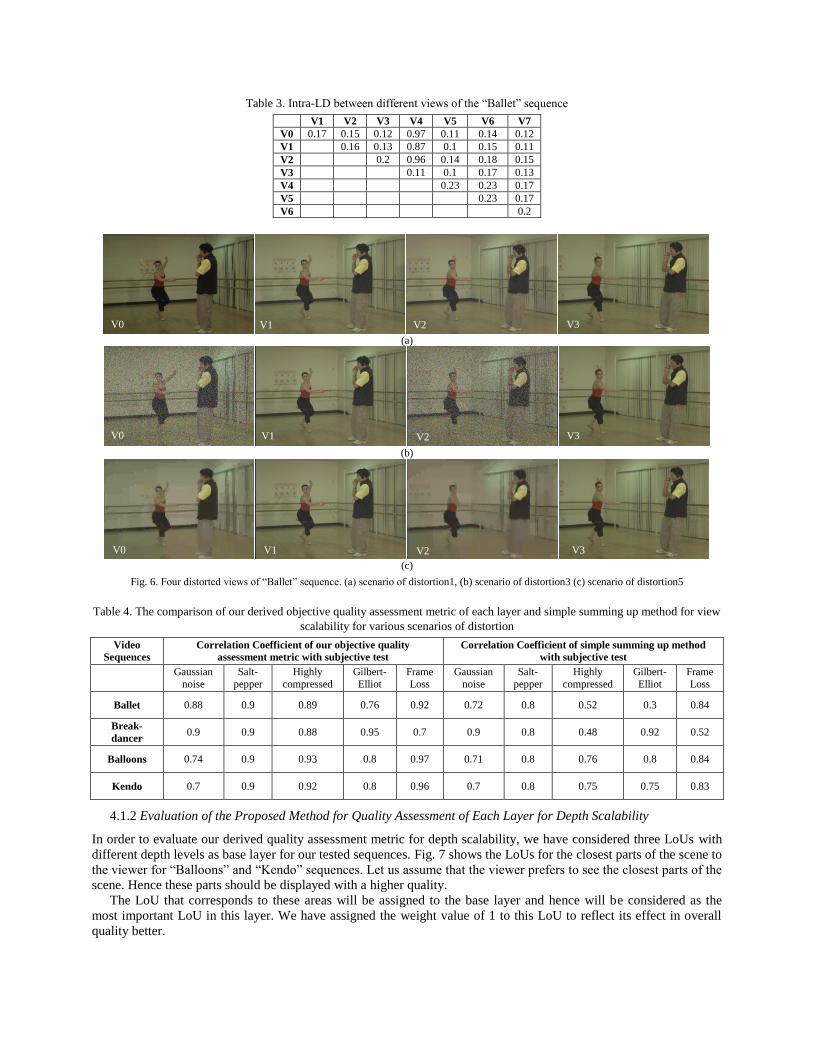
Table 3. Intra-LD between different views of the “Ballet” sequence
V1 V2 V3 V4 V5 V6 V7
V0 0.17 0.15 0.12 0.97 0.11 0.14 0.12
V1 0.16 0.13 0.87 0.1 0.15 0.11
V2 0.2 0.96 0.14 0.18 0.15
V3 0.11 0.1 0.17 0.13
V4 0.23 0.23 0.17
V5 0.23 0.17
V6 0.2
(a)
(b)
(c)
Fig. 6. Four distorted views of “Ballet” sequence. (a) scenario of distortion1, (b) scenario of distortion3 (c) scenario of distortion5
Table 4. The comparison of our derived objective quality assessment metric of each layer and simple summing up method for view
scalability for various scenarios of distortion
Video
Sequences
Correlation Coefficient of our objective quality
assessment metric with subjective test
Correlation Coefficient of simple summing up method
with subjective test
Gaussian
noise
Salt-
pepper
Highly
compressed
Gilbert-
Elliot
Frame
Loss
Gaussian
noise
Salt-
pepper
Highly
compressed
Gilbert-
Elliot
Frame
Loss
Ballet 0.88 0.9 0.89 0.76 0.92 0.72 0.8 0.52 0.3 0.84
Break-
dancer 0.9 0.9 0.88 0.95 0.7 0.9 0.8 0.48 0.92 0.52
Balloons 0.74 0.9 0.93 0.8 0.97 0.71 0.8 0.76 0.8 0.84
Kendo 0.7 0.9 0.92 0.8 0.96 0.7 0.8 0.75 0.75 0.83
4.1.2 Evaluation of the Proposed Method for Quality Assessment of Each Layer for Depth Scalability
In order to evaluate our derived quality assessment metric for depth scalability, we have considered three LoUs with
different depth levels as base layer for our tested sequences. Fig. 7 shows the LoUs for the closest parts of the scene to
the viewer for “Balloons” and “Kendo” sequences. Let us assume that the viewer prefers to see the closest parts of the
scene. Hence these parts should be displayed with a higher quality.
The LoU that corresponds to these areas will be assigned to the base layer and hence will be considered as the
most important LoU in this layer. We have assigned the weight value of 1 to this LoU to reflect its effect in overall
quality better.
V0 V1
V0
V2 V3
V0 V1 V2 V3
V0 V1 V2 V3
Then, the weight values of the other LoUs have been determined according to equation (2) and by using the
distance between the depth levels of different LoUs. Again, we have used the scenarios of distortion that have been
shown in Table 2 to simulate resource limitations.
(a) Balloons (b) Kendo
Fig. 7. LoUs for the closest parts of the scene to the viewer for (a) “Balloons” and (b) “Kendo” sequences
We have calculated the overall quality of the three LoUs using a simple summation of the quality of each LoU and
also by using our derived metric with the weight values depicted in (2) . Then we have used subjective tests to
compare the overall quality in simple sum and weighted sum quality assessment methods.
To help render the views along with the depth scalable sequence for subjective test, we send a side information in
the form of texture video. For each specific layer, such as the base layer the corresponding coordinate of the points in
each of the LoUs have been extracted using the depth map information. Finally, the parts from the video that
corresponds to these coordinates are rendered using texture video. This process is performed for each frame of each
view to render the whole multi-view sequence. The results of the comparison of correlation coefficients of subjective
test with simple summing up and weighted summing up methods are shown in Table 5. As we can see, the correlation
coefficient for our objective quality metric and subjective results is higher than the simple summing up method.
Table 5. The comparison of our objective quality assessment metric for quality assessment of each layer and simple summing up
method in depth scalability
Video
Sequences
Correlation Coefficient of our objective quality assessment
metric with subjective test
Correlation Coefficient of simple summing up method with
subjective test
Gaussian
noise
Salt-
pepper
Highly
compressed
Gilbert-
Elliot
Frame
Loss
Gaussian
noise
Salt-
pepper
Highly
compressed
Gilbert-
Elliot
Frame
Loss
Ballet 0.93 0.91 0.85 0.93 0.97 0.77 0.7 0.66 0.77 0.9
Break-
dancer 0.94 0.91 0.86 0.94 0.94 0.73 0.66 0.62 0.73 0.7
Balloons 0.9 0.96 0.82 0.9 0.92 0.69 0.83 0.52 0.63 0.71
Kendo 0.86 0.86 0.87 0.86 0.86 0.85 0.85 0.75 0.85 0.85
4.2. Evaluation of the Proposed Method for Quality Assessment in SMVC
In this part, we will evaluate the performance of our derived objective quality assessment metric for quality
assessment of the whole scalable multi-view 3D video by comparing it with the results of subjective quality
assessments. A perfect objective quality assessment metric for video quality should fluctuate linearly with subjective
quality (Feghali et al. 2007). Our experiment tries to show this correlation for our derived metric.
4.2.1 Evaluation of the Proposed Method for Quality Assessment in SMVC for View Scalability
Our proposed evaluation procedure for quality assessment in scalable multi-view 3D video is as follows. For each
sequence, we have assigned four views to the base layer and the remaining views to the enhancement layers. We have
considered two different cases in our experiment. In the first case, only one enhancement layer with four views has
been considered. In the second test, two enhancement layers each with 2 views have been considered. From equation
(7) , we have used Inter-LD to more effectively calculate the overall quality. In order to see the importance of this
concept in overall quality assessment of SMVC, we have considered two different scenarios in assigning views to
different layers. In the first scenario, the base and enhancement layers have low Inter-LD with each other, and in the
second scenario they have higher Inter-LD. Table 6 shows our selected views for these two different cases for the
“Break-dancer” sequences. Fig. 8 illustrates the selected views with the lowest disparity in these two different cases
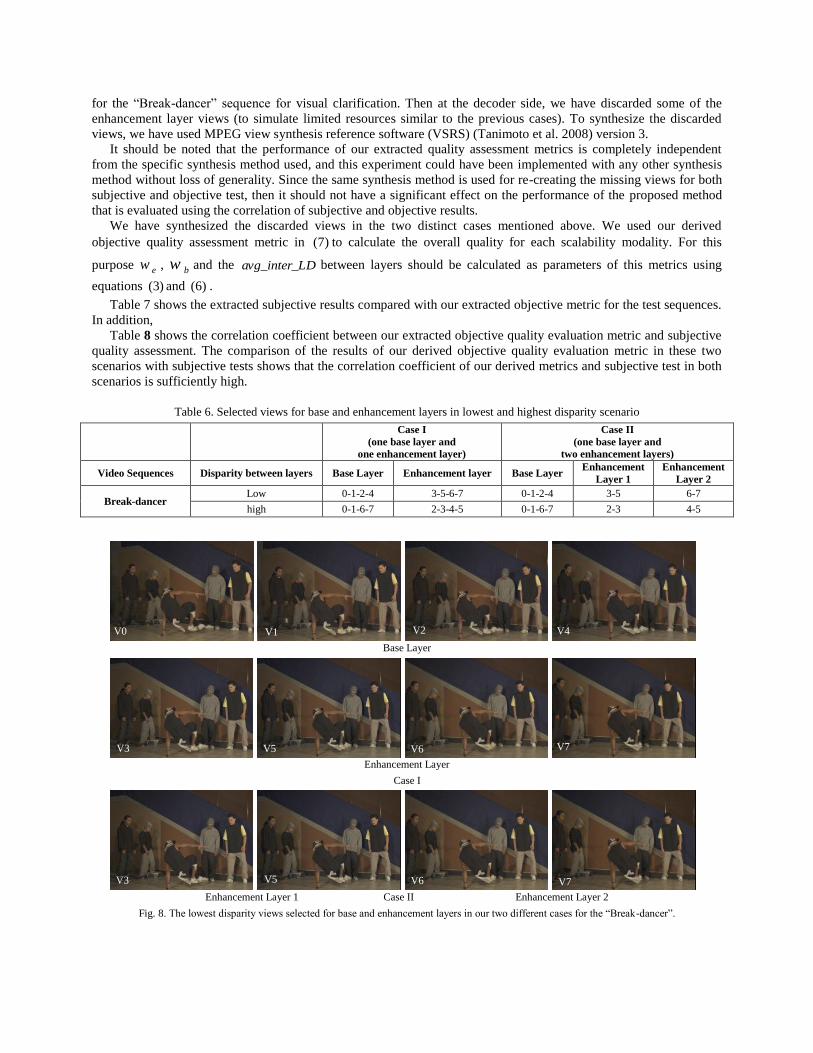
for the “Break-dancer” sequence for visual clarification. Then at the decoder side, we have discarded some of the
enhancement layer views (to simulate limited resources similar to the previous cases). To synthesize the discarded
views, we have used MPEG view synthesis reference software (VSRS) (Tanimoto et al. 2008) version 3.
It should be noted that the performance of our extracted quality assessment metrics is completely independent
from the specific synthesis method used, and this experiment could have been implemented with any other synthesis
method without loss of generality. Since the same synthesis method is used for re-creating the missing views for both
subjective and objective test, then it should not have a significant effect on the performance of the proposed method
that is evaluated using the correlation of subjective and objective results.
We have synthesized the discarded views in the two distinct cases mentioned above. We used our derived
objective quality assessment metric in (7) to calculate the overall quality for each scalability modality. For this
purpose ew , bw and the avg_inter_LD between layers should be calculated as parameters of this metrics using
equations (3) and (6) .
Table 7 shows the extracted subjective results compared with our extracted objective metric for the test sequences.
In addition,
Table 8 shows the correlation coefficient between our extracted objective quality evaluation metric and subjective
quality assessment. The comparison of the results of our derived objective quality evaluation metric in these two
scenarios with subjective tests shows that the correlation coefficient of our derived metrics and subjective test in both
scenarios is sufficiently high.
Table 6. Selected views for base and enhancement layers in lowest and highest disparity scenario
Case I
(one base layer and
one enhancement layer)
Case II
(one base layer and
two enhancement layers)
Video Sequences Disparity between layers Base Layer Enhancement layer Base Layer Enhancement
Layer 1
Enhancement
Layer 2
Break-dancer Low 0-1-2-4 3-5-6-7 0-1-2-4 3-5 6-7
high 0-1-6-7 2-3-4-5 0-1-6-7 2-3 4-5
Base Layer
Enhancement Layer
Case I
Enhancement Layer 1 Case II Enhancement Layer 2
Fig. 8. The lowest disparity views selected for base and enhancement layers in our two different cases for the “Break-dancer”.
V0 V1 V2 V4
V1
V3 V5 V6 V7
V3 V5 V6 V7
This indicates the effectiveness of using Inter-LD for SMVC overall quality assessment. It should be noted that,
since no other overall objective quality assessment method exists for SMVC, we cannot compare our method against
any objective methods from the literature. As such, we have only compared the results of our method in this
subsection against subjective quality assessments.
Table 7. Comparison of the results of our objective quality assessment metric with subjective results for view scalability
Case I
(one base layer and one enhancement layer)
Case II
(one base layer and two enhancement layers)
Video
sequences
Disparity
between
layers
Subjective
test result
Our objective
metric (PSNR)
Our objective
metric (SSIM)
Subjective
test result
Our objective
metric (PSNR)
Our objective
metric (SSIM)
Ballet high 2 30.76 0.72 4 38.13 0.88
low 2 31.27 0.73 4 38.77 0.88
Break-
dancer
high 2 31.32 0.78 4 41.04 0.95
low 2 31.26 0.75 5 40.15 0.92
Balloons high 3 32.98 0.84 4 33.12 0.85
low 3 33.03 0.85 4 33.67 0.86
Kendo high 3 40.77 0.85 4 41.17 0.86
low 3 42.41 0.94 4 42.71 0.95
Table 8. The correlation coefficients between our objective quality assessment metric and subjective quality assessment for view
scalability
Video Sequences Correlation Coefficient
Ballet 0.97
Break-dancer 0.96
Balloons 0.7
Kendo 0.4
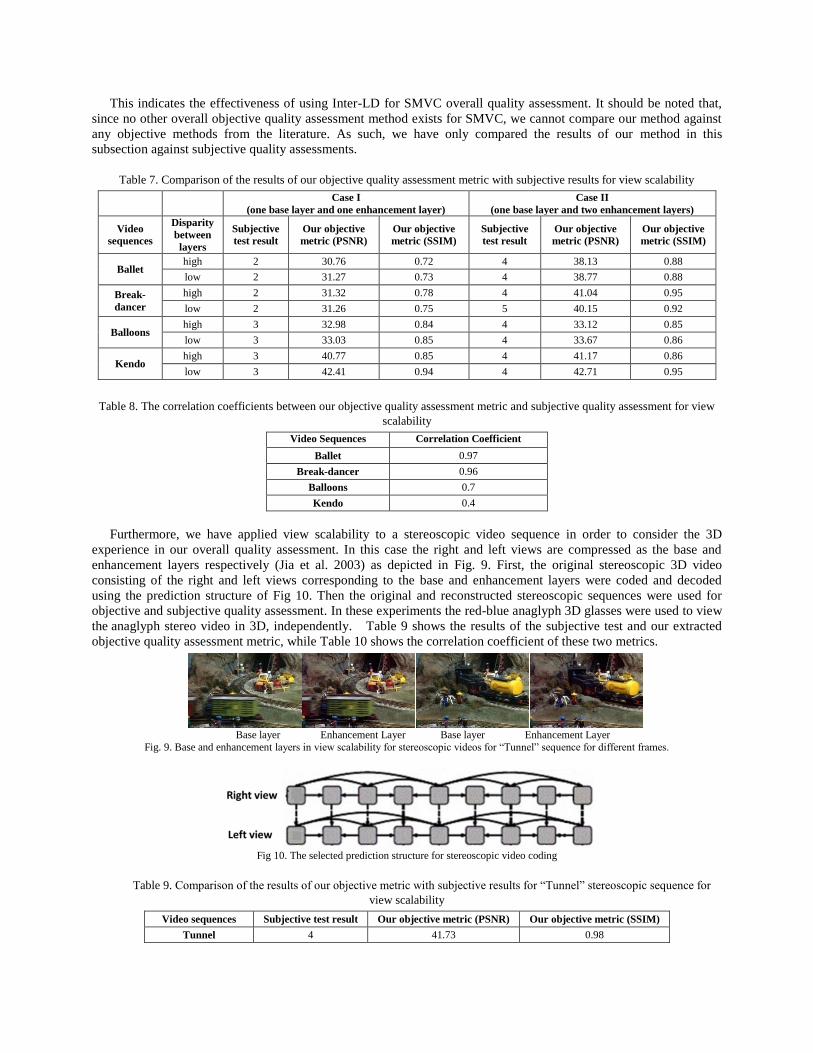
Furthermore, we have applied view scalability to a stereoscopic video sequence in order to consider the 3D
experience in our overall quality assessment. In this case the right and left views are compressed as the base and
enhancement layers respectively (Jia et al. 2003) as depicted in Fig. 9. First, the original stereoscopic 3D video
consisting of the right and left views corresponding to the base and enhancement layers were coded and decoded
using the prediction structure of Fig 10. Then the original and reconstructed stereoscopic sequences were used for
objective and subjective quality assessment. In these experiments the red-blue anaglyph 3D glasses were used to view
the anaglyph stereo video in 3D, independently. Table 9 shows the results of the subjective test and our extracted
objective quality assessment metric, while Table 10 shows the correlation coefficient of these two metrics.
Base layer Enhancement Layer Base layer Enhancement Layer
Fig. 9. Base and enhancement layers in view scalability for stereoscopic videos for “Tunnel” sequence for different frames.
Fig 10. The selected prediction structure for stereoscopic video coding
Table 9. Comparison of the results of our objective metric with subjective results for “Tunnel” stereoscopic sequence for
view scalability
Video sequences Subjective test result Our objective metric (PSNR) Our objective metric (SSIM)
Tunnel 4 41.73 0.98

Table 10. The correlation coefficients between our objective metric and subjective quality assessment for stereoscopic video for
view scalability
Video Sequences Correlation Coefficient
Tunnel 0.9
4.2.2 Evaluation of the Proposed Method for Quality Assessment in SMVC for Depth Scalability
For the evaluation of our extracted metric for quality assessment in scalable multi-view 3D video in depth scalability,
we have considered one base and one enhancement layer. The base layer consists of the LoUs with related to the areas
in the scene with the lowest distance to the viewers and the enhancement layer includes the remaining areas. Then we
discard the enhancement layer in order to simulate the resource restrictions similar to the previous cases.
Again to help render the views at the receiver side, along with the depth scalable sequence we send a side
information in the form of texture video. Once the layers are determined, the corresponding coordinate of the points
of related LoUs are extracted. Then, the parts from the texture video that corresponds to these coordinates will be
coded as side information. Since the base layer consists of the areas in the scene that are more important to the
viewer, the corresponding texture video will be coded with higher quality. For subjective testing, each video
consisting of base and enhancement layers is rendered as follows. First, for base layer, the related LoUs are rendered
using the depth map and also the high quality texture video from side information. Since enhancement layers may be
discarded due to resource limitation, such as network error or bandwidth constraints, their corresponding LoUs,
containing depth map information might be missing. Therefore, the corresponding parts of missing enhancement
layers will be rendered using only the corresponding lower quality texture video from side information.
It should be noted that, since we have used the depth map information to render the base layer, the corresponding
areas that are more important to viewers can provide the 3D perception.
We extracted the overall objective quality measure of the scalable multi-view sequence using equation (7) to
compare it with subjective quality measurement. Table 11 and Table 12 show the results of our experiment for this
scalable modality.
Table 11. Comparison of the results of our objective metric with subjective results for depth scalability
Video sequences Subjective test result Our objective metric (PSNR)
Balloons 2 19.61
Kendo 2 15.58
Table 12. The correlation coefficients between our objective metric and subjective quality assessment for depth scalability
Video Sequences Correlation Coefficient
Balloons 0.87
Kendo 0.83
5. CONCLUSION
This paper proposed a new methodology to derive objective quality assessment metrics for scalable multi-view 3D
video. This method considers two distinct steps to evaluate the quality of scalable multi-view 3D video. First, a new
method is proposed to quantify the quality of each layer. This method utilizes the weighted sum approach to quantify
the overall quality of LoUs and uses the Intra-LD corresponding to each scalable modality to calculate the weight
values. Then, a method is introduced to combine the quality of each layer. The effect of some factors such as the
number of received layers and Inter-LD as another intrinsic feature of scalable multi-view 3D video is taken into
account in this method. Performance evaluation demonstrates that the objective quality assessment metrics that were
derived by this methodology closely reflects subjective observations in various scalable modalities.
In a scalable multi-view 3D environment, one of the challenges is to properly select the views that should be
assigned to the base and enhancement layers such that the highest overall quality can be achieved. Our simulation
results indicate that our extracted SMVC quality metrics can be used as an effective tool in this regard by reflecting
the subjective perception more accurately.
REFERENCES
Barkowsky, M., Wang, K., Cousseau, R., Brunnstrom, K., Olsson, R., and Le Callet, P. 2010. Subjective quality assessment of error concealment strategies for 3DTV in the presence of asymmetric transmission errors. In 18th International Packet Video Workshop (PV). Hong Kong, China.
193 – 200.
Bhat, A., Richardson and I., Kannangara, S. 2009. A novel perceptual quality metric for video compression. In Picture Coding Symposium, Chicago, IL, US. 1-4.
Chang, Y,. and Kim, M. 2011. Hybrid video CODEC based joint rate control of stereoscopic video for terrestrial broadcasting services. In
Proceedings of the 2011 IEEE International Conference on Multimedia and Expo (ICME), Barcelona, Spain. 1-6. Do, L., Zinger, S., and de With, P. H. N. 2010. Conversion of free-viewpoint 3D multi-view video for stereoscopic displays. In Proceedings of the
IEEE International Conference on Multimedia and Expo (ICME), Suntec City, Singapore. 1730 – 1734.
Dodgson, N.A. 2005. Autostereoscopic 3D displays. In Computer Journal Published by the IEEE Computer Society, 38, 9, 31–36. Feghali, R., Speranza, F., Wang, D., and Vincent, A. 2007. Video quality metric for bit rate control via joint adjustment of quantization and frame
rate. In IEEE Transactions on Broadcasting. 53, 1, 441 – 446.
Grois, D., Kaminsky, E., and Hadar, O. 2010. Dynamically adjustable and scalable ROI video coding. In IEEE International Symposium on Broadband Multimedia Systems and Broadcasting (BMSB), Shanghai, China. 1 – 5.
Gutierrez, J., Perez, P., Jaureguizar, F., Cabrera, J., and Garcia, N. 2011. Subjective assessment of the impact of transmission errors in 3DTV
compared to HDTV. In 3DTV Conference: The True Vision - Capture, Transmission and Display of 3D Video (3DTV-CON). Antalya, Turkey. 1-4.
Ha, K., and Kim, M. 2011. A perceptual quality assessment metric using temporal complexity and disparity information for stereoscopic video. In
18th IEEE International Conference on Image Processing (ICIP), Brussels, Belgium. 2525 – 2528. Hewage, C.T.E.R., Worrall, S.T., Dogan, S., and Kondoz, A.M. 2008. Prediction of stereoscopic video quality using objective quality models of 2-
D video. In Electronics Letters. 44, 16, 963 - 965.
Hewage, C.T.E.R., and Martini, M.G. 2010. Reduced-reference quality evaluation for compressed depth maps associated with colour plus depth 3D video. In 17th IEEE International Conference on Image Processing (ICIP), Hong Kong, 4017 – 4020.
Hewage, C.T.E.R., and Martini, M.G. 2010. Reduced-reference quality metric for 3D depth map transmission. In 3DTV-Conference: The True
Vision - Capture, Transmission and Display of 3D Video (3DTV-CON). Tampere, Finland. 1 – 4. Hewage, C. T. E. R., and Martini, M. G. 2011. Reduced-Reference quality assessment for 3D video compression and transmission. In IEEE
Transactions on Consumer Electronics, 57,3, 1185 – 1193. Ho, Y. S,. and Oh, K. J. 2007. Overview of multi-view video coding. In 6th EURASIP Conference focused on Speech and Image Processing
Multimedia Communications and Services, Maribor, Slovenia.5-10.
ISO/IEC JTC 1/SC 29/WG11. (2005). Introduction to multi-view video coding. http://www.itscj.ipsj.or.jp/sc29/ ITU-T Rec. H.264 / ISO/IEC, Annex H. (2010). Multiview video coding. http://www.itu.int/rec/T-REC-H.264.
ITU-R Recommendation BT.500-10. (2000). Methodology for the subjective assessment of the quality of television picture.
http://www.itu.int/rec/R-REC-BT.500/en. Jia, H., Gao, W., and Lu, Y. 2003. Stereoscopic video coding based on global displacement compensated prediction. In Information,
Communications and Signal Processing and the Pacific Rim Conference on Multimedia. Singapore, 61 – 65.
Jin, L., Boev, A., Gotchev, A., , Egiazarian, K. 2011. 3D-DCT based perceptual quality assessment of stereo video. In 18th IEEE International Conference on Image Processing (ICIP), Brussels, Belgium.2521 – 2524.
Joveluro, P., Malekmohamadi, H., Fernando., W.A.C., and Kondoz, A.M. 2010. Perceptual video quality metric for 3D video quality assessment.
In The True Vision - Capture, Transmission and Display of 3D Video,Tampere, Finland. 1 – 4. Ka-Man Wong, Lai-Man Po, Kwok-Wai Cheung, Ka-Ho Ng, and Xuyuan Xu. 2011. Stretching, compression and shearing disparity compensated
prediction techniques for stereo and multiview video coding. In IEEE International Conference on Acoustics, Speech and Signal Processing
(ICASSP), Prague, Czech Republic. 841 – 844. Kim, D., Min, D., Oh, J., Jeon, S., and Sohn, K. 2009. Depth map quality metric for three-dimensional video. In Proceedings of SPIE 7237,
723719.
Kilner, J., Starck, J., Guillemaut, J.Y., and Hilton, A. 2009. Objective quality assessment in free-viewpoint video production. In Elsevier Signal Processing: Image Communication, 24, 1-2, 3-16.
Koumaras, H., Kourtis, A., Cheng-Han Lin, and Ce-Kuen Shieh. 2007. A Theoretical Framework for End-to-
End VideoQuality Prediction of MPEG-based Sequences. In 3rd International Conference on Networking and Services, ICNS. Athens, Greece. 62.
Leon, G., Kalva, H., and Furht, B. 2008. 3D video quality evaluation with depth quality variations. In 3DTV Conference: The True Vision-Capture,
Transmission and Display of 3D Video. Istanbul, Turkey. 301-304. Leorin, S., Lucchese, L., and Cutler, R.G. 2005. Quality assessment of panorama video for videoconferencing applications. In IEEE 7th Workshop
on Multimedia Signal Processing, Shanghai, China. 1-4.
Li, C., Yang, X., Chu, B., Lu, W., and Pang, L. 2010. A new image fusion quality assessment method based on contourlet and SSIM. In 3rd IEEE
International Conference on Computer Science and Information Technology, Chengdu, China. 246 - 249.
Li, Q., and Wang Z. 2009. Reduced-Reference image quality assessment using divisive normalization-based image representation. In IEEE Journal
of Selected Topics in Signal Processing, 3, 2, 202 – 211. Lin, W., and Kuo, C.-C. J. 2011. Perceptual visual quality metrics: a survey. In Journal of Visual Communication and Image Representation, 22, 4,
297-312.
Liyuan, X., Junyong, Y., Ebrahimi, T., and Perkis, A. 2011. Objective metrics for quality of experience in stereoscopic images. In 18th IEEE International Conference on Image Processing (ICIP), Brussels, Belgium. 3105 – 3108.
Martini, M.G., and Hewage, C. T. E. R. 2011. Objective quality assessment for 3-D video delivery. In IEEE ComSoc MMTC E-letter, 6, 8, 8-22.
Maalouf, A., and Larabi, M.-C. 2010. A no-reference color video quality metric based on a 3D multispectral wavelet transform. In Second International Workshop on Quality of Multimedia Experience (QoMEX). Trondheim, Norway. 11 – 16.
Meesters, L.M.J., IJsselsteijn, W.A., and Seuntiens, P.J. H. 2004. A survey of perceptual evaluations and requirements of three-dimensional TV. In
IEEE Transactions on Circuits and Systems for Video Technology. 14, 3, 381 - 391. Merl, ftp://ftp.merl.com/pub/avetro/mvc-testseq/stereo-interlaced/420/,last access on January 15, 2012.
Micallef, B.W., Debono, C.J., and Farrugia, R.A. 2010. Exploiting depth information for fast multi-view video coding. In
Picture Coding Symposium (PCS). Nagoya, Japan. 38 – 41.
Microsoft, http://research.microsoft.com/en-us/um/people/sbkang/3dvideodownload, last access on January 15, 2012.
Mittal, A., Moorthy, A.K., Ghosh, J., and Bovik, A.C. 2011. Algorithmic assessment of 3D quality of experience for images and videos. In Digital Signal Processing and IEEE Signal Processing Education Workshop, Sedona, Arizona, 338 – 343.
Muller, K., Merkle,P., and Wiegand, T. 2011. 3-D video representation using depth maps. In Proceedings of the IEEE. 99, 4, 643-656.
Nur, G., Arachchi, H.K., Dogan, S., and Kondoz, A.M. 2011. Extended VQM model for predicting 3D video quality considering ambient illumination context . In 3DTV Conference: The True Vision - Capture, Transmission and Display of 3D Video (3DTV-CON). Antalya, Turkey.
1-4.
Ozbek, N., Tekalp, and A.M., Tunali, E.T. 2007. Rate allocation between views in scalable stereo video coding using an objective stereo video quality measure. In IEEE International Conference on Acoustics, Speech and Signal Processing, ICASSP. Honolulu, HI. I-1045 - I-1048.
Ozbek, N., Ertan, G., and Karakus, O. 2011. Interactive quality assessment for asymmetric coding of 3D video. In 3DTV Conference: The True
Vision - Capture, Transmission and Display of 3D Video (3DTV-CON). Antalya, Turkey. 1-4. Pandit, S.P., Chen, Y., and Ye, S. 2008. Text of ISO/IEC 14496- 5:2001/PDAM 15 Reference Software for Multiview Video Coding, ISO/IEC
JTC1/SC29/WG11 MPEG2008/W9974, Hannover. Germany.
Recommendation ITU-R BT 812. 1994. Subjective assessment of the quality of alphanumeric and graphic pictures in teletext and similar services. Rodriguez, E.J.,Nunome, T., and Tasaka, S. 2009. Assessment of user behavior and QoE in multi-view video and audio IP transmission. In 15th
Asia-Pacific Conference on Communications, APCC. Shanghai, China. 790 – 793.
Roodaki, H., Hashemi, M.R., and Shirmohammadi, S. 2011. A new scalable multi-view video coding configuration for mobile applications. In Proceedings of IEEE International Conference on Multimedia & Expo. Barcelona, Spain. 1-4.
Saygili, G., Gurler, C.G., and Tekalp, A.M. 2010. Quality assessment of asymmetric stereo video coding. In 17th IEEE International Conference
on Image Processing (ICIP). Hong Kong, 4009 – 4012. Schwarz, H., Marpe, D., and Wiegand, T. 2007. Overview of the scalable video coding extension of the H.264/AVC standard. In IEEE
Transactions on Circuits and Systems for Video Technology. 17, 9, 1103 – 1120.
Shao, H., Cao, X., and Er, G. 2009. Objective quality of depth image based rendering in 3DTV system. In 3DTV Conference: The True Vision - Capture, Transmission and Display of 3D Video. Potsdam, Germany. pp. 1– 4.
Shimizu, Sh., Kitahara, M., Kimata, H., Kamikura, K., and Yashima, Y. 2007. view scalable multiview video coding using 3-D warping with depth
map. In IEEE Transactions on Circuits and Systems for Video Technology. 17, 11,1485 - 1495. Solh M. and AlRegib, G. 2009. MIQM: A novel multi-view image quality measure. In International Workshop on Quality of Multimedia
Experience, San Diego, CA, 186-191. Stelmach, L. B., and James Tam, W. 1998. Stereoscopic image coding: effect of disparate image-quality in left and right-eye views. In Signal
Processing: Image Communication. 14, 1-2, 111-117.
Tanimoto, M., Fujii, T., Suzuki, K., Fukushima, N., and Mori, Y. 2008. Reference softwares for depth estimation and view synthesis. ISO/IEC JTC1/SC29/WG11 MPEG2008/M15377, Archamps.
Tanimoto, M. 2009. Overview of FTV (free-viewpoint television), In Proceedings of the 2009 IEEE international conference on Multimedia and
Expo (ICME), New York, NY, 1552 - 1553. Tanimoto Laboratory, http://www.tanimoto.nuee.nagoya-u.ac.jp/~fukushima/mpegftv/yuv/ ,last access on January 15, 2012.
Umar, A.S., Swash, R.M., and Sadka, A.H. 2011. Subjective quality assessment of 3D videos. In IEEE Africon, Livingstone. 1–6.
Vetro, A., Tourapis, A.M., Muller, K., and Chen, T. 2011. 3D-TV content storage and transmission. In IEEE Transactions on Broadcasting. 57, 2,
384 – 394.
Vetro, A., Wiegand, T,. and Sullivan, G. J. 2011. Overview of the stereo and multiview video coding extensions of the H.264/MPEG-4 AVC
standard. In Proceedings of the IEEE. 99, 4, 626-642. Wang, Z., Bovik, A.C., Sheikh, H.R., and Simoncelli, E.P. 2004. Image quality assessment: from error visibility to structural similarity. In IEEE
Transactions on Image Processing. 13, 4, 600 – 612.
Yamagishi, K., Karam, L., Okamoto, J., and Hayashi, T. 2011. Subjective characteristics for stereoscopic high definition video. In third International Workshop on Quality of Multimedia Experience (QoMEX). Mechelen, 37 – 42
Yan Zhang, Ping An, Yanfei Wu, and Zhaoyang Zhang. 2010. A multiview video quality assessment method based on disparity and SSIM. In
IEEE 10th International Conference on Signal Processing (ICSP). Beijing, China. 1044 – 1047. Yixia, L., Yilin, C., and Na, Z. 2009. Method of ensuring eye-to eye contact in multi-view video conference. In IEEE International Conference on
Broadband Network & Multimedia Technology. Beijing, China. 882 – 886.
Yo-Sung Ho, and Kwan-Jung Oh,. 2007. Overview of multi-view video coding. In 14th International Workshop on Systems Signals and Image Processing and 6th EURASIP Conference focused on Speech and Image Processing Multimedia Communications and Services. Maribor,
Slovenia. 5 - 12.
Zhu, Y., and Zhen, T. 2009. 3D Multi-view Autostereoscopic Display and Its Key Technologies. In Asia-Pacific Conference on Information Processing (ASIP). Shenzhen, China. 31-35.
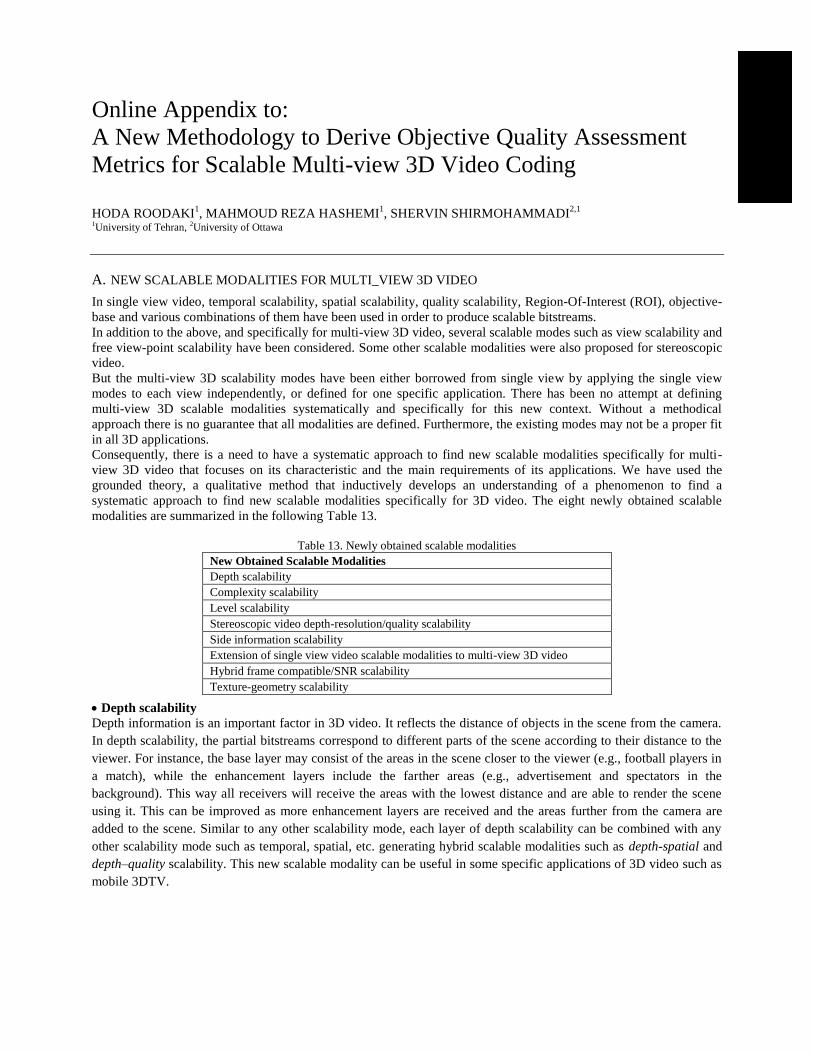
Online Appendix to:
A New Methodology to Derive Objective Quality Assessment
Metrics for Scalable Multi-view 3D Video Coding
HODA ROODAKI
1, MAHMOUD REZA HASHEMI
1, SHERVIN SHIRMOHAMMADI
2,1
1University of Tehran, 2University of Ottawa
A. NEW SCALABLE MODALITIES FOR MULTI_VIEW 3D VIDEO
In single view video, temporal scalability, spatial scalability, quality scalability, Region-Of-Interest (ROI), objective-
base and various combinations of them have been used in order to produce scalable bitstreams.
In addition to the above, and specifically for multi-view 3D video, several scalable modes such as view scalability and
free view-point scalability have been considered. Some other scalable modalities were also proposed for stereoscopic
video.
But the multi-view 3D scalability modes have been either borrowed from single view by applying the single view
modes to each view independently, or defined for one specific application. There has been no attempt at defining
multi-view 3D scalable modalities systematically and specifically for this new context. Without a methodical
approach there is no guarantee that all modalities are defined. Furthermore, the existing modes may not be a proper fit
in all 3D applications.
Consequently, there is a need to have a systematic approach to find new scalable modalities specifically for multi-
view 3D video that focuses on its characteristic and the main requirements of its applications. We have used the
grounded theory, a qualitative method that inductively develops an understanding of a phenomenon to find a
systematic approach to find new scalable modalities specifically for 3D video. The eight newly obtained scalable
modalities are summarized in the following Table 13.
Table 13. Newly obtained scalable modalities
New Obtained Scalable Modalities
Depth scalability
Complexity scalability
Level scalability
Stereoscopic video depth-resolution/quality scalability
Side information scalability
Extension of single view video scalable modalities to multi-view 3D video
Hybrid frame compatible/SNR scalability
Texture-geometry scalability
Depth scalability
Depth information is an important factor in 3D video. It reflects the distance of objects in the scene from the camera.
In depth scalability, the partial bitstreams correspond to different parts of the scene according to their distance to the
viewer. For instance, the base layer may consist of the areas in the scene closer to the viewer (e.g., football players in
a match), while the enhancement layers include the farther areas (e.g., advertisement and spectators in the
background). This way all receivers will receive the areas with the lowest distance and are able to render the scene
using it. This can be improved as more enhancement layers are received and the areas further from the camera are
added to the scene. Similar to any other scalability mode, each layer of depth scalability can be combined with any
other scalability mode such as temporal, spatial, etc. generating hybrid scalable modalities such as depth-spatial and
depth–quality scalability. This new scalable modality can be useful in some specific applications of 3D video such as
mobile 3DTV.
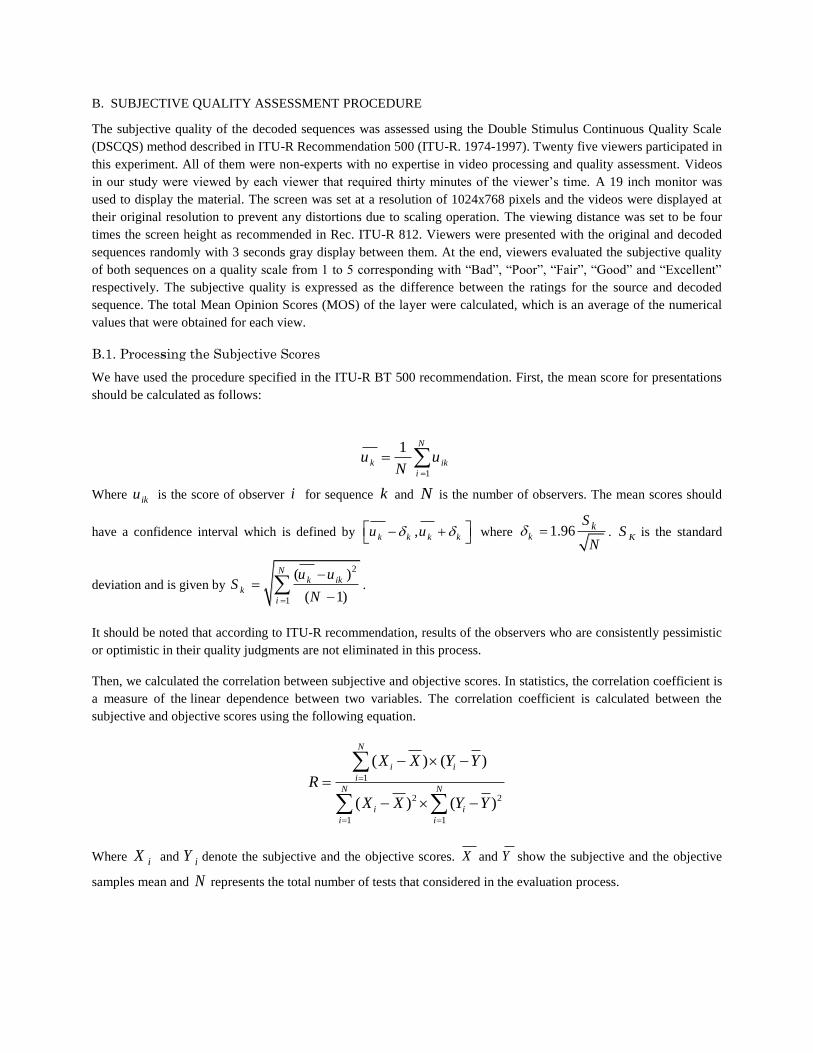
B. SUBJECTIVE QUALITY ASSESSMENT PROCEDURE
The subjective quality of the decoded sequences was assessed using the Double Stimulus Continuous Quality Scale
(DSCQS) method described in ITU-R Recommendation 500 (ITU-R. 1974-1997). Twenty five viewers participated in
this experiment. All of them were non-experts with no expertise in video processing and quality assessment. Videos
in our study were viewed by each viewer that required thirty minutes of the viewer’s time. A 19 inch monitor was
used to display the material. The screen was set at a resolution of 1024x768 pixels and the videos were displayed at
their original resolution to prevent any distortions due to scaling operation. The viewing distance was set to be four
times the screen height as recommended in Rec. ITU-R 812. Viewers were presented with the original and decoded
sequences randomly with 3 seconds gray display between them. At the end, viewers evaluated the subjective quality
of both sequences on a quality scale from 1 to 5 corresponding with “Bad”, “Poor”, “Fair”, “Good” and “Excellent”
respectively. The subjective quality is expressed as the difference between the ratings for the source and decoded
sequence. The total Mean Opinion Scores (MOS) of the layer were calculated, which is an average of the numerical
values that were obtained for each view.
B.1. Processing the Subjective Scores
We have used the procedure specified in the ITU-R BT 500 recommendation. First, the mean score for presentations
should be calculated as follows:
1
1 N
k ik
i
u uN
Where iku is the score of observer i for sequence k and N is the number of observers. The mean scores should
have a confidence interval which is defined by ,k k k ku u where 1.96k
kS
N . KS is the standard
deviation and is given by
2
1
( )
( 1)
Nk ik
k
i
u uS
N
.
It should be noted that according to ITU-R recommendation, results of the observers who are consistently pessimistic
or optimistic in their quality judgments are not eliminated in this process.
Then, we calculated the correlation between subjective and objective scores. In statistics, the correlation coefficient is
a measure of the linear dependence between two variables. The correlation coefficient is calculated between the
subjective and objective scores using the following equation.
1
2 2
1 1
( ) ( )
( ) ( )
N
i i
i
N N
i i
i i
X X Y Y
R
X X Y Y
Where iX and iY denote the subjective and the objective scores. X and Y show the subjective and the objective
samples mean and N represents the total number of tests that considered in the evaluation process.