Embed Size (px)
Citation preview
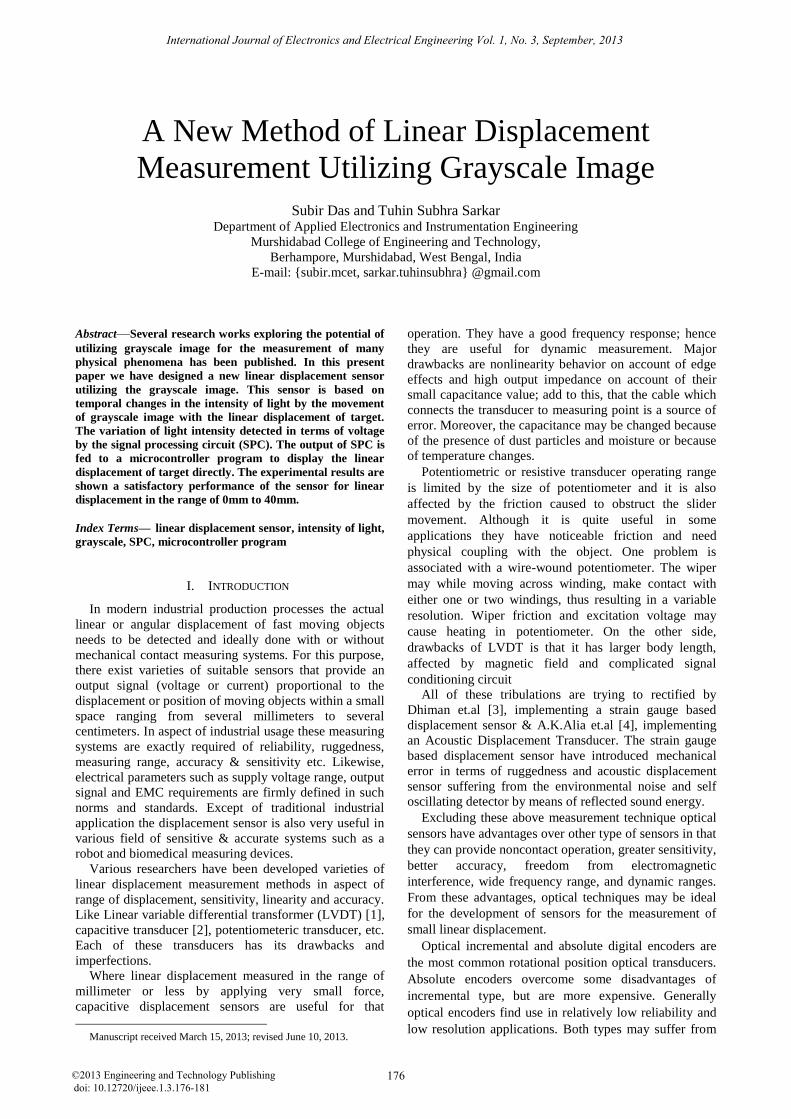
A New Method of Linear Displacement
Measurement Utilizing Grayscale Image
Subir Das and Tuhin Subhra Sarkar Department of Applied Electronics and Instrumentation Engineering
Murshidabad College of Engineering and Technology,
Berhampore, Murshidabad, West Bengal, India
E-mail: subir.mcet, sarkar.tuhinsubhra @gmail.com
Abstract—Several research works exploring the potential of
utilizing grayscale image for the measurement of many
physical phenomena has been published. In this present
paper we have designed a new linear displacement sensor
utilizing the grayscale image. This sensor is based on
temporal changes in the intensity of light by the movement
of grayscale image with the linear displacement of target.
The variation of light intensity detected in terms of voltage
by the signal processing circuit (SPC). The output of SPC is
fed to a microcontroller program to display the linear
displacement of target directly. The experimental results are
shown a satisfactory performance of the sensor for linear
displacement in the range of 0mm to 40mm.
Index Terms— linear displacement sensor, intensity of light,
grayscale, SPC, microcontroller program
I. INTRODUCTION
In modern industrial production processes the actual
linear or angular displacement of fast moving objects
needs to be detected and ideally done with or without
mechanical contact measuring systems. For this purpose,
there exist varieties of suitable sensors that provide an
output signal (voltage or current) proportional to the
displacement or position of moving objects within a small
space ranging from several millimeters to several
centimeters. In aspect of industrial usage these measuring
systems are exactly required of reliability, ruggedness,
measuring range, accuracy & sensitivity etc. Likewise,
electrical parameters such as supply voltage range, output
signal and EMC requirements are firmly defined in such
norms and standards. Except of traditional industrial
application the displacement sensor is also very useful in
various field of sensitive & accurate systems such as a
robot and biomedical measuring devices.
Various researchers have been developed varieties of
linear displacement measurement methods in aspect of
range of displacement, sensitivity, linearity and accuracy.
Like Linear variable differential transformer (LVDT) [1],
capacitive transducer [2], potentiometeric transducer, etc.
Each of these transducers has its drawbacks and
imperfections.
Where linear displacement measured in the range of
millimeter or less by applying very small force,
capacitive displacement sensors are useful for that
Manuscript received March 15, 2013; revised June 10, 2013.
operation. They have a good frequency response; hence
they are useful for dynamic measurement. Major
drawbacks are nonlinearity behavior on account of edge
effects and high output impedance on account of their
small capacitance value; add to this, that the cable which
connects the transducer to measuring point is a source of
error. Moreover, the capacitance may be changed because
of the presence of dust particles and moisture or because
of temperature changes.
Potentiometric or resistive transducer operating range
is limited by the size of potentiometer and it is also
affected by the friction caused to obstruct the slider
movement. Although it is quite useful in some
applications they have noticeable friction and need
physical coupling with the object. One problem is
associated with a wire-wound potentiometer. The wiper
may while moving across winding, make contact with
either one or two windings, thus resulting in a variable
resolution. Wiper friction and excitation voltage may
cause heating in potentiometer. On the other side,
drawbacks of LVDT is that it has larger body length,
affected by magnetic field and complicated signal
conditioning circuit
All of these tribulations are trying to rectified by
Dhiman et.al [3], implementing a strain gauge based
displacement sensor & A.K.Alia et.al [4], implementing
an Acoustic Displacement Transducer. The strain gauge based displacement sensor have introduced mechanical
error in terms of ruggedness and acoustic displacement
sensor suffering from the environmental noise and self
oscillating detector by means of reflected sound energy.
Excluding these above measurement technique optical
sensors have advantages over other type of sensors in that
they can provide noncontact operation, greater sensitivity,
better accuracy, freedom from electromagnetic
interference, wide frequency range, and dynamic ranges.
From these advantages, optical techniques may be ideal
for the development of sensors for the measurement of
small linear displacement.
Optical incremental and absolute digital encoders are
the most common rotational position optical transducers.
Absolute encoders overcome some disadvantages of
incremental type, but are more expensive. Generally
optical encoders find use in relatively low reliability and
low resolution applications. Both types may suffer from
International Journal of Electronics and Electrical Engineering Vol. 1, No. 3, September, 2013
176©2013 Engineering and Technology Publishingdoi: 10.12720/ijeee.1.3.176-181

damage in harsh industrial environment. For sensing the
linear displacement, linear encoder and quadrature
encoder are traditionally used. Historically, the practical
disadvantage of optical encoders have included pattern
inaccuracies, concentricity errors between disc and shaft,
susceptibility to electrical noise, vulnerability to shock
and lose of data in power failure. One of major problems
with optical encoders; ice crystal formation and resultant
pattern damage when the shaft turns has not really been
completely solved. Instead of optical encoder some of the
researcher’s works on the principle of variation of light
intensity due to reflection of optical signal from the target
or moving objects which is the source of displacement
and also it is called reflector. Advantage of such systems
has simple in design, low cost & free from ice crystal
formation. Maiti.et.al [5] & Mhdi.et.al [6] developed a
linear variable differential displacement sensor based on
optical light intensity variation method. The drawbacks in
such systems are the reflected light could not attain the
same incident angle and reflection angle between the
source and detector after variation from steady state
position of the reflector, it was scattered from the detector.
So the expected variation of light intensity due to the
displacement makes an error.
Building on the above, it becomes obvious that there is
a wide range of engineering activities still needed to be
done for the improvement of the existing industrial
displacement measurement systems or for the
development of new types based on new perspectives. In
this present paper, we have introduced a new method of
linear displacement measurement system which
contributed better accuracy, linearity, repeatability and
also industrial requirements within a small space range.
This method has been designed by the principle of optical
light intensity variation method by the linear movement
of grayscale image plate with the linear displacement of
moving objects. As the moving objects displaced from its
steady state position the grayscale image plate moves
over the optical sensors accordingly. The optical sensor
consists of a transmitter and a photo-detector. Due to the
movement of grayscale plate the emitted light intensity of
a transmitter has been varied and detected by the photo-
detector. Finally it makes output variation in terms of
voltage & displayed the changes of displacement utilizing
the SPC unit & microcontroller programmed based
display unit. Since it has an advantage over the optical
sensor like reflector arrangement that the light intensity
largely independent of the reflector position & very
simple in design. Also its enclosed structure prevents the
system from harsh industrial environment disturbance.
The prototype module operates in the linear scale of 0
mm to 40 mm displacement range. We proved
successfully that this system works as a small linear-
displacement sensor. The introduction is followed by a
representation of the working principle, constructional
details, the experimental investigation, and a series of
discussion topics based on the experiment.
Figure 1. Gradient grayscale image
II. THEORETICAL BACKGROUND
In the field of photography and computing, a bi-
tonal discrete image is such a type of image in which
mesh of rectangular cells contain a color value
(information content), is called pixel. This pixel hold only
smallest possible information content with a “0” are
referred to as black and “1” are referred to as white. If
images are presented by these two colors, obviously those
images are known as black-and-white images. Unlike bi-
tonal images, in the context of computer imaging
grayscale information contents have many shades,
varying from black to white. That grayscale images
carries only intensity information of light, viz. black as
the weakest intensity and white as the strongest intensity
of light. In grayscale images each pixel holds 8 bit length
color information, resulting in 256 (i.e.28=256) different
gray levels to represent the variation of color in between
of black and white. Where, all 8-bit 0’s (i.e. zero in
decimal) represents as normally black and all 8-bit 1’s
(i.e. 255 in decimal) represents as white and the gray
levels are the decimal numbers in between of 0 and 255.
Now if these 256 gray levels are mapped onto a ramp
scale, it is seen that the pixel color information is changed
gradually from black to white. More specifically, when
gray levels are increased gradually i.e. from 0 to 255,
black color decreased gradually along with gradually
increasing of white color, is referred to as a gradient
grayscale image. Now if this gradient grayscale image is
placed under the light source, it is found that the reflected
light intensity level is mostly weakest at 0th gray level
and strongest at 255th gray level of pixel. So, it is
obvious that when gray levels of pixels are increased
gradually, the intensity of light is changed accordingly i.e.
from weakest intensity to strongest intensity and it seems
that it might be changed linearly. In this present work, we
have developed a gradient grayscale image with the
dimension of 40mm length and 30mm width utilizing the
MATLAB programming as shown in Fig. 1. So, it is
obvious that gradient grayscale image probably can make
International Journal of Electronics and Electrical Engineering Vol. 1, No. 3, September, 2013
177©2013 Engineering and Technology Publishing
a linear change of light intensity from weakest point to
strongest point.
III. EXPERIMENTAL PROCEDURE
A. Working Principal
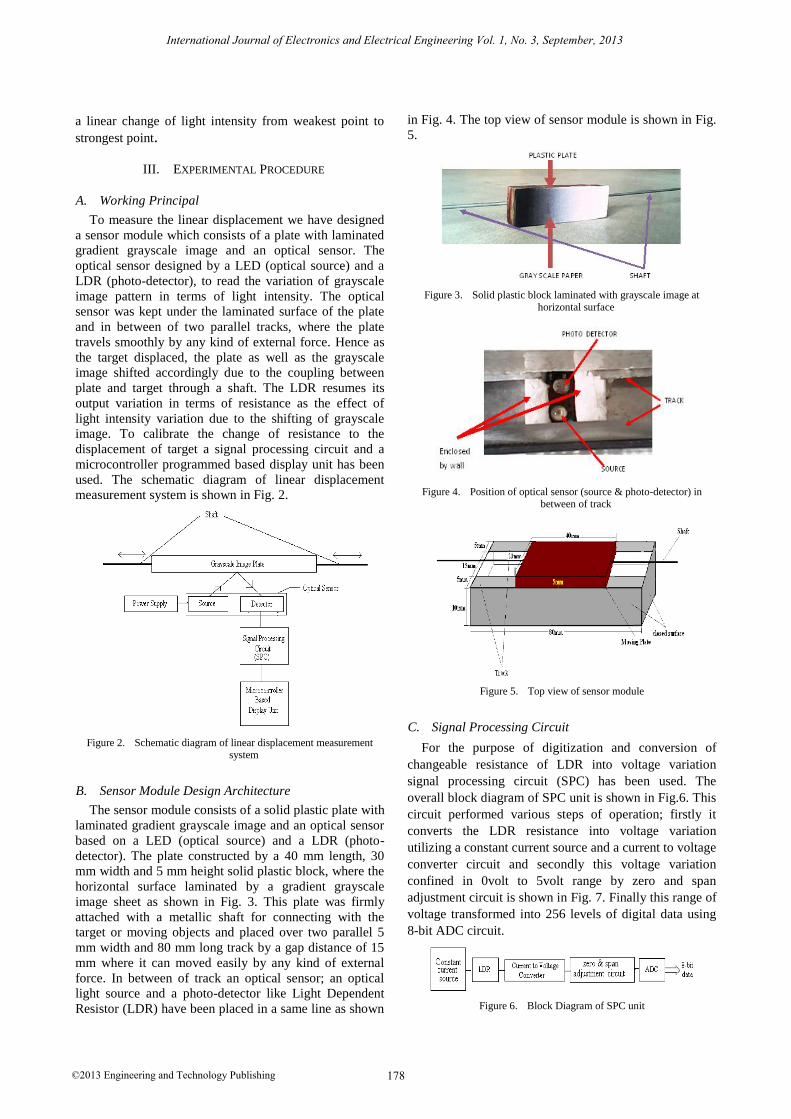
To measure the linear displacement we have designed
a sensor module which consists of a plate with laminated
gradient grayscale image and an optical sensor. The
optical sensor designed by a LED (optical source) and a
LDR (photo-detector), to read the variation of grayscale
image pattern in terms of light intensity. The optical
sensor was kept under the laminated surface of the plate
and in between of two parallel tracks, where the plate
travels smoothly by any kind of external force. Hence as
the target displaced, the plate as well as the grayscale
image shifted accordingly due to the coupling between
plate and target through a shaft. The LDR resumes its
output variation in terms of resistance as the effect of
light intensity variation due to the shifting of grayscale
image. To calibrate the change of resistance to the
displacement of target a signal processing circuit and a
microcontroller programmed based display unit has been
used. The schematic diagram of linear displacement
measurement system is shown in Fig. 2.
Figure 2. Schematic diagram of linear displacement measurement system
B. Sensor Module Design Architecture
The sensor module consists of a solid plastic plate with
laminated gradient grayscale image and an optical sensor
based on a LED (optical source) and a LDR (photo-
detector). The plate constructed by a 40 mm length, 30
mm width and 5 mm height solid plastic block, where the
horizontal surface laminated by a gradient grayscale
image sheet as shown in Fig. 3. This plate was firmly
attached with a metallic shaft for connecting with the
target or moving objects and placed over two parallel 5
mm width and 80 mm long track by a gap distance of 15
mm where it can moved easily by any kind of external
force. In between of track an optical sensor; an optical
light source and a photo-detector like Light Dependent
Resistor (LDR) have been placed in a same line as shown
in Fig. 4. The top view of sensor module is shown in Fig.
5.
Figure 3. Solid plastic block laminated with grayscale image at horizontal surface
Figure 4. Position of optical sensor (source & photo-detector) in between of track
Figure 5. Top view of sensor module
C. Signal Processing Circuit
For the purpose of digitization and conversion of
changeable resistance of LDR into voltage variation
signal processing circuit (SPC) has been used. The
overall block diagram of SPC unit is shown in Fig.6. This
circuit performed various steps of operation; firstly it
converts the LDR resistance into voltage variation
utilizing a constant current source and a current to voltage
converter circuit and secondly this voltage variation
confined in 0volt to 5volt range by zero and span
adjustment circuit is shown in Fig. 7. Finally this range of
voltage transformed into 256 levels of digital data using
8-bit ADC circuit.
Figure 6. Block Diagram of SPC unit
International Journal of Electronics and Electrical Engineering Vol. 1, No. 3, September, 2013
178©2013 Engineering and Technology Publishing

Figure 7. Circuit diagram for detection of LDR resistance into voltage variation (0 to 5 volt)
D. Microcontroller Programmed based Display Unit
Figure 8. Flowchart of Microcontroller program
International Journal of Electronics and Electrical Engineering Vol. 1, No. 3, September, 2013
179©2013 Engineering and Technology Publishing

The SPC unit developed a voltage range of 0 volt to 5
volt due to the displacement of 40mm to 0mm. Hence a
display unit has the capability to display the actual
displacement of 0 mm to 40 mm due to the variation of
voltage range from 5 volt to 0 volt. To display the actual
displacement of target the digitize value of this voltage
range is fed to port1 of ATMEL 89S52 microcontroller
which interfaced with the 16 characters 2 line LCD unit
at port2. The programming of microcontroller displayed
the actual displacement of target using the output data of
ADC and defined Look-up-table data. The detailed
flowchart of microcontroller program is shown in Fig. 8.
IV. EXPERIMENTAL RESULT
In the proposed scheme the linear displacement of
target or moving objects has been measured by the
movement of gradient grayscale image over an optical
sensor. The optical sensor transmits light by a LED and
reflects back from the surface of grayscale image to the
photo-detector (LDR). At initial condition, the weakest
intensity point of grayscale image i.e. heavy dark region
belongs over the optical sensor. In this state the output of
LDR resistance was high due to absorption of more light
by the dark region of grayscale image. Hence as the target
moves linearly from its initial position the grayscale
image moves accordingly from its weakest intensity point
to strongest intensity point i.e. heavy dark region to white
region. So the output of LDR resistance has been
decreased linearly. It is noticed that the LDR resistance
varies linearly from 7.74 KΩ to 4.68 KΩ due the
movement of target in the range of 0mm to 40mm. The
LDR characteristics curve due to the movement of target
is shown in Fig.9. In Fig.7, the change of LDR resistance
has been fed to the current to voltage converter circuit
which designed by a rated 1mA current source and
produced change of voltage according to Ohm’s Law.
After getting this voltage variation it has been calibrated
in the range of 0 volt to 5 volt for the linear displacement
of 40mm to 0mm. The calibrated output voltage (V0) has
been measured and plotted against the linear
displacement of target, which is shown in Fig.10
Figure 9. Plot of output resistance of LDR vs. Linear displacement of
target
Figure 10. Plot of output voltage (V0) of SPC vs. linear
dispalcement of target
In Fig.10, it is obvious that the output voltage (V0) of
SPC unit approximately linear with the displacement of
target. Hence we have calculated the non linearity of that
curve utilizing best-fit straight line method and find the
value of -6.67% FSO (Full Scale Output) at the
dispalcement of 40mm. In the contrast of the other
displacement sensor like LVDT[1] and strain gauge based
dispalcement sensor[3] has exhibits linearity only in 0 to
5mm and 0 to 10mm range respectively. Also the
accuracy factor of that measurement method is -2% FSO
at 4mm.
The proposed sensing method can measure the smallest
displacement of 1mm i.e; resolution of this method is
1mm. So it exhibits better resolution than optical
LVDT[5] and Acoustic displacement transducer[4] which
shown 10mm and 5mm respectively.
The repeteability of that sensing method has been
plotted in Fig.11 considering the displacement of 10mm
at 10 times repeated measurements. It has been found that
the maximum value of output voltage (V0) is 4.07 volt,
minimum value of output voltage (V0) is 4.068 volt and
average value in that displacement is 4.069 volt. The full
scale value of output voltage (V0) is 5.02 volt at
maximum span of displacement about 40mm so, the
repeteability of that method evaluated as 0.04%FSO.
Figure 11. Repeatability test at 10 mm displacement
V. CONCLUTION
The designed sensor is efficient, in expensive, and
multipurpose. It could be integrated with other primary
non electrical sensors and order to get an electrical read
out.
International Journal of Electronics and Electrical Engineering Vol. 1, No. 3, September, 2013
180©2013 Engineering and Technology Publishing

This displacement sensor module is applicable in
various industrial fields such as robot, biomedical
measuring device, rectilinear motor & position feed back
of a pneumatic or hydraulic cylinder rod. In this case the
sensor is not embedded within the target, but externally
tied through a yoke to the target body.
From Fig.10 it is obvious that the output voltage (V0)
variation of SPC unit with the variation of displacement
has been found approximately linear in the range of 0mm
to 40mm. So accurate measurement of displacement in
linear range, computer based programming can be used
by interfacing this sensor with the DAS card & PC, it is
the future scope of work.
This displacement sensor module can also be used
beyond this measured range; it is also the future scope of
work.
REFERENCES
[1] S. C. Saxena and S. B. L. Saksena, “A self compensated smart
LVDT transducer,” IEEE Trans. Inst.& Meas. Vol. 38, no. 3, pp. 748-753, 1989.
[2] F. N. Toth and G. C. M. Meijer, “A low cost smart capacitive
position sensor,” IEEE Trans. Inst.& Meas. Vol. 41, no. 6, pp. 1041-1044, June 1992
[3] P. K. Dhiman, K. Pal, and R. K. Sharma, “Strain gauge based
displacement sensor,” Journal of Physical Sciences, Vol. 10, pp.
164–166, 2006.
[4] T. A. Mograbi, M. A. K. Alia, and M. Abuzalata, “Design of an
acoustic displacement transducer,” Sensors & Transducers
Journal, Vol. 112, Issue 1, pp. 1-9, January 2010. [5] T. K. Maiti, P. Paul, I. Das, and S. Saha, “PC based linear
variable differential displacement measurement uses optical
technique,” Sensors & Transducers Journal, Vol.81, Issue 7, pp. 1341-1347, July 2007.
[6] B. R. Mhdi, N. A. Aljaber, S. M. Aljwas, and A. H. Khalid,
“Design and construction of optical fiber sensor system for detection of the stress and fine motion,” International Journal of
Nano Devices, Sensors and Systems (IJ-Nano), Volume 1, no. 1, pp. 25-33, May 2012.
Subir Das was born in West Bengal, India in 1984.
He received Bachelor’s degree in electronics & instrumentation engineering from West Bengal
University of Technology, West Bengal, India in
2006 and M.Tech degree in instrumentation & control engineering from University of Calcutta,
West Bengal, India in 2010. He is currently an Assistant Professor in Applied Electronics &
Instrumentation Engineering at Murshidabad College of Engineering &
Technology, Berhampore, West Bengal, India. He worked with Danieli Automation, West Bengal, India, Core-Technologies, West Bengal,
India and Stesalit India Ltd. West Bengal, India between 2006 and 2008. His research interests include the design of sensors and transducers,
robotics automation, industrial automation and image processing. He
has authored or coauthored nearly 8 papers in the areas of the sensors and transducers, and design of electronics measuring systems.
Tuhin Subhra Sarkar was born in West Bengal
India in 1981. He received Bachelor’s degree in
electronics & instrumentation engineering from University of Kalyani, West Bengal, India in 2004
and M.Tech degree in computer science and engineering from University of Kalyani, West
Bengal, India in 2006. He is currently an Assistant
Professor in Applied Electronics & Instrumentation Engineering at Murshidabad College of
Engineering & Technology, Berhampore, West Bengal, India. He has
been a visiting Lecturer in Sheikhpara A. R. M. Polytechnic, West
Bengal, India between 2006 and 2007. His research interests include the
design of sensors and transducers, VLSI, network security and image processing. He has authored or coauthored nearly 6 papers in the areas
of the sensors and transducers, network security and VLSI.
International Journal of Electronics and Electrical Engineering Vol. 1, No. 3, September, 2013
181©2013 Engineering and Technology Publishing


![Linear Displacement Effficiency_In waterflooding [Compatibility Mode]](https://img.pdfslide.us/doc/110x75/551c750b49795911568b4724/linear-displacement-effficiencyin-waterflooding-compatibility-mode.jpg)