Embed Size (px)
Citation preview
lable at ScienceDirect
Energy xxx (2015) 1e16
Contents lists avai
Energy
journal homepage: www.elsevier .com/locate/energy
A new graphical method for Pinch Analysis applications: Heatexchanger network retrofit and energy integration
Mamdouh A. Gadalla*
Dept. of Chemical Engineering, The British University in Egypt (BUE), El Sherouk City, Misr-Ismalia Road, 11837, Egypt
a r t i c l e i n f o
Article history:Received 9 July 2014Received in revised form18 November 2014Accepted 5 December 2014Available online xxx
Keywords:Pinch AnalysisGraphical techniqueEnergy savingRetrofitEnergy integrationCrude oil
* Tel.: þ20 22 689 0000x1471; fax: þ20 22 630 00E-mail address: [email protected].
http://dx.doi.org/10.1016/j.energy.2014.12.0110360-5442/© 2014 Elsevier Ltd. All rights reserved.
Please cite this article in press as: Gadalla Menergy integration, Energy (2015), http://dx
a b s t r a c t
Energy integration is a key solution in chemical process and crude refining industries to minimiseexternal fuel consumption and to face the impact of growing energy crises. Typical energy integrationprojects can reach a reduction of heating fuels and cold utilities by up to 40% compared with originaldesigns or existing installations. Pinch Analysis is a leading tool and regarded as an efficient method toincrease energy efficiency and minimise fuel flow consumptions. It is valid for both natures of design,grassroots and retrofit situations. It can practically be applied to synthesise a HEN (heat exchangernetwork) or modify an existing preheat train for minimum energy consumption. Heat recovery systemsor HENs are networks for exchanging heat between hot and cold process sources. All heat transferredfrom hot process sources into cold process sinks represent the scope for energy integration. On the otherhand, energies required beyond this integrated amount are to be satisfied by external utilities. Graphicalrepresentations of Pinch Analysis, such as Composite and Grand Composite Curves are very useful forgrassroots designs. Nevertheless, in retrofit situation the analysis is not adequate and besides it isgraphically tedious to represent existing exchangers on such graphs.
This research proposes a new graphical method for the analysis of heat recovery systems, applicable toHEN retrofit. The new graphical method is based on plotting temperatures of process hot streams versustemperatures of process cold streams. A new graph is constructed for representing existing HENs. For agiven network, each existing exchanger is represented by a straight line, whose slope is proportional tothe ratio of heat capacities and flows. Further, the length of each exchanger line is related to the heat flowtransferred across this exchanger. This new graphical representation can easily identify exchangersacross the pinch, Network Pinch, pinching matches and improper placement of fuel consumption.Furthermore, such a graph can recognise promising modifications to improve the energy performanceand hence less fuel and cooling water requirement. Graphs developed in this work can be used to analysethe energy performance of existing networks with respect to energy targets. They can also be used injunction with the background process to modify basic designs or existing network for better energyintegration opportunities and minimum fuel demands. The application of the new graphical method to acase study showed savings of approximately 17% in energy demands and fuel consumption.
© 2014 Elsevier Ltd. All rights reserved.
1. Introduction
Chemical plants, including crude oil up-stream processingunits are energy-intensive process industries. Among these unitoperations and process equipment, distillation is found to be themost energy consuming unit. As an example, Gadalla et al. [1]reviewed the energy problems of refinery crude distillationplants as major energy intensive processes, and focused to
10.
A, A new graphical method.doi.org/10.1016/j.energy.2014
optimise existing operating conditions for minimum energy de-mands. More general, Smith in his textbook [2] devoted completechapters to introduce the fundamentals of energy consumption indistillation industry, distillation sequencing, retrofit of distillationunits, optimisation of superstructure for distillation sequencing,heat integration in distillation, etc. The textbook also considerednormal distillation as well as azeotropic mixtures, and presentedin detail all principles and design guidelines of Pinch Analysis. Onthe other hand, El-Halwagi [3] considered distillation industries inmany of his applications for energy integration, optimisation andsustainability. This book additionally introduced the conceptual
for Pinch Analysis applications: Heat exchanger network retrofit and.12.011
M.A. Gadalla / Energy xxx (2015) 1e162
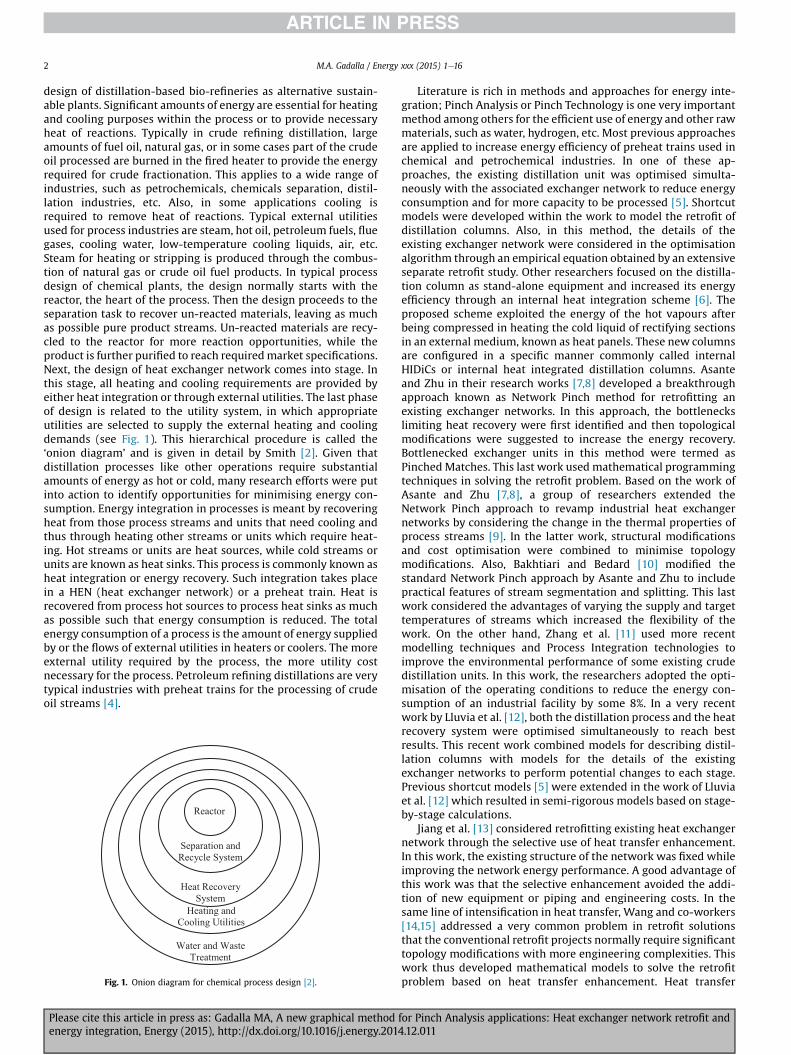
design of distillation-based bio-refineries as alternative sustain-able plants. Significant amounts of energy are essential for heatingand cooling purposes within the process or to provide necessaryheat of reactions. Typically in crude refining distillation, largeamounts of fuel oil, natural gas, or in some cases part of the crudeoil processed are burned in the fired heater to provide the energyrequired for crude fractionation. This applies to a wide range ofindustries, such as petrochemicals, chemicals separation, distil-lation industries, etc. Also, in some applications cooling isrequired to remove heat of reactions. Typical external utilitiesused for process industries are steam, hot oil, petroleum fuels, fluegases, cooling water, low-temperature cooling liquids, air, etc.Steam for heating or stripping is produced through the combus-tion of natural gas or crude oil fuel products. In typical processdesign of chemical plants, the design normally starts with thereactor, the heart of the process. Then the design proceeds to theseparation task to recover un-reacted materials, leaving as muchas possible pure product streams. Un-reacted materials are recy-cled to the reactor for more reaction opportunities, while theproduct is further purified to reach requiredmarket specifications.Next, the design of heat exchanger network comes into stage. Inthis stage, all heating and cooling requirements are provided byeither heat integration or through external utilities. The last phaseof design is related to the utility system, in which appropriateutilities are selected to supply the external heating and coolingdemands (see Fig. 1). This hierarchical procedure is called the‘onion diagram’ and is given in detail by Smith [2]. Given thatdistillation processes like other operations require substantialamounts of energy as hot or cold, many research efforts were putinto action to identify opportunities for minimising energy con-sumption. Energy integration in processes is meant by recoveringheat from those process streams and units that need cooling andthus through heating other streams or units which require heat-ing. Hot streams or units are heat sources, while cold streams orunits are known as heat sinks. This process is commonly known asheat integration or energy recovery. Such integration takes placein a HEN (heat exchanger network) or a preheat train. Heat isrecovered from process hot sources to process heat sinks as muchas possible such that energy consumption is reduced. The totalenergy consumption of a process is the amount of energy suppliedby or the flows of external utilities in heaters or coolers. The moreexternal utility required by the process, the more utility costnecessary for the process. Petroleum refining distillations are verytypical industries with preheat trains for the processing of crudeoil streams [4].
Fig. 1. Onion diagram for chemical process design [2].
Please cite this article in press as: Gadalla MA, A new graphical methodenergy integration, Energy (2015), http://dx.doi.org/10.1016/j.energy.201
Literature is rich in methods and approaches for energy inte-gration; Pinch Analysis or Pinch Technology is one very importantmethod among others for the efficient use of energy and other rawmaterials, such as water, hydrogen, etc. Most previous approachesare applied to increase energy efficiency of preheat trains used inchemical and petrochemical industries. In one of these ap-proaches, the existing distillation unit was optimised simulta-neously with the associated exchanger network to reduce energyconsumption and for more capacity to be processed [5]. Shortcutmodels were developed within the work to model the retrofit ofdistillation columns. Also, in this method, the details of theexisting exchanger network were considered in the optimisationalgorithm through an empirical equation obtained by an extensiveseparate retrofit study. Other researchers focused on the distilla-tion column as stand-alone equipment and increased its energyefficiency through an internal heat integration scheme [6]. Theproposed scheme exploited the energy of the hot vapours afterbeing compressed in heating the cold liquid of rectifying sectionsin an external medium, known as heat panels. These new columnsare configured in a specific manner commonly called internalHIDiCs or internal heat integrated distillation columns. Asanteand Zhu in their research works [7,8] developed a breakthroughapproach known as Network Pinch method for retrofitting anexisting exchanger networks. In this approach, the bottleneckslimiting heat recovery were first identified and then topologicalmodifications were suggested to increase the energy recovery.Bottlenecked exchanger units in this method were termed asPinched Matches. This last work used mathematical programmingtechniques in solving the retrofit problem. Based on the work ofAsante and Zhu [7,8], a group of researchers extended theNetwork Pinch approach to revamp industrial heat exchangernetworks by considering the change in the thermal properties ofprocess streams [9]. In the latter work, structural modificationsand cost optimisation were combined to minimise topologymodifications. Also, Bakhtiari and Bedard [10] modified thestandard Network Pinch approach by Asante and Zhu to includepractical features of stream segmentation and splitting. This lastwork considered the advantages of varying the supply and targettemperatures of streams which increased the flexibility of thework. On the other hand, Zhang et al. [11] used more recentmodelling techniques and Process Integration technologies toimprove the environmental performance of some existing crudedistillation units. In this work, the researchers adopted the opti-misation of the operating conditions to reduce the energy con-sumption of an industrial facility by some 8%. In a very recentwork by Lluvia et al. [12], both the distillation process and the heatrecovery system were optimised simultaneously to reach bestresults. This recent work combined models for describing distil-lation columns with models for the details of the existingexchanger networks to perform potential changes to each stage.Previous shortcut models [5] were extended in the work of Lluviaet al. [12] which resulted in semi-rigorous models based on stage-by-stage calculations.
Jiang et al. [13] considered retrofitting existing heat exchangernetwork through the selective use of heat transfer enhancement.In this work, the existing structure of the network was fixed whileimproving the network energy performance. A good advantage ofthis work was that the selective enhancement avoided the addi-tion of new equipment or piping and engineering costs. In thesame line of intensification in heat transfer, Wang and co-workers[14,15] addressed a very common problem in retrofit solutionsthat the conventional retrofit projects normally require significanttopology modifications with more engineering complexities. Thiswork thus developed mathematical models to solve the retrofitproblem based on heat transfer enhancement. Heat transfer
for Pinch Analysis applications: Heat exchanger network retrofit and4.12.011
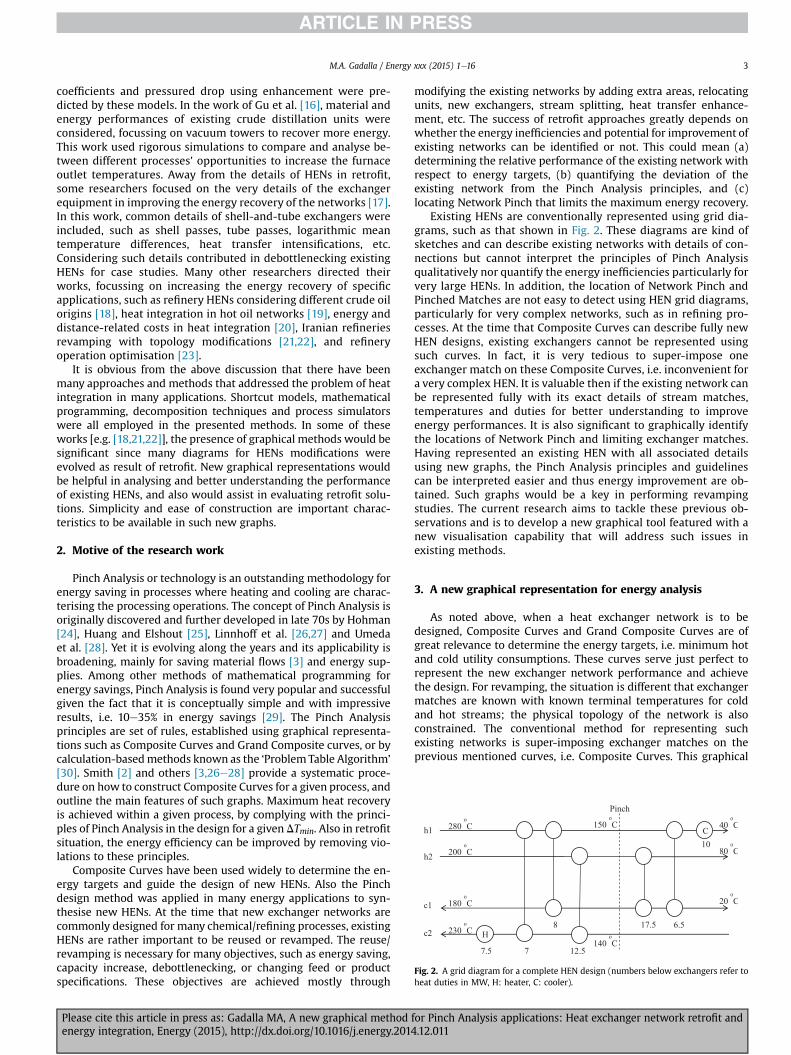
Fig. 2. A grid diagram for a complete HEN design (numbers below exchangers refer toheat duties in MW, H: heater, C: cooler).
M.A. Gadalla / Energy xxx (2015) 1e16 3
coefficients and pressured drop using enhancement were pre-dicted by these models. In the work of Gu et al. [16], material andenergy performances of existing crude distillation units wereconsidered, focussing on vacuum towers to recover more energy.This work used rigorous simulations to compare and analyse be-tween different processes' opportunities to increase the furnaceoutlet temperatures. Away from the details of HENs in retrofit,some researchers focused on the very details of the exchangerequipment in improving the energy recovery of the networks [17].In this work, common details of shell-and-tube exchangers wereincluded, such as shell passes, tube passes, logarithmic meantemperature differences, heat transfer intensifications, etc.Considering such details contributed in debottlenecking existingHENs for case studies. Many other researchers directed theirworks, focussing on increasing the energy recovery of specificapplications, such as refinery HENs considering different crude oilorigins [18], heat integration in hot oil networks [19], energy anddistance-related costs in heat integration [20], Iranian refineriesrevamping with topology modifications [21,22], and refineryoperation optimisation [23].
It is obvious from the above discussion that there have beenmany approaches and methods that addressed the problem of heatintegration in many applications. Shortcut models, mathematicalprogramming, decomposition techniques and process simulatorswere all employed in the presented methods. In some of theseworks [e.g. [18,21,22]], the presence of graphical methods would besignificant since many diagrams for HENs modifications wereevolved as result of retrofit. New graphical representations wouldbe helpful in analysing and better understanding the performanceof existing HENs, and also would assist in evaluating retrofit solu-tions. Simplicity and ease of construction are important charac-teristics to be available in such new graphs.
2. Motive of the research work
Pinch Analysis or technology is an outstanding methodology forenergy saving in processes where heating and cooling are charac-terising the processing operations. The concept of Pinch Analysis isoriginally discovered and further developed in late 70s by Hohman[24], Huang and Elshout [25], Linnhoff et al. [26,27] and Umedaet al. [28]. Yet it is evolving along the years and its applicability isbroadening, mainly for saving material flows [3] and energy sup-plies. Among other methods of mathematical programming forenergy savings, Pinch Analysis is found very popular and successfulgiven the fact that it is conceptually simple and with impressiveresults, i.e. 10e35% in energy savings [29]. The Pinch Analysisprinciples are set of rules, established using graphical representa-tions such as Composite Curves and Grand Composite curves, or bycalculation-basedmethods known as the ‘Problem Table Algorithm’
[30]. Smith [2] and others [3,26e28] provide a systematic proce-dure on how to construct Composite Curves for a given process, andoutline the main features of such graphs. Maximum heat recoveryis achieved within a given process, by complying with the princi-ples of Pinch Analysis in the design for a given DTmin. Also in retrofitsituation, the energy efficiency can be improved by removing vio-lations to these principles.
Composite Curves have been used widely to determine the en-ergy targets and guide the design of new HENs. Also the Pinchdesign method was applied in many energy applications to syn-thesise new HENs. At the time that new exchanger networks arecommonly designed for many chemical/refining processes, existingHENs are rather important to be reused or revamped. The reuse/revamping is necessary for many objectives, such as energy saving,capacity increase, debottlenecking, or changing feed or productspecifications. These objectives are achieved mostly through
Please cite this article in press as: Gadalla MA, A new graphical methodenergy integration, Energy (2015), http://dx.doi.org/10.1016/j.energy.2014
modifying the existing networks by adding extra areas, relocatingunits, new exchangers, stream splitting, heat transfer enhance-ment, etc. The success of retrofit approaches greatly depends onwhether the energy inefficiencies and potential for improvement ofexisting networks can be identified or not. This could mean (a)determining the relative performance of the existing network withrespect to energy targets, (b) quantifying the deviation of theexisting network from the Pinch Analysis principles, and (c)locating Network Pinch that limits the maximum energy recovery.
Existing HENs are conventionally represented using grid dia-grams, such as that shown in Fig. 2. These diagrams are kind ofsketches and can describe existing networks with details of con-nections but cannot interpret the principles of Pinch Analysisqualitatively nor quantify the energy inefficiencies particularly forvery large HENs. In addition, the location of Network Pinch andPinched Matches are not easy to detect using HEN grid diagrams,particularly for very complex networks, such as in refining pro-cesses. At the time that Composite Curves can describe fully newHEN designs, existing exchangers cannot be represented usingsuch curves. In fact, it is very tedious to super-impose oneexchanger match on these Composite Curves, i.e. inconvenient fora very complex HEN. It is valuable then if the existing network canbe represented fully with its exact details of stream matches,temperatures and duties for better understanding to improveenergy performances. It is also significant to graphically identifythe locations of Network Pinch and limiting exchanger matches.Having represented an existing HEN with all associated detailsusing new graphs, the Pinch Analysis principles and guidelinescan be interpreted easier and thus energy improvement are ob-tained. Such graphs would be a key in performing revampingstudies. The current research aims to tackle these previous ob-servations and is to develop a new graphical tool featured with anew visualisation capability that will address such issues inexisting methods.
3. A new graphical representation for energy analysis
As noted above, when a heat exchanger network is to bedesigned, Composite Curves and Grand Composite Curves are ofgreat relevance to determine the energy targets, i.e. minimum hotand cold utility consumptions. These curves serve just perfect torepresent the new exchanger network performance and achievethe design. For revamping, the situation is different that exchangermatches are known with known terminal temperatures for coldand hot streams; the physical topology of the network is alsoconstrained. The conventional method for representing suchexisting networks is super-imposing exchanger matches on theprevious mentioned curves, i.e. Composite Curves. This graphical
for Pinch Analysis applications: Heat exchanger network retrofit and.12.011
M.A. Gadalla / Energy xxx (2015) 1e164
method seems tedious to obtain with the difficulty of matchingexisting temperatures with those target values of the curves.Instead, a new graphical representation is proposed that is easier toachieve and is of significance for energy analysis of newdesigns andin evaluating the performance of the existing HEN.
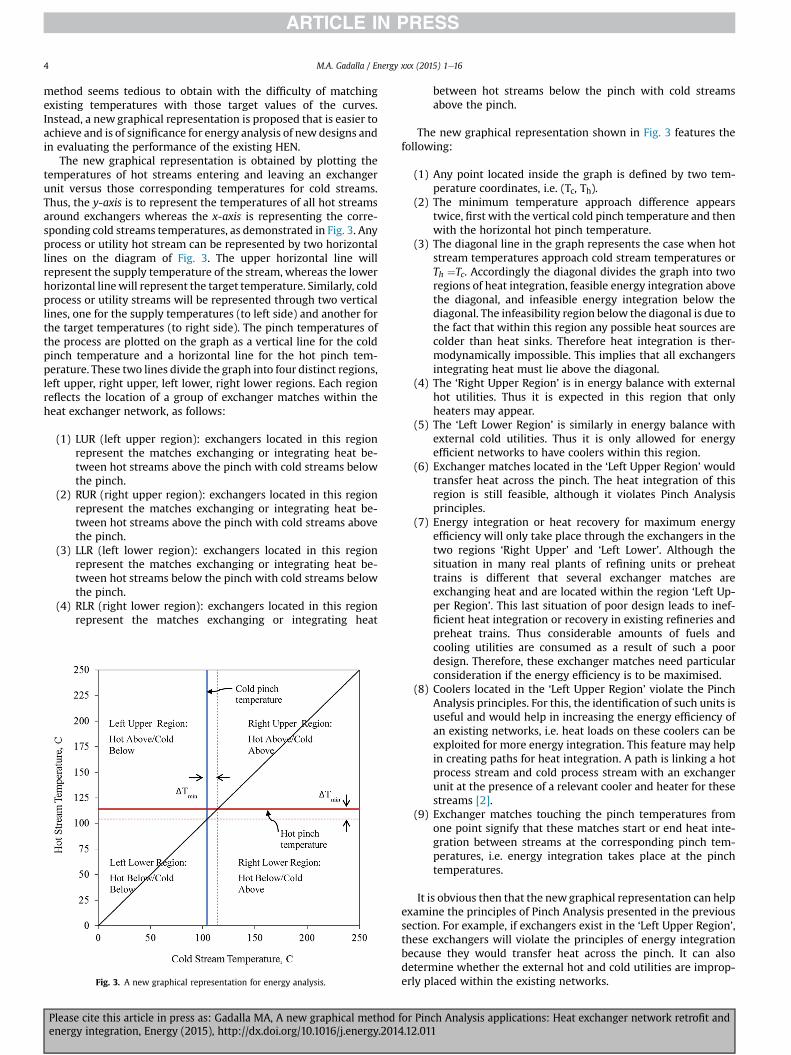
The new graphical representation is obtained by plotting thetemperatures of hot streams entering and leaving an exchangerunit versus those corresponding temperatures for cold streams.Thus, the y-axis is to represent the temperatures of all hot streamsaround exchangers whereas the x-axis is representing the corre-sponding cold streams temperatures, as demonstrated in Fig. 3. Anyprocess or utility hot stream can be represented by two horizontallines on the diagram of Fig. 3. The upper horizontal line willrepresent the supply temperature of the stream, whereas the lowerhorizontal linewill represent the target temperature. Similarly, coldprocess or utility streams will be represented through two verticallines, one for the supply temperatures (to left side) and another forthe target temperatures (to right side). The pinch temperatures ofthe process are plotted on the graph as a vertical line for the coldpinch temperature and a horizontal line for the hot pinch tem-perature. These two lines divide the graph into four distinct regions,left upper, right upper, left lower, right lower regions. Each regionreflects the location of a group of exchanger matches within theheat exchanger network, as follows:
(1) LUR (left upper region): exchangers located in this regionrepresent the matches exchanging or integrating heat be-tween hot streams above the pinch with cold streams belowthe pinch.
(2) RUR (right upper region): exchangers located in this regionrepresent the matches exchanging or integrating heat be-tween hot streams above the pinch with cold streams abovethe pinch.
(3) LLR (left lower region): exchangers located in this regionrepresent the matches exchanging or integrating heat be-tween hot streams below the pinch with cold streams belowthe pinch.
(4) RLR (right lower region): exchangers located in this regionrepresent the matches exchanging or integrating heat
Fig. 3. A new graphical representation for energy analysis.
Please cite this article in press as: Gadalla MA, A new graphical methodenergy integration, Energy (2015), http://dx.doi.org/10.1016/j.energy.201
between hot streams below the pinch with cold streamsabove the pinch.
The new graphical representation shown in Fig. 3 features thefollowing:
(1) Any point located inside the graph is defined by two tem-perature coordinates, i.e. (Tc, Th).
(2) The minimum temperature approach difference appearstwice, first with the vertical cold pinch temperature and thenwith the horizontal hot pinch temperature.
(3) The diagonal line in the graph represents the case when hotstream temperatures approach cold stream temperatures orTh ¼Tc. Accordingly the diagonal divides the graph into tworegions of heat integration, feasible energy integration abovethe diagonal, and infeasible energy integration below thediagonal. The infeasibility region below the diagonal is due tothe fact that within this region any possible heat sources arecolder than heat sinks. Therefore heat integration is ther-modynamically impossible. This implies that all exchangersintegrating heat must lie above the diagonal.
(4) The ‘Right Upper Region’ is in energy balance with externalhot utilities. Thus it is expected in this region that onlyheaters may appear.
(5) The ‘Left Lower Region’ is similarly in energy balance withexternal cold utilities. Thus it is only allowed for energyefficient networks to have coolers within this region.
(6) Exchanger matches located in the ‘Left Upper Region’ wouldtransfer heat across the pinch. The heat integration of thisregion is still feasible, although it violates Pinch Analysisprinciples.
(7) Energy integration or heat recovery for maximum energyefficiency will only take place through the exchangers in thetwo regions ‘Right Upper’ and ‘Left Lower’. Although thesituation in many real plants of refining units or preheattrains is different that several exchanger matches areexchanging heat and are located within the region ‘Left Up-per Region’. This last situation of poor design leads to inef-ficient heat integration or recovery in existing refineries andpreheat trains. Thus considerable amounts of fuels andcooling utilities are consumed as a result of such a poordesign. Therefore, these exchanger matches need particularconsideration if the energy efficiency is to be maximised.
(8) Coolers located in the ‘Left Upper Region’ violate the PinchAnalysis principles. For this, the identification of such units isuseful and would help in increasing the energy efficiency ofan existing networks, i.e. heat loads on these coolers can beexploited for more energy integration. This feature may helpin creating paths for heat integration. A path is linking a hotprocess stream and cold process stream with an exchangerunit at the presence of a relevant cooler and heater for thesestreams [2].
(9) Exchanger matches touching the pinch temperatures fromone point signify that these matches start or end heat inte-gration between streams at the corresponding pinch tem-peratures, i.e. energy integration takes place at the pinchtemperatures.
It is obvious then that the newgraphical representation can helpexamine the principles of Pinch Analysis presented in the previoussection. For example, if exchangers exist in the ‘Left Upper Region’,these exchangers will violate the principles of energy integrationbecause they would transfer heat across the pinch. It can alsodetermine whether the external hot and cold utilities are improp-erly placed within the existing networks.
for Pinch Analysis applications: Heat exchanger network retrofit and4.12.011
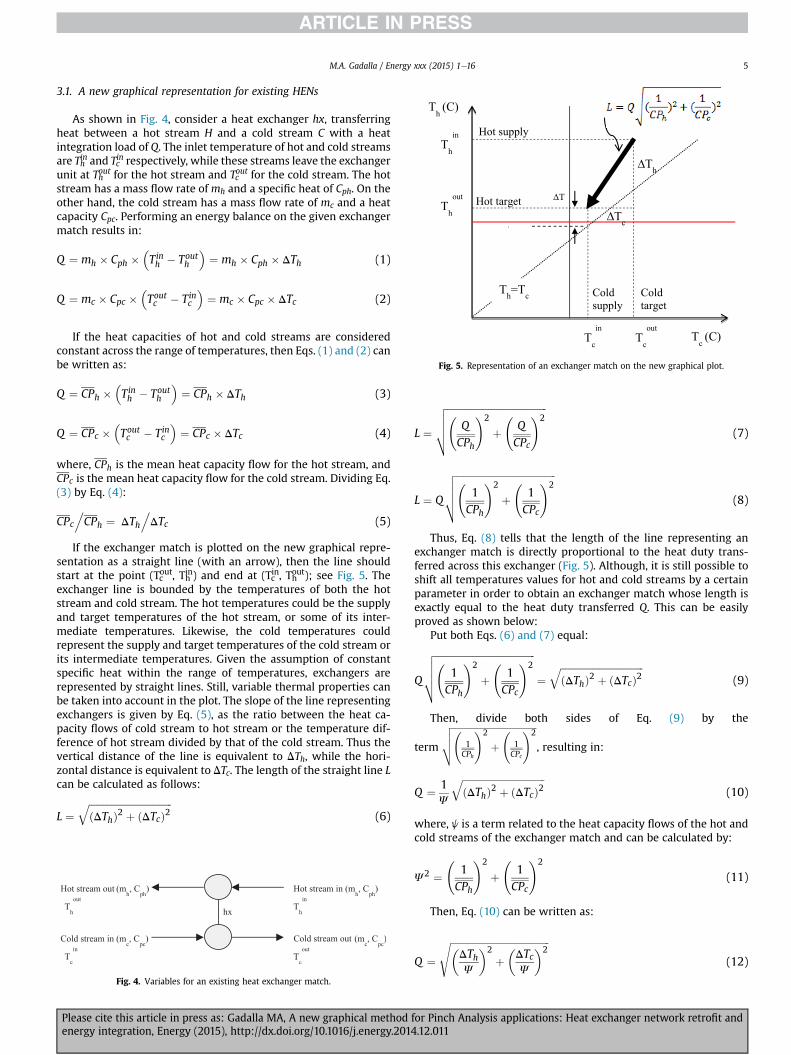
Fig. 5. Representation of an exchanger match on the new graphical plot.
M.A. Gadalla / Energy xxx (2015) 1e16 5
3.1. A new graphical representation for existing HENs
As shown in Fig. 4, consider a heat exchanger hx, transferringheat between a hot stream H and a cold stream C with a heatintegration load of Q. The inlet temperature of hot and cold streamsare Thin and Tc
in respectively, while these streams leave the exchangerunit at Thout for the hot stream and Tc
out for the cold stream. The hotstream has a mass flow rate of mh and a specific heat of Cph. On theother hand, the cold stream has a mass flow rate of mc and a heatcapacity Cpc. Performing an energy balance on the given exchangermatch results in:
Q ¼ mh � Cph ��Tinh � Touth
�¼ mh � Cph � DTh (1)
Q ¼ mc � Cpc ��Toutc � Tinc
�¼ mc � Cpc � DTc (2)
If the heat capacities of hot and cold streams are consideredconstant across the range of temperatures, then Eqs. (1) and (2) canbe written as:
Q ¼ CPh ��Tinh � Touth
�¼ CPh � DTh (3)
Q ¼ CPc � Toutc � Tinc� �
¼ CPc � DTc (4)
where, CPh is the mean heat capacity flow for the hot stream, andCPc is the mean heat capacity flow for the cold stream. Dividing Eq.(3) by Eq. (4):
CPc.CPh ¼ DTh
.DTc (5)
If the exchanger match is plotted on the new graphical repre-sentation as a straight line (with an arrow), then the line shouldstart at the point (Tcout, Thin) and end at (Tcin, Thout); see Fig. 5. Theexchanger line is bounded by the temperatures of both the hotstream and cold stream. The hot temperatures could be the supplyand target temperatures of the hot stream, or some of its inter-mediate temperatures. Likewise, the cold temperatures couldrepresent the supply and target temperatures of the cold stream orits intermediate temperatures. Given the assumption of constantspecific heat within the range of temperatures, exchangers arerepresented by straight lines. Still, variable thermal properties canbe taken into account in the plot. The slope of the line representingexchangers is given by Eq. (5), as the ratio between the heat ca-pacity flows of cold stream to hot stream or the temperature dif-ference of hot stream divided by that of the cold stream. Thus thevertical distance of the line is equivalent to DTh, while the hori-zontal distance is equivalent to DTc. The length of the straight line Lcan be calculated as follows:
L ¼ffiffiffiffiffiffiffiffiffiffiffiffiffiffiffiffiffiffiffiffiffiffiffiffiffiffiffiffiffiffiffiffiffiffiðDThÞ2 þ ðDTcÞ2
q(6)
Fig. 4. Variables for an existing heat exchanger match.
Please cite this article in press as: Gadalla MA, A new graphical methodenergy integration, Energy (2015), http://dx.doi.org/10.1016/j.energy.2014
L ¼
ffiffiffiffiffiffiffiffiffiffiffiffiffiffiffiffiffiffiffiffiffiffiffiffiffiffiffiffiffiffiffiffiffiffiffiffiffiffiffiffiffi Q
CPh
!2
þ
Q
CPc
!2vuuut (7)
L ¼ Q
ffiffiffiffiffiffiffiffiffiffiffiffiffiffiffiffiffiffiffiffiffiffiffiffiffiffiffiffiffiffiffiffiffiffiffiffiffiffiffiffiffi 1
CPh
!2
þ
1CPc
!2vuuut (8)
Thus, Eq. (8) tells that the length of the line representing anexchanger match is directly proportional to the heat duty trans-ferred across this exchanger (Fig. 5). Although, it is still possible toshift all temperatures values for hot and cold streams by a certainparameter in order to obtain an exchanger match whose length isexactly equal to the heat duty transferred Q. This can be easilyproved as shown below:
Put both Eqs. (6) and (7) equal:
Q
ffiffiffiffiffiffiffiffiffiffiffiffiffiffiffiffiffiffiffiffiffiffiffiffiffiffiffiffiffiffiffiffiffiffiffiffiffiffiffiffiffi 1
CPh
!2
þ
1CPc
!2vuuut ¼
ffiffiffiffiffiffiffiffiffiffiffiffiffiffiffiffiffiffiffiffiffiffiffiffiffiffiffiffiffiffiffiffiffiffiðDThÞ2 þ ðDTcÞ2
q(9)
Then, divide both sides of Eq. (9) by the
term
ffiffiffiffiffiffiffiffiffiffiffiffiffiffiffiffiffiffiffiffiffiffiffiffiffiffiffiffiffiffiffiffiffiffiffiffiffi 1CPh
!2
þ
1CPc
!2vuut , resulting in:
Q ¼ 1J
ffiffiffiffiffiffiffiffiffiffiffiffiffiffiffiffiffiffiffiffiffiffiffiffiffiffiffiffiffiffiffiffiffiffiðDThÞ2 þ ðDTcÞ2
q(10)
where, j is a term related to the heat capacity flows of the hot andcold streams of the exchanger match and can be calculated by:
J2 ¼
1CPh
!2
þ
1CPc
!2
(11)
Then, Eq. (10) can be written as:
Q ¼ffiffiffiffiffiffiffiffiffiffiffiffiffiffiffiffiffiffiffiffiffiffiffiffiffiffiffiffiffiffiffiffiffiffiffiffiffiffiffiffiffi�DThJ
�2
þ�DTcJ
�2s
(12)
for Pinch Analysis applications: Heat exchanger network retrofit and.12.011
M.A. Gadalla / Energy xxx (2015) 1e166
Eq. (12) is simplified through Eqs. (13)e(15) to be related to newtemperature values divided by the term j calculated by Eq. (11);these new temperature values are called shifted temperatures.
Q ¼
ffiffiffiffiffiffiffiffiffiffiffiffiffiffiffiffiffiffiffiffiffiffiffiffiffiffiffiffiffiffiffiffiffiffiffiffiffiffiffiffiffiffiffiffiffiffiffiffiffiffiffiffiffiffiffiffiffiffiffiffiffiffiffiffiffiffiffi Tinh � Touth
J
!2
þ Toutc � Tinc
J
!2vuut (13)
Q ¼
ffiffiffiffiffiffiffiffiffiffiffiffiffiffiffiffiffiffiffiffiffiffiffiffiffiffiffiffiffiffiffiffiffiffiffiffiffiffiffiffiffiffiffiffiffiffiffiffiffiffiffiffiffiffiffiffiffiffiffiffiffiffiffiffiffiffiffi TinhJ
� TouthJ
!2
þ ToutcJ
� TincJ
!2vuut (14)
Q ¼ffiffiffiffiffiffiffiffiffiffiffiffiffiffiffiffiffiffiffiffiffiffiffiffiffiffiffiffiffiffiffiffiffiffiffiffiffiffiffiffiffiffiffiffiffiffiffiffiffiffiffiffiffiffiffiffiffiffiffiffiffiffiffiffiffiffiffiffiffiffiffi�Tin*h � Tout*h
�2 þ �Tout*c � Tin*c
�2r(15)
where, Tin*h is the shifted temperature of inlet hot stream to the
exchanger unit and can be calculated by diving the real tempera-ture by the term j, as:
Tin*h ¼ TinhJ
(16)
Similarly, all other shifted temperatures can be calculated fromsimilar relationships with real temperatures.
Q ¼ffiffiffiffiffiffiffiffiffiffiffiffiffiffiffiffiffiffiffiffiffiffiffiffiffiffiffiffiffiffiffiffiffiffiffiffiffiffiffi�DT*h
�2 þ �DT*c�2r
(17)
Eq. (17) indicates that when the exchanger match is representedsuch that the temperatures of inlet and outlet streams within theexchanger are divided by the term j, then the length of theexchanger match in the graph will exactly equal Q. This is mathe-matically correct since the length of the line is the square root of thesummation of both the squares of temperature differences on theshifted-scale (Eq. (17)). The new graph will be obtained simply bydividing each temperature for hot/cold stream by the term j for thespecific exchanger match (Eq. (11)). Then, the new values areplotted on the new graph of shifted temperatures. Note that eachvertical difference for an exchanger line refers to shifted hot tem-perature difference ðDT�hÞ. Similarly, the horizontal difference for anexchanger indicates the shifted temperature difference for the coldstream ðDT�cÞ. Therefore, the graphical representation shown inFig. 5 can be redrawn by shifting all temperatures of hot and coldstreams for each exchanger match by the term j for the particularexchanger streams calculated by Eq. (11). Hence, the heat dutiesacross each exchanger match can be read directly from the shiftedgraph as their numerical values of the each line length according toEq. (12). This graphical nature is of importance as one can comparebetween any exchangermatches or modifications then according totheir exact lengths, i.e. heat duties.
A significant feature observed in Fig. 5 is that the vertical dis-tance between the straight line and the diagonal gives the tem-perature driving force profile across each exchanger (DT). The closetthe exchanger line to the diagonal, the smallest the temperaturedriving force the exchanger has. Then if the line is parallel to thediagonal, this implies a constant temperature driving force alongthe exchanger match. An exchanger match becomes a limiting forheat recovery as the line approaches the diagonal, and hence adecreased temperature driving force. This feature would help inidentifying limiting exchanger matches for heat recovery bylocating those matches with the smallest vertical distances to thediagonal, and hence temperature driving forces.
The maximum heat recovery for an existing network is identi-fied when exchanger matches tend to touch the diagonal in thegraphical representation, where Th ¼ Tc. Thus, these matches are
Please cite this article in press as: Gadalla MA, A new graphical methodenergy integration, Energy (2015), http://dx.doi.org/10.1016/j.energy.201
pinching matches whenever heat recovery is maximised and aNetwork Pinch takes place. Consequently, the new graphical rep-resentation is useful in identifying the pinching matches for anexisting network and locating the Network Pinch. Therefore, toincrease heat recovery beyond the maximum for the given condi-tion, modifications must be made to overcome the Network Pinch.When the diagonal is taken as Th ¼ Tc as the reference for NetworkPinch, the temperature approach limit assumed is zero. Then again,any positive temperature limit may be used (DTmin). In this lattercase, Th ¼ Tc þ DTmin.
Now to describe an existing HEN with full details, all exchangerunits are plotted through lines on the graphical representation, asdescribed in Fig. 5. Exchangers are represented knowing eitherterminal temperatures, i.e. hot end and cold end (Tc, Th) or oneterminal temperature and a slope (ratio of heat capacity flows).The values of other variables can then be determined. Exchangerunits between the same cold and hot streams will have the sameslope. This facilitates the execution of the HEN graph because theexchanger lines can be drawn as parallel. For successive ex-changers, their representation is done such that one exchangerfollows the other, starting at the intermediate temperature. Acomplete HEN representation is obtained by plotting all thevarious exchanger units within the network. In the new HENgraphical representation, a conventional loop of two exchangersappears as two lines, each for each exchanger; the two linesplotted between the same hot stream temperatures, on the y-axis,connecting the same cold stream on the x-axis. On another hand, autility-path appears as three lines of exchangers (or more), con-necting a process stream (or streams), and cold utility and hotutility. The hot utility line will be located on the top right region ofFig. 5, whilst the cold utility line will lie within the bottom leftregion. Heat is shifted within the loop graphically by fixing theexchanger lines' slopes and extending these lines for more tem-perature difference in the case of added heat and for less tem-perature difference in the case of removed heat. The extendedexchanger lines will then determine the new intermediate tem-peratures. Note that while shifting heat within loops, theboundary temperatures for both hot and cold streams remain un-changed. A similar graphical procedure is followed when utility-paths are exploited to reduce utilities consumption. In this case,the amount of utility heat to be saved is shifted from the utilities'exchangers and added to the exchanger. When heat is added orremoved, slopes of exchangers' lines are fixed, and only thetemperatures are changing. The following illustrative exampleexplains the application of the new graphical method on anexisting HEN. It highlights the procedure of the new technique,and points out to some significant observations, findings and theadvantages of the approach. Cases of paths and loops will also bereferred to.
3.2. An illustrative example e an existing HEN
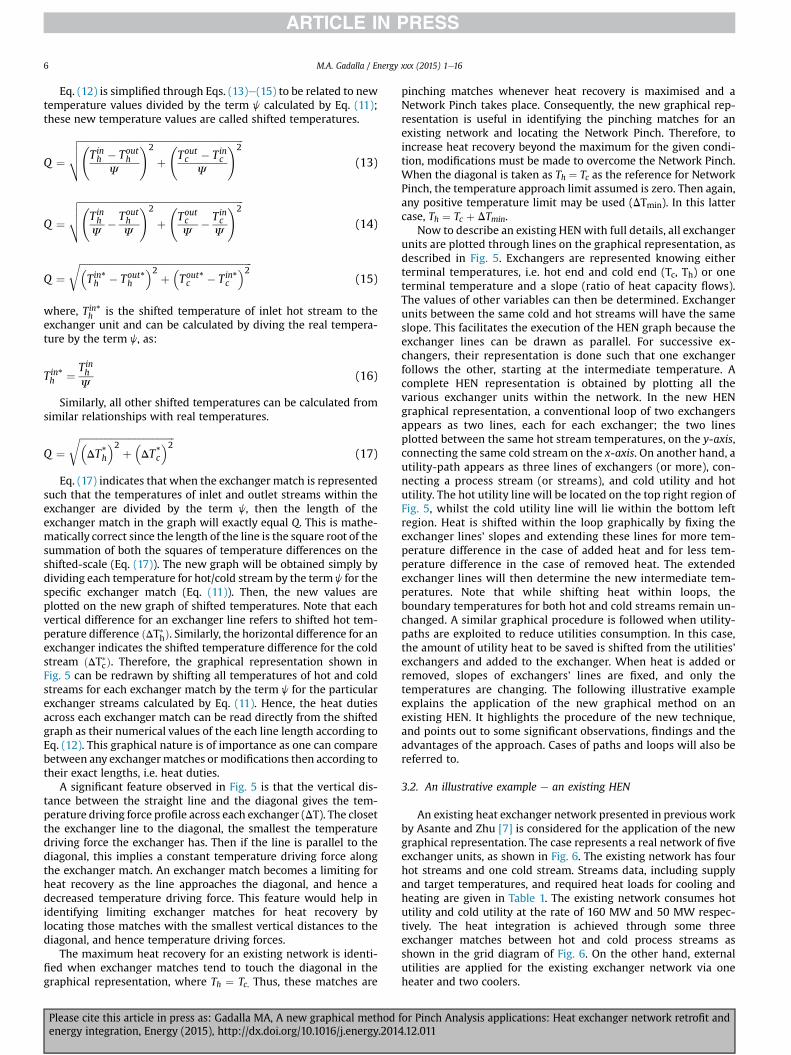
An existing heat exchanger network presented in previous workby Asante and Zhu [7] is considered for the application of the newgraphical representation. The case represents a real network of fiveexchanger units, as shown in Fig. 6. The existing network has fourhot streams and one cold stream. Streams data, including supplyand target temperatures, and required heat loads for cooling andheating are given in Table 1. The existing network consumes hotutility and cold utility at the rate of 160 MW and 50 MW respec-tively. The heat integration is achieved through some threeexchanger matches between hot and cold process streams asshown in the grid diagram of Fig. 6. On the other hand, externalutilities are applied for the existing exchanger network via oneheater and two coolers.
for Pinch Analysis applications: Heat exchanger network retrofit and4.12.011
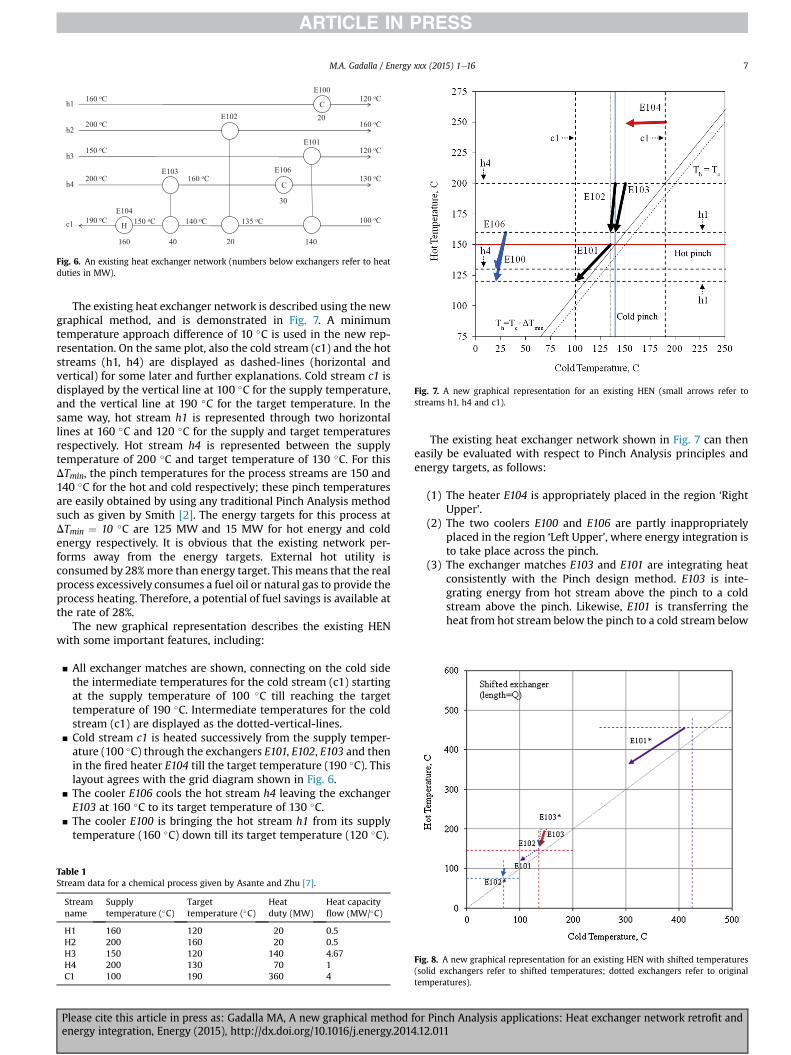
Fig. 7. A new graphical representation for an existing HEN (small arrows refer tostreams h1, h4 and c1).
Fig. 6. An existing heat exchanger network (numbers below exchangers refer to heatduties in MW).
M.A. Gadalla / Energy xxx (2015) 1e16 7
The existing heat exchanger network is described using the newgraphical method, and is demonstrated in Fig. 7. A minimumtemperature approach difference of 10 �C is used in the new rep-resentation. On the same plot, also the cold stream (c1) and the hotstreams (h1, h4) are displayed as dashed-lines (horizontal andvertical) for some later and further explanations. Cold stream c1 isdisplayed by the vertical line at 100 �C for the supply temperature,and the vertical line at 190 �C for the target temperature. In thesame way, hot stream h1 is represented through two horizontallines at 160 �C and 120 �C for the supply and target temperaturesrespectively. Hot stream h4 is represented between the supplytemperature of 200 �C and target temperature of 130 �C. For thisDTmin, the pinch temperatures for the process streams are 150 and140 �C for the hot and cold respectively; these pinch temperaturesare easily obtained by using any traditional Pinch Analysis methodsuch as given by Smith [2]. The energy targets for this process atDTmin ¼ 10 �C are 125 MW and 15 MW for hot energy and coldenergy respectively. It is obvious that the existing network per-forms away from the energy targets. External hot utility isconsumed by 28%more than energy target. This means that the realprocess excessively consumes a fuel oil or natural gas to provide theprocess heating. Therefore, a potential of fuel savings is available atthe rate of 28%.
The new graphical representation describes the existing HENwith some important features, including:
▪ All exchanger matches are shown, connecting on the cold sidethe intermediate temperatures for the cold stream (c1) startingat the supply temperature of 100 �C till reaching the targettemperature of 190 �C. Intermediate temperatures for the coldstream (c1) are displayed as the dotted-vertical-lines.
▪ Cold stream c1 is heated successively from the supply temper-ature (100 �C) through the exchangers E101, E102, E103 and thenin the fired heater E104 till the target temperature (190 �C). Thislayout agrees with the grid diagram shown in Fig. 6.
▪ The cooler E106 cools the hot stream h4 leaving the exchangerE103 at 160 �C to its target temperature of 130 �C.
▪ The cooler E100 is bringing the hot stream h1 from its supplytemperature (160 �C) down till its target temperature (120 �C).
Table 1Stream data for a chemical process given by Asante and Zhu [7].
Streamname
Supplytemperature (�C)
Targettemperature (�C)
Heatduty (MW)
Heat capacityflow (MW/�C)
H1 160 120 20 0.5H2 200 160 20 0.5H3 150 120 140 4.67H4 200 130 70 1C1 100 190 360 4
Please cite this article in press as: Gadalla MA, A new graphical methodenergy integration, Energy (2015), http://dx.doi.org/10.1016/j.energy.2014
The existing heat exchanger network shown in Fig. 7 can theneasily be evaluated with respect to Pinch Analysis principles andenergy targets, as follows:
(1) The heater E104 is appropriately placed in the region ‘RightUpper’.
(2) The two coolers E100 and E106 are partly inappropriatelyplaced in the region ‘Left Upper’, where energy integration isto take place across the pinch.
(3) The exchanger matches E103 and E101 are integrating heatconsistently with the Pinch design method. E103 is inte-grating energy from hot stream above the pinch to a coldstream above the pinch. Likewise, E101 is transferring theheat from hot stream below the pinch to a cold stream below
Fig. 8. A new graphical representation for an existing HEN with shifted temperatures(solid exchangers refer to shifted temperatures; dotted exchangers refer to originaltemperatures).
for Pinch Analysis applications: Heat exchanger network retrofit and.12.011
M.A. Gadalla / Energy xxx (2015) 1e168
the pinch. This means a Network Pinch may probably takeplace at this exchanger match when energy integration is tobe performed.
(4) The exchanger E101 is close to the diagonal, hence it is apotential limiting exchanger in energy saving projects.
(5) The exchanger E102 is integrating heat across the pinch, i.e.exchanging heat from above the pinch into below the pinch.
(6) For the current performance, there appears no pinchingmatches as none of the exchanger matches (represented bylines) touch the diagonal (DTmin ¼ 0 �C) or the line corre-sponding to DTmin ¼ 10 �C. On the contrary, there is still apositive vertical distance between the exchanger lines andthe diagonal. This implies positive temperature drivingforces and hence more potential for energy integration.
If the temperatures of the existing HEN shown in Fig. 7 areshifted using Eqs. (11) and (17), then the exchanger lines willrepresent the heat duties transferred across these exchangers(Fig. 8). The figure shows three exchangers of the HEN with shiftedtemperatures, compared with the exchanges with original tem-peratures as they are in Fig. 7. Exchangers with shifted tempera-tures are termed E101*, E102* and E103*, and are shown by solidlines. Now, the lengths of the new exchanger lines are indicators tothe heat duties of each exchanger. The longer the line is, the moreheat the exchanger transfers.
As shown above, the new graphical methods helps examine thePinch Analysis principles in an existing HEN. Furthermore, theimproper placement of E100 and E106, and together with the heatintegration across the pinch done through E102 explain why theexisting network performs poorly with respect to energy targets(28% excess in fuel or utility consumption). This suggests that theseexchanger matches need to be of concern for any energy savings'projects.
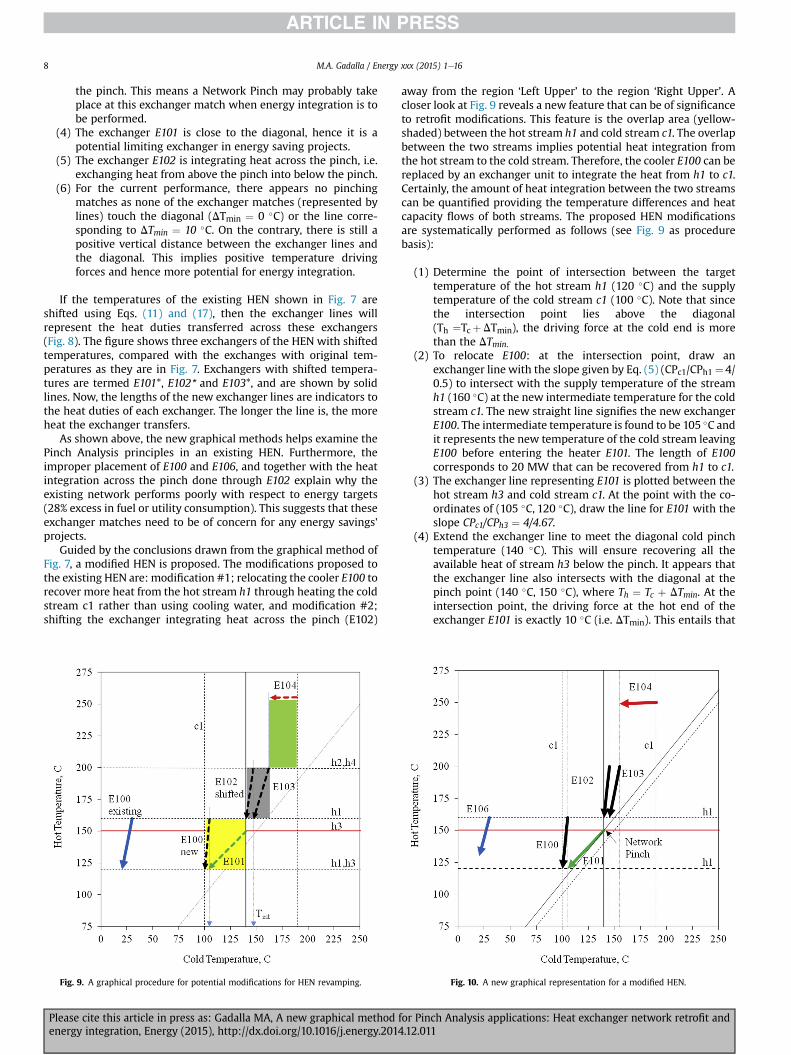
Guided by the conclusions drawn from the graphical method ofFig. 7, a modified HEN is proposed. The modifications proposed tothe existing HEN are: modification #1; relocating the cooler E100 torecover more heat from the hot stream h1 through heating the coldstream c1 rather than using cooling water, and modification #2;shifting the exchanger integrating heat across the pinch (E102)
Fig. 9. A graphical procedure for potential modifications for HEN revamping.
Please cite this article in press as: Gadalla MA, A new graphical methodenergy integration, Energy (2015), http://dx.doi.org/10.1016/j.energy.201
away from the region ‘Left Upper’ to the region ‘Right Upper’. Acloser look at Fig. 9 reveals a new feature that can be of significanceto retrofit modifications. This feature is the overlap area (yellow-shaded) between the hot stream h1 and cold stream c1. The overlapbetween the two streams implies potential heat integration fromthe hot stream to the cold stream. Therefore, the cooler E100 can bereplaced by an exchanger unit to integrate the heat from h1 to c1.Certainly, the amount of heat integration between the two streamscan be quantified providing the temperature differences and heatcapacity flows of both streams. The proposed HEN modificationsare systematically performed as follows (see Fig. 9 as procedurebasis):
(1) Determine the point of intersection between the targettemperature of the hot stream h1 (120 �C) and the supplytemperature of the cold stream c1 (100 �C). Note that sincethe intersection point lies above the diagonal(Th ¼TcþDTmin), the driving force at the cold end is morethan the DTmin.
(2) To relocate E100: at the intersection point, draw anexchanger line with the slope given by Eq. (5) (CPc1/CPh1 ¼4/0.5) to intersect with the supply temperature of the streamh1 (160 �C) at the new intermediate temperature for the coldstream c1. The new straight line signifies the new exchangerE100. The intermediate temperature is found to be 105 �C andit represents the new temperature of the cold stream leavingE100 before entering the heater E101. The length of E100corresponds to 20 MW that can be recovered from h1 to c1.
(3) The exchanger line representing E101 is plotted between thehot stream h3 and cold stream c1. At the point with the co-ordinates of (105 �C, 120 �C), draw the line for E101 with theslope CPc1/CPh3 ¼ 4/4.67.
(4) Extend the exchanger line to meet the diagonal cold pinchtemperature (140 �C). This will ensure recovering all theavailable heat of stream h3 below the pinch. It appears thatthe exchanger line also intersects with the diagonal at thepinch point (140 �C, 150 �C), where Th ¼ Tc þ DTmin. At theintersection point, the driving force at the hot end of theexchanger E101 is exactly 10 �C (i.e. DTmin). This entails that
Fig. 10. A new graphical representation for a modified HEN.
for Pinch Analysis applications: Heat exchanger network retrofit and4.12.011
M.A. Gadalla / Energy xxx (2015) 1e16 9
this exchanger unit is pinched and thus causing a NetworkPinch.
(5) To shift E102: draw a line starting at the point (140 �C,160 �C)with the slope of CPc1/CPh2¼ 4/0.5, and extend the linewithinthe region of heat integration above the pinch. The line willintersect with the supply temperature of h2 at 200 �C. Thelength of this exchanger line will correspond to the heat loadof the stream h2 (20 MW). As shown in Fig. 9, the newlocation of the exchanger E102 now becomes completelywithin the area of heat integration above the pinch. There-fore, this exchanger after modification does not violate thePinch Analysis principles as it did in the existing HEN.
(6) The intersection of E102 with the horizontal line of 200 �Cresults in the new temperature of c1 to enter the exchangerE103 (Tint). Then, at the point (Tint, 160 �C) the exchanger linerepresenting E103 can be plotted with the slope CPc1/CPh4 ¼ 4/1 between the horizontal temperatures 160 �C and200 �C which are the intermediate and supply temperaturesof h4, respectively. A new intermediate temperature for thestream c1 is obtained which corresponds to the temperatureleaving E103, i.e. entering heater E104.
(7) The heat load on the heater E104 to heat the cold stream c1till its target temperature (190 �C) can then be graphicallydetermined.
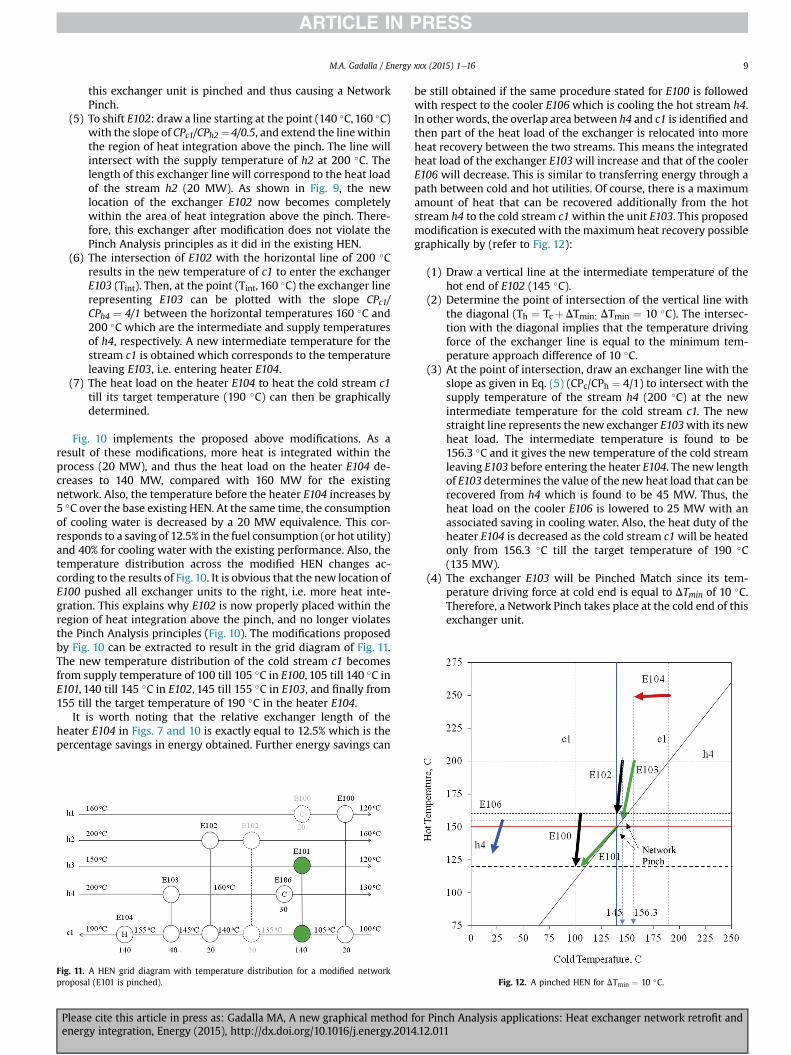
Fig. 10 implements the proposed above modifications. As aresult of these modifications, more heat is integrated within theprocess (20 MW), and thus the heat load on the heater E104 de-creases to 140 MW, compared with 160 MW for the existingnetwork. Also, the temperature before the heater E104 increases by5 �C over the base existing HEN. At the same time, the consumptionof cooling water is decreased by a 20 MW equivalence. This cor-responds to a saving of 12.5% in the fuel consumption (or hot utility)and 40% for cooling water with the existing performance. Also, thetemperature distribution across the modified HEN changes ac-cording to the results of Fig. 10. It is obvious that the new location ofE100 pushed all exchanger units to the right, i.e. more heat inte-gration. This explains why E102 is now properly placed within theregion of heat integration above the pinch, and no longer violatesthe Pinch Analysis principles (Fig. 10). The modifications proposedby Fig. 10 can be extracted to result in the grid diagram of Fig. 11.The new temperature distribution of the cold stream c1 becomesfrom supply temperature of 100 till 105 �C in E100, 105 till 140 �C inE101, 140 till 145 �C in E102, 145 till 155 �C in E103, and finally from155 till the target temperature of 190 �C in the heater E104.
It is worth noting that the relative exchanger length of theheater E104 in Figs. 7 and 10 is exactly equal to 12.5% which is thepercentage savings in energy obtained. Further energy savings can
Fig. 11. A HEN grid diagram with temperature distribution for a modified networkproposal (E101 is pinched).
Please cite this article in press as: Gadalla MA, A new graphical methodenergy integration, Energy (2015), http://dx.doi.org/10.1016/j.energy.2014
be still obtained if the same procedure stated for E100 is followedwith respect to the cooler E106 which is cooling the hot stream h4.In other words, the overlap area between h4 and c1 is identified andthen part of the heat load of the exchanger is relocated into moreheat recovery between the two streams. This means the integratedheat load of the exchanger E103will increase and that of the coolerE106 will decrease. This is similar to transferring energy through apath between cold and hot utilities. Of course, there is a maximumamount of heat that can be recovered additionally from the hotstream h4 to the cold stream c1within the unit E103. This proposedmodification is executed with the maximum heat recovery possiblegraphically by (refer to Fig. 12):
(1) Draw a vertical line at the intermediate temperature of thehot end of E102 (145 �C).
(2) Determine the point of intersection of the vertical line withthe diagonal (Th ¼ TcþDTmin; DTmin ¼ 10 �C). The intersec-tion with the diagonal implies that the temperature drivingforce of the exchanger line is equal to the minimum tem-perature approach difference of 10 �C.
(3) At the point of intersection, draw an exchanger line with theslope as given in Eq. (5) (CPc/CPh ¼ 4/1) to intersect with thesupply temperature of the stream h4 (200 �C) at the newintermediate temperature for the cold stream c1. The newstraight line represents the new exchanger E103with its newheat load. The intermediate temperature is found to be156.3 �C and it gives the new temperature of the cold streamleaving E103 before entering the heater E104. The new lengthof E103 determines the value of the new heat load that can berecovered from h4 which is found to be 45 MW. Thus, theheat load on the cooler E106 is lowered to 25 MW with anassociated saving in cooling water. Also, the heat duty of theheater E104 is decreased as the cold stream c1will be heatedonly from 156.3 �C till the target temperature of 190 �C(135 MW).
(4) The exchanger E103 will be Pinched Match since its tem-perature driving force at cold end is equal to DTmin of 10 �C.Therefore, a Network Pinch takes place at the cold end of thisexchanger unit.
Fig. 12. A pinched HEN for DTmin ¼ 10 �C.
for Pinch Analysis applications: Heat exchanger network retrofit and.12.011
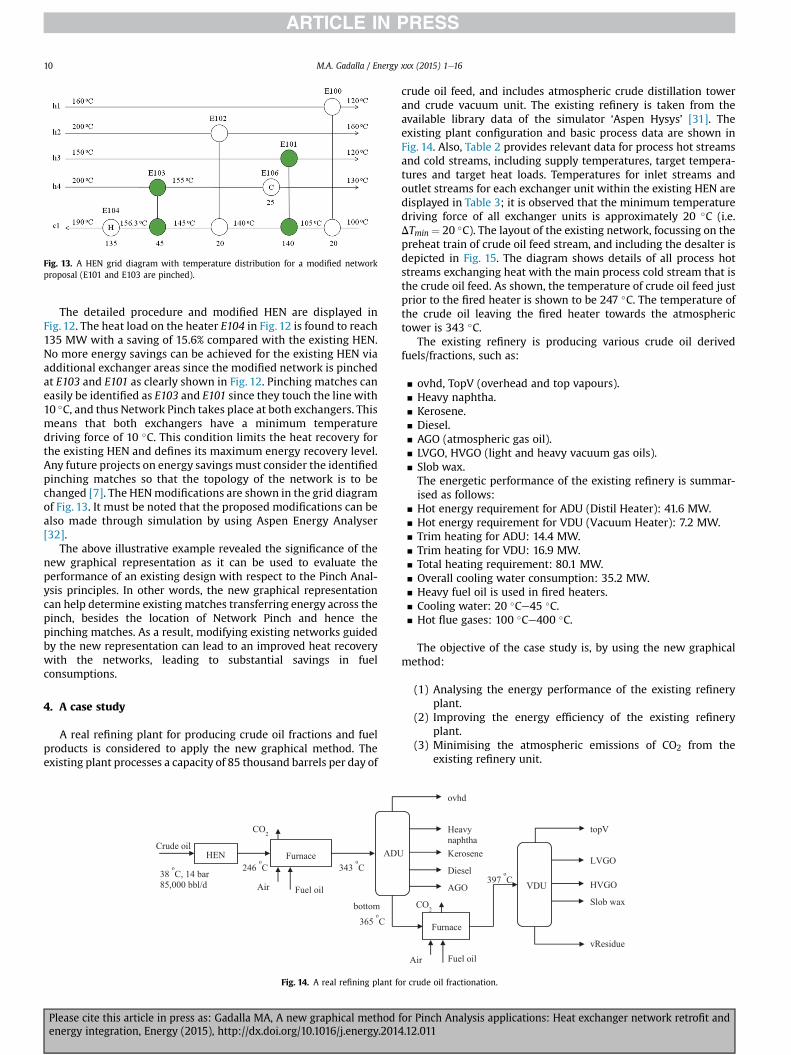
Fig. 13. A HEN grid diagram with temperature distribution for a modified networkproposal (E101 and E103 are pinched).
M.A. Gadalla / Energy xxx (2015) 1e1610
The detailed procedure and modified HEN are displayed inFig. 12. The heat load on the heater E104 in Fig. 12 is found to reach135 MW with a saving of 15.6% compared with the existing HEN.No more energy savings can be achieved for the existing HEN viaadditional exchanger areas since the modified network is pinchedat E103 and E101 as clearly shown in Fig. 12. Pinching matches caneasily be identified as E103 and E101 since they touch the line with10 �C, and thus Network Pinch takes place at both exchangers. Thismeans that both exchangers have a minimum temperaturedriving force of 10 �C. This condition limits the heat recovery forthe existing HEN and defines its maximum energy recovery level.Any future projects on energy savings must consider the identifiedpinching matches so that the topology of the network is to bechanged [7]. The HENmodifications are shown in the grid diagramof Fig. 13. It must be noted that the proposed modifications can bealso made through simulation by using Aspen Energy Analyser[32].
The above illustrative example revealed the significance of thenew graphical representation as it can be used to evaluate theperformance of an existing design with respect to the Pinch Anal-ysis principles. In other words, the new graphical representationcan help determine existing matches transferring energy across thepinch, besides the location of Network Pinch and hence thepinching matches. As a result, modifying existing networks guidedby the new representation can lead to an improved heat recoverywith the networks, leading to substantial savings in fuelconsumptions.
4. A case study
A real refining plant for producing crude oil fractions and fuelproducts is considered to apply the new graphical method. Theexisting plant processes a capacity of 85 thousand barrels per day of
Fig. 14. A real refining plant f
Please cite this article in press as: Gadalla MA, A new graphical methodenergy integration, Energy (2015), http://dx.doi.org/10.1016/j.energy.201
crude oil feed, and includes atmospheric crude distillation towerand crude vacuum unit. The existing refinery is taken from theavailable library data of the simulator ‘Aspen Hysys’ [31]. Theexisting plant configuration and basic process data are shown inFig. 14. Also, Table 2 provides relevant data for process hot streamsand cold streams, including supply temperatures, target tempera-tures and target heat loads. Temperatures for inlet streams andoutlet streams for each exchanger unit within the existing HEN aredisplayed in Table 3; it is observed that the minimum temperaturedriving force of all exchanger units is approximately 20 �C (i.e.DTmin ¼ 20 �C). The layout of the existing network, focussing on thepreheat train of crude oil feed stream, and including the desalter isdepicted in Fig. 15. The diagram shows details of all process hotstreams exchanging heat with the main process cold stream that isthe crude oil feed. As shown, the temperature of crude oil feed justprior to the fired heater is shown to be 247 �C. The temperature ofthe crude oil leaving the fired heater towards the atmospherictower is 343 �C.
The existing refinery is producing various crude oil derivedfuels/fractions, such as:
▪ ovhd, TopV (overhead and top vapours).▪ Heavy naphtha.▪ Kerosene.▪ Diesel.▪ AGO (atmospheric gas oil).▪ LVGO, HVGO (light and heavy vacuum gas oils).▪ Slob wax.The energetic performance of the existing refinery is summar-ised as follows:
▪ Hot energy requirement for ADU (Distil Heater): 41.6 MW.▪ Hot energy requirement for VDU (Vacuum Heater): 7.2 MW.▪ Trim heating for ADU: 14.4 MW.▪ Trim heating for VDU: 16.9 MW.▪ Total heating requirement: 80.1 MW.▪ Overall cooling water consumption: 35.2 MW.▪ Heavy fuel oil is used in fired heaters.▪ Cooling water: 20 �Ce45 �C.▪ Hot flue gases: 100 �Ce400 �C.
The objective of the case study is, by using the new graphicalmethod:
(1) Analysing the energy performance of the existing refineryplant.
(2) Improving the energy efficiency of the existing refineryplant.
(3) Minimising the atmospheric emissions of CO2 from theexisting refinery unit.
or crude oil fractionation.
for Pinch Analysis applications: Heat exchanger network retrofit and4.12.011
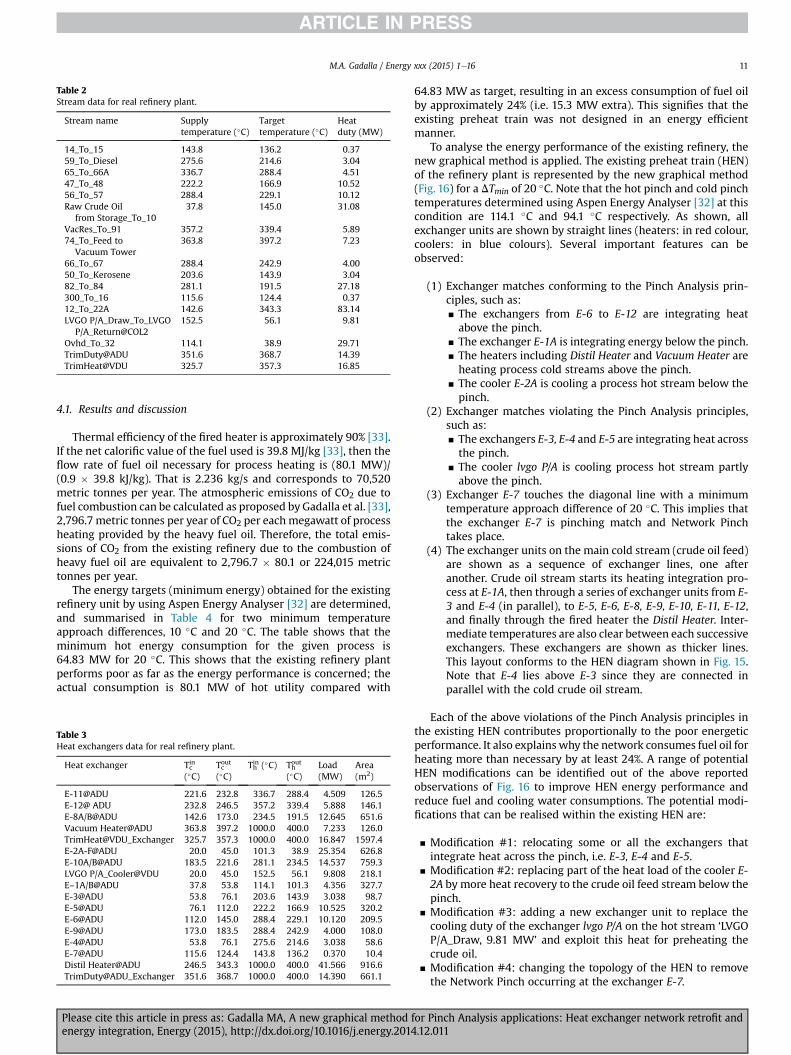
Table 2Stream data for real refinery plant.
Stream name Supplytemperature (�C)
Targettemperature (�C)
Heatduty (MW)
14_To_15 143.8 136.2 0.3759_To_Diesel 275.6 214.6 3.0465_To_66A 336.7 288.4 4.5147_To_48 222.2 166.9 10.5256_To_57 288.4 229.1 10.12Raw Crude Oil
from Storage_To_1037.8 145.0 31.08
VacRes_To_91 357.2 339.4 5.8974_To_Feed to
Vacuum Tower363.8 397.2 7.23
66_To_67 288.4 242.9 4.0050_To_Kerosene 203.6 143.9 3.0482_To_84 281.1 191.5 27.18300_To_16 115.6 124.4 0.3712_To_22A 142.6 343.3 83.14LVGO P/A_Draw_To_LVGO
P/[email protected] 56.1 9.81
Ovhd_To_32 114.1 38.9 29.71TrimDuty@ADU 351.6 368.7 14.39TrimHeat@VDU 325.7 357.3 16.85
M.A. Gadalla / Energy xxx (2015) 1e16 11
4.1. Results and discussion
Thermal efficiency of the fired heater is approximately 90% [33].If the net calorific value of the fuel used is 39.8 MJ/kg [33], then theflow rate of fuel oil necessary for process heating is (80.1 MW)/(0.9 � 39.8 kJ/kg). That is 2.236 kg/s and corresponds to 70,520metric tonnes per year. The atmospheric emissions of CO2 due tofuel combustion can be calculated as proposed by Gadalla et al. [33],2,796.7 metric tonnes per year of CO2 per eachmegawatt of processheating provided by the heavy fuel oil. Therefore, the total emis-sions of CO2 from the existing refinery due to the combustion ofheavy fuel oil are equivalent to 2,796.7 � 80.1 or 224,015 metrictonnes per year.
The energy targets (minimum energy) obtained for the existingrefinery unit by using Aspen Energy Analyser [32] are determined,and summarised in Table 4 for two minimum temperatureapproach differences, 10 �C and 20 �C. The table shows that theminimum hot energy consumption for the given process is64.83 MW for 20 �C. This shows that the existing refinery plantperforms poor as far as the energy performance is concerned; theactual consumption is 80.1 MW of hot utility compared with
Table 3Heat exchangers data for real refinery plant.
Heat exchanger Tcin
(�C)Tcout
(�C)Thin (�C) Thout
(�C)Load(MW)
Area(m2)
E-11@ADU 221.6 232.8 336.7 288.4 4.509 126.5E-12@ ADU 232.8 246.5 357.2 339.4 5.888 146.1E-8A/B@ADU 142.6 173.0 234.5 191.5 12.645 651.6Vacuum Heater@ADU 363.8 397.2 1000.0 400.0 7.233 126.0TrimHeat@VDU_Exchanger 325.7 357.3 1000.0 400.0 16.847 1597.4E-2A-F@ADU 20.0 45.0 101.3 38.9 25.354 626.8E-10A/B@ADU 183.5 221.6 281.1 234.5 14.537 759.3LVGO P/A_Cooler@VDU 20.0 45.0 152.5 56.1 9.808 218.1E–1A/B@ADU 37.8 53.8 114.1 101.3 4.356 327.7E-3@ADU 53.8 76.1 203.6 143.9 3.038 98.7E-5@ADU 76.1 112.0 222.2 166.9 10.525 320.2E-6@ADU 112.0 145.0 288.4 229.1 10.120 209.5E-9@ADU 173.0 183.5 288.4 242.9 4.000 108.0E-4@ADU 53.8 76.1 275.6 214.6 3.038 58.6E-7@ADU 115.6 124.4 143.8 136.2 0.370 10.4Distil Heater@ADU 246.5 343.3 1000.0 400.0 41.566 916.6TrimDuty@ADU_Exchanger 351.6 368.7 1000.0 400.0 14.390 661.1
Please cite this article in press as: Gadalla MA, A new graphical methodenergy integration, Energy (2015), http://dx.doi.org/10.1016/j.energy.2014
64.83 MW as target, resulting in an excess consumption of fuel oilby approximately 24% (i.e. 15.3 MW extra). This signifies that theexisting preheat train was not designed in an energy efficientmanner.
To analyse the energy performance of the existing refinery, thenew graphical method is applied. The existing preheat train (HEN)of the refinery plant is represented by the new graphical method(Fig. 16) for a DTmin of 20 �C. Note that the hot pinch and cold pinchtemperatures determined using Aspen Energy Analyser [32] at thiscondition are 114.1 �C and 94.1 �C respectively. As shown, allexchanger units are shown by straight lines (heaters: in red colour,coolers: in blue colours). Several important features can beobserved:
(1) Exchanger matches conforming to the Pinch Analysis prin-ciples, such as:
for Pin.12.01
▪ The exchangers from E-6 to E-12 are integrating heatabove the pinch.
▪ The exchanger E-1A is integrating energy below the pinch.▪ The heaters including Distil Heater and Vacuum Heater areheating process cold streams above the pinch.
▪ The cooler E-2A is cooling a process hot stream below thepinch.
(2) Exchanger matches violating the Pinch Analysis principles,such as:
▪ The exchangers E-3, E-4 and E-5 are integrating heat acrossthe pinch.▪ The cooler lvgo P/A is cooling process hot stream partlyabove the pinch.
(3) Exchanger E-7 touches the diagonal line with a minimumtemperature approach difference of 20 �C. This implies thatthe exchanger E-7 is pinching match and Network Pinchtakes place.
(4) The exchanger units on the main cold stream (crude oil feed)are shown as a sequence of exchanger lines, one afteranother. Crude oil stream starts its heating integration pro-cess at E-1A, then through a series of exchanger units from E-3 and E-4 (in parallel), to E-5, E-6, E-8, E-9, E-10, E-11, E-12,and finally through the fired heater the Distil Heater. Inter-mediate temperatures are also clear between each successiveexchangers. These exchangers are shown as thicker lines.This layout conforms to the HEN diagram shown in Fig. 15.Note that E-4 lies above E-3 since they are connected inparallel with the cold crude oil stream.
Each of the above violations of the Pinch Analysis principles inthe existing HEN contributes proportionally to the poor energeticperformance. It also explains why the network consumes fuel oil forheating more than necessary by at least 24%. A range of potentialHEN modifications can be identified out of the above reportedobservations of Fig. 16 to improve HEN energy performance andreduce fuel and cooling water consumptions. The potential modi-fications that can be realised within the existing HEN are:
▪ Modification #1: relocating some or all the exchangers thatintegrate heat across the pinch, i.e. E-3, E-4 and E-5.
▪ Modification #2: replacing part of the heat load of the cooler E-2A by more heat recovery to the crude oil feed stream below thepinch.
▪ Modification #3: adding a new exchanger unit to replace thecooling duty of the exchanger lvgo P/A on the hot stream ‘LVGOP/A_Draw, 9.81 MW’ and exploit this heat for preheating thecrude oil.
▪ Modification #4: changing the topology of the HEN to removethe Network Pinch occurring at the exchanger E-7.
ch Analysis applications: Heat exchanger network retrofit and1
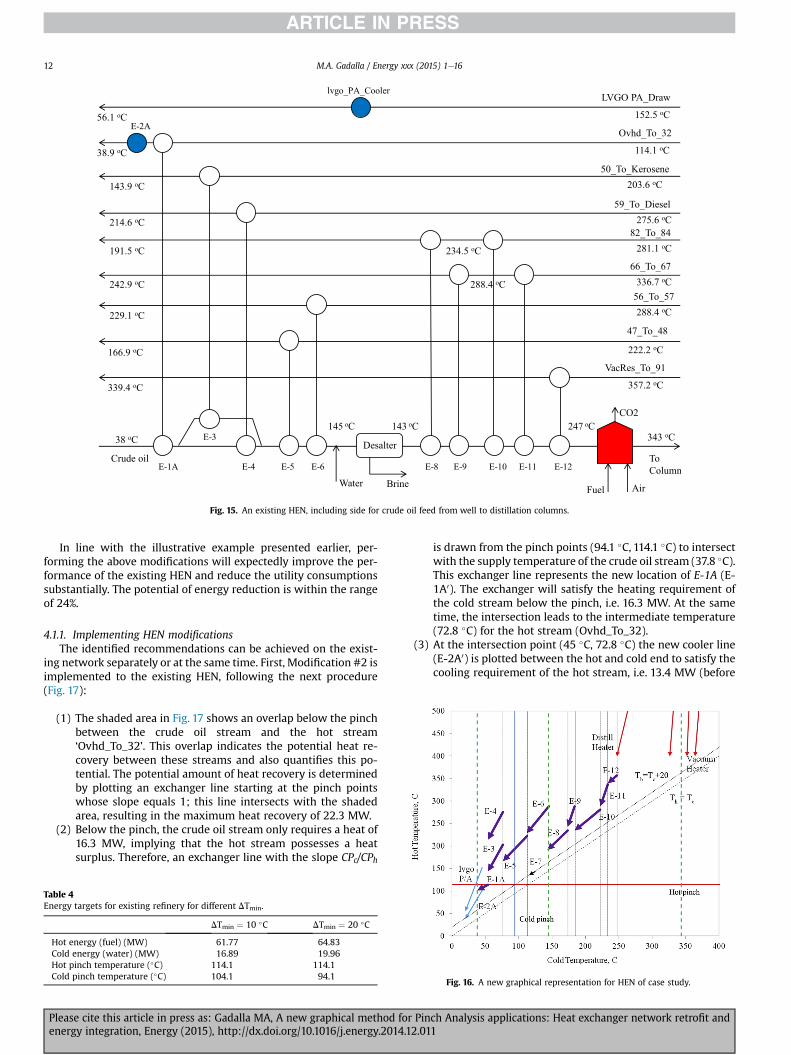
Fig. 15. An existing HEN, including side for crude oil feed from well to distillation columns.
M.A. Gadalla / Energy xxx (2015) 1e1612
In line with the illustrative example presented earlier, per-forming the above modifications will expectedly improve the per-formance of the existing HEN and reduce the utility consumptionssubstantially. The potential of energy reduction is within the rangeof 24%.
4.1.1. Implementing HEN modificationsThe identified recommendations can be achieved on the exist-
ing network separately or at the same time. First, Modification #2 isimplemented to the existing HEN, following the next procedure(Fig. 17):
(1) The shaded area in Fig. 17 shows an overlap below the pinchbetween the crude oil stream and the hot stream‘Ovhd_To_32’. This overlap indicates the potential heat re-covery between these streams and also quantifies this po-tential. The potential amount of heat recovery is determinedby plotting an exchanger line starting at the pinch pointswhose slope equals 1; this line intersects with the shadedarea, resulting in the maximum heat recovery of 22.3 MW.
(2) Below the pinch, the crude oil stream only requires a heat of16.3 MW, implying that the hot stream possesses a heatsurplus. Therefore, an exchanger line with the slope CPc/CPh
Table 4Energy targets for existing refinery for different DTmin.
DTmin ¼ 10 �C DTmin ¼ 20 �C
Hot energy (fuel) (MW) 61.77 64.83Cold energy (water) (MW) 16.89 19.96Hot pinch temperature (�C) 114.1 114.1Cold pinch temperature (�C) 104.1 94.1
Please cite this article in press as: Gadalla MA, A new graphical methodenergy integration, Energy (2015), http://dx.doi.org/10.1016/j.energy.201
is drawn from the pinch points (94.1 �C, 114.1 �C) to intersectwith the supply temperature of the crude oil stream (37.8 �C).This exchanger line represents the new location of E-1A (E-1A0). The exchanger will satisfy the heating requirement ofthe cold stream below the pinch, i.e. 16.3 MW. At the sametime, the intersection leads to the intermediate temperature(72.8 �C) for the hot stream (Ovhd_To_32).
(3) At the intersection point (45 �C, 72.8 �C) the new cooler line(E-2A0) is plotted between the hot and cold end to satisfy thecooling requirement of the hot stream, i.e. 13.4 MW (before
Fig. 16. A new graphical representation for HEN of case study.
for Pinch Analysis applications: Heat exchanger network retrofit and4.12.011
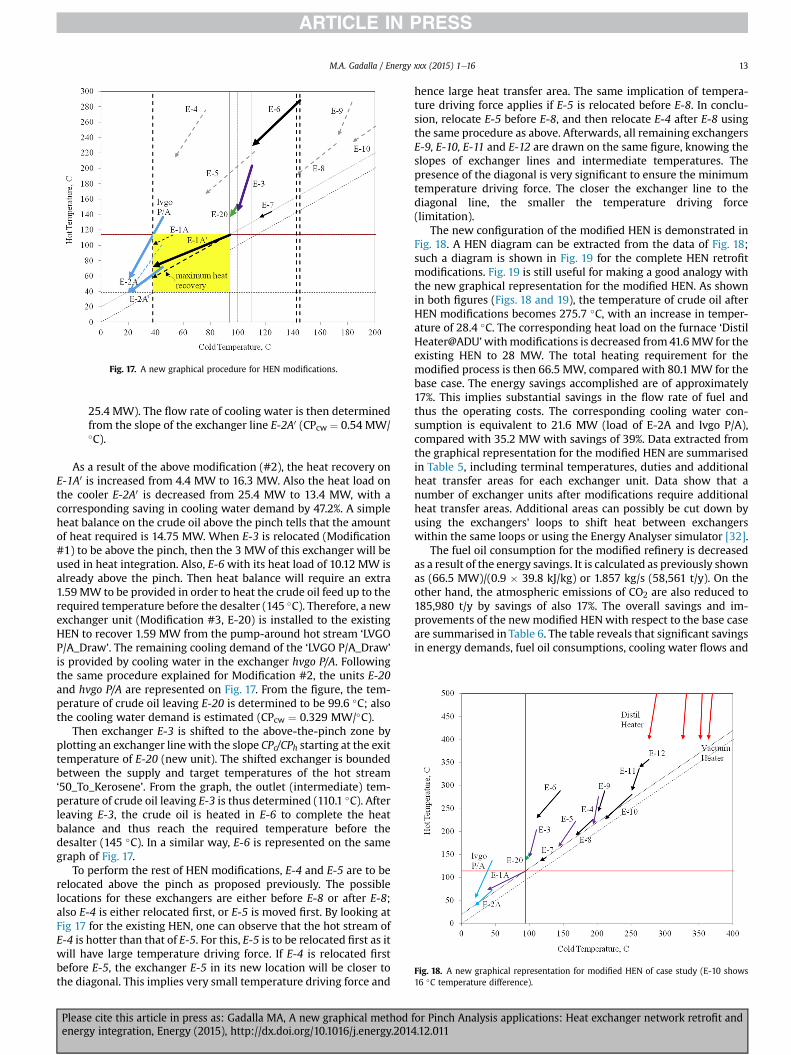
Fig. 17. A new graphical procedure for HEN modifications.
Fig. 18. A new graphical representation for modified HEN of case study (E-10 shows16 �C temperature difference).
M.A. Gadalla / Energy xxx (2015) 1e16 13
25.4 MW). The flow rate of cooling water is then determinedfrom the slope of the exchanger line E-2A0 (CPcw ¼ 0.54 MW/�C).
As a result of the above modification (#2), the heat recovery onE-1A0 is increased from 4.4 MW to 16.3 MW. Also the heat load onthe cooler E-2A0 is decreased from 25.4 MW to 13.4 MW, with acorresponding saving in cooling water demand by 47.2%. A simpleheat balance on the crude oil above the pinch tells that the amountof heat required is 14.75 MW. When E-3 is relocated (Modification#1) to be above the pinch, then the 3 MWof this exchanger will beused in heat integration. Also, E-6with its heat load of 10.12 MW isalready above the pinch. Then heat balance will require an extra1.59 MW to be provided in order to heat the crude oil feed up to therequired temperature before the desalter (145 �C). Therefore, a newexchanger unit (Modification #3, E-20) is installed to the existingHEN to recover 1.59 MW from the pump-around hot stream ‘LVGOP/A_Draw’. The remaining cooling demand of the ‘LVGO P/A_Draw’
is provided by cooling water in the exchanger hvgo P/A. Followingthe same procedure explained for Modification #2, the units E-20and hvgo P/A are represented on Fig. 17. From the figure, the tem-perature of crude oil leaving E-20 is determined to be 99.6 �C; alsothe cooling water demand is estimated (CPcw ¼ 0.329 MW/�C).
Then exchanger E-3 is shifted to the above-the-pinch zone byplotting an exchanger line with the slope CPc/CPh starting at the exittemperature of E-20 (new unit). The shifted exchanger is boundedbetween the supply and target temperatures of the hot stream‘50_To_Kerosene’. From the graph, the outlet (intermediate) tem-perature of crude oil leaving E-3 is thus determined (110.1 �C). Afterleaving E-3, the crude oil is heated in E-6 to complete the heatbalance and thus reach the required temperature before thedesalter (145 �C). In a similar way, E-6 is represented on the samegraph of Fig. 17.
To perform the rest of HEN modifications, E-4 and E-5 are to berelocated above the pinch as proposed previously. The possiblelocations for these exchangers are either before E-8 or after E-8;also E-4 is either relocated first, or E-5 is moved first. By looking atFig 17 for the existing HEN, one can observe that the hot stream ofE-4 is hotter than that of E-5. For this, E-5 is to be relocated first as itwill have large temperature driving force. If E-4 is relocated firstbefore E-5, the exchanger E-5 in its new location will be closer tothe diagonal. This implies very small temperature driving force and
Please cite this article in press as: Gadalla MA, A new graphical methodenergy integration, Energy (2015), http://dx.doi.org/10.1016/j.energy.2014
hence large heat transfer area. The same implication of tempera-ture driving force applies if E-5 is relocated before E-8. In conclu-sion, relocate E-5 before E-8, and then relocate E-4 after E-8 usingthe same procedure as above. Afterwards, all remaining exchangersE-9, E-10, E-11 and E-12 are drawn on the same figure, knowing theslopes of exchanger lines and intermediate temperatures. Thepresence of the diagonal is very significant to ensure the minimumtemperature driving force. The closer the exchanger line to thediagonal line, the smaller the temperature driving force(limitation).
The new configuration of the modified HEN is demonstrated inFig. 18. A HEN diagram can be extracted from the data of Fig. 18;such a diagram is shown in Fig. 19 for the complete HEN retrofitmodifications. Fig. 19 is still useful for making a good analogy withthe new graphical representation for the modified HEN. As shownin both figures (Figs. 18 and 19), the temperature of crude oil afterHEN modifications becomes 275.7 �C, with an increase in temper-ature of 28.4 �C. The corresponding heat load on the furnace ‘DistilHeater@ADU’withmodifications is decreased from41.6MW for theexisting HEN to 28 MW. The total heating requirement for themodified process is then 66.5 MW, compared with 80.1 MW for thebase case. The energy savings accomplished are of approximately17%. This implies substantial savings in the flow rate of fuel andthus the operating costs. The corresponding cooling water con-sumption is equivalent to 21.6 MW (load of E-2A and lvgo P/A),compared with 35.2 MW with savings of 39%. Data extracted fromthe graphical representation for the modified HEN are summarisedin Table 5, including terminal temperatures, duties and additionalheat transfer areas for each exchanger unit. Data show that anumber of exchanger units after modifications require additionalheat transfer areas. Additional areas can possibly be cut down byusing the exchangers' loops to shift heat between exchangerswithin the same loops or using the Energy Analyser simulator [32].
The fuel oil consumption for the modified refinery is decreasedas a result of the energy savings. It is calculated as previously shownas (66.5 MW)/(0.9 � 39.8 kJ/kg) or 1.857 kg/s (58,561 t/y). On theother hand, the atmospheric emissions of CO2 are also reduced to185,980 t/y by savings of also 17%. The overall savings and im-provements of the newmodified HEN with respect to the base caseare summarised in Table 6. The table reveals that significant savingsin energy demands, fuel oil consumptions, cooling water flows and
for Pinch Analysis applications: Heat exchanger network retrofit and.12.011
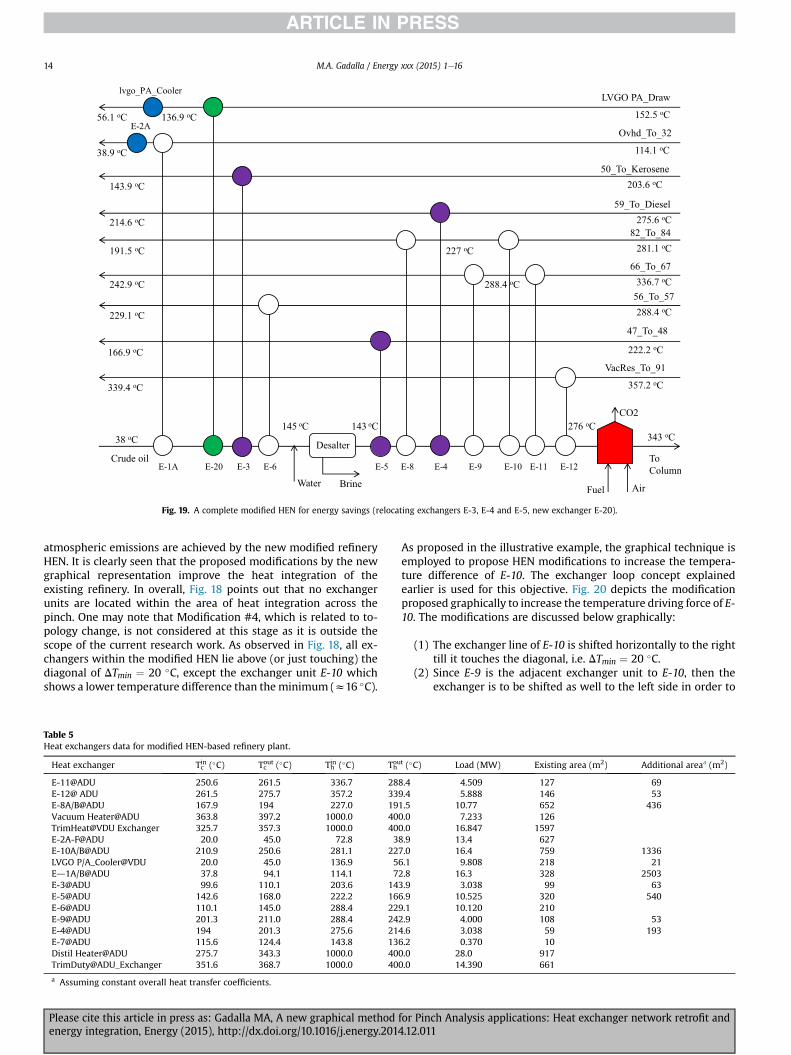
Fig. 19. A complete modified HEN for energy savings (relocating exchangers E-3, E-4 and E-5, new exchanger E-20).
M.A. Gadalla / Energy xxx (2015) 1e1614
atmospheric emissions are achieved by the new modified refineryHEN. It is clearly seen that the proposed modifications by the newgraphical representation improve the heat integration of theexisting refinery. In overall, Fig. 18 points out that no exchangerunits are located within the area of heat integration across thepinch. One may note that Modification #4, which is related to to-pology change, is not considered at this stage as it is outside thescope of the current research work. As observed in Fig. 18, all ex-changers within the modified HEN lie above (or just touching) thediagonal of DTmin ¼ 20 �C, except the exchanger unit E-10 whichshows a lower temperature difference than theminimum (z16 �C).
Table 5Heat exchangers data for modified HEN-based refinery plant.
Heat exchanger Tcin (�C) Tcout (�C) Thin (�C) Thou
E-11@ADU 250.6 261.5 336.7 28E-12@ ADU 261.5 275.7 357.2 33E-8A/B@ADU 167.9 194 227.0 19Vacuum Heater@ADU 363.8 397.2 1000.0 40TrimHeat@VDU Exchanger 325.7 357.3 1000.0 40E-2A-F@ADU 20.0 45.0 72.8 3E-10A/B@ADU 210.9 250.6 281.1 22LVGO P/A_Cooler@VDU 20.0 45.0 136.9 5Ed1A/B@ADU 37.8 94.1 114.1 7E-3@ADU 99.6 110.1 203.6 14E-5@ADU 142.6 168.0 222.2 16E-6@ADU 110.1 145.0 288.4 22E-9@ADU 201.3 211.0 288.4 24E-4@ADU 194 201.3 275.6 21E-7@ADU 115.6 124.4 143.8 13Distil Heater@ADU 275.7 343.3 1000.0 40TrimDuty@ADU_Exchanger 351.6 368.7 1000.0 40
a Assuming constant overall heat transfer coefficients.
Please cite this article in press as: Gadalla MA, A new graphical methodenergy integration, Energy (2015), http://dx.doi.org/10.1016/j.energy.201
As proposed in the illustrative example, the graphical technique isemployed to propose HEN modifications to increase the tempera-ture difference of E-10. The exchanger loop concept explainedearlier is used for this objective. Fig. 20 depicts the modificationproposed graphically to increase the temperature driving force of E-10. The modifications are discussed below graphically:
(1) The exchanger line of E-10 is shifted horizontally to the righttill it touches the diagonal, i.e. DTmin ¼ 20 �C.
(2) Since E-9 is the adjacent exchanger unit to E-10, then theexchanger is to be shifted as well to the left side in order to
t (�C) Load (MW) Existing area (m2) Additional areaa (m2)
8.4 4.509 127 699.4 5.888 146 531.5 10.77 652 4360.0 7.233 1260.0 16.847 15978.9 13.4 6277.0 16.4 759 13366.1 9.808 218 212.8 16.3 328 25033.9 3.038 99 636.9 10.525 320 5409.1 10.120 2102.9 4.000 108 534.6 3.038 59 1936.2 0.370 100.0 28.0 9170.0 14.390 661
for Pinch Analysis applications: Heat exchanger network retrofit and4.12.011
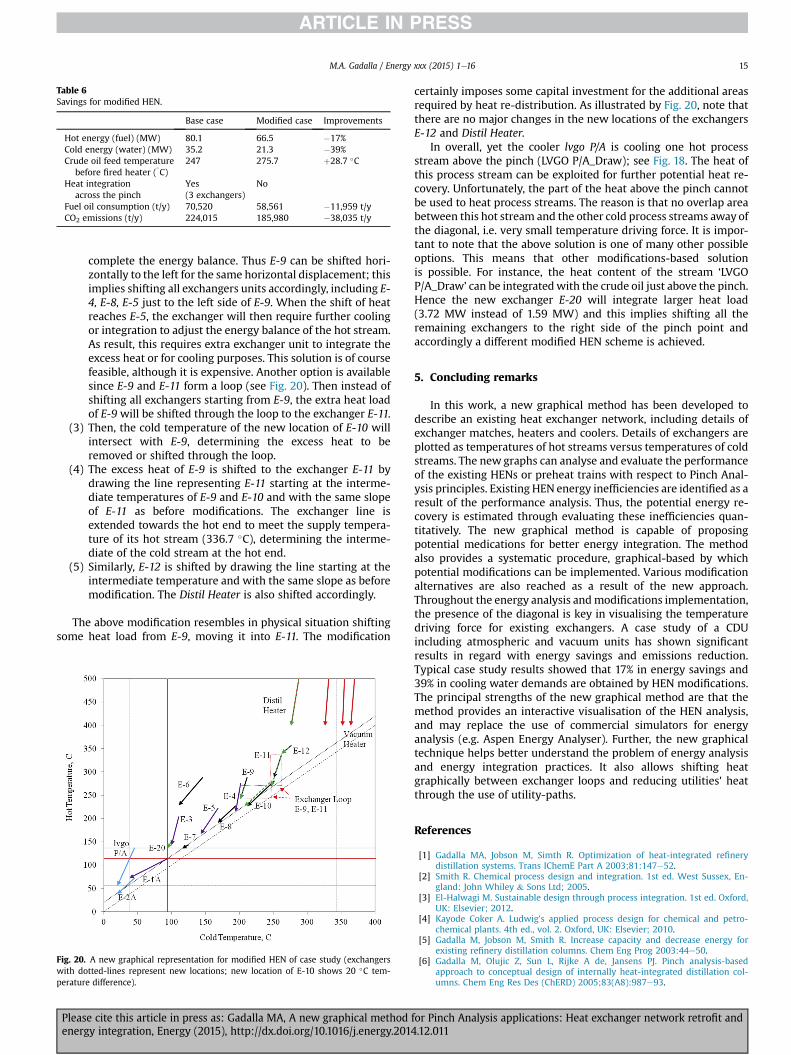
Table 6Savings for modified HEN.
Base case Modified case Improvements
Hot energy (fuel) (MW) 80.1 66.5 �17%Cold energy (water) (MW) 35.2 21.3 �39%Crude oil feed temperature
before fired heater (�C)
247 275.7 þ28.7 �C
Heat integrationacross the pinch
Yes(3 exchangers)
No
Fuel oil consumption (t/y) 70,520 58,561 �11,959 t/yCO2 emissions (t/y) 224,015 185,980 �38,035 t/y
M.A. Gadalla / Energy xxx (2015) 1e16 15
complete the energy balance. Thus E-9 can be shifted hori-zontally to the left for the same horizontal displacement; thisimplies shifting all exchangers units accordingly, including E-4, E-8, E-5 just to the left side of E-9. When the shift of heatreaches E-5, the exchanger will then require further coolingor integration to adjust the energy balance of the hot stream.As result, this requires extra exchanger unit to integrate theexcess heat or for cooling purposes. This solution is of coursefeasible, although it is expensive. Another option is availablesince E-9 and E-11 form a loop (see Fig. 20). Then instead ofshifting all exchangers starting from E-9, the extra heat loadof E-9 will be shifted through the loop to the exchanger E-11.
(3) Then, the cold temperature of the new location of E-10 willintersect with E-9, determining the excess heat to beremoved or shifted through the loop.
(4) The excess heat of E-9 is shifted to the exchanger E-11 bydrawing the line representing E-11 starting at the interme-diate temperatures of E-9 and E-10 and with the same slopeof E-11 as before modifications. The exchanger line isextended towards the hot end to meet the supply tempera-ture of its hot stream (336.7 �C), determining the interme-diate of the cold stream at the hot end.
(5) Similarly, E-12 is shifted by drawing the line starting at theintermediate temperature and with the same slope as beforemodification. The Distil Heater is also shifted accordingly.
The above modification resembles in physical situation shiftingsome heat load from E-9, moving it into E-11. The modification
Fig. 20. A new graphical representation for modified HEN of case study (exchangerswith dotted-lines represent new locations; new location of E-10 shows 20 �C tem-perature difference).
Please cite this article in press as: Gadalla MA, A new graphical methodenergy integration, Energy (2015), http://dx.doi.org/10.1016/j.energy.2014
certainly imposes some capital investment for the additional areasrequired by heat re-distribution. As illustrated by Fig. 20, note thatthere are no major changes in the new locations of the exchangersE-12 and Distil Heater.
In overall, yet the cooler lvgo P/A is cooling one hot processstream above the pinch (LVGO P/A_Draw); see Fig. 18. The heat ofthis process stream can be exploited for further potential heat re-covery. Unfortunately, the part of the heat above the pinch cannotbe used to heat process streams. The reason is that no overlap areabetween this hot stream and the other cold process streams away ofthe diagonal, i.e. very small temperature driving force. It is impor-tant to note that the above solution is one of many other possibleoptions. This means that other modifications-based solutionis possible. For instance, the heat content of the stream ‘LVGOP/A_Draw’ can be integratedwith the crude oil just above the pinch.Hence the new exchanger E-20 will integrate larger heat load(3.72 MW instead of 1.59 MW) and this implies shifting all theremaining exchangers to the right side of the pinch point andaccordingly a different modified HEN scheme is achieved.
5. Concluding remarks
In this work, a new graphical method has been developed todescribe an existing heat exchanger network, including details ofexchanger matches, heaters and coolers. Details of exchangers areplotted as temperatures of hot streams versus temperatures of coldstreams. The new graphs can analyse and evaluate the performanceof the existing HENs or preheat trains with respect to Pinch Anal-ysis principles. Existing HEN energy inefficiencies are identified as aresult of the performance analysis. Thus, the potential energy re-covery is estimated through evaluating these inefficiencies quan-titatively. The new graphical method is capable of proposingpotential medications for better energy integration. The methodalso provides a systematic procedure, graphical-based by whichpotential modifications can be implemented. Various modificationalternatives are also reached as a result of the new approach.Throughout the energy analysis andmodifications implementation,the presence of the diagonal is key in visualising the temperaturedriving force for existing exchangers. A case study of a CDUincluding atmospheric and vacuum units has shown significantresults in regard with energy savings and emissions reduction.Typical case study results showed that 17% in energy savings and39% in cooling water demands are obtained by HEN modifications.The principal strengths of the new graphical method are that themethod provides an interactive visualisation of the HEN analysis,and may replace the use of commercial simulators for energyanalysis (e.g. Aspen Energy Analyser). Further, the new graphicaltechnique helps better understand the problem of energy analysisand energy integration practices. It also allows shifting heatgraphically between exchanger loops and reducing utilities' heatthrough the use of utility-paths.
References
[1] Gadalla MA, Jobson M, Simth R. Optimization of heat-integrated refinerydistillation systems. Trans IChemE Part A 2003;81:147e52.
[2] Smith R. Chemical process design and integration. 1st ed. West Sussex, En-gland: John Whiley & Sons Ltd; 2005.
[3] El-Halwagi M. Sustainable design through process integration. 1st ed. Oxford,UK: Elsevier; 2012.
[4] Kayode Coker A. Ludwig's applied process design for chemical and petro-chemical plants. 4th ed., vol. 2. Oxford, UK: Elsevier; 2010.
[5] Gadalla M, Jobson M, Smith R. Increase capacity and decrease energy forexisting refinery distillation columns. Chem Eng Prog 2003:44e50.
[6] Gadalla M, Olujic Z, Sun L, Rijke A de, Jansens PJ. Pinch analysis-basedapproach to conceptual design of internally heat-integrated distillation col-umns. Chem Eng Res Des (ChERD) 2005;83(A8):987e93.
for Pinch Analysis applications: Heat exchanger network retrofit and.12.011
M.A. Gadalla / Energy xxx (2015) 1e1616
[7] Asante NDK, Zhu XX. An automated and interactive approach for heatexchanger network retrofit. Trans IChemE 1997;75:349.
[8] Zhu XX, Asante NDK. Diagnosis and optimization approach for heat exchangernetwork retrofit. AIChE J 1999;45:1488.
[9] Smith R, Jobson M, Chen L. Recent development in the retrofit of heatexchanger networks. Appl Therm Eng 2010;30:2281e9.
[10] Bakhtiari B, Bedard S. Retrofitting heat exchanger networks using a modifiednetwork pinch approach. Appl Therm Eng 2013;51:973e9.
[11] Zhang N, Smith R, Bulatov I, Kleme�s JJ. Sustaining high energy efficiency inexisting processes with advanced process integration technology. Appl Energy2013;101:26e32. http://dx.doi.org/10.1016/j.apenergy.2012.02.037.
[12] Ochoa-Estopier LM, Jobson M, Smith R. The use of reduced models for designand optimisation of heat-integrated crude oil distillation systems. Energy2014. http://dx.doi.org/10.1016/j.energy.2014.06.043.
[13] Jiang N, Shelley JD, Doyle S, Smith R. Heat exchanger network retrofit with afixed network structure. Appl Energy 2014;127:25e33.
[14] Wang Y, Pan M, Bulatov I, Smith R, Kim JK. Application of intensified heattransfer for the retrofit of heat exchanger network. Appl Energy 2012;89:45e59. http://dx.doi.org/10.1016/j.apenergy.2011.03.019.
[15] Wang Y. Heat exchanger network retrofit through heat transfer enhancement.PhD Thesis. Manchester; UK: The University of Manchester; 2012.
[16] Gu W, Huang Y, Wang K, Zhang B, Chen Q, Hui CW. Comparative analysis andevaluation of three crude oil vacuum distillation processes for process se-lection. Energy 2014. http://dx.doi.org/10.1016/j.energy.2014.08.053.
[17] Pan M, Smith R, Bulatov I. A novel optimization approach of improving energyrecovery in retrofitting heat exchanger network with exchanger details. En-ergy 2013;57:188e200. http://dx.doi.org/10.1016/j.energy.2012.10.056.
[18] Pejpichestakul W, Siemanond K. Retrofit of refinery heat exchanger networkunder different kinds of crude oil by pinch design method using mathematicalprogramming. Chem Eng Trans 2013;32:1411e6.
[19] Ataei A, Tahouni N, Haji Seyedi SM, Hashemian SM, Yoo CK, Panjeshahi MH.A novel approach to hot oil system design for energy conservation. ApplTherm Eng 2014;66:423e34.
[20] Wang Y, Feng F, Chu KH. Trade-off between energy and distance related costsfor different connection patterns in heat integration across plants. Appl ThermEng 2014;70:857e66.
[21] Rezaei H, Zarei MM, Fazlollahi F, Sarkari M, Shahraki F, Baxter LL. Energysaving in a crude distillation unit by a retrofit design of heat exchanger net-works. Indian J Chem Technol 2013;20:290e3.
[22] Chegini S, Dargahi R, Mahdavi A. Modifications of preheating heat exchangernetwork in crude distillation unit of Arak refinery based on pinch technology.In: Proceeding of the world congress on engineering and computer scienceWCECS. San Francisco, USA; 2008.
[23] Kamel D, Gadalla M, Ashour F. New retrofit approach for optimisation andmodification for a crude oil distillation system. ChemEngTrans 2013;35:1363e8.
[24] Hohman EC. Optimum networks of heat exchange. PhD Thesis. CA, USA:University of Southern California; 1971.
[25] Huang F, Elshout RV. Optimizing the heat recovery of crude units. Chem EngProg 1976;72:68.
[26] Linnhoff B, Mason DR, Wardle I. Understanding heat exchanger networks.Comp Chem Eng 1979;3:295.
[27] Linnhoff B, Townsend DW, Boland D, Hewitt GF, Thomas BEA, Guy AR, et al.A user guide on process integration for the efficient use of energy. 1st ed. UK:IChemE; 1982.
[28] Umeda T, Itoh J, Shiroko K. Heat exchange system synthesis. Chem Eng Prog1978;74:70.
Please cite this article in press as: Gadalla MA, A new graphical methodenergy integration, Energy (2015), http://dx.doi.org/10.1016/j.energy.201
[29] Natural resources Canada. Pinch analysis: for the efficient use of energy, water& hydrogen. CANMET; 2003, ISBN 0-662-34964-4. Catalogue # M39-96/2003E.
[30] Linnhoff B, Flower JR. Synthesis of heat exchanger networks: I. Systematicgeneration of energy optimal networks. AIChE J 1978;24(4):633e42.
[31] Aspen HYSYS v7.3. USA: Aspen Technology, Inc.; 2011. university program.[32] Aspen energy analyser v7.3. USA: Aspen Technology, Inc.; 2011. university
program.[33] Gadalla M, Olujic Z, Jobson M, Smith R. Estimation and reduction of CO2
emissions from crude oil distillation units. Energy 2006;31:2062e72.
Nomenclature
Cpc: specific heat of cold stream (kJ/kg$�C)Cph: specific heat of hot stream (kJ/kg$�C)CPc: heat capacity flow for cold stream (kJ/s$�C)CPc: mean heat capacity flow for cold stream (kJ/s$�C)CPh: heat capacity flow for hot stream (kJ/s$�C)CPh: mean heat capacity flow for hot stream (kJ/s$�C)L: length of exchanger line (m)mc: mass flow rate of cold stream (kg/s)mh: mass flow rate of hot stream (kg/s)P/A: pump-aroundQ: heat duty or flow (kW)Tc: temperature of process cold stream (�C)Th: temperature of process hot stream (�C)Tinh : temperature of inlet hot stream to exchangers (�C)Tin*h : shifted temperature of inlet hot stream to exchangers (�C)Touth : temperature of outlet hot stream from exchangers (�C)Tout*h : shifted temperature of outlet hot stream from exchangers (�C)Tinc : temperature of inlet cold stream to exchangers (�C)Tin*c : shifted temperature of inlet cold stream to exchangers (�C)Toutc : temperature of outlet cold stream from exchangers (�C)Tout*c : shifted temperature of outlet cold stream from exchangers (�C)Tinh : temperature of inlet hot stream to exchangers (�C)DT: temperature driving force of exchanger (�C, K)DTmin: minimum temperature approach difference (�C, K)DTc: temperature difference of cold stream (�C, K)DT*c : shifted temperature difference of cold stream (�C, K)DTh: temperature difference of hot stream (�C, K)DT*h: shifted temperature difference of hot stream (�C, K)
Abbreviation
c: cold streamcw: cooling waterh: hot streamHEN(s): heat exchanger network(s)hx: exchanger unitLLR: left lower regionLUR: left upper regionRLR: right lower regionRUR: right upper region
for Pinch Analysis applications: Heat exchanger network retrofit and4.12.011