Embed Size (px)
Citation preview

A new century, a new round
MBA 290GNovember 14, 2007
Team OneSohail Gondal, Vince Law, Que Anh Nguyen, Jason Stauth
VS.

Koninklijke Philips Electronics N.V., Netherlands
• Consumer Electronics, Lighting, Medical Systems, and Domestic Appliances and Personal Care
• In 2006 $39.6 billion in sales, 60 countries
• Bordered by the North Sea to the north and west, Belgium to the south, and Germany to the east.
Germany
Belgium
1970’sAdoption of
Matshusita’s VHS over V2000
videocassette
1892Light bulb
factory
1912Incorporation
1918-1930sVacuum tubes,
radios, x-ray tubes
1940Moved management & research to US and
England
1963Audio cassette
tape
1982Compact Disc
with Sony
1971-presentReorganization of company
- 7 CEOs -

Matsushita Electric Industrial Co., Japan
• Brands and divisions:
– Panasonic, National, Nais, Quasar, Technics, Ramsa, Rasonic
• In 2006, $79 billion in sales
• Ranked the 59th company in the world in 2007 by the Forbes Global 500
1918Duplex lamp
sockets
1927Bicycle lamp
“National” brand
1940’sLight fixtures, motors,
electric irons
1960’sTelevision sets
“Panasonic” brand
1974Purchased
Quasar from Motorola
1989Japanese stock
market crash
2004Panasonic as primary
global brand
1979Expanded
“Panasonic” brand to Europe
2006No more analog TVs.
Concentrate on digital.

Structure Matrix Hierarchical
Decision making Decentralized Centralized
Staffing Key staff local Key staff ex-pats
Philips Matsushita
Strategy Technical innovator Fast follower
Comparison of the starting positions of the two organizations

2006 Sales by product line and regionSales by Region
0.0
10.0
20.0
30.0
40.0
50.0
60.0
70.0
80.0
90.0
Matsushita Philips
Sal
es (
$B)
Europe
North and South America
Japan, Asia
Philips Product Sales by Category
Medical Systems
DAP
CE
LightingOther
Matsushita Product Sales by Category
AVC Networks
Home Appliances
Components and Devices
MEW and PanaHome
JVCOther
AVC=audio, video & communications; MEW=Matsushita electric works CE=consumer electronics; DAP=domestic appliances and personal care

Matsushita overtook Philips in the mid 80’s and built a formidable lead
0
10
20
30
40
50
60
70
80
90
Philips 35.3 40 33 21.8 17 10 4.2
Matsushita 68.9 78.1 37.8 24.9 13.7 4.5 2.6
2000 1995 1990 1985 1980 1975 1970
Sal
e s,
$mn

Focus on growth in different industry sectors
Matsushita: Growth by Sector
0%10%
20%30%
40%50%
60%70%
80%90%
100%
2005 2006 2007
Other
JVC
MEW and PanaHome
Components andDevices
Home Appliances
AVC Networks
Philips: Growth by Sector
0%
20%
40%
60%
80%
100%
2004 2005 2006
Other
Lighting
CE
DAP
Medical Systems
Semiconductor Division:• 15% total sales• 17% EBIT
Ph
ilip
s S
emi
Div

• Good supply of Dutch engineers / sales talent
• Tap into EU / US talent
Philips Matsushita
• Good supply of Japanese engineering and commercial talent
• Value-added per hour 68% higher than EU
• Proximity to Germany caused operations to be moved abroad during WW II
• Proximity to low-wage Asian countries for manufacturing
Factor conditions
Skilledresources
Geographic Location

• Dutch market too small to absorb mass production of electronics
– Expansion to foreign markets (1899)
Philips Matsushita
• Japanese consumers represents a significant market
– Late focus on export market (1950’s)
• Global Ops provided access to local trends and needs in foreign markets
• Products focused on local markets
• Japanese customers are highly demanding of quality and innovation in electronics
Demand conditions
Market size
Marketmaturity

• Locally weak, but strong EU (Siemens) and US (GE) competitors
Philips Matsushita
• Strong presence of quality competitors
Related industries
• Locally weak, but strong EU / US value chain
• Strong presence of players across electronics value chain
• Approximately 120 electronics company in Japan
Support industries
Related & support industries

• Stay focused on core products while competitors were diversifying
• Emphasized innovations & technological prowess
Philips Matsushita
• Diversified product line• Focus on operational
excellence• Fast-to-market, “Manishita”
• Decentralized global operations, strong NOs
• Joint technical and commercial leadership
• Highly centralized• Small business environment
with divisional structure• “One-product-one-division”
• In house competition between technical and commercial functions
• No national rivals
• In house competition between divisions
• Fierce competition from Japanese electronics firms: JVC, Sony, Hitachi
Strategy
Structure
Rivalry
Firm strategy, structure & rivalry

Strong National Organizations
Fiefdoms often working against
each other
Employee centric values
Organization with “lifers”
Focus on R&D / technical innovation
Inability to commercialize
innovation
Core Competencies Core Incompetencies
How Philips’ strengths and core competencies became its weaknesses
Common Market
Ability to adapt to local market conditions
No economy of scale in
manufacturing
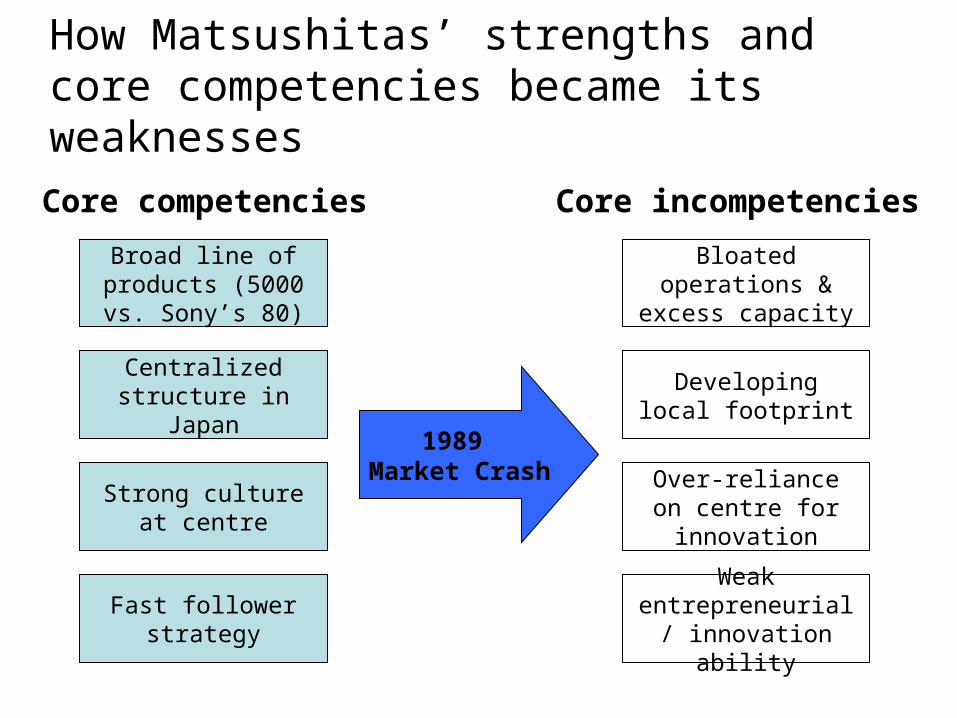
Centralized structure in Japan
Developing local footprint
Strong culture at centre
Over-reliance on centre for innovation
Fast follower strategyWeak entrepreneurial
/ innovation ability
Core competencies Core incompetencies
How Matsushitas’ strengths and core competencies became its weaknesses
Broad line of products (5000 vs.
Sony’s 80)
Bloated operations & excess capacity
1989 Market Crash

Matsushita Philips
Deg
ree of
centralizatio
nL
ow
Hig
h
• 1970’s - Shift to IPC’s / Tilting matrix to PD’s
• 1987 - 4 core LOBs / 14 PD’s to 4 global divisions
• 1990 - Bet on 15 core multimedia technologies
• 2001 - Eliminate “management discount” in stock price
• 1982 - Operational Localization
• 1986 - “Matsushita Bank”
• 1999 - “Simple, small, speedy and strategic”
A comparison of the two organizations attempts to shift their strategies

3793
1983
15951223
726 659 560 437
2268
2884 2003 R&D spend (£m)
Source: UK Department of Trade & Industry – R&D Scoreboard
While Philips is amongst the biggest R&D spenders in the industry…
The worlds top ten R&D investors in electronic and electrical equipment

Total sales (in billions of euros)
Sales in electrical capital goods (in billions of euros)
Sony(JPN)
56,8
17,1
GE (USA)
IBM (USA)
Siemens(D)
120,5
79,6
75,6
74,2
63,1
Hitachi(JPN)
64,2
Matsushita(JPN)
57,3
Hewlett-Packard(USA)
66,9
64,9
Toshiba(JPN)
43,5
NEC(JPN)
37,1
SamsungElectronics(KOR)
46,7
38,5
26,5
28,6 30,4 36,3
21,0
… it still seems unable to translate innovation into commercial success.
The top ten companies in electronics and electrical engineering

779
341
166 14994 88
64 63 55 37
volumes in € billions
32.3
14.1
6.9 6.23.9 3.6
2.7 2.6 2.3 1.5
% share of world market
Source: Siemens AG, Nov 2003
Despite the attractiveness of foreign markets for electronics products…
The top ten world markets for electronic and electrical equipment

Source: 2007 Financial Statements
… Matsushita still generates the predominant amount of its sales from Asia.
Sales by geographic segment
Europe18%China
6%
Other44%
Domestic4%
US28%
Europe13%
Asia & Others
21%
Domestic51%
North & Soth America
15%
Philips Matsushita
Source: 2006 Financial Statements

Possible reasons for Net Income differential
• Philips has disposed of many businesses that has resulted in net income being supplemented by income from discontinued operations e.g., in 2006
• Exchange rate effects due to weak Yen
• Tax incentives to Philips?
While lagging in sales, Philips has managed higher net income
0
20
40
60
80
100
Matsushita 0 66.2 66.9 77.9 79.5 81.4
Philips 38.9 34.8 36.1 37.4 39.2
2002 2003 2004 2005 2006 2007
-6-4-2
0246
810
Matsushita 0 -0.2 0.4 0.5 1.4 1.9
Philips -4.6 1 4.1 4.2 7.8
2002 2003 2004 2005 2006 2007Net
In
c om
e , $
bn
Sal
e s,
$bn
Income from continued operations €0.9Bn
Income from discontinued operations
€4.5Bn
Net Income €5.4Bn

Philips stock price growth has outperformed Matsushita

Philips has even outperformed GE and Sony

Philips is on par with DJI and better than S&P500 & Nasdaq

Why do the transformation efforts at Philips and Matsushita not seemed to have worked?
1
2
3
4
5
6
7
8
Establish a sense of urgency
Form a powerful guiding coalition
Create a vision
Communicate the vision
Empower employees to act on the vision
Create short term wins
Build on momentum to drive more change
Institutionalize new approaches
?
?
?
?
Philips MatsushitaEight steps to transformationLeading Change: Why Transformation Efforts Fail, Kotter, HBR

Corporate venturing units have “generated decidedly uneven financial returns”
0%
5%
10%
15%
20%
25%
30%
Ecosy
stem
ven
turin
g
Innova
tion v
entu
ring
Harve
st v
entu
ring
Privat
e Equity
ven
turin
g
New le
g ven
turin
g
Mix
ed o
bject
ives
Successful
Unsuccessful
Success rates for different types of venture unit
Source: The future of corporate venturing, MIT Sloan Review, Fall 2003

Apple’s Core Competencies
Managing the supply chain
1• Flat/small structure, young/innovative culture• User-centric design and marketing• Focused product line• Strong brand loyalty
Own the customer relationship = higher
margins
Core strengths in design & branding
2
• Many-to-one supplier relationship• Close supplier relationships• Complete off-shore production
Retain bargaining position and drive
down costs
Maintain Control over suppliers and costs
High margins & Dominant market share
(ipods)
+
=
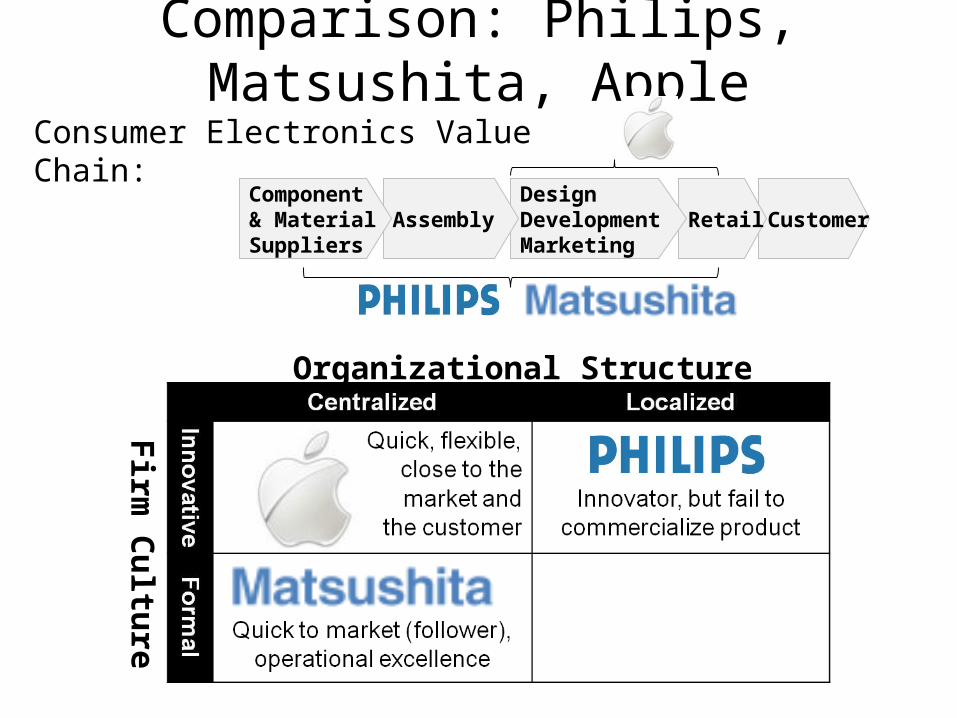
Comparison: Philips, Matsushita, Apple
CustomerRetailDesignDevelopmentMarketing
AssemblyComponent & MaterialSuppliers
Consumer Electronics Value Chain:
Organizational Structure
Firm
Cu
lture

How to compete with Apple in CE
• Focus on core competency: local design and engineering innovations
• Improve/centralize commercialization, marketing, and branding of innovation
• Centralize/outsource production, develop operational excellence– Minimize cost of production
• Develop internal entrepreneurial spark– Diversify design and
development beyond Japan
– Top management buy-in
– E.g. allow autonomous product development and design arm to thrive within the company
• Build smaller brands or reinvent existing brands (Panasonic/ National) for premium image– higher prices/margins