Embed Size (px)
Citation preview
ww.sciencedirect.com
i n t e rn a t i o n a l j o u r n a l o f h y d r o g e n en e r g y 4 1 ( 2 0 1 6 ) 4 8 0 8e4 8 1 9
Available online at w
ScienceDirect
journal homepage: www.elsevier .com/locate/he
A new approach to battery powered electricvehicles: A hydrogen fuel-cell-based rangeextender system
Roberto �Alvarez Fern�andez*, Fernando Beltr�an Cilleruelo,I~naki Villar Martınez
Universidad Nebrija, Pirineos 55, 28040 Madrid, Spain
a r t i c l e i n f o
Article history:
Received 27 November 2015
Received in revised form
8 January 2016
Accepted 8 January 2016
Available online 4 February 2016
Keywords:
Hydrogen
Electric vehicle
Fuel cell
Extended range
Simulation
Model
Abbreviations: BEV, Battery Electric VehicHybrid Electric Vehicle; RE, Range Extender;Vehicles; SoC, State of Charge; PEM, Proton* Corresponding author. Tel.: þ34 914521100E-mail address: [email protected] (R.�A.
http://dx.doi.org/10.1016/j.ijhydene.2016.01.00360-3199/Copyright © 2016, Hydrogen Energ
a b s t r a c t
Sometimes technology and development of society run slightly different roads. This situ-
ation is now happening in the case of hydrogen as an energy carrier in the automotive
world. In the article presented here, the authors propose a change in the structure of the
power plant of Battery Electric Vehicles (BEV). The objective is that these vehicles can be
presently used until the development of an electric and/or hydrogen recharge/refuel
network allows being useful with the current status. In this paper a new concept of
Extended Range Electric Vehicle (EREV) based in a Fuel Cell Electric Vehicle (FCEV) set
model is presented. A study is then developed in order to determine the working condi-
tions that will lead to better efficiency and performance, referring to capacity of both en-
ergy sources: electricity stored in a Lithium-Ion battery and hydrogen gas in high pressure
tanks. The possibilities here shown open the door to strategic advantages and innovation
for car designers in the future.
Copyright © 2016, Hydrogen Energy Publications, LLC. Published by Elsevier Ltd. All rights
reserved.
Introduction
Nowadays, when the traditional transport model has become
to its depletion, manufacturers and governments are betting
hard on newer and greener technologies as a solution. Not
only the progressive depletion of fuel reserves, but also the
environment evolution indicate that the mobile fleet must
probably change in no more than the next twenty e thirty
le; EREV, Extended RangICE, Internal Combustio
Exchange Membrane; NE; fax: þ34 914521111.Fern�andez).35y Publications, LLC. Publ
years [1,2]. Many manufacturer companies agree that the
Battery Electric Vehicle (BEV) is the one to beat [3,4], but differ
on the specific way [5]. This has much to do with the charac-
teristics of the different technologies of energy storage avail-
able. It is known that batteries offer a good dynamic response,
while their discharge time, shorter than desired, and the
recharge time, longer than desired, makes consequently that
BEVs available in the market today are not suitable for many
customers.
e Electric Vehicle; FCEV, Fuel Cell Electric Vehicle; PHEV, Plug-inn Engine; PDU, Power Distribution System; AFV, Alternative FuelDC, New European Driving Cycle.
ished by Elsevier Ltd. All rights reserved.
i n t e r n a t i o n a l j o u r n a l o f h y d r o g e n en e r g y 4 1 ( 2 0 1 6 ) 4 8 0 8e4 8 1 9 4809
A temporary solution may be the Plug in Hybrid Electric
Vehicle (PHEV), as it can be charged with electricity like BEVs,
run on gasoline with an Internal Combustion Engine (ICE) and
use batteries to improve fuel efficiency [6]. The combination
offers increased driving range with potential large fuel cost
savings and emission reductions. There are two main PHEV
technologies: parallel hybrids, in which both, the electric
motor and the combustion engine, are mechanically coupled
to the wheels through a transmission (i.e. Toyota Prius), and
series hybrids, also known as Extended Range Electric Vehi-
cles (EREV), in which the electric motor is directly coupled to
the wheels and the combustion engine is only used to charge
the batteries (i.e. BMW i3). Although PHEVs possess many
advantages, they also have certain limitations. The main
concerns include increased cost due to the introduction of
engines, energy storage systems, and power converters [7],
and also, fossil fuels are used. At best, a 2 to 2.5 fold fuel ef-
ficiency gain can be hoped for the world car fleet out to 2030.
Most of this gain would be the result of a switch to hybrid
technologies [8], and depending on the percentage of elec-
tricity derived from renewable energy that could replace most
petroleum-based fuels.
On the other hand, Fuel Cell Electric Vehicles (FCEVs) are
powered by gaseous hydrogen, stored onboard in high pres-
sure tanks, which is converted into electricity by multiple
individual cells serial connected (fuel cell stack). A small bat-
tery pack is still used. It is typically smaller than BEV's one and
it is charged by an excess of energy from the hydrogen fuel cell
or through regenerative braking techniques (also often avail-
able on BEVs) which returns energy from the kinetic force
when braking, by switching the motor to operate in reverse,
flipping the route of the electricity and charging the battery.
Hyundai Tucson ix35 Fuel Cell and Toyota Mirai are two ex-
amples of FCEVs: both are zero tailpipe emissions and enjoy
good characteristics when it comes to range, as it is deter-
mined by the capacity of the tank, which can be refilled as
simply and fast as a gasoline tank.
Several policy initiatives have been adopted in order to
promote the development of a hydrogen refuelling network:
i.e. California State has committed funding for the develop-
ment of 100 hydrogen fuelling stations, Japan's government
proposed $71 million to build hydrogen fuelling stations, the
U.K. announced over $752 million of new capital investment
between 2015 and 2020 in support of ultra-low emission ve-
hicles, including FCEVs [9]. Germany, alone, expects to have
400 hydrogen fuelling stations in 2020. Norway, Sweden and
Denmark are developing the ScandinavianHydrogenHighway
to make the Scandinavian region the first in Europe where
hydrogen is commercially available in a network of refuelling
stations [10]. Italy is establishing a similar highway, designed
to connect the country in a hydrogen way to Germany and
Scandinavia. Nevertheless the slow development of refuelling
infrastructure and current vehicle cost are clearly the most
important hurdles keeping FCEVs from storming the market
en masse [11].
In the present paper the authors have started to combine
both vehicle concepts, EREV and FCEV, in order to solve these
particular problems and obtain a mixed response and an
improved vehicle range with easy refill.
Problem statement
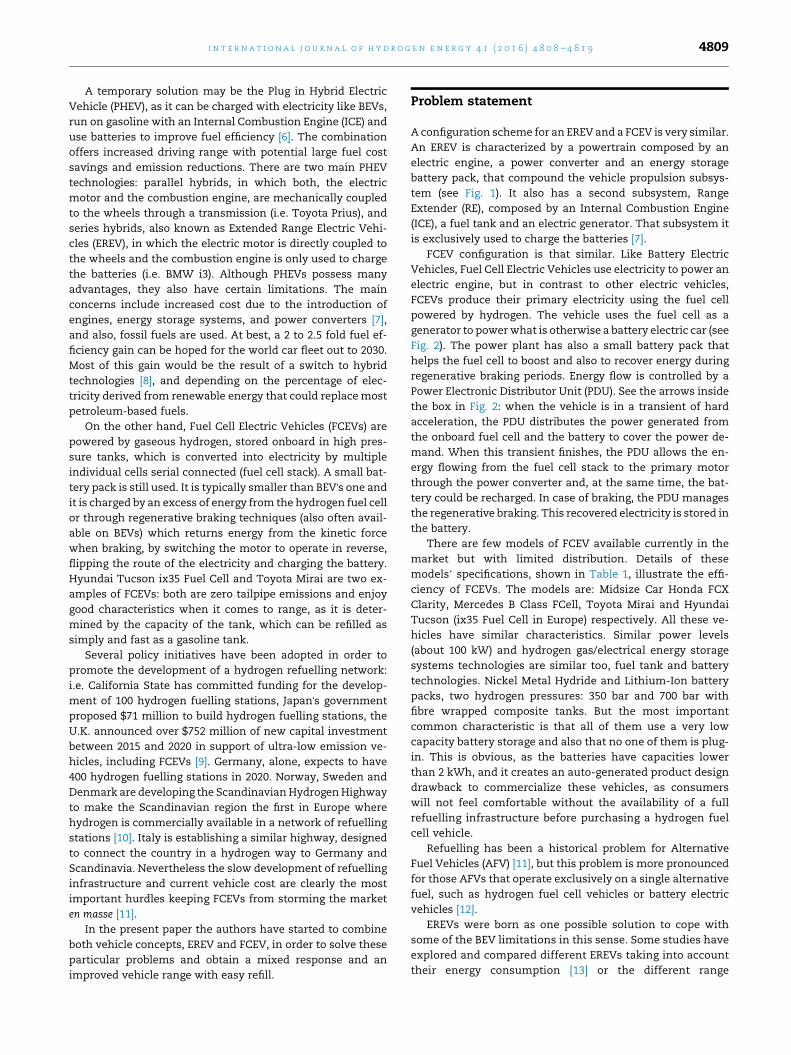
A configuration scheme for an EREV and a FCEV is very similar.
An EREV is characterized by a powertrain composed by an
electric engine, a power converter and an energy storage
battery pack, that compound the vehicle propulsion subsys-
tem (see Fig. 1). It also has a second subsystem, Range
Extender (RE), composed by an Internal Combustion Engine
(ICE), a fuel tank and an electric generator. That subsystem it
is exclusively used to charge the batteries [7].
FCEV configuration is that similar. Like Battery Electric
Vehicles, Fuel Cell Electric Vehicles use electricity to power an
electric engine, but in contrast to other electric vehicles,
FCEVs produce their primary electricity using the fuel cell
powered by hydrogen. The vehicle uses the fuel cell as a
generator to powerwhat is otherwise a battery electric car (see
Fig. 2). The power plant has also a small battery pack that
helps the fuel cell to boost and also to recover energy during
regenerative braking periods. Energy flow is controlled by a
Power Electronic Distributor Unit (PDU). See the arrows inside
the box in Fig. 2: when the vehicle is in a transient of hard
acceleration, the PDU distributes the power generated from
the onboard fuel cell and the battery to cover the power de-
mand. When this transient finishes, the PDU allows the en-
ergy flowing from the fuel cell stack to the primary motor
through the power converter and, at the same time, the bat-
tery could be recharged. In case of braking, the PDU manages
the regenerative braking. This recovered electricity is stored in
the battery.
There are few models of FCEV available currently in the
market but with limited distribution. Details of these
models’ specifications, shown in Table 1, illustrate the effi-
ciency of FCEVs. The models are: Midsize Car Honda FCX
Clarity, Mercedes B Class FCell, Toyota Mirai and Hyundai
Tucson (ix35 Fuel Cell in Europe) respectively. All these ve-
hicles have similar characteristics. Similar power levels
(about 100 kW) and hydrogen gas/electrical energy storage
systems technologies are similar too, fuel tank and battery
technologies. Nickel Metal Hydride and Lithium-Ion battery
packs, two hydrogen pressures: 350 bar and 700 bar with
fibre wrapped composite tanks. But the most important
common characteristic is that all of them use a very low
capacity battery storage and also that no one of them is plug-
in. This is obvious, as the batteries have capacities lower
than 2 kWh, and it creates an auto-generated product design
drawback to commercialize these vehicles, as consumers
will not feel comfortable without the availability of a full
refuelling infrastructure before purchasing a hydrogen fuel
cell vehicle.
Refuelling has been a historical problem for Alternative
Fuel Vehicles (AFV) [11], but this problem is more pronounced
for those AFVs that operate exclusively on a single alternative
fuel, such as hydrogen fuel cell vehicles or battery electric
vehicles [12].
EREVs were born as one possible solution to cope with
some of the BEV limitations in this sense. Some studies have
explored and compared different EREVs taking into account
their energy consumption [13] or the different range
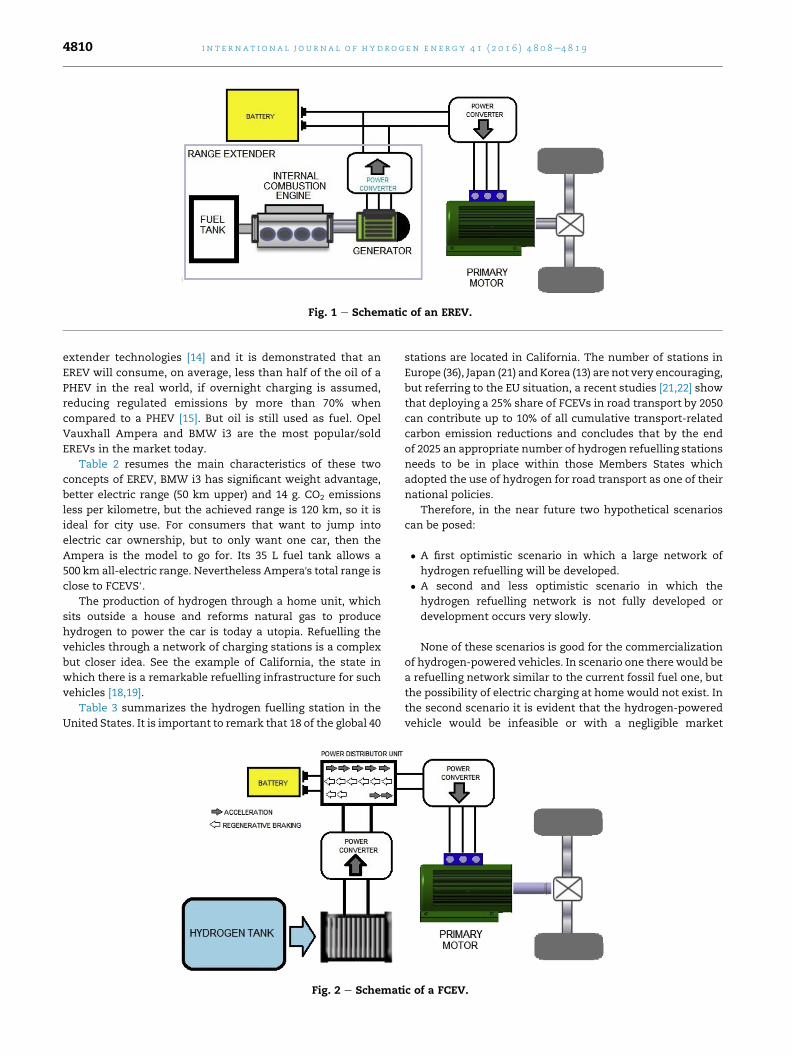
Fig. 1 e Schematic of an EREV.
i n t e rn a t i o n a l j o u r n a l o f h y d r o g e n en e r g y 4 1 ( 2 0 1 6 ) 4 8 0 8e4 8 1 94810
extender technologies [14] and it is demonstrated that an
EREV will consume, on average, less than half of the oil of a
PHEV in the real world, if overnight charging is assumed,
reducing regulated emissions by more than 70% when
compared to a PHEV [15]. But oil is still used as fuel. Opel
Vauxhall Ampera and BMW i3 are the most popular/sold
EREVs in the market today.
Table 2 resumes the main characteristics of these two
concepts of EREV, BMW i3 has significant weight advantage,
better electric range (50 km upper) and 14 g. CO2 emissions
less per kilometre, but the achieved range is 120 km, so it is
ideal for city use. For consumers that want to jump into
electric car ownership, but to only want one car, then the
Ampera is the model to go for. Its 35 L fuel tank allows a
500 km all-electric range. Nevertheless Ampera's total range is
close to FCEVS’.
The production of hydrogen through a home unit, which
sits outside a house and reforms natural gas to produce
hydrogen to power the car is today a utopia. Refuelling the
vehicles through a network of charging stations is a complex
but closer idea. See the example of California, the state in
which there is a remarkable refuelling infrastructure for such
vehicles [18,19].
Table 3 summarizes the hydrogen fuelling station in the
United States. It is important to remark that 18 of the global 40
Fig. 2 e Schemat
stations are located in California. The number of stations in
Europe (36), Japan (21) and Korea (13) are not very encouraging,
but referring to the EU situation, a recent studies [21,22] show
that deploying a 25% share of FCEVs in road transport by 2050
can contribute up to 10% of all cumulative transport-related
carbon emission reductions and concludes that by the end
of 2025 an appropriate number of hydrogen refuelling stations
needs to be in place within those Members States which
adopted the use of hydrogen for road transport as one of their
national policies.
Therefore, in the near future two hypothetical scenarios
can be posed:
� A first optimistic scenario in which a large network of
hydrogen refuelling will be developed.
� A second and less optimistic scenario in which the
hydrogen refuelling network is not fully developed or
development occurs very slowly.
None of these scenarios is good for the commercialization
of hydrogen-powered vehicles. In scenario one there would be
a refuelling network similar to the current fossil fuel one, but
the possibility of electric charging at home would not exist. In
the second scenario it is evident that the hydrogen-powered
vehicle would be infeasible or with a negligible market
ic of a FCEV.
Table
1e
Tech
nicalsp
ecifica
tionsofco
mm
ercialFCEVs.
Model
Electricenginepower
Electricenergystorage
Drivingrange(Cycle)
Fuel
capacity
(massepressureevolume)
Fuelce
llpower
Fuel
consu
mption
(kghydro
gen/100km
)
HondaFCX
Clarity
DCPerm
anent
Magnet100kW
Lithium-Ion(Li-Ion)
386km
(EPA
Test
Data)
3.92kge350bar
100kW
1015
MercedesBClass
FCell
100kW
Lithium-Ion-1.4
kW
h385km
(NEDC)
3.7
kg-700bar
100kW
0.97
Toyota
Mirai
114kW
Nickel-Metal-Hydride(N
iMH)-1.6
kW
h483km
(EPA
Test
Data)
5kg-700bar�1
22.4
L100kW
1.03
Hyundaiix35
ACInduction100kW
Lithium-IonPolymer(Li-Po)e
0.95kW
h525km
(NEDC)
5.64kg�7
00bare
144L
100kW
1.07
Table 2 e Main characteristics of the best-selling EREVs[16,17].
BMW i3 Opel Ampera
Electric engine power 125 kW 111 kW
Lithiumeion battery
capacity/weight
18.8 kWh/230 kg 16 kWh/198 kg
Extended range oil tank 9 L 35 L
Range exender petrol
engine power
647 cc 2-cylinder
(25.4 kW)
1.4i 16v (63 kW)
Electric-only range 131 km 83 km
All electric range 250 km 580 km
CO2 emissions 13 g/km 27 g/km
Unladen weight 1390 kg 1715 kg
i n t e r n a t i o n a l j o u r n a l o f h y d r o g e n en e r g y 4 1 ( 2 0 1 6 ) 4 8 0 8e4 8 1 9 4811
penetration rate. Part of this problem could be solved with a
change in the vehicle power plant architecture design,
including a higher capacity battery and plug-in technology. A
power plant based on an EREV concept that used electric en-
ergy storage in a high electric battery and an extended range
fuel cell stack system powered by hydrogen would allow the
vehicle to be used in both scenarios successfully. In scenario
one, the vehicle could be recharged with electricity at home
and refuel hydrogen using the network refuelling points. The
second scenario would allow the driver to preferably recharge
batteries at home with electricity and using the poorly
developed network of hydrogen refuelling for long trips.
So the authors of the present paper, aiming to optimize the
design of two current concepts: EREV and FCEV, and propose a
power plant architecture that mixes the following concepts:
Plug-in battery, ER (Extended Range), FC (Fuel cell stack) and
EV (Electric Vehicle) shown in Fig. 3. The aim of Plug-in ERFC-
EV vehicles is to satisfy the customer specifications defined by
today's car user profile in order to cover two specific re-
quirements of vehicle's customers: Range and refuel.
This power plant structure is not a novelty formedium and
heavy duty vans, trucks and buses. Renault Kangoo ZE H2
model is an example of adaptation of the standard Kangoo Z.E.
electric van featuring the same 22 kW on-board battery pack
and 44 kW electric motor, but also including a small range
extender using a hydrogen fuel cell and hydrogen fuel tank.
However in light duty vehicles this approach is novel and
especially designing a switching control method on the range-
extender strategy, allowing the driver to manage hydrogen
consumption versus battery charge depletion is a novelty.
Methodology
A Matlab/Simulink vehicle model has been developed to es-
timate the energy consumption in battery range attending to
the comparison of different FCEV Plug-in configurations. The
purpose of the study is to find out trends on the range of the
Table 3 e Alternative fuelling station counts in U.S.A [20].
Electric(stations/charging outlets)
Hydrogen
Public 10708/26623 12
Public þ private 12642/30826 40
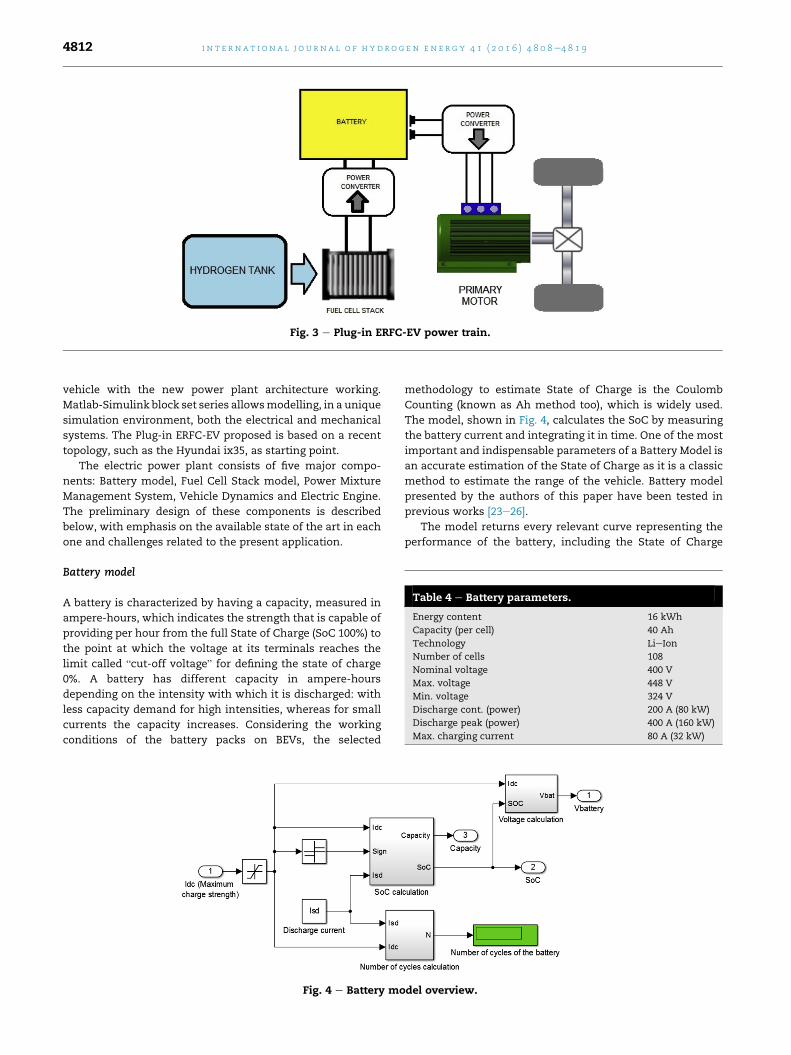
Fig. 3 e Plug-in ERFC-EV power train.
Table 4 e Battery parameters.
Energy content 16 kWh
Capacity (per cell) 40 Ah
Technology LieIon
Number of cells 108
Nominal voltage 400 V
Max. voltage 448 V
Min. voltage 324 V
Discharge cont. (power) 200 A (80 kW)
Discharge peak (power) 400 A (160 kW)
Max. charging current 80 A (32 kW)
i n t e rn a t i o n a l j o u r n a l o f h y d r o g e n en e r g y 4 1 ( 2 0 1 6 ) 4 8 0 8e4 8 1 94812
vehicle with the new power plant architecture working.
Matlab-Simulink block set series allowsmodelling, in a unique
simulation environment, both the electrical and mechanical
systems. The Plug-in ERFC-EV proposed is based on a recent
topology, such as the Hyundai ix35, as starting point.
The electric power plant consists of five major compo-
nents: Battery model, Fuel Cell Stack model, Power Mixture
Management System, Vehicle Dynamics and Electric Engine.
The preliminary design of these components is described
below, with emphasis on the available state of the art in each
one and challenges related to the present application.
Battery model
A battery is characterized by having a capacity, measured in
ampere-hours, which indicates the strength that is capable of
providing per hour from the full State of Charge (SoC 100%) to
the point at which the voltage at its terminals reaches the
limit called “cut-off voltage” for defining the state of charge
0%. A battery has different capacity in ampere-hours
depending on the intensity with which it is discharged: with
less capacity demand for high intensities, whereas for small
currents the capacity increases. Considering the working
conditions of the battery packs on BEVs, the selected
Fig. 4 e Battery mo
methodology to estimate State of Charge is the Coulomb
Counting (known as Ah method too), which is widely used.
The model, shown in Fig. 4, calculates the SoC by measuring
the battery current and integrating it in time. One of the most
important and indispensable parameters of a Battery Model is
an accurate estimation of the State of Charge as it is a classic
method to estimate the range of the vehicle. Battery model
presented by the authors of this paper have been tested in
previous works [23e26].
The model returns every relevant curve representing the
performance of the battery, including the State of Charge
del overview.
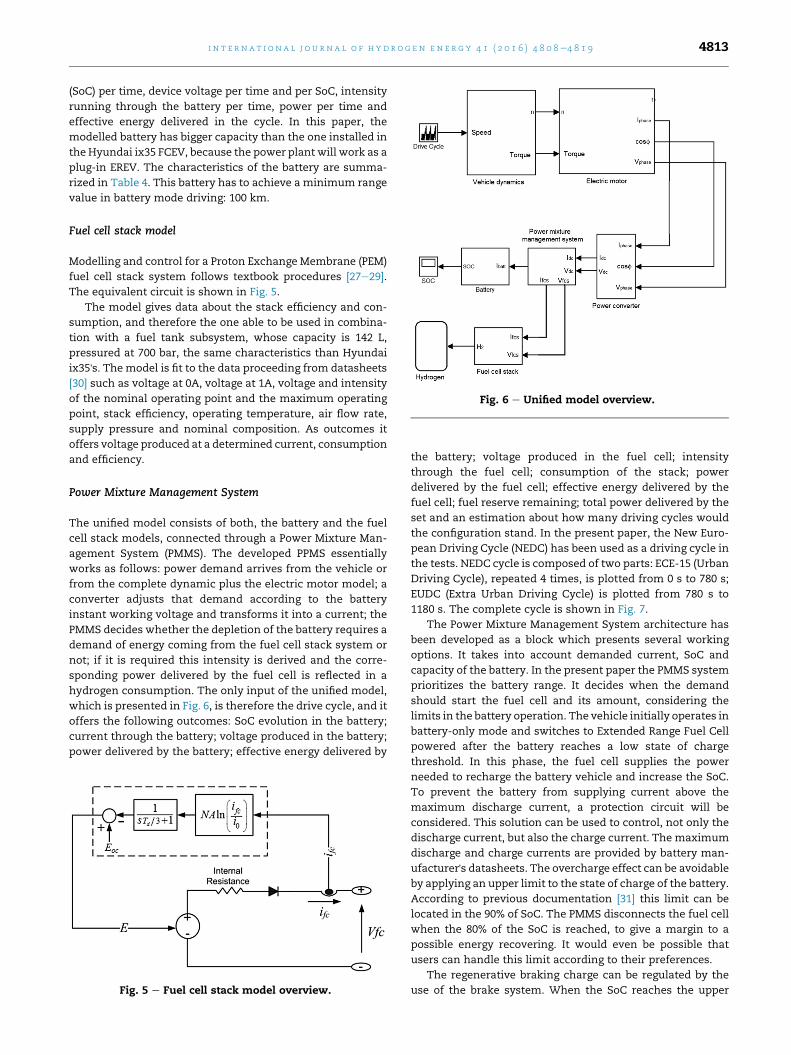
Fig. 6 e Unified model overview.
i n t e r n a t i o n a l j o u r n a l o f h y d r o g e n en e r g y 4 1 ( 2 0 1 6 ) 4 8 0 8e4 8 1 9 4813
(SoC) per time, device voltage per time and per SoC, intensity
running through the battery per time, power per time and
effective energy delivered in the cycle. In this paper, the
modelled battery has bigger capacity than the one installed in
the Hyundai ix35 FCEV, because the power plant will work as a
plug-in EREV. The characteristics of the battery are summa-
rized in Table 4. This battery has to achieve a minimum range
value in battery mode driving: 100 km.
Fuel cell stack model
Modelling and control for a Proton Exchange Membrane (PEM)
fuel cell stack system follows textbook procedures [27e29].
The equivalent circuit is shown in Fig. 5.
The model gives data about the stack efficiency and con-
sumption, and therefore the one able to be used in combina-
tion with a fuel tank subsystem, whose capacity is 142 L,
pressured at 700 bar, the same characteristics than Hyundai
ix35's. Themodel is fit to the data proceeding from datasheets
[30] such as voltage at 0A, voltage at 1A, voltage and intensity
of the nominal operating point and the maximum operating
point, stack efficiency, operating temperature, air flow rate,
supply pressure and nominal composition. As outcomes it
offers voltage produced at a determined current, consumption
and efficiency.
Power Mixture Management System
The unified model consists of both, the battery and the fuel
cell stack models, connected through a Power Mixture Man-
agement System (PMMS). The developed PPMS essentially
works as follows: power demand arrives from the vehicle or
from the complete dynamic plus the electric motor model; a
converter adjusts that demand according to the battery
instant working voltage and transforms it into a current; the
PMMS decides whether the depletion of the battery requires a
demand of energy coming from the fuel cell stack system or
not; if it is required this intensity is derived and the corre-
sponding power delivered by the fuel cell is reflected in a
hydrogen consumption. The only input of the unified model,
which is presented in Fig. 6, is therefore the drive cycle, and it
offers the following outcomes: SoC evolution in the battery;
current through the battery; voltage produced in the battery;
power delivered by the battery; effective energy delivered by
Fig. 5 e Fuel cell stack model overview.
the battery; voltage produced in the fuel cell; intensity
through the fuel cell; consumption of the stack; power
delivered by the fuel cell; effective energy delivered by the
fuel cell; fuel reserve remaining; total power delivered by the
set and an estimation about how many driving cycles would
the configuration stand. In the present paper, the New Euro-
pean Driving Cycle (NEDC) has been used as a driving cycle in
the tests. NEDC cycle is composed of two parts: ECE-15 (Urban
Driving Cycle), repeated 4 times, is plotted from 0 s to 780 s;
EUDC (Extra Urban Driving Cycle) is plotted from 780 s to
1180 s. The complete cycle is shown in Fig. 7.
The Power Mixture Management System architecture has
been developed as a block which presents several working
options. It takes into account demanded current, SoC and
capacity of the battery. In the present paper the PMMS system
prioritizes the battery range. It decides when the demand
should start the fuel cell and its amount, considering the
limits in the battery operation. The vehicle initially operates in
battery-only mode and switches to Extended Range Fuel Cell
powered after the battery reaches a low state of charge
threshold. In this phase, the fuel cell supplies the power
needed to recharge the battery vehicle and increase the SoC.
To prevent the battery from supplying current above the
maximum discharge current, a protection circuit will be
considered. This solution can be used to control, not only the
discharge current, but also the charge current. The maximum
discharge and charge currents are provided by battery man-
ufacturer's datasheets. The overcharge effect can be avoidable
by applying an upper limit to the state of charge of the battery.
According to previous documentation [31] this limit can be
located in the 90% of SoC. The PMMS disconnects the fuel cell
when the 80% of the SoC is reached, to give a margin to a
possible energy recovering. It would even be possible that
users can handle this limit according to their preferences.
The regenerative braking charge can be regulated by the
use of the brake system. When the SoC reaches the upper
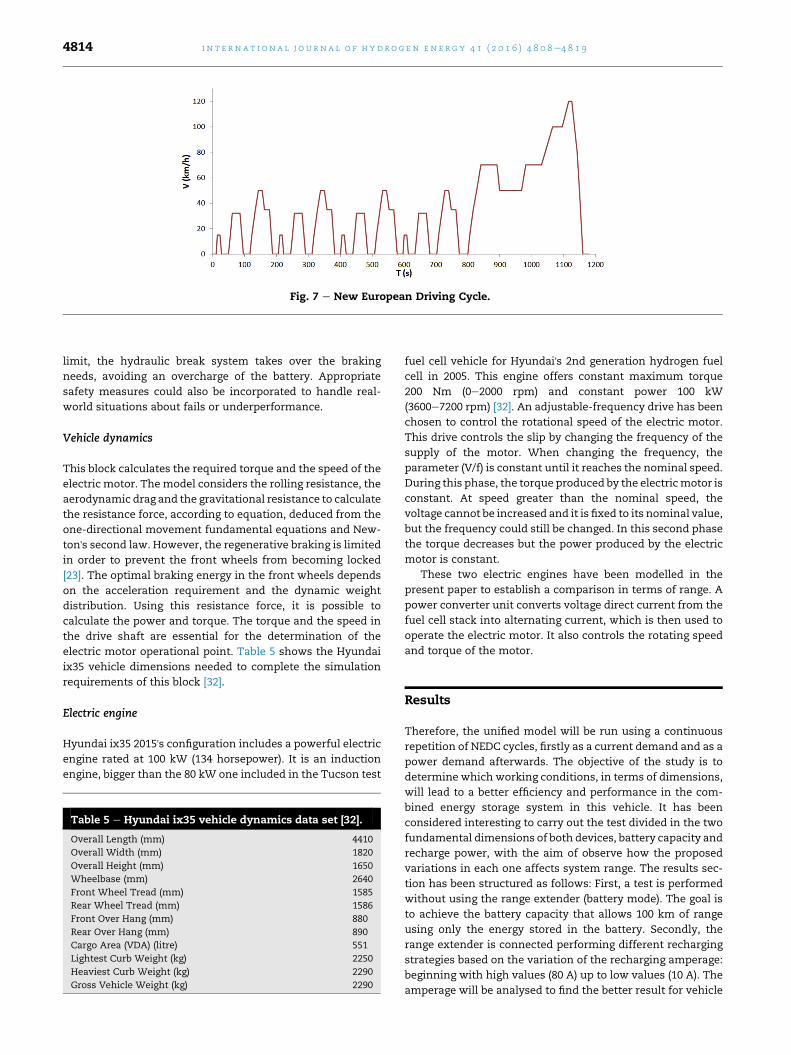
Fig. 7 e New European Driving Cycle.
i n t e rn a t i o n a l j o u r n a l o f h y d r o g e n en e r g y 4 1 ( 2 0 1 6 ) 4 8 0 8e4 8 1 94814
limit, the hydraulic break system takes over the braking
needs, avoiding an overcharge of the battery. Appropriate
safety measures could also be incorporated to handle real-
world situations about fails or underperformance.
Vehicle dynamics
This block calculates the required torque and the speed of the
electric motor. Themodel considers the rolling resistance, the
aerodynamic drag and the gravitational resistance to calculate
the resistance force, according to equation, deduced from the
one-directional movement fundamental equations and New-
ton's second law. However, the regenerative braking is limited
in order to prevent the front wheels from becoming locked
[23]. The optimal braking energy in the front wheels depends
on the acceleration requirement and the dynamic weight
distribution. Using this resistance force, it is possible to
calculate the power and torque. The torque and the speed in
the drive shaft are essential for the determination of the
electric motor operational point. Table 5 shows the Hyundai
ix35 vehicle dimensions needed to complete the simulation
requirements of this block [32].
Electric engine
Hyundai ix35 2015's configuration includes a powerful electric
engine rated at 100 kW (134 horsepower). It is an induction
engine, bigger than the 80 kW one included in the Tucson test
Table 5 e Hyundai ix35 vehicle dynamics data set [32].
Overall Length (mm) 4410
Overall Width (mm) 1820
Overall Height (mm) 1650
Wheelbase (mm) 2640
Front Wheel Tread (mm) 1585
Rear Wheel Tread (mm) 1586
Front Over Hang (mm) 880
Rear Over Hang (mm) 890
Cargo Area (VDA) (litre) 551
Lightest Curb Weight (kg) 2250
Heaviest Curb Weight (kg) 2290
Gross Vehicle Weight (kg) 2290
fuel cell vehicle for Hyundai's 2nd generation hydrogen fuel
cell in 2005. This engine offers constant maximum torque
200 Nm (0e2000 rpm) and constant power 100 kW
(3600e7200 rpm) [32]. An adjustable-frequency drive has been
chosen to control the rotational speed of the electric motor.
This drive controls the slip by changing the frequency of the
supply of the motor. When changing the frequency, the
parameter (V/f) is constant until it reaches the nominal speed.
During this phase, the torque produced by the electricmotor is
constant. At speed greater than the nominal speed, the
voltage cannot be increased and it is fixed to its nominal value,
but the frequency could still be changed. In this second phase
the torque decreases but the power produced by the electric
motor is constant.
These two electric engines have been modelled in the
present paper to establish a comparison in terms of range. A
power converter unit converts voltage direct current from the
fuel cell stack into alternating current, which is then used to
operate the electric motor. It also controls the rotating speed
and torque of the motor.
Results
Therefore, the unified model will be run using a continuous
repetition of NEDC cycles, firstly as a current demand and as a
power demand afterwards. The objective of the study is to
determine which working conditions, in terms of dimensions,
will lead to a better efficiency and performance in the com-
bined energy storage system in this vehicle. It has been
considered interesting to carry out the test divided in the two
fundamental dimensions of both devices, battery capacity and
recharge power, with the aim of observe how the proposed
variations in each one affects system range. The results sec-
tion has been structured as follows: First, a test is performed
without using the range extender (battery mode). The goal is
to achieve the battery capacity that allows 100 km of range
using only the energy stored in the battery. Secondly, the
range extender is connected performing different recharging
strategies based on the variation of the recharging amperage:
beginning with high values (80 A) up to low values (10 A). The
amperage will be analysed to find the better result for vehicle
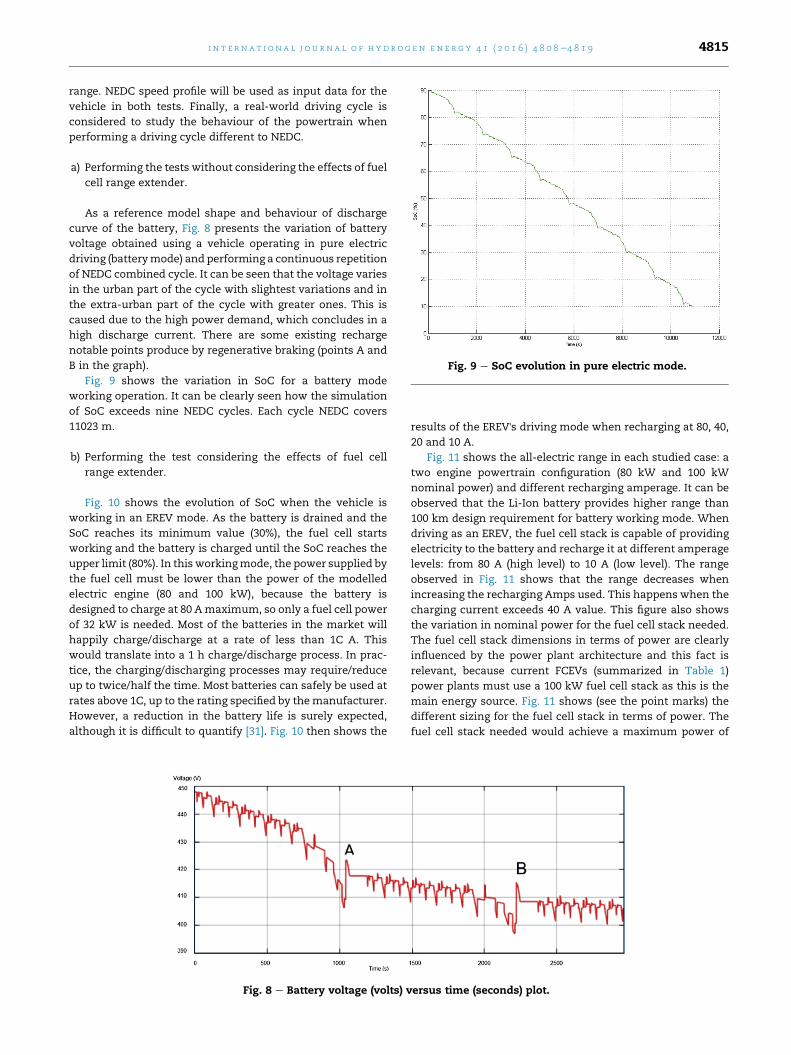
Fig. 9 e SoC evolution in pure electric mode.
i n t e r n a t i o n a l j o u r n a l o f h y d r o g e n en e r g y 4 1 ( 2 0 1 6 ) 4 8 0 8e4 8 1 9 4815
range. NEDC speed profile will be used as input data for the
vehicle in both tests. Finally, a real-world driving cycle is
considered to study the behaviour of the powertrain when
performing a driving cycle different to NEDC.
a) Performing the tests without considering the effects of fuel
cell range extender.
As a reference model shape and behaviour of discharge
curve of the battery, Fig. 8 presents the variation of battery
voltage obtained using a vehicle operating in pure electric
driving (batterymode) and performing a continuous repetition
of NEDC combined cycle. It can be seen that the voltage varies
in the urban part of the cycle with slightest variations and in
the extra-urban part of the cycle with greater ones. This is
caused due to the high power demand, which concludes in a
high discharge current. There are some existing recharge
notable points produce by regenerative braking (points A and
B in the graph).
Fig. 9 shows the variation in SoC for a battery mode
working operation. It can be clearly seen how the simulation
of SoC exceeds nine NEDC cycles. Each cycle NEDC covers
11023 m.
b) Performing the test considering the effects of fuel cell
range extender.
Fig. 10 shows the evolution of SoC when the vehicle is
working in an EREV mode. As the battery is drained and the
SoC reaches its minimum value (30%), the fuel cell starts
working and the battery is charged until the SoC reaches the
upper limit (80%). In this workingmode, the power supplied by
the fuel cell must be lower than the power of the modelled
electric engine (80 and 100 kW), because the battery is
designed to charge at 80 Amaximum, so only a fuel cell power
of 32 kW is needed. Most of the batteries in the market will
happily charge/discharge at a rate of less than 1C A. This
would translate into a 1 h charge/discharge process. In prac-
tice, the charging/discharging processes may require/reduce
up to twice/half the time. Most batteries can safely be used at
rates above 1C, up to the rating specified by themanufacturer.
However, a reduction in the battery life is surely expected,
although it is difficult to quantify [31]. Fig. 10 then shows the
Fig. 8 e Battery voltage (volts) v
results of the EREV's driving mode when recharging at 80, 40,
20 and 10 A.
Fig. 11 shows the all-electric range in each studied case: a
two engine powertrain configuration (80 kW and 100 kW
nominal power) and different recharging amperage. It can be
observed that the Li-Ion battery provides higher range than
100 km design requirement for battery working mode. When
driving as an EREV, the fuel cell stack is capable of providing
electricity to the battery and recharge it at different amperage
levels: from 80 A (high level) to 10 A (low level). The range
observed in Fig. 11 shows that the range decreases when
increasing the recharging Amps used. This happens when the
charging current exceeds 40 A value. This figure also shows
the variation in nominal power for the fuel cell stack needed.
The fuel cell stack dimensions in terms of power are clearly
influenced by the power plant architecture and this fact is
relevant, because current FCEVs (summarized in Table 1)
power plants must use a 100 kW fuel cell stack as this is the
main energy source. Fig. 11 shows (see the point marks) the
different sizing for the fuel cell stack in terms of power. The
fuel cell stack needed would achieve a maximum power of
ersus time (seconds) plot.
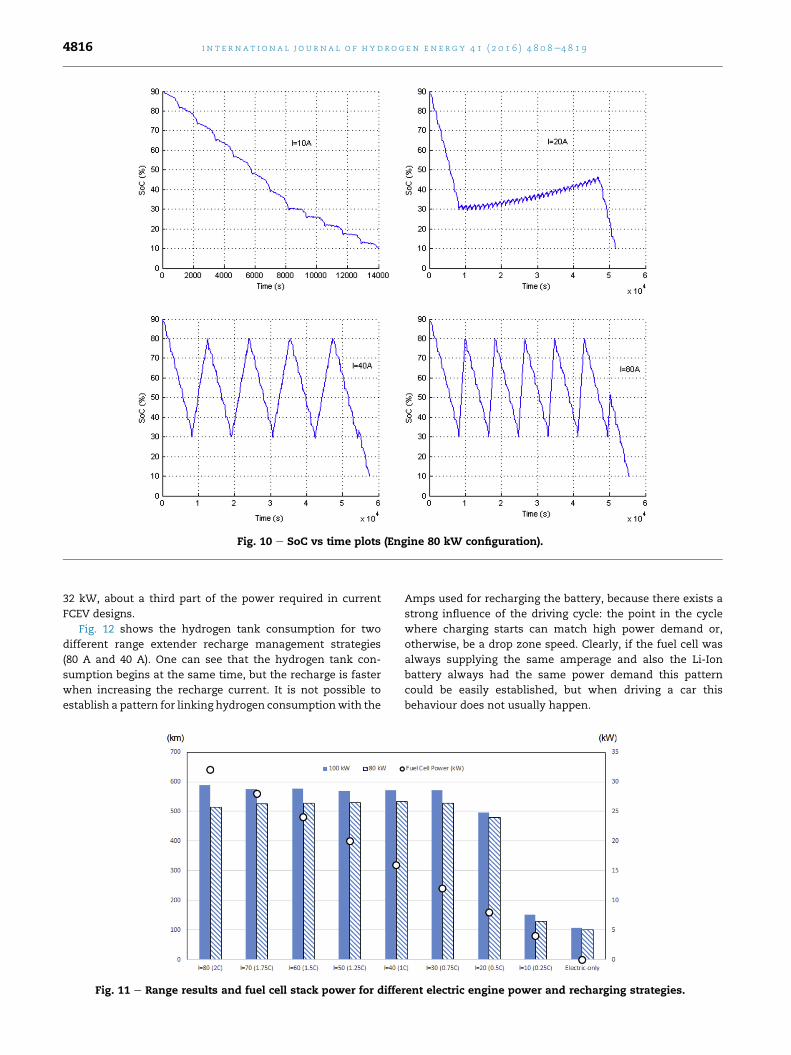
Fig. 10 e SoC vs time plots (Engine 80 kW configuration).
i n t e rn a t i o n a l j o u r n a l o f h y d r o g e n en e r g y 4 1 ( 2 0 1 6 ) 4 8 0 8e4 8 1 94816
32 kW, about a third part of the power required in current
FCEV designs.
Fig. 12 shows the hydrogen tank consumption for two
different range extender recharge management strategies
(80 A and 40 A). One can see that the hydrogen tank con-
sumption begins at the same time, but the recharge is faster
when increasing the recharge current. It is not possible to
establish a pattern for linking hydrogen consumptionwith the
Fig. 11 e Range results and fuel cell stack power for diffe
Amps used for recharging the battery, because there exists a
strong influence of the driving cycle: the point in the cycle
where charging starts can match high power demand or,
otherwise, be a drop zone speed. Clearly, if the fuel cell was
always supplying the same amperage and also the Li-Ion
battery always had the same power demand this pattern
could be easily established, but when driving a car this
behaviour does not usually happen.
rent electric engine power and recharging strategies.
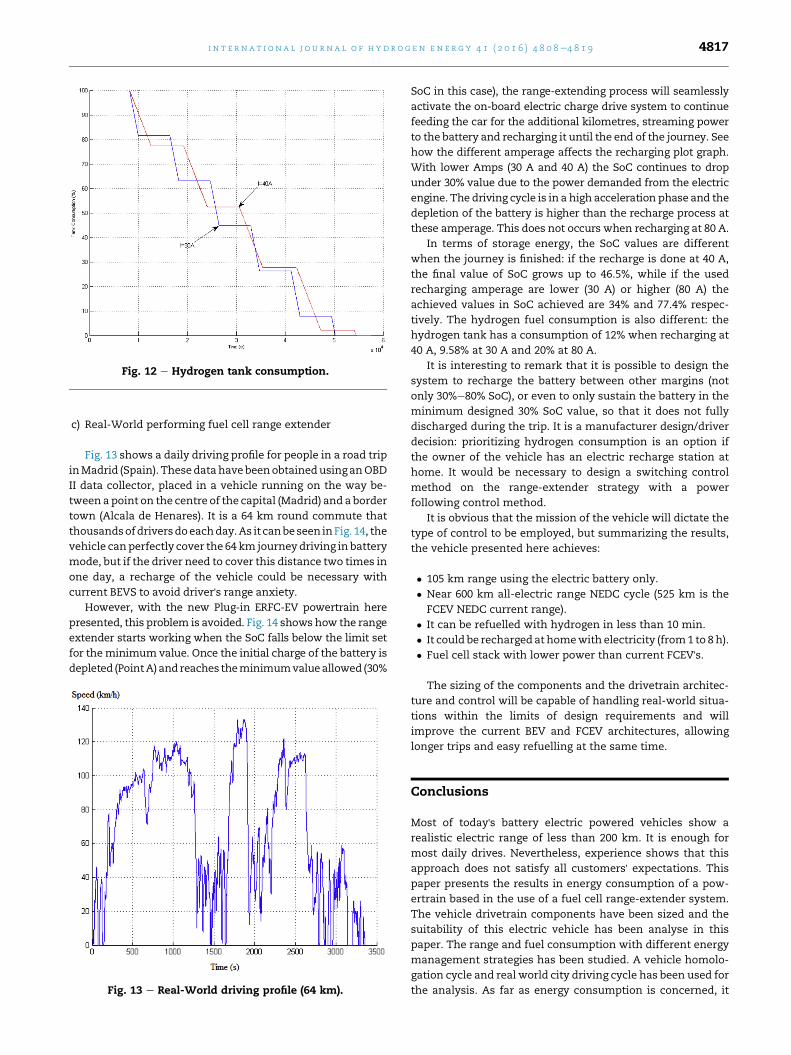
Fig. 12 e Hydrogen tank consumption.
i n t e r n a t i o n a l j o u r n a l o f h y d r o g e n en e r g y 4 1 ( 2 0 1 6 ) 4 8 0 8e4 8 1 9 4817
c) Real-World performing fuel cell range extender
Fig. 13 shows a daily driving profile for people in a road trip
inMadrid (Spain). ThesedatahavebeenobtainedusinganOBD
II data collector, placed in a vehicle running on the way be-
tween a point on the centre of the capital (Madrid) and a border
town (Alcala de Henares). It is a 64 km round commute that
thousandsofdriversdoeachday.As it canbeseen inFig. 14, the
vehicle canperfectly cover the 64 km journeydriving in battery
mode, but if the driver need to cover this distance two times in
one day, a recharge of the vehicle could be necessary with
current BEVS to avoid driver's range anxiety.
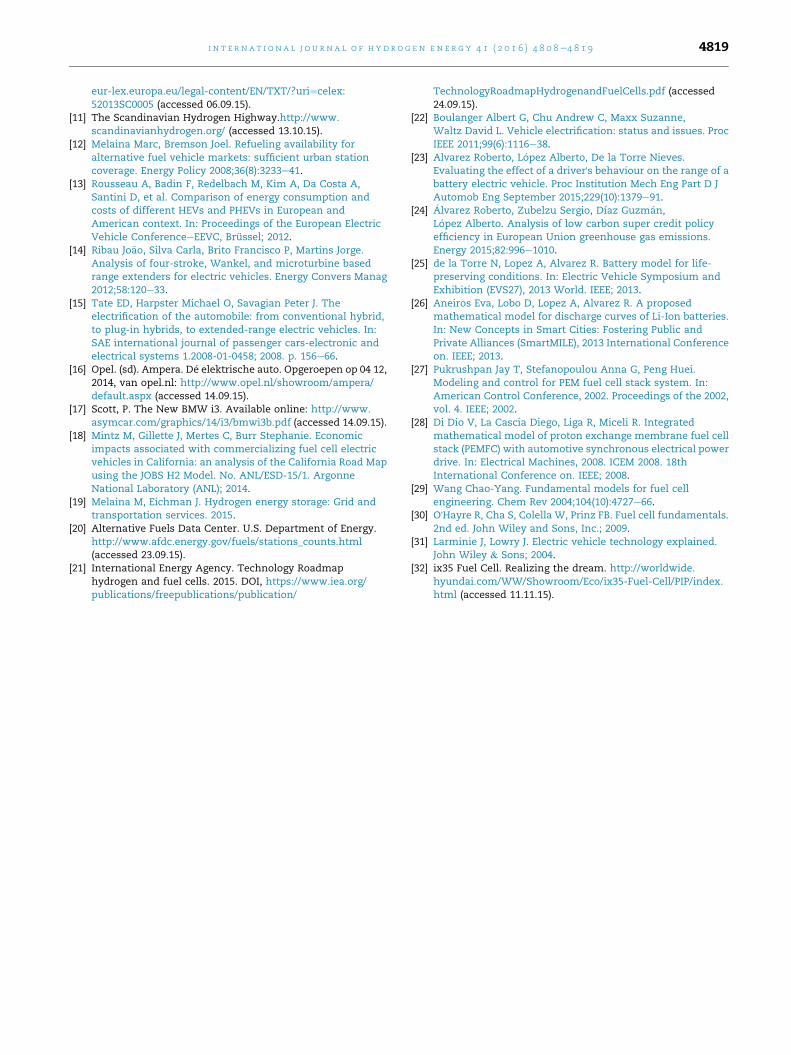
However, with the new Plug-in ERFC-EV powertrain here
presented, this problem is avoided. Fig. 14 shows how the range
extender starts working when the SoC falls below the limit set
for theminimum value. Once the initial charge of the battery is
depleted (PointA)and reaches theminimumvalueallowed (30%
Fig. 13 e Real-World driving profile (64 km).
SoC in this case), the range-extending process will seamlessly
activate the on-board electric charge drive system to continue
feeding the car for the additional kilometres, streaming power
to the battery and recharging it until the end of the journey. See
how the different amperage affects the recharging plot graph.
With lower Amps (30 A and 40 A) the SoC continues to drop
under 30% value due to the power demanded from the electric
engine. The driving cycle is in a high acceleration phase and the
depletion of the battery is higher than the recharge process at
these amperage. This does not occurs when recharging at 80 A.
In terms of storage energy, the SoC values are different
when the journey is finished: if the recharge is done at 40 A,
the final value of SoC grows up to 46.5%, while if the used
recharging amperage are lower (30 A) or higher (80 A) the
achieved values in SoC achieved are 34% and 77.4% respec-
tively. The hydrogen fuel consumption is also different: the
hydrogen tank has a consumption of 12% when recharging at
40 A, 9.58% at 30 A and 20% at 80 A.
It is interesting to remark that it is possible to design the
system to recharge the battery between other margins (not
only 30%e80% SoC), or even to only sustain the battery in the
minimum designed 30% SoC value, so that it does not fully
discharged during the trip. It is a manufacturer design/driver
decision: prioritizing hydrogen consumption is an option if
the owner of the vehicle has an electric recharge station at
home. It would be necessary to design a switching control
method on the range-extender strategy with a power
following control method.
It is obvious that the mission of the vehicle will dictate the
type of control to be employed, but summarizing the results,
the vehicle presented here achieves:
� 105 km range using the electric battery only.
� Near 600 km all-electric range NEDC cycle (525 km is the
FCEV NEDC current range).
� It can be refuelled with hydrogen in less than 10 min.
� It could be rechargedat homewith electricity (from1 to 8 h).
� Fuel cell stack with lower power than current FCEV's.
The sizing of the components and the drivetrain architec-
ture and control will be capable of handling real-world situa-
tions within the limits of design requirements and will
improve the current BEV and FCEV architectures, allowing
longer trips and easy refuelling at the same time.
Conclusions
Most of today's battery electric powered vehicles show a
realistic electric range of less than 200 km. It is enough for
most daily drives. Nevertheless, experience shows that this
approach does not satisfy all customers' expectations. Thispaper presents the results in energy consumption of a pow-
ertrain based in the use of a fuel cell range-extender system.
The vehicle drivetrain components have been sized and the
suitability of this electric vehicle has been analyse in this
paper. The range and fuel consumption with different energy
management strategies has been studied. A vehicle homolo-
gation cycle and real world city driving cycle has been used for
the analysis. As far as energy consumption is concerned, it
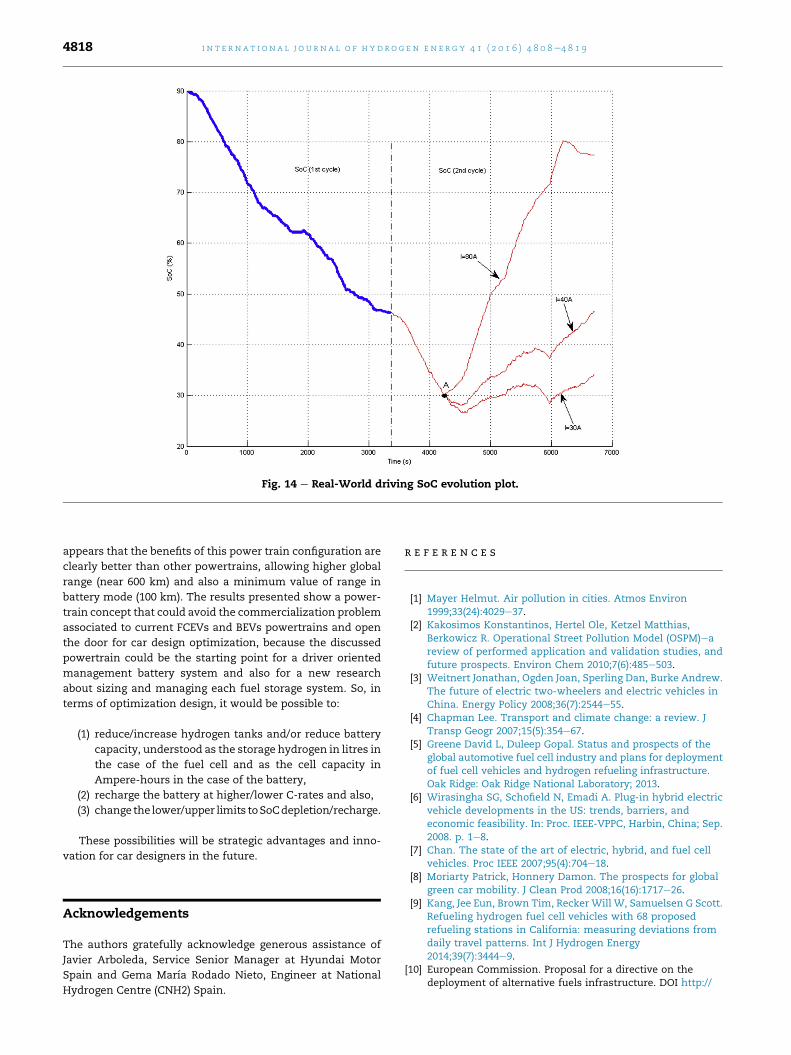
Fig. 14 e Real-World driving SoC evolution plot.
i n t e rn a t i o n a l j o u r n a l o f h y d r o g e n en e r g y 4 1 ( 2 0 1 6 ) 4 8 0 8e4 8 1 94818
appears that the benefits of this power train configuration are
clearly better than other powertrains, allowing higher global
range (near 600 km) and also a minimum value of range in
battery mode (100 km). The results presented show a power-
train concept that could avoid the commercialization problem
associated to current FCEVs and BEVs powertrains and open
the door for car design optimization, because the discussed
powertrain could be the starting point for a driver oriented
management battery system and also for a new research
about sizing and managing each fuel storage system. So, in
terms of optimization design, it would be possible to:
(1) reduce/increase hydrogen tanks and/or reduce battery
capacity, understood as the storage hydrogen in litres in
the case of the fuel cell and as the cell capacity in
Ampere-hours in the case of the battery,
(2) recharge the battery at higher/lower C-rates and also,
(3) change the lower/upper limits toSoCdepletion/recharge.
These possibilities will be strategic advantages and inno-
vation for car designers in the future.
Acknowledgements
The authors gratefully acknowledge generous assistance of
Javier Arboleda, Service Senior Manager at Hyundai Motor
Spain and Gema Marıa Rodado Nieto, Engineer at National
Hydrogen Centre (CNH2) Spain.
r e f e r e n c e s
[1] Mayer Helmut. Air pollution in cities. Atmos Environ1999;33(24):4029e37.
[2] Kakosimos Konstantinos, Hertel Ole, Ketzel Matthias,Berkowicz R. Operational Street Pollution Model (OSPM)eareview of performed application and validation studies, andfuture prospects. Environ Chem 2010;7(6):485e503.
[3] Weitnert Jonathan, Ogden Joan, Sperling Dan, Burke Andrew.The future of electric two-wheelers and electric vehicles inChina. Energy Policy 2008;36(7):2544e55.
[4] Chapman Lee. Transport and climate change: a review. JTransp Geogr 2007;15(5):354e67.
[5] Greene David L, Duleep Gopal. Status and prospects of theglobal automotive fuel cell industry and plans for deploymentof fuel cell vehicles and hydrogen refueling infrastructure.Oak Ridge: Oak Ridge National Laboratory; 2013.
[6] Wirasingha SG, Schofield N, Emadi A. Plug-in hybrid electricvehicle developments in the US: trends, barriers, andeconomic feasibility. In: Proc. IEEE-VPPC, Harbin, China; Sep.2008. p. 1e8.
[7] Chan. The state of the art of electric, hybrid, and fuel cellvehicles. Proc IEEE 2007;95(4):704e18.
[8] Moriarty Patrick, Honnery Damon. The prospects for globalgreen car mobility. J Clean Prod 2008;16(16):1717e26.
[9] Kang, Jee Eun, Brown Tim, Recker Will W, Samuelsen G Scott.Refueling hydrogen fuel cell vehicles with 68 proposedrefueling stations in California: measuring deviations fromdaily travel patterns. Int J Hydrogen Energy2014;39(7):3444e9.
[10] European Commission. Proposal for a directive on thedeployment of alternative fuels infrastructure. DOI http://
i n t e r n a t i o n a l j o u r n a l o f h y d r o g e n en e r g y 4 1 ( 2 0 1 6 ) 4 8 0 8e4 8 1 9 4819
eur-lex.europa.eu/legal-content/EN/TXT/?uri¼celex:52013SC0005 (accessed 06.09.15).
[11] The Scandinavian Hydrogen Highway.http://www.scandinavianhydrogen.org/ (accessed 13.10.15).
[12] Melaina Marc, Bremson Joel. Refueling availability foralternative fuel vehicle markets: sufficient urban stationcoverage. Energy Policy 2008;36(8):3233e41.
[13] Rousseau A, Badin F, Redelbach M, Kim A, Da Costa A,Santini D, et al. Comparison of energy consumption andcosts of different HEVs and PHEVs in European andAmerican context. In: Proceedings of the European ElectricVehicle ConferenceeEEVC, Brussel; 2012.
[14] Ribau Jo~ao, Silva Carla, Brito Francisco P, Martins Jorge.Analysis of four-stroke, Wankel, and microturbine basedrange extenders for electric vehicles. Energy Convers Manag2012;58:120e33.
[15] Tate ED, Harpster Michael O, Savagian Peter J. Theelectrification of the automobile: from conventional hybrid,to plug-in hybrids, to extended-range electric vehicles. In:SAE international journal of passenger cars-electronic andelectrical systems 1.2008-01-0458; 2008. p. 156e66.
[16] Opel. (sd). Ampera. D�e elektrische auto. Opgeroepen op 04 12,2014, van opel.nl: http://www.opel.nl/showroom/ampera/default.aspx (accessed 14.09.15).
[17] Scott, P. The New BMW i3. Available online: http://www.asymcar.com/graphics/14/i3/bmwi3b.pdf (accessed 14.09.15).
[18] Mintz M, Gillette J, Mertes C, Burr Stephanie. Economicimpacts associated with commercializing fuel cell electricvehicles in California: an analysis of the California Road Mapusing the JOBS H2 Model. No. ANL/ESD-15/1. ArgonneNational Laboratory (ANL); 2014.
[19] Melaina M, Eichman J. Hydrogen energy storage: Grid andtransportation services. 2015.
[20] Alternative Fuels Data Center. U.S. Department of Energy.http://www.afdc.energy.gov/fuels/stations_counts.html(accessed 23.09.15).
[21] International Energy Agency. Technology Roadmaphydrogen and fuel cells. 2015. DOI, https://www.iea.org/publications/freepublications/publication/
TechnologyRoadmapHydrogenandFuelCells.pdf (accessed24.09.15).
[22] Boulanger Albert G, Chu Andrew C, Maxx Suzanne,Waltz David L. Vehicle electrification: status and issues. ProcIEEE 2011;99(6):1116e38.
[23] Alvarez Roberto, L�opez Alberto, De la Torre Nieves.Evaluating the effect of a driver's behaviour on the range of abattery electric vehicle. Proc Institution Mech Eng Part D JAutomob Eng September 2015;229(10):1379e91.
[24] �Alvarez Roberto, Zubelzu Sergio, Dıaz Guzm�an,L�opez Alberto. Analysis of low carbon super credit policyefficiency in European Union greenhouse gas emissions.Energy 2015;82:996e1010.
[25] de la Torre N, Lopez A, Alvarez R. Battery model for life-preserving conditions. In: Electric Vehicle Symposium andExhibition (EVS27), 2013 World. IEEE; 2013.
[26] Aneiros Eva, Lobo D, Lopez A, Alvarez R. A proposedmathematical model for discharge curves of Li-Ion batteries.In: New Concepts in Smart Cities: Fostering Public andPrivate Alliances (SmartMILE), 2013 International Conferenceon. IEEE; 2013.
[27] Pukrushpan Jay T, Stefanopoulou Anna G, Peng Huei.Modeling and control for PEM fuel cell stack system. In:American Control Conference, 2002. Proceedings of the 2002,vol. 4. IEEE; 2002.
[28] Di Dio V, La Cascia Diego, Liga R, Miceli R. Integratedmathematical model of proton exchange membrane fuel cellstack (PEMFC) with automotive synchronous electrical powerdrive. In: Electrical Machines, 2008. ICEM 2008. 18thInternational Conference on. IEEE; 2008.
[29] Wang Chao-Yang. Fundamental models for fuel cellengineering. Chem Rev 2004;104(10):4727e66.
[30] O'Hayre R, Cha S, Colella W, Prinz FB. Fuel cell fundamentals.2nd ed. John Wiley and Sons, Inc.; 2009.
[31] Larminie J, Lowry J. Electric vehicle technology explained.John Wiley & Sons; 2004.
[32] ix35 Fuel Cell. Realizing the dream. http://worldwide.hyundai.com/WW/Showroom/Eco/ix35-Fuel-Cell/PIP/index.html (accessed 11.11.15).

本文献由“学霸图书馆-文献云下载”收集自网络,仅供学习交流使用。
学霸图书馆(www.xuebalib.com)是一个“整合众多图书馆数据库资源,
提供一站式文献检索和下载服务”的24 小时在线不限IP
图书馆。
图书馆致力于便利、促进学习与科研,提供最强文献下载服务。
图书馆导航:
图书馆首页 文献云下载 图书馆入口 外文数据库大全 疑难文献辅助工具