Embed Size (px)
Citation preview
A New Approach for On-site Calibration of Voltage Transformers
Florian Predl, Dr. Michael Krüger, OMICRON, Austria Michael Freiburg, TU Dortmund University, Germany
1. Introduction Voltage transformers (VT) are used in electrical grids for metering and/or protection purposes. The high requirements regarding their precision demand a calibration of the objects before installation. The accuracy classes of VT are different for protection and metering transformers and are classified depending on the maximum ratio and phase-angle error between the vectors of the primary voltage and the secondary voltage related to the primary side. This calibration is performed in the laboratories of the manufacturers, operators or testing institutes. Once calibrated, the VT typically operates without re-calibration for its lifetime. In some cases, e.g. reconstruction of the switchyard, the accuracy of the VT is reconfirmed with a laboratory test or extensive on-site measurements. The accuracy of the VT is dependent on the leakage inductance, the winding resistance, the turns ratio and the excitation current at power frequency. Core or winding deformation as a result of external influences and ageing in general for example can thus result in a change of the error of the VT. In addition it may be interesting to obtain the excitation characteristics of the VT out of field measurements for ferroresonance analysis or simulation programs.
1. Accuracy requirements for voltage transformers International standards specifying the accuracy definition and its limitation for conventional voltage transformers such as
- IEC 60044-2 for inductive voltage transformers - IEC 60044-5 for capacitive voltage transformers - IEC 61869-3 additional requirements for inductive voltage transformer (reworked version of IEC
60044-2) - IEC 61869-5 additional requirements for capacitive voltage transformers (reworked version of IEC
60044-5) - IEEE C57.13 standard requirements for instrument transformers - ANSI C93.1 requirements for power-line carrier coupling capacitors and coupling capacitor voltage
transformers (CCVT) Above standards require a certain amount of operating points where the voltage transformer has to fulfill the specified accuracy requirements. For metering windings the voltage ratio error and phase displacement is specified in between 80% to 120% of the rated primary voltage and from 25% to 100% of the rated secondary burden. In addition for class 0.1 and 0.2 having a rated burden of 10VA or lower, the current ratio error and phase displacements is defined even for 0VA, representing an open circuit. For protection windings the voltage ratio error and phase displacement is specified even from 2% up to 100%*Fv of the rated primary voltage, whereas Fv is the rated voltage factor and can be specified up to 1.9 times of rated primary voltage. The burden range is specified from 25% to 100% of rated burden. Furthermore for voltage transformers having more than one secondary winding the class specification has to be fulfilled while other windings have to be treated as both, as open circuit (0VA) and loaded with 100% rated burden under consideration of the defined total simultaneous burden.
2. Testing of VTs in the field Against this background it is very helpful to have the opportunity to get information about the accuracy class out of field measurements. Until now, precise testing of VTs was a major undertaking. Highly accurate measurement solutions are complex systems, made up of various devices that are calibrated and extremely accurate. This includes a high-voltage source, a reference transformer, a set of standard burdens, measuring bridges for comparative purposes, and a computer to evaluate all of the measured data. The time and costs involved are immense, both for on-site tests and during the manufacturing. Smaller testing solutions typically lack the necessary accuracy or are incapable of taking all of the different burdens into account. Therefore, OMICRON has developed a new way of testing VTs.
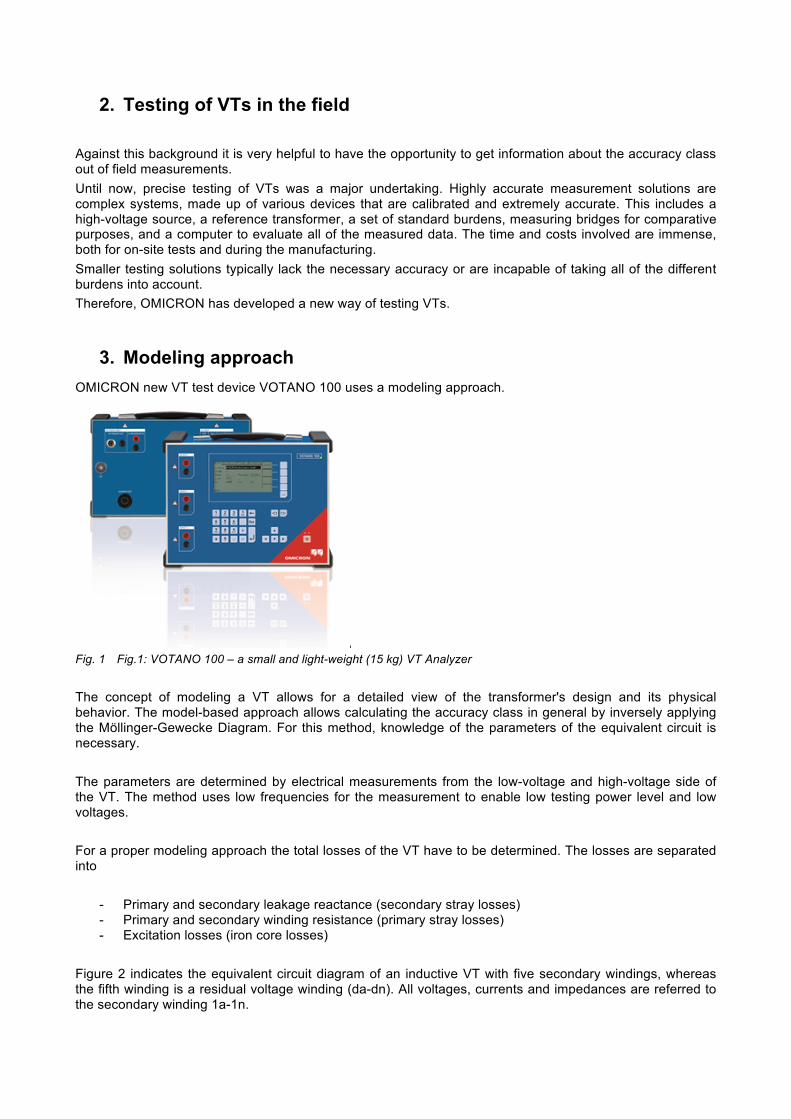
3. Modeling approach OMICRON new VT test device VOTANO 100 uses a modeling approach.
Fig. 1 Fig.1: VOTANO 100 – a small and light-weight (15 kg) VT Analyzer The concept of modeling a VT allows for a detailed view of the transformer's design and its physical behavior. The model-based approach allows calculating the accuracy class in general by inversely applying the Möllinger-Gewecke Diagram. For this method, knowledge of the parameters of the equivalent circuit is necessary. The parameters are determined by electrical measurements from the low-voltage and high-voltage side of the VT. The method uses low frequencies for the measurement to enable low testing power level and low voltages. For a proper modeling approach the total losses of the VT have to be determined. The losses are separated into
- Primary and secondary leakage reactance (secondary stray losses) - Primary and secondary winding resistance (primary stray losses) - Excitation losses (iron core losses)
Figure 2 indicates the equivalent circuit diagram of an inductive VT with five secondary windings, whereas the fifth winding is a residual voltage winding (da-dn). All voltages, currents and impedances are referred to the secondary winding 1a-1n.
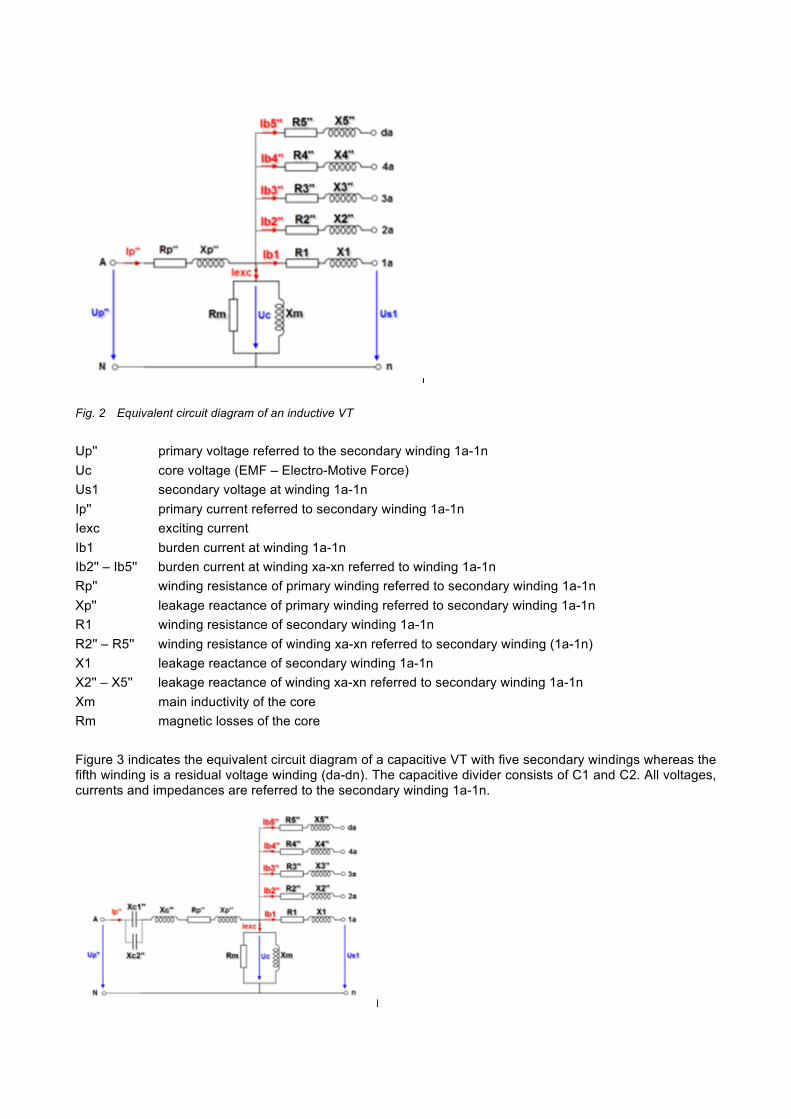
Fig. 2 Equivalent circuit diagram of an inductive VT Up'' primary voltage referred to the secondary winding 1a-1n Uc core voltage (EMF – Electro-Motive Force) Us1 secondary voltage at winding 1a-1n Ip'' primary current referred to secondary winding 1a-1n Iexc exciting current Ib1 burden current at winding 1a-1n Ib2'' – Ib5'' burden current at winding xa-xn referred to winding 1a-1n Rp'' winding resistance of primary winding referred to secondary winding 1a-1n Xp'' leakage reactance of primary winding referred to secondary winding 1a-1n R1 winding resistance of secondary winding 1a-1n R2'' – R5'' winding resistance of winding xa-xn referred to secondary winding (1a-1n) X1 leakage reactance of secondary winding 1a-1n X2'' – X5'' leakage reactance of winding xa-xn referred to secondary winding 1a-1n Xm main inductivity of the core Rm magnetic losses of the core Figure 3 indicates the equivalent circuit diagram of a capacitive VT with five secondary windings whereas the fifth winding is a residual voltage winding (da-dn). The capacitive divider consists of C1 and C2. All voltages, currents and impedances are referred to the secondary winding 1a-1n.
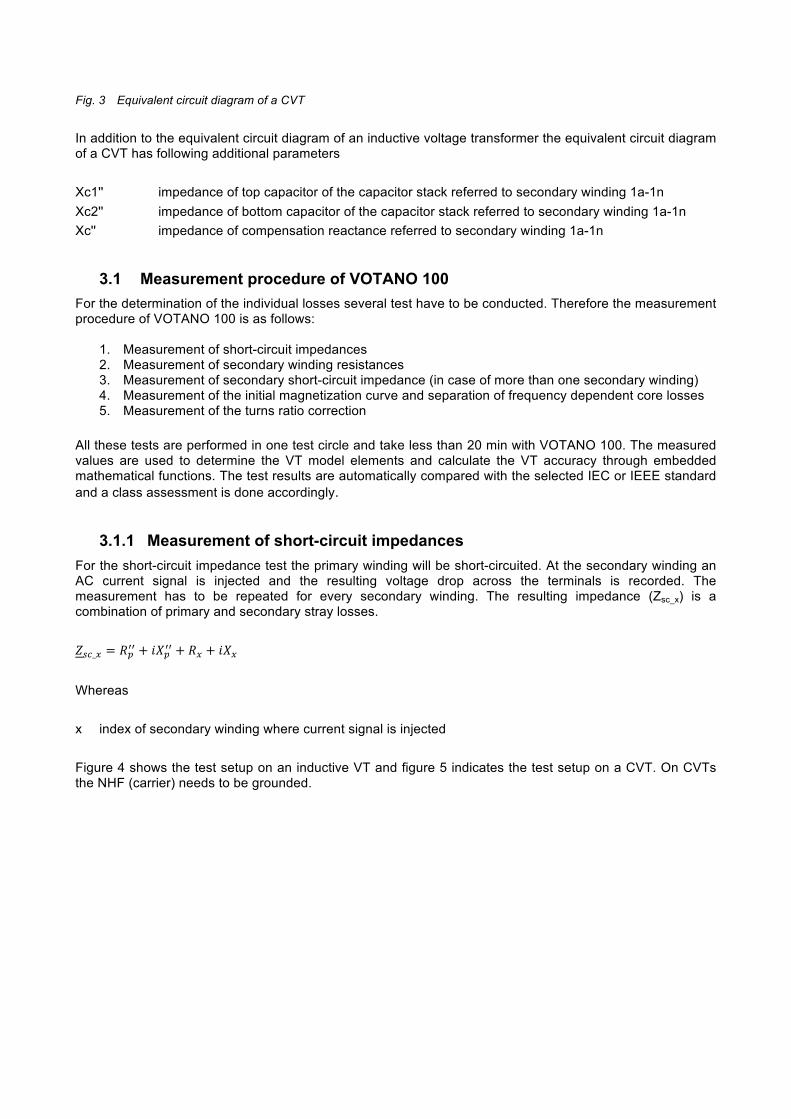
Fig. 3 Equivalent circuit diagram of a CVT In addition to the equivalent circuit diagram of an inductive voltage transformer the equivalent circuit diagram of a CVT has following additional parameters Xc1'' impedance of top capacitor of the capacitor stack referred to secondary winding 1a-1n Xc2'' impedance of bottom capacitor of the capacitor stack referred to secondary winding 1a-1n Xc'' impedance of compensation reactance referred to secondary winding 1a-1n
3.1 Measurement procedure of VOTANO 100 For the determination of the individual losses several test have to be conducted. Therefore the measurement procedure of VOTANO 100 is as follows:
1. Measurement of short-circuit impedances 2. Measurement of secondary winding resistances 3. Measurement of secondary short-circuit impedance (in case of more than one secondary winding) 4. Measurement of the initial magnetization curve and separation of frequency dependent core losses 5. Measurement of the turns ratio correction
All these tests are performed in one test circle and take less than 20 min with VOTANO 100. The measured values are used to determine the VT model elements and calculate the VT accuracy through embedded mathematical functions. The test results are automatically compared with the selected IEC or IEEE standard and a class assessment is done accordingly.
3.1.1 Measurement of short-circuit impedances For the short-circuit impedance test the primary winding will be short-circuited. At the secondary winding an AC current signal is injected and the resulting voltage drop across the terminals is recorded. The measurement has to be repeated for every secondary winding. The resulting impedance (Zsc_x) is a combination of primary and secondary stray losses. 𝑍!"_! = 𝑅!!! + 𝑖𝑋!!! + 𝑅! + 𝑖𝑋! Whereas x index of secondary winding where current signal is injected Figure 4 shows the test setup on an inductive VT and figure 5 indicates the test setup on a CVT. On CVTs the NHF (carrier) needs to be grounded.
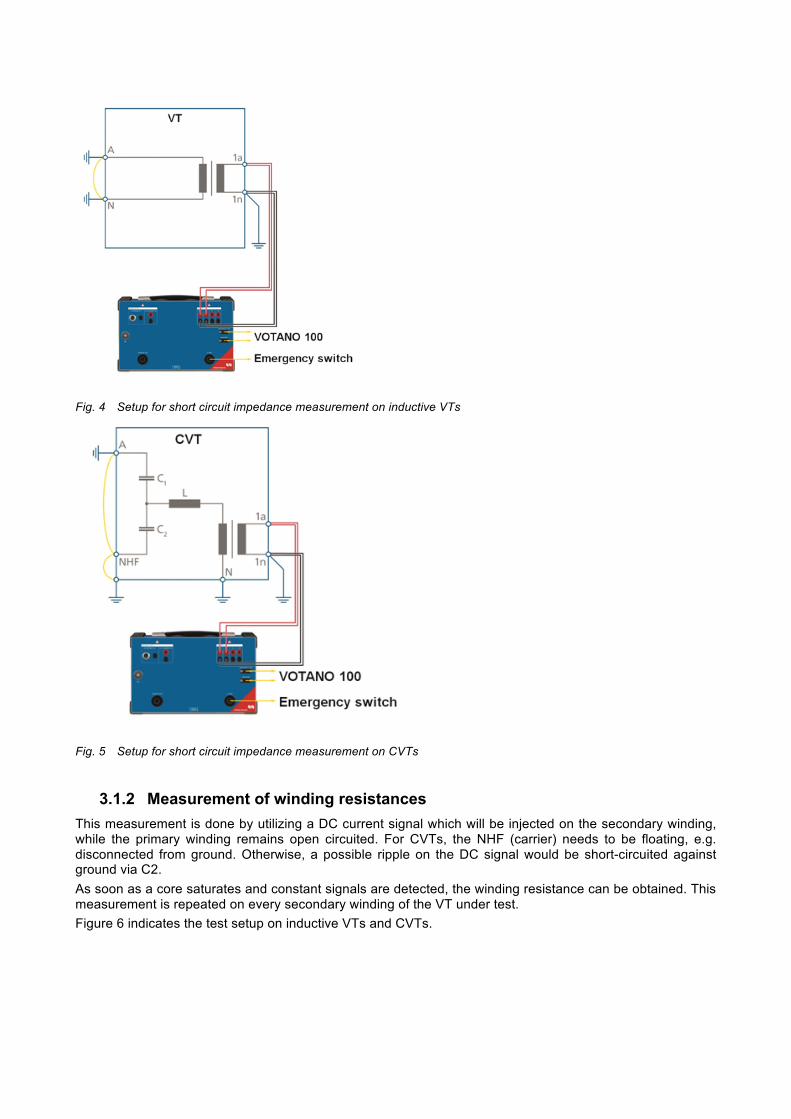
Fig. 4 Setup for short circuit impedance measurement on inductive VTs
Fig. 5 Setup for short circuit impedance measurement on CVTs
3.1.2 Measurement of winding resistances This measurement is done by utilizing a DC current signal which will be injected on the secondary winding, while the primary winding remains open circuited. For CVTs, the NHF (carrier) needs to be floating, e.g. disconnected from ground. Otherwise, a possible ripple on the DC signal would be short-circuited against ground via C2. As soon as a core saturates and constant signals are detected, the winding resistance can be obtained. This measurement is repeated on every secondary winding of the VT under test. Figure 6 indicates the test setup on inductive VTs and CVTs.
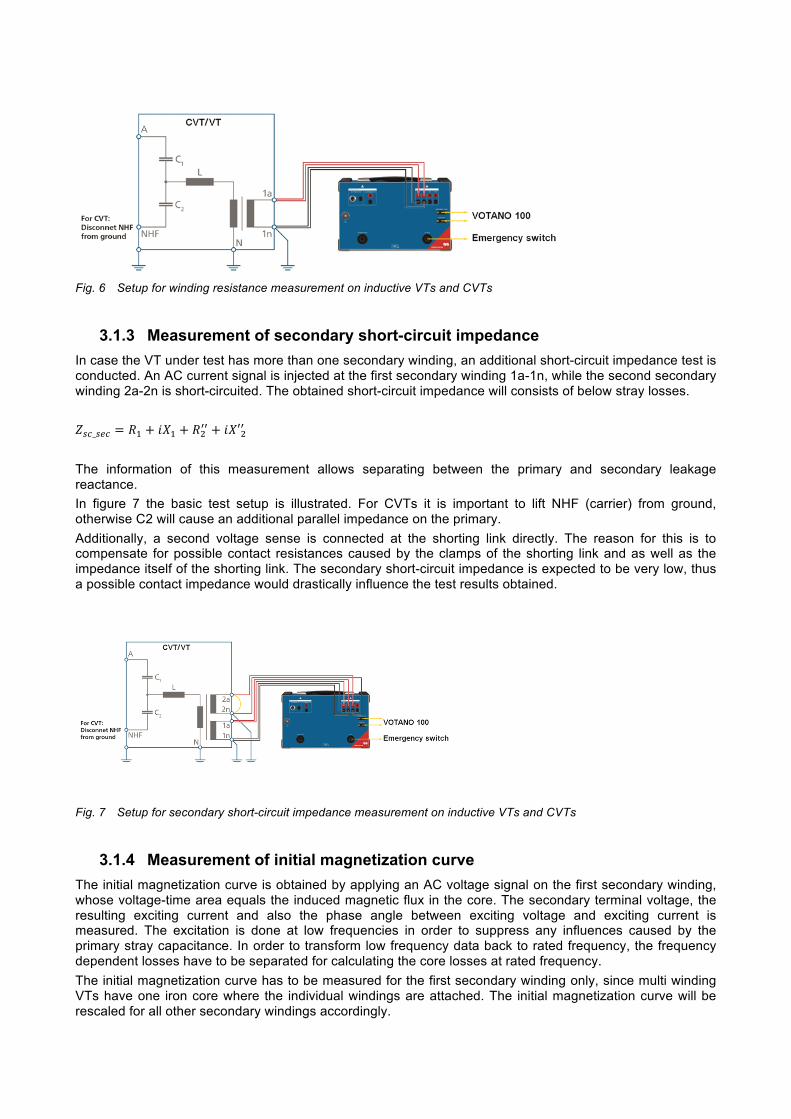
Fig. 6 Setup for winding resistance measurement on inductive VTs and CVTs
3.1.3 Measurement of secondary short-circuit impedance In case the VT under test has more than one secondary winding, an additional short-circuit impedance test is conducted. An AC current signal is injected at the first secondary winding 1a-1n, while the second secondary winding 2a-2n is short-circuited. The obtained short-circuit impedance will consists of below stray losses. 𝑍!"_!"# = 𝑅! + 𝑖𝑋! + 𝑅!!! + 𝑖𝑋′!! The information of this measurement allows separating between the primary and secondary leakage reactance. In figure 7 the basic test setup is illustrated. For CVTs it is important to lift NHF (carrier) from ground, otherwise C2 will cause an additional parallel impedance on the primary. Additionally, a second voltage sense is connected at the shorting link directly. The reason for this is to compensate for possible contact resistances caused by the clamps of the shorting link and as well as the impedance itself of the shorting link. The secondary short-circuit impedance is expected to be very low, thus a possible contact impedance would drastically influence the test results obtained.
Fig. 7 Setup for secondary short-circuit impedance measurement on inductive VTs and CVTs
3.1.4 Measurement of initial magnetization curve The initial magnetization curve is obtained by applying an AC voltage signal on the first secondary winding, whose voltage-time area equals the induced magnetic flux in the core. The secondary terminal voltage, the resulting exciting current and also the phase angle between exciting voltage and exciting current is measured. The excitation is done at low frequencies in order to suppress any influences caused by the primary stray capacitance. In order to transform low frequency data back to rated frequency, the frequency dependent losses have to be separated for calculating the core losses at rated frequency. The initial magnetization curve has to be measured for the first secondary winding only, since multi winding VTs have one iron core where the individual windings are attached. The initial magnetization curve will be rescaled for all other secondary windings accordingly.
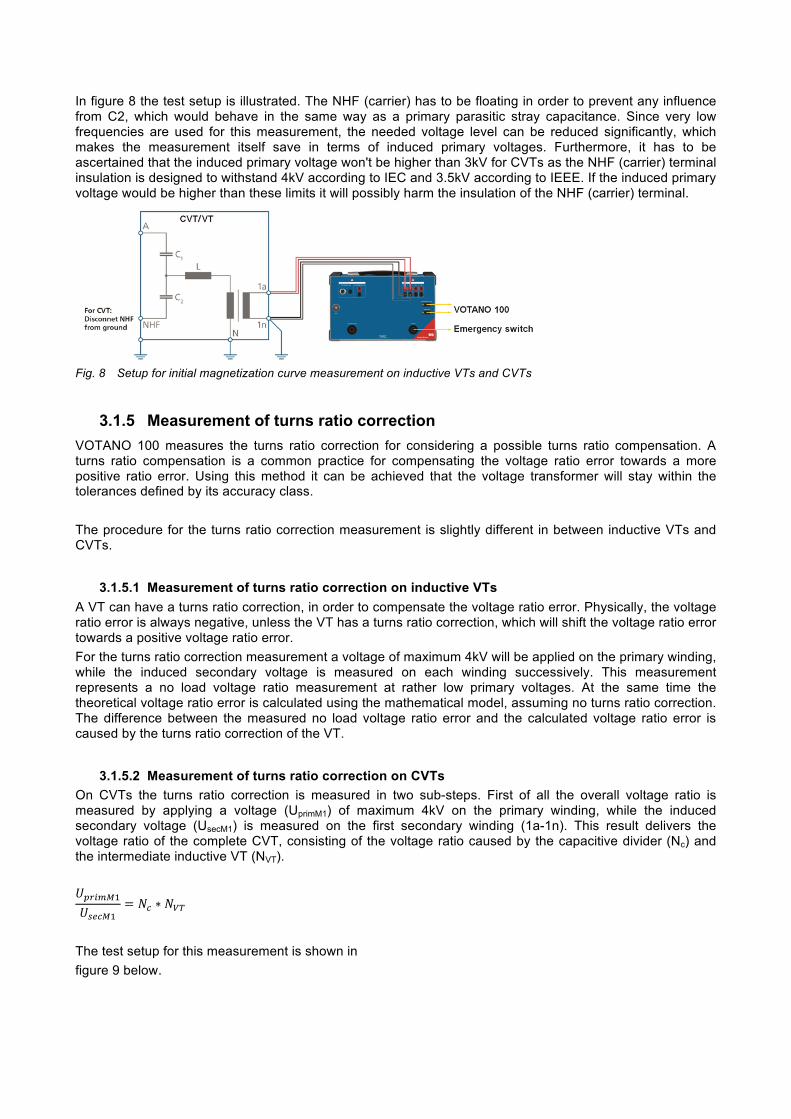
In figure 8 the test setup is illustrated. The NHF (carrier) has to be floating in order to prevent any influence from C2, which would behave in the same way as a primary parasitic stray capacitance. Since very low frequencies are used for this measurement, the needed voltage level can be reduced significantly, which makes the measurement itself save in terms of induced primary voltages. Furthermore, it has to be ascertained that the induced primary voltage won't be higher than 3kV for CVTs as the NHF (carrier) terminal insulation is designed to withstand 4kV according to IEC and 3.5kV according to IEEE. If the induced primary voltage would be higher than these limits it will possibly harm the insulation of the NHF (carrier) terminal.
Fig. 8 Setup for initial magnetization curve measurement on inductive VTs and CVTs
3.1.5 Measurement of turns ratio correction VOTANO 100 measures the turns ratio correction for considering a possible turns ratio compensation. A turns ratio compensation is a common practice for compensating the voltage ratio error towards a more positive ratio error. Using this method it can be achieved that the voltage transformer will stay within the tolerances defined by its accuracy class. The procedure for the turns ratio correction measurement is slightly different in between inductive VTs and CVTs.
3.1.5.1 Measurement of turns ratio correction on inductive VTs A VT can have a turns ratio correction, in order to compensate the voltage ratio error. Physically, the voltage ratio error is always negative, unless the VT has a turns ratio correction, which will shift the voltage ratio error towards a positive voltage ratio error. For the turns ratio correction measurement a voltage of maximum 4kV will be applied on the primary winding, while the induced secondary voltage is measured on each winding successively. This measurement represents a no load voltage ratio measurement at rather low primary voltages. At the same time the theoretical voltage ratio error is calculated using the mathematical model, assuming no turns ratio correction. The difference between the measured no load voltage ratio error and the calculated voltage ratio error is caused by the turns ratio correction of the VT.
3.1.5.2 Measurement of turns ratio correction on CVTs On CVTs the turns ratio correction is measured in two sub-steps. First of all the overall voltage ratio is measured by applying a voltage (UprimM1) of maximum 4kV on the primary winding, while the induced secondary voltage (UsecM1) is measured on the first secondary winding (1a-1n). This result delivers the voltage ratio of the complete CVT, consisting of the voltage ratio caused by the capacitive divider (Nc) and the intermediate inductive VT (NVT). 𝑈!"#$%!𝑈!"#$!
= 𝑁! ∗ 𝑁!"
The test setup for this measurement is shown in figure 9 below.
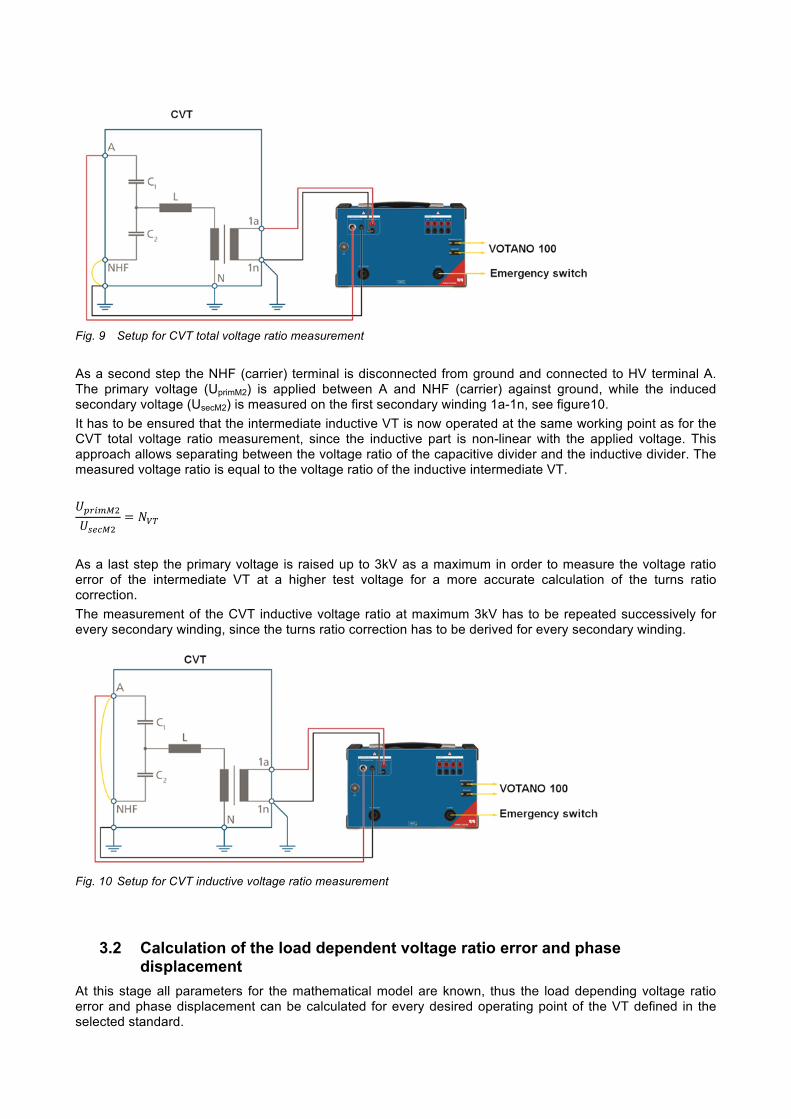
Fig. 9 Setup for CVT total voltage ratio measurement As a second step the NHF (carrier) terminal is disconnected from ground and connected to HV terminal A. The primary voltage (UprimM2) is applied between A and NHF (carrier) against ground, while the induced secondary voltage (UsecM2) is measured on the first secondary winding 1a-1n, see figure10. It has to be ensured that the intermediate inductive VT is now operated at the same working point as for the CVT total voltage ratio measurement, since the inductive part is non-linear with the applied voltage. This approach allows separating between the voltage ratio of the capacitive divider and the inductive divider. The measured voltage ratio is equal to the voltage ratio of the inductive intermediate VT. 𝑈!"#$%!𝑈!"#$!
= 𝑁!"
As a last step the primary voltage is raised up to 3kV as a maximum in order to measure the voltage ratio error of the intermediate VT at a higher test voltage for a more accurate calculation of the turns ratio correction. The measurement of the CVT inductive voltage ratio at maximum 3kV has to be repeated successively for every secondary winding, since the turns ratio correction has to be derived for every secondary winding.
Fig. 10 Setup for CVT inductive voltage ratio measurement
3.2 Calculation of the load dependent voltage ratio error and phase displacement
At this stage all parameters for the mathematical model are known, thus the load depending voltage ratio error and phase displacement can be calculated for every desired operating point of the VT defined in the selected standard.

The burden current causes a voltage drop across the secondary stray impedance. This voltage drop is added to the terminal voltage in order to calculate the core voltage. At the obtained core voltage the resulting exciting current and its phase angle related to the core voltage is known. The information about the exciting current is needed for calculating the total primary current (Ip''). Depending on the load condition of the other windings, their burden current is added to the total primary current. The primary current causes and additional voltage drop across the primary stray impedance. The primary voltage drop is added to the core voltage in order to derive the primary voltage. The voltage ratio error can be derived from the primary voltage and secondary terminal voltage. As the turns ratio correction is known, the offset caused by the turns ratio correction is added to the calculated voltage ratio error. As the calculation itself is done in complex plane the phase displacement can be derived as well.
4. Verification of VTs using the modeling approach VOTANO 100 achieves accurate test results which are close to the reference. This allows voltage transformers with class 0.1 accuracy to be precisely calibrated. Therefore, the device can be used for testing protection and metering VTs during the manufacturing process and as well for on-site verification of the voltage transformer's accuracy. However, before putting a VT in operation for the first time, it should be tested with primary injection at rated-voltage level.
5. Case Studies 5.1 Measurement on a 66kV reference VT
The first case study is about an on-site measurement on a 66kV to 132kV reference VT. The secondary winding has two taps for adapting the voltage ratio between 132kV/√3:110V/√3 and 66kV/√3:110V/√3. The nameplate information about the VT is indicated on figure 10. The accuracy of this reference VT is defined as ±0.03% in voltage ratio error and ±1.5min in phase displacement at a rated load of 1VA with a power factor of 1.0 and for a voltage range from 50% to 125% of rated primary voltage. The accuracy of the VT is specified for a frequency range of 50Hz to 60Hz.
Fig. 11 Nameplate of reference VT The picture below (figure 11) shows the terminal box of the secondary winding. The VT was tested several times in order to prove the stability of the test results for 50Hz, 60Hz and even for both possible voltage ratios.
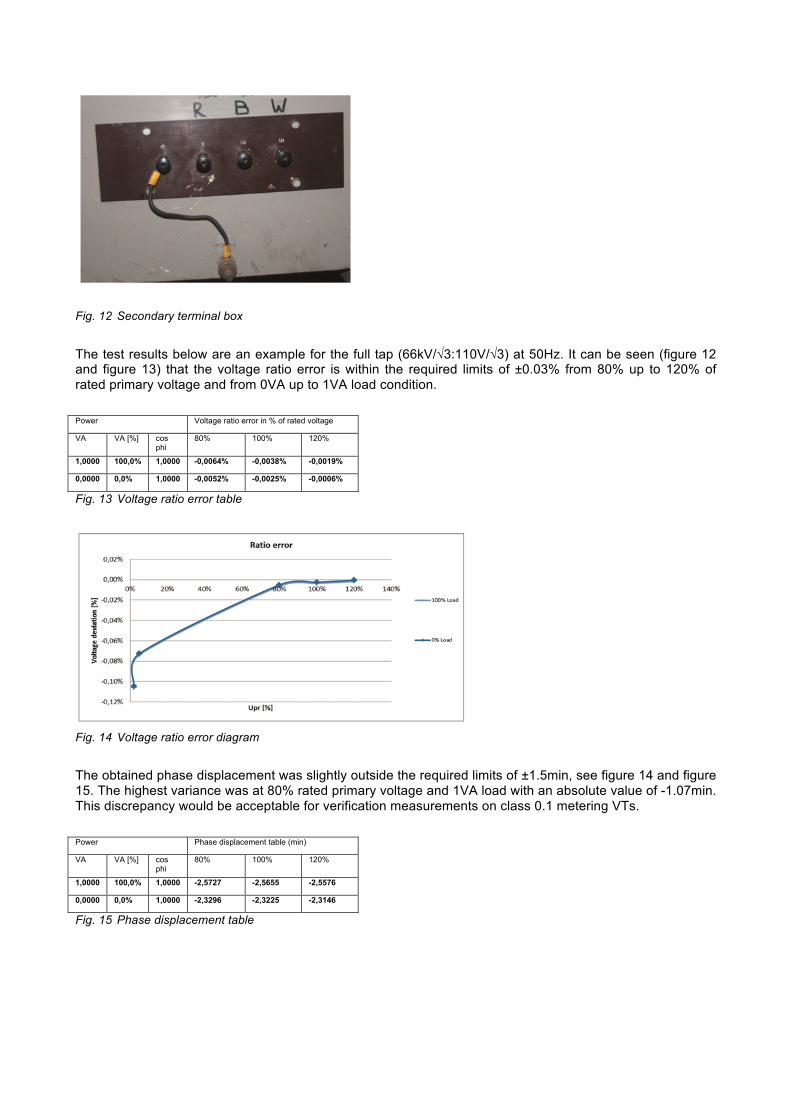
Fig. 12 Secondary terminal box The test results below are an example for the full tap (66kV/√3:110V/√3) at 50Hz. It can be seen (figure 12 and figure 13) that the voltage ratio error is within the required limits of ±0.03% from 80% up to 120% of rated primary voltage and from 0VA up to 1VA load condition. Power Voltage ratio error in % of rated voltage
VA VA [%] cos phi
80% 100% 120%
1,0000 100,0% 1,0000 -0,0064% -0,0038% -0,0019%
0,0000 0,0% 1,0000 -0,0052% -0,0025% -0,0006%
Fig. 13 Voltage ratio error table
Fig. 14 Voltage ratio error diagram The obtained phase displacement was slightly outside the required limits of ±1.5min, see figure 14 and figure 15. The highest variance was at 80% rated primary voltage and 1VA load with an absolute value of -1.07min. This discrepancy would be acceptable for verification measurements on class 0.1 metering VTs. Power Phase displacement table (min)
VA VA [%] cos phi
80% 100% 120%
1,0000 100,0% 1,0000 -2,5727 -2,5655 -2,5576
0,0000 0,0% 1,0000 -2,3296 -2,3225 -2,3146
Fig. 15 Phase displacement table
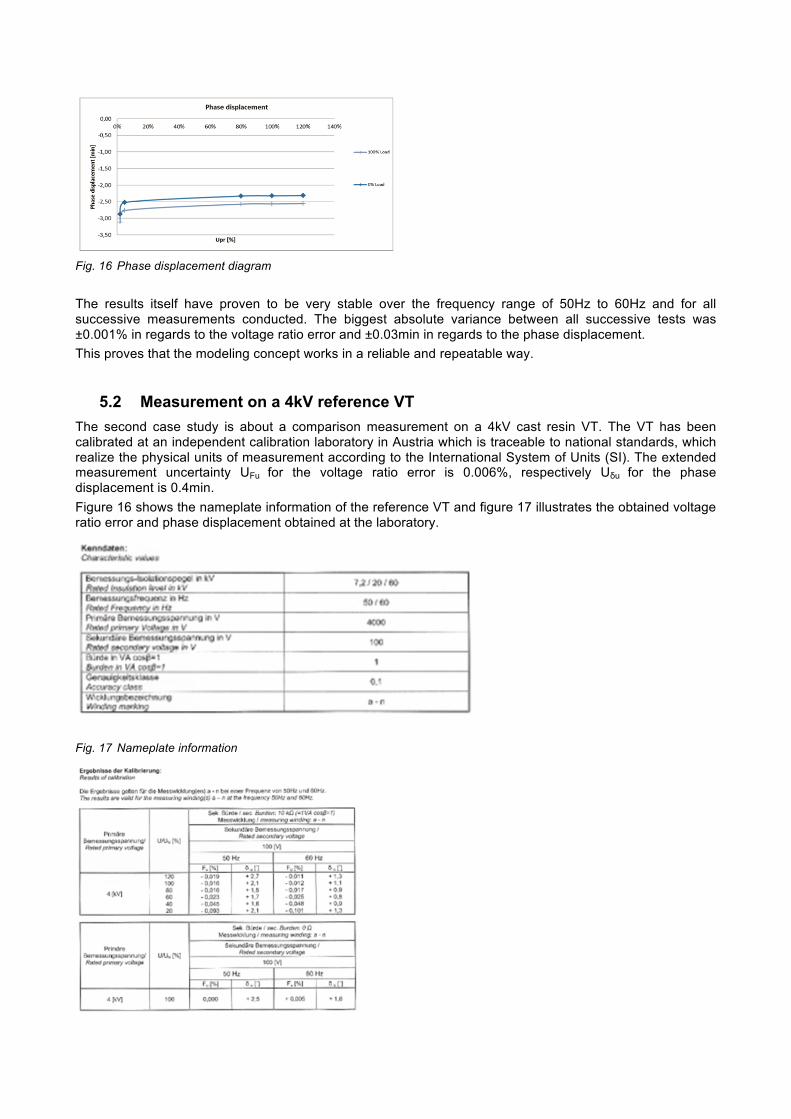
Fig. 16 Phase displacement diagram The results itself have proven to be very stable over the frequency range of 50Hz to 60Hz and for all successive measurements conducted. The biggest absolute variance between all successive tests was ±0.001% in regards to the voltage ratio error and ±0.03min in regards to the phase displacement. This proves that the modeling concept works in a reliable and repeatable way.
5.2 Measurement on a 4kV reference VT The second case study is about a comparison measurement on a 4kV cast resin VT. The VT has been calibrated at an independent calibration laboratory in Austria which is traceable to national standards, which realize the physical units of measurement according to the International System of Units (SI). The extended measurement uncertainty UFu for the voltage ratio error is 0.006%, respectively Uδu for the phase displacement is 0.4min. Figure 16 shows the nameplate information of the reference VT and figure 17 illustrates the obtained voltage ratio error and phase displacement obtained at the laboratory.
Fig. 17 Nameplate information
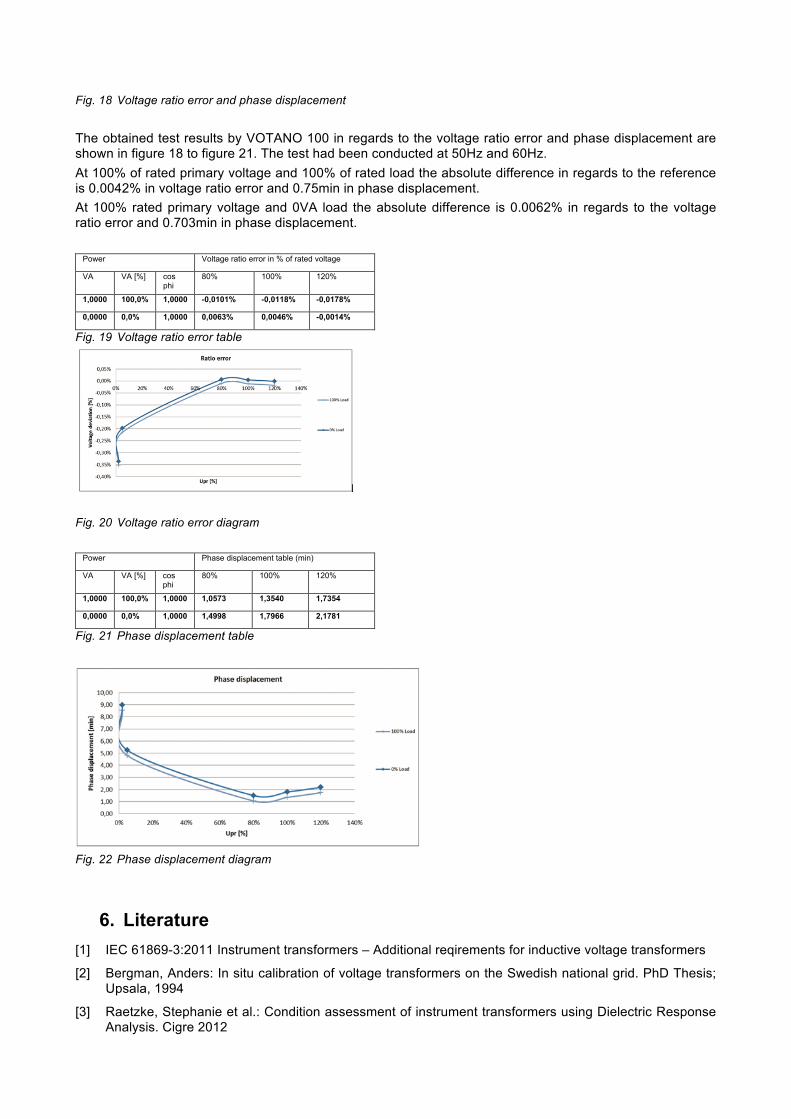
Fig. 18 Voltage ratio error and phase displacement The obtained test results by VOTANO 100 in regards to the voltage ratio error and phase displacement are shown in figure 18 to figure 21. The test had been conducted at 50Hz and 60Hz. At 100% of rated primary voltage and 100% of rated load the absolute difference in regards to the reference is 0.0042% in voltage ratio error and 0.75min in phase displacement. At 100% rated primary voltage and 0VA load the absolute difference is 0.0062% in regards to the voltage ratio error and 0.703min in phase displacement.
Power Voltage ratio error in % of rated voltage
VA VA [%] cos phi
80% 100% 120%
1,0000 100,0% 1,0000 -0,0101% -0,0118% -0,0178%
0,0000 0,0% 1,0000 0,0063% 0,0046% -0,0014%
Fig. 19 Voltage ratio error table
Fig. 20 Voltage ratio error diagram
Power Phase displacement table (min)
VA VA [%] cos phi
80% 100% 120%
1,0000 100,0% 1,0000 1,0573 1,3540 1,7354
0,0000 0,0% 1,0000 1,4998 1,7966 2,1781
Fig. 21 Phase displacement table
Fig. 22 Phase displacement diagram
6. Literature [1] IEC 61869-3:2011 Instrument transformers – Additional reqirements for inductive voltage transformers
[2] Bergman, Anders: In situ calibration of voltage transformers on the Swedish national grid. PhD Thesis; Upsala, 1994
[3] Raetzke, Stephanie et al.: Condition assessment of instrument transformers using Dielectric Response Analysis. Cigre 2012

[4] Azcarraga, C.G. et al.: On-site Testing of Instrument Transformers; 2006 Annual Report Conference on Electrical Insulation and Dielectric Phenomena
[5] VOTANO 100 preliminary user manual
[6] IEC 60044-2 Edition 1.2 / 2003-02 "Instrument Transformers, Part 2: Inductive voltage transformers", Reference number CEI/IEC 60044-2:1997+A1:2000+A2:2002
[7] IEC 60044-5 First Edition / 2004-04 "Instrument transformers, Part 5: Capacitor voltage transformers" Reference number CEI/IEC 60044-5:2004
[8] IEC 61869-3 Edition 1.0 / 2011-07 "Instrument transformers, Part 3: Additional requirements for inductive voltage transformers"
[9] IEC 61869-5 Edition 1.0 / 2011-07 "Instrument transformers, Part 5: Additional requirements for capacitor voltage transformers"
[10] IEEE "Standard Requirements for Instrument Transformers" IEEE Std C57.13TM-2008
[11] ANSI C93.1 – 1999 Requirements for Power-Line Carrier Coupling Capacitors and Coupling and Coupling Capacitor Voltage Transformers (CCVT)
About the Authors
Florian Predl works for OMICRON as an Application Engineer, mainly focusing on instrument transformer applications since September 2007. He graduated at the Federal Higher Technical Institute in Rankweil, Austria with the focus on high frequency technology.
Michael Freiburg is currently working as a research assistant at the Technical University of Dortmund, Germany. His research interests include Diagnostics of High Voltage Equipment and Material Science. He received the engineering degree in 2010 and he is currently working towards the PhD degree at the Technical University of Dortmund, Germany, in cooperation with OMICRON, Austria.
Dr. Michael Krüger is Head of Engineering Services “Test & Diagnostics Solutions for Primary Assets”, OMICRON, Austria. He studied electrical engineering at the University of Aachen (RWTH) and the University of Kaiserslautern (Germany) and graduated in 1976 (Dipl.-Ing.). In 1990 he received the Dr. techn. from the University of Vienna. Dr. Michael Krüger has more than 30 years of experience in high-voltage engineering and insulation diagnosis.