Embed Size (px)
Citation preview

ORIGINAL RESEARCH ARTICLEpublished: 30 October 2012
doi: 10.3389/fnins.2012.00156
A neuronal transcriptome response involving stresspathways is buffered by neuronal microRNAs
Sergei A. Manakov 1,2, Andrew Morton3, Anton J. Enright 2* and Seth G. N. Grant 1*†
1 Genes to Cognition Programme, Wellcome Trust Sanger Institute, Cambridge, UK2 RNA Genomics Lab, European Molecular Biology Laboratory-European Bioinformatics Institute, Cambridge, UK3 Centre for Integrative Physiology, University of Edinburgh, Edinburgh, UK
Edited by:Leonard C. Schalkwyk, King’s CollegeLondon, UK
Reviewed by:Ruth Luthi-Carter, University ofLeicester, UKMichael Parsons, Medical ResearchCouncil, UKLeonid Bystrykh, European ResearchInstitute for Biology of Ageing,Netherlands
*Correspondence:Anton J. Enright, European MolecularBiology Laboratory-EuropeanBioinformatics Institute, WellcomeTrust Genome Campus, Hinxton,Cambridge CB10 1SD, UK.e-mail: [email protected];Seth G. N. Grant, Centre for ClinicalBrain Sciences and Centre forNeuroregeneration, The University ofEdinburgh, Chancellors Building, 47Little France Crescent, EdinburghEH16 4SB, UK.e-mail: [email protected]†Present address:Seth G. N. Grant, Centre for ClinicalBrain Sciences and Centre forNeuroregeneration, The University ofEdinburgh, 47 Little France Crescent,Edinburgh EH16 4SB, UK.
A single microRNA (miRNA) can inhibit a large number of mRNA transcripts. This wide-spread regulatory function has been experimentally demonstrated for a number of miRNAs.However, even when a multitude of targets is confirmed, function of a miRNA is frequentlyinterpreted through a prism of a handful arbitrarily selected “interesting” targets. In thiswork we first show that hundreds of transcripts with target sites for two miRNAs expressedendogenously in neurons, miR-124 and miR-434-3p, are coordinately upregulated in a vari-ety of neuronal stresses. This creates a landscape where these two miRNAs can exerttheir widespread inhibitory potential on stress-induced transcripts. Next, we experimen-tally demonstrate that overexpression of these two miRNAs indeed significantly inhibitsexpression of hundreds of stress-induced transcripts, thus confirming that these transcriptsare enriched in true targets of examined miRNAs. A number of miRNAs were previouslyshown to have important roles in the regulation of stress responses, and our results sug-gest that these roles should be understood in light of a wide spread activation of miRNAtargets during stresses. Importantly, a popular cationic lipid transfection reagent triggerssuch induction of miRNA targets. Therefore, when a transfection paradigm is employed tostudy miRNA function, the results of such studies should be interpreted with considerationfor the inadvertent induction of miRNA targets.
Keywords: miRNA, transcriptome, neuronal stress, buffering, primary neuronal culture
INTRODUCTIONBinding to a short specific sequence motif (∼7 nt long) within3′untranslated regions (UTR) of mRNAs underlies recognitionof targets by microRNA (miRNAs; Lewis et al., 2003, 2005). Thepresence of these motifs, called seed matching sites or a targetsites, in many mRNAs allows miRNA to have many targets. Thescale of targeting repertoires of individual repertoires was firstpredicted computationally (Enright et al., 2003; Lewis et al., 2003;Stark et al., 2003) and then demonstrated experimentally (Limet al., 2005; Giraldez et al., 2006). However, despite having multi-ple targets, the function of a miRNA is frequently interpreted byconsidering only one or few, sometimes arbitrary selected, targets(Makeyev et al., 2007; Visvanathan et al., 2007; Rybak et al., 2008).Even though focusing on one or two targets gives detailed insightsinto specific functional aspects of a miRNA in question, all targetsshould be considered in an unbiased fashion to achieve a properunderstanding of the role of a miRNA.
Their multiple targets make miRNAs perfectly suited to canalizetranscriptome changes during development, as well as to maintain
the stability of differentiated states by buffering transcriptionalperturbations (Hornstein and Shomron, 2006). Deviations fromthe normal homeostatic state of the transcriptome occur duringstresses, and indeed miRNAs were shown to impart robustness tostress responses. For example, miR-7 is necessary for eye devel-opment under temperature fluctuations (Li et al., 2009), miR-14for survival during salt stress (Xu et al., 2003), miR-8 for adapta-tions to osmotic fluctuation (Flynt et al., 2009). More examplesof miRNAs with confirmed roles in stress are reviewed elsewhere(Leung and Sharp, 2010). However, in the extensive body of workon miRNAs in stresses, research has typically focused on a selectedfew targets, and the relationship between the complete repertoiresof targets and changes in the transcriptome during stress is stilllargely not understood.
The neuronal transcriptome is a relevant and important con-text in which to explore miRNA function. The evolutionary originof neurons was linked to the emergence of a neuron specificmiRNA, miR-124 (Christodoulou et al., 2010), and this and otherneuronal miRNAs are critically important for neuronal function
www.frontiersin.org October 2012 | Volume 6 | Article 156 | 1

Manakov et al. Neuronal transcriptome buffering by miRNA
(Rajasethupathy et al., 2009; Schratt, 2009). Therefore, we decidedto study the link between miRNAs and transcriptome wide changesin gene expression in primary neuronal cultures, a popular systemfor studying neuronal biology (Nelson, 1975; Dichter, 1978). Bytransfecting miRNA inhibitors and mimics, we interfered withspecific miRNAs in primary cultures of cortical neurons and thenidentified the sets of regulated mRNAs using transcriptome pro-filing. This experimental method of identifying miRNA targetshas been previously validated and published (Lim et al., 2005;Giraldez et al., 2006). With this approach we found that hundredsof transcripts induced by stresses of neurons and the brain are infact direct targets of miRNAs. Targets of neuronal miRNAs, miR-124 and miR-434-3p, are enriched in genes that are activated bystresses, and, importantly, this enrichment is higher than is thecase for non-neuronal miRNAs. Hence these two neuronal miR-NAs have a capacity to buffer massive changes in the neuronaltranscriptome that occur during stresses.
In addition, we report that the widely used neuronal transfec-tion procedure promotes a major stress response. Treatment ofprimary neurons with blank cationic lipid transfection reagentalone (Materials and Methods) induced expression of stress-related genes enriched in miR-124 target sites in their transcript3′UTRs. We experimentally confirmed that a significant propor-tion of these transcripts are indeed targeted by miRNAs, withtargets of two neuronal miRNAs, miR-124 and miR-434-3p beingthe most enriched. Therefore our study raises a note of caution forthose studying miRNAs, as we found that cationic lipid trans-fection, a commonplace experimental procedure, inadvertentlyinduces expression of miRNA targets.
MATERIALS AND METHODSPRIMARY NEURONAL CULTURESAll mice were treated in accordance with the UK Animals (Scien-tific Procedures) Act of 1986, and all procedures were approvedthrough the UK Home Office Inspectorate. Pregnant C57BL/6 c/cmice at 17.5 days gestation were sacrificed and the forebrains ofdecapitated embryos were dissected. Forebrains were shredded andtransferred to papain (10 units/mL, Worthington) for 20 min at37˚C. Cells were dispersed by trituration in DMEM (Invitrogen)and centrifuged at 400 G for 3.5 min. The pellet was resuspendedin Neurobasal (Invitrogen) supplemented with B-27 (Invitrogen)and 0.5 mM l-Gln (Invitrogen). The suspension was centrifugedat 400 G for 3.5 min. The final pellet was resuspended in the sup-plemented Neurobasal. The cells were plated onto poly-d-lysine(Sigma) and laminin (Invitrogen) coated plastic substrates (Corn-ing) at a density of ∼1,300 cells/mm2. The cells were cultured inthe supplemented Neurobasal in a humidified incubator at 37˚Cand 5% CO2.
TRANSFECTIONSTransfections were performed using DharmaFECT 3 transfectionreagent (Dharmacon) according to the manufacturer’s proto-col as previously described (MacLaren et al., 2011). At 4–6 daysafter plating, the cultures were transfected with mimics andinhibitors of mouse miRNAs (Qiagen) or the mimic of cel-miR-67(Dharmacon). All transfections were performed in three or four
biological replicates. After ∼48 h post-transfection, the total RNAwas extracted from the cultures.
KCL TREATMENTAt 6 days after plating, KCl was added to the culture media toa final concentration of 15 mM. After ∼48 h, total RNA wasextracted from cultures treated with KCl and matched untreatedcultures (eight biological replicates per condition). Gene expres-sion was profiled with Illumina microarrays (see below). Differ-entially expressed transcripts where defined as those correspond-ing to probes with multiple testing adjusted P < 0.01. P-valueswere adjusted with Benjamini and Hochberg (1995) procedure asimplemented via limma package functions (Smyth, 2004). Thisprocedure was also followed in all other cases when it is stated thatP-value adjustment was performed (see below).
RNA EXTRACTION AND MICROARRAY PROFILINGAt ∼48 h post-transfection or post-treatment with 15 mM KCl,the culture media was removed and the cells were lysed withQIAzol (Qiagen). Total RNA was extracted with miRNeasy MiniKit (Qiagen) according to the manufacturer’s protocol. Profilingof mRNA abundances was performed using an Illumina SentrixBeadChip Array Mouse-WG6 v2 microarray platform accordingto the Illumina protocol.
ANALYSIS OF MICROARRAY DATAIllumina arrays were scanned using a BeadArray reader (Illumina)and raw probe intensities were exported with GenomeStudio soft-ware (Illumina) according to the manufacturer’s protocols. Theraw data was deposited in ArrayExpresses (Parkinson et al., 2009;accession number E-MTAB-68). Analysis of the array data was per-formed in the R environment (R. Team, 2008) with Bioconductorpackages (Gentleman et al., 2004). The output of GenomeStu-dio was imported into R using lumi package functions (Du et al.,2008). Only probes with lumi detection call P < 0.01 were consid-ered for further analysis. The Illumina array data were transformedwith VST and normalized with RSN as implemented via the lumipackage. Analysis of differential gene expression was performedusing limma package functions (Smyth, 2004).
Microarray data from KCl treatment and transfection exper-iments is deposited in ArrayExpress1 under E-MTAB-686 acces-sion.
Raw Affymetrix microarray mRNA profiling data for thekainate injection experiment (Akahoshi et al., 2007) was down-loaded from GEO (Barrett et al., 2011; accession numberGSE6388). The raw data was imported into R environment, trans-formed and normalized with RMA as implemented via the affypackage (Gautier et al., 2004). Analysis of differential gene expres-sion was performed using limma package functions (Smyth, 2004).Probes with differential expression P < 0.05 were considered to bedifferentially expressed.
Mapping Illumina microarray probes to transcript and geneidentifiersIllumina microarray probe sequences were taken from the Illu-mina mRNA array annotation file MouseWG-6_V2_0_R2_112
1http://www.ebi.ac.uk/arrayexpress/
Frontiers in Neuroscience | Neurogenomics October 2012 | Volume 6 | Article 156 | 2
Manakov et al. Neuronal transcriptome buffering by miRNA
78593_A (BGX file) available from the Illumina website2. Illu-mina mRNA array probes were aligned to the complete set ofthe full-length Ensembl v56 mouse transcripts (Flicek et al., 2008;Hubbard et al., 2009) with SSAHA2 (Ning et al., 2001). All cat-egories of Enesmbl transcripts, were retrieved using the EnsemblPerl API, which enabled access to Core, Vega, and OtherFeaturesmouse transcripts (Flicek et al., 2008; Hubbard et al., 2009). Atranscript from the highest scoring SSAHA2 alignment was cho-sen for each probe (at least 30 perfect consecutive matches wererequired). If more than one alignment had an equally high score,manually curated Vega transcripts were preferred. In order toresolve ambiguity of multiple transcripts from the same sourcealigning equally well, the “biotype” annotation was considered(protein coding transcripts were preferred to pseudogenes, andnonsense-mediated decay had the lowest preference). If the ambi-guity was still not resolved, transcripts with the longest 3′UTRor cDNA were selected. When probes did not align to any of theEnsembl transcripts, mapping of the probes to RefSeq 38 (Pruittet al., 2009) transcript identifiers was taken from the IlluminaBGX files. After probes were uniquely mapped to the best tran-script identifiers (either from Ensembl or from the Illumina BGXfiles), the corresponding GeneBank gene identifiers (referred to asEntrez gene IDs) were matched to the probes. For probes mappedto Ensembl or Vega transcripts, the Entrez gene IDs were retrievedusing Ensembl API, and for probes mapped to RefSeq IDs via theBGX annotation files, the Entrez gene IDs were taken from theBGX file. The adjusted P-values of differential expression wereused for selection of the best probe per Entrez gene ID (i.e., aprobe with the most significant adjusted P-value was preferred).
Mapping Affymetrix microarray probes to transcript and geneidentifiersBioconductor annotation library “mgu74bv2.db” (Gentlemanet al., 2004) was used in analysis of the Affymetrix data (Aka-hoshi et al., 2007). These libraries provided mapping of microarrayprobes to RefSeq transcript and Entrez gene identifiers. For Ref-Seq transcript IDs, 3′UTR sequences were obtained from Ensembl,using Ensembl API (Flicek et al., 2008; Hubbard et al., 2009). Thelength of 3′UTRs was used to resolve the ambiguity in mapping ofprobes to RefSeq transcript IDs: when the probes were mapped tomore than one RefSeq transcript ID, the ID corresponding to thetranscript with the longest 3′UTR was selected. In the Bioconduc-tor annotation files, each RefSeq transcript ID corresponded to oneEntrez gene ID. The adjusted P-values of differential expressionwere used for selection of the best probe per Entrez gene ID (i.e., aprobe with the most significant adjusted P-value was preferred).
Obtaining 3′UTR sequences of transcriptsThe 3′UTR sequence for the transcripts mapped to each of themicroarray platforms were obtained from Ensembl v56 with theEnsembl API (Flicek et al., 2008; Hubbard et al., 2009). For Sylameranalysis regions of low complexity and repetitive (redundant)sequences were removed as previously described (van Dongenet al., 2008). The low complexity and redundant sequences weremasked out (Thomas-Chollier et al., 2008).
2http://support.illumina.com/array/array_kits/mousewg-6_v2_expression_beadchip_kit/downloads.ilmn
SYLAMER ANALYSISThe sequences of all mature mouse miRNAs were downloadeddirectly from miRBase Release 14 (Griffiths-Jones et al., 2008).For each miRNA, two sequences complementary to the seed region(i.e., the seed matching sites) were derived: the sequence comple-mentary to bases 2–8 from the 5′-end of the miRNA [7(2)-typeseed matching site], and to bases 1–7 with an A opposite to position1 [7(1A)-type; Bartel, 2009] producing 876 distinct seed matchingsites in total. Three seed matching sites, CAAUAAA, UAUUUAU,and UCAAUAA that are similar to the AAUAAA, a polyadenylationsignal in 3′UTRs (Connelly and Manley, 1988) had to be excludedfrom the analyzes, as biases in distribution of these words couldnot be attributed to miRNA-mediated effects.
Sylamer tests for nucleotide word occurrence biases in a sortedlist of sequences using hypergeometric test and is suitable to pro-file biases in distribution of miRNA seed matching sites in the listof 3′UTRs (van Dongen et al., 2008). Assessment of the enrich-ment of a particular nucleotide word of a given length is doneby calculation of a hypergeometric enrichment P-value of thatword in samples of sequences (or bins) from the list. Sampling ofsequences from the ordered list was done from the most downreg-ulated to the most upregulated and the size of a leading bin wasiteratively incremented (i.e., at each step the leading bin includesall previously sampled sequences plus a certain number of newsequences). At each step, Sylamer calculates the enrichment P-value of a particular nucleotide word by comparing its occurrencein the leading bin to its occurrence in all sequences of the list.Transcripts without a 3′UTR sequence were excluded from thetest.
Sequences were sorted by t -statistic of corresponding microar-ray probes. In each test, the distribution of 876 seed matching sitesof length seven bases corresponding to mouse mature miRNAs(see above) was assessed. The sample size (bin size) of selectedsequences was incremented by 100 at each step. The level ofMarkov-correction was set to four (van Dongen et al., 2008).
Putative direct targets of miRNAs were defined as previouslydescribed (van Dongen et al., 2008). Briefly, first, a P-value cutofffor differential expression was selected. We selected the cutoff to beequal to 0.05, because this adjusted P-value for differential expres-sion roughly coincided with the peak of Sylamer enrichment ofseed matching sites for transfected miRNAs in a majority of exper-iments (Figure 3). Second, transcripts downregulated (adjustedP < 0.05) in contrast between transfections of miRNA mimicsand miRNA inhibitors (for all mouse miRNAs) or mock transfec-tion (for cel-miR-67) were selected. Finally, putative direct targetsof a transfected miRNA were defined as a sub-selection of thesetranscripts that contained one or more seed matching sites fortransfected miRNAs.
RESULTSINDUCTION OF STRESS RESPONSE GENES BY THE TRANSFECTIONREAGENTWe proceeded to use a standard transfection protocol, uti-lized in thousands of studies, where a mixture of a cationiclipid and nucleic acid is applied to the cultured neurons. Inthe course of analyzing mRNA profiles from multiple dif-ferent miRNA inhibitors and mimics, we were initially sur-prised by a set of mRNAs that unexpectedly changed in all
www.frontiersin.org October 2012 | Volume 6 | Article 156 | 3

Manakov et al. Neuronal transcriptome buffering by miRNA
experiments. In analyzing this phenomenon, we tested the mRNAprofile of neurons treated with cationic lipid alone and com-pared this with untreated neurons and unexpectedly foundthe transfection reagent alone induced a major change in thetranscriptome.
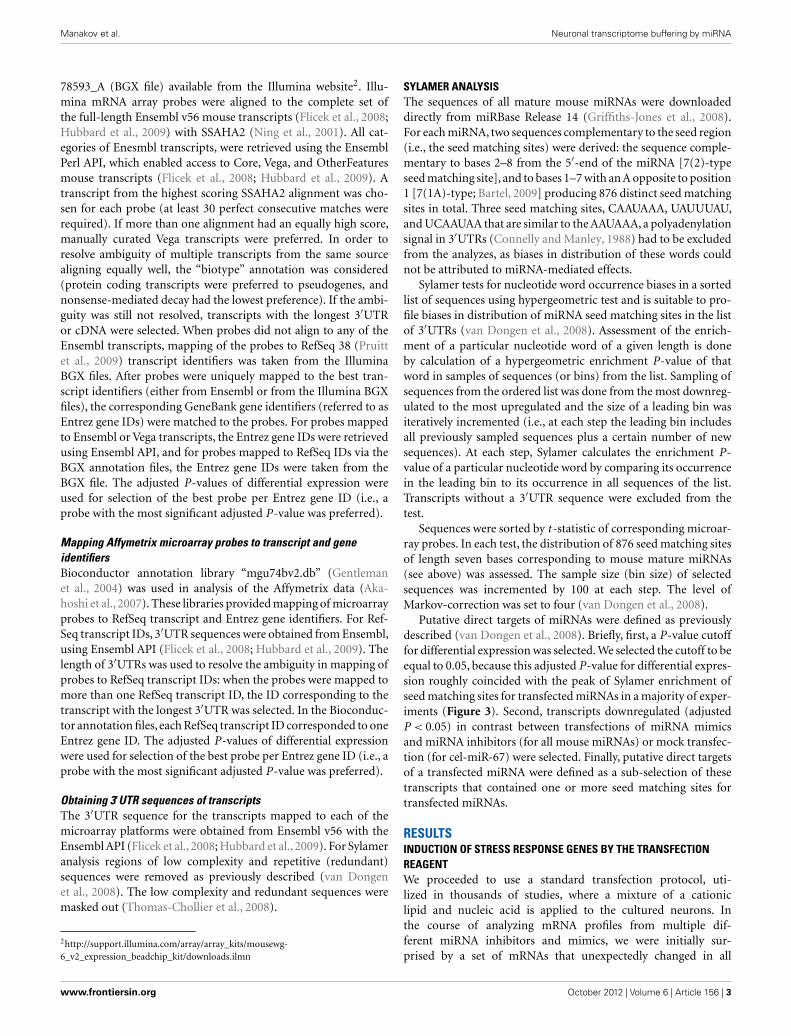
Figure 1A shows that ∼48 h after addition of the transfec-tion reagent there was a reduction in expression of 683 mRNAs(6.3% of transcriptome) and an upregulation of 725 mRNAs(6.7% of transcriptome). The lists of genes encoding these mRNAs,together with fold changes and P-values of differential expression,are supplied in Data Sheet 2 in Supplementary Material. Inspec-tion of these lists revealed many important regulatory genes andKEGG pathway analysis (Kanehisa et al., 2000) showed signifi-cant induction in the p53 pathway, P450 related pathway andreduction in lipid biosynthesis and transport. Thus, the treat-ment with a cationic lipid transfection reagent triggers a majorresponse in the transcriptome involving stress and metabolicpathways.
OTHER TREATMENTS ALSO INDUCED THE RESPONSEWe next asked if this transcriptome response was relevant toneuronal physiology or simply an idiosyncratic effect of the trans-fection reagent. To address this, we compared these transfection-regulated mRNAs with transcriptome data from neurons that hadbeen subjected to other types of stressful treatments. First, weanalyzed published microarray transcriptome profiling of hip-pocampi in which glutamate receptors were abnormally activatedthrough injection of kainate (Akahoshi et al., 2007). We identi-fied sets of transcripts with expression either down or upregu-lated by this treatment (Materials and Methods). Transcripts thatwere downregulated upon injection of kainate had a significantintersection with transcripts downregulated by the transfectionreagent treatment of the neuronal cultures (P < 4.62× 10⁻¹³,Figure 1A), while transcripts upregulated by the kainate inter-sected significantly with transcripts upregulated by the transfec-tion reagent (P < 3.72× 10−39, Figure 1A). Next, we analyzedlists of genes that were previously reported to be either inducedor reduced in expression in the human brain upon aging (Luet al., 2004). Mouse homologs of human genes were obtainedfrom HomoloGene (Sayers et al., 2010) and their transcripts werecompared to transcripts differentially expressed upon the transfec-tion reagent treatment. Again, transcriptome changes observed inthe aging brain were similar to those observed upon the trans-fection treatment (P < 1.36× 10−09 for intersection of down-regulated transcripts and P < 7.73× 10−08 for upregulated tran-scripts, Figure 1A). Finally, we conducted an experiment werewe chronically depolarized primary neuronal cultures by treat-ment with KCl (Materials and Methods). We identified genesthat were either down or upregulated through transcriptomeprofiling with microarrays (Materials and Methods). As withthe published accounts of transcriptome changes in the brainupon kainate injection and aging, KCl treatment of the cul-tures induced changes in the transcriptome overlapped signif-icantly with those observed upon the cationic lipid transfec-tion reagent (P < 4.60× 10−39 for downregulated transcripts andP < 8.75× 10⁻¹⁸ for upregulated transcripts, Figure 1A). All thegene lists, and, when available, fold changes and P-values of
Fold change, log2a
dju
ste
d −
log1
0(P
−va
lue)
1
2
3
4
5
6
−1.5 −1 −0.5 0 0.5 1 1.5
683 genes 725 genes
Enri
ch
me
nt
(lo
g2
)
KCl
kainat
e
ageing
Enri
ch
me
nt
(lo
g2
)
KCl
kainat
e ageing
1
2
0
1
2
0
** **
**
**
****
Sorted sequences
log
10
(en
richm
ent P
−va
lue
)
0 2000 4000 6000 8000
−10
−8
−6
−4
−2
0
2
4
6
enrichm
ent
depletion
downregulated upregulated
A
BGUGCCUU [7(2)-type]
UGCCUUA [7(1A)-type]miR−124
FIGURE 1 | Stress induces expression of genes subject tomiRNA-mediated regulation. (A) The x -axis shows differential expression(log2) between mock transfected and untransfected cultures, the y -axisshows the adjusted P -value (−log10) for differential expression. Each pointon the plot uniquely represents one gene, genes above the dashed line aredifferentially expressed with multiple testing adjusted P < 0.1. The insetsshow enrichment (log2) of genes either downregulated (white bars) orinduced (black bars) by stressful treatments. Genes differentially expressedupon KCl treatment where identified by Illumina microarrays (Materials andMethods). Genes differentially expressed upon kainite treatment wherederived from published microarray profiling data (Akahoshi et al., 2007;Materials and Methods). Mouse homologs (from HomoloGene; Sayerset al., 2010) of human genes that were previously reported as differentiallyexpressed upon aging of the human brain comprised the aging sets.Double asterisks indicate hypergeometric P < 0.001 (Materials andMethods). The set of 10,849 genes detected by Illumina microarrays(Materials and Methods) in mock transfected and untransfected cultureswas used as the universe for the hypergeometric tests. (B) The x -axisrepresents 3′UTRs corresponding to expressed genes sorted from mostdownregulated to most upregulated in comparison of mock transfected
(Continued)
Frontiers in Neuroscience | Neurogenomics October 2012 | Volume 6 | Article 156 | 4

Manakov et al. Neuronal transcriptome buffering by miRNA
FIGURE 1 | Continuedvs. untransfected cultures. P -values are calculated using the Sylamermethod (van Dongen et al., 2008). Positive values on the y -axes representnucleotide word enrichment [+|log10(P -value)|] and negative valuesrepresent depletion [−|log10(P -value)|]. The red and blue lines showenrichment profiles of 7(2) or 7(1A)-type seed matching sites (Bartel, 2009)for miR-124, the gray lines – for other miRNAs (Materials and Methods).
differential expression, are supplied in Data Sheet 2 in Supple-mentary Material. These observations suggest significant simi-larity between sets of genes activated in response to differentstresses. Therefore, for convenience we refer to the response ofneurons to different stresses as Neuronal Challenge Response(NCR).
THE RESPONSE INVOLVES INDUCTION OF TRANSCRIPTS SUBJECT TOmiRNA-MEDIATED REGULATIONRecent reports have identified a role for miRNA in regulationof mRNA during stress responses (Leung and Sharp, 2010). Wetherefore examined the potential role of miRNAs in regulatingNCR mRNAs. It has previously been demonstrated repeatedly thatmiRNAs induce coordinated changes in expression of their tar-gets (Farh et al., 2005; Lim et al., 2005). Therefore, we employedSylamer, a statistical analysis of all known miRNA target sitesin 3′UTRs (van Dongen et al., 2008). Sylamer looks for biasesin the distribution of target sites in lists of 3′UTRs that areordered according to the magnitude of differential expression ofthe corresponding transcripts. If a particular miRNA is overex-pressed and has a direct impact on differential expression, then3′UTRs of downregulated transcripts will be enriched in tar-get sites of that miRNA, but not other miRNAs. On the otherhand, if a miRNA is non-functional, then the 3′UTRs of upreg-ulated transcripts will be enriched in target sites of that miRNA.With Sylamer we identified seed matching sites of miR-124 as themost enriched in mRNAs upregulated during the transcriptomeresponse, and thus implicated miR-124 as a potential regulatorof the NCR mRNAs (Figure 1B and Materials and Methods).miR-124 is a neuron specific miRNA known to play a role in themaintenance of neuronal identity (Conaco et al., 2006). A sim-ilar distribution of miR-124 sites was observed in the mRNAsregulated by KCl and kainate (Figure 2). In addition to miR-124, in the data from the brains of mice treated with kainatewe detected a bias in distribution of sites for miR-434-3p, amiRNA that is upregulated in development of primary neurons(Manakov et al., 2009). These observations suggest the possi-bility that endogenous miR-124 and miR-434-3p regulate NCRmRNAs.
miRNA-MEDIATED INHIBITION OF THE RESPONSE GENESIt has been previously demonstrated that overexpression of miR-NAs reduces expression of a significant fraction of their targets(Lim et al., 2005; Giraldez et al., 2006; Selbach et al., 2008), whileinhibition (knock down) of miRNAs results in elevated abundanceof their targets (Conaco et al., 2006; Giraldez et al., 2006; Selbachet al., 2008). Therefore, comparison of mRNA transcriptome datafollowing treatment with both mimics and inhibitors of miRNAs
provides confidence in the targets (Lim et al., 2005; Giraldezet al., 2006). Indeed, we found that contrast of expression betweencultures transfected with mimics (i.e., miRNA overexpression)and those transfected with inhibitors (i.e., miRNA knock down)results in bigger and more significant differential expression thancontrast of overexpression and simple mock transfection (resultsnot shown). In addition to serving as an efficient contrast for dif-ferential expression analysis, the use of miRNA inhibitors providesadditional confidence that identified changes in gene expressionare directly related to the endogenous function of the inhibitedmiRNA (see Discussion). Therefore, to identify miRNA targets,we transfected primary neurons with mimics and inhibitors ofmiR-124 and miR-434-3p or controls including miRNAs that aredownregulated in mature neuronal cultures (miR-143, miR-145,miR-25; Manakov et al., 2009). In addition, we transfected cultureswith the mimic of Caenorhabditis elegans miRNA (cel-miR-67)and compared it against mock transfection (inhibition is not pos-sible for this miRNA, as it is not endogenous to mouse primaryneurons).
We have then conducted the statistical analysis of miRNAbinding site distribution in 3′UTRs of all transcripts detectedby microarrays, and found that downregulated transcripts wereenriched in the sites for the transfected miRNAs (Figure 3 andMaterials and Methods). Seed matching site containing tran-scripts, that are downregulated in analogous experiments, wereshown to be enriched in validated miRNA targets (Lim et al.,2005; Giraldez et al., 2006; Selbach et al., 2008). Therefore wecompiled lists of dozens to hundreds of putative direct targetsfor the six transfected miRNAs (Data Sheet 1 in SupplementaryMaterial).
Following derivation of putative miRNA targets, we assessedwhether the identified targets were enriched among NCR mRNAs,therefore implicating miRNAs in regulation of the NCR. Indeed,analysis of the mRNA targets of miR-124 and miR-434-3p showedthat they were significantly enriched in all four NCR sets (transfec-tion, KCl, kainate, aging; Figure 4). Targets of the four transfectednon-neuronal miRNAs were also enriched in some of the sets,although these effects were smaller and less consistent than forthe two neuronal miRNAs (Figure 4). The targets that we identi-fied for miR-124 were consistent with previously published lists ofmiR-124 targets (Lim et al., 2005; Chi et al., 2009; Figures 5A,B).These results confirm that increasing or decreasing the levelsof miR-124 and miR-434-3p reduces or increases NCR mRNAsrespectively.
DISCUSSIONWe found that challenging neurons with different stimuli induces atranscriptome response involving a large set of mRNAs, observedin vitro and in vivo. This response changes the expression of aset of stress-related pathways and is triggered by a wide varietyof exogenous challenges including treatment of primary neu-rons with a blank cationic lipid transfection reagent, neuronalactivation, and aging. A significant proportion of the transcriptsactivated by the transfection reagent were also activated by otherstresses (Figure 1A). Due to this similarity, we refer to changesin the transcriptome during stresses as a NCR. We observedenrichment of miR-124 and miR-434-3p seed matching sites in
www.frontiersin.org October 2012 | Volume 6 | Article 156 | 5

Manakov et al. Neuronal transcriptome buffering by miRNA
Sorted sequences
log10(e
nr
valu
e)
0 2000 4000 6000 8000
0
2
4
6
Sorted sequences
log10(e
nr
valu
e)
0 2000 4000 6000
0
2
4
6
A
B
GUGCCUU [7(2)-type]
UGCCUUA [7(1A)-type]
GGUUCAA [7(2)-type]
GUGCCUU [7(2)-type]
UGCCUUA [7(1A)-type]
FIGURE 2 | Signal for activity of endogenous miR-124 andmiR-434-3p. The x -axes represent 3′UTRs corresponding to expressedgenes sorted from most downregulated to most upregulated incomparison of (A) cultures treated with KCl and untreated cultures and(B) mouse hippocampi treated with kainate and untreated hippocampi(Akahoshi et al., 2007). P -values are calculated using the Sylamer method
(van Dongen et al., 2008). Positive values on the y -axes representnucleotide word enrichment [+|log10(P -value)|] and negative valuesrepresent depletion [−|log10(P -value)|]. The red and blue lines showenrichment profiles of seed matching sites for miR-124 [7(2)-and7(1A)-types; Bartel, 2009], the green line for miR-434-3p [7(2)-type], andthe gray lines – seed matching sites for other miRNAs.
3′UTRs of transcripts that were induced during NCR (Figures 1Band 2). Next, we tested whether the induced transcripts wereenriched in direct targets of these miRNAs. Purely computa-tional miRNA target prediction algorithms, such as TargetScan(Friedman et al., 2009), PicTar (Krek et al., 2005), or miRanda
(Griffiths-Jones et al., 2008), are prone to false positive predic-tions. Therefore we experimentally derived targets of a selectionof miRNAs using an approach that was previously published andvalidated (Lim et al., 2005; Giraldez et al., 2006). We defined tar-gets as transcripts that both have one or more seed matching sites
Frontiers in Neuroscience | Neurogenomics October 2012 | Volume 6 | Article 156 | 6

Manakov et al. Neuronal transcriptome buffering by miRNA
Sorted sequences
log10(e
nr
valu
e)
0 2000 4000 6000 8000 10000
0
2
4
6
8
10
12
Sorted sequences
log10(e
nr
valu
e)
0 2000 4000 6000 8000
0
2
4
6
8
10
12
14
16
18
20
22
24
26
Sorted sequences
log10(e
nr
valu
e)
0 2000 4000 6000 8000
02468
10121416182022242628303234363840424446485052
Sorted sequences
log10(e
nr
valu
e)
0 2000 4000 6000 8000 10000
0
2
4
6
8
10
12
BA
DC
E
Sorted sequences
log10(e
nr
valu
e)
0 2000 4000 6000 8000
0
2
4
6
8
10
12GGUUCAA [7(2)-type]GUUCAAA [7(1A)-type]
AACUGGA [7(2)-type]
ACUGGAA [7(1A)-type]
UCAUCUC [7(2)-type]
CAUCUCA [7(1A)-type]
GUGCAAU [7(2)-type]
UGCAAUA [7(1A)-type]GGUUGUG [7(2)-type]
GUUGUGA [7(1A)-type]
log10(e
nr
valu
e)
0 2000 4000 6000 8000
0
2
4
6
8
10
12
14
16
18
20
22
24
26
28
30
32
34
36
38
40
42
44
46
48
F
GUGCCUU [7(2)-type]
UGCCUUA [7(1A)-type]
FIGURE 3 | Identified putative direct miRNA targets. The x -axesrepresent 3′UTRs corresponding to genes sorted from mostdownregulated to most upregulated in comparison to cultures transfectedwith (A) miR-124 mimic and inhibitor, (B) miR-434-3p mimic and inhibitor,(C) miR-143 mimic and inhibitor, (D) miR-145 mimic and inhibitor,(E) miR-25 mimic and inhibitor, (F) ce-miR-67 mimic and mock transfected
cultures. Sequences to the left of the vertical dashed lines correspond togenes downregulated with differential expression adjusted P < 0.05.Putative targets of miRNAs are defined as downregulated genes (adjustedP < 0.05) encoding transcripts with one or 7(2) or 7(1A)-type seedmatching sites (Bartel, 2009) in 3′UTRs. Section “Materials and Methods”for details.
for a miRNA and, at the same time, are significantly inhibitedduring overexpression of that miRNA (Materials and Methods).Indeed, we found that NCR mRNAs are preferred targets of two
neuronal miRNAs, miR-124 and miR-434-3p (Figure 4). There-fore, these miRNAs can act to modulate or buffer the responseat the whole transcriptome level by destabilization of hundreds
www.frontiersin.org October 2012 | Volume 6 | Article 156 | 7

Manakov et al. Neuronal transcriptome buffering by miRNA
A B
C D
FIGURE 4 |The y -axis show enrichment of miRNA targets in genes thatwere downregulated (white bars) or induced (black bars) by four typesof stressful treatments of neurons and the brain (Data Sheet 2 inSupplementary Material). These treatments are described in ResultsSections “Induction of Stress Response Genes by the Transfection reagent”and “Other Treatments Also Induce the Response”: (A) treatment of primary
neuronal cultures with cationic lipid transfection reagent; (B) treatment of thebrain with kainate; (C) treatment of primary neuronal cultures with KCl; (D)ageing of the human brain. A single asterisk indicates hypergeometricP < 0.05, double indicates P < 0.001. The set of 10,849 genes detected byIllumina microarrays (see Materials and Methods) in mock transfected anduntransfected cultures was used as the universe for the hypergeometric tests.
of transcripts that are induced during the response. The effectof stress on transcriptome can be viewed as a deviation fromhomeostatic equilibrium that is associated with the unperturbeddifferentiated state. Therefore, the capacity of miRNAs to inhibithundreds of transcripts that are activated by stress makes themcandidate stabilizers of the normal, homeostatic state of thetranscriptome.
To our knowledge, our report is the first to connect a broadtargeting capacity of miRNAs and transcriptome wide changes ingene expression that are observed in stresses. We hope that ourstudy will encourage future mechanistic investigation of the prin-ciples that govern this relationship. For example, it is possible thatmiRNAs themselves are inhibited during stress, and that this is themechanism for the concomitant relief of miRNA-mediated reg-ulation. It is also possible that upon stress, in a fashion similarto protein components of miRNA effector complex (Leung et al.,2006), miRNAs themselves may relocate to cellular compartmentswhere they are kept separate from their targets, enabling inductionof normally repressed stress pathways. We believe that addressingthese questions will provide an important contribution to under-standing of the molecular mechanisms and cellular functions ofmiRNAs.
Interestingly, one of the treatments that triggered NCR wasthe transfection procedure itself (i.e., treatment of neurons witha blank cationic lipid transfection reagent). We believe this isthe first report of activation of miRNA targets linked to the useof a common cationic lipid transfection reagent. The observed
induction of putative direct targets of miR-124, as well as of othermiRNAs, raises an important warning sign for miRNA research,because stress caused by experimental procedures, such as trans-fection, inadvertently induces expression of miRNA targets. Sub-sequently, inhibition of these targets is observed when miRNAmimic is added to the cells. Therefore, it is important to realizethat miRNA targets observed in transfection experiments shouldbe understood in the context of cellular stress associated with thetransfection.
We identified enrichment of miRNA targets among genes thatrespond to stresses in primary neurons (NCR genes). It remainsto be established whether NCR is specific to neurons, or if it isrelated to stress response programs in other cell types. In fact,we propose that miRNA targets are enriched in stress responsegenes not only in neurons. To look for support of this propo-sition we examined targets of a neuronal miRNA that were alsoidentified in a transfection experiment, but in a non-neuronalsystem. HeLa cells were transfected with miR-124 mimic (Limet al., 2005). Of the miR-124 targets reported in that study, 102had one-to-one homology to mouse genes and were detectedby microarrays in our experiments (Materials and Methods). Ofthese, 18 genes (17.6%,∼3.3 times more than expected by chance,P < 4.06× 10−06) were activated during mock transfection of pri-mary neurons in our study (Figure 5C). This relationship betweenmiR-124 targets in HeLa and genes activated by mock trans-fection of primary neurons is significant, but it is weaker thanthat observed by us in primary neurons (Figure 4A). The latter
Frontiers in Neuroscience | Neurogenomics October 2012 | Volume 6 | Article 156 | 8

Manakov et al. Neuronal transcriptome buffering by miRNA
intersection-23
intersection-10
intersection-06
A
B
C
FIGURE 5 | Comparison with previously published miR-124 targets.(A,B) The Venn diagrams show counts of putative direct targets of miR-124that were inferred from the transfection experiments in this work and fromthe published HITS-CLIP sequencing (Chi et al., 2009) and microarray (Limet al., 2005) experiments. The latter study is based on HeLa transfrectionexperiment. The mouse homologs of human miR-124 targets wereretrieved from HomoloGene http://www.ncbi.nlm.nih.gov/homologene; (C)the Venn diagram shows counts of miR-124 targets reported in HeLa study(Lim et al., 2005) and transcripts induced by transfection alone in ourexperiment. In all cases the test universe was 3,465 mouse transcripts,with 3′UTRs containing one or more 7(2) or 7(1A)-type seed matching sitefor miR-124. The test universe was a complete list of mouse genesencoding transcripts with 3′UTRs containing one or more 7(2) or 7(1A)-typeseed matching site for miR-124, and which were represented on IlluminaSentrix BeadChip Array Mouse-WG6 v2 microarray platform (3,465 genes intotal). The text shows fold enrichment above what is expected by chancealone and the hypergeometric P -value for the intersection.
may be due to the fact that a set of HeLa genes activated duringtransfection is substantially different from the NCR set. Unfortu-nately, to our knowledge, the stress response associated with theuse of transfection reagent has not been directly studied, evenin a popular system like HeLa cells. If genes activated by trans-fection stress in non-neuronal cell types are reported, it will beinteresting to see whether enrichment of targets of a miRNAin these cells, especially of miRNAs that are specific to the celltype in question, will be at the same level as observed in ourstudy.
Recent developments in high throughput proteomics allowquantitative profiling of the global dynamics in abundances ofthousands of proteins (Schwanhausser et al., 2011; Geiger et al.,2012). It is likely that we have already identified a near-completeset of stress activated miR-124 and miR-434-3p targets, as itwas shown for mammalian miRNAs to primarily act by regu-lating mRNA abundance (Guo et al., 2010). However, it remainspossible that some targets were missed in our study of the tran-scriptome. In the future it will be important to profile pro-tein changes that take place in primary neurons upon pertur-bation of miR-124 and miR-434-3p expression. Also, it is notknown how quickly miRNA-mediated changes in the transcrip-tome translate into changes in the whole proteome, and weencourage investigation of this issue in the context of the NCRand related stress responses, where we found individual singlemiRNAs to be capable of dampening expression of hundreds ofmRNAs.
In the marine invertebrate Aplysia californica, miR-124 has beenshown to constrain synaptic plasticity (long-term facilitation)induced by neuronal activation (Rajasethupathy et al., 2009).Also, ablation of all miRNAs in the adult mouse brain increasedsynaptic plasticity (Konopka et al., 2010). We hypothesize thatchanges in the neuronal transcriptome during learning are akinto those of the NCR in that targets of miRNAs are being acti-vated. In such a scenario, miRNAs provide resilience to the tran-scriptome against different exogenous and endogenous stimuli,like those inducing plasticity or stress responses. ManipulatingmiRNAs may not only influence mechanisms of learning andmemory (Rajasethupathy et al., 2009; Konopka et al., 2010) butalso mechanisms engaged by stress, neurotoxicity, and age-relatedevents.
ACKNOWLEDGMENTSWe thank Cei Abreu-Goodger, Stijn van Dongen, and HarpreetSaini for useful discussions, and Cordelia Langford and Peter Ellisfor help with microarrays. This work was supported by the DarwinTrust of Edinburgh, Wellcome Trust and EMBL.
SUPPLEMENTARY MATERIALThe Supplementary Material for this article can be foundonline at http://www.frontiersin.org/Neurogenomics/10.3389/fnins.2012.00156/abstract
Data Sheet 1 | Putative targets of transfected miRNA derived from mRNAprofiling data.
Data Sheet 2 | Gene Lists.
www.frontiersin.org October 2012 | Volume 6 | Article 156 | 9

Manakov et al. Neuronal transcriptome buffering by miRNA
REFERENCESAkahoshi, N., Murashima, Y. L., Himi,
T., Ishizaki, Y., and Ishii, I. (2007).Increased expression of the lyso-somal protease cathepsin S inhippocampal microglia followingkainate-induced seizures. Neurosci.Lett. 429, 136–141.
Barrett, T., Troup, D. B., Wilhite, S. E.,Ledoux, P., Evangelista, C., Kim, I.F., et al. (2011). NCBI GEO: archivefor functional genomics data sets –10 years on. Nucleic Acids Res. 39,D1005–D1010.
Bartel, D. P. (2009). MicroRNAs: tar-get recognition and regulatory func-tions. Cell 136, 215–233.
Benjamini, Y., and Hochberg, Y. (1995).Controlling the false discovery rate:a practical and powerful approach tomultiple testing. J. R. Stat. Soc. SeriesB Methodol. 57, 289–300.
Chi, S., Zang, J., Mele, A., and Darnell,R. (2009). Argonaute HITS-CLIP decodes microRNA-mRNAinteraction maps. Nature 460,479–486.
Christodoulou, F., Raible, F., Tomer, R.,Simakov, O., Trachana, K., Klaus,S., et al. (2010). Ancient ani-mal microRNAs and the evolu-tion of tissue identity. Nature 463,1084–1088.
Conaco, C., Otto, S., Han, J.-J.,and Mandel, G. (2006). Recip-rocal actions of REST and amicroRNA promote neuronal iden-tity. Proc. Natl. Acad. Sci. U.S.A. 103,2422–2427.
Connelly, S., and Manley, J. L. (1988).A functional mRNA polyadenylationsignal is required for transcriptiontermination by RNA polymerase II.Genes Dev. 2, 440–452.
Dichter, M. A. (1978). Rat cortical neu-rons in cell culture: culture methods,cell morphology, electrophysiology,and synapse formation. Brain Res.149, 279–293.
Du, P., Kibbe, W. A., and Lin, S. M.(2008). Lumi: a pipeline for pro-cessing illumina microarray. Bioin-formatics 24, 1547–1548.
Enright, A. J., John, B., Gaul, U.,Tuschl, T., Sander, C., and Marks,D. S. (2003). MicroRNA targets inDrosophila. Genome Biol. 5, R1.
Farh, K. K.-H., Grimson, A., Jan, C.,Lewis, B. P., Johnston, W. K., Lim,L. P., et al. (2005). The widespreadimpact of mammalian microRNAson mRNA repression and evolution.Science 310, 1817–1821.
Flicek, P., Aken, B. L., Beal, K.,Ballester, B., Caccamo, M.,Chen, Y., et al. (2008). Ensembl2008. Nucleic Acids Res. 36,D707–D714.
Flynt, A. S., Thatcher, E. J., Burkewitz,K., Li, N., Liu, Y., and Patton, J. G.(2009). miR-8 MicroRNAs regulatethe response to osmotic stress inzebrafish embryos. J. Cell Biol. 185,115–127.
Friedman, R. C., Farh, K. K.-H., Burge,C. B., and Bartel, D. P. (2009). Mostmammalian mRNAs are conservedtargets of microRNAs. Genome Res.19, 92–105.
Gautier, L., Cope, L., Bolstad, B. M., andIrizarry, R. A. (2004). affy – Analy-sis of affymetrix genechip data atthe probe level. Bioinformatics 20,307–315.
Geiger, T., Wehner, A., Schaab, C., Cox,J., and Mann, M. (2012). Compar-ative proteomic analysis of elevencommon cell lines reveals ubiqui-tous but varying expression of mostproteins. Mol. Cell. Proteomics 11,M111.014050.
Gentleman, R. C., Carey, V. J., Bates, D.M., Bolstad, B., Dettling, M., Dudoit,S., et al. (2004). Bioconductor: opensoftware development for computa-tional biology and bioinformatics.Genome Biol. 5, R80.
Giraldez, A. J., Mishima, Y., Rihel, J.,Grocock, R. J., van Dongen, S.,Inoue, K., et al. (2006). ZebrafishMiR-430 promotes deadenylationand clearance of maternal mRNAs.Science 312, 75–79.
Griffiths-Jones, S., Saini, H. K., vanDongen, S., and Enright,A. J. (2008).miRBase: Tools for microRNAgenomics. Nucleic Acids Res. 36,D154–D158.
Guo, H., Ingolia, N. T., Weiss-man, J. S., and Bartel, D. P.(2010). Mammalian microRNAspredominantly act to decrease tar-get mRNA levels. Nature 466,835–840.
Hornstein, E., and Shomron, N. (2006).Canalization of development bymicroRNAs. Nat. Genet. 38, S20–S24.
Hubbard, T. J. P., Aken, B. L., Ayling, S.,Ballester, B., Beal, K., Bragin, E., et al.(2009). Ensembl 2009. Nucleic AcidsRes. 37, D690–D697.
Kanehisa, M., Araki, M., Goto, S., Hat-tori, M., Hirakawa, M., Itoh, M., etal. (2000). KEGG: Kyoto encyclope-dia of genes and genomes. NucleicAcids Res. 28, 27–30.
Konopka, W., Kiryk, A., Novak, M., Her-werth, M., Parkitna, J. R., Wawrzy-niak, M., et al. (2010). MicroRNAloss enhances learning and mem-ory in mice. J. Neurosci. 30,14835–14842.
Krek, A., Grün, D., Poy, M. N., Wolf, R.,Rosenberg, L., Epstein, E. J., et al.(2005). Combinatorial microRNA
target predictions. Nat. Genet. 37,495–500.
Leung, A. K. L., Calabrese, J. M., andSharp, P. A. (2006). Quantitativeanalysis of Argonaute proteinreveals microRNA-dependentlocalization to stress granules.Proc. Natl. Acad. Sci. U.S.A. 103,18125–18130.
Leung, A. K. L., and Sharp, P. A.(2010). MicroRNA functions instress responses. Mol. Cell 40,205–215.
Lewis, B. P., Burge, C. B., and Bartel,D. P. (2005). Conserved seed pair-ing, often flanked by adenosines,indicates that thousands of humangenes are microRNA targets. Cell120, 15–20.
Lewis, B. P., Shih, I.-H., Jones-Rhoades,M. W., Bartel, D. P., and Burge,C. B. (2003). Prediction of mam-malian microRNA targets. Cell 115,787–798.
Li, X., Cassidy, J. J., Reinke, C. A.,Fischboeck, S., and Carthew, R.W. (2009). A microRNA impartsrobustness against environmentalfluctuation during development.Cell 137, 273–282.
Lim, L. P., Lau, N. C., Garrett-Engele,P., Grimson, A., Schelter, J. M., Cas-tle, J., et al. (2005). Microarrayanalysis shows that some microR-NAs downregulate large numbersof target mRNAs. Nature 433,769–773.
Lu, T., Pan, Y., Kao, S.-Y., Li, C., Kohane,I., Chan, J., et al. (2004). Gene reg-ulation and DNA damage in theageing human brain. Nature 429,883–891.
MacLaren, E. J., Charlesworth, P.,Coba, M. P., and Grant, S. G.N. (2011). Knockdown of men-tal disorder susceptibility genes dis-rupts neuronal network physiologyin vitro. Mol. Cell. Neurosci. 47,93–99.
Makeyev, E. V., Zhang, J., Carrasco,M. A., and Maniatis, T. (2007).The microRNA miR-124 promotesneuronal differentiation by trigger-ing brain-specific alternative pre-mRNA splicing. Mol. Cell 27,435–448.
Manakov, S. A., Grant, S. G. N.,and Enright, A. J. (2009). Recip-rocal regulation of microRNA andmRNA profiles in neuronal develop-ment and synapse formation. BMCGenomics 10, 419. doi:10.1186/1471-2164-10-419
Nelson, P. G. (1975). Nerve and mus-cle cells in culture. Physiol. Rev. 55,1–61.
Ning, Z., Cox, A. J., and Mullikin, J. C.(2001). SSAHA: a fast search method
for large DNA databases. GenomeRes. 11, 1725–1729.
Parkinson, H., Kapushesky, M.,Kolesnikov, N., Rustici, G., Shojata-lab, M., Abeygunawardena, N., et al.(2009). Arrayexpress update – froman archive of functional genomicsexperiments to the atlas of geneexpression. Nucleic Acids Res. 37,D868–D872.
Pruitt, K. D., Tatusova, T., Klimke, W.,and Maglott, D. R. (2009). NCBIreference sequences: current status,policy and new initiatives. NucleicAcids Res. 37, D32–D36.
R. Team. (2008). R: A Language andEnvironment for Statistical Comput-ing. Vienna, Austria: R Foundationfor Statistical Computing.
Rajasethupathy, P., Fiumara, F., Sheri-dan, R., Betel, D., Puthanveettil,S. V., Russo, J. J., et al. (2009).Characterization of small RNAs inAplysia reveals a role for miR-124 in constraining synaptic plas-ticity through CREB. Neuron 63,803–817.
Rybak, A., Fuchs, H., Smirnova, L.,Brandt, C., Pohl, E. E., Nitsch, R., etal. (2008). A feedback loop compris-ing lin-28 and let-7 controls pre-let-7 maturation during neural stem-cell commitment. Nat. Cell Biol. 10,987–993.
Sayers, E. W., Barrett, T., Benson, D. A.,Bolton, E., Bryant, S. H., Canese, K.,et al. (2010). Database resources ofthe national center for biotechnol-ogy information. Nucleic Acids Res.39, D38–D51.
Schratt, G. (2009). MicroRNAs at thesynapse. Nat. Rev. Neurosci. 10,842–849.
Schwanhausser, B., Busse, D., Li,N., Dittmar, G., Schuchhardt, J.,Wolf, J., et al. (2011). Globalquantification of mammalian geneexpression control. Nature 473,337–342.
Selbach, M., Schwanhäusser, B., Thier-felder, N., Fang, Z., Khanin, R.,and Rajewsky, N. (2008). Wide-spread changes in protein synthesisinduced by microRNAs. Nature 455,58–63.
Smyth, G. K. (2004). Linear modelsand empirical bayes methods forassessing differential expression inmicroarray experiments. Stat. Appl.Genet. Mol. Biol. doi: 10.2202/1544-6115.1027
Stark, A., Brennecke, J., Russell, R.B., and Cohen, S. M. (2003).Identification of DrosophilamicroRNA targets. PLoS Biol. 1, e60.doi:10.1371/journal.pbio.0000060.
Thomas-Chollier, M., Sand, O.,Turatsinze, J.-V., Janky, R., Defrance,
Frontiers in Neuroscience | Neurogenomics October 2012 | Volume 6 | Article 156 | 10

Manakov et al. Neuronal transcriptome buffering by miRNA
M., Vervisch, E., et al. (2008).RSAT: regulatory sequence analy-sis tools. Nucleic Acids Res. 36,W119–W127.
van Dongen, S., Abreu-Goodger, C.,and Enright, A. J. (2008). DetectingmicroRNA binding and siRNA off-target effects from expression data.Nat. Methods 5, 1023–1025.
Visvanathan, J., Lee, S., Lee, B., Lee,J. W., and Lee, S.-K. (2007).The microRNA miR-124 antago-nizes the anti-neural REST/SCP1
pathway during embryonic CNSdevelopment. Genes. Dev. 21,744–749.
Xu, P., Vernooy, S. Y., Guo, M., andHay, B. A. (2003). The DrosophilamicroRNA Mir-14 suppresses celldeath and is required for nor-mal fat metabolism. Curr. Biol. 13,790–795.
Conflict of Interest Statement: Theauthors declare that the research wasconducted in the absence of any
commercial or financial relationshipsthat could be construed as a potentialconflict of interest.
Received: 01 June 2012; accepted: 01October 2012; published online: 30 Octo-ber 2012.Citation: Manakov SA, Morton A,Enright AJ and Grant SGN (2012) Aneuronal transcriptome response involv-ing stress pathways is buffered by neu-ronal microRNAs. Front. Neurosci. 6:156.doi: 10.3389/fnins.2012.00156
This article was submitted to Frontiers inNeurogenomics, a specialty of Frontiers inNeuroscience.Copyright © 2012 Manakov, Morton,Enright and Grant . This is an open-access article distributed under the termsof the Creative Commons AttributionLicense, which permits use, distributionand reproduction in other forums, pro-vided the original authors and sourceare credited and subject to any copy-right notices concerning any third-partygraphics etc.
www.frontiersin.org October 2012 | Volume 6 | Article 156 | 11