Embed Size (px)
Citation preview
Association for Information SystemsAIS Electronic Library (AISeL)
PACIS 2018 Proceedings Pacific Asia Conference on Information Systems(PACIS)
6-26-2018
A Network-enhanced Prediction Method forAutomobile Purchase Classification using DeepLearningHan YinRenmin University of China, [email protected]
Yue WangRenmin University of China, [email protected]
Qian LiRenmin University of China, [email protected]
Wei XuRenmin University of China, [email protected]
Ying YuRenmin University of China, [email protected]
See next page for additional authors
Follow this and additional works at: https://aisel.aisnet.org/pacis2018
This material is brought to you by the Pacific Asia Conference on Information Systems (PACIS) at AIS Electronic Library (AISeL). It has beenaccepted for inclusion in PACIS 2018 Proceedings by an authorized administrator of AIS Electronic Library (AISeL). For more information, pleasecontact [email protected].
Recommended CitationYin, Han; Wang, Yue; Li, Qian; Xu, Wei; Yu, Ying; and Zhang, Tao, "A Network-enhanced Prediction Method for AutomobilePurchase Classification using Deep Learning" (2018). PACIS 2018 Proceedings. 111.https://aisel.aisnet.org/pacis2018/111
CORE Metadata, citation and similar papers at core.ac.uk
Provided by AIS Electronic Library (AISeL)

AuthorsHan Yin, Yue Wang, Qian Li, Wei Xu, Ying Yu, and Tao Zhang
This article is available at AIS Electronic Library (AISeL): https://aisel.aisnet.org/pacis2018/111
A Prediction Method for Automobile Purchase Classification
Twenty-Second Pacific Asia Conference on Information Systems, Japan 2018
A Network-enhanced Prediction Method for Automobile Purchase Classification using Deep
Learning Completed Research Paper
Han Yin Renmin University of China
No. 59 Zhongguancun Street, Haidian District Beijing, 100872, P.R. China
Yue Wang Renmin University of China
No. 59 Zhongguancun Street, Haidian District Beijing, 100872, P.R. China
Qian Li Renmin University of China
No. 59 Zhongguancun Street, Haidian District Beijing, 100872, P.R. China
Wei Xu Renmin University of China
No. 59 Zhongguancun Street, Haidian District Beijing, 100872, P.R. China
Ying Yu Renmin University of China
No. 59 Zhongguancun Street, Haidian District Beijing, 100872, P.R. China
Tao Zhang Renmin University of China
No. 59 Zhongguancun Street, Haidian District Beijing, 100872, P.R. China
Abstract
Automobile purchase intentions of customers relate to car dealers’ costs and affect the car dealers’ marketing strategy and manufacturing process in the long term. Automobile purchase
intention classification has become critically important for car dealers. In our paper, we innovatively constructed a hobby based network and a working based network of customers, and used customers’ profile of same group as inputs to the deep learning model to predict
customers’ purchase intention based on community detection by social network analysis. Based on the real-world dataset, our experimental results verify that the framework with both hobby-based network and working-based network using deep learning method has best
performance, which is 14% better than the baseline model. And the hobby-based network outperforms working-based network. Because of the advantage of consumer’s personality, hobbies can be used for better predicting the purchase intention. Therefore, our proposed
framework is a potential tool for automobile purchase intention classification.
Keywords: Automobile purchase, purchase intention classification, social network analysis, deep learning method
A Prediction Method for Automobile Purchase Classification
Twenty-Second Pacific Asia Conference on Information Systems, Japan 2018
Introduction
There has been a dramatic increase in private car ownership in recent years. A survey conducted by Ministry of Commerce shows that the sales volume of automobiles in China reached 28,879,000 in 2017, an increase of 3% over the same period of previous year. Automobile sale has gradually become an important point for the development of the global economy and people's livelihoods. However, the replacement frequency of car is very low because of its high value and long life cycle. For that reason, the competition between car dealers will become increasingly fiercer. Therefore, reducing costs and maintaining a leader position over the competition are the focuses of the car dealers.
Purchase intention prediction can not only reduce the car dealers’ costs, but also affect the car dealers’ marketing strategy in the long term. Therefore, how to correctly match target customers and automobile is a crucial problem that car dealers urgently need to solve. In the study of influential factors, on the one hand, practitioners and academic researchers have made great effort in exploring the characteristics of individuals. On the other hand, individuals to behave in some way varies with the behavior of the group were also considered (Manski 1993). However, the breakthrough point for the study of group influence was relative simple in some extent.
Based on the principle of homophily argued by scholars (Hill et al. 2006), people with different characteristics or backgrounds may show different behavior or make decisions in different ways. Due to the advantage of the network in describing customer heterogeneity, it is used as a tool for studying relationships between customers in our paper. The study of social network analysis (SNA) is essential for understanding how neighbors influence the preference and adoption. The “neighbors” in this paper refers to customers based on something in common. The communities in whole customers’ network can be detected, and the intention of customers in same community can help identify and infer the preference of products for adopter in question to a large extend. Among SNA, researches has long studied the influencers in networks (Zhang et al. 2016). Influencers are “leaders” in network who have ability to influence an exceptional number of their neighbors and can maximum the diffusion of information through connections in network. They are tightly connected with neighbors or bridge two or even more sub-communities in whole network. Therefore, not only the traditional consumer’s characteristics, but also a consumer network value should be considered together into the automobile purchase decision issue.
Most of models for above researches applied regression model, factors analysis (FA) and principle component analysis (PCA) to estimate weight of factors. The advantages of these methodologies are intuitive, reproducible and luminous to other academics and results. Nevertheless, as the volumes of data are increasing in exponential growth, analysis based on linear models is insufficient to satisfy the requirement of academics and practitioners any more (Yi et al.2017). In recent years, utilizing machine learning methods to predict customers purchase decision has become an alternative approach and a popular research direction. Naive Bayesian algorithm, decision tree, Bayes classifier and support vector machine (SVM) (Yi et al.2017), random forest (RF) (Kim et al. 2016) are mainly modeled on customer interest classification. Thus, the idea of using machine learning methods should be transplanted into automobile purchase field.
Consequently, this paper proposes an automobile purchase intention prediction model based on SNA methods and data mining methods. The model not only embodies the traditional contextual attributes, such as age and gender, but also gives full consideration to the influence from group. With the aid of data mining methods, the model can better predict customer interest classification for automobile.
A Prediction Method for Automobile Purchase Classification
Twenty-Second Pacific Asia Conference on Information Systems, Japan 2018
The remainder of the paper is structured as follows. A brief introduction to prior studies is given in Section 2. Section 3 explains how our proposed research framework works. Next, data description and result analysis are described in Section 4. The conclusions and future works are also summarized in Section 5.
Related Works
Automobile Purchase Intention Prediction
The individual behavior prediction has always been a hot issue of sociology (Burt. 1987), psychology (Fishbein and Ajzen. 2011) and business (Mahajan. 1990), namely, predicting which individuals are most likely to take action. Identifying consumer’s preference and intention is significant for car dealers. Many influential factors have already been studied under different conceptual frameworks and methodologies (Knez et al. 2014).
Nowadays, with the public interesting for green technologies, more and more scholars have already studied the adoption about alternative fuel vehicles (AFV). Gender, age, environmental knowledge (Ogarra et al. 2005) and oil price (Popp et al. 2009) were the elements that have been studied by scholars. Knez, Jereb and Obrecht (Knez et al. 2014) identified financial consideration, technical aspects, environmental benefit and vehicle design by k-means cluster analysis method and PCA.
Contextual effects and endogenous effects were distinguished to study the effect on car ownership (Manski 1993; Goetzke and Weinberger 2012). Contextual effects refer to characteristics of individuals, such as household income, race, number of workers in household, presence of child(ren), education. Hafner, Walker and Verplanken (Hafner et al. 2017) pointed out that the car-buying decisions for people fell into six categories: practical issues, financial considerations, trusted information sources, previous experiences, image, and color. Endogenous effects indicate that an individual to behave in some way varies with the behavior of the group (Manski 1993). They found that the endogenous effect is highly significant. The endogenous effects are focused on the influence of group behavior on individuals. Peer influence including friends, commercial, siblings and parents are related with the desire to purchase a different car as the result of the PCA (Belgiawan et al. 2013).
The researches mentioned above conduct an in-depth analysis of numerical and categorical decision making factors, including relevant personnel information, environment knowledge, and social economy. In our paper, constructing a customer profile on the basis of customer contextual characteristics is the foundation of automobile intention prediction. However, the research methods used for analyzing these factors were relatively simple, usually use the regression method. Due to the important application of SNA methods in the field of community detection, therefore, SNA is used for identifying groups of each customer. Customers in the same group tend to behave similarly (Manski 1993). In order to study the endogenous effects of customers, we will utilize the customer’s profile of same group to predict the intention classification of each customer by deep learning method.
Social Network Analysis in Purchase Intention Prediction
Due to homophily of people (McPherson et al. 2001), the great advantages and convenience of social network for information transforming and interaction aroused the attention of the majority of scholars. Parts of scholars have focused on the impact of network features on behavior analysis and decision prediction. Singla, Parag and Richardson et al. (Singla et al. 2008) studied the network built by instant messaging, finding that people who are neighbors are more likely to share interests. Bakshy, Eckles and
A Prediction Method for Automobile Purchase Classification
Twenty-Second Pacific Asia Conference on Information Systems, Japan 2018
Yan et al. (Bakshy et al. 2012) confirmed the influence of minimal social cues for advertising. The consumer’s response for ads has positive relationship between the strength of their connection with an affiliated peer. Weighted brand–brand networks were constructed by the work of Zhang, Bhattacharyya and Bhattacharyya (Zhang et al. 2016), which represent interactions among users and brands with the purpose of identifying the target brand for consumers.
However, most researches in SNA have focused on network features only and neglected the traditional customer features. The combination of customer features and network features in purchase adoption and intention can improve performance considerably. In the field of telecommunication, Hill, Provost and Volinsky (Hill et al. 2006) built consumer networks on the basis of direct interactions, which proved that the model with geographic, demographic, prior purchase data and network attributes achieved the best performance. Bhatt, Chaoji and Parekh (Bhatt et al. 2010) studied the adoption of a paid voice-over IP service by an instant messenger network. They confirmed that combining user features (communication frequency, etc.) and network features (number of network neighbors, etc.) is better than using either user features or network features in isolation. Furthermore, the influencer in social network was one of hot issues in SNA researches. Zhang, Bhattacharyya and Bhattacharyya (Zhang et al. 2016) designed a global ranking algorithm to calculate the influence of brands in network and select influential brands.
Therefore, SNA is used in our paper to analyze the connections between customers, discovering the communities or groups in customers’ network so that we can predict one customer purchase intention by analyzing the behavior patterns of customers in the same community. What’s more, the influence of customers in network should be considered in our paper. And both the customer profiles and influence in network are inputted to the purchase intention prediction model.
Machine Learning Methods in Purchase Decision
With the advent of the Big Data era, the amount of data has grown exponentially, the dimensionality and complexity of the data were also amplified on a large scale so that traditional data analysis methods are no longer suitable. Machine learning (ML) has outstanding performance in dealing with complex data, which can store and process massive amounts of data in real time (Boyd and Crawford 2012). Prediction and description are two main goals of machine learning methods (Portugal et al. 2018). Classification methods are widely applied in prediction of purchase. Many scholars did the corresponding researches.
Gupta and Pathak (Gupta and Pathak 2014) applied logistic regression model to achieve adaptive pricing and purchase prediction, enhancing right price purchase by customers on e-commerce platform. Liu and Shi (Liu and Shi 2016) demonstrated that decision tree has obvious advantages in the efficiency and stability for predicting users' interests than naive Bayesian algorithms. SVM was used in Liu and Li’s study (Liu and Li 2017) to predict purchase behavior on December 18th, 2014. Neural network analysis, SVM, and RF were studied in the study of Kim, Im and Han (Kim et al. 2016) to predict the behavior of purchasers and non-purchasers based on users’ online behavior, and RF showed the highest prediction accuracy.
However, machine learning methods cannot use more attributes hidden in the data set in other forms of the data, which needs multiple and superimposed non-linear and/or linear transformation (Wang and Xu 2018). Therefore, in our paper, we can develop a deep learning method to mine the hidden patterns behind all customers’ characteristics, and then to predict customer’s purchase intention.
A Prediction Method for Automobile Purchase Classification
Twenty-Second Pacific Asia Conference on Information Systems, Japan 2018
The Contribution of Our Work
As aforementioned, data mining methods provide powerful tools for exploring the factors and methods of automobile purchase intention prediction. On one hand, however, previous practitioners and academic researchers have focused on the influential factors for purchase prediction by FA and PCA methods, ignoring the strength of machine learning algorithms for the improvement of prediction accuracy. On the other hand, SNA methodology which can discover communities or groups from customers has not been widely used in endogenous factors analysis of automobile purchase prediction. Therefore, this paper proposes a SNA-based automobile purchase intention prediction method using deep learning method, combing customer profiles. In our method, SNA and deep learning technology are complementary. SNA is employed to achieve community division from whole customers and calculate the influence for all customers in one community. And deep learning is employed to predict customer’s intention classification on the basis of high-quality attributes.
Research Framework
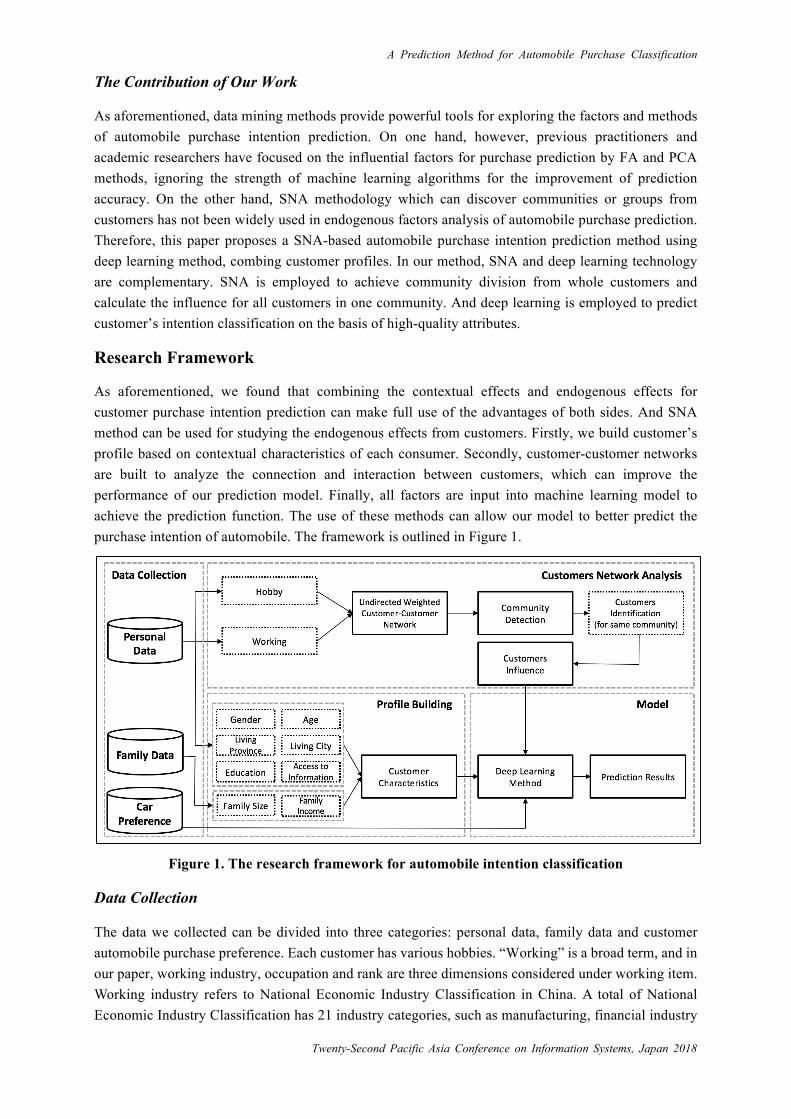
As aforementioned, we found that combining the contextual effects and endogenous effects for customer purchase intention prediction can make full use of the advantages of both sides. And SNA method can be used for studying the endogenous effects from customers. Firstly, we build customer’s profile based on contextual characteristics of each consumer. Secondly, customer-customer networks are built to analyze the connection and interaction between customers, which can improve the performance of our prediction model. Finally, all factors are input into machine learning model to achieve the prediction function. The use of these methods can allow our model to better predict the purchase intention of automobile. The framework is outlined in Figure 1.
Figure 1. The research framework for automobile intention classification
Data Collection
The data we collected can be divided into three categories: personal data, family data and customer automobile purchase preference. Each customer has various hobbies. “Working” is a broad term, and in our paper, working industry, occupation and rank are three dimensions considered under working item. Working industry refers to National Economic Industry Classification in China. A total of National Economic Industry Classification has 21 industry categories, such as manufacturing, financial industry
A Prediction Method for Automobile Purchase Classification
Twenty-Second Pacific Asia Conference on Information Systems, Japan 2018
and education. Occupation includes government staff, technical staff, salesman and so on. Rank represents chairman, manger, and so on. Customer family data refers to family size and family income. Customer automobile preference means customer preferences in a specific car model, directly reflected in whether consumers will buy or not. Thus, the purchase intention prediction in our paper becomes a binary classification problem. All of the above data are structured data, including numeric data and categorical data.
Customers Network Analysis
In our paper, we build two undirected weighted customer-customer networks based on customer hobbies and working situation. Hobby and working situation are regarded as intrinsic force and extrinsic force for customers’ purchase decision. Due to homophily of people, customers are more likely to behave in the same way under similar background. Hobby reflects a person's own preference on the surrounding things to some extent. For example, people who are passionate about sports may prefer more powerful cars. As for working situation, society and public has stable expectation and norms for people in specific working industry, occupation or rank. This phenomenon can be summarized as social norms. The strength of social norms refers to an individual act up to those important others expectations (Belgiawan et al. 2017). Social norms are more important for purchase decisions than the identity constructed from comments (Ozaki and Sevastyanova 2011). Belgiawan, Schmöcker and Abou-Zeid et al. (Belgiawan et al. 2017) quantified the influence of social norms on car purchase intentions of undergraduate students. There is no lack of such thoughts in our life that a manager should sit in a main business-style car. Therefore, hobbies and working situation are chosen as the factors in building customers’ networks. Next, the two customer-customer networks will be analyzed by community detection measures and centrality measures.
Undirected Weighted Customer-Customer Network
As mentioned earlier, for undirected weighted customer-customer networks based on hobbies (hobby based network), the more common hobbies two consumers have, the greater the probability of same automobile preferences. Customers are designated as nodes, an edge between two nodes is created as there is common hobby between two customers. The more common hobbies two consumers have, the larger weight of these two customers. The hobby based network will be defined by mathematical notation and expressions. It is represented by H =< C, E,W >, where the set of C indicate automobile purchase customers, the set of E correspond to the links between customers, and the set of W point the weights of edges. C = c* with c* being a customer having a set of hobbies h* , then, E =c*, c, |h* ∩ h, ≠ ϕ represents the edge of customers network with w*, = |h* ∩ h,| indicating the
number of common hobbies for customer c* and customer c,. Among them, 1 ≤ i, j ≤ N where N equals the total numbers of customers in network. To facilitate later calculation model, the adjacency matrix can be used for representing the intrinsic oriented customer-customer network:
HN*, =w*,ifc*andc,havealink0otherwise
(1)
In the opposite of hobbies, working situation is viewed as extrinsic force for automobile purchase intention. Under the working item, working industry, occupation and rank are three dimensions considered in our paper. The undirected weighted customer-customer network based on working (working based network) is also called extrinsic oriented undirected weighted customer-customer network. Two customers can construct a connection as long as they are at least one same in the
A Prediction Method for Automobile Purchase Classification
Twenty-Second Pacific Asia Conference on Information Systems, Japan 2018
industry, occupation or rank. The working based network is represented by J =< C, E,W >. C = c*
with c* being a customer having a vector with industry, occupation and rank expressed as HI=
(I, O, R). Then, E = c*, c, | HIM∩HIN
≠ ϕ represents the edge of customers network with w*, = |
HIM∩HIN
| indicating the weight of edge between customer c* and customer c,. Among them, 1 ≤
i, j ≤ n where n equals the total numbers of customers in network. And, the adjacency matrix can be used for representing the extrinsic driven customer-customer network:
WN*, =w*,ifc*andc,havealink0otherwise
(2)
Community Detection Algorithm
There are many methods to detect communities, such as the minimum-cut method, hierarchical clustering, Girvan–Newman algorithm and so on. Among all these algorithms, we chose the Label Propagation Algorithm (LPA) (Raghavan et al. 2007). The process of LPA is to initialize every node of the network with a unique label at first; then each node changes its label to the most of its neighbors have, if there are more than one label to choose then it changes to one of them randomly. The second step will repeat until the labels of all the nodes don’t change any more. In the end, nodes that have the same label will form a community.
The main reason why we choose the LPA to detect community is that it is less computationally expensive compared with other algorithms. It only takes an almost linear time to detect the community using LPA. Considering that the network in this paper is dense, using other algorithms will take much more time. What’s more, the LPA doesn’t require any priori information about the network, for example, the number of communities. In other word, it helps us to decide the number of communities.
Customer Influence
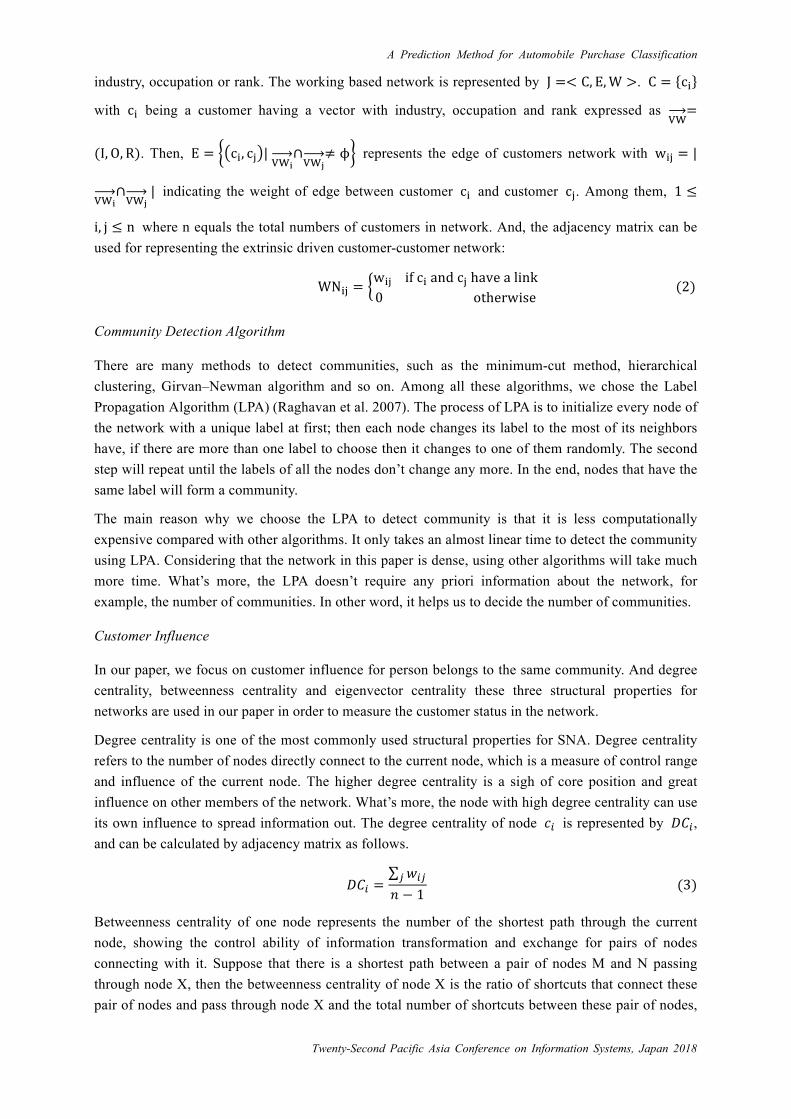
In our paper, we focus on customer influence for person belongs to the same community. And degree centrality, betweenness centrality and eigenvector centrality these three structural properties for networks are used in our paper in order to measure the customer status in the network.
Degree centrality is one of the most commonly used structural properties for SNA. Degree centrality refers to the number of nodes directly connect to the current node, which is a measure of control range and influence of the current node. The higher degree centrality is a sigh of core position and great influence on other members of the network. What’s more, the node with high degree centrality can use its own influence to spread information out. The degree centrality of node 𝑐Q is represented by 𝐷𝐶Q, and can be calculated by adjacency matrix as follows.
𝐷𝐶Q =𝑤QUU
𝑛 − 1(3)
Betweenness centrality of one node represents the number of the shortest path through the current node, showing the control ability of information transformation and exchange for pairs of nodes connecting with it. Suppose that there is a shortest path between a pair of nodes M and N passing through node X, then the betweenness centrality of node X is the ratio of shortcuts that connect these pair of nodes and pass through node X and the total number of shortcuts between these pair of nodes,
A Prediction Method for Automobile Purchase Classification
Twenty-Second Pacific Asia Conference on Information Systems, Japan 2018
measuring to what extent X is at the “middle” of node M and N. The shortcuts equals to the shortest path between two nodes. Thus, the betweenness centrality of node X for pair of nodes M and N (bZ[ X ) is calculated as follows:
bZ[ X =gZ[(X)gZ[
(4)
where gZ[ is the total number of shortcuts between pair of nodes M and N, gZ[ X is shortcuts through node X among them. The summation of the betweenness centrality of node X relative to all pairs of nodes in the network is the betweenness centrality of node X (CZ[_`), which is expressed as follows:
CZ[_` = bZ[ Xa
[
a
Z
(5)
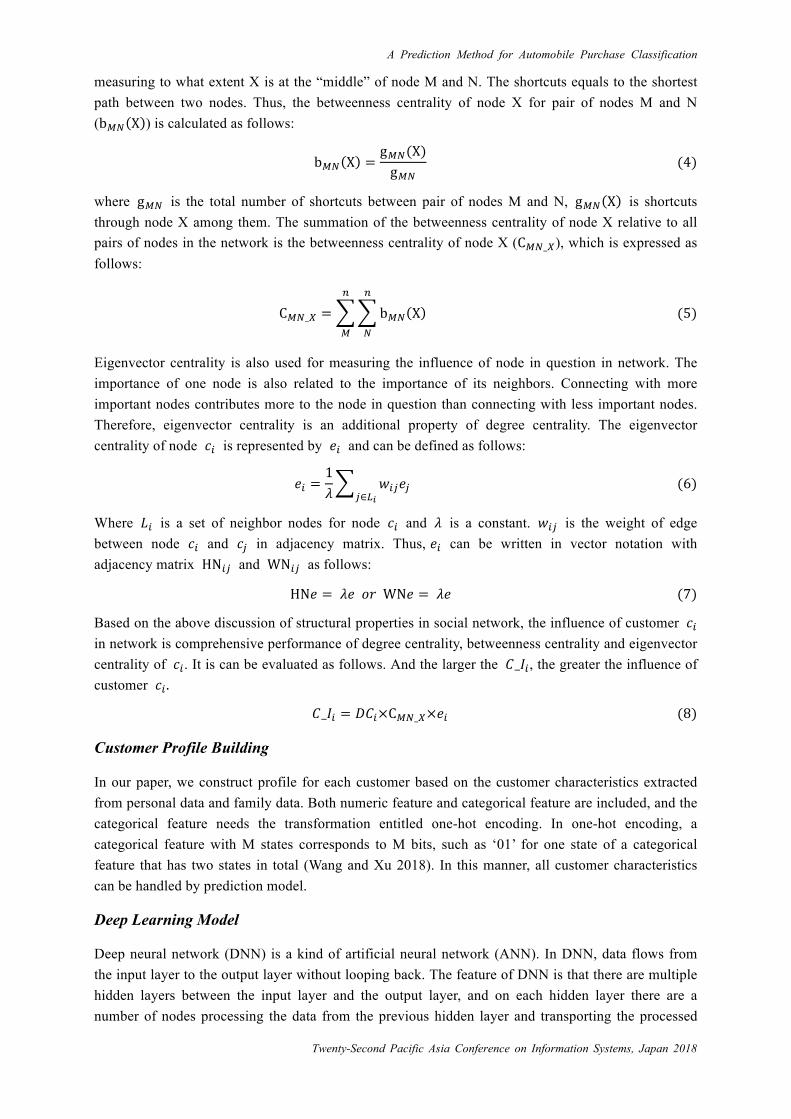
Eigenvector centrality is also used for measuring the influence of node in question in network. The importance of one node is also related to the importance of its neighbors. Connecting with more important nodes contributes more to the node in question than connecting with less important nodes. Therefore, eigenvector centrality is an additional property of degree centrality. The eigenvector centrality of node 𝑐Q is represented by 𝑒Q and can be defined as follows:
𝑒Q =1𝜆
𝑤QU𝑒UU∈fg
(6)
Where 𝐿Q is a set of neighbor nodes for node 𝑐Q and 𝜆 is a constant. 𝑤QU is the weight of edge between node 𝑐Q and 𝑐U in adjacency matrix. Thus, 𝑒Q can be written in vector notation with adjacency matrix HNQU and WNQU as follows:
HN𝑒 = 𝜆𝑒𝑜𝑟WN𝑒 = 𝜆𝑒(7)
Based on the above discussion of structural properties in social network, the influence of customer 𝑐Q in network is comprehensive performance of degree centrality, betweenness centrality and eigenvector centrality of 𝑐Q. It is can be evaluated as follows. And the larger the 𝐶_𝐼Q, the greater the influence of customer 𝑐Q.
𝐶_𝐼Q = 𝐷𝐶Q×CZ[_`×𝑒Q(8)
Customer Profile Building
In our paper, we construct profile for each customer based on the customer characteristics extracted from personal data and family data. Both numeric feature and categorical feature are included, and the categorical feature needs the transformation entitled one-hot encoding. In one-hot encoding, a categorical feature with M states corresponds to M bits, such as ‘01’ for one state of a categorical feature that has two states in total (Wang and Xu 2018). In this manner, all customer characteristics can be handled by prediction model.
Deep Learning Model
Deep neural network (DNN) is a kind of artificial neural network (ANN). In DNN, data flows from the input layer to the output layer without looping back. The feature of DNN is that there are multiple hidden layers between the input layer and the output layer, and on each hidden layer there are a number of nodes processing the data from the previous hidden layer and transporting the processed
A Prediction Method for Automobile Purchase Classification
Twenty-Second Pacific Asia Conference on Information Systems, Japan 2018
data to the next hidden layer. These hidden layers enable DNN to model complicated non-linear relationships by using the activation function. (The activation function we used in this paper is ReLU, which is believed to avoid the gradient vanish of error.) (Glorot et al. 2012)
However, these hidden layers may model rare dependencies in the training data, which makes the model prone to overfitting. To solve this problem, regularization methods are applied during the training process. In addition to the L1 regularization method and L2 regularization method, dropout regularization can combat overfitting by randomly omitting units in the hidden layers to exclude rare dependencies (Dahl et al. 2013).
Empirical Analysis
Data Description
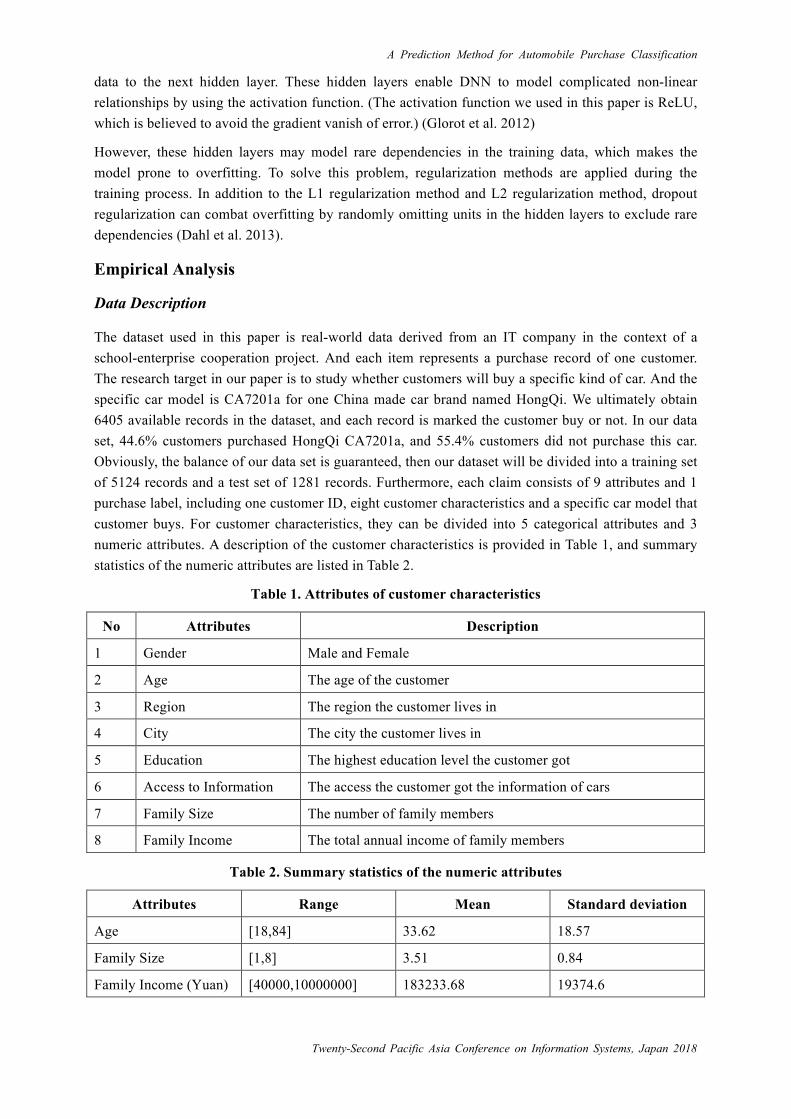
The dataset used in this paper is real-world data derived from an IT company in the context of a school-enterprise cooperation project. And each item represents a purchase record of one customer. The research target in our paper is to study whether customers will buy a specific kind of car. And the specific car model is CA7201a for one China made car brand named HongQi. We ultimately obtain 6405 available records in the dataset, and each record is marked the customer buy or not. In our data set, 44.6% customers purchased HongQi CA7201a, and 55.4% customers did not purchase this car. Obviously, the balance of our data set is guaranteed, then our dataset will be divided into a training set of 5124 records and a test set of 1281 records. Furthermore, each claim consists of 9 attributes and 1 purchase label, including one customer ID, eight customer characteristics and a specific car model that customer buys. For customer characteristics, they can be divided into 5 categorical attributes and 3 numeric attributes. A description of the customer characteristics is provided in Table 1, and summary statistics of the numeric attributes are listed in Table 2.
Table 1. Attributes of customer characteristics
No Attributes Description
1 Gender Male and Female
2 Age The age of the customer
3 Region The region the customer lives in
4 City The city the customer lives in
5 Education The highest education level the customer got
6 Access to Information The access the customer got the information of cars
7 Family Size The number of family members
8 Family Income The total annual income of family members
Table 2. Summary statistics of the numeric attributes
Attributes Range Mean Standard deviation
Age [18,84] 33.62 18.57
Family Size [1,8] 3.51 0.84
Family Income (Yuan) [40000,10000000] 183233.68 19374.6
A Prediction Method for Automobile Purchase Classification
Twenty-Second Pacific Asia Conference on Information Systems, Japan 2018
The performance measures
To evaluate the performance of the proposed framework for customers’ automobile purchase prediction, the accuracy is not enough for the classification problems. Usually, Precision and F1 score are two more classical indicators will be applied to measure the performance of the model built. As we have pointed out above, the problem in our paper is a binary classification issue. For the binary classification issue, there are four basic indicators: accuracy, precision, recall and F1-score.
Accuracy reflects the judgment ability of the classifier for the whole sample. And, precision refers to the proportion of real positive samples in the positive prediction results by the classifier. Recall refers to how much positive samples can be found in the all real positive samples. However, some scholars have point out that it is easy to achieve high precision or recall, it is difficult to develop a model with high precision and recall at the same time (Harrington, P. 2012). Due to the combination of precision and recall, F1 score is used in our paper as one criterion.
Community Detection Results
In our paper, hobby based network and working based network are constructed. And then, label propagation algorithm is used for community detection. For hobby based network, 3 communities are detected and 4 communities for working based network. All the customers are numbered in our paper by letter “C” and numbers from 1 to 6405 randomly, like “C33” and “C128”.
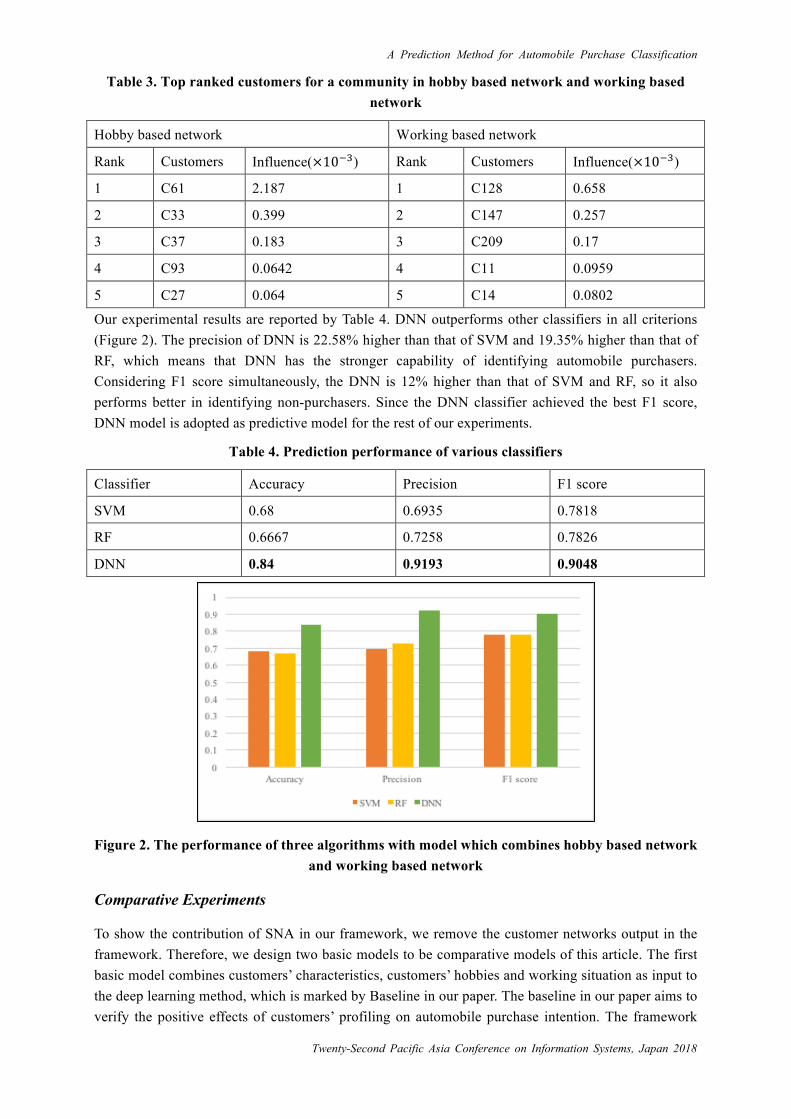
After community detection, we calculated the influence of one customer in community. The degree centrality of one customer is represented by the size of a node. Bigger points higher influence. Table 3 shows the 5 most influential customers for hobby based network and working based network respectively. A rank of “1” indicates the most influential customers in one community. The influence of a customer is derived from our calculation method developed in Section Customer Influence.
Experiments for predictive models
We evaluate the performance of the proposed prediction framework in our paper and other well-known machine learning classifiers such as SVM and RF. In order to achieve best performance, we need to set proper parameters of classifiers. Firstly, the features of Random Forest include the number of features that each tree could use to train the model, the number of trees and the maximum depth of trees. When the number of features increase, each tree could employ more data to build the model, however, the diversity of trees will decrease. The model could be more precise when there are more trees, but it will take longer time to train the model. And to avoid the over-fitting problem and the under-fitting problem, we need to tune the maximum depth of trees effectively. To decide these parameters, we used grid search and the result is that the number features is the square root of the number of all features, the number of trees is 50 and the maximum depth of trees is 5. Next, as for the SVM model, we choose the RBF kernel because it outperforms other kernels. The grid search is also employed to find the gamma and penalty factor C to achieve the best performance. The result of is that gamma=0.15 and C=1. Third, to build the DNN architecture, we need to decide the number of hidden layers. We noticed that the performance of DNN increased little when the number of hidden layers is more than 6. Therefore, the number of hidden layers is set as 6. To avoid a gradient vanish, DNN uses ReLU as the activation function. The dropout probability is 0.2. Moreover, the learning rate starts at 0.1 and decreases as the epoch increases. And, 10-fold cross-validation is used in our paper to ensure the validity of the three algorithms.
A Prediction Method for Automobile Purchase Classification
Twenty-Second Pacific Asia Conference on Information Systems, Japan 2018
Table 3. Top ranked customers for a community in hobby based network and working based network
Hobby based network Working based network
Rank Customers Influence(×10qr) Rank Customers Influence(×10qr)
1 C61 2.187 1 C128 0.658
2 C33 0.399 2 C147 0.257
3 C37 0.183 3 C209 0.17
4 C93 0.0642 4 C11 0.0959
5 C27 0.064 5 C14 0.0802
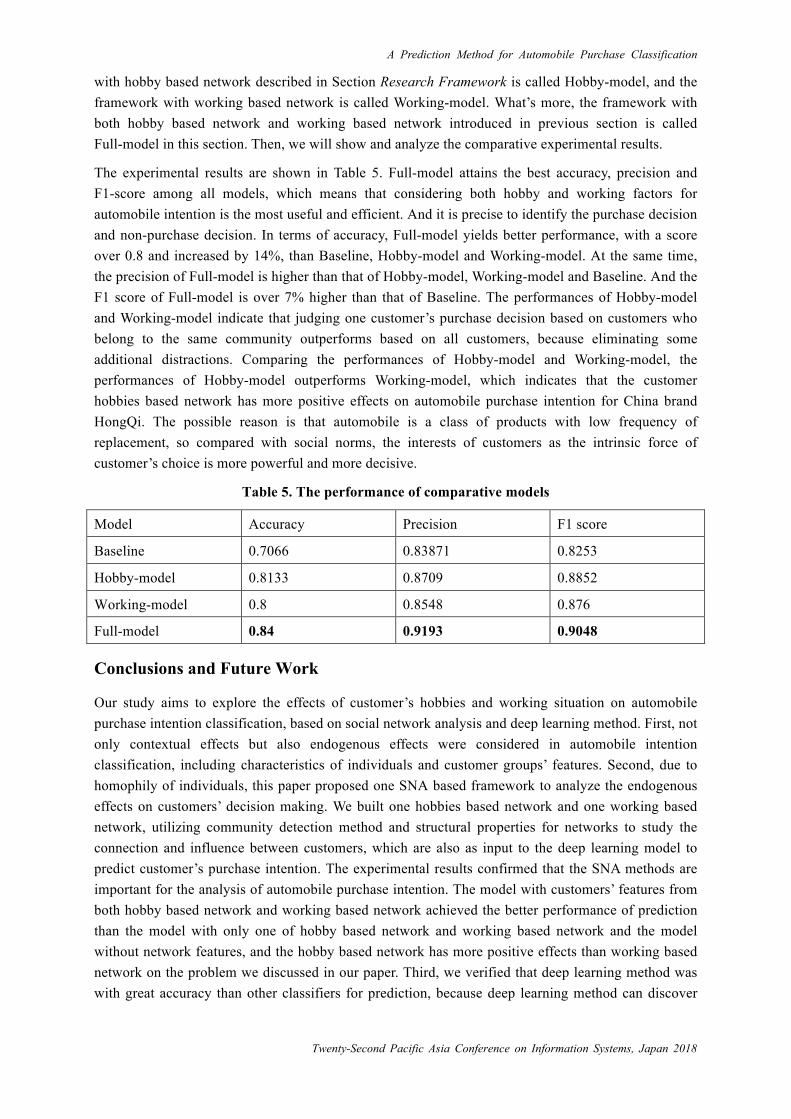
Our experimental results are reported by Table 4. DNN outperforms other classifiers in all criterions (Figure 2). The precision of DNN is 22.58% higher than that of SVM and 19.35% higher than that of RF, which means that DNN has the stronger capability of identifying automobile purchasers. Considering F1 score simultaneously, the DNN is 12% higher than that of SVM and RF, so it also performs better in identifying non-purchasers. Since the DNN classifier achieved the best F1 score, DNN model is adopted as predictive model for the rest of our experiments.
Table 4. Prediction performance of various classifiers
Classifier Accuracy Precision F1 score
SVM 0.68 0.6935 0.7818
RF 0.6667 0.7258 0.7826
DNN 0.84 0.9193 0.9048
Figure 2. The performance of three algorithms with model which combines hobby based network and working based network
Comparative Experiments
To show the contribution of SNA in our framework, we remove the customer networks output in the framework. Therefore, we design two basic models to be comparative models of this article. The first basic model combines customers’ characteristics, customers’ hobbies and working situation as input to the deep learning method, which is marked by Baseline in our paper. The baseline in our paper aims to verify the positive effects of customers’ profiling on automobile purchase intention. The framework
A Prediction Method for Automobile Purchase Classification
Twenty-Second Pacific Asia Conference on Information Systems, Japan 2018
with hobby based network described in Section Research Framework is called Hobby-model, and the framework with working based network is called Working-model. What’s more, the framework with both hobby based network and working based network introduced in previous section is called Full-model in this section. Then, we will show and analyze the comparative experimental results.
The experimental results are shown in Table 5. Full-model attains the best accuracy, precision and F1-score among all models, which means that considering both hobby and working factors for automobile intention is the most useful and efficient. And it is precise to identify the purchase decision and non-purchase decision. In terms of accuracy, Full-model yields better performance, with a score over 0.8 and increased by 14%, than Baseline, Hobby-model and Working-model. At the same time, the precision of Full-model is higher than that of Hobby-model, Working-model and Baseline. And the F1 score of Full-model is over 7% higher than that of Baseline. The performances of Hobby-model and Working-model indicate that judging one customer’s purchase decision based on customers who belong to the same community outperforms based on all customers, because eliminating some additional distractions. Comparing the performances of Hobby-model and Working-model, the performances of Hobby-model outperforms Working-model, which indicates that the customer hobbies based network has more positive effects on automobile purchase intention for China brand HongQi. The possible reason is that automobile is a class of products with low frequency of replacement, so compared with social norms, the interests of customers as the intrinsic force of customer’s choice is more powerful and more decisive.
Table 5. The performance of comparative models
Model Accuracy Precision F1 score
Baseline 0.7066 0.83871 0.8253
Hobby-model 0.8133 0.8709 0.8852
Working-model 0.8 0.8548 0.876
Full-model 0.84 0.9193 0.9048
Conclusions and Future Work
Our study aims to explore the effects of customer’s hobbies and working situation on automobile purchase intention classification, based on social network analysis and deep learning method. First, not only contextual effects but also endogenous effects were considered in automobile intention classification, including characteristics of individuals and customer groups’ features. Second, due to homophily of individuals, this paper proposed one SNA based framework to analyze the endogenous effects on customers’ decision making. We built one hobbies based network and one working based network, utilizing community detection method and structural properties for networks to study the connection and influence between customers, which are also as input to the deep learning model to predict customer’s purchase intention. The experimental results confirmed that the SNA methods are important for the analysis of automobile purchase intention. The model with customers’ features from both hobby based network and working based network achieved the better performance of prediction than the model with only one of hobby based network and working based network and the model without network features, and the hobby based network has more positive effects than working based network on the problem we discussed in our paper. Third, we verified that deep learning method was with great accuracy than other classifiers for prediction, because deep learning method can discover
A Prediction Method for Automobile Purchase Classification
Twenty-Second Pacific Asia Conference on Information Systems, Japan 2018
and utilize the hidden patterns of dataset more efficiency. The experimental results also verified that deep learning method is effective.
The model proposed in this paper can be improved in several aspects. Firstly, this method can be verified on more automobile brands and car models. The main audiences of different car brands are different, so the customers’ behaviors are different. Secondly, cars are also made up of different features. Therefore, future work will focus on different strength of contextual effects and endogenous effects on different car features. Thirdly, with the popularity of online shopping, we can move our algorithm to online purchase classification problem, and make full use of people online behaviors.
Acknowledgment
This work was supported in part by the National Natural Science Foundation of China (Grant No. 71301163, 71771212), Humanities and Social Sciences Foundation of the Ministry of Education (No. 14YJA630075, 15YJA630068), the People’s Livelihood Investigation Project of Social Sciences Development Fund (201701602), Fundamental Research Funds for the Central Universities, and Research Funds of Renmin University of China (No. 15XNLQ08). Qian Li and Wei Xu are the corresponding authors.
References
Ajzen, I., and Fishbein, M. 1980. Understanding Attitudes and Predicting Social Behavior. PRENTICE-HALL.
Bakshy, E., Eckles, D., Yan, R., and Rosenn, I. 2012. “Social Influence in Social Advertising: Evidence from Field Experiments,” ACM Conference on Electronic Commerce, pp. 146-161.
Belgiawan, P., Schmöcker, J., and Fujii, S. 2013. “Effects of Peer Influence, Satisfaction and Regret on Car Purchase Desire,” Procedia Environmental Sciences (17), pp. 485-493.
Belgiawan, P., Schmöcker, J., Abou-Zeid, M., Walker, J., and Fujii, S. 2017. “Modelling Social Norms: Case Study of Students’ Car Purchase Intentions,” Travel Behaviour and Society (7), pp. 12-25.
Bhatt, R., Chaoji, V., and Parekh, R. 2010. “Predicting Product Adoption in Large-Scale Social Networks,” ACM International Conference on Information and Knowledge Management, pp. 1039-1048.
Boyd, D., and Crawford, K. 2012. “Critical Questions for Big Data: Provocations for a Cultural, Technological, and Scholarly Phenomenon,” Informacios Tarsadalom (15:2), pp. 662-679.
Burt, R. S. 1987. “Social Contagion and Innovation: Cohesion Versus Structural Equivalence,” American Journal of Sociology (92:6), pp. 1287-1335.
Dahl, G. E., Sainath, T. N., and Hinton, G. E. 2013. “Improving Deep Neural Networks for LVCSR Using Rectified Linear Units and Dropout,” IEEE International Conference on Acoustics, Speech and Signal Processing, pp. 8609-8613.
Fishbein M, Ajzen I. 2011. Predicting and Changing Behavior: The Reasoned Action Approach. New York: Taylor & Francis.
Glorot, X., Bordes, A., and Bengio, Y. 2012. “Deep Sparse Rectifier Neural Networks,” International Conference on Artificial Intelligence and Statistics, pp. 315-323.
Goetzke, F., and Weinberger, R. 2012. “Separating Contextual from Endogenous Effects in Automobile Ownership Models,” Environment and Planning A (44:5), pp. 1032-1046.
Gupta, R., and Pathak, C. 2014. “A Machine Learning Framework for Predicting Purchase by Online Customers based on Dynamic Pricing,” Procedia Computer Science (36), pp. 599-605.
Hafner, R., Walker, I., and Verplanken, B. 2017. “Image, Not Environmentalism: A Qualitative
A Prediction Method for Automobile Purchase Classification
Twenty-Second Pacific Asia Conference on Information Systems, Japan 2018
Exploration of Factors Influencing Vehicle Purchasing Decisions,” Transportation Research Part A: Policy and Practice (97), pp. 89-105.
Harrington, P. 2012. Machine Learning in Action. Manning Publications Co. Hill, S., Provost, F., and Volinsky, C. 2006. “Network-Based Marketing: Identifying Likely Adopters
via Consumer Networks,” Statistical Science (21:2), pp. 256-276. Kim, M., Im, I., and Han, S. 2016. “Purchase Prediction by Analyzing Users’ Online Behaviors Using
Machine Learning and Information Theory Approaches,” Asia Pacific Journal of Information Systems (26:1), pp. 66-79.
Knez, M., Jereb, B., and Obrecht, M. 2014. “Factors Influencing the Purchasing Decisions of Low Emission Cars: A study of Slovenia,” Transportation Research Part D: Transport and Environment (30), pp. 53-61.
Liu, B., and Shi, Y. 2016. “Prediction of User's Purchase Intention Based on Machine Learning,” 2016 3rd International Conference on Soft Computing & Machine Intelligence, pp. 99-103.
Liu, X., and Li, J. 2017. “Using Support Vector Machine for Online Purchase Predication,” International Conference on Logistics, Informatics and Service Sciences.
Mahajan, V., Muller, E., and Bass, F. M. 1990. “New Product Diffusion Models in Marketing: A Review and Directions for Research,” Journal of Marketing (54:1), pp. 1-26.
Manski, C. F. 1993. “Identification of Endogenous Social Effects: The Reflection Problem,” Review of Economic Studies (60:3), pp. 531-542.
McPherson, M., Smith-Lovin, L., and Cook, J. 2001. “Birds of a Feather: Homophily in Social Networks,” Annual Review of Sociology (27:1), pp. 415-444.
O’Garra, T., Mourato, S., and Pearson, P. 2005. “Analysing Awareness and Acceptability of Hydrogen Vehicles: A London Case Study,” International Journal of Hydrogen Energy (30:6), pp. 649-659.
Ozaki, R., and Sevastyanova, K. 2011. “Going Hybrid: An Analysis of Consumer Purchase Motivations,” Energy Policy (39:5), pp. 2217-2227.
Popp, M., Van de Velde, L., Vickery, G., Van Huylenbroeck, G., Verbeke, W., and Dixon, B. 2009. “Determinants of Consumer Interest in Fuel Economy: Lessons for Strengthening the Conservation Argument,” Biomass and Bioenergy (33:5), pp. 768-778.
Portugal, I., Alencar, P., and Cowan, D. 2018. “The Use of Machine Learning Algorithms in Recommender Systems: A Systematic Review,” Expert Systems with Applications (97), pp. 205-227.
Raghavan, U., Albert, R., and Kumara, S. 2007. “Near Linear Time Algorithm to Detect Community Structures in Large-scale Networks,” Physical Review E (76:3), pp. 036106-36106
Singla, Parag, Richardson, and Matthew. 2008. “Yes, There is a Correlation: - from Social Networks to Personal Behavior on the Web,” Environmental Geology (58:8), pp. 1627-1628.
Wang, Y., and Xu, W. 2018. “Leveraging Deep Learning with LDA-based Text Analytics to Detect Automobile Insurance Fraud,” Decision Support Systems (105), pp. 87-95.
Yi, Z., Yada, K., and Ali, A. B. M. S. 2017. “Prediction of Consumer Purchasing in a Grocery Store Using Machine Learning Techniques,” Computer Science and Engineering, pp. 18-25.
Zhang, K., Bhattacharyya, S., and Ram, S. 2016. “Large-Scale Network Analysis for Online Social Brand Advertising,” MIS Quarterly (40:4), pp. 849-868.


![Prediction of the Enhanced Out-of-Plane Thermal Conductivity ...tride nanoparticles in epoxy composites [5]. Hong [4] et al. enhanced the thermal con-ductivity of epoxy composites](https://img.pdfslide.us/doc/110x75/60ee5ed6898096425f1dcc69/prediction-of-the-enhanced-out-of-plane-thermal-conductivity-tride-nanoparticles.jpg)