Embed Size (px)
Citation preview
2011
A N N U A L REPORT

Chairperson’s Report 7
Chief Executive Officer’s Report 10
Cross Cutting Matters 12
- Corporate Governance 12
- Regulatory and Legislative Governance 12
- Review of Namibia’s Energy Regulatory and Legislative Framework 14
- Namibian Electricity Distribution Industry Restructuring Process 15
- Human Capital Management 15
- Corporate Social Investment (CSI) 19
- International Relations and Partnerships 20
Economic Regulation 20
- Single Buyer Model 24
Industry Analysis 25
- Industry Overview and Structure 25
- Key Players in the Electricity Sector 25
- Electricity Supply Challenges 27
- Impact of Imports on the Supply of Electicity 28
Licensing 30
New Licenses Granted 32
- Independant Power Producers (IPPs) 34
Renewable Energy And Energy Efficiency Activities 34
Technical Regulation 37
Annual Financial Statements 41
1.
C O N T E N T S

VisionTo be recognised as a leading regulator for
achieving optimum viability and competition in
the Namibian energy industry
Mission StatementTo regulate and control the Namibian ESI in the
interest of all stakeholders with regard to price,
quality and reliability
Corporate Values
ProfessionalismTo conduct every task to a standard of excellence and to maintain the highest level
of technical competence and personal integrity/efficiency so as to ensure the
satisfaction of all stakeholders
IntegrityTo be accountable and act in accordance with government policy and accept full
responsibility for all outcomes; to be transparent, open, honest and fair in all dealings
and communications with stakeholders
InnovationTo innovate through learning, teamwork and knowledge-sharing in order to remain
competitive in the market and to continue to deliver excellent service
SustainabilityTo ensure the endowment of Namibia’s energy resources are available to present
and future generations by considering our economic, environmental and social
responsibility
2.
3.
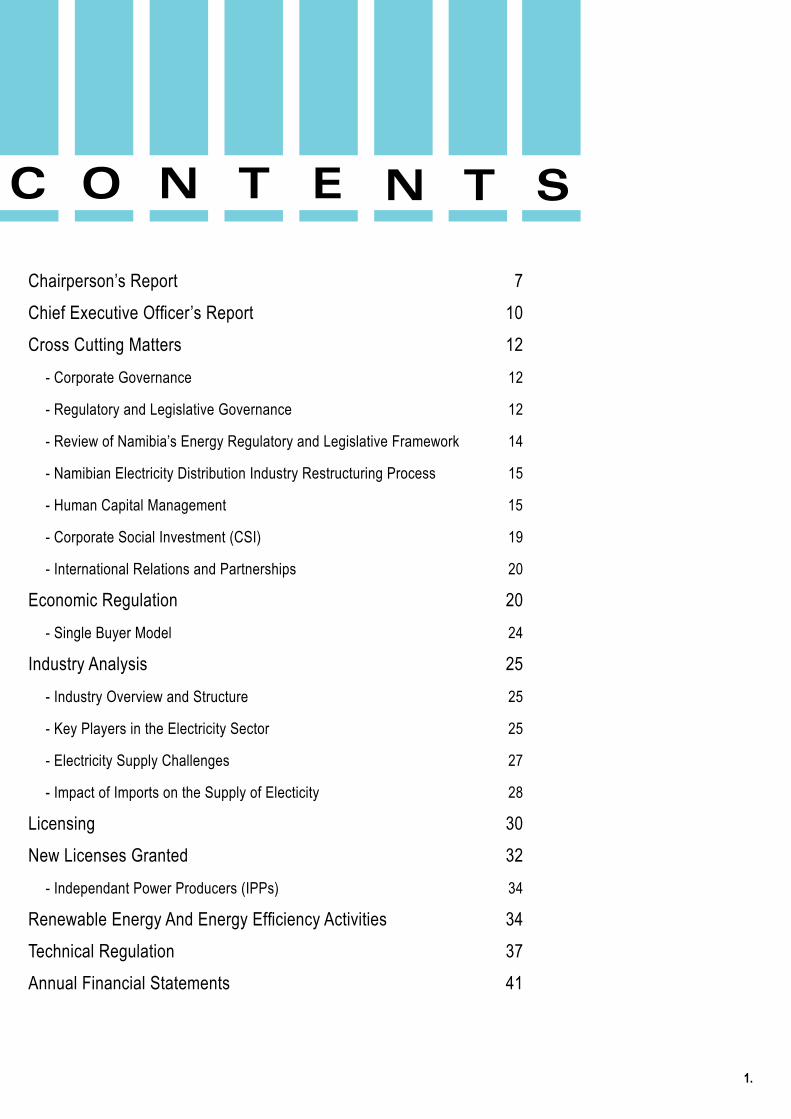
Abbreviations/AcronymsAFUR - African Forum for Utility RegulationCBI - Capacity Building InstituteCEC - Copper Belt Energy CorporationCENORED - Central Northern ElectricityCEO - Chief Executive Officer CSI - Corporate Social InvestmentDSM - Demand Side ManagementECB - Electricity Control BoardEDI - Electricity Distribution InstituteELS - Commonwealth Special Advisory Services Division: Economic and Legal SectionEPMS - Employee Performance SystemESI - Electricity Supply IndustryETSIP - Education and Training Sector Improvement ProgrammeFIG - FigureG - GenerationHIV - Human Immune Deficiency VirusIPP - Independent Power ProducerskWh - Kilo Watt HourLA - Local AuthorityLHPC - Lunsemfwa Hydro Power CompanyLPU - Larger Power UserLRMC - Long Run National CostMME - Ministry of Mines and EnergyMW - Mega WattsNAMCOR - Namibia Petroleum CorporationNAMPOWER - Namibia Power CorporationNAMREP - Namibia Renewable Programme
NEF - National Energy RegulatoryNIRP - National Integrated Resource PlanNESC - Namibia Electricity Safety CodeNGO - Non Govermental OrganisationNMC - Namibia Medical CareNORED - Northern Electricity DistributorNP - NamPowerPPA - Power Purchase AgreementPV - PhotovoltaicQoS - Quality of SupplyQoSS - Quality of Supply and ServiceQoSSS - Quality of Supply and Service StandardsRE - Renewable EnergyRED’s - Regional Electricity DistributorsRERA - Regional Electricity Regulators Association of Southern AfricaREEEI - Renewable Energy and Energy Efficiency InstituteREEEP - Renewable Energy and Energy Efficiency ProgrammeRC - Regional CouncilSADC - Southern Africa Development CommunitySAPP - Southern African Power PoolSNIED - Sam Nujoma Innovative Enterprise DevelopmentT - TransmissionTOU - Time of UseZESA - Zambian Electricity Supply Agency

FLTR: Front: Mr Jason Nandago (Chairperson) and Mrs Panduleni Shimutwikeni (Vice Chairperson) Back: Mr Gottlieb Hinda, Mr Siseho C. Simasiku (CEO and Ex Officio Board Member),
Mr Fritz Jeske and Mr Gersom Katjimune
ECB Board Members
4.
Mr Jason Nandago
(Chairperson of the Board and member of the Human
Resources and Remuneration and Pricing and Tariffs Sub-
Committees)
Economist with 19 years experience
Currently Managing Director of Metropolitan Namibia (Pty) Ltd
Mrs Panduleni N. Shimutwikeni
(Vice Chairperson of the Board and Chairperson of the Human
Resources and Remuneration sub-Committee)
Lawyer
Currently the Secretary to the National Council of Namibia
Mr Fritz Jeske
(Member of the Board and the Finance and Audit Committee and
Chairperson of the Pricing and Tariffs Committee)
Namibian professional electric engineer
35 years experience in Electrical Engineering
Currently CEO of Bicon Namibia Consulting Engineers
Mr Gersom Katjimune
(Member of the Board and Chairperson of the Finance and
Audit Subcommittee)
Economist
Currently a farmer who recently retired as Managing Director
of Mutual & Federal Insurance Company of Namibia Ltd
Mr Gottlieb Hinda
(Member of the Board only, no Subcommittee membership
allocation)
Financial and Investment Expert
Currently the Head of Business Support and Development at
the Development Bank of Namibia
ECB Board Members and their membership to the Respective Board Subcommittees

Ms Helene Vosloo
Manager: Economic Regulation
Ms Mara Uazenga
GM: Administration and Finance
Mr Rojas Manyame
GM: Regulation
Ms Damoline Muruko
Manager: Corporate Communications
and Legal Services
5.
Management
Mr Siseho C Simasiku
Chief Executive Officer
E C B
Dr Maxwell Muyambo
Manager: Technical Regulation
Vacant
Manager: Regulatory Support Services
6.
Mr
Jaso
n N
and
ago
- C
hai
rper
son
Chairperson’s Report
On behalf of the Board it is my esteemed honour to introduce and present to you the Electricity Control
Board’s (ECB) Annual Report 2011 aimed at providing a synopsis of its operations, the Electricity Supply
Industry (ESI) and its Audited Financial Statements for the year ended 31 March 2011. The Board, in
addition, proudly bids farewell to a strategic era from 2006-2010; a period where the ECB achieved various
Regulatory milestones.
The milestones celebrated by the ECB range from the revision and repeal of the Electricity Act 2 of 2000
(2000 Act) and its Administrative Regulations that were repealed in 2007 by the Electricity Act 4 of 2007
(2007 Act). During the first five years of the operation of the 2000 Act, it became evident that reform
was required not only to achieve performance improvement but also to match outside changes nationally,
regionally and internationally. Such reform would aim at -
• Increasingprivatesectorparticipationtomobilizefinance;
• Promotingcompetitionamongsectorentities;
• Increasingthesector’sefficiency;
• Increasingthepenetrationandimprovethereliabilityandqualityofelectricitysupply;
• Ensuringreasonableandaffordabletariffs.
It is imperative to address in short to what extent the ECB as regulator and advisor to Government on issues
pertaining to the ESI, has met these pertinent goals over its last ten years of Regulation. The ECB has during
the year under review engaged extensively with Government on pertinent issues including, amongst others,
the following:
• Implementation of Cost Reflective Tariffs which resulted in Government extending the deadline on cost
reflectivity to 2011/2012;
• Overall tariff Review process;
• Discussions on the Restructuring of the Electricity Distribution Industry (EDI) into five REDs as agreed
initially (but the situation has reached an impasse and a clear position will be taken after the finalisation
of the Study currently being carried out by the ESI on the legislative framework for the REDs and the
subsequent EDI Summit to be arranged by the Minister of Mines and Energy);
• Engagement and seeking approval on the ECB building was extensively discussed with the Minister as the
ECB is exploring migrating to being a multi sectoral Regulator.
As pertains to governance, the ECB has consistently spearheaded projects related to the drafting of policy
and legislative frameworks for the industry and has embarked on a very strategic project of reforming the
legal frameworks for the energy industry and more particularly for its transformation from an electricity
regulator to a multi sectoral energy regulator.
As I mentioned in my last Report (2010) security of supply is a recurring agenda item and I am pleased
to report that the measures taken by the ECB have enabled it to make progress in fulfilling its statutory
mandate of attracting private investment into the ESI. The ECB in this regard has not only been inundated
with numerous enquiries but has also issued a total of nine conditional licenses for generation to intending
Independent Power Producers (IPPs). Private sector interest has been overwhelming in renewable energy
resources with solar and wind being the most sought after. Perhaps unsurprisingly, thanks to the protracted
Power Purchase Agreement (PPA) negotiations due the relatively high cost of renewable energy none of
them are operational to date. Once completed, the National Integrated Resources Plan (NIRP) currently
being developed will further enhance ECB’s efforts to attract private sector investment in generation.
7.
The ECB is proud to announce that the national utility, NamPower, has reached cost reflectivity. However
tariffs will continue to rise to reflect the long run marginal cost (LRMC) of supply especially for the new
generation projects expected to come on board during the next ten years. This is necessary to ensure new
investment in the generation sector to balance the demand but also to ensure that consumers are protected
from tariff spikes.
The ECB recognizes that the path to cost reflectivity has had an impact on the end consumers, particularly
the “Poor” and this is exacerbated by the fact that Namibia has a high unemployment rate (estimated at
over 50%).
The ECB, in order to alleviate the plight as alluded to above, has embarked upon a project to investigate the
introduction of ‘pro-poor tariffs’ in Namibia. That should, however, be viewed as a temporary intervention
and, instead, the long term solution lies in using electricity to empower people to engage in economic
activities that would not have been possible without access to electricity. That would, in line with the ideals
of Vision 2030, enable many people to migrate from the ‘poor people’ category who cannot afford to pay
for electricity.
It would be an oversight on my part if I omit to congratulate our latest addition to the Board of ECB, Mr
Gottlieb Fabianus Hinda, who joined the ECB in March 2011. He brings with him a wide range of financial
sector experience and skills which will be invaluable to the Board especially in the transformation of the ECB
into an energy Regulator. The Board heartily welcomes him on board.
I wish to thank the Minister of Minister of Mines and Energy, Honourable Isak Katali for his visionary leadership
and also the Management and employees of the ECB for their dedication in fearlessly leading and regulating
the ESI.
In conclusion, I wish to recognise the continued interest and active participation of our stakeholders in ECB’s
activities. It is highly appreciated and commendable.
Mr Jason Nandago
8.

9.
The Chief Executive Officer’s Report
It is with great satisfaction that I report that the ECB achieved all the critical objectives set for the year
2010/2011. The highlights and challenges of the reporting period included the following:
Highlights
• A major milestone was reached when, during the reporting period, tariffs reached cost-reflectivity. As
emphasised in previous reports, ensuring security of supply of electricity, a backbone for economic growth
and productivity in most sectors of the economy, remains a challenge for Namibia and a high priority for
the ECB. Cost-reflective tariffs are a pre-requisite for attracting private sector investment in the energy
sector;
• As detailed elsewhere in this report, progress was also made with regard to the market model, the
‘Modified’ Single Buyer Model. The ECB believes that the model agreed by the Parties after protracted
negotiations not only sufficiently addresses the needs of IPPs in generation and distribution, but also
brings benefits to consumers;
• In pursuance of its declared Core Value of Integrity, the ECB jointly with NamPower, developed and
approved a ‘Generation and Transmission Tariff Model’ for the purposes of tariff calculation and setting.
This approach serves to assure all stakeholders that the Regulator arrives at tariffs through a transparent,
open, honest, fair and scientific process;
• To the delight of consumers, after several challenges and delays, full implementation of Time-of-Use
Tariffs by all distribution licensees was achieved during the reporting period;
• National Integrated Resource Plan (NIRP): Given the high priority the ECB places on security of supply, it
is pleasing to report that all issues (including development of terms of reference, funding, selection and
appointment of consultants, and work plan drafting) related to the NIRP project, which will determine
the optimal resource mix for electricity generation in Namibia, were finalised during the reporting period.
The Ministry of Mines and Energy will commission the project in July 2011, and has mandated the ECB
to execute it;
• Renewable Energy Procurement Mechanisms: To facilitate private sector participation in electricity
generation from renewable energy sources, the ECB Board approved recommendations for transparent
tendering for all capacities exceeding 5 MW. It is envisaged that the endorsement of procurement
mechanisms and the availability of sufficient baseline data, together with NIRP inputs, will significantly
influence private sector participation;
• On quality of supply, it is noteworthy that enquiries received during the reporting period indicate that the
quality of supply project initially commissioned for implementation by REDs only, is gaining substantial
buy-in from other industry players and licensees. The level of participation is expected to enhance the
efficiency gains anticipated by the industry through implementation of this project;
• On corporate governance, I wish to welcome our new Board Member, Mr Gottlieb Hinda from whose
invaluable experience in the financial sector the ECB is bound to benefit.
Challenges
• Balancing the 3As (Availability, Accessibility, Affordability) remains a major challenge for Namibia. The
gap between generation and demand is expected to widen further in the medium term as no firm new
generation projects have been recorded to date;
• The Industry continues to experience serious skills shortages with negative impact on safety;
• Attracting private sector participation and investment in the ESI remains a challenge due to the slow pace
of restructuring and drafting of the necessary enabling legal frameworks.
10.
9.11.
Mr
Sis
eho
C S
imas
iku
- C
hie
f E
xecu
tive
Off
icer

Cross-Cutting Matters
Corporate Governance Good corporate governance is critical to the success of the Electricity Control Board (ECB). The ECB’s
Board is unreservedly committed to applying the fundamental principles of good corporate governance -
transparency, integrity, accountability and responsibility - in all dealings by the ECB. Accordingly, the Board
embraces the principles of good governance, as set out in the 2009 King Report on Governance for South
Africa (King III), the Electricity Act, Act 4 of 2007 (the Act), the State-owned Enterprises Governance Act,
Act 2 of 2006, and the Competition Act, Act 2 of 2003 (the Competition Act).
The ECB Board has approved its own Board Charter, which defines the governance envelope within which
the Board operates. It also sets out the Board’s role and responsibilities, as well as the requirements for its
composition and meeting procedures. The Board has five non-executive directors; with the latest member
appointed in March 2011; and the ECB’s Chief Executive Officer is an ex-officio member of the Board. It
has three separate Board Committees, namely the Audit Committee, Human Resources and Remuneration
Committee, and the Pricing and Tariffs Committee. Board members are appointed by the Minister of Mines
and Energy, and hold office for four years. The terms of all Board members expire in December 2011. The
Board has fully complied with the statutory requirement to have four meetings a year.
The ECB is required in sections 3 (d) and 3 (e) of the Act, to ensure a competitive environment in the ESI in Namibia
with such restrictions as may be necessary for the security of electricity provision and other public interests and to
promote private sector investment in the ESI. It is in light of the above setting that the ECB chose to work closely
with the Namibian Competition Commission in line with the objects of the Competition Act.
Regulatory and Legislative Governance The ECB has consistently continued to implement the provisions of the Electricity Act, Act 4 of 2007, which
expanded its mandate especially as it pertains to the drafting and implementation of subordinate legislation
in the form of rules, codes and procedures.
In February 2011, the Electricity Regulations: Administrative: Electricity Act, 2007 (Administrative Regulations,
2007) that mainly deal with administrative matters and licensing procedures (i.e. advertising of applications,
submission of applications, issue of licenses), were promulgated in Government Notice No 13, and subsequently
repealed the Electricity Regulations: Administrative of 12 July 2000.
The Administrative Regulations, 2007, are currently being implemented by the ECB and the Electricity
Supply Industry (ESI), and have brought about various changes such as the removal of appeal procedures,
extension of functions of the Board, and increases in license application fees.
Following the promulgation of the Act, the ECB embarked on a vigorous process of establishing subordinate
legislation such as rules, codes and regulations, as well as internal management instruments such as the
ECB’s internal set of procedures. These regulatory instruments are needed to assist with the implementation
of the provisions of the Act.
During the present reporting period, the Board has approved most of the regulatory instruments. These are
now ready for legal scrutiny, and the subsequent promulgation in the Government Gazette. The finalised
regulatory instruments include the Administrative Regulations, the Quality of Supply and Service Standards
(QoSSS), the ECB Complaints Handling Procedures, the Rules on the Resale of Electricity, the Mediation
Procedural Rules, the License Application Objection Form, the Public Hearing Procedural Rules and the
Namibian Electricity Safety Code.
12.
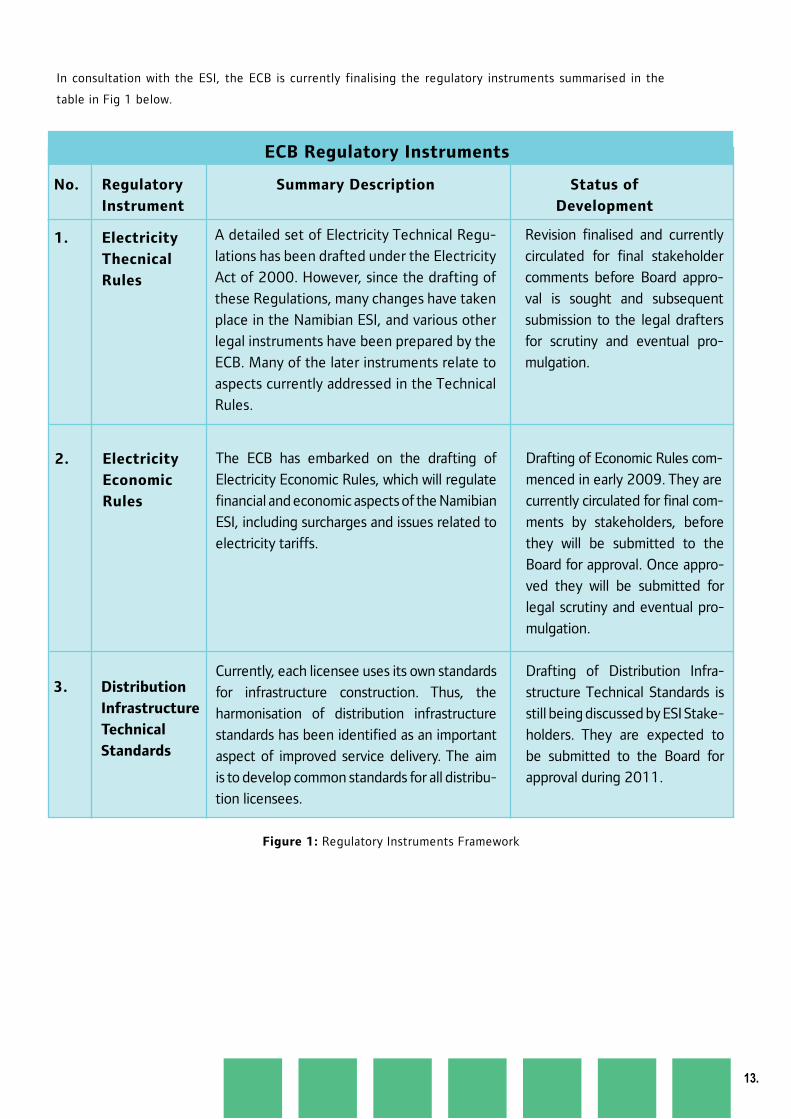
In consultation with the ESI, the ECB is currently finalising the regulatory instruments summarised in the
table in Fig 1 below.
ECB Regulatory Instruments
No. Regulatory Summary Description Status of
Instrument Development
1. Electricity
Thecnical
Rules
A detailed set of Electricity Technical Regu-
lations has been drafted under the Electricity
Act of 2000. However, since the drafting of
these Regulations, many changes have taken
place in the Namibian ESI, and various other
legal instruments have been prepared by the
ECB. Many of the later instruments relate to
aspects currently addressed in the Technical
Rules.
Revision finalised and currently
circulated for final stakeholder
comments before Board appro-
val is sought and subsequent
submission to the legal drafters
for scrutiny and eventual pro-
mulgation.
13.
2. Electricity
Economic
Rules
The ECB has embarked on the drafting of
Electricity Economic Rules, which will regulate
financial and economic aspects of the Namibian
ESI, including surcharges and issues related to
electricity tariffs.
Currently, each licensee uses its own standards
for infrastructure construction. Thus, the
harmonisation of distribution infrastructure
standards has been identified as an important
aspect of improved service delivery. The aim
is to develop common standards for all distribu-
tion licensees.
Drafting of Economic Rules com-
menced in early 2009. They are
currently circulated for final com-
ments by stakeholders, before
they will be submitted to the
Board for approval. Once appro-
ved they will be submitted for
legal scrutiny and eventual pro-
mulgation.
Drafting of Distribution Infra-
structure Technical Standards is
still being discussed by ESI Stake-
holders. They are expected to
be submitted to the Board for
approval during 2011.
Figure 1: Regulatory Instruments Framework
3. Distribution
Infrastructure
Technical
Standards
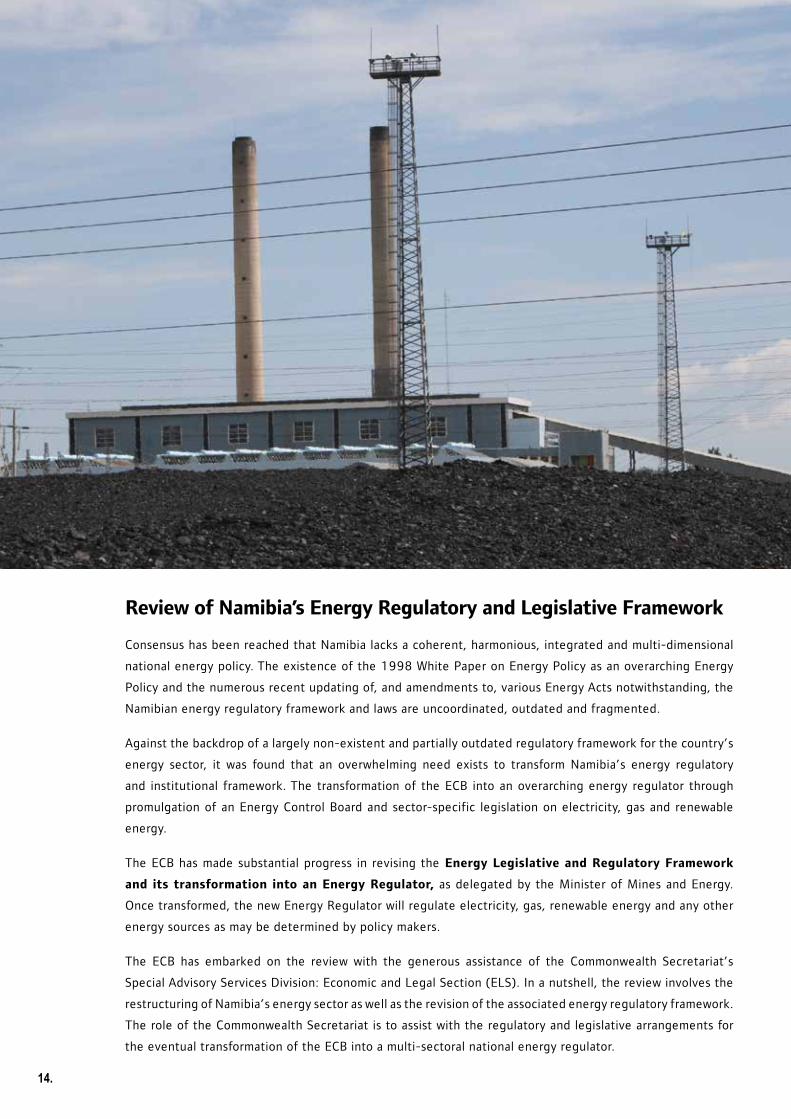
Review of Namibia’s Energy Regulatory and Legislative Framework
Consensus has been reached that Namibia lacks a coherent, harmonious, integrated and multi-dimensional
national energy policy. The existence of the 1998 White Paper on Energy Policy as an overarching Energy
Policy and the numerous recent updating of, and amendments to, various Energy Acts notwithstanding, the
Namibian energy regulatory framework and laws are uncoordinated, outdated and fragmented.
Against the backdrop of a largely non-existent and partially outdated regulatory framework for the country’s
energy sector, it was found that an overwhelming need exists to transform Namibia’s energy regulatory
and institutional framework. The transformation of the ECB into an overarching energy regulator through
promulgation of an Energy Control Board and sector-specific legislation on electricity, gas and renewable
energy.
The ECB has made substantial progress in revising the Energy Legislative and Regulatory Framework
and its transformation into an Energy Regulator, as delegated by the Minister of Mines and Energy.
Once transformed, the new Energy Regulator will regulate electricity, gas, renewable energy and any other
energy sources as may be determined by policy makers.
The ECB has embarked on the review with the generous assistance of the Commonwealth Secretariat’s
Special Advisory Services Division: Economic and Legal Section (ELS). In a nutshell, the review involves the
restructuring of Namibia’s energy sector as well as the revision of the associated energy regulatory framework.
The role of the Commonwealth Secretariat is to assist with the regulatory and legislative arrangements for
the eventual transformation of the ECB into a multi-sectoral national energy regulator.
14.
The ELS undertook various Missions to Namibia, and the first draft versions of a proposed Amended Electricity
Bill and the new Energy Regulatory Board’s Act have been discussed at round table meetings with the ECB
Management.
In addition, the ELS team is also reviewing and finalising the Namibian Draft Gas Bill (drafted in 2005 but never
promulgated due to various shortcomings) in order to provide the necessary framework for the development and
utilisation of natural gas in Namibia.
The process entails a considerable review process, including formal public consultations and workshops that will
take into account opinions and inputs of all relevant stakeholders including Government, NamPower, industry
associations, NGOs, prospective gas producers, and mining companies (the largest consumers of energy in
Namibia). Once the review process is completed the Draft Gas Bill will be presented for debate and scrutiny by
Parliament. It is expected that the review and development process of the Gas Bill will take approximately 18
months.
Namibian Electricity Distribution Industry Restructuring Process
Namibia has thus far created three Regional Electricity Distributors (REDs), out of the five originally
envisaged. The process to create the remaining two REDs has reached a deadlock. Furthermore, the REDs
still do not have a regulatory framework, since provisions pertaining to the REDs were removed from the
Amended Electricity Act, 2007.
The ECB, in an attempt to address this ‘legal vacuum’, has assessed the legislative framework of the REDs
and other distributing entities, to determine whether Namibia needs separate REDs/Utilities legislation, or
whether provisions pertaining to distributors should be provided in an updated Electricity Act in future.
The study recommends that:
• There is a need for a revised Electricity Act, expanding on provisions dealing with utility/licensee
regulation and containing specific provisions (especially transitional provisions) for the establishment and
functioning of REDs and all other electricity utilities (inclusive of farmer schemes);
• There is a need for an enhanced distinction between the roles and responsibilities of the various institutional
entities involved, i.e. the Minister of Mines and Energy, the ECB, Local Authorities and Regional Councils,
and the Minister of Regional and Local Government and Housing and Rural Development;
• Exemptions from applicable legislation, where relevant. A new regulatory framework is to contain restruc-
turing measures and principles in so far as policies are deemed insufficient to ensure compliance with
policy principles. Examples hereof would be the requirement that REDs be asset based companies and
must themselves be involved in the day-to-day operation of their electricity businesses.
The study is currently under circulation for comment amongst ESI stakeholders. It is envisaged that a
consolidated and common ESI Position Paper on restructuring will be compiled, which will then be submitted
to the Minister of Mines and Energy. The recommendations from the ESI stakeholders will be considered
for discussion and possible adoption at an upcoming EDI Summit, which is to be initiated by the Minister of
Mines and Energy.
Human Capital Management
A key issue during the period under review has been the approval of comprehensive Human Resources
Policy Guidelines, to ensure that the ECB’s employment practices remain relevant and practical, and cater
for the changing needs of the organisation, and to ensure that competent employees can be attracted and
retained.
15.
16.
As an employer, the ECB endeavours to create and sustain a working environment characterised by responsible
employment practices, competitive remuneration levels and cordial employee relations, reflecting the
organisation’s values, i.e. professionalism, integrity, sustainability and innovation.
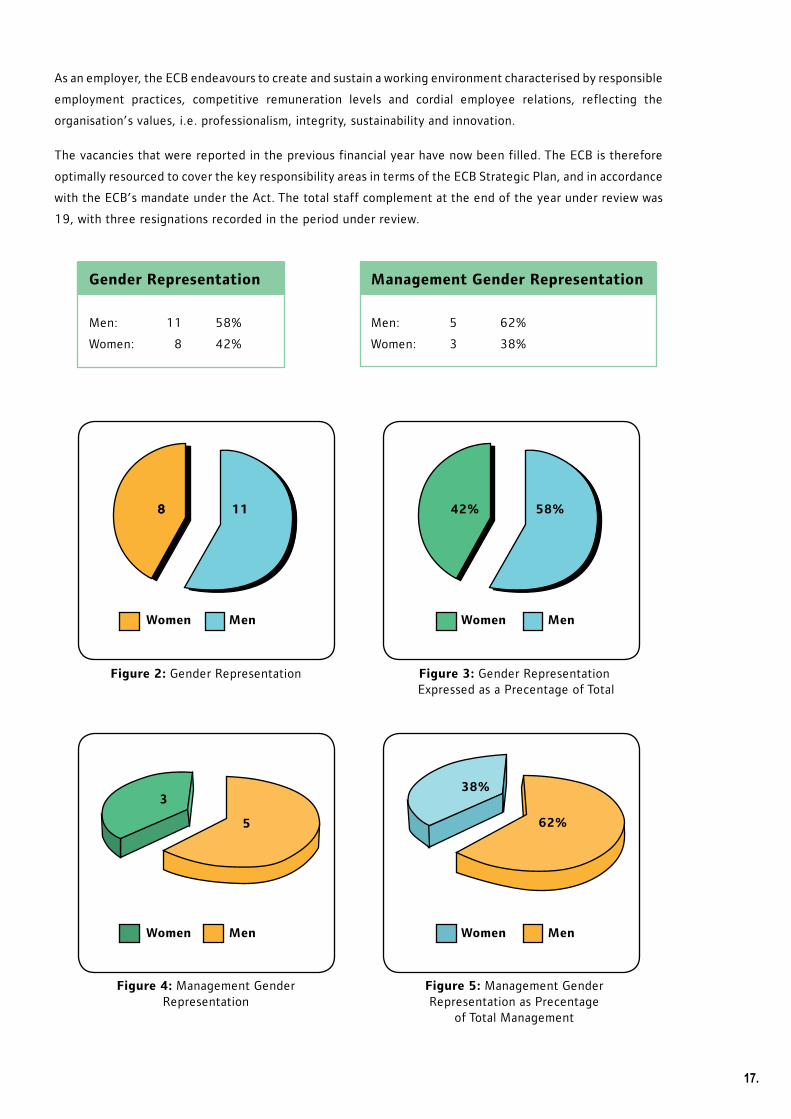
The vacancies that were reported in the previous financial year have now been filled. The ECB is therefore
optimally resourced to cover the key responsibility areas in terms of the ECB Strategic Plan, and in accordance
with the ECB’s mandate under the Act. The total staff complement at the end of the year under review was
19, with three resignations recorded in the period under review.
Gender Representation Management Gender Representation
Men: 11 58% Men: 5 62%
Women: 8 42% Women: 3 38%
Figure 2: Gender Representation
MenWomen MenWomen
88 11 42% 58%
Figure 3: Gender Representation Expressed as a Precentage of Total
Figure 4: Management Gender Representation
8
Figure 5: Management Gender Representation as Precentage
of Total Management
3
5
38%
62%
17.
MenWomen MenWomen
Although there are 16% more male than female employees at the ECB, this gender disparity widens
even further when comparing the percentage of female versus male in management positions. Females
in managerial positions are 24% less than their male counterparts. This disparity will be born in mind and
ECB will do everything in its power to redress it. Employment Equity continues to be an integral part of
the ECB’s organizational strategy and is viewed by the Board and senior management as a driving force in
ensuring that the ECB retains its competitive edge in the Namibian market place. As the need to understand,
accept and embrace diversity has definitely become a strategic organisational imperative in the Namibian
organisational environment, the ECB also places considerable emphasis on the management of diversity. The
ECB is confident that, with emphasis on executive development, focus on an executive pipeline, leadership
development, targeted resourcing at all levels; it will meet its Employment Equity objectives, although at this
stage it is not a relevant employer in terms of Affirmative Action (Employment) Act, 1998.
The key human resources strategy focus areas over the past year was the enhancement of executive and
management skills; the training of our technical staff with regards to the core regulatory skills acquisition;
strengthening of our wellness program; realigning of our recruitment and selection processes and the
continuous enhancement of our remuneration and performance management strategies. Despite meeting
the aforesaid objectives, the key challenges for the ECB are inter alia; the ever expanding organisational
structure, which has contributed to the lack of office and parking space for the ECB staff; new positions
that are requiring new skills sets and the introduction of requisite capacity building initiatives to service the
operational requirements.
Training And Development
The ECB is a knowledge-based organisation, and hence emphasises excellence in human capital development
for all its employees. It is recognised that no organisation can survive and prosper without strong leadership,
goal-oriented management teams and a competent and effective workforce. The ECB’s education, training
and development programmes are structured accordingly, and focused on the unique organisational require-
ments.
In pursuance of the objective of quality training interventions, the ECB has established several relationships
with leading business schools and international institutions in order to offer employees access to programmes
for the advancement of skills for effective utility policy, regulation, management, and leadership.
Tertiary institutions supporting the ECB’s ongoing capacity development programme include the:
• Public Utility Research Centre at the University of Florida;
• University of Stellenbosch Business School;
• University of Cape Town Business School;
• Polytechnic of Namibia.
During the 2010/2011 financial year, the training programs/courses provided for include:
• Regulation training (PURC) (USA);
• Introduction to Regulation Training (Budapest);
• Regulatory Studies in Europe;
• Leadership Development Programs.
For the next financial year, the ECB intends to introduce a Graduate Development Programme for Electrical
Engineers and a Job Attachment Scheme to assist the ESI to meet its needs for experienced and well-
educated young professionals.
18.
Employee Wellness For the period under review, the ECB employees participated in the various wellness programmes:
• ECB Employee Wellness Day;
• 2010 World Aids Day Commemoration;
• ESI Sports Fun Day;
• Annual Flu Injection for ECB staff and dependants.
Corporate Social Investment (CSI)
The ECB is committed to foster harmonious relations with its stakeholders, and contribute to the development
of a thriving and vibrant Namibian society. In terms of the ECB’s corporate social investment (CSI), the regulator
supports Government’s national priorities of socio-economic development. To ensure the sustainability of
the ECB’s efforts, the organisation aligns itself with non-profit organisations’ efforts in identifying areas of
true need and supporting those organisations effective at applying resources to address societal problem
areas. The primary focus areas were education, the environment and safety.
The ECB devotes considerable financial and other resources to sustainable corporate social investment (CSI),
in support of government national priorities of socio-economic development and other societal considerations.
As a good corporate citizen, our objective is to find ways in which to give back to the communities and the
country as a whole, through supporting sustainable projects that make a real difference.
The funding assistance provided for in this period under review was either in cash or kind and the
following organisations, amongst others, were the beneficiaries:
• ETSIP through the Ministry of Education;
• The Christina Swart-Opperman (CSO) Aids Orphan Foundation Trust;
• Computer donations to schools;
• National Emergency Disaster Fund;
• J. P. Karuaihe Trust Fund.
For the next financial year, we are anticipating to cast our net wider, to reach out to a wider part of Namibia.
Stakeholder Engagement
The ECB prides itself on creating and improving its communications with stakeholders. This is primarily
achieved by ongoing interaction, engagement and consultation with stakeholders. The ECB has had several
consultations with stakeholders on important issues, including the establishment of the capacity development
institute, time-of-use tariffs and the development of the National Resource Plan.
The ECB also regularly attends the NamPower/REDs meetings which are used to share information amongst
ESI stakeholders, clarify issues pertaining to the ESI and provide leadership.
Consumer Education
The ECB has embarked on a programme to educate and raise awareness of the services it offers. The ECB’s
consumer education strategy envisages that the ECB utilises national events such as trade fairs, career fairs
and sector expos to educate consumers. During the 2010/2011 financial year the ECB has attended the
trade fairs at Ongwediwa and Windhoek.
13.19.
Branding and Corporate Identity
The willingness of ECB staff to participate in national events such as workshops, shows, symposiums and
career fairs has given ECB a facelift as to how consumers and the public at large perceive it. The ECB re-
cognises that the corporate image and reputation of an organization is enhanced by good customer care and
customer relations. Therefore the employees of ECB are required to display a high level of integrity when
dealing with stakeholders.
National Stakeholder Education Forum
The stakeholder communication forum created and sponsored by the ECB provides an avenue which gives
all the ESI role players an opportunity to share information and interact amongst themselves on the issues,
challenges and developments in the industry. In the year under review the ESI role players met in Windhoek
for this event.
International Relations and Partnerships
The ECB has continued to strengthen and revitalise its relationships with energy regulators on the African
continent and elsewhere. Several events, including the ARFUR, RERA, and regional and international
conferences were attended by staff members.
The ECB has cemented its relationship with the World Bank which is sponsoring two projects, namely the
NIRP and the conversion of the ECB to an Energy Regulator.
In the year under review the ECB was visited by several institutions, notably the Swaziland Electricity
Regulator and representatives from the African Union. The visit by the delegation from Swaziland was led by
the chairperson of the Board and their mission was to familiarise themselves with the ECB’s work, and learn
from local regulatory experience.
Between 23 May and 2 June 2011, ECB staff undertook a study visit to Zambia, where they were given
an overview of ERB’s operations. The delegation also visited the Kafue Gorge Power Station, which is the
largest power station in Zambia, as well as the Copper Belt Energy Cooperation (CEC), Lunsemfwa Hydro
Power Company (LHPC) and Leopards Hill substation in Lusaka.
The team was also given an opportunity to conduct a technical audit for the Leopards Hill substation, which
is a transit point for power that is transmitted from Kariba North Bank and Kafue Gorge power stations. The
audit was conducted using guidelines in the ECB’s Technical Audit Manual.
Media Relations
The ECB continues to work with several media houses to share and disseminate information to its stakeholders,
and provides newspaper placements and articles of educational value to consumers.
Social Responsibility
The ECB has demonstrated its corporate social responsibility through its close involvement and contribution
to social upliftment programmes and community initiatives.
Economic Regulation
For the financial year 2010/2011, the ECB granted NamPower (NP) an 18% effective average increase in
electricity tariffs. Distribution utilities and Local Authorities were granted varying increases, as justified by
the individual revenue requirements as part of their tariff applications to the ECB.
20.
The above is consistent with the ECB’s main regulatory objectives, i.e.:
• Electricity-pricing methodology that equitably rewards investors (recovery of cost of supply plus regulated
rate of return) while keeping prices affordable to consumers;
• Ensuring quality of supply and service (taking cognisance of different quality standards and associated
costs); and
•Maximising operational efficiency through restructuring and performance evaluation and monitoring.
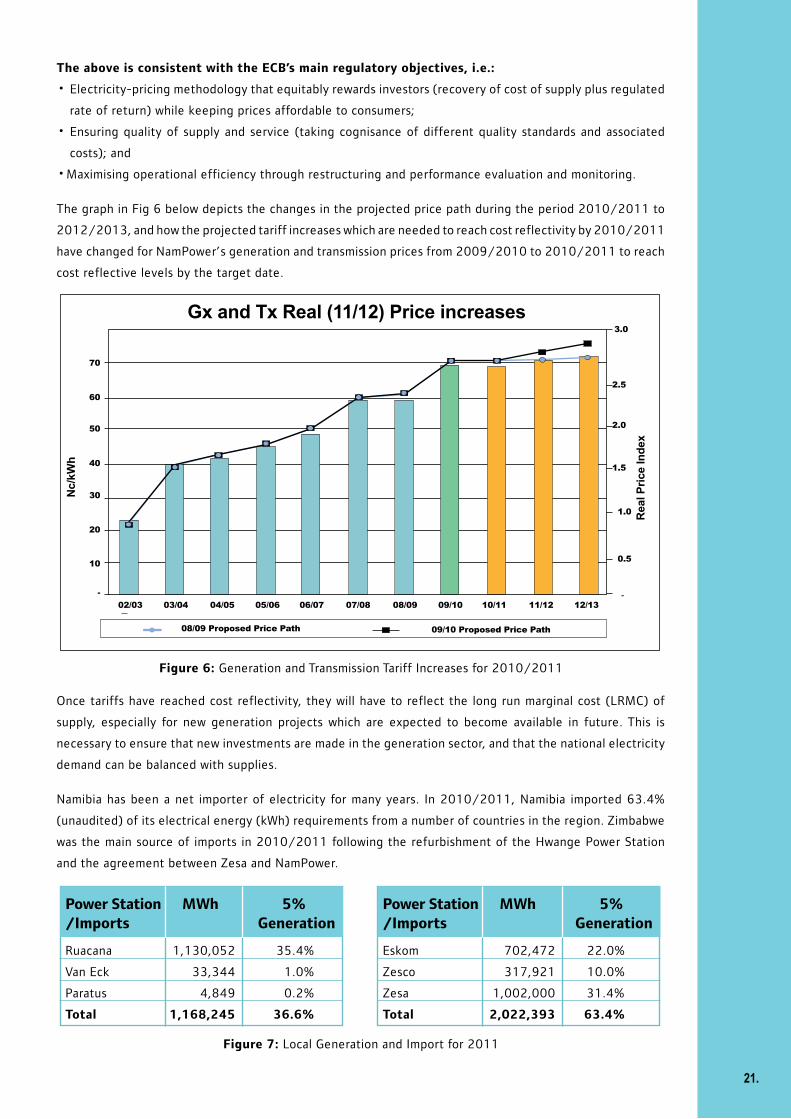
The graph in Fig 6 below depicts the changes in the projected price path during the period 2010/2011 to
2012/2013, and how the projected tariff increases which are needed to reach cost reflectivity by 2010/2011
have changed for NamPower’s generation and transmission prices from 2009/2010 to 2010/2011 to reach
cost reflective levels by the target date.
Gx and Tx Real (11/12) Price increases
60
50
40
30
20
10
Nc/
kWh
02/03
-
03/04 04/05 05/06 06/07 07/08 08/09 09/10 10/11 11/12 12/13
08/09 Proposed Price Path 09/10 Proposed Price Path
1.0
0.5
-
Rea
l Pri
ce In
dex
3.0
1.5
70
2.0
2.5
Once tariffs have reached cost reflectivity, they will have to reflect the long run marginal cost (LRMC) of
supply, especially for new generation projects which are expected to become available in future. This is
necessary to ensure that new investments are made in the generation sector, and that the national electricity
demand can be balanced with supplies.
Namibia has been a net importer of electricity for many years. In 2010/2011, Namibia imported 63.4%
(unaudited) of its electrical energy (kWh) requirements from a number of countries in the region. Zimbabwe
was the main source of imports in 2010/2011 following the refurbishment of the Hwange Power Station
and the agreement between Zesa and NamPower.
Figure 6: Generation and Transmission Tariff Increases for 2010/2011
Power Station MWh 5%/Imports Generation
Ruacana 1,130,052 35.4%
Van Eck 33,344 1.0%
Paratus 4,849 0.2%
Total 1,168,245 36.6%
Power Station MWh 5%/Imports Generation
Eskom 702,472 22.0%
Zesco 317,921 10.0%
Zesa 1,002,000 31.4%
Total 2,022,393 63.4%
Figure 7: Local Generation and Import for 2011
21.
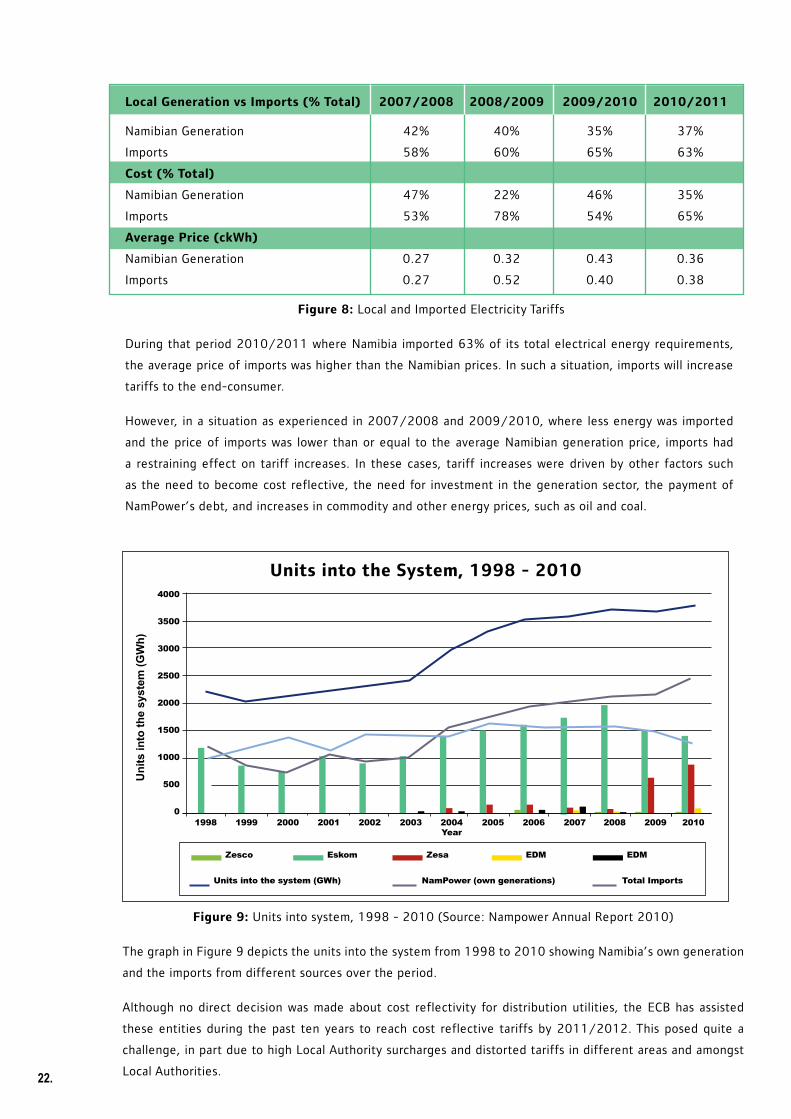
Local Generation vs Imports (% Total) 2007/2008 2008/2009 2009/2010 2010/2011
Namibian Generation 42% 40% 35% 37%
Imports 58% 60% 65% 63%
Cost (% Total)
Namibian Generation 47% 22% 46% 35%
Imports 53% 78% 54% 65%
Average Price (ckWh)
Namibian Generation 0.27 0.32 0.43 0.36
Imports 0.27 0.52 0.40 0.38
Figure 8: Local and Imported Electricity Tariffs
During that period 2010/2011 where Namibia imported 63% of its total electrical energy requirements,
the average price of imports was higher than the Namibian prices. In such a situation, imports will increase
tariffs to the end-consumer.
However, in a situation as experienced in 2007/2008 and 2009/2010, where less energy was imported
and the price of imports was lower than or equal to the average Namibian generation price, imports had
a restraining effect on tariff increases. In these cases, tariff increases were driven by other factors such
as the need to become cost reflective, the need for investment in the generation sector, the payment of
NamPower’s debt, and increases in commodity and other energy prices, such as oil and coal.
Figure 9: Units into system, 1998 - 2010 (Source: Nampower Annual Report 2010)
The graph in Figure 9 depicts the units into the system from 1998 to 2010 showing Namibia’s own generation
and the imports from different sources over the period.
Although no direct decision was made about cost reflectivity for distribution utilities, the ECB has assisted
these entities during the past ten years to reach cost reflective tariffs by 2011/2012. This posed quite a
challenge, in part due to high Local Authority surcharges and distorted tariffs in different areas and amongst
Local Authorities. 22.
Un
its
into
th
e sy
stem
(G
Wh
)
0
500
1000
1500
2000
2500
3000
3500
4000
1998 1999 2000 2001 2002 2003 2004 2005 2006 2007 2008 2009 2010Year
Zesco Eskom Zesa EDM EDM
Units into the system (GWh) NamPower (own generations) Total Imports
Units into the System, 1998 - 2010
23.
In 2010/2011, the ECB approved a 5c/kWh Local Authority surcharge to all councils in the Erongo RED
area that had not been receiving any LA surcharge or receiving less than 5c/kWh. The same amount of LA
surcharge had also been approved for LAs/RCs in 2009/2010 in CENORED and NORED.
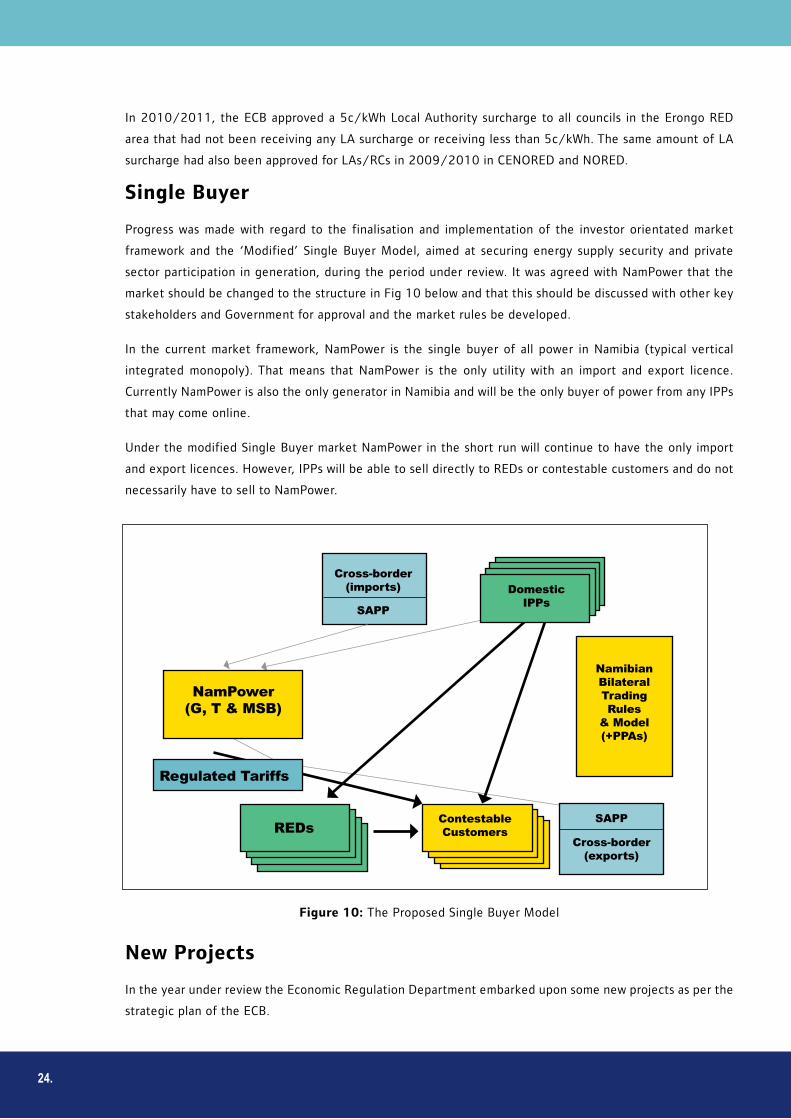
Single Buyer
Progress was made with regard to the finalisation and implementation of the investor orientated market
framework and the ‘Modified’ Single Buyer Model, aimed at securing energy supply security and private
sector participation in generation, during the period under review. It was agreed with NamPower that the
market should be changed to the structure in Fig 10 below and that this should be discussed with other key
stakeholders and Government for approval and the market rules be developed.
In the current market framework, NamPower is the single buyer of all power in Namibia (typical vertical
integrated monopoly). That means that NamPower is the only utility with an import and export licence.
Currently NamPower is also the only generator in Namibia and will be the only buyer of power from any IPPs
that may come online.
Under the modified Single Buyer market NamPower in the short run will continue to have the only import
and export licences. However, IPPs will be able to sell directly to REDs or contestable customers and do not
necessarily have to sell to NamPower.
Figure 10: The Proposed Single Buyer Model
New Projects
In the year under review the Economic Regulation Department embarked upon some new projects as per the
strategic plan of the ECB.
24.
NamibianBilateralTradingRules
& Model(+PPAs)
SAPP
SAPP
Cross-border(exports)
Cross-border(imports)
ContestableCustomersREDs
Regulated Tariffs
NamPower(G, T & MSB)
DomesticIPPs
Generation and transmission tariff review model
One of most important projects was the development of a consolidated tariff model for the evaluation and
determination of the NamPower generation and transmission tariffs. This was necessitated by the fact that
the tariff methodology for both generation and transmission was changed in 2009/2010.
The ECB and NamPower will utilise this model for the 2011/2012 tariff review to reduce differences
amongst the parties and will be updating and improving the model if necessary once it has gone through the
first tariff review. It is therefore a tool to improve and simplify the NamPower tariff review process.
Utilities financial viability model
The ECB commissioned a project to develop a model to assess the financial viability of utilities. It is expected
that this project will be finalised in the next financial year.
Renewable energy procurement mechanisms
The ECB conducted a study to develop a framework and tariff methodology to ensure that a sustainable,
transparent and fair tariff methodology is developed for renewable energy resources in Namibia. The study
was funded by the Renewable Energy and Energy Efficiency Partnership (REEEP), and conducted by the
Renewable Energy and Energy Efficiency Institute (REEEI) at the Polytechnic of Namibia. A RE Calculator
for assessing the impact of a given RE tariff on the energy mix was developed and the project made specific
recommendations on procurement methods for wind, solar, landfill gas and biomass. Implementation will be
subject to formal endorsement and approval by the ECB Board and the Minister of Mines and Energy
Revenue reconciliation framework
The ECB embarked on the second phase of the revenue reconciliation framework project. The aim of the
second phase was to develop benchmarks within which the ECB will allow or disallow over- or under recoveries
by utilities. It is expected that this project will be finalised in the next financial year.
Industry Analysis
Industry Overview And Structure
During the period under review, no major changes took place with respect to the functional structure of
the ESI. An operational development of note, however, was the direct funding allocated by Government
through the Ministry of Mines and Energy (MME), to enable Erongo RED and CENORED to provide services
to geographical areas initially designated for the un-established Central and Southern REDs. These areas
had come under the spotlight after NamPower had decided to terminate the services of towns that could no
longer pay. The significance of this development lies in fact that it illustrates that despite the existence of
pockets of resistance to the enhancement or continued establishment of REDs, no better alternative for the
medium to long term has been presented.
Key Players In The Electricity SectorWith the notable absence of operational Independent Power Producers (IPPs), the principal players in the
Namibian electricity sector’s value chain remained the same, as illustrated in the diagram shown in Figure
11 on page 27. With respect to utility operations, NamPower continues to have a monopoly position in
generation, transmission and energy trading. The REDs, Local Authorities, and NamPower remained the key
players in the distribution and electricity supply sectors.
25.
26.
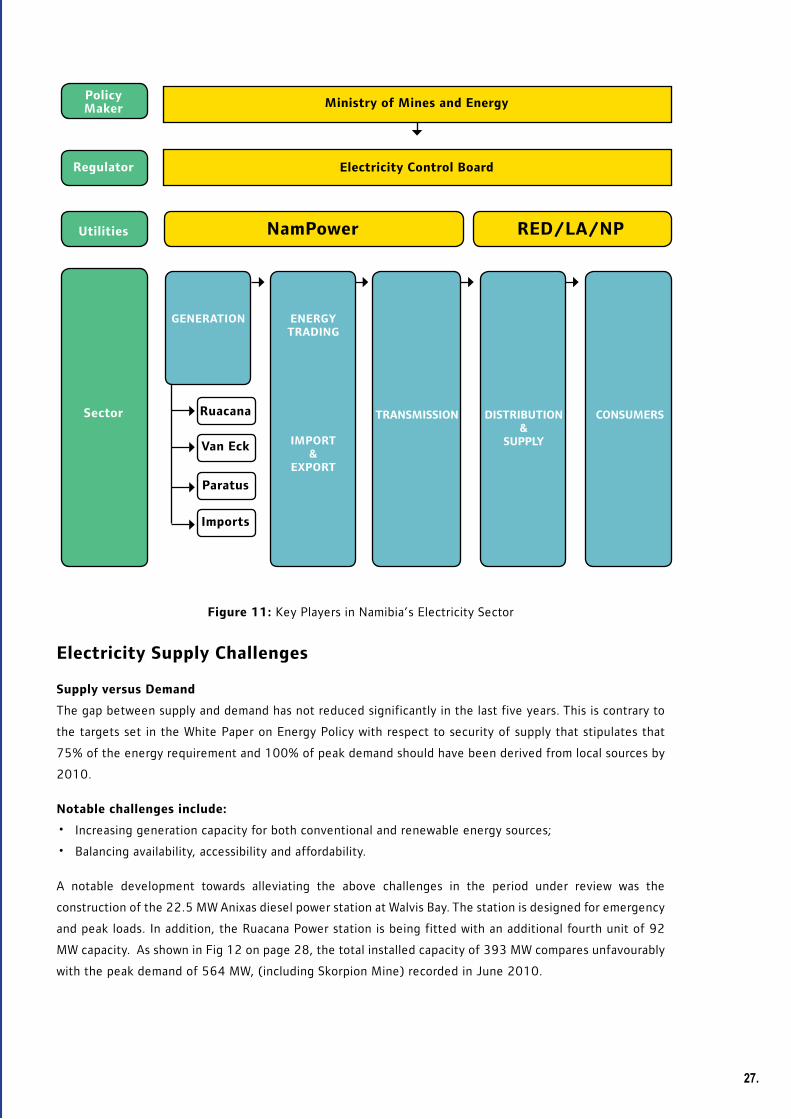
Figure 11: Key Players in Namibia’s Electricity Sector
Electricity Supply Challenges
Supply versus Demand
The gap between supply and demand has not reduced significantly in the last five years. This is contrary to
the targets set in the White Paper on Energy Policy with respect to security of supply that stipulates that
75% of the energy requirement and 100% of peak demand should have been derived from local sources by
2010.
Notable challenges include:
• Increasing generation capacity for both conventional and renewable energy sources;
• Balancing availability, accessibility and affordability.
A notable development towards alleviating the above challenges in the period under review was the
construction of the 22.5 MW Anixas diesel power station at Walvis Bay. The station is designed for emergency
and peak loads. In addition, the Ruacana Power station is being fitted with an additional fourth unit of 92
MW capacity. As shown in Fig 12 on page 28, the total installed capacity of 393 MW compares unfavourably
with the peak demand of 564 MW, (including Skorpion Mine) recorded in June 2010.
27.
Policy Maker Ministry of Mines and Energy
Regulator Electricity Control Board
Utilities NamPower RED/LA/NP
Sector
GENERATION ENERGYTRADING
IMPORT&
EXPORT
TRANSMISSION DISTRIBUTION&
SUPPLY
CONSUMERSRuacana
Van Eck
Paratus
Imports
Power Station Primary Energy Capacity Allocation
Source
Ruacana Hydro 249 MW Base load
Van Eck Coal 120 MW Peaking
Paratus Diesel 24 MW Peaking
Total Mixed 393 MW
Ruacana 4th Unit Hydro 92 MW Under construction
Anixas Diesel 22.5 MW Under construction
Figure 12: Installed Local Generation Capacity
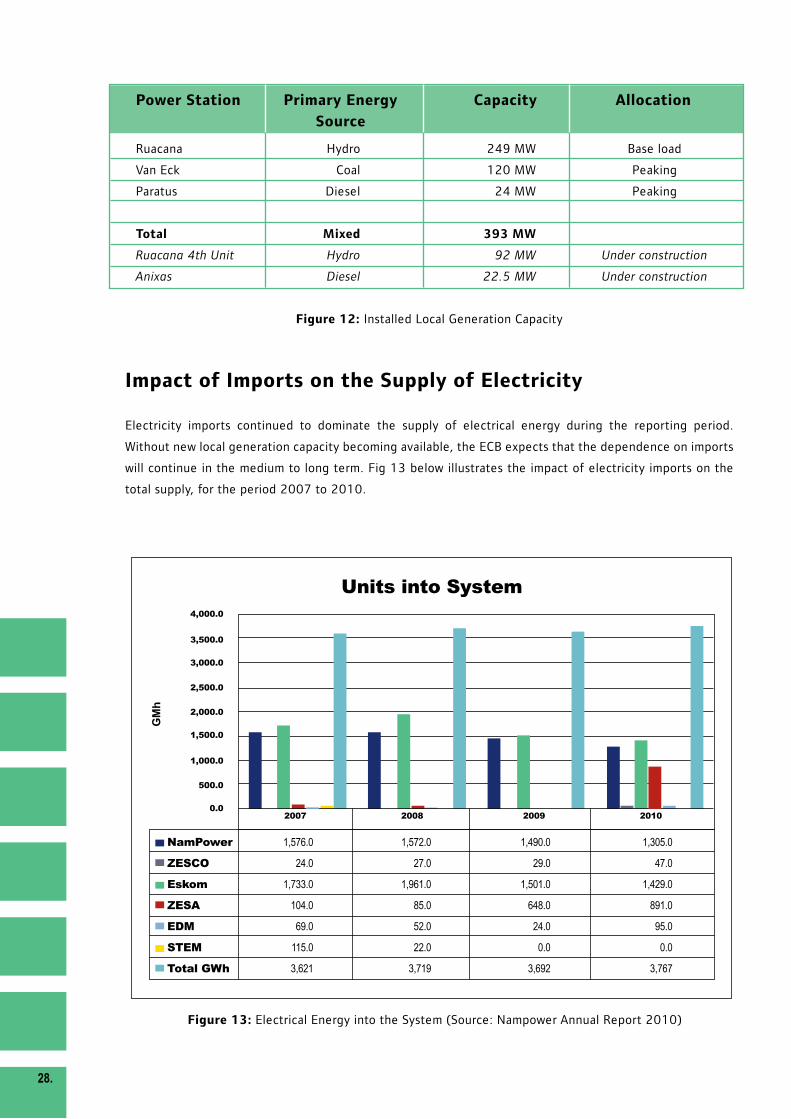
Impact of Imports on the Supply of Electricity
Electricity imports continued to dominate the supply of electrical energy during the reporting period.
Without new local generation capacity becoming available, the ECB expects that the dependence on imports
will continue in the medium to long term. Fig 13 below illustrates the impact of electricity imports on the
total supply, for the period 2007 to 2010.
Figure 13: Electrical Energy into the System (Source: Nampower Annual Report 2010)
GM
h
500.0
1,000.0
0.0
2,000.0
2,500.0
1,500.0
3,500.0
4,000.0
3,000.0
Units into System
NamPower 1,576.0 1,572.0 1,490.0 1,305.0
ZESCO 24.0 27.0 29.0 47.0
Eskom 1,733.0 1,961.0 1,501.0 1,429.0
ZESA 104.0 85.0 648.0 891.0
EDM 69.0 52.0 24.0 95.0
STEM 115.0 22.0 0.0 0.0
Total GWh 3,621 3,719 3,692 3,767
28.
2007 2008 2009 2010
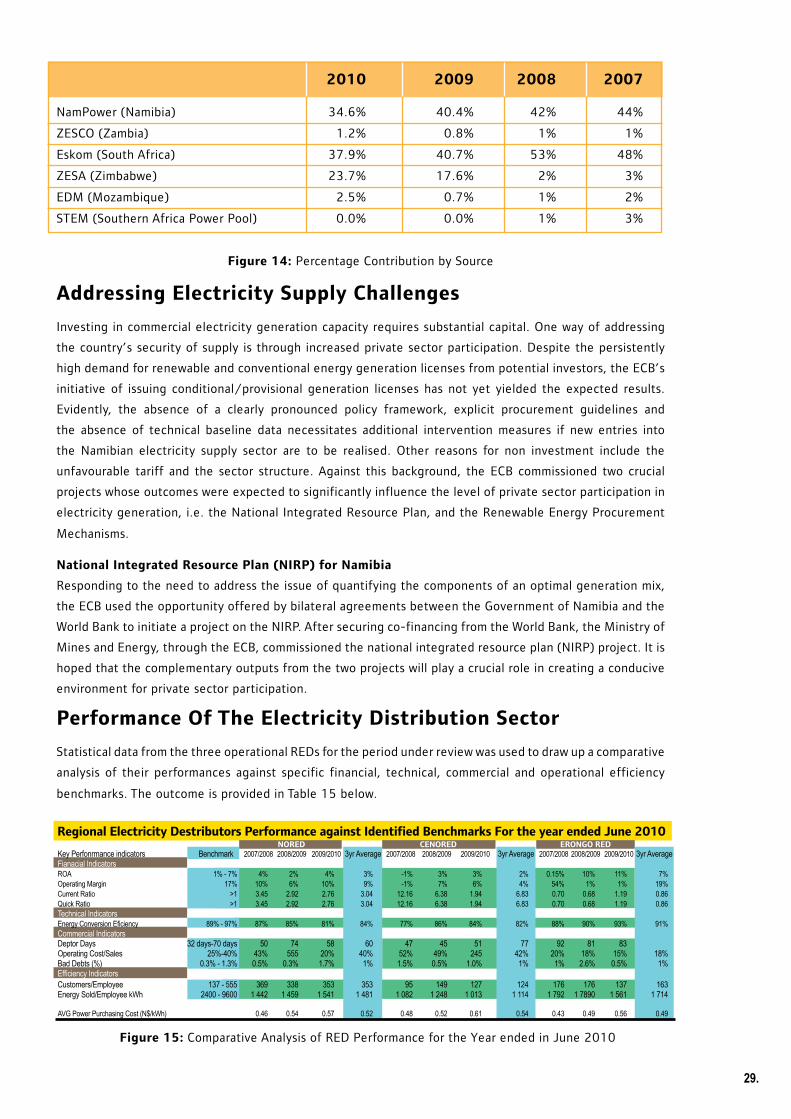
2010 2009 2008 2007
NamPower (Namibia) 34.6% 40.4% 42% 44%
ZESCO (Zambia) 1.2% 0.8% 1% 1%
Eskom (South Africa) 37.9% 40.7% 53% 48%
ZESA (Zimbabwe) 23.7% 17.6% 2% 3%
EDM (Mozambique) 2.5% 0.7% 1% 2%
STEM (Southern Africa Power Pool) 0.0% 0.0% 1% 3%
Figure 14: Percentage Contribution by Source
Addressing Electricity Supply Challenges
Investing in commercial electricity generation capacity requires substantial capital. One way of addressing
the country’s security of supply is through increased private sector participation. Despite the persistently
high demand for renewable and conventional energy generation licenses from potential investors, the ECB’s
initiative of issuing conditional/provisional generation licenses has not yet yielded the expected results.
Evidently, the absence of a clearly pronounced policy framework, explicit procurement guidelines and
the absence of technical baseline data necessitates additional intervention measures if new entries into
the Namibian electricity supply sector are to be realised. Other reasons for non investment include the
unfavourable tariff and the sector structure. Against this background, the ECB commissioned two crucial
projects whose outcomes were expected to significantly influence the level of private sector participation in
electricity generation, i.e. the National Integrated Resource Plan, and the Renewable Energy Procurement
Mechanisms.
National Integrated Resource Plan (NIRP) for Namibia
Responding to the need to address the issue of quantifying the components of an optimal generation mix,
the ECB used the opportunity offered by bilateral agreements between the Government of Namibia and the
World Bank to initiate a project on the NIRP. After securing co-financing from the World Bank, the Ministry of
Mines and Energy, through the ECB, commissioned the national integrated resource plan (NIRP) project. It is
hoped that the complementary outputs from the two projects will play a crucial role in creating a conducive
environment for private sector participation.
Performance Of The Electricity Distribution Sector
Statistical data from the three operational REDs for the period under review was used to draw up a comparative
analysis of their performances against specific financial, technical, commercial and operational efficiency
benchmarks. The outcome is provided in Table 15 below.
Figure 15: Comparative Analysis of RED Performance for the Year ended in June 2010
Regional Electricity Destributors Performance against Identified Benchmarks For the year ended June 2010 NORED CENORED ERONGO RED
Key Perfonrmance indicators Benchmark 2007/2008 2008/2009 2009/2010 3yr Average 2007/2008 2008/2009 2009/2010 3yr Average 2007/2008 2008/2009 2009/2010 3yr Average Fianacial IndicatorsROA 1% - 7% 4% 2% 4% 3% -1% 3% 3% 2% 0.15% 10% 11% 7%Operating Margin 17% 10% 6% 10% 9% -1% 7% 6% 4% 54% 1% 1% 19%Current Ratio >1 3.45 2.92 2.76 3.04 12.16 6.38 1.94 6.83 0.70 0.68 1.19 0.86Quick Ratio >1 3.45 2.92 2.76 3.04 12.16 6.38 1.94 6.83 0.70 0.68 1.19 0.86Technical IndicatorsEnergy Conversion Eficiency 89% - 97% 87% 85% 81% 84% 77% 86% 84% 82% 88% 90% 93% 91%Commercial IndicatorsDeptor Days 32 days-70 days 50 74 58 60 47 45 51 77 92 81 83Operating Cost/Sales 25%-40% 43% 555 20% 40% 52% 49% 245 42% 20% 18% 15% 18%Bad Debts (%) 0.3% - 1.3% 0.5% 0.3% 1.7% 1% 1.5% 0.5% 1.0% 1% 1% 2.6% 0.5% 1%Efficiency IndicatorsCustomers/Employee 137 - 555 369 338 353 353 95 149 127 124 176 176 137 163Energy Sold/Employee kWh 2400 - 9600 1 442 1 459 1 541 1 481 1 082 1 248 1 013 1 114 1 792 1 7890 1 561 1 714
AVG Power Purchasing Cost (N$/kWh) 0.46 0.54 0.57 0.52 0.48 0.52 0.61 0.54 0.43 0.49 0.56 0.49Commercial Indicators
29.

The ECB envisaged the performance targets to be reached over time. NORED continued to perform
satisfactorily for the year under review. In particular its financial performance was consistently satisfactory.
CENOREDs liquidity improved during the review period. For the financial year 2009/2010, CENORED
recorded the highest average energy cost of N$0.61c/kWh, which was an increase from N$0.52c/kWh the
previous year, followed by ERONGO RED which recorded an increase from N$0.49c/kWh to N$0.56c/kWh.
ERONGO RED has also improved on liquidity.Its debtor days remain high, but a notable improvement from
the previous year. The energy conversion efficiencies within NORED and CENORED remained below the
target, primarily due to the nature of the distribution network within these areas.
Under commercial indicators CENORED remained as the top performer, recording on average 51 debtor days.
Bad debts have decreased substantially at ERONGO RED, due to an improved revenue collection system.
The distribution licensees have had difficulties achieving the targets set for energy sold per employee,
recording an industry average of 1463kWh sold per employee, against a set target of 2400 - 9600kWh. This
is a serious concern to the ECB, and measures are being put in place to build capacity within the distribution
areas, and improve efficiencies within this performance area.
Licensing
Licensing Procedures
The main tasks of the ECB include issuing licenses and monitoring licensee performance to ensure compliance
with license conditions and requirements. A typical applicant for a license can be a corporate entity such as a
municipality, electricity generation or distribution company, a power utility, an individual, or any legal entity
intending to fully or partially undertake an electricity business within the borders of Namibia.
The application must be submitted to the Electricity Control Board, and advertised in newspapers according
to the regulations. Interested parties are required to forward their objections to the plans put forward in
the application to the ECB. The ECB then considers the application and objections, and either makes a
recommendation to the Minister of Mines and Energy, or arranges a public hearing about the application.
The result of the hearing is taken into account when the ECB makes its recommendation to the Minister.
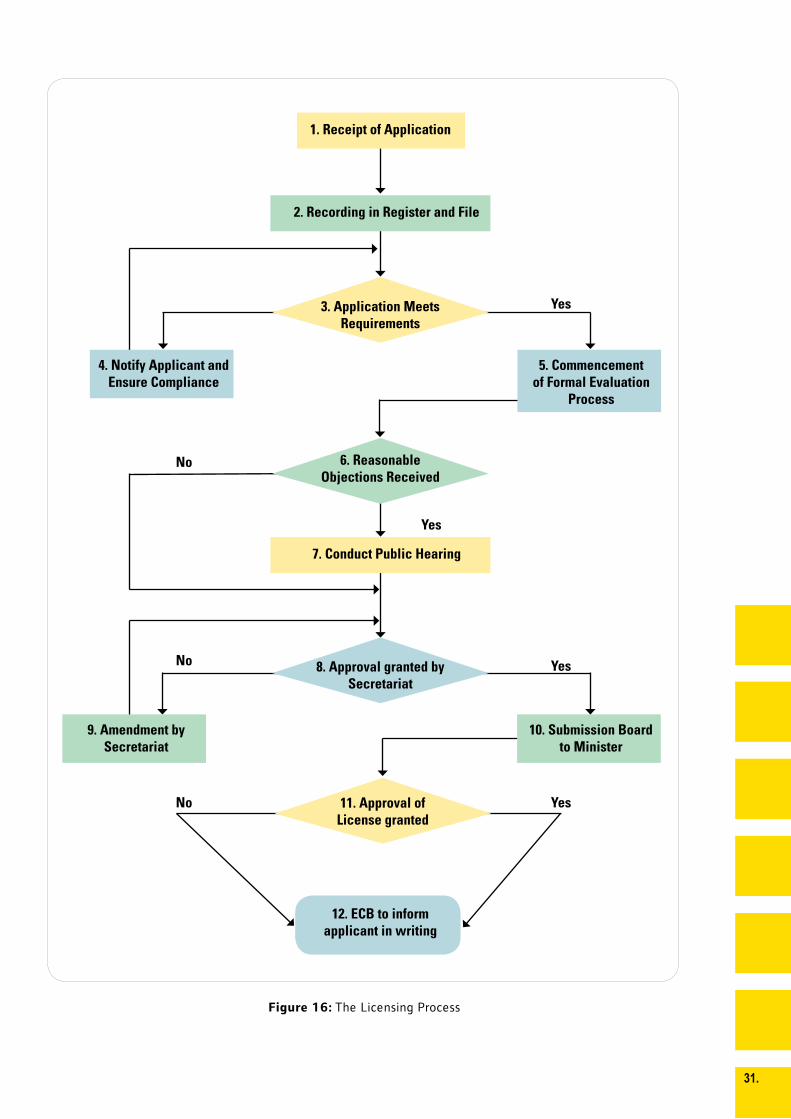
The Minister has the final decision, whether to approve or decline an application. The licensing process is
schematically summarised in Figure 16 on the next page.
30.
11. Approval of License granted
1. Receipt of Application
2. Recording in Register and File
3. Application Meets Requirements
5. Commencement of Formal Evaluation
Process
6. Reasonable Objections Received
4. Notify Applicant and Ensure Compliance
7. Conduct Public Hearing
9. Amendment by Secretariat
10. Submission Board to Minister
12. ECB to inform applicant in writing
Figure 16: The Licensing Process
31.
Yes
Yes8. Approval granted by Secretariat
YesNo
No
No
Yes
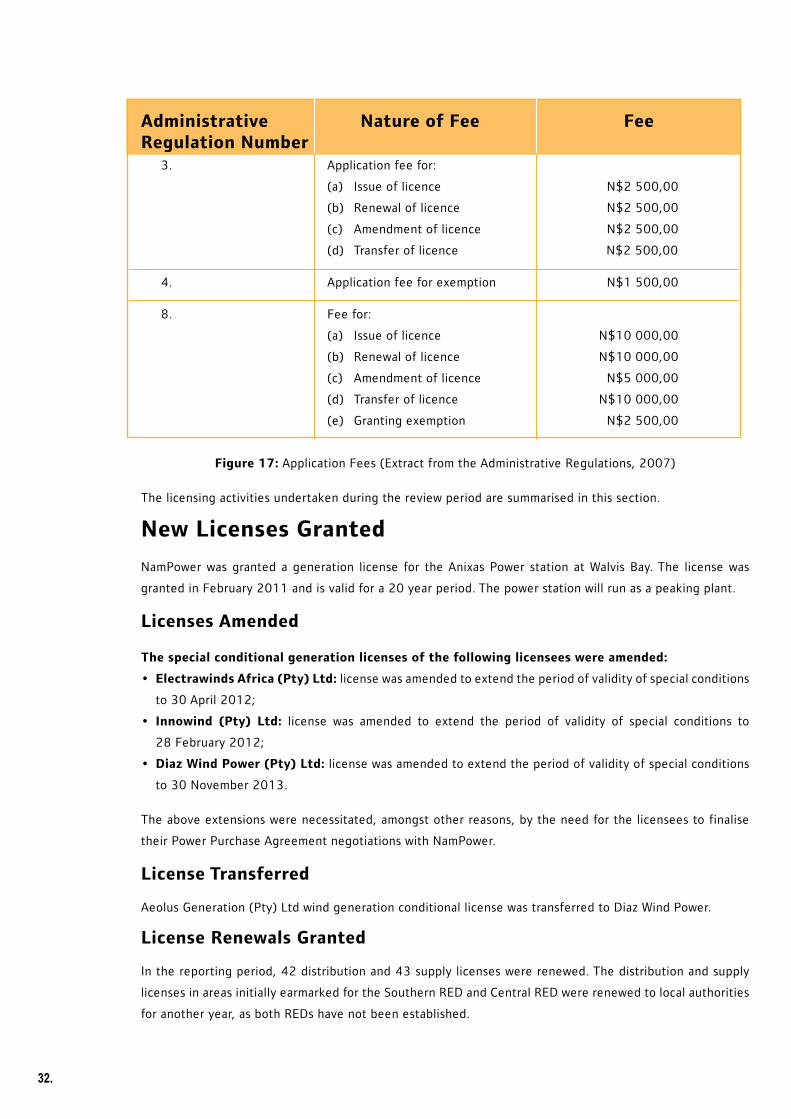
Administrative Nature of Fee FeeRegulation Number
3. Application fee for:
(a) Issue of licence N$2 500,00
(b) Renewal of licence N$2 500,00
(c) Amendment of licence N$2 500,00
(d) Transfer of licence N$2 500,00
4. Application fee for exemption N$1 500,00
8. Fee for:
(a) Issue of licence N$10 000,00
(b) Renewal of licence N$10 000,00
(c) Amendment of licence N$5 000,00
(d) Transfer of licence N$10 000,00
(e) Granting exemption N$2 500,00
Figure 17: Application Fees (Extract from the Administrative Regulations, 2007)
The licensing activities undertaken during the review period are summarised in this section.
New Licenses Granted
NamPower was granted a generation license for the Anixas Power station at Walvis Bay. The license was
granted in February 2011 and is valid for a 20 year period. The power station will run as a peaking plant.
Licenses Amended
The special conditional generation licenses of the following licensees were amended:
•Electrawinds Africa (Pty) Ltd: license was amended to extend the period of validity of special conditions
to 30 April 2012;
• Innowind (Pty) Ltd: license was amended to extend the period of validity of special conditions to
28 February 2012;
•Diaz Wind Power (Pty) Ltd: license was amended to extend the period of validity of special conditions
to 30 November 2013.
The above extensions were necessitated, amongst other reasons, by the need for the licensees to finalise
their Power Purchase Agreement negotiations with NamPower.
License Transferred
Aeolus Generation (Pty) Ltd wind generation conditional license was transferred to Diaz Wind Power.
License Renewals Granted
In the reporting period, 42 distribution and 43 supply licenses were renewed. The distribution and supply
licenses in areas initially earmarked for the Southern RED and Central RED were renewed to local authorities
for another year, as both REDs have not been established.
32.
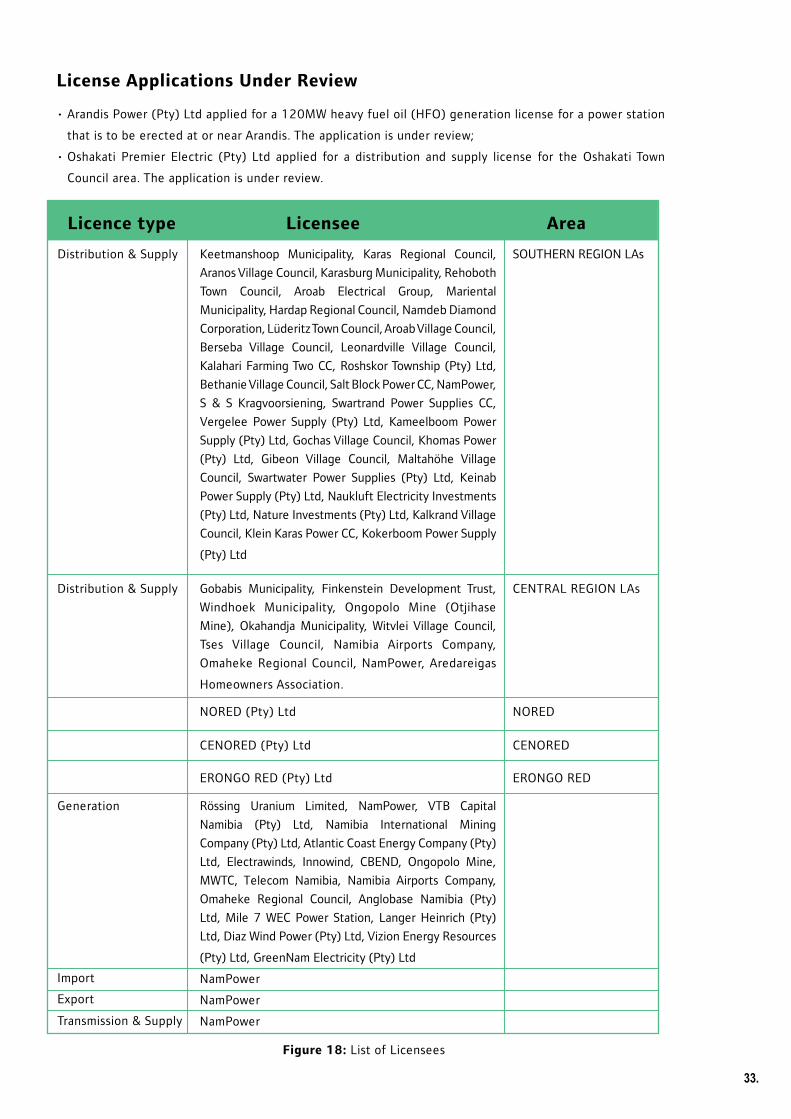
License Applications Under Review
•ArandisPower(Pty)Ltdappliedfora120MWheavyfueloil(HFO)generationlicenseforapowerstation
that is to be erected at or near Arandis. The application is under review;
•Oshakati Premier Electric (Pty) Ltd applied for a distribution and supply license for theOshakatiTown
Council area. The application is under review.
Keetmanshoop Municipality, Karas Regional Council,
Aranos Village Council, Karasburg Municipality, Rehoboth
Town Council, Aroab Electrical Group, Mariental
Municipality, Hardap Regional Council, Namdeb Diamond
Corporation, Lüderitz Town Council, Aroab Village Council,
Berseba Village Council, Leonardville Village Council,
Kalahari Farming Two CC, Roshskor Township (Pty) Ltd,
Bethanie Village Council, Salt Block Power CC, NamPower,
S & S Kragvoorsiening, Swartrand Power Supplies CC,
Vergelee Power Supply (Pty) Ltd, Kameelboom Power
Supply (Pty) Ltd, Gochas Village Council, Khomas Power
(Pty) Ltd, Gibeon Village Council, Maltahöhe Village
Council, Swartwater Power Supplies (Pty) Ltd, Keinab
Power Supply (Pty) Ltd, Naukluft Electricity Investments
(Pty) Ltd, Nature Investments (Pty) Ltd, Kalkrand Village
Council, Klein Karas Power CC, Kokerboom Power Supply
(Pty) Ltd
Distribution & Supply SOUTHERN REGION LAs
Gobabis Municipality, Finkenstein Development Trust,
Windhoek Municipality, Ongopolo Mine (Otjihase
Mine), Okahandja Municipality, Witvlei Village Council,
Tses Village Council, Namibia Airports Company,
Omaheke Regional Council, NamPower, Aredareigas
Homeowners Association.
Distribution & Supply CENTRAL REGION LAs
NORED (Pty) Ltd NORED
CENORED (Pty) Ltd CENORED
ERONGO RED (Pty) Ltd ERONGO RED
Rössing Uranium Limited, NamPower, VTB Capital
Namibia (Pty) Ltd, Namibia International Mining
Company (Pty) Ltd, Atlantic Coast Energy Company (Pty)
Ltd, Electrawinds, Innowind, CBEND, Ongopolo Mine,
MWTC, Telecom Namibia, Namibia Airports Company,
Omaheke Regional Council, Anglobase Namibia (Pty)
Ltd, Mile 7 WEC Power Station, Langer Heinrich (Pty)
Ltd, Diaz Wind Power (Pty) Ltd, Vizion Energy Resources
(Pty) Ltd, GreenNam Electricity (Pty) Ltd
NamPower
NamPower
NamPower
Generation
Import
Export
Transmission & Supply
Licence type Licensee Area
Figure 18: List of Licensees
33.
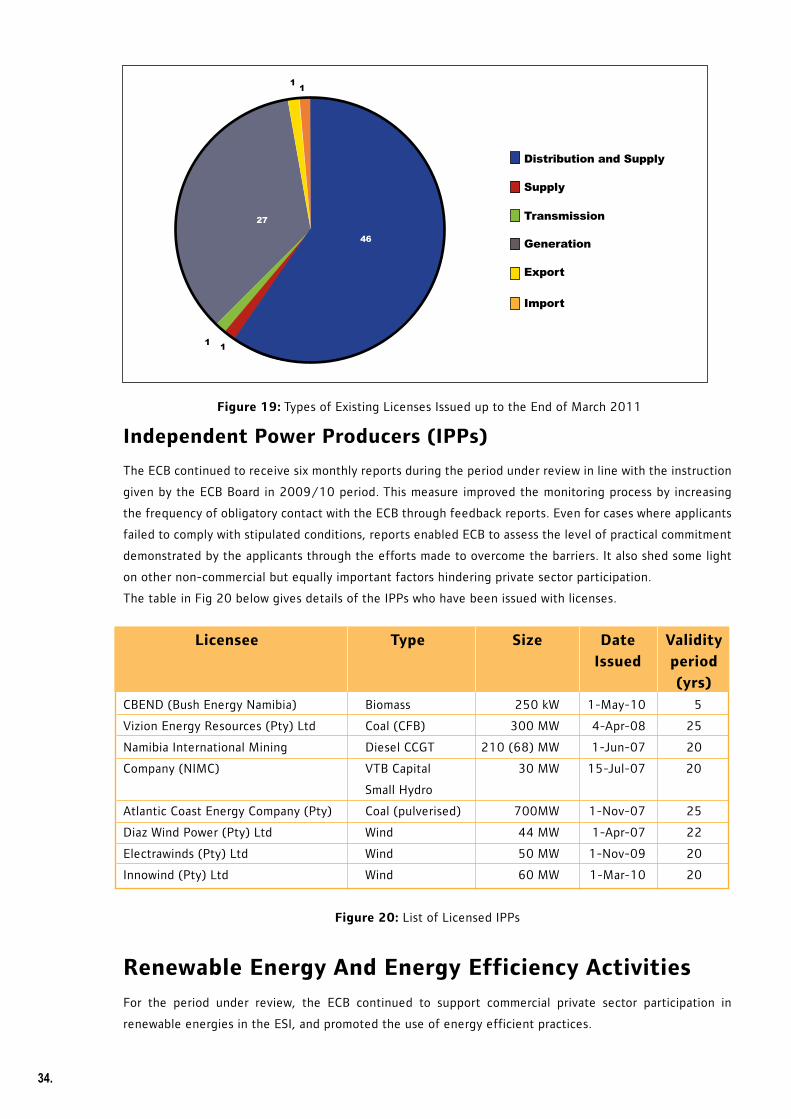
Figure 19: Types of Existing Licenses Issued up to the End of March 2011
Independent Power Producers (IPPs)
The ECB continued to receive six monthly reports during the period under review in line with the instruction
given by the ECB Board in 2009/10 period. This measure improved the monitoring process by increasing
the frequency of obligatory contact with the ECB through feedback reports. Even for cases where applicants
failed to comply with stipulated conditions, reports enabled ECB to assess the level of practical commitment
demonstrated by the applicants through the efforts made to overcome the barriers. It also shed some light
on other non-commercial but equally important factors hindering private sector participation.
The table in Fig 20 below gives details of the IPPs who have been issued with licenses.
Licensee Type Size Date Validity
Issued period
(yrs)
CBEND (Bush Energy Namibia) Biomass 250 kW 1-May-10 5
Vizion Energy Resources (Pty) Ltd Coal (CFB) 300 MW 4-Apr-08 25
Namibia International Mining Diesel CCGT 210 (68) MW 1-Jun-07 20
Company (NIMC) VTB Capital 30 MW 15-Jul-07 20
Small Hydro
Atlantic Coast Energy Company (Pty) Coal (pulverised) 700MW 1-Nov-07 25
Diaz Wind Power (Pty) Ltd Wind 44 MW 1-Apr-07 22
Electrawinds (Pty) Ltd Wind 50 MW 1-Nov-09 20
Innowind (Pty) Ltd Wind 60 MW 1-Mar-10 20
Figure 20: List of Licensed IPPs
Renewable Energy And Energy Efficiency Activities
For the period under review, the ECB continued to support commercial private sector participation in
renewable energies in the ESI, and promoted the use of energy efficient practices.
1
1 1
Distribution and Supply
Supply
Transmission
Generation
Export
Import
1
46
27
34.
35.
In particular, the ECB:
• issued conditional licenses in renewable energy generation to potential IPPs;
• approvedrenewableenergyfeedintariffsforsmallscalerenewableenergytechnologiesforErongoRED
and CENORED;
• maderecommendationstotheBoardonrenewableenergyprocurementmechanisms;
• participatedincapacitybuildingtrainingforenergyefficiencyassessments;and
• networked at national, regional and international levels on renewable energy and energy efficiency
activities.
The ECB continues to support the Government’s initiatives for the promotion of the use of solar water
heaters in Government buildings. Contemporary solar water heaters are a good example of a cost-effective
renewable energy technology that contributes to significant long-term cost savings for consumers.
Solar Photovoltaic (PV) License ApplicationsThere is considerable interest amongst investors in solar photovoltaic (PV) technology. Presently, and in the
absence of a guiding policy on procurement mechanisms for renewable energy technologies, and because
the Integrated Resource Plan has not yet been completed, the ECB considers licenses for solar PV plants as
and when such applications are received. Of note is a license for a 30 MW PV plant, which was issued to an
investor in 2011.
36.
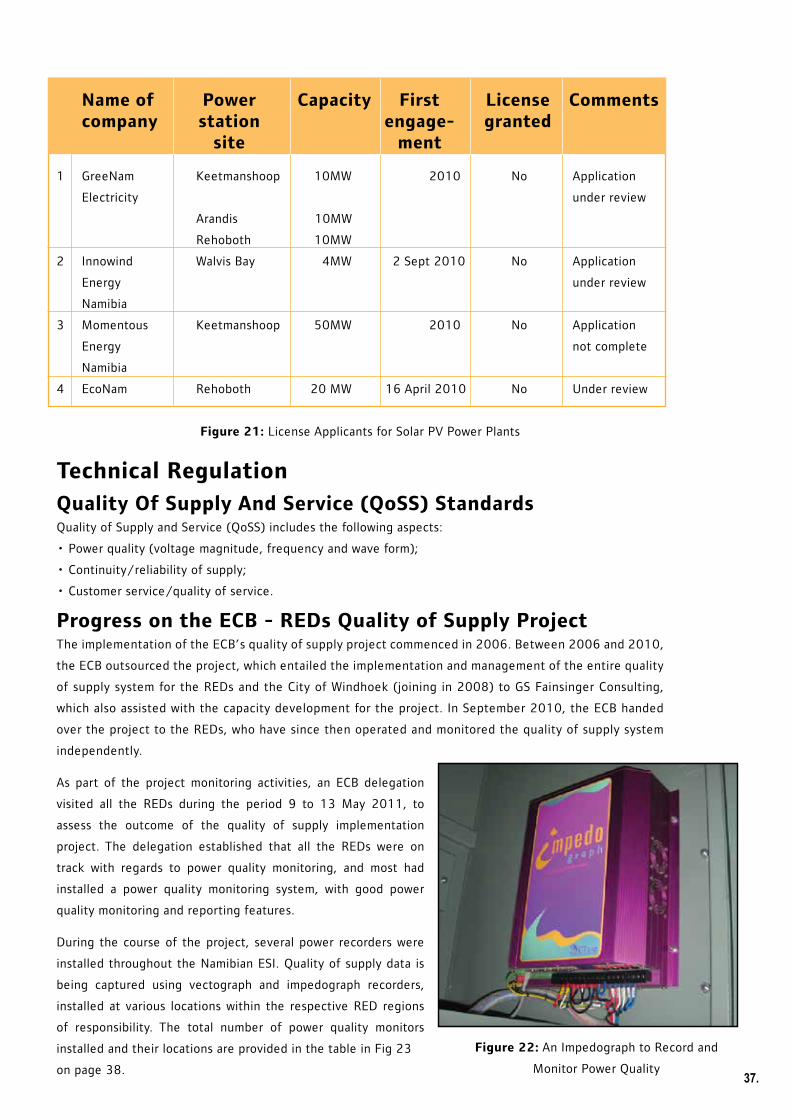
Name of Power Capacity First License Comments company station engage- granted site ment
1 GreeNam Keetmanshoop 10MW 2010 No Application
Electricity under review
Arandis 10MW
Rehoboth 10MW
2 Innowind Walvis Bay 4MW 2 Sept 2010 No Application
Energy under review
Namibia
3 Momentous Keetmanshoop 50MW 2010 No Application
Energy not complete
Namibia
4 EcoNam Rehoboth 20 MW 16 April 2010 No Under review
Figure 21: License Applicants for Solar PV Power Plants
Technical Regulation
Quality Of Supply And Service (QoSS) Standards Quality of Supply and Service (QoSS) includes the following aspects:
• Power quality (voltage magnitude, frequency and wave form);
• Continuity/reliability of supply;
• Customer service/quality of service.
Progress on the ECB - REDs Quality of Supply ProjectThe implementation of the ECB’s quality of supply project commenced in 2006. Between 2006 and 2010,
the ECB outsourced the project, which entailed the implementation and management of the entire quality
of supply system for the REDs and the City of Windhoek (joining in 2008) to GS Fainsinger Consulting,
which also assisted with the capacity development for the project. In September 2010, the ECB handed
over the project to the REDs, who have since then operated and monitored the quality of supply system
independently.
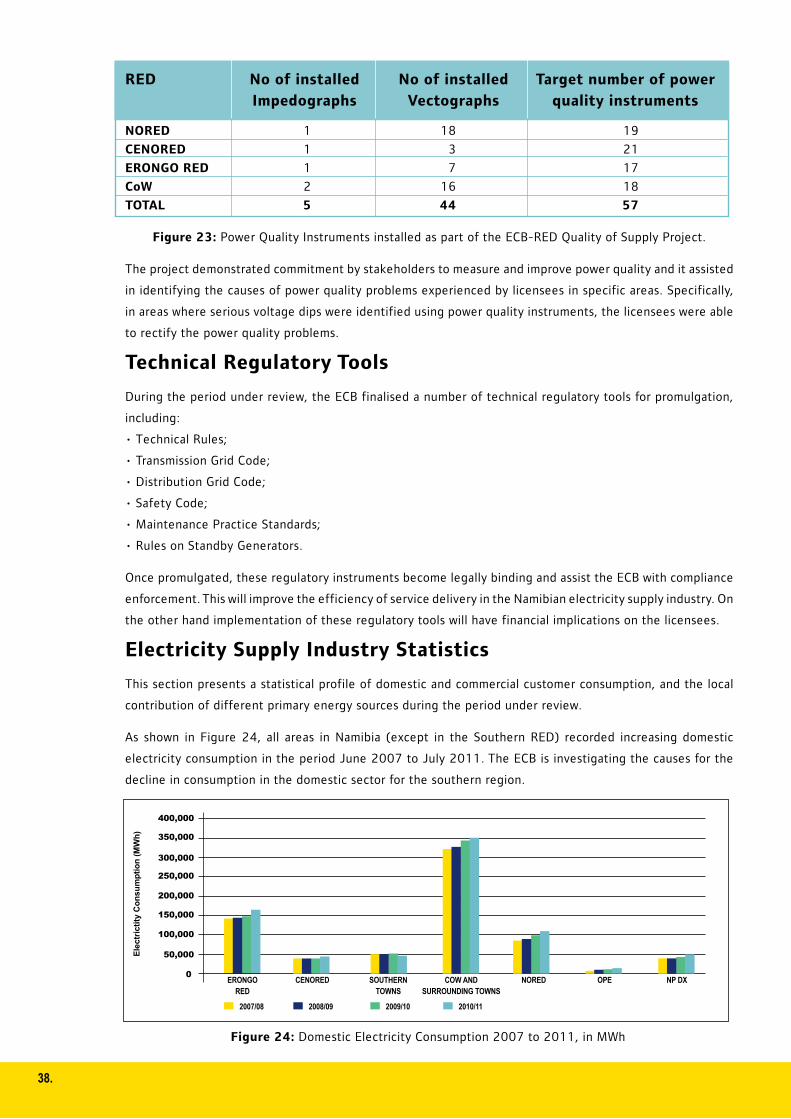
As part of the project monitoring activities, an ECB delegation
visited all the REDs during the period 9 to 13 May 2011, to
assess the outcome of the quality of supply implementation
project. The delegation established that all the REDs were on
track with regards to power quality monitoring, and most had
installed a power quality monitoring system, with good power
quality monitoring and reporting features.
During the course of the project, several power recorders were
installed throughout the Namibian ESI. Quality of supply data is
being captured using vectograph and impedograph recorders,
installed at various locations within the respective RED regions
of responsibility. The total number of power quality monitors
installed and their locations are provided in the table in Fig 23
on page 38.
Figure 22: An Impedograph to Record and
Monitor Power Quality37.
RED No of installed No of installed Target number of power
Impedographs Vectographs quality instruments
NORED 1 18 19
CENORED 1 3 21
ERONGO RED 1 7 17
CoW 2 16 18
TOTAL 5 44 57
Figure 23: Power Quality Instruments installed as part of the ECB-RED Quality of Supply Project.
The project demonstrated commitment by stakeholders to measure and improve power quality and it assisted
in identifying the causes of power quality problems experienced by licensees in specific areas. Specifically,
in areas where serious voltage dips were identified using power quality instruments, the licensees were able
to rectify the power quality problems.
Technical Regulatory Tools
During the period under review, the ECB finalised a number of technical regulatory tools for promulgation,
including:
•TechnicalRules;
•TransmissionGridCode;
•DistributionGridCode;
•SafetyCode;
•MaintenancePracticeStandards;
•RulesonStandbyGenerators.
Once promulgated, these regulatory instruments become legally binding and assist the ECB with compliance
enforcement. This will improve the efficiency of service delivery in the Namibian electricity supply industry. On
the other hand implementation of these regulatory tools will have financial implications on the licensees.
Electricity Supply Industry Statistics
This section presents a statistical profile of domestic and commercial customer consumption, and the local
contribution of different primary energy sources during the period under review.
As shown in Figure 24, all areas in Namibia (except in the Southern RED) recorded increasing domestic
electricity consumption in the period June 2007 to July 2011. The ECB is investigating the causes for the
decline in consumption in the domestic sector for the southern region.
50,000
100,000
150,000
200,000
250,000
300,000
ERONGORED
Ele
ctri
ctit
y C
on
sum
pti
on
(M
Wh
)
2007/08
0CENORED SOUTHERN
TOWNSCOW AND
SURROUNDING TOWNSNORED OPE NP DX
350,000
400,000
2008/09 2009/10 2010/11
Figure 24: Domestic Electricity Consumption 2007 to 2011, in MWh
38.
As shown in Figure 25, the number of domestic customers has increased in all areas in Namibia, except in
the City of Windhoek area, which shows a small decline in 2011. The ECB is investigating the causes for
the decrease in the number of customers against an increase in consumption for the City of Windhoek and
surrounding towns as shown in Fig 24 on page 38.
50,000
100,000
150,000
200,000
250,000
300,000
ERONGORED
Ele
ctri
ctit
y C
on
sum
pti
on
(M
Wh
)
2007/08
0CENORED SOUTHERN
REDCOW AND
SURROUNDING TOWNSNORED OPE NP DX
350,000
400,000
2008/09 2009/10 2010/11
Figure 25: Number of Domestic Customers in 2007 to 2011
In the commercial sector, consumption of electricity increased except in CENORED and in the NamPower
distribution areas. It is assumed that a reclassification of customers may have contributed to decreasing
commercial customer consumption in the CENORED area.
Figure 26: Commercial Electricity Consumption 2007 to 2011
The trends for customer numbers, as shown in Figure 27 on page 40, are similar to those shown for commercial
electricity consumption. The ECB is investigating the causes for the decline in consumption in the commercial
sector. In the case of the NamPower distibution areas, customer number remained almost constant, while the
average consumption per commercial customer decreased in the reporting period.
39.
20,000
40,000
60,000
80,000
100,000
120,000
ERONGORED
Ele
ctri
ctit
y C
on
sum
pti
on
(M
Wh
)
2007/08
0CENORED SOUTHERN
TOWNSCOW AND
SURROUNDING TOWNSNORED OPE NP DX
140,000
2008/09 2009/10 2010/11
160,000
180,000
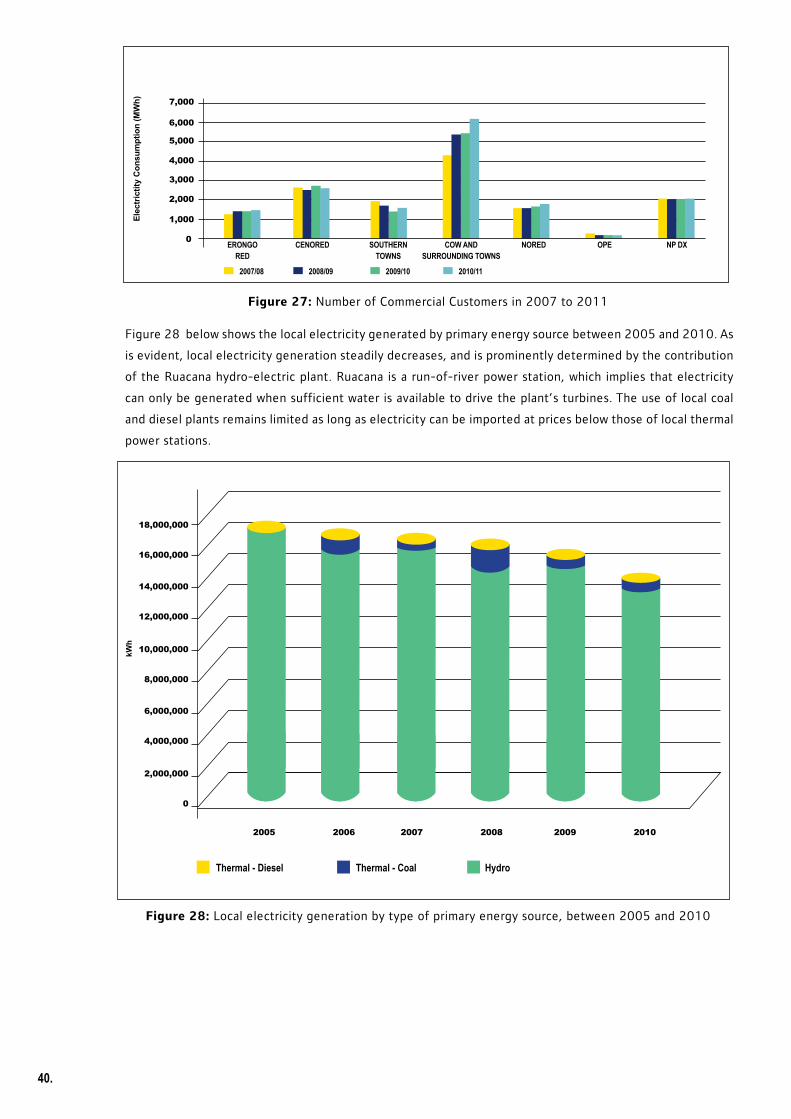
Figure 28 below shows the local electricity generated by primary energy source between 2005 and 2010. As
is evident, local electricity generation steadily decreases, and is prominently determined by the contribution
of the Ruacana hydro-electric plant. Ruacana is a run-of-river power station, which implies that electricity
can only be generated when sufficient water is available to drive the plant’s turbines. The use of local coal
and diesel plants remains limited as long as electricity can be imported at prices below those of local thermal
power stations.
Figure 27: Number of Commercial Customers in 2007 to 2011
Figure 28: Local electricity generation by type of primary energy source, between 2005 and 2010
Thermal - Diesel Thermal - Coal Hydro
40.
1,000
2,000
3,000
4,000
5,000
6,000
ERONGORED
Ele
ctri
ctit
y C
on
sum
pti
on
(M
Wh
)
2007/08
0CENORED SOUTHERN
TOWNSCOW AND
SURROUNDING TOWNSNORED OPE NP DX
7,000
2008/09 2009/10 2010/11
18,000,000
16,000,000
14,000,000
12,000,000
10,000,000
8,000,000
6,000,000
4,000,000
2,000,000
0
2005 2006 2007 2008 2009 2010
kWh
Annual Financial Statements For The Year Ended 31 March 2011
41.
FI
NA
NC
IA
LS
Annual Financial StatementsFor The Year Ended 31 March 2011
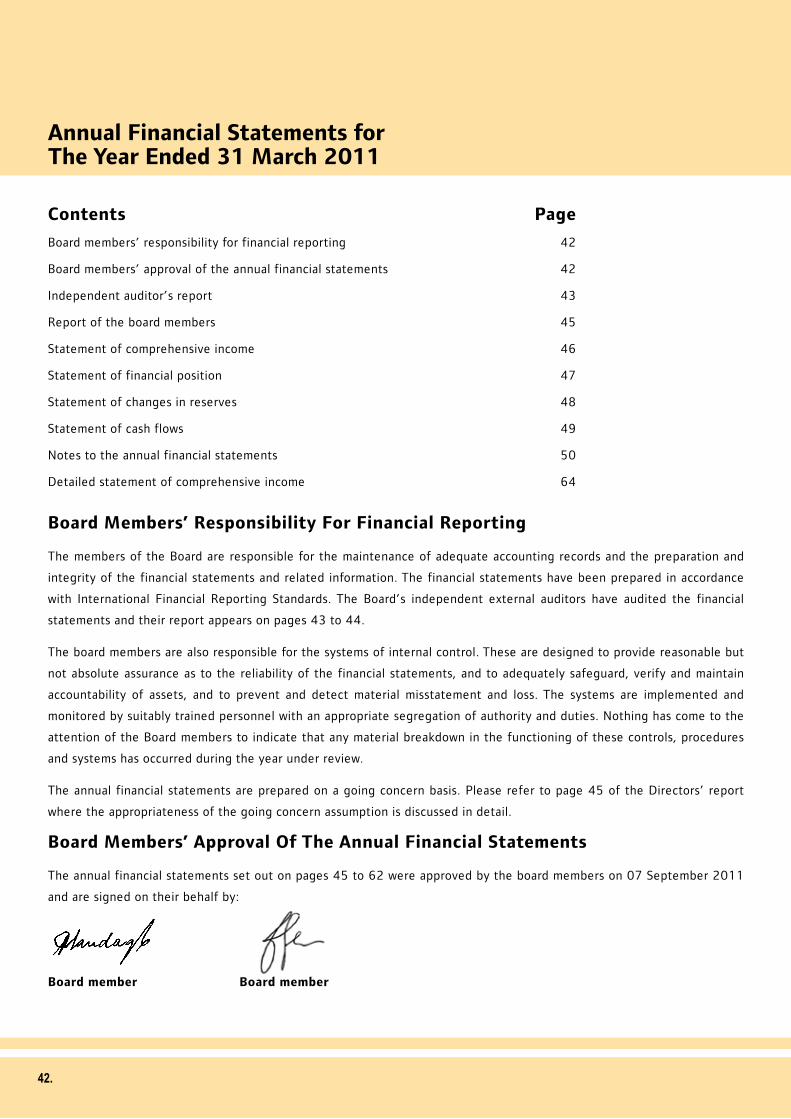
Contents Page
Board members’ responsibility for financial reporting 42
Board members’ approval of the annual financial statements 42
Independent auditor’s report 43
Report of the board members 45
Statement of comprehensive income 46
Statement of financial position 47
Statement of changes in reserves 48
Statement of cash flows 49
Notes to the annual financial statements 50
Detailed statement of comprehensive income 64
Board Members’ Responsibility For Financial Reporting
The members of the Board are responsible for the maintenance of adequate accounting records and the preparation and
integrity of the financial statements and related information. The financial statements have been prepared in accordance
with International Financial Reporting Standards. The Board’s independent external auditors have audited the financial
statements and their report appears on pages 43 to 44.
The board members are also responsible for the systems of internal control. These are designed to provide reasonable but
not absolute assurance as to the reliability of the financial statements, and to adequately safeguard, verify and maintain
accountability of assets, and to prevent and detect material misstatement and loss. The systems are implemented and
monitored by suitably trained personnel with an appropriate segregation of authority and duties. Nothing has come to the
attention of the Board members to indicate that any material breakdown in the functioning of these controls, procedures
and systems has occurred during the year under review.
The annual financial statements are prepared on a going concern basis. Please refer to page 45 of the Directors’ report
where the appropriateness of the going concern assumption is discussed in detail.
Board Members’ Approval Of The Annual Financial Statements
The annual financial statements set out on pages 45 to 62 were approved by the board members on 07 September 2011
and are signed on their behalf by:
Board member Board member
50.42.
Annual Financial Statements for The Year Ended 31 March 2011
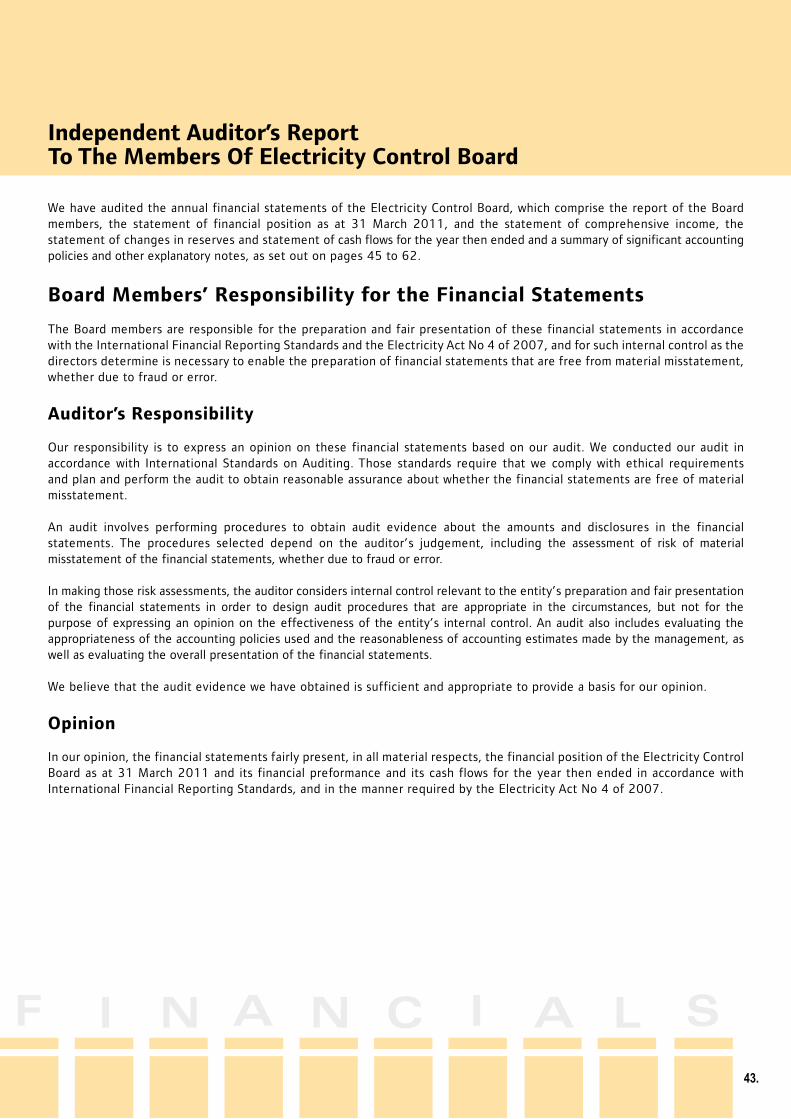
Independent Auditor’s ReportTo The Members Of Electricity Control Board
We have audited the annual financial statements of the Electricity Control Board, which comprise the report of the Board members, the statement of financial position as at 31 March 2011, and the statement of comprehensive income, the statement of changes in reserves and statement of cash flows for the year then ended and a summary of significant accounting policies and other explanatory notes, as set out on pages 45 to 62.
Board Members’ Responsibility for the Financial Statements
The Board members are responsible for the preparation and fair presentation of these financial statements in accordance with the International Financial Reporting Standards and the Electricity Act No 4 of 2007, and for such internal control as the directors determine is necessary to enable the preparation of financial statements that are free from material misstatement, whether due to fraud or error.
Auditor’s Responsibility
Our responsibility is to express an opinion on these financial statements based on our audit. We conducted our audit in accordance with International Standards on Auditing. Those standards require that we comply with ethical requirements and plan and perform the audit to obtain reasonable assurance about whether the financial statements are free of material misstatement.
An audit involves performing procedures to obtain audit evidence about the amounts and disclosures in the financial statements. The procedures selected depend on the auditor’s judgement, including the assessment of risk of material misstatement of the financial statements, whether due to fraud or error.
In making those risk assessments, the auditor considers internal control relevant to the entity’s preparation and fair presentation of the financial statements in order to design audit procedures that are appropriate in the circumstances, but not for the purpose of expressing an opinion on the effectiveness of the entity’s internal control. An audit also includes evaluating the appropriateness of the accounting policies used and the reasonableness of accounting estimates made by the management, as well as evaluating the overall presentation of the financial statements.
We believe that the audit evidence we have obtained is sufficient and appropriate to provide a basis for our opinion.
Opinion
In our opinion, the financial statements fairly present, in all material respects, the financial position of the Electricity Control Board as at 31 March 2011 and its financial preformance and its cash flows for the year then ended in accordance with International Financial Reporting Standards, and in the manner required by the Electricity Act No 4 of 2007.
51.
F I N A N C I A L S43.
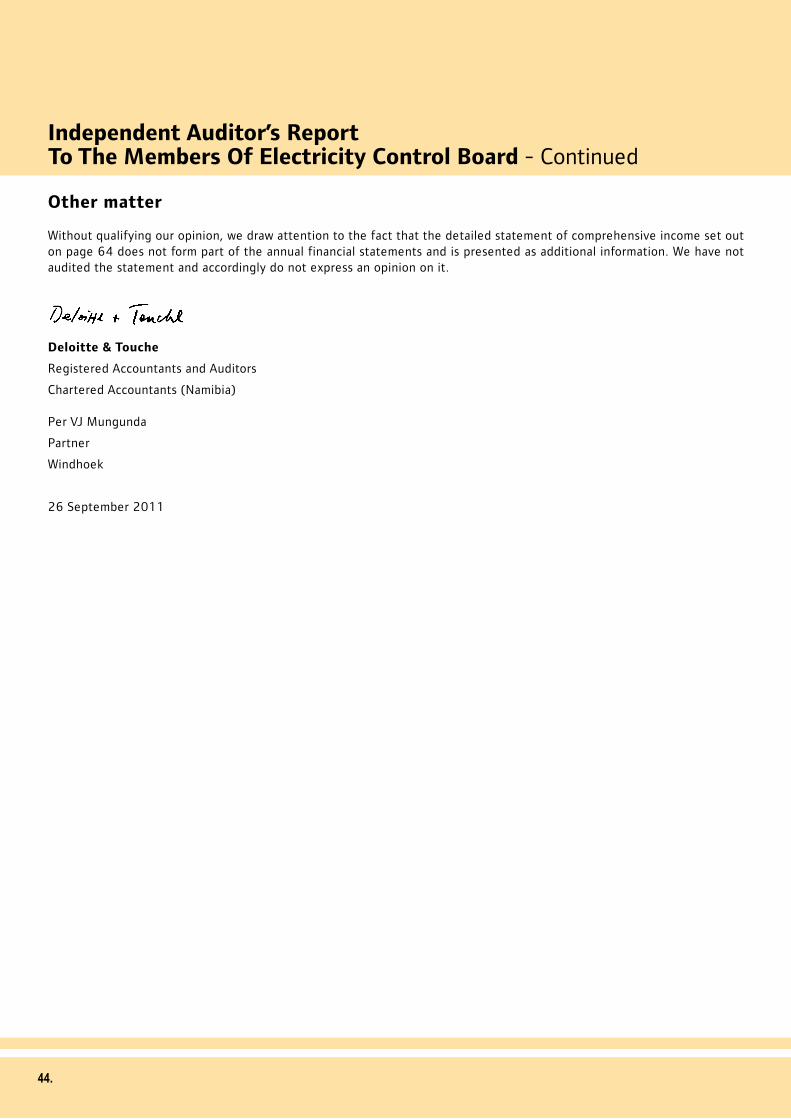
Independent Auditor’s ReportTo The Members Of Electricity Control Board - Continued
Other matter
Without qualifying our opinion, we draw attention to the fact that the detailed statement of comprehensive income set out on page 64 does not form part of the annual financial statements and is presented as additional information. We have not audited the statement and accordingly do not express an opinion on it.
Deloitte & Touche
Registered Accountants and Auditors
Chartered Accountants (Namibia)
Per VJ Mungunda
Partner
Windhoek
26 September 2011
50.44.
51.45.
Report of the Board MembersFor The Year Ended 31 March 2011
The Board members have pleasure in presenting their report on the activities of the Board for the year ended 31 March
2011.
Background and Operations
The Electricity Control Board was established by the Government of the Republic of Namibia in terms of the Electricity
Act No 2 of 2000 (repealed by Electricity Act No 4 of 2007), to exercise control over the electricity supply industry and
to regulate the generation, transmission, distribution, use, import and export of electricity in accordance with prevailing
Government policy so as to ensure order in the efficient supply of electricity.
Results
The results of the Board are fully set out in the attached annual financial statements.
Dividends
No dividends have been paid or declared during the year (2010: Nil).
Board Members and Secretary
The members of the Electricity Control Board during the year and at the date of this report were as follows:
Mr. Jason Nandago (Chairperson)
Mr. Gersom Katjimune
Ms. Panduleni Shimutwikeni
Mr. Fritz Jeske
Mr. Gottlieb Hinda
Board Secretary
Ms Damoline Muruko
Business address Postal address
8 Bismarck Street PO Box 2923
Windhoek Windhoek
NAMIBIA NAMIBIA
Subsequent Events
The board members are not aware of any fact or circumstance, which occurred between the date of the financial statements
and the date of this report, which might influence an assessment of the Board’s state of affairs and require disclosure in
these financial statements.
Going Concern
The Board incurred a loss of N$4 474 842 (2010: N$2 687 023) and a surplus of N$240 274 is forecast for the 2011/12
financial year. The Board has also accumulated sufficient surplus to absorb any future losses and together with future
revision to the levies, these will ensure the operational existence of the Electricity Control Board and this confirms the
appropriateness of the going concern basis in the preparation of the annual financial statements.
F I N A N C I A L S
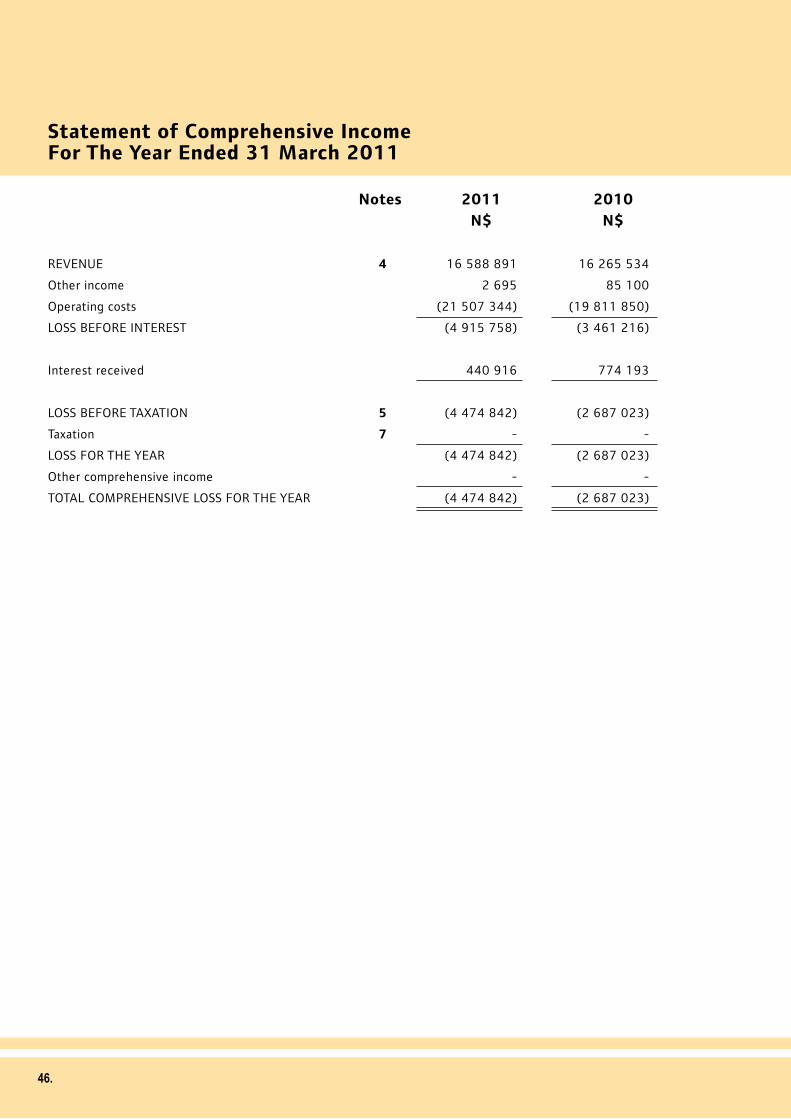
Notes 2011 2010
N$ N$
REVENUE 4 16 588 891 16 265 534
Other income 2 695 85 100
Operating costs (21 507 344) (19 811 850)
LOSS BEFORE INTEREST (4 915 758) (3 461 216)
Interest received 440 916 774 193
LOSS BEFORE TAXATION 5 (4 474 842) (2 687 023)
Taxation 7 - -
LOSS FOR THE YEAR (4 474 842) (2 687 023)
Other comprehensive income - -
TOTAL COMPREHENSIVE LOSS FOR THE YEAR (4 474 842) (2 687 023)
Statement of Comprehensive IncomeFor The Year Ended 31 March 2011
46.
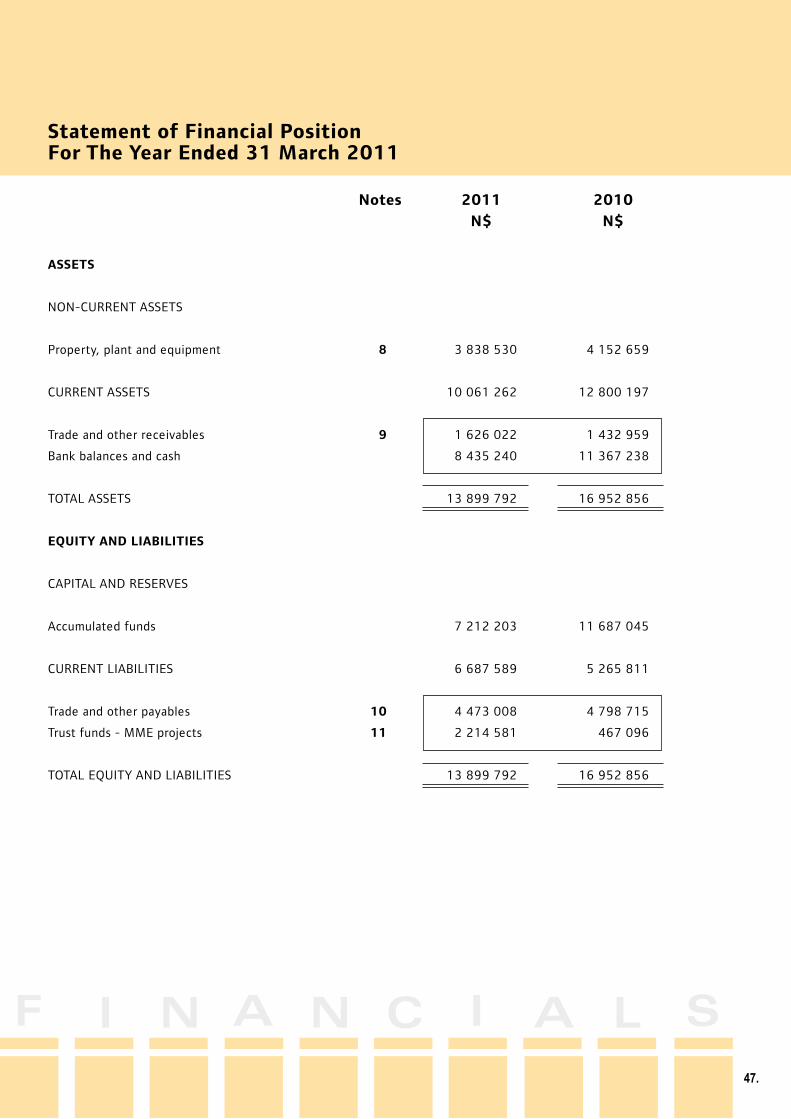
Notes 2011 2010
N$ N$
ASSETS
NON-CURRENT ASSETS
Property, plant and equipment 8 3 838 530 4 152 659
CURRENT ASSETS 10 061 262 12 800 197
Trade and other receivables 9 1 626 022 1 432 959
Bank balances and cash 8 435 240 11 367 238
TOTAL ASSETS 13 899 792 16 952 856
EQUITY AND LIABILITIES
CAPITAL AND RESERVES
Accumulated funds 7 212 203 11 687 045
CURRENT LIABILITIES 6 687 589 5 265 811
Trade and other payables 10 4 473 008 4 798 715
Trust funds - MME projects 11 2 214 581 467 096
TOTAL EQUITY AND LIABILITIES 13 899 792 16 952 856
51.
Statement of Financial PositionFor The Year Ended 31 March 2011
47.
F I N A N C I A L S
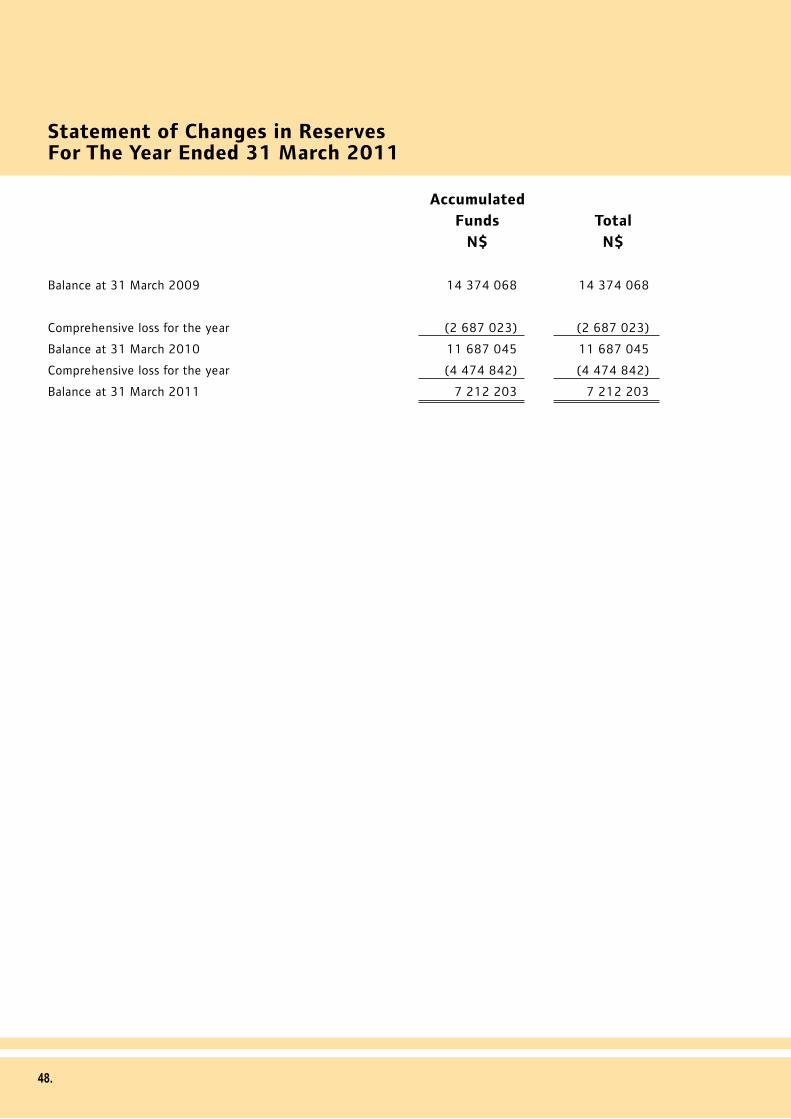
Accumulated
Funds Total
N$ N$
Balance at 31 March 2009 14 374 068 14 374 068
Comprehensive loss for the year (2 687 023) (2 687 023)
Balance at 31 March 2010 11 687 045 11 687 045
Comprehensive loss for the year (4 474 842) (4 474 842)
Balance at 31 March 2011 7 212 203 7 212 203
Statement of Changes in ReservesFor The Year Ended 31 March 2011
48.
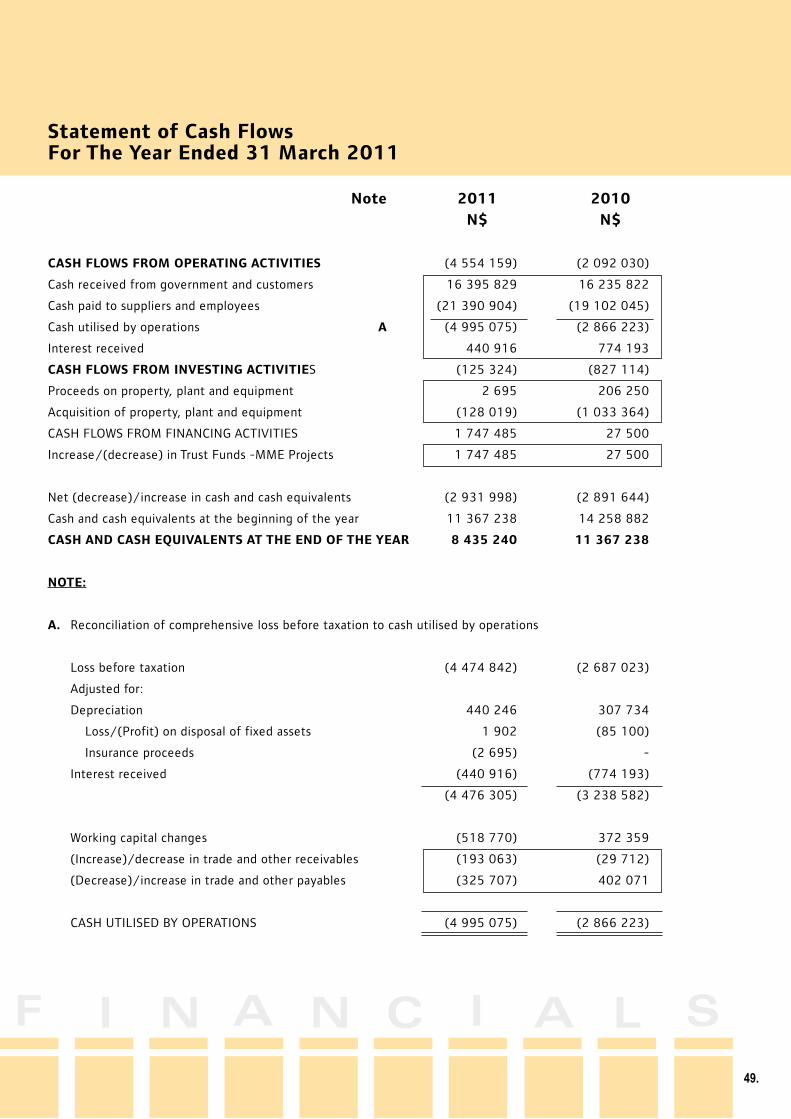
Note 2011 2010
N$ N$
CASH FLOWS FROM OPERATING ACTIVITIES (4 554 159) (2 092 030)
Cash received from government and customers 16 395 829 16 235 822
Cash paid to suppliers and employees (21 390 904) (19 102 045)
Cash utilised by operations A (4 995 075) (2 866 223)
Interest received 440 916 774 193
CASH FLOWS FROM INVESTING ACTIVITIES (125 324) (827 114)
Proceeds on property, plant and equipment 2 695 206 250
Acquisition of property, plant and equipment (128 019) (1 033 364)
CASH FLOWS FROM FINANCING ACTIVITIES 1 747 485 27 500
Increase/(decrease) in Trust Funds -MME Projects 1 747 485 27 500
Net (decrease)/increase in cash and cash equivalents (2 931 998) (2 891 644)
Cash and cash equivalents at the beginning of the year 11 367 238 14 258 882
CASH AND CASH EQUIVALENTS AT THE END OF THE YEAR 8 435 240 11 367 238
NOTE:
A. Reconciliation of comprehensive loss before taxation to cash utilised by operations
Loss before taxation (4 474 842) (2 687 023)
Adjusted for:
Depreciation 440 246 307 734
Loss/(Profit) on disposal of fixed assets 1 902 (85 100)
Insurance proceeds (2 695) -
Interest received (440 916) (774 193)
(4 476 305) (3 238 582)
Working capital changes (518 770) 372 359
(Increase)/decrease in trade and other receivables (193 063) (29 712)
(Decrease)/increase in trade and other payables (325 707) 402 071
CASH UTILISED BY OPERATIONS (4 995 075) (2 866 223)
Statement of Cash FlowsFor The Year Ended 31 March 2011
49.
F I N A N C I A L S
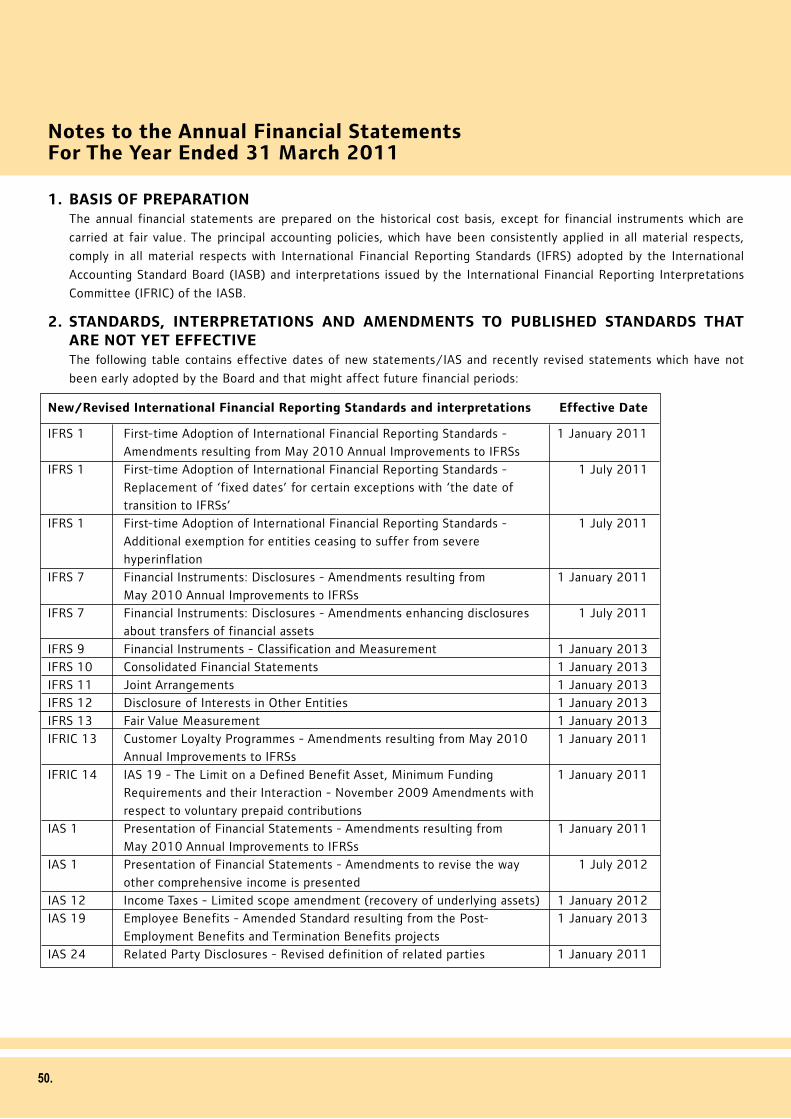
1. BASIS OF PREPARATION The annual financial statements are prepared on the historical cost basis, except for financial instruments which are
carried at fair value. The principal accounting policies, which have been consistently applied in all material respects,
comply in all material respects with International Financial Reporting Standards (IFRS) adopted by the International
Accounting Standard Board (IASB) and interpretations issued by the International Financial Reporting Interpretations
Committee (IFRIC) of the IASB.
2. STANDARDS, INTERPRETATIONS AND AMENDMENTS TO PUBLISHED STANDARDS THAT ARE NOT YET EFFECTIVE
The following table contains effective dates of new statements/IAS and recently revised statements which have not
been early adopted by the Board and that might affect future financial periods:
New/Revised International Financial Reporting Standards and interpretations Effective Date
IFRS 1 First-time Adoption of International Financial Reporting Standards - 1 January 2011
Amendments resulting from May 2010 Annual Improvements to IFRSs
IFRS 1 First-time Adoption of International Financial Reporting Standards - 1 July 2011
Replacement of ‘fixed dates’ for certain exceptions with ‘the date of
transition to IFRSs’
IFRS 1 First-time Adoption of International Financial Reporting Standards - 1 July 2011
Additional exemption for entities ceasing to suffer from severe
hyperinflation
IFRS 7 Financial Instruments: Disclosures - Amendments resulting from 1 January 2011
May 2010 Annual Improvements to IFRSs
IFRS 7 Financial Instruments: Disclosures - Amendments enhancing disclosures 1 July 2011
about transfers of financial assets
IFRS 9 Financial Instruments - Classification and Measurement 1 January 2013
IFRS 10 Consolidated Financial Statements 1 January 2013
IFRS 11 Joint Arrangements 1 January 2013
IFRS 12 Disclosure of Interests in Other Entities 1 January 2013
IFRS 13 Fair Value Measurement 1 January 2013
IFRIC 13 Customer Loyalty Programmes - Amendments resulting from May 2010 1 January 2011
Annual Improvements to IFRSs
IFRIC 14 IAS 19 - The Limit on a Defined Benefit Asset, Minimum Funding 1 January 2011
Requirements and their Interaction - November 2009 Amendments with
respect to voluntary prepaid contributions
IAS 1 Presentation of Financial Statements - Amendments resulting from 1 January 2011
May 2010 Annual Improvements to IFRSs
IAS 1 Presentation of Financial Statements - Amendments to revise the way 1 July 2012
other comprehensive income is presented
IAS 12 Income Taxes - Limited scope amendment (recovery of underlying assets) 1 January 2012
IAS 19 Employee Benefits - Amended Standard resulting from the Post- 1 January 2013
Employment Benefits and Termination Benefits projects
IAS 24 Related Party Disclosures - Revised definition of related parties 1 January 2011
Notes to the Annual Financial StatementsFor The Year Ended 31 March 2011
50.
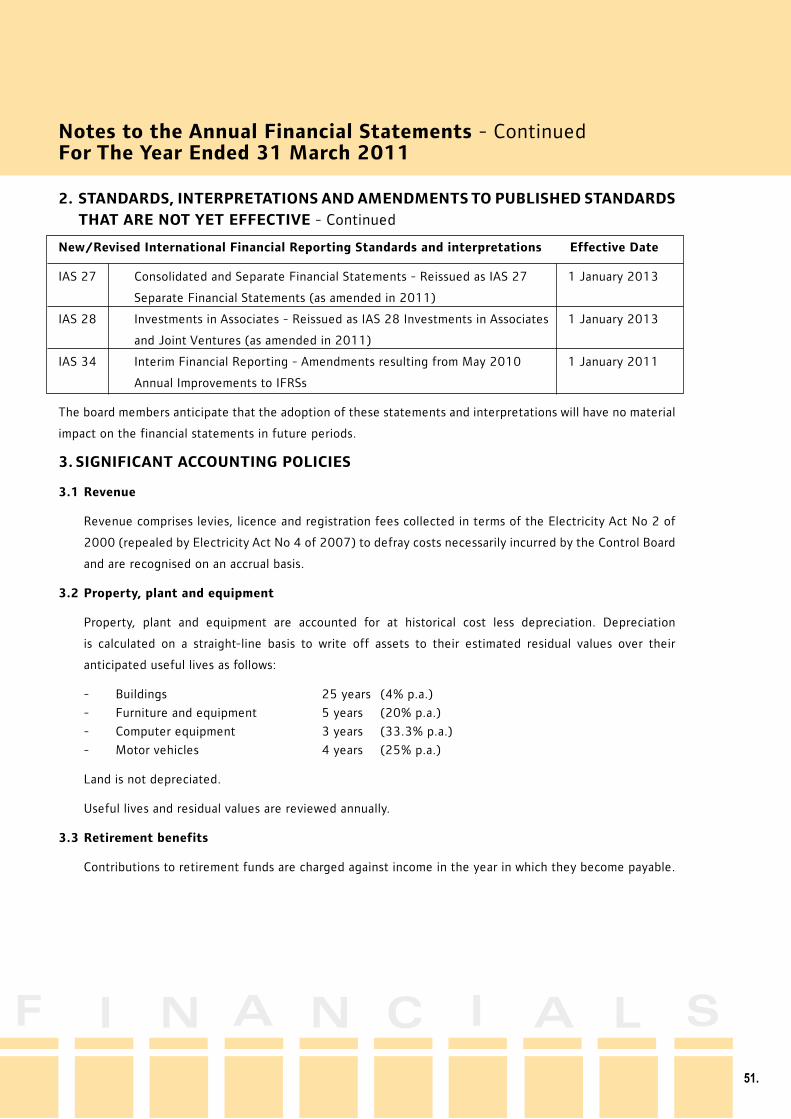
2. STANDARDS, INTERPRETATIONS AND AMENDMENTS TO PUBLISHED STANDARDS
THAT ARE NOT YET EFFECTIVE - Continued
New/Revised International Financial Reporting Standards and interpretations Effective Date
IAS 27 Consolidated and Separate Financial Statements - Reissued as IAS 27 1 January 2013
Separate Financial Statements (as amended in 2011)
IAS 28 Investments in Associates - Reissued as IAS 28 Investments in Associates 1 January 2013
and Joint Ventures (as amended in 2011)
IAS 34 Interim Financial Reporting - Amendments resulting from May 2010 1 January 2011
Annual Improvements to IFRSs
The board members anticipate that the adoption of these statements and interpretations will have no material
impact on the financial statements in future periods.
3. SIGNIFICANT ACCOUNTING POLICIES
3.1 Revenue
Revenue comprises levies, licence and registration fees collected in terms of the Electricity Act No 2 of
2000 (repealed by Electricity Act No 4 of 2007) to defray costs necessarily incurred by the Control Board
and are recognised on an accrual basis.
3.2 Property, plant and equipment
Property, plant and equipment are accounted for at historical cost less depreciation. Depreciation
is calculated on a straight-line basis to write off assets to their estimated residual values over their
anticipated useful lives as follows:
- Buildings 25 years (4% p.a.)
- Furniture and equipment 5 years (20% p.a.)
- Computer equipment 3 years (33.3% p.a.)
- Motor vehicles 4 years (25% p.a.)
Land is not depreciated.
Useful lives and residual values are reviewed annually.
3.3 Retirement benefits
Contributions to retirement funds are charged against income in the year in which they become payable.
Notes to the Annual Financial Statements - ContinuedFor The Year Ended 31 March 2011
51.
F I N A N C I A L S
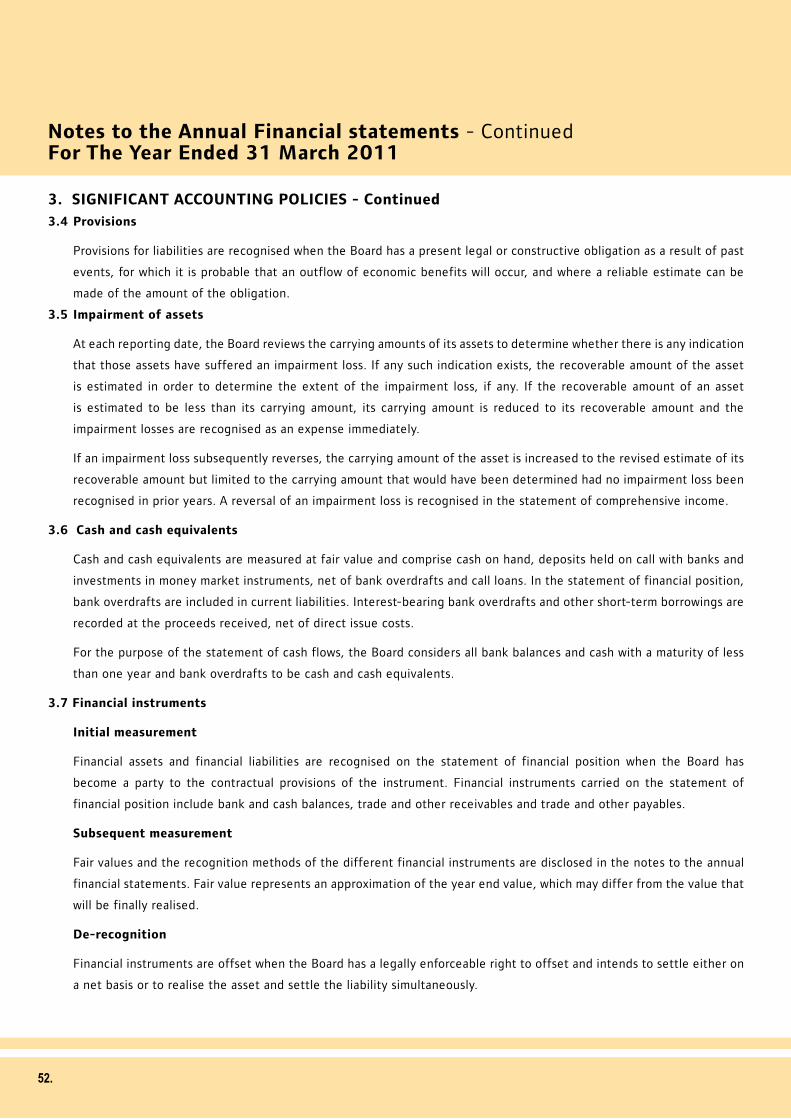
3. SIGNIFICANT ACCOUNTING POLICIES - Continued
3.4 Provisions
Provisions for liabilities are recognised when the Board has a present legal or constructive obligation as a result of past
events, for which it is probable that an outflow of economic benefits will occur, and where a reliable estimate can be
made of the amount of the obligation.
3.5 Impairment of assets
At each reporting date, the Board reviews the carrying amounts of its assets to determine whether there is any indication
that those assets have suffered an impairment loss. If any such indication exists, the recoverable amount of the asset
is estimated in order to determine the extent of the impairment loss, if any. If the recoverable amount of an asset
is estimated to be less than its carrying amount, its carrying amount is reduced to its recoverable amount and the
impairment losses are recognised as an expense immediately.
If an impairment loss subsequently reverses, the carrying amount of the asset is increased to the revised estimate of its
recoverable amount but limited to the carrying amount that would have been determined had no impairment loss been
recognised in prior years. A reversal of an impairment loss is recognised in the statement of comprehensive income.
3.6 Cash and cash equivalents
Cash and cash equivalents are measured at fair value and comprise cash on hand, deposits held on call with banks and
investments in money market instruments, net of bank overdrafts and call loans. In the statement of financial position,
bank overdrafts are included in current liabilities. Interest-bearing bank overdrafts and other short-term borrowings are
recorded at the proceeds received, net of direct issue costs.
For the purpose of the statement of cash flows, the Board considers all bank balances and cash with a maturity of less
than one year and bank overdrafts to be cash and cash equivalents.
3.7 Financial instruments
Initial measurement
Financial assets and financial liabilities are recognised on the statement of financial position when the Board has
become a party to the contractual provisions of the instrument. Financial instruments carried on the statement of
financial position include bank and cash balances, trade and other receivables and trade and other payables.
Subsequent measurement
Fair values and the recognition methods of the different financial instruments are disclosed in the notes to the annual
financial statements. Fair value represents an approximation of the year end value, which may differ from the value that
will be finally realised.
De-recognition
Financial instruments are offset when the Board has a legally enforceable right to offset and intends to settle either on
a net basis or to realise the asset and settle the liability simultaneously.
Notes to the Annual Financial statements - ContinuedFor The Year Ended 31 March 2011
52.
3.8 Trade and other receivables
Trade receivables are measured at initial recognition at fair value, and are subsequently measured at amortised cost
using effective interest rate method. Appropriate allowances for estimated irrecoverable amounts are recognised in
the statement of comprehensive income when there is objective evidence that the asset is impaired. The allowance
recognised is measured as the difference between the asset’s carrying amount and the present value of estimated
future cash flows discounted at the effective interest rate computed at initial recognition.
3.9 Trade and other payables
Trade payables are initially measured at fair value, and are subsequently measured at amortised cost, using the effective
interest rate method.
3.10 Leasing
Leases are classified as finance leases whenever the terms of the lease transfer substantially all the rights and rewards
of ownership to the lessee. All other leases are classified as operating leases and rentals are charged against trading
profit as they become due.
The Board as a lessee
Assets held under finance lease are recognised as assets of the Board at fair value at the date of acquisition. The
corresponding liability to the lessor is included in the statement of financial position as a finance lease obligation.
Finance costs, which represent the difference between the total leasing commitments and the fair value of the assets
acquired, are charged to the statement of comprehensive income over the term of the relevant lease so as to produce
a constant periodic rate of interest on the remaining balance of the obligations for each period.
Rentals payable under operating leases are charged to income on a straight-line basis over the term of the relevant
lease.
3.11 Judgements by management
There were no material judgements made by management that could have a significant effect on the amounts
recognised in the financial statements.
3.12 Key sources of estimation uncertainty
There are no key assumptions concerning the future and other key sources of estimation uncertainty at the reporting
date that could have a significant risk of causing material adjustment to the carrying amounts of the assets and
liabilities within the next financial year.
3.13 Trust Funds-Ministry of Mines and Energy Project
The Board undertakes a project on behalf of the Ministry of Mines and Energy (MME). The funds received are
accounted for as monies held in trust and all expenditure incurred on this project are accounted for separately from
the Board’s transactions.
Notes to the Annual Financial Statements - ContinuedFor The Year Ended 31 March 2011
53.
F I N A N C I A L S
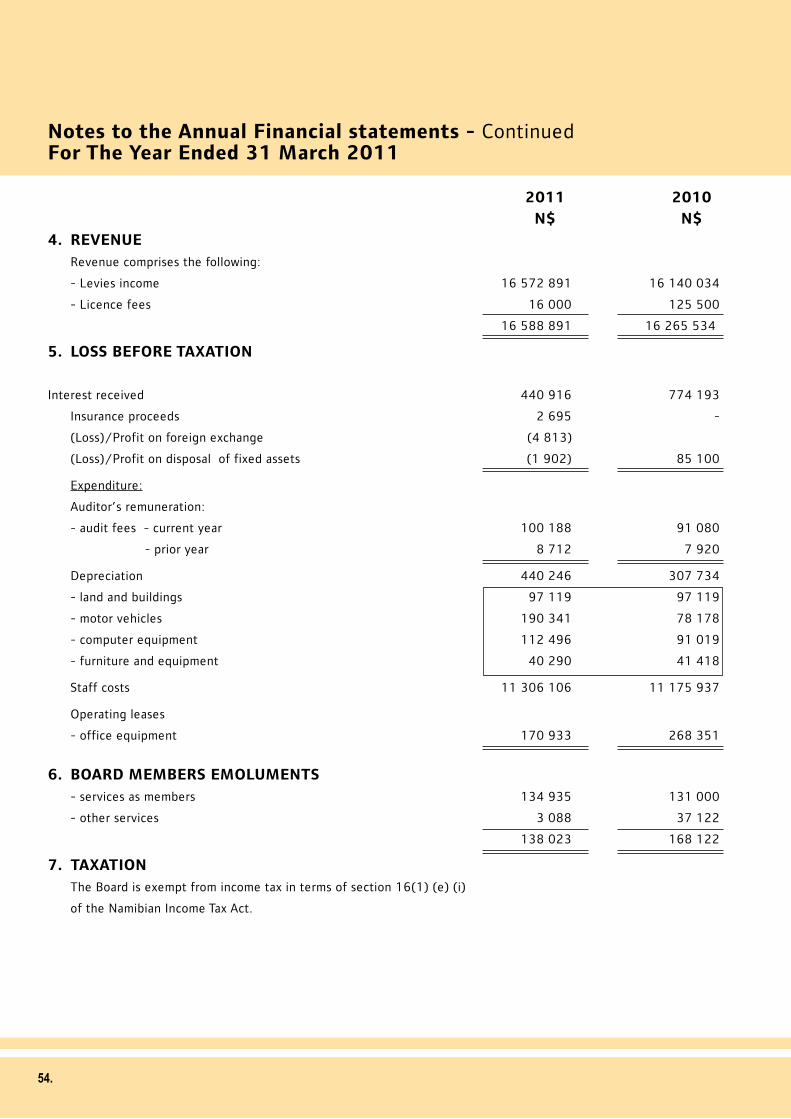
Notes to the Annual Financial statements - ContinuedFor The Year Ended 31 March 2011
2011 2010
N$ N$
4. REVENUE
Revenue comprises the following:
- Levies income 16 572 891 16 140 034
- Licence fees 16 000 125 500
16 588 891 16 265 534
5. LOSS BEFORE TAXATION
Interest received 440 916 774 193
Insurance proceeds 2 695 -
(Loss)/Profit on foreign exchange (4 813)
(Loss)/Profit on disposal of fixed assets (1 902) 85 100
Expenditure:
Auditor’s remuneration:
- audit fees - current year 100 188 91 080
- prior year 8 712 7 920
Depreciation 440 246 307 734
- land and buildings 97 119 97 119
- motor vehicles 190 341 78 178
- computer equipment 112 496 91 019
- furniture and equipment 40 290 41 418
Staff costs 11 306 106 11 175 937
Operating leases
- office equipment 170 933 268 351
6. BOARD MEMBERS EMOLUMENTS
- services as members 134 935 131 000
- other services 3 088 37 122
138 023 168 122
7. TAXATION
The Board is exempt from income tax in terms of section 16(1) (e) (i)
of the Namibian Income Tax Act.
54.
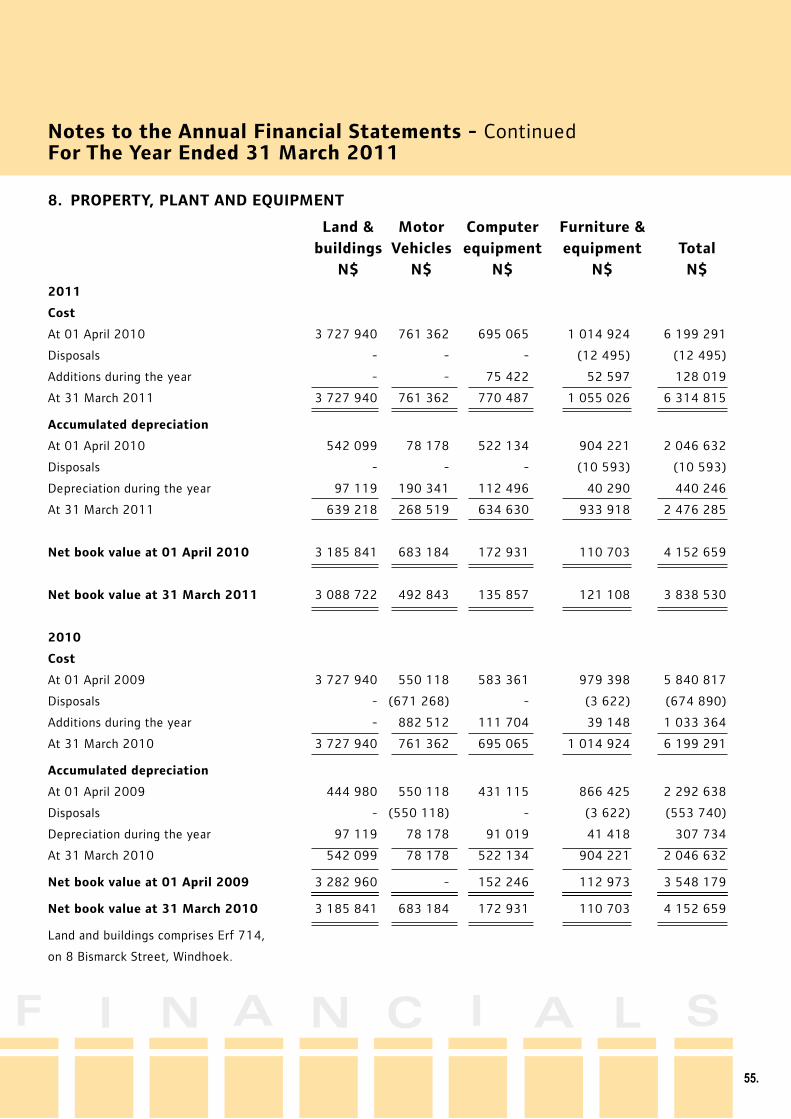
Notes to the Annual Financial Statements - ContinuedFor The Year Ended 31 March 2011
8. PROPERTY, PLANT AND EQUIPMENT
Land & Motor Computer Furniture &
buildings Vehicles equipment equipment Total
N$ N$ N$ N$ N$
2011
Cost
At 01 April 2010 3 727 940 761 362 695 065 1 014 924 6 199 291
Disposals - - - (12 495) (12 495)
Additions during the year - - 75 422 52 597 128 019
At 31 March 2011 3 727 940 761 362 770 487 1 055 026 6 314 815
Accumulated depreciation
At 01 April 2010 542 099 78 178 522 134 904 221 2 046 632
Disposals - - - (10 593) (10 593)
Depreciation during the year 97 119 190 341 112 496 40 290 440 246
At 31 March 2011 639 218 268 519 634 630 933 918 2 476 285
Net book value at 01 April 2010 3 185 841 683 184 172 931 110 703 4 152 659
Net book value at 31 March 2011 3 088 722 492 843 135 857 121 108 3 838 530
2010
Cost
At 01 April 2009 3 727 940 550 118 583 361 979 398 5 840 817
Disposals - (671 268) - (3 622) (674 890)
Additions during the year - 882 512 111 704 39 148 1 033 364
At 31 March 2010 3 727 940 761 362 695 065 1 014 924 6 199 291
Accumulated depreciation
At 01 April 2009 444 980 550 118 431 115 866 425 2 292 638
Disposals - (550 118) - (3 622) (553 740)
Depreciation during the year 97 119 78 178 91 019 41 418 307 734
At 31 March 2010 542 099 78 178 522 134 904 221 2 046 632
Net book value at 01 April 2009 3 282 960 - 152 246 112 973 3 548 179
Net book value at 31 March 2010 3 185 841 683 184 172 931 110 703 4 152 659
Land and buildings comprises Erf 714,
on 8 Bismarck Street, Windhoek.
55.
F I N A N C I A L S
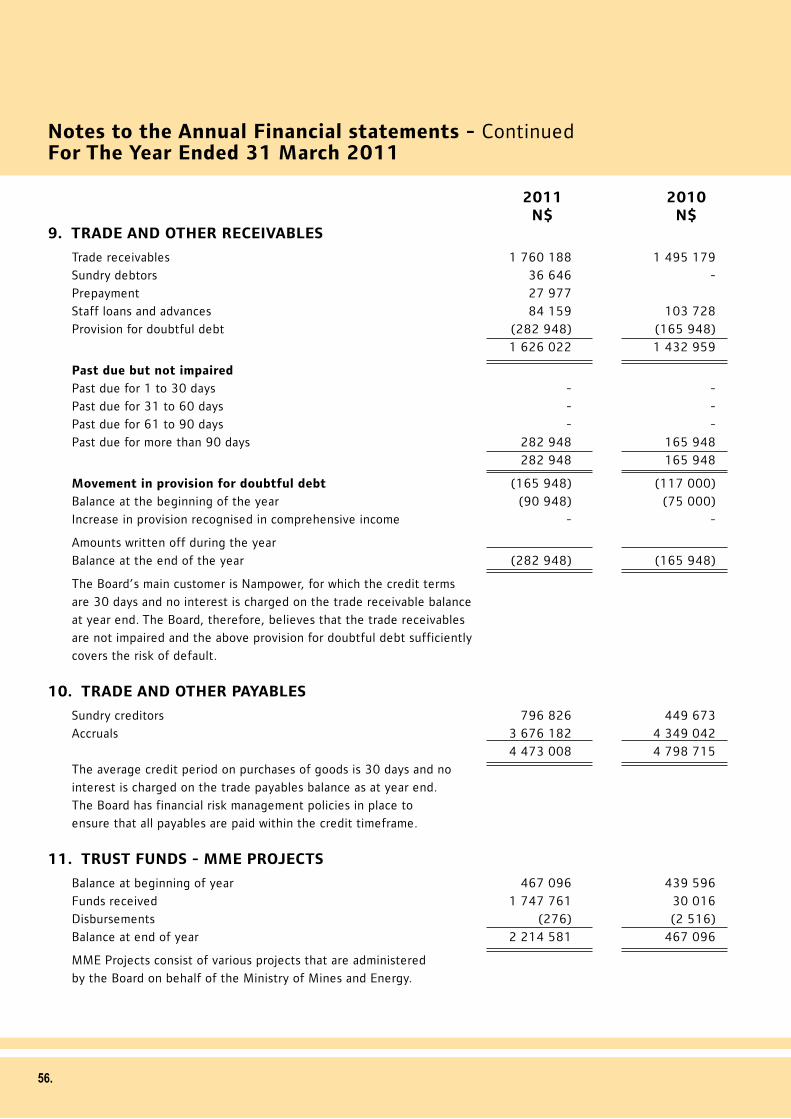
Notes to the Annual Financial statements - ContinuedFor The Year Ended 31 March 2011
2011 2010 N$ N$9. TRADE AND OTHER RECEIVABLES
Trade receivables 1 760 188 1 495 179
Sundry debtors 36 646 -
Prepayment 27 977
Staff loans and advances 84 159 103 728
Provision for doubtful debt (282 948) (165 948)
1 626 022 1 432 959
Past due but not impaired
Past due for 1 to 30 days - -
Past due for 31 to 60 days - -
Past due for 61 to 90 days - -
Past due for more than 90 days 282 948 165 948
282 948 165 948
Movement in provision for doubtful debt (165 948) (117 000)
Balance at the beginning of the year (90 948) (75 000)
Increase in provision recognised in comprehensive income - -
Amounts written off during the year
Balance at the end of the year (282 948) (165 948)
The Board’s main customer is Nampower, for which the credit terms
are 30 days and no interest is charged on the trade receivable balance
at year end. The Board, therefore, believes that the trade receivables
are not impaired and the above provision for doubtful debt sufficiently
covers the risk of default.
10. TRADE AND OTHER PAYABLES
Sundry creditors 796 826 449 673
Accruals 3 676 182 4 349 042
4 473 008 4 798 715
The average credit period on purchases of goods is 30 days and no
interest is charged on the trade payables balance as at year end.
The Board has financial risk management policies in place to
ensure that all payables are paid within the credit timeframe.
11. TRUST FUNDS - MME PROJECTS
Balance at beginning of year 467 096 439 596
Funds received 1 747 761 30 016
Disbursements (276) (2 516)
Balance at end of year 2 214 581 467 096
MME Projects consist of various projects that are administered
by the Board on behalf of the Ministry of Mines and Energy.
56.

57.
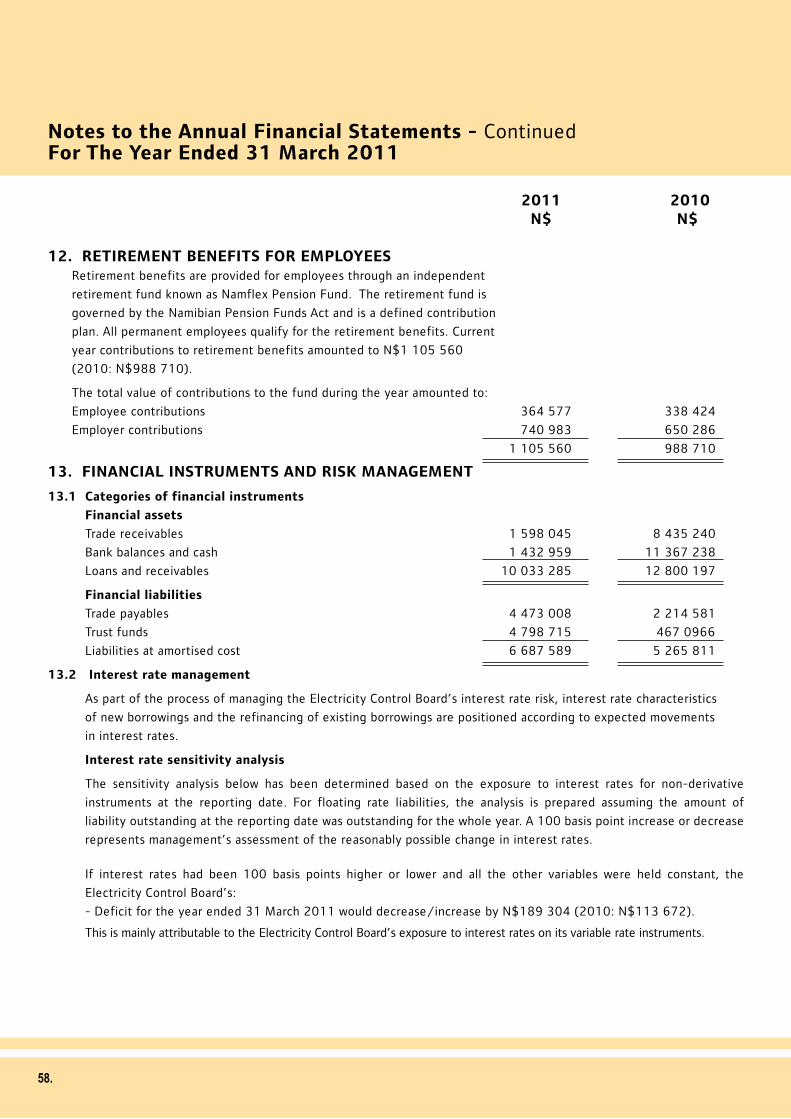
Notes to the Annual Financial Statements - ContinuedFor The Year Ended 31 March 2011
2011 2010 N$ N$ 12. RETIREMENT BENEFITS FOR EMPLOYEES
Retirement benefits are provided for employees through an independent
retirement fund known as Namflex Pension Fund. The retirement fund is
governed by the Namibian Pension Funds Act and is a defined contribution
plan. All permanent employees qualify for the retirement benefits. Current
year contributions to retirement benefits amounted to N$1 105 560
(2010: N$988 710).
The total value of contributions to the fund during the year amounted to:
Employee contributions 364 577 338 424
Employer contributions 740 983 650 286
1 105 560 988 710
13. FINANCIAL INSTRUMENTS AND RISK MANAGEMENT
13.1 Categories of financial instruments
Financial assets
Trade receivables 1 598 045 8 435 240
Bank balances and cash 1 432 959 11 367 238
Loans and receivables 10 033 285 12 800 197
Financial liabilities
Trade payables 4 473 008 2 214 581
Trust funds 4 798 715 467 0966
Liabilities at amortised cost 6 687 589 5 265 811
13.2 Interest rate management
As part of the process of managing the Electricity Control Board’s interest rate risk, interest rate characteristics
of new borrowings and the refinancing of existing borrowings are positioned according to expected movements
in interest rates.
Interest rate sensitivity analysis
The sensitivity analysis below has been determined based on the exposure to interest rates for non-derivative
instruments at the reporting date. For floating rate liabilities, the analysis is prepared assuming the amount of
liability outstanding at the reporting date was outstanding for the whole year. A 100 basis point increase or decrease
represents management’s assessment of the reasonably possible change in interest rates.
If interest rates had been 100 basis points higher or lower and all the other variables were held constant, the
Electricity Control Board’s:
- Deficit for the year ended 31 March 2011 would decrease/increase by N$189 304 (2010: N$113 672).
This is mainly attributable to the Electricity Control Board’s exposure to interest rates on its variable rate instruments.
58.
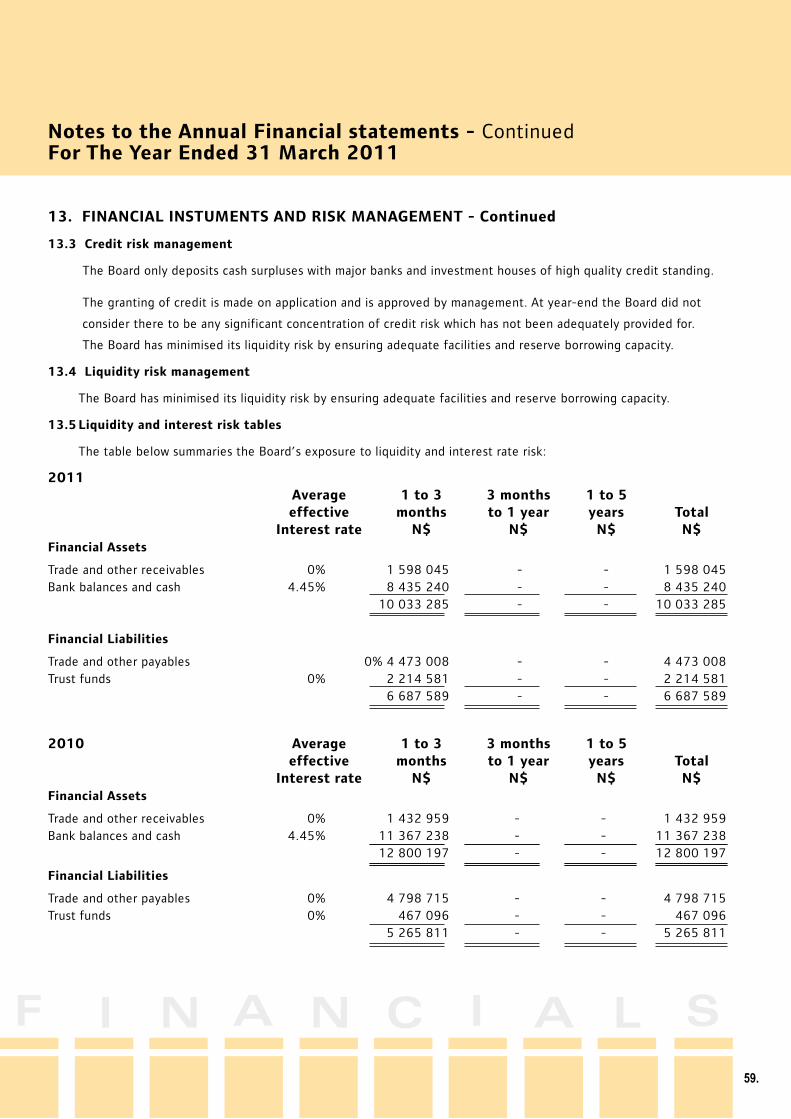
Notes to the Annual Financial statements - ContinuedFor The Year Ended 31 March 2011
13. FINANCIAL INSTUMENTS AND RISK MANAGEMENT - Continued
13.3 Credit risk management
The Board only deposits cash surpluses with major banks and investment houses of high quality credit standing.
The granting of credit is made on application and is approved by management. At year-end the Board did not
consider there to be any significant concentration of credit risk which has not been adequately provided for.
The Board has minimised its liquidity risk by ensuring adequate facilities and reserve borrowing capacity.
13.4 Liquidity risk management
The Board has minimised its liquidity risk by ensuring adequate facilities and reserve borrowing capacity.
13.5 Liquidity and interest risk tables
The table below summaries the Board’s exposure to liquidity and interest rate risk:
2011 Average 1 to 3 3 months 1 to 5 effective months to 1 year years Total Interest rate N$ N$ N$ N$Financial Assets
Trade and other receivables 0% 1 598 045 - - 1 598 045Bank balances and cash 4.45% 8 435 240 - - 8 435 240 10 033 285 - - 10 033 285 Financial Liabilities
Trade and other payables 0% 4 473 008 - - 4 473 008Trust funds 0% 2 214 581 - - 2 214 581 6 687 589 - - 6 687 589
2010 Average 1 to 3 3 months 1 to 5 effective months to 1 year years Total Interest rate N$ N$ N$ N$Financial Assets
Trade and other receivables 0% 1 432 959 - - 1 432 959Bank balances and cash 4.45% 11 367 238 - - 11 367 238 12 800 197 - - 12 800 197
Financial Liabilities
Trade and other payables 0% 4 798 715 - - 4 798 715Trust funds 0% 467 096 - - 467 096 5 265 811 - - 5 265 811
59.
F I N A N C I A L S
60.
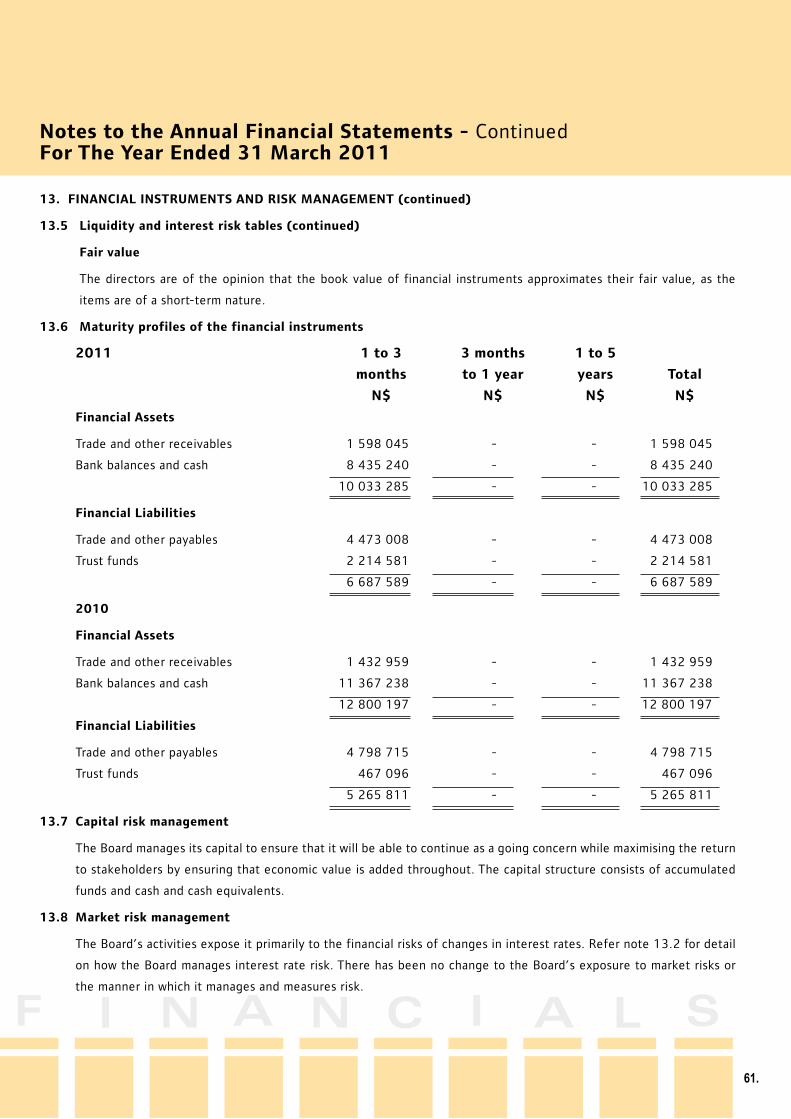
Notes to the Annual Financial Statements - ContinuedFor The Year Ended 31 March 2011
13. FINANCIAL INSTRUMENTS AND RISK MANAGEMENT (continued)
13.5 Liquidity and interest risk tables (continued)
Fair value
The directors are of the opinion that the book value of financial instruments approximates their fair value, as the
items are of a short-term nature.
13.6 Maturity profiles of the financial instruments
2011 1 to 3 3 months 1 to 5
months to 1 year years Total
N$ N$ N$ N$
Financial Assets
Trade and other receivables 1 598 045 - - 1 598 045
Bank balances and cash 8 435 240 - - 8 435 240
10 033 285 - - 10 033 285
Financial Liabilities
Trade and other payables 4 473 008 - - 4 473 008
Trust funds 2 214 581 - - 2 214 581
6 687 589 - - 6 687 589
2010
Financial Assets
Trade and other receivables 1 432 959 - - 1 432 959
Bank balances and cash 11 367 238 - - 11 367 238
12 800 197 - - 12 800 197
Financial Liabilities
Trade and other payables 4 798 715 - - 4 798 715
Trust funds 467 096 - - 467 096
5 265 811 - - 5 265 811
13.7 Capital risk management
The Board manages its capital to ensure that it will be able to continue as a going concern while maximising the return
to stakeholders by ensuring that economic value is added throughout. The capital structure consists of accumulated
funds and cash and cash equivalents.
13.8 Market risk management
The Board’s activities expose it primarily to the financial risks of changes in interest rates. Refer note 13.2 for detail
on how the Board manages interest rate risk. There has been no change to the Board’s exposure to market risks or
the manner in which it manages and measures risk.
61.
F I N A N C I A L S
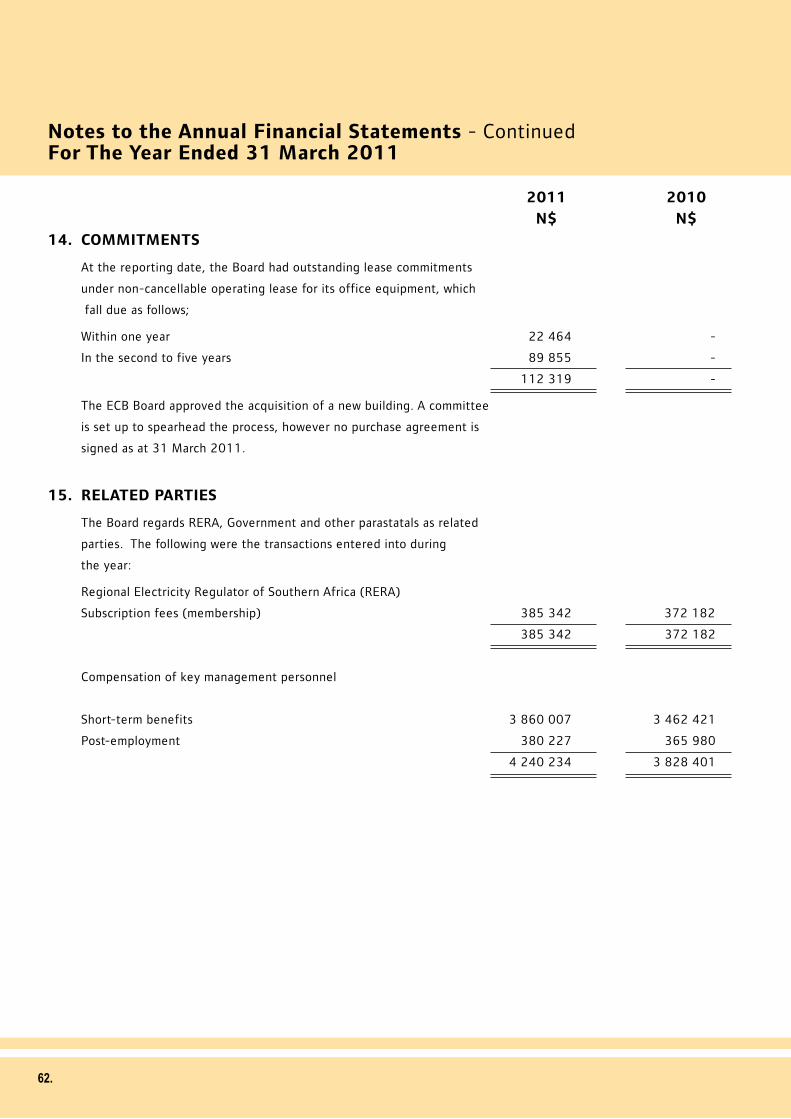
Notes to the Annual Financial Statements - ContinuedFor The Year Ended 31 March 2011
2011 2010
N$ N$
14. COMMITMENTS
At the reporting date, the Board had outstanding lease commitments
under non-cancellable operating lease for its office equipment, which
fall due as follows;
Within one year 22 464 -
In the second to five years 89 855 -
112 319 -
The ECB Board approved the acquisition of a new building. A committee
is set up to spearhead the process, however no purchase agreement is
signed as at 31 March 2011.
15. RELATED PARTIES
The Board regards RERA, Government and other parastatals as related
parties. The following were the transactions entered into during
the year:
Regional Electricity Regulator of Southern Africa (RERA)
Subscription fees (membership) 385 342 372 182
385 342 372 182
Compensation of key management personnel
Short-term benefits 3 860 007 3 462 421
Post-employment 380 227 365 980
4 240 234 3 828 401
62.
63.
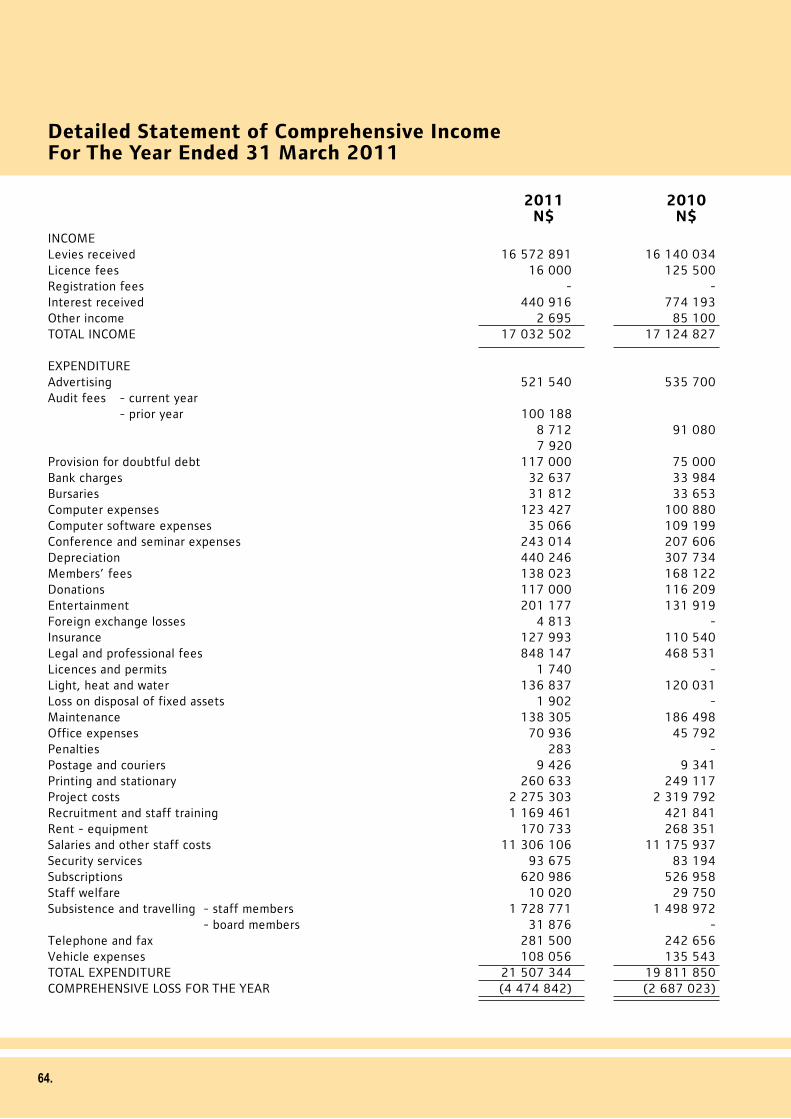
Detailed Statement of Comprehensive IncomeFor The Year Ended 31 March 2011
2011 2010 N$ N$ INCOME Levies received 16 572 891 16 140 034Licence fees 16 000 125 500Registration fees - -Interest received 440 916 774 193Other income 2 695 85 100TOTAL INCOME 17 032 502 17 124 827 EXPENDITURE Advertising 521 540 535 700Audit fees - current year - prior year 100 188 8 712 91 080 7 920Provision for doubtful debt 117 000 75 000Bank charges 32 637 33 984Bursaries 31 812 33 653Computer expenses 123 427 100 880Computer software expenses 35 066 109 199Conference and seminar expenses 243 014 207 606Depreciation 440 246 307 734Members’ fees 138 023 168 122Donations 117 000 116 209Entertainment 201 177 131 919Foreign exchange losses 4 813 -Insurance 127 993 110 540Legal and professional fees 848 147 468 531Licences and permits 1 740 -Light, heat and water 136 837 120 031Loss on disposal of fixed assets 1 902 -Maintenance 138 305 186 498Office expenses 70 936 45 792Penalties 283 -Postage and couriers 9 426 9 341Printing and stationary 260 633 249 117Project costs 2 275 303 2 319 792Recruitment and staff training 1 169 461 421 841Rent - equipment 170 733 268 351Salaries and other staff costs 11 306 106 11 175 937Security services 93 675 83 194Subscriptions 620 986 526 958Staff welfare 10 020 29 750Subsistence and travelling - staff members 1 728 771 1 498 972 - board members 31 876 -Telephone and fax 281 500 242 656Vehicle expenses 108 056 135 543TOTAL EXPENDITURE 21 507 344 19 811 850COMPREHENSIVE LOSS FOR THE YEAR (4 474 842) (2 687 023)
64.
F I N A N C I A L S

8 Bismarck StreetPO Box 2923
Windhoek, NamibiaTel (+264 61) 374 306Fax (+264 61) 374 305
www.ecb.org.na
Contact Details