Embed Size (px)
Citation preview
Metzger et a.l 2004 – A multidisciplinary multi-scale framwork for assessing vulnerability to global change 1
Millennium Ecosystem Assessment conference: Bridging Scales and Epistemologies -- 17-20 March 2004, Alexandria, Egypt. Session 6.2: Multi-Scale Assessments: Advances, Insights, and Remaining Challenges
A multidisciplinary multi-scale framework for assessing vulnerability to global change
MARC J. METZGER* ( ), RIK LEEMANS** & DAGMAR SCHRÖTER***
*Plant Production Systems
Wageningen University
Haarweg 333
6709 RZ Wageningen
The Netherlands
**Environmental Systems Analysis
Wageningen University
P.O. Box 47
6700 RZ Wageningen
The Netherlands
***Department of Global Change & Natural Systems
Potsdam Institute for Climate Impact Research
P.O. Box 60 12 03
D-14412 Potsdam
Germany
Contact details corresponding author ( ): E-mail: [email protected] Tel: +31 317 483251 Fax: +31 317 484892

Metzger et a.l 2004 – A multidisciplinary multi-scale framwork for assessing vulnerability to global change 2
Abstract
Terrestrial ecosystems provide a number of vital services for people and society, e.g. biodiversity, food, fibre, water resources, carbon sequestration, and recreation. The future capability of ecosystems to provide these services is determined by changes in socio-economic characteristics, land use, biodiversity, atmospheric composition and climate. Most published impact assessments do not address the vulnerability of ecosystems and ecosystem services under such environmental change. They cannot answer important multidisciplinary questions such as: which are the main regions or sectors that are vulnerable to global change? How do the vulnerabilities of two regions compare? Which scenario is the least harmful for a sector? This paper describes how the project ATEAM (Advanced Terrestrial Ecosystem Analysis and Modelling) uses a new approach to ecosystem assessment. Within ATEAM a full suite of ecosystem models, covering biodiversity, agriculture, forestry, hydrology, and carbon sequestration are fed with the same input data and are run with the same consistent SRES-based scenarios. Each model gives insights into specific ecosystems, as in traditional impact assessments. Moreover, by integrating the results in a Vulnerability Assessment, multidisciplinary questions, such as those listed above, can be answered as well. A statistically derived European environmental stratification forms a key element of the Vulnerability Assessment. By linking it to other quantitative environmental stratifications, comparisons can be made using data from different assessments and scales. The paper presents first results of ATEAM’s Vulnerability Assessment, and illustrates how the multidisciplinary vulnerability framework can be used at different scales.
Metzger et a.l 2004 – A multidisciplinary multi-scale framwork for assessing vulnerability to global change 3
Introduction
Even if human society is successful in entering a sustainable development pathway, significant global changes will occur within the next decades. The atmospheric carbon dioxide concentration will at least double compared to pre industrial concentrations, while the global average surface temperature is projected to increase by 1.4-5.8°C (IPCC 2001c). Land use changes will have an immediate and strong effect on agriculture, forestry, rural communities, biodiversity and amenities such as traditional landscapes (UNEP 2002; Watson et al. 2000). Furthermore, an increasing number of people, with increasing consumption of food and energy per capita have boosted the emission of nitrogen to the atmosphere, resulting in eutrophication of environments via atmospheric nitrogen deposition (Galloway 2001, Alcamo 2002). Over the last decades the world has become increasingly aware of these global changes, resulting in much research and many impact assessments at all scales levels and across many disciplines. However, integrating this wealth of research across scales and disciplines has remained a problem (Millennium Ecosystem Assessment, 2003). This paper first summarises a concept developed to assess where in Europe people may be vulnerable to the loss of particular ecosystem services, associated with the combined effects of climate change, land use change, and atmospheric pollution. Subsequently the paper will illustrate how this vulnerability framework can also be applied at different scales and how the vulnerability of ecosystem services can be compared across scales. The concepts described in this paper were developed for the ATEAM project (Advanced Terrestrial Ecosystem Analysis and Modelling, http://www.pik-potsdam.de/ateam). Metzger and Schröter have recently submitted a detailed description of the vulnerability concept to Regional Environmental Change. Ecosystem services form a vital link between ecosystems and society by providing food and timber, clean water, aesthetic value and other necessities. Impacts of global changes on ecosystems have already been observed (see reviews by Smith et al. 1999, Sala et al. 2000, Stenseth et al. 2002, Walther et al. 2002, Parmesan and Yohe 2003, Root et al. 2003). Such impacts are of direct importance to human society, because ecosystems and the organisms that make them up provide services that sustain and fulfil human life (Daily 1997). Therefore, in addition to immediate global change effects on humans (e.g. environmental hazards), an important part of our vulnerability to global change is due to impacts on ecosystems and the services they provide. The Millennium Ecosystem Assessment focuses specifically on ecosystem services and their link to human well-being (Millennium Ecosystem Assessment, 2003). In the vulnerability concept reported here, the supply of ecosystem services is used as a measure of human well-being under the influence of global change stressors, similar to the approach suggested by Luers et al. (2003). The Synthesis chapter of the Intergovernmental Panel on Climate Change (IPCC) Third Assessment Report (TAR) Working Group III recognized the limitations of static impact assessments and put forward the challenge to move to dynamic assessments that are a function of shifting climatic parameters, trends such as economic and population growth, and the ability to innovate and adapt to changes (IPCC, 2001a). A step towards meeting this challenge is the emergence of a common definition of the term “vulnerability”: Vulnerability is the degree to which a system is susceptible to, or unable to cope with, adverse effects of climate change, including climate variability and extremes (IPCC TAR).

Metzger et a.l 2004 – A multidisciplinary multi-scale framwork for assessing vulnerability to global change 4
The vulnerability concept explained in this paper is based on this definition and was developed to integrate results from a broad range of different, spatially explicit models. Projections of changing ecosystem service supply and changing adaptive capacity are integrated into spatially explicit maps of vulnerability for different human sectors. Such vulnerability maps provide a means for making comparisons between ecosystem services, sectors, scenarios and regions to tackle multidisciplinary questions such as:
• Which regions are most vulnerable to global change? • How do the vulnerabilities of two regions compare? • Which sectors are the most vulnerable in a certain region? • Which scenario is the least harmful for a sector?
The term vulnerability was defined in such a way that it includes both the traditional elements of an impact assessment (i.e. sensitivities of a system to exposures), and adaptive capacity to cope with potential impacts of global change (Polsky et al. 2003, Turner et al. 2003). The following sections first summarise the concepts of the spatially explicit and quantitative framework that was developed for a vulnerability assessment for Europe, explaining the different tools used to quantify the elements of vulnerability, and how we integrate these elements into maps of vulnerability. Then it will illustrated how the vulnerability framework can be used to compare information from the global impact model IMAGE (IMAGE team 2001) with the European results from ATEAM.
A multidisciplinary vulnerability framework
The IPCC definitions of vulnerability to climate change, and related terms such as exposure, sensitivity, and adaptive capacity, form a suitable starting position to explore possibilities for quantification. However, because vulnerability assessments consider not only climate change, but also other global changes such as land use change (Turner et al. 2003), the IPCC definitions were in some cases adjusted. Table 1 lists the definitions of some fundamental terms used in this paper and gives two examples of how these terms could relate to the agriculture sector. From these definitions the following generic functions are constructed, describing the vulnerability of a sector relying on a particular ecosystem service in an area under a certain scenario at a certain point in time. Vulnerability is a function of exposure, sensitivity and adaptive capacity (equation 1). Potential impacts are a function of exposure and sensitivity (equation 2). Therefore, vulnerability is a function of potential impacts and adaptive capacity (equation 3):
V(es, x, s, t) = ƒ( E(es, x, s, t), S(es, x, s, t), AC(es, x, s, t) ) (1)
PI(es, x, s, t) = ƒ( E(es, x, s, t),S(es, x, s, t) ) (2)
V(es, x, s, t) = ƒ( PI(es, x, s, t), AC(es, x, s, t) ) (3)
where V = vulnerability, E = exposure, S = sensitivity, AC = adaptive capacity and PI = potential impact, es =
ecosystem service, x = a grid cell, s = a scenario, t = a time slice
Metzger et a.l 2004 – A multidisciplinary multi-scale framwork for assessing vulnerability to global change 5
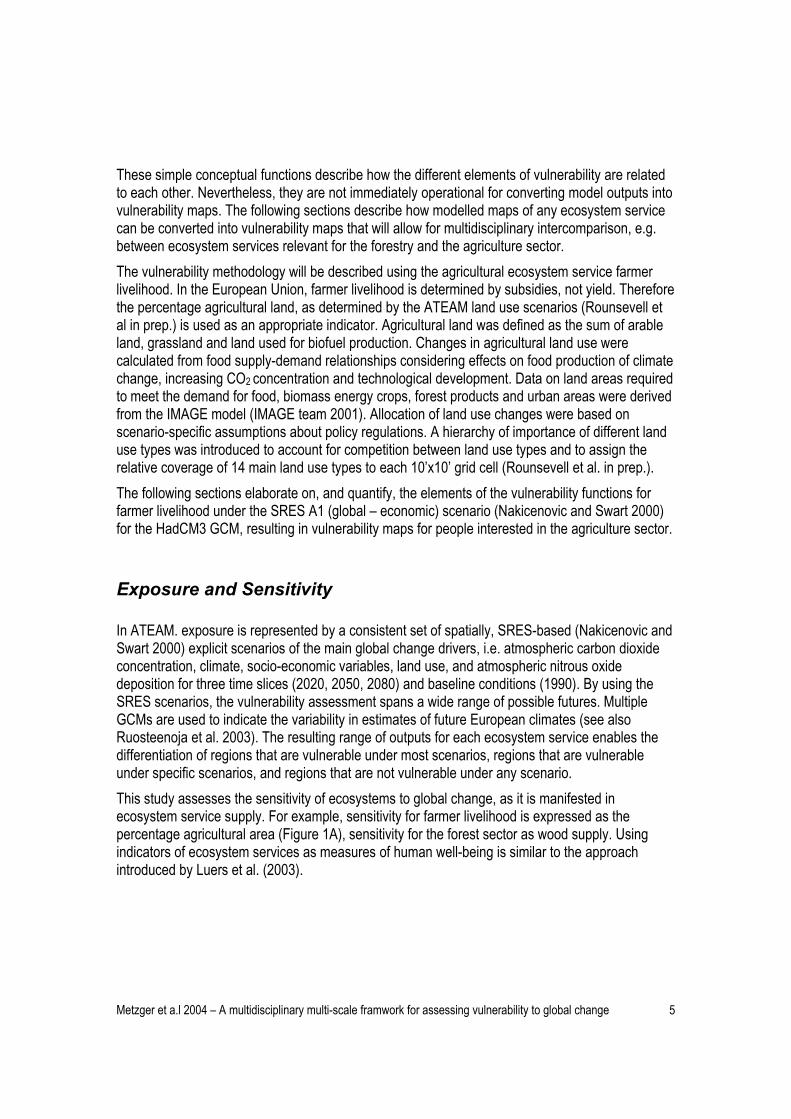
These simple conceptual functions describe how the different elements of vulnerability are related to each other. Nevertheless, they are not immediately operational for converting model outputs into vulnerability maps. The following sections describe how modelled maps of any ecosystem service can be converted into vulnerability maps that will allow for multidisciplinary intercomparison, e.g. between ecosystem services relevant for the forestry and the agriculture sector. The vulnerability methodology will be described using the agricultural ecosystem service farmer livelihood. In the European Union, farmer livelihood is determined by subsidies, not yield. Therefore the percentage agricultural land, as determined by the ATEAM land use scenarios (Rounsevell et al in prep.) is used as an appropriate indicator. Agricultural land was defined as the sum of arable land, grassland and land used for biofuel production. Changes in agricultural land use were calculated from food supply-demand relationships considering effects on food production of climate change, increasing CO2 concentration and technological development. Data on land areas required to meet the demand for food, biomass energy crops, forest products and urban areas were derived from the IMAGE model (IMAGE team 2001). Allocation of land use changes were based on scenario-specific assumptions about policy regulations. A hierarchy of importance of different land use types was introduced to account for competition between land use types and to assign the relative coverage of 14 main land use types to each 10’x10’ grid cell (Rounsevell et al. in prep.). The following sections elaborate on, and quantify, the elements of the vulnerability functions for farmer livelihood under the SRES A1 (global – economic) scenario (Nakicenovic and Swart 2000) for the HadCM3 GCM, resulting in vulnerability maps for people interested in the agriculture sector.
Exposure and Sensitivity
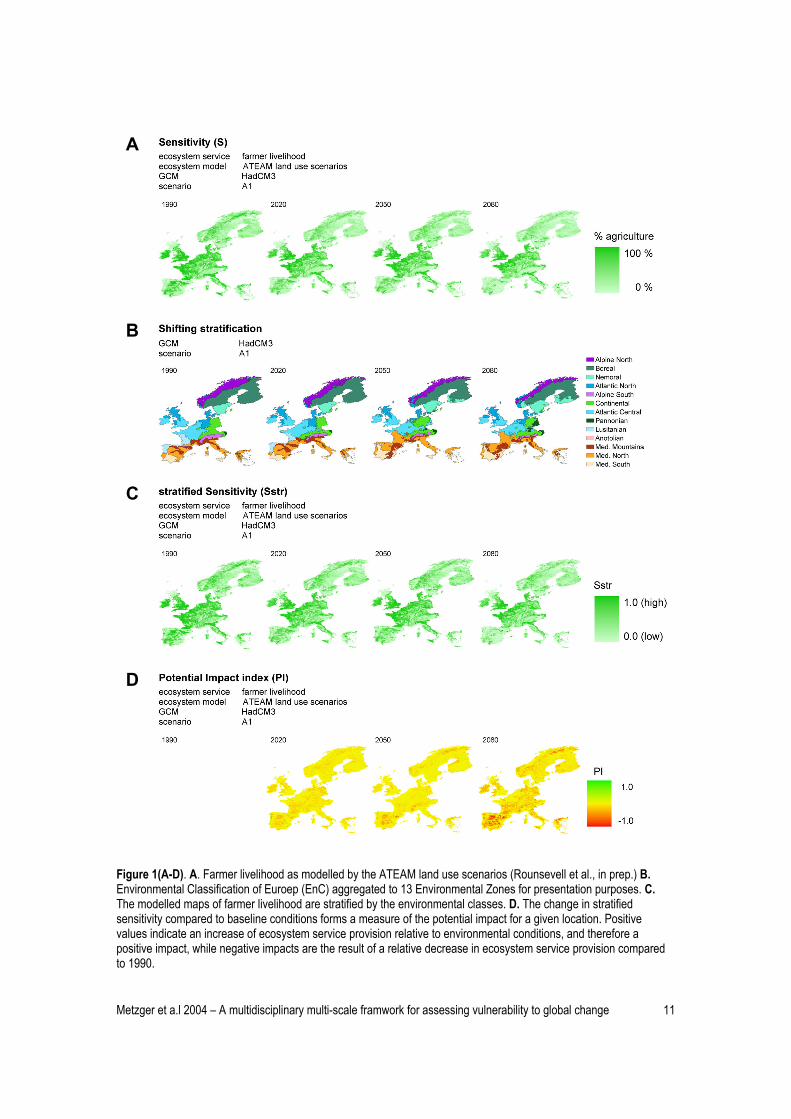
In ATEAM. exposure is represented by a consistent set of spatially, SRES-based (Nakicenovic and Swart 2000) explicit scenarios of the main global change drivers, i.e. atmospheric carbon dioxide concentration, climate, socio-economic variables, land use, and atmospheric nitrous oxide deposition for three time slices (2020, 2050, 2080) and baseline conditions (1990). By using the SRES scenarios, the vulnerability assessment spans a wide range of possible futures. Multiple GCMs are used to indicate the variability in estimates of future European climates (see also Ruosteenoja et al. 2003). The resulting range of outputs for each ecosystem service enables the differentiation of regions that are vulnerable under most scenarios, regions that are vulnerable under specific scenarios, and regions that are not vulnerable under any scenario. This study assesses the sensitivity of ecosystems to global change, as it is manifested in ecosystem service supply. For example, sensitivity for farmer livelihood is expressed as the percentage agricultural area (Figure 1A), sensitivity for the forest sector as wood supply. Using indicators of ecosystem services as measures of human well-being is similar to the approach introduced by Luers et al. (2003).

Metzger et a.l 2004 – A multidisciplinary multi-scale framwork for assessing vulnerability to global change 6
Table 1. Definitions of important terminology related to vulnerability, with an example for the agriculture sector. IPCC TAR = Intergovernmental Panel on Climate Change Third Assessment Report (IPCC 2001a-c).
Term ATEAM definitions based on IPCC TAR
Part of the assessment
Agriculture example
Exposure (E) The nature and degree to which ecosystems are exposed to environmental change. Scenarios
Increased climatic stress, decreases in
demand
Sensitivity (S) The degree to which a human-environment system is affected, either adversely or beneficially, by environmental change.
Changes agricultural communities and
landscapes
Adaptation (A) Adjustment in natural or human systems to a new or changing environment.
Ecosystem
Models Changes in local
management, change crop
Potential Impact (PI)
All impacts that may occur given projected environmental change, without considering planned adaptation.
Decrease agricultural land
Adaptive Capacity (AC) The potential to implement planned
adaptation measures. Potential for high quality
safe products
Vulnerability (V) The degree to which an ecosystem service is sensitive to global change plus the degree to which the sector that relies on this service is unable to adapt to the changes.
Vulnerability
Assessment
?
Planned Adaptation (PA)
The result of a deliberate policy decision based on an awareness that conditions have changed or are about to change and that action is required to return to, maintain or achieve a desired state.
Residual Impact (RI) The impacts of global change that would
occur after considering planned adaptation.
The future will tell.

Metzger et a.l 2004 – A multidisciplinary multi-scale framwork for assessing vulnerability to global change 7
Stratified sensitivity and the potential impact index
Our estimation of potential impacts is undertaken at the regional scale, emphasising the differences across the European environment. Simply comparing changes in ecosystem services across Europe provides only a limited analysis of regional differences because ecosystem services are highly correlated with their environments. Some environments have high values for particular ecosystem services whereas other regions have lower values. For instance, Spain has high biodiversity (5048 vascular plant species (WCMC 1992)), but low grain yields (2.7 t ha-1 for 1998-2000 average (Ekboir, 2002)), whereas The Netherlands has a far lower biodiversity (1477 vascular plant species (van der Meijden et al. 1996)), but a very high grain yield (8.1 t ha-1 for 1998-2000 average (Ekboir 2002)). Therefore, while providing useful information about the stock of resources at a European scale, absolute differences in species numbers or yield levels are not good measures for comparing regional impacts between these countries. A relative change would overcome this problem (e.g. -40% grain yield in Spain versus + 8% in The Netherlands), but also has a serious limitation: the same relative change can occur in very different situations. Table 2 illustrates how a relative change of –20% can represent very different impacts, both between and within environments. Therefore comparisons of relative changes in single grid cells must be interpreted with great care and cannot easily be compared. For a meaningful comparison of grid cells across Europe it is necessary to place sensitivities in their regional environmental context, i.e. in a justified cluster of environmental conditions that is suited as a reference for the values in an individual grid cell. Because environments will alter under global change, consistent environmental strata must be determined for each time slice. We used the recently developed Environmental Classification of Europe (EnC) to stratify the modelled sensitivities (Metzger et al. 2003; Metzger et al. submitted to Global Ecology and Biogeography). The EnC was created by statistical clustering of selected climate and topographical variables into 84 classes. For each class a discriminant function was calculated for the variables available from the climate change scenarios. With these functions the 84 climate classes were mapped for the different GCMs, scenarios and time slices, resulting in 48 maps of shifted climate classes. Maps of the EnC, for baseline and the HadCM3-A1 scenario are mapped in Figure 1B for 13 aggregated Environmental Zones. With these maps, all modelled ecosystem sensitivities can be placed in their environmental context consistently. Within an environmental class ecosystem service values can be expressed relative to a reference value. The reference value used in this assessment is the highest ecosystem service value achieved in an environmental class. For a grid cell in a given EnC class, the fraction of the modelled sensitivity relative to the highest achieved ecosystem service value in the region (Sref) is calculated, giving a stratified value with a 0–1 range for ecosystem service sensitivity in the grid cell:
Sstr(es, x, s, t) = S(es, x, s, t) / Sref(es, enc, x, s, t) (4)
where Sstr = stratified sensitivity, S = sensitivity and Sref = highest achieved ecosystem service value, es = ecosystem service, x = a grid cell, s = a scenario, t = a time slice and enc = an environmental class

Metzger et a.l 2004 – A multidisciplinary multi-scale framwork for assessing vulnerability to global change 8
Table 2. Example of changing ecosystem service supply in four grid cells and two different environments between two time slices (t and t+1). Both absolute and relative changes in ecosystem service supply do not form a good basis for analysing regional potential impacts (see text). When changes are stratified by their environment, comparable potential impacts can be determined (i.e. grid cell A and D).
environment 1 environment 2
grid cell A grid cell B grid cell C grid cell D
t t+1 t t+1 t t+1 t t+1
Value in grid cell 3.0 2.4 1.0 0.8 8.0 6.4 5.0 4.0
Absolute change 0.6 0.2 1.6 1.0
Relative change -20 % -20 % -20 % -20 %
Highest ecosystem service value (Sref)
3.0 2.7 3.0 2.7 8.0 8.8 8.0 8.8
Stratified sensitivity 1.0 0.9 0.3 0.3 1.0 0.7 0.6 0.5
Potential Impact (PI) -0.1 0 -0.3 -0.1
In this way a map is created in which ecosystem services are stratified by their environment and expressed relative to a reference value (Figure 1C). Because the environment changes over time, both the reference value and the environmental classification is determined for each time slice. As shown in Figure 1C, the stratified sensitivity map shows more regional detail than the original sensitivity map. This is the regional detail required to compare potential impacts across regions (see also Table 2). In addition to comparing regions, the change of stratified sensitivity over time can be seen by looking at three time slices through the 21st century, 2020, 2050 and 2080 as well as the 1990 baseline. The change in stratified sensitivities compared to baseline conditions shows how changes in ecosystem services affect a given location. This can be seen as a quantification of the potential impact of the changed ecosystem service provision for the grid cell (see also Table 2). Regions where ecosystem service supply relative to the environment increases have a positive potential impact and vice versa (see Figure 1D). The potential impact index then is:
PI(es, x, s, t) = ∆ Sstr(es, x, s, t) (5)
where PI = potential impact, Sstr = stratified sensitivity, es = ecosystem service, x = a grid cell, s = a scenario, t = a time slice
Adaptive capacity index
To capture society’s ability to implement planned adaptation measures, the ATEAM project developed a generic index of macro-scale adaptive capacity. This index is based on a conceptual framework of socio-economic indicators, determinants and components of adaptive capacity, e.g. GDP per capita, female activity rate, income inequality, number of patents, and age dependency ratio (Schröter et al. 2003). The approach will be described in detail in Klein et al. 2004 (in preparation to be submitted to Global Environmental Change Part A: Human and Policy Dimensions). Adaptation in general is understood as an adjustment in natural or human systems in response to actual or expected environmental change, which moderates harm or exploits beneficial opportunities. Here, adaptive capacity reflects the potential to implement planned adaptation
Metzger et a.l 2004 – A multidisciplinary multi-scale framwork for assessing vulnerability to global change 9
measures and is therefore concerned with deliberate human attempts to adapt to or cope with change, and not with autonomous adaptation. The concept of adaptive capacity was introduced in the IPCC TAR (IPCC 2001a). According to the IPCC TAR, factors that determine adaptive capacity to climate change include economic wealth, technology and infrastructure, information, knowledge and skills, institutions, equity and social capital. So far, only one paper has made an attempt at quantifying adaptive capacity based on observations of past hazard events (Yohe and Tol 2002). For the vulnerability assessment framework, present-day and future estimates of adaptive capacity were sought that would be quantitative, spatially explicit, and based on, as well as consistent with, the exposure scenarios described above. The index of adaptive capacity developed to meet these needs is an index of the macro-scale outer boundaries of the capacity of a region (i.e. provinces and counties) to cope with changes. The index does not include individual abilities to adapt. An illustrative example of our spatially explicit generic adaptive capacity index over time is shown in Figure 1E, for a particular scenario (A1). Different regions in Europe show different macro-scale adaptive capacity – under this scenario, lowest adaptive capacity is expected in the Mediterranean and improves over time.
Vulnerability maps
The different elements of the vulnerability function (equation 3) have now been quantified, as summarised in Figure 2. The last step, the combination of the potential impact index (PI) and the adaptive capacity index (AC), is however the most dangerous step, especially when taking into account our limited understanding of adaptive capacity. It was therefore decided to create a visual combination of PI and AC without quantifying their relationship. The vulnerability maps will illustrate which areas are vulnerable. For further analytical purposes the constituents of vulnerability, the potential impact index and the adaptive capacity index, will have to be viewed separately. Trends in vulnerability follow the trend in potential impact: when ecosystem service supply decreases, humans relying on that particular ecosystem service become more vulnerable in that region. Alternatively, when ecosystem service supply increases, vulnerability decreases. Adaptive capacity lowers vulnerability. In regions with similar Potential Impact, the region with a high AC will be less vulnerable than the region with a low AC. The Hue Saturation Value (HSV) colour scheme is used to combine PI and AC. The PI index determined the Hue, ranging from red (decreasing stratified ecosystem service supply, PI = -1, highest negative potential impact) via yellow (no change in ecosystem service supply, PI = 0, no potential impact) to green (increase in stratified ecosystem service supply, PI = 1, highest positive potential impact). Note that it is possible that while the modelled sensitivity stays unchanged, stratified sensitivity increases or decreased due to changes in the highest value of ecosystem service supply in the environmental class (Sref). Thus, when the environment changes, but sensitivity stays constant this is reflected in the potential impact. Colour Saturation is determined by the AC and ranges from 50% to 100% depending on the level of the AC. When the PI becomes more negative, a higher AC will lower the vulnerability, therefore a higher AC value gets a lower saturation, resulting in a less bright shade of red. Alternatively, when ecosystem service supply increases (PI > 0), a higher AC value will get a higher saturation, resulting in a brighter shade of green. Inversely, in areas of negative impact, low AC gives brighter red, whereas in areas of positive impacts low AC gives less bright green. The last element of the HSV colour code, the Value, was kept constant for all combinations. Figure 1F shows the
Metzger et a.l 2004 – A multidisciplinary multi-scale framwork for assessing vulnerability to global change 10
vulnerability maps and the legend for farmer livelihood under the A1 scenario for the HadCM3 GCM. Under this scenario farmer livelihood will decrease in the extensive agricultural areas. The role of AC becomes apparent in rural France and Spain, where France is less vulnerable than Spain due to a higher AC, i.e. a supposed higher ability of the French agricultural sector to react to these changes.
Analysis of the maps
Communication of the results of the vulnerability assessment needs considerable thought, not in the least because of the uncertainties in future changes, and the political sensitivity around directly related European policies, such as agricultural reforms. Vulnerability maps, but also maps of the exposure, sensitivities, PI and AC, should always be presented as one of a range of possible scenarios. Furthermore, many of the comparisons and analyses can take place in summarised tables or graphs instead of maps, which are more easily misinterpreted. For instance, changes can be summarised per (current) Environmental Zone (EnZ) (Figure 1B, 1990) or per country. Figure 1G gives an example of a summary of the potential impact in 2080 for the Environmental Zones, showing the variability between scenarios and GCMs. Similar graphs can be made for the other components of vulnerability, which can also be analysed separately. The results presented in Figure 1G show that the scenarios affect the potential impact differently in the different EnZs. In most cases the A1 scenario has the most negative impact. However, in the Atlantic Central the A2 and B2 scenarios project greater changes. The B1 scenario is most frequently shows the smallest impact, but not in the Mediterranean South, where it comes third, after A2 and B2. The variability in the GCMs used to model farmer livelihood also shows differences across the EnZs. In the some EnZs the variability is very small (e.g. Nemoral, Atlantic Central) in other EnZs the variability is considerable (e.g. Lusitanian and Mediterranean South). The extent of the variability in the affect of the Global Circulation Models (GCMs) is important to take into account when analysing the results, because in some cases the variability between the GCMs is similar to the variability between the scenarios. When this is the case, analysis of the scenarios cannot be treated with great confidence.
Metzger et a.l 2004 – A multidisciplinary multi-scale framwork for assessing vulnerability to global change 11
Figure 1(A-D). A. Farmer livelihood as modelled by the ATEAM land use scenarios (Rounsevell et al., in prep.) B. Environmental Classification of Euroep (EnC) aggregated to 13 Environmental Zones for presentation purposes. C. The modelled maps of farmer livelihood are stratified by the environmental classes. D. The change in stratified sensitivity compared to baseline conditions forms a measure of the potential impact for a given location. Positive values indicate an increase of ecosystem service provision relative to environmental conditions, and therefore a positive impact, while negative impacts are the result of a relative decrease in ecosystem service provision compared to 1990.
A
B
C
D

Metzger et a.l 2004 – A multidisciplinary multi-scale framwork for assessing vulnerability to global change 12
Figure 1(E-G). E. Socio-economic indicators were aggregated to a generic adaptive capacity index. Trends in the original indicators were linked to the SRES scenarios in order to map adaptive capacity in the 21st Century. F. Vulnerability maps combine information about potential impact (PI) and adaptive capacity (AC), as illustrated by the legend. An increase of stratified ecosystem service supply decreases vulnerability and visa versa. At the same time vulnerability is lowered by human adaptive capacity. G. Summary of potential impact in 2080 for the Environmental Zones (EnZ), showing the variability between scenarios and GCMs (for the A2 scenario).
E
F
G
a1a2b1b2
scenario
variability in PI between scenarios,summarized per Environmental Zone
Alp in e No rt h
B or ea l
Ne m
o ra l
A tl an tic Nor th
Alp in e So ut h
Con tin en ta l
A tl an tic Cen tra l
L u sit an ian
Me d . M
o un ta ins
Med . N
o rth
Med . S o ut h
-0.30
-0.20
-0.10
0.00
pi
a2scenario
CGCM2CSIRO2HadCM3PCM
gcm
variability in PI between GCMs,summarized per Environmental Zone
Alp in e N
o rth
Bor ea l
Ne m
o ra l
Atl an tic N
or th
Alp in e S
o ut h
Co n tin en ta l
Atla n tic C
en tra l
L u sit an ian
Me d . M
o un tai ns
Med . N
o rth
Med . S
o uth
-0.30
-0.20
-0.10
0.00
pi
Metzger et a.l 2004 – A multidisciplinary multi-scale framwork for assessing vulnerability to global change 13
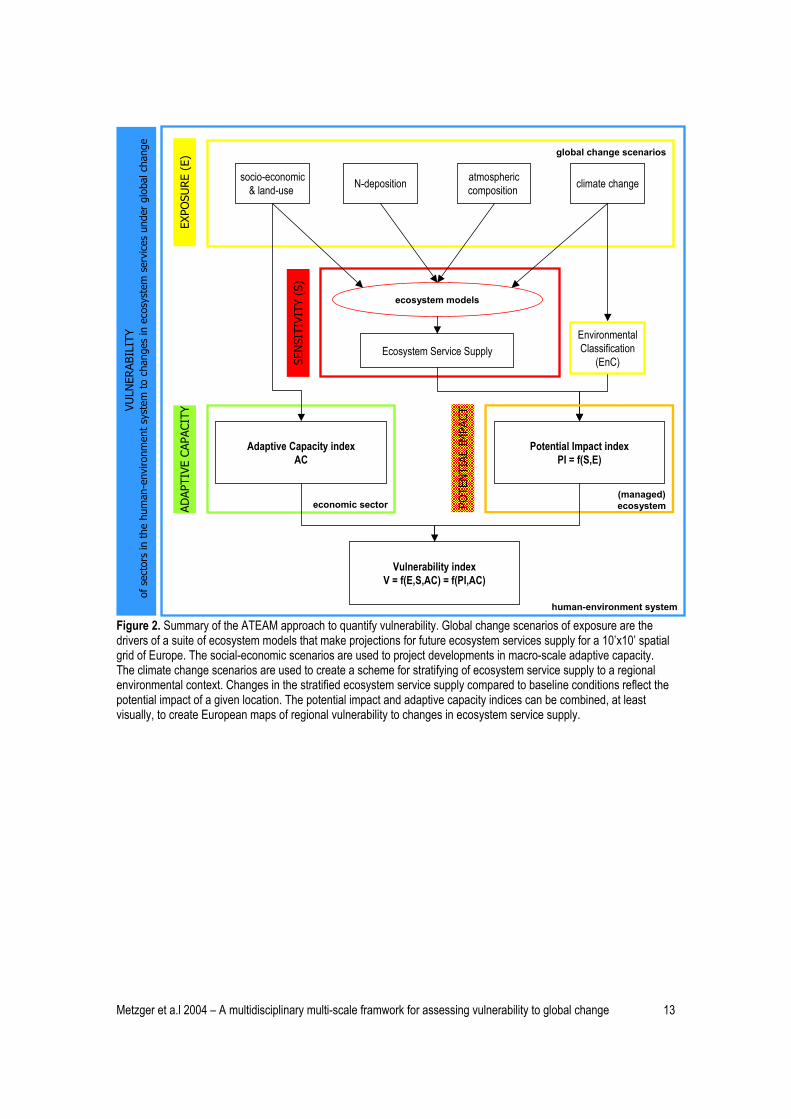
Figure 2. Summary of the ATEAM approach to quantify vulnerability. Global change scenarios of exposure are the drivers of a suite of ecosystem models that make projections for future ecosystem services supply for a 10’x10’ spatial grid of Europe. The social-economic scenarios are used to project developments in macro-scale adaptive capacity. The climate change scenarios are used to create a scheme for stratifying of ecosystem service supply to a regional environmental context. Changes in the stratified ecosystem service supply compared to baseline conditions reflect the potential impact of a given location. The potential impact and adaptive capacity indices can be combined, at least visually, to create European maps of regional vulnerability to changes in ecosystem service supply.
socio-economic& land-use N-deposition atmospheric
composition climate change
ecosystem models
EnvironmentalClassification
(EnC)Ecosystem Service Supply
VULN
ERAB
ILIT
Yof
sec
tors
in t
he h
uman
-env
ironm
ent
syst
em t
o ch
ange
s in
eco
syst
em s
ervi
ces
unde
r gl
obal
chan
ge
global change scenarios
human-environment system
economic sector
Adaptive Capacity indexAC
(managed)ecosystem
Potential Impact indexPI = f(S,E)
POTE
NTI
AL I
MPA
CT
Vulnerability indexV = f(E,S,AC) = f(PI,AC)
ADAP
TIVE
CAP
ACIT
Y
SEN
SITI
VITY
(S)
EXPO
SURE
(E)
Metzger et a.l 2004 – A multidisciplinary multi-scale framwork for assessing vulnerability to global change 14
Multi-scale comparisons of vulnerability
Ecosystems are frequently hierarchically grouped, for instance in plots, landscapes and biomes. Traditional assessments usually focus on the impacts of a limited number of drivers on a subset of ecosystems within one of these groups (e.g. Luers et al 2003, Polsky 2004). Unfortunately integrating and comparing observations drawn from studies remains a great challenge (Millennium Ecosystem Assessment, 2003). This section illustrates how the vulnerability framework presented above can be applied at the other scales, using suitable stratifications for that scale. Furthermore, by linking stratifications, results from the global impact model IMAGE (IMAGE team 2001) will be compared with the European results from ATEAM.
Vulnerability maps at different scales
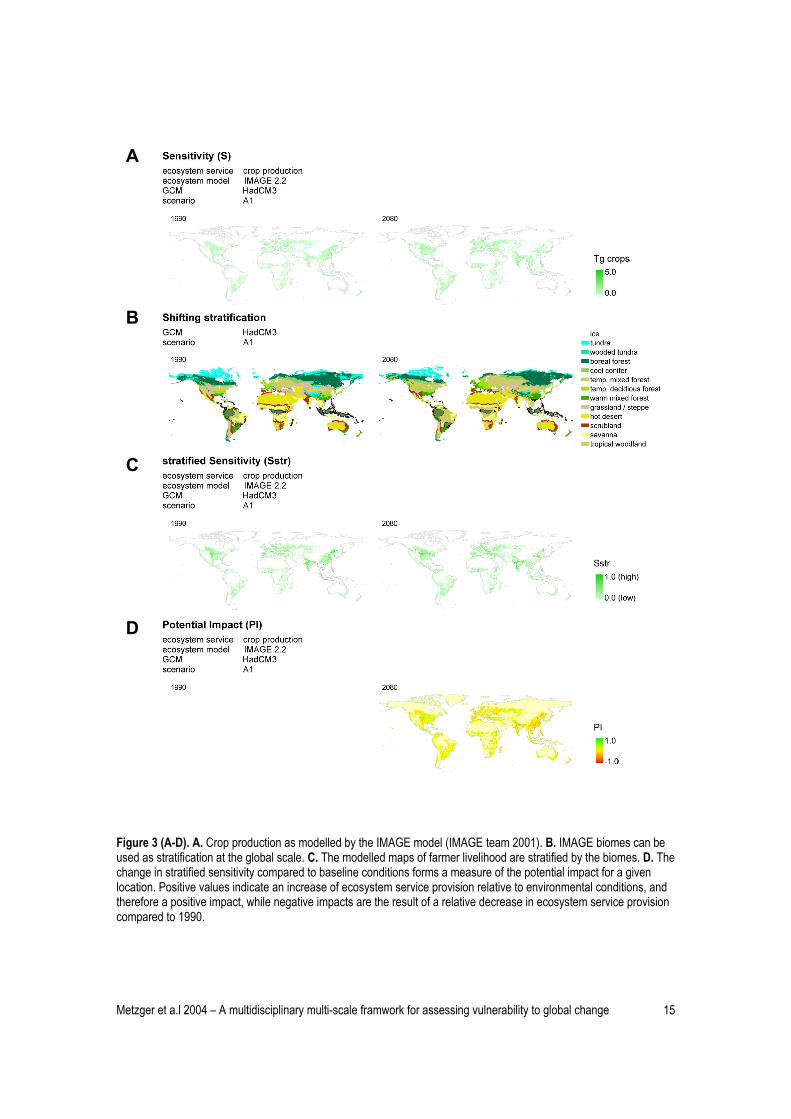
It is generally recognised that ecosystem components determine spatial environmental patterns through a scale-dependant hierarchy. On a global or continental scale, climate and geology determine the main patterns. They are conditional for the formations of soils, which in turn determine the local potential vegetation. There are feedbacks in the other direction, for example vegetation also influences soil properties and can even influence local climate. Most ecosystem patterns are, however, caused by the above-mentioned hierarchy (Bailey, 1985; Klijn & de Haes, 1994). On a European scale, climate and geomorphology are recognised as the key determinants of ecological patterns; these are followed by geology and soil. The variables that were clustered to create the European Environmental Classification, used to stratify ecosystem service supply in Europe as described above, were selected with this conceptual hierarchical model in mind (Metzger et al. 2003; Metzger et al. submitted to Global Ecology and Biogeography). In studies where ecosystem service supply is modelled at other scales, e.g. globally or at the catchment level, similar quantitative stratifications can be created using variables that are appropriate for that particular scale. With these stratification it is be possible to create standardized maps of potential impact. At the global scale several modelled maps of potential natural vegetation or biomes are available that could form suitable quantitative stratifications and are also linked to global change scenarios. Figure 3 shows how global potential impact maps can be created in the same way as depicted in Figure 1 for the Europe, using data from the IMAGE 2.2 model (IMAGE team 2001). Potential Natural Vegetation is used to stratify the ecosystem service food crop production. Because no Adaptive Capacity index is available at the global scale it is not possible at this time to create true vulnerability maps. Quantitative stratifications at the more regional levels (i.e. catchment or landscape) are not readily available and will probably need to be constructed with a specific region in mind. However, advances in quantitative clustering and classification make consistent regional landscape maps possible over large areas, as demonstrated by the first stages of the European landscape character assessment by Mücher et al. (2003).
Metzger et a.l 2004 – A multidisciplinary multi-scale framwork for assessing vulnerability to global change 15
Figure 3 (A-D). A. Crop production as modelled by the IMAGE model (IMAGE team 2001). B. IMAGE biomes can be used as stratification at the global scale. C. The modelled maps of farmer livelihood are stratified by the biomes. D. The change in stratified sensitivity compared to baseline conditions forms a measure of the potential impact for a given location. Positive values indicate an increase of ecosystem service provision relative to environmental conditions, and therefore a positive impact, while negative impacts are the result of a relative decrease in ecosystem service provision compared to 1990.
A
B
C
D
Metzger et a.l 2004 – A multidisciplinary multi-scale framwork for assessing vulnerability to global change 16
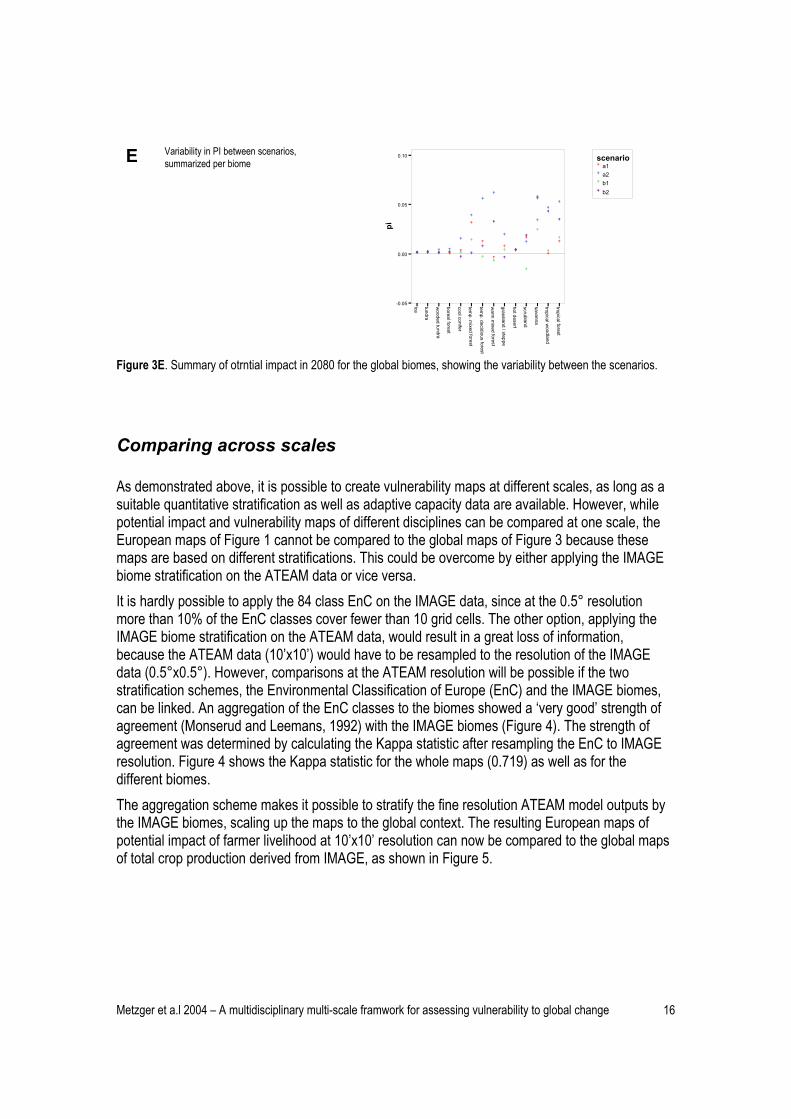
Figure 3E. Summary of otrntial impact in 2080 for the global biomes, showing the variability between the scenarios.
Comparing across scales
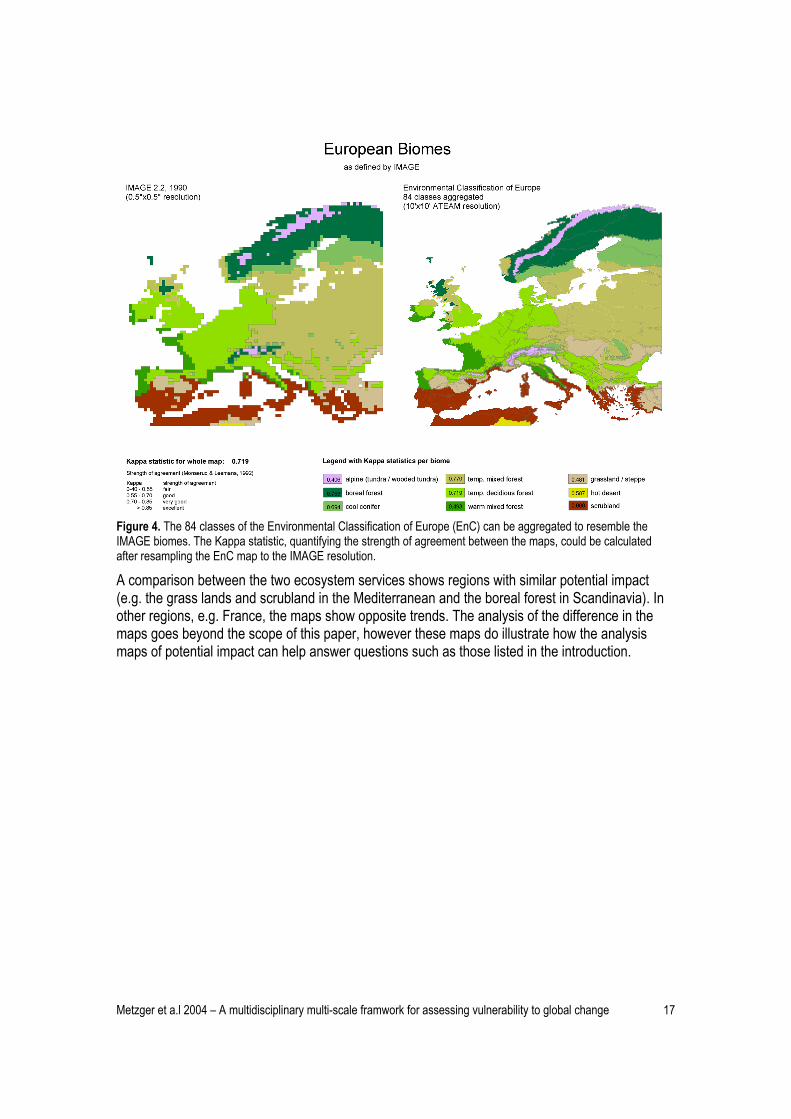
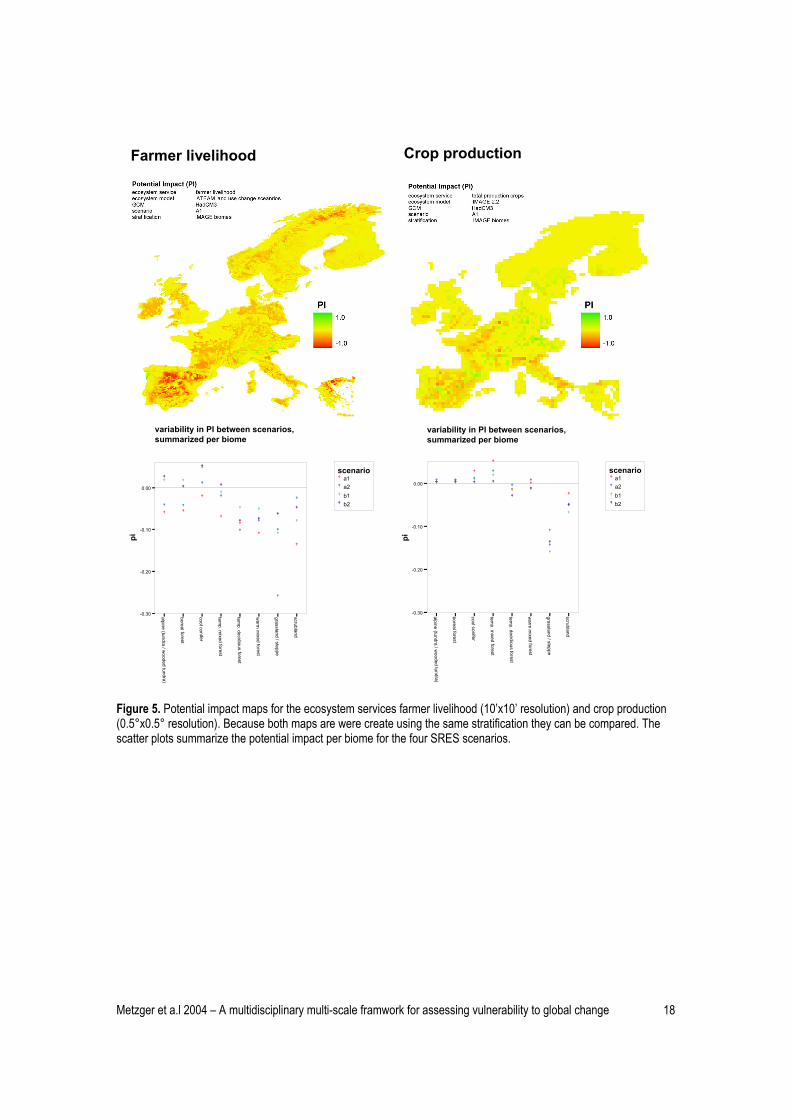
As demonstrated above, it is possible to create vulnerability maps at different scales, as long as a suitable quantitative stratification as well as adaptive capacity data are available. However, while potential impact and vulnerability maps of different disciplines can be compared at one scale, the European maps of Figure 1 cannot be compared to the global maps of Figure 3 because these maps are based on different stratifications. This could be overcome by either applying the IMAGE biome stratification on the ATEAM data or vice versa. It is hardly possible to apply the 84 class EnC on the IMAGE data, since at the 0.5° resolution more than 10% of the EnC classes cover fewer than 10 grid cells. The other option, applying the IMAGE biome stratification on the ATEAM data, would result in a great loss of information, because the ATEAM data (10’x10’) would have to be resampled to the resolution of the IMAGE data (0.5°x0.5°). However, comparisons at the ATEAM resolution will be possible if the two stratification schemes, the Environmental Classification of Europe (EnC) and the IMAGE biomes, can be linked. An aggregation of the EnC classes to the biomes showed a ‘very good’ strength of agreement (Monserud and Leemans, 1992) with the IMAGE biomes (Figure 4). The strength of agreement was determined by calculating the Kappa statistic after resampling the EnC to IMAGE resolution. Figure 4 shows the Kappa statistic for the whole maps (0.719) as well as for the different biomes. The aggregation scheme makes it possible to stratify the fine resolution ATEAM model outputs by the IMAGE biomes, scaling up the maps to the global context. The resulting European maps of potential impact of farmer livelihood at 10’x10’ resolution can now be compared to the global maps of total crop production derived from IMAGE, as shown in Figure 5.
Ea1a2b1b2
scenario
ice
tu n dra
wo od ed t un dr a
b ore a l fo re s t
c oo l c o nif er
te mp. m
ixe d fo re st
te mp. d ec idi ou s fo res t
wa rm
mix ed f ore s t
gr as sl an d / s te pp e
h ot de s er t
sc ru bl an d
sa v an na
tro pi ca l wo od la nd
tro p ica l f or es t
-0.05
0.00
0.05
0.10
pi
Variability in PI between scenarios, summarized per biome
Metzger et a.l 2004 – A multidisciplinary multi-scale framwork for assessing vulnerability to global change 17
Figure 4. The 84 classes of the Environmental Classification of Europe (EnC) can be aggregated to resemble the IMAGE biomes. The Kappa statistic, quantifying the strength of agreement between the maps, could be calculated after resampling the EnC map to the IMAGE resolution.
A comparison between the two ecosystem services shows regions with similar potential impact (e.g. the grass lands and scrubland in the Mediterranean and the boreal forest in Scandinavia). In other regions, e.g. France, the maps show opposite trends. The analysis of the difference in the maps goes beyond the scope of this paper, however these maps do illustrate how the analysis maps of potential impact can help answer questions such as those listed in the introduction.
Metzger et a.l 2004 – A multidisciplinary multi-scale framwork for assessing vulnerability to global change 18
Figure 5. Potential impact maps for the ecosystem services farmer livelihood (10’x10’ resolution) and crop production (0.5°x0.5° resolution). Because both maps are were create using the same stratification they can be compared. The scatter plots summarize the potential impact per biome for the four SRES scenarios.
a1a2b1b2
scenario
variability in PI between scenarios,summarized per biome
a lpi ne (t un dr a / woo d ed tu nd ra )
bo re al fo re st
c oo l co nif er
te mp. m
ix ed fo re st
te mp. de ci dio us f or es t
wa rm
mix ed f or es t
g ra ss lan d / s te pp e
sc ru bl an d
-0.30
-0.20
-0.10
0.00
pi
Farmer livelihood Crop production
a1a2b1b2
scenario
variability in PI between scenarios,summarized per biome
alp in e (tu nd ra / wo o de d tun d ra )
bo re al fo re st
co ol co n ife r
te mp. m
ixe d fo re st
te mp. d ec idi ou s for es t
wa rm
mix ed fo re st
g ra ss la nd / ste p pe
s c rub la nd
-0.30
-0.20
-0.10
0.00
pi
Metzger et a.l 2004 – A multidisciplinary multi-scale framwork for assessing vulnerability to global change 19
Discussion
This paper demonstrated the ATEAM vulnerability approach with the example of two agricultural ecosystem services, modelled at different scales. This suffices for illustrating the approach and gives insight into the type of analyses that can be made with this framework, but cannot be seen as a vulnerability assessment, which should include all sectors that could be vulnerable to a certain exposure. Only then will it be possible to consider interactions between different ecosystem services and between sectors. For example, abandoning agricultural areas not only influences the farming community, but also has implications for the aesthetic value of a landscape, and therefore for the tourism sector. Because in the vulnerability framework presented here ecosystem services are presented in a common dimension, it can form a useful tool for stakeholders to examine such interactions. The current framework was developed with the tools at hand and a wish list of analyses in mind. Strong points in the framework are the multiple scenarios as a measure of variability and uncertainty, the multiple stressors (climate, land use, and nitrogen deposition change), the inclusion of a measure of adaptive capacity, and the possibility to make comparisons across scale levels. The approach, as presented here, will facilitate the analysis of the ecosystem services estimated by ecosystem models. As the approach is applied, more advanced methods of combining potential impact (PI) and adaptive capacity (AC) may be developed, i.e. through fuzzy logic or qualitative differential equations. However, prerequisite for this is a further understanding how PI and AC interact and influence vulnerability, which may only be feasible when analysing specific cases. Ideally the AC index will eventually be replaced by sector specific projections of adaptive capacity. Some qualitative information, or knowledge shared during stakeholder dialogues does not enter the approach in a formal way. Therefore it is imperative to discuss the results with stakeholders, experts and scientists as part of the analysis. Communication of the results of a vulnerability assessment will need considerable thought, not in the least because of the uncertainties in future changes, and the political sensitivity around (European) policies that are directly related, such as agricultural reforms and carbon trading. Vulnerability maps, but also maps of the exposure, sensitivities, PI and AC, should always be presented as one of a range of possible scenarios. Furthermore, many of the comparisons and analyses can take place in summarised tables or graphs instead of maps, as shown in Figures 1G, 3E and 4), since maps are more easily misinterpreted. The method of comparing vulnerability, and its components, across scales by using a nested hierarchy of stratifications offers a challenging new way of analysis. However, as argued by O’Brien et al. (2003, in press), vulnerability is a dynamic outcome of both environmental and social processes occurring at multiple scales. While the nested stratifications form a tool for analysing multi-scale environmental processes, they neglect the social aspects. Therefore, when vulnerability maps based on this framework depict problematic regions, further attention should be directed to these regions to analyse their adaptive capacity at different scales (e.g. household, municipality, province, country).
Metzger et a.l 2004 – A multidisciplinary multi-scale framwork for assessing vulnerability to global change 20
Conclusion
This work was guided by a vision of how scientists can support stakeholders in decision-making. To enable people to decide on how to manage their land in a sustainable way, multiple maps of projected ecosystem service supply and adaptive capacity of related sectors could be obtained for all the ecosystem services that are relevant to the people. Like a portfolio that is spatially explicit and shows projections over time (while being honest about the attached uncertainties), different ecosystem services could be seen in their interactions, sometimes competing with each other, sometimes erasing or enforcing each other. This portfolio could provide the basis for discussion between different stakeholders and policy makers, thereby facilitating sustainable management of natural resources. This paper has shown how such a portfolio can be made for different scale levels, and how maps from different scale can be compared using nested quantitative stratifications.
Acknowledgements
The work presented in this paper was carried out as part of the EU funded Fifth Framework project ATEAM (Advanced Terrestrial Ecosystem Assessment and Modelling, Project No. EVK2-2000-00075). Many members in the consortium contributed to the discussions that helped shape the work in this paper. We especially want to thank Bas Eickhout of the Netherlands Environmental Assessment Agency (RIVM/MNP) for providing the IMAGE 2.2 data.
Metzger et a.l 2004 – A multidisciplinary multi-scale framwork for assessing vulnerability to global change 21
References
Alcamo J (2002) Introduction to special issue on regional air pollution and climate change in Europe. Environmental Science & Policy 5:255
Bailey RG (1985) The factor of scale in ecosystem mapping. Environmental Management, 9, 271-276.
Daily GC (1997) Nature's services. Island Press / Shearwater Books, Washington
Ekboir J (ed) (2002) CIMMYT 2000-2001 World Wheat Overview and Outlook: Developing No-Till Packages for Small-Scale Farmers. Mexico, DF: CIMMYT
Galloway JN (2001) Acidification of the world: Natural and anthropogenic. Water, Air, and Soil Pollution 130:17-24
IMAGE team (2001) The IMAGE 2.2 implementation of the SRES scenarios: A comprehensive analysis of emissions, climate change and impacts in the 21st century. in. National Institute of Public Health and the Environment (RIVM), Bilthoven, The Netherlands
IPCC (2001a) Climate Change 2001: Impacts, Adaptation, and Vulnerability. Contribution of Working Group II to the third assessment report of the Intergovernmental Panel on Climate Change (IPCC). Cambridge University Press, Cambridge
IPCC (2001b) Climate Change 2001: Mitigation. Contribution of Working Group III to the third assessment report of the Intergovernmental Panel on Climate Change (IPCC). Cambridge University Press, Cambridge
IPCC (2001c) Climate Change 2001: The Scientific Basis. Contribution of Working Group I to the third assessment report of the Intergovernmental Panel on Climate Change (IPCC). Cambridge University Press, Cambridge
Klijn F, de Haes HAU (1994) A hierarchical approach to ecosystems and its implications for ecological land classification. Landscape Ecology, 9, 89-104.
Luers AL, Lobell DB, Sklar LS, Addams CL, Matson PA (2003) A method for quantifying vulnerability, applied to the agricultural system of the Yaqui Valley, Mexico. Global Environmental Change 13:255-267
van der Meijden, R, van Duuren L, Duistermaat LH (1996) Standard List of the Flora of the Netherlands 1996. Survey of Changes since 1990. Gorteria 22, 1/2
Metzger M, Bunce B, Jongman R, Mateus V, Mücher S (2003) The Environmental Classification of Europe, a new tool for European landscape ecologists. Landschap 20(5)
Monserud RA, Leemans R (1992) The comparison of global vegetation maps Ecological Modelling 62: 275-293.
Mücher CA, Bunce RGH, Jongman RHG, Klijn JA, Koomen AJM, Metzger MJ, Wascher DM (2003) Identification and Characterisation of Environments and Landscapes in Europe. Alterra report 832. Alterra, Wageningen
Millenium Ecosystem Assessment (2003) Ecosystems and Human Well-being; a framework for assessment. Island Press, Washington
Nakicenovic N, Swart R (eds) (2000) IPCC Special Report on Emissions Scenarios (SRES). Cambridge University Press, Cambridge
O'Brien K, Sygna L, Haugen JE (2004) (in press) Vulnerable or resilient? A multi-scale assessment of climate impacts and vulnerability in Norway. Climatic Change
Parmesan C, Yohe G (2003) A globally coherent fingerprint of climate change impacts across natural systems. Nature 421:37-42
Polsky C, Schröter D, Patt A, Gaffin S, Martello ML, Neff R, Pulsipher A, Selin H (2003) Assessing Vulnerabilities to the Effects of Global Change: An Eight-Step Approach. Belfer Center for Science and International Affairs Working Paper, Environment and Natural Resources Program, John F. Kennedy School of Government, Harvard University, Cambridge, Massachusetts. 2003-05:17
Polsky C (2004) Putting Space and Time in Ricardian Climate Change Impact Studies: The Case of Agriculture in the U.S. Great Plains, Annals of the Association of American Geographers, in press.
Root TL, Price JT, Hall KR, Schneider SH, Rosenzweig C, Pounds JA (2003) Fingerprints of global warming on wild animals and plants. Nature 421:57-60
Ruosteenoja K, Carter TR, Jylhä K, Tuomenvirta H (2003) Future climate in world regions: an intercomparison of model-based projections for the new IPCC emissions scenarios. The Finnish Environment 644, Finnish Environment Institute
Metzger et a.l 2004 – A multidisciplinary multi-scale framwork for assessing vulnerability to global change 22
Sala OE, Chapin FS, Armesto JJ, Berlow E, Bloomfield J, Dirzo R, Huber-Sanwald E, Huenneke LF, Jackson RB, Kinzig A, Leemans R, Lodge DM, Mooney HA, Oesterheld M, Poff NL, Sykes MT, Walker BH, Walker M, Wall DH (2000) Biodiversity - Global biodiversity scenarios for the year 2100. Science 287:1770-1774
Schröter D, Acosta-Michlik L, Reidsma P, Metzger MJ and Klein RJT (2003) Modelling the Vulnerability of Eco-Social Systems to Global Change: Human Adaptive Capacity to Changes in Ecosystem Service Provision. Paper presented at the Fifth Open Meeting of the Human Dimensions of Global Environmental Change Research Community, Montreal, Canada. Available online http://sedac.ciesin.columbia.edu/openmtg/
Smith VH, Tilman GD, Nekola JC (1999) Eutrophication: impacts of excess nutrient inputs on freshwater, marine, and terrestrial ecosystems. Environmental Pollution 100:179-196
Stenseth NC, Mysterud A, Ottersen G, Hurrell JW, Chan K-S, Lima M (2002) Ecological Effects of Climate Fluctuations. Science 297:1292-1296
Turner BL, Kasperson RE, Matson P, McCarthy JJ, Corell RW, Christensen L, Eckley N, Kasperson JX, Luers A, Martello ML, Polsky C, Pulsipher and Schiller A (2003) A Framework For Vulnerability Analysis In Sustainability Science. Proceedings National Academy of Sciences USA 100:8074-8079
UNEP (2002) GEO-3: Global Environmental Outlook Report 3. UNEP - United Nations Environment Programme
Walther G-R, Post E, Convey P, Menzel A, Parmesan C, Beebee TJC, Fromentin J-M, Hoegh-Guldberg O, Bairlein F (2002) Ecological responses to recent climate change. Nature 416:389-395
Watson RT, Noble IR, Bolin B, Ravindranath NH, Verardo DJ, Dokken DJ (eds) (2000) Land Use, Land-Use Change and Forestry. A Special Report of the Intergovernmental Panel on Climate Change (IPCC). Cambridge University Press, Cambridge
World Conservation Monitoring Centre (1992) Global Biodiversity: Status of the Earth's living resources. Chapman & Hall, London
Yohe G, Tol RSJ (2002) Indicators for social and economic coping capacity -- moving toward a working definition of adaptive capacity. Global Environmental Change 12:25-40
About the authors
Marc Metzger MSc is a PhD student at the Plant Production Systems group of Wageningen University. After graduating as biologist from Wageningen University he started work on his PhD with Prof. Rik Leemans, working in the ATEAM project. His role in the project is to find a way of quantifying the vulnerability of society to changes in ecosystem service provision under global change. As a first step he created a statistical environmental classification of Europe. Prof. Rik Leemans is professor of Environmental Systems Analysis at Wageningen University. He currently leads multidisciplinary projects to develop models for ecosystem vulnerability. He was strongly involved in all assessments of IPCC over the last decade. He is also active in directing several core projects of IHDP and IGBP and co-chairing the Response Option Working group of the MA and participates in several (inter)national committees concerned with global change. Dr. Dagmar Schröter is scientific coordinator of the Vulnerability Assessment ATEAM (Advanced Terrestrial Ecosystem Analysis and Modelling) at the Potsdam Institute for Climate Impact Research (PIK). From 1996 through 2000, she was research assistant for the EU projects Carbon and Nitrogen Cycling in Forest Ecosystems (CANIF) and Global Change and Biodiversity in Soils (GLOBIS) at the Institute of Animal Ecology, University Giessen, Germany.