Embed Size (px)
Citation preview
www.elsevier.com/locate/enbuild
Energy and Buildings 38 (2006) 393–409
A multicriteria lifespan energy efficiency approach
to intelligent building assessment
Zhen Chen a,*, Derek Clements-Croome a, Ju Hong b, Heng Li b, Qian Xu b
a School of Construction Management and Engineering, The University of Reading, Reading, UKb Department of Building and Real Estate, The Hong Kong Polytechnic University, Hong Kong, China
Received 15 July 2005; received in revised form 29 July 2005; accepted 5 August 2005
Abstract
This paper presents a multicriteria decision-making model for lifespan energy efficiency assessment of intelligent buildings (IBs). The decision-
making model called IBAssessor is developed using an analytic network process (ANP) method and a set of lifespan performance indicators for IBs
selected by a new quantitative approach called energy–time consumption index (ETI). In order to improve the quality of decision-making, the
authors of this paper make use of previous research achievements including a lifespan sustainable business model, the Asian IB Index, and a
number of relevant publications. Practitioners can use the IBAssessor ANP model at different stages of an IB lifespan for either engineering or
business oriented assessments. Finally, this paper presents an experimental case study to demonstrate how to use IBAssessor ANP model to solve
real-world design tasks.
# 2005 Published by Elsevier B.V.
Keywords: Intelligent building; Life cycle assessment; Analytic network process; Energy efficiency
1. Introduction
Sustainable building design, construction and operation
require innovations in both engineering and management areas
at all stages of a building’s life. The lifespan of buildings is
composed of a series of interlocking processes, starting from
initial architectural and structural design, through to actual
construction, and then to maintenance and control as well as to
eventual demolition or renovation of buildings. Inside this
lifespan, essential requirements are generated from considera-
tions of social, environmental, and economic issues for high-
efficient energy-saving building systems in compliance with
building codes and regulations. In this regard, building
assessment is becoming popular in order to have a standard
method to evaluate new and existing building design. For
example, the U.S. Green Building Council [89] developed the
Leadership in Energy and Environmental Design (LEED)
Green Building Rating System as a voluntary, consensus-based
national standard for developing high-performance, sustain-
able buildings. The Japan Sustainable Building Consortium
* Corresponding author. Tel.: +44 7979 830 187.
E-mail address: [email protected] (Z. Chen).
0378-7788/$ – see front matter # 2005 Published by Elsevier B.V.
doi:10.1016/j.enbuild.2005.08.001
[99] developed the comprehensive assessment system for
building environmental efficiency (CASBEE) system as a new
environmental assessment system to meet both the political
requirements and market needs for achiving a sustainable
society. The Building Research Establishment Ltd. [9] from
UK developed the Building Research Establishment Environ-
mental Assessment Method (BREEAM) to assess the
environmental performance of both new and existing build-
ings. Meanwhile, intelligent buildings (IBs) are also under
assessment according to their IB related characteristics and
actual circumstances. For example, the Asian Institute of
Intelligent Buildings (AIIB) [5,22] from Hong Kong devel-
oped an IB Index system to specifically assess the performance
of IBs; and the BRE developed a matrix tool called MATOOL
for assessing the performance of intelligent buildings [12].
Although a new international benchmark of IB assessment is
under developing by the Continental Automated Building
Association [18] in Canada, there is not a standard sustainable
IB assessment tool, and this leads to the research being
presented in this paper.
Based on current practice in building assessment, the authors
of this paper present a multicriteria decision-making model
using the analytic network process (ANP) [70–72] to evaluate
the lifespan energy efficiency of IBs. To undertake this task, this
Z. Chen et al. / Energy and Buildings 38 (2006) 393–409394
Nomenclature
IBI the IB Index
I, J I is the index number of rows; J is the index
number of columns; both I and J correspond to
the number of cluster and their nodes (I, J 2 (1, 2,
. . ., 318))
m the number of elements in the ith module
Mi the score of the ith modules
n the total number of columns in cluster I
nI the total number of nodes in cluster I
nT the total number of tender alternatives (nT = 2 in
this study)
NðnI ÞI the node belongs to cluster I and the total number
of nodes in cluster I is nI
wi the weight to the jth module relevant to other
modules (wi 2 ½1; 9�)wt the synthesized priority weight of tender alter-
native t
wijI;J the weighted/derived priority of node i at row I
and column (J, i 2 (1, 2, . . ., nI)
wx j the weight to the jth element relevant to other
elements of the ith module (wx j 2 ½1; 9�)wx;wy the weight of module x and module y
WIJ a submatrix of the supermatrix
x, y different modules
xj the score of the jth element of the ith module
(xj 2 [1,100])
aij a matrix value assigned to the interdependence
relationship of node i to node j to reflect the
relative importance weight of interdependence
paper firstly reviews building assessment systems currently
adopted in Australia, Canada, Hong Kong, Japan, Korea,
mainland China, The Netherlands, the United Kingdom and the
United States. A quantitative indicator selection approach to
energy–time consumption during building lifespan is proposed
based on a Strategic Intelligent Building Evaluation and
Renovation (SIBER) model, which is a development of the
Through Life Environment Business Model developed by the
University of Reading for lifecycle assessment [24]. Under the
SIBER model, the authors further developed a Tactical
Intelligent Building Evaluation and Renovation (TIBER)
model, and from which an ANP model named IBAssessor is
then structured based on a group of key performance indicators
(KPIs) [2], which are selected through a proposed quantitative
approach called energy–time consumption index (ETI). In
order to further exam the effectiveness of IBAssessor, an
experimental case study is finally conducted with detailed
calculation and evaluation procedures. The paper concludes
that auditors can use the IBAssessor when it is necessary to
evaluate the lifespan energy efficiency of IBs and therefore
select the most appropriate building.
The significant contributions of this paper include an
energy–time analysis based quantitative approach to KPI
selection, a set of criteria applied to IB assessment regarding
their lifespan performances of energy efficiencies, and an
ANP model for lifespan energy efficiency assessment in IB
design, construction and operation. Meanwhile, the evidence
to be presented in this paper include the SIBER model for
building lifespan performance management; the TIBER
model for IB assessment; the energy–time analysis based
quantitative approach to KPI selection; the ANP model for
selecting the most appropriate IB alternative based on
lifespan energy–time consumption analysis; and an experi-
mental case study. It is the authors’ expectation that
practitioners including managers and auditors can use the
proposed IBAssessor for energy efficiency assessment in IB
design, construction and operation.
2. Assessment methods
According to the latest literature [24], an IB is one that
provides a productive and cost-effective environment through
optimizations based on its three basic elements—people
(owners; occupants; visitors, etc.); products (materials; fabric;
structure; facilities; equipments; services); and processes
(automation; control; systems; maintenance; performance
evaluation)—and the interrelationships between them. IBs
use integrated and intelligent systems to provide a rewarding
experience for the building owners, property managers,
occupants and visitors to achieve their goals. These goals
include the lifespan high energy efficiency, the environmental-
friendly built environment with substantial safety, security,
well-being and convenience, a lower life-cycle cost, and long-
term flexibility and marketability, which lead to achieve a high-
level of buildings that have the highest social, environmental
and economic values. Meanwhile, IBs use advanced informa-
tion and communication technologies to develop embedded
data collection and information networks through which its
services systems are automatically controlled to respond using
an approach similar to the sensor system of human beings,
guided by predictions based upon knowledge of the past
situations of the building and usage, maintained in an integrated
data base. Thus, IBs should be sustainable, healthy and
technologically aware, meet the needs of occupants and
business, and should be flexible and adaptable to deal with
change.
Practitioners use assessment methods to evaluate the design
or the performance of IBs. There are three main kinds of
assessment methods including building rating, computer
simulation and facilities management [24]. The rating method
relies on a series of factors/indicators related to the design and
the performance issues together with their defined scales to rate
an IB. The simulation method uses artificially settings based on
real-world data from the operation of IBs. The facilities
management method use experts’ knowledge to achieve goals
in practical IB design, construction and operation. The
applications of the first two kinds of assessment methods
can be at either design or operation stage of any IB under
evaluation, while the third method can be applied at all stages of
the IB life cycle.
Z. Chen et al. / Energy and Buildings 38 (2006) 393–409 395
The authors are conducting an extensive literature review on
conventional building assessment systems in order to extract a
group of indicators for the proposed ANP model. Current
building assessment systems under review include:
- A
ssessment Standards for Certifying Intelligent Buildings(ASCIB, by Intelligent Building Society of Korea (IBSK),
Seoul, Korea) [39],
- B
uilding Quality Assessment (BQA, by Building EconomicsBureau, UK),
- B
uilding Research Establishment Environmental AssessmentMethod (BREEAM, by Building Research Establishment Ltd.
(BRE), UK) [9],
- B
uilding Sustainability Assessment Tool (BSAT, by theDepartment of Trade and Industry, UK) [73],
- B
uilding IQ Rating Criteria (BIQRC, by Task Force 1—Intelligent Building Ranking System, Continental Automated
Building Association (CABA), Ottawa, Canada) [18],
- C
omprehensive Assessment System for Building Environ-mental Efficiency (CASBEE, by Japan Sustainable Building
Consortium (JSBC), Japan) [99],
- D
esign Quality Indicator (DQI, by Construction IndustryCouncil, UK),
- E
nvironmental Performance Express of Buildings (Eco-Quantum, by IVAM, The Netherlands),
- A
ssessment Framework and Green Building Tool (GBTool,by the International Initiative for a Sustainable Built
Environment (IISBE), Canada) [100],
- G
reen Mark for Buildings (GMB, by Building andConstruction Authority, Singapore) [104],
- H
ong Kong Building Environmental Assessment Method(HK-BEAM, by HK-BEAM Society, Hong Kong) [101],
- I
B Index (by Asian Institute of Intelligent Buildings (AIIB),Hong Kong) [5,22],
- I
B Rating (by Shanghai Construction Council (SCC),Shanghai, China) [74],
- L
eadership in Energy and Environmental Design/GreenBuilding Rating System (LEED, by U.S. Green Building
Council, USA) [89],
- A
matrix tool for assessing the performance of intelligentbuildings (MATOOL, by Building Research Establishment
Ltd. (BRE), UK) [12],
- N
ational Australian Built Environment Rating System(NABERS, by Department of the Environment and Heritage,
Australia) [102],
- O
ffice Scorer (Sustainable Refurbishment/RedevelopmentDecision Support Tool for office buildings, Building Research
Establishment Ltd. (BRE), UK) [8],
- S
ustainable Project Appraisal Routine (SPeAR, by Arup, UK)[103], and
- S
ustainability Checklist (Assessment of the social, environ-mental and economic impact of a proposed development, by the
South East England Development Agency (SEEDA), UK) [7].
According to the literature review focusing on the building
assessment systems, the authors noticed that there are several
successful applications of rating methods for building
performance assessment. For example, the LEED Green
Building Rating System1 is a voluntary, consensus-based
national standard for developing high-performance, sustainable
buildings in the United States [89]. The Environmental
Assessment Method by the Building Research Establishment
Ltd. (BREEAM) is adaptable to assess the environmental
performances of both new and existing buildings in the UK
[9,30]. The Standard Assessment Procedure (SAP) of the
National Home Energy Rating (NHER) is the UK’s premier
energy labelling scheme recommends by the UK Government
for home energy rating [58]. On the other hand, although
simulation methods can provide more reliable results than
rating methods using various conditions in the building lifespan
based on objective and subjective settings in computer
programmes; there is not a comprehensive simulation tool
for practitioners to conduct IB assessment at present. On the
contrary, popular simulation approaches mainly focus on only
one part of building performance such as thermal environment
or acoustic environment, and it is a difficult task to develop a
tool for complete performance simulations of the total
environment in buildings. In this regard, rating systems have
been widely adopted in building performance assessments, and
the simulation method is often adopted in building design.
Among these building assessment systems, there have been
several rating methods designed for for IB assessment, and
there are some new rating systems under development as well.
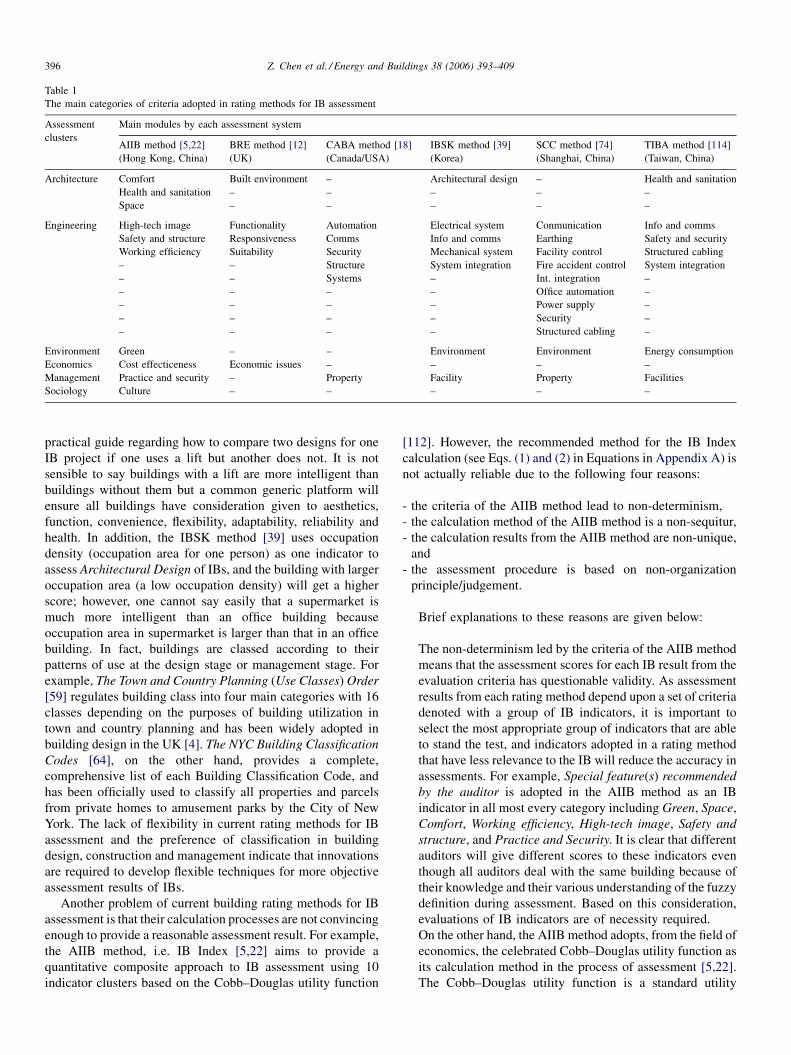
Table 1 gives a summary of representative methods based on
current practice in IB assessment. According to the literature
review, the authors identified six assessment clusters of
indicators centreing on Architecture, Engineering, Environ-
ment, Economics, Management, or Sociology. Among the five
IB assessment systems listed in Table 1, the AIIB method, i.e.
IB Index method [5,22] is the most comprehensive one that
covers all of the seven assessment clusters, and the SCC method
[74] is mostly focused on the one assessment cluster, i.e.
Engineering. The CABA method [18] aims to benchmark the IB
assessment in a more general way but is still under construction.
And the BRE method, i.e. MATOOL [12] and the IBSK method
[39] have less coverage of assessment clusters than the IB
Index. Therefore, the AIIB method is currently the most
comprehensive method for IB assessment.
3. Limitations of building rating methods
One problem of current building rating methods is that they
actually pay less attention to functional variation in different
types of buildings, which influence not only the emotional as
well as the physical well-being of human beings, but also the
design and the management of buildings. In other words, each
assessment procedure conducted under each rating method
actually uses a generic platform of indicators applied to all
kinds of buildings therefore do not differentiate one building
from another regarding their various features. As a consquence,
assessment results of different kinds of buildings actually lack
the power of comparability regarding the features of IBs. For
example, AIIB method adopts 29 sub-indicators to assess the
performance of lift and escalators [5,22]; however, there is not a
Z. Chen et al. / Energy and Buildings 38 (2006) 393–409396
Table 1
The main categories of criteria adopted in rating methods for IB assessment
Assessment
clusters
Main modules by each assessment system
AIIB method [5,22]
(Hong Kong, China)
BRE method [12]
(UK)
CABA method [18]
(Canada/USA)
IBSK method [39]
(Korea)
SCC method [74]
(Shanghai, China)
TIBA method [114]
(Taiwan, China)
Architecture Comfort Built environment – Architectural design – Health and sanitation
Health and sanitation – – – – –
Space – – – – –
Engineering High-tech image Functionality Automation Electrical system Conmunication Info and comms
Safety and structure Responsiveness Comms Info and comms Earthing Safety and security
Working efficiency Suitability Security Mechanical system Facility control Structured cabling
– – Structure System integration Fire accident control System integration
– – Systems – Int. integration –
– – – – Office automation –
– – – – Power supply –
– – – – Security –
– – – – Structured cabling –
Environment Green – – Environment Environment Energy consumption
Economics Cost effecticeness Economic issues – – – –
Management Practice and security – Property Facility Property Facilities
Sociology Culture – – – – –
practical guide regarding how to compare two designs for one
IB project if one uses a lift but another does not. It is not
sensible to say buildings with a lift are more intelligent than
buildings without them but a common generic platform will
ensure all buildings have consideration given to aesthetics,
function, convenience, flexibility, adaptability, reliability and
health. In addition, the IBSK method [39] uses occupation
density (occupation area for one person) as one indicator to
assess Architectural Design of IBs, and the building with larger
occupation area (a low occupation density) will get a higher
score; however, one cannot say easily that a supermarket is
much more intelligent than an office building because
occupation area in supermarket is larger than that in an office
building. In fact, buildings are classed according to their
patterns of use at the design stage or management stage. For
example, The Town and Country Planning (Use Classes) Order
[59] regulates building class into four main categories with 16
classes depending on the purposes of building utilization in
town and country planning and has been widely adopted in
building design in the UK [4]. The NYC Building Classification
Codes [64], on the other hand, provides a complete,
comprehensive list of each Building Classification Code, and
has been officially used to classify all properties and parcels
from private homes to amusement parks by the City of New
York. The lack of flexibility in current rating methods for IB
assessment and the preference of classification in building
design, construction and management indicate that innovations
are required to develop flexible techniques for more objective
assessment results of IBs.
Another problem of current building rating methods for IB
assessment is that their calculation processes are not convincing
enough to provide a reasonable assessment result. For example,
the AIIB method, i.e. IB Index [5,22] aims to provide a
quantitative composite approach to IB assessment using 10
indicator clusters based on the Cobb–Douglas utility function
[112]. However, the recommended method for the IB Index
calculation (see Eqs. (1) and (2) in Equations in Appendix A) is
not actually reliable due to the following four reasons:
- t
he criteria of the AIIB method lead to non-determinism,- t
he calculation method of the AIIB method is a non-sequitur,- t
he calculation results from the AIIB method are non-unique,and
- t
he assessment procedure is based on non-organizationprinciple/judgement.
Brief explanations to these reasons are given below:
The non-determinism led by the criteria of the AIIB method
means that the assessment scores for each IB result from the
evaluation criteria has questionable validity. As assessment
results from each rating method depend upon a set of criteria
denoted with a group of IB indicators, it is important to
select the most appropriate group of indicators that are able
to stand the test, and indicators adopted in a rating method
that have less relevance to the IB will reduce the accuracy in
assessments. For example, Special feature(s) recommended
by the auditor is adopted in the AIIB method as an IB
indicator in all most every category including Green, Space,
Comfort, Working efficiency, High-tech image, Safety and
structure, and Practice and Security. It is clear that different
auditors will give different scores to these indicators even
though all auditors deal with the same building because of
their knowledge and their various understanding of the fuzzy
definition during assessment. Based on this consideration,
evaluations of IB indicators are of necessity required.
On the other hand, the AIIB method adopts, from the field of
economics, the celebrated Cobb–Douglas utility function as
its calculation method in the process of assessment [5,22].
The Cobb–Douglas utility function is a standard utility
Z. Chen et al. / Energy and Buildings 38 (2006) 393–409 397
Tab
An
Bui
A.
B.
C.
D.
function applied to describe matching output to input in a
production processes and it is used commonly in both
macro- and micro-economics [108,109]. However, there is
no clear information to support concerns about the
application of the Cobb–Douglas utility function to the
rating procedure according to personal discussions between
the authors and other researchers in either the Cobb–
Douglas utility function or rating procedure fields. In fact,
the AIIB did not provide a reasonable explanation of reasons
to adopt the Cobb–Douglas utility function in the calculation
of a 10-module IB Index algorithm. Although the Cobb–
Douglas utility function is one of the most widely applied
utility functions in microeconomics, its major drawbacks
such as the limited scope of effective regions and the harsh
constraint terms to parameters definitely affect its utility in
applications [10,27,37,65,97]. It is actually hard to define a
physical model to describe this 10-module IB Index
algorithm beyond the Cobb–Douglas utility function.
Moreover, according to the second law of thermodynamics,
which requires that any process that takes place at non-zero
speeds must consume a minimum finite amount of exergy
(the quality of energy), so production isoquants (combina-
tions of inputs that yield the same output) [113] cannot be of
the Cobb–Douglas type [40]. In these cases, the necessary
and the sufficient conditions of applying the Cobb–Douglas
utility function to the 10-module IB Index algorithm
therefore require more study.
In addition, the AIIB method allows subjective weights of
different building modules but this can lead to confusion
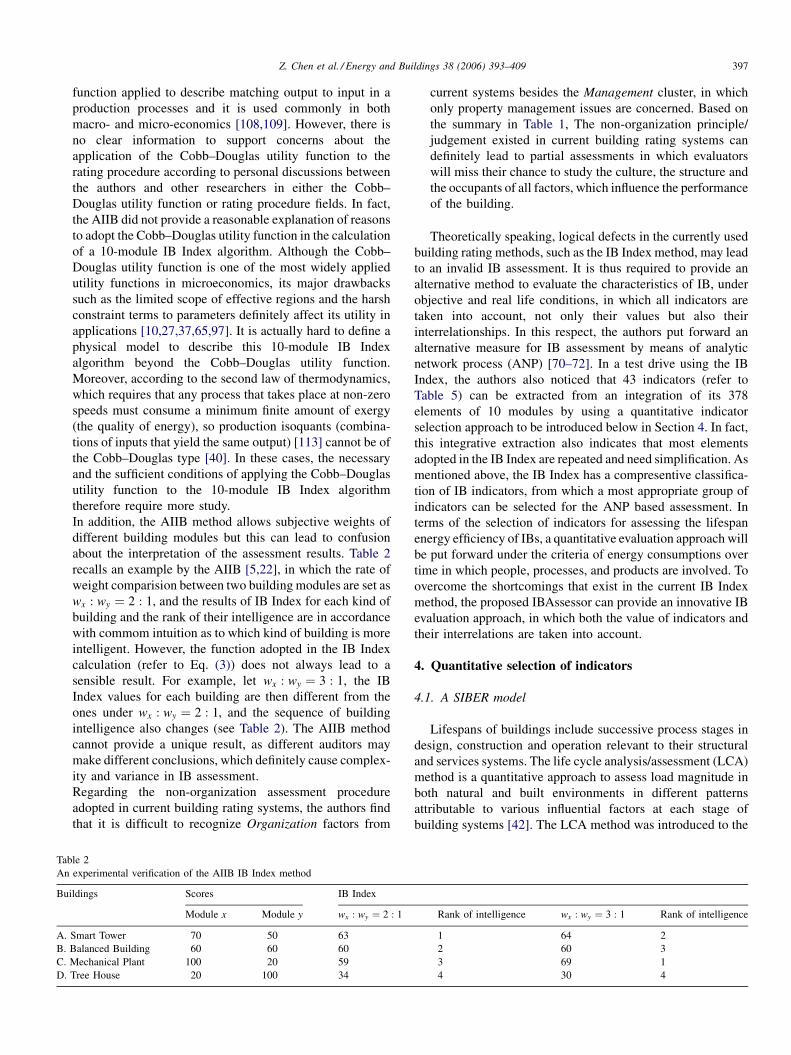
about the interpretation of the assessment results. Table 2
recalls an example by the AIIB [5,22], in which the rate of
weight comparision between two building modules are set as
wx : wy ¼ 2 : 1, and the results of IB Index for each kind of
building and the rank of their intelligence are in accordance
with commom intuition as to which kind of building is more
intelligent. However, the function adopted in the IB Index
calculation (refer to Eq. (3)) does not always lead to a
sensible result. For example, let wx : wy ¼ 3 : 1, the IB
Index values for each building are then different from the
ones under wx : wy ¼ 2 : 1, and the sequence of building
intelligence also changes (see Table 2). The AIIB method
cannot provide a unique result, as different auditors may
make different conclusions, which definitely cause complex-
ity and variance in IB assessment.
Regarding the non-organization assessment procedure
adopted in current building rating systems, the authors find
that it is difficult to recognize Organization factors from
le 2
experimental verification of the AIIB IB Index method
ldings Scores IB Index
Module x Module y wx : wy ¼ 2 : 1
Smart Tower 70 50 63
Balanced Building 60 60 60
Mechanical Plant 100 20 59
Tree House 20 100 34
current systems besides the Management cluster, in which
only property management issues are concerned. Based on
the summary in Table 1, The non-organization principle/
judgement existed in current building rating systems can
definitely lead to partial assessments in which evaluators
will miss their chance to study the culture, the structure and
the occupants of all factors, which influence the performance
of the building.
Theoretically speaking, logical defects in the currently used
building rating methods, such as the IB Index method, may lead
to an invalid IB assessment. It is thus required to provide an
alternative method to evaluate the characteristics of IB, under
objective and real life conditions, in which all indicators are
taken into account, not only their values but also their
interrelationships. In this respect, the authors put forward an
alternative measure for IB assessment by means of analytic
network process (ANP) [70–72]. In a test drive using the IB
Index, the authors also noticed that 43 indicators (refer to
Table 5) can be extracted from an integration of its 378
elements of 10 modules by using a quantitative indicator
selection approach to be introduced below in Section 4. In fact,
this integrative extraction also indicates that most elements
adopted in the IB Index are repeated and need simplification. As
mentioned above, the IB Index has a compresentive classifica-
tion of IB indicators, from which a most appropriate group of
indicators can be selected for the ANP based assessment. In
terms of the selection of indicators for assessing the lifespan
energy efficiency of IBs, a quantitative evaluation approach will
be put forward under the criteria of energy consumptions over
time in which people, processes, and products are involved. To
overcome the shortcomings that exist in the current IB Index
method, the proposed IBAssessor can provide an innovative IB
evaluation approach, in which both the value of indicators and
their interrelations are taken into account.
4. Quantitative selection of indicators
4.1. A SIBER model
Lifespans of buildings include successive process stages in
design, construction and operation relevant to their structural
and services systems. The life cycle analysis/assessment (LCA)
method is a quantitative approach to assess load magnitude in
both natural and built environments in different patterns
attributable to various influential factors at each stage of
building systems [42]. The LCA method was introduced to the
Rank of intelligence wx : wy ¼ 3 : 1 Rank of intelligence
1 64 2
2 60 3
3 69 1
4 30 4

Z. Chen et al. / Energy and Buildings 38 (2006) 393–409398
construction industry in 1970s [14,82] in both structural
engineering and project management. In the past 30 years, it
has developed another main stream of assessment theory in the
building and construction industry [3,6,7,15,16,17,20,21,23,32,
34,35,36,44–46,49,50,51–57,61,62,63,66–69,77,78,83,90–96,
98,105]. For implementing the concept of LCA in project
management, one essential is to benchmark construction
processes; significant research and development progress have
been achieved already. For example, the CSI [29] in the USA
made a close loop of project cycle that describes five phases for
construction projects including Planning and Predesign Activ-
ities, Design Activities, Bidding Activities, Construction
Activities, and Post-Construction Activities. Kagioglou et al.
[48] in the UK developed a general Process protocol that
describes ten phases for construction projects including
Demonstrating the Need, Conception of Need, Outline
Feasibility, Substantive Feasibility Study and Outline Financial
Authority, Outline Conceptual Design, Full Conceptual Design,
Co-ordinated Design, Procurement and Full Financial Authority,
Production Information, Construction, and Operation and
Maintenance. Smith [78] in the USA developed a knowledgebase
support prototype for the Total Life-cycle Cost that describes ten
phases for construction projects including Requirements, Plan,
Program, Design, Construction, Operation, Maintenance, Eva-
luation, Revitalization, and Disposal. The U.S. Army Corps of
Engineers (USACE) conducted a series LCA research in 1990s
[83–88] including the Guide for Project Partners and the Facility
Composer. The Guide for Project Partners describes six basic
phases of a civil works project including Reconnaissance,
Feasibility, Pre-construction engineering and design, Real estate
acquisition, Construction, and Operations and maintenance; and
the Facility Composer is a suite of criteria/requirement-based
facility modeling tools that integrate customer-specific criteria
with a life-cycle facility model and commercial tools [79]. The
Australian Building Codes Board [1] introduced energy
efficiency performance standards into the Building Code of
Australia in 2003 [76], in which Life Cycle House Energy
Estimator [31] is adopted. Literature reviews indicate the process
oriented LCA has been widely recognized and adopted in the
building and construction industry, and become the basic view
and starting point of construction management.
On the other hand, standards for quality assurance in
business have been developed since late 1950s [75]. After the
ISO [41–43] issued ISO 9000:1994 series of quality manage-
ment standards and replaced with ISO 9000:2000, life-cycle
business management has become a new development of LCA
in construction management. For example, the USNIBS (1998)
put forward a Total Life-cycle Cost Model for facilities
managers to conduct the comparative evaluation of all costs,
including productivity of function and impacts on the
enterprise, health and the environment throughout the facilities
life [78]. The FIDIC [33] introduced a Business Integrity
Management System to set out why consultants should apply
business integrity management in all of their work, and should
introduce initiating the business integrity management process
into their firms. Moreover, the USACE [86] developed a Project
Management Business Process model to deliver quality
projects. The model reflects the USACE corporate commitment
to provide inclusive, seamless, flexible, effective, and efficient
customer services, and embodies communication, leadership,
systematic and coordinated management, teamwork, partner-
ing, effective balancing of competing demands, and primary
accountability for the life cycle of a project. Based on these
LCA-based process benchmarks, Clements-Croome et al. [25]
put forward the Through Life Environment Business Model
(TLEBM) that concentrates upon six consistent phases for the
business management of construction projects including Client
Brief , Design, Installation/Commission (I/C), Operation and
Maintenance (O&M), Post Occupancy Evaluation (POE), and
Reuse/Recycle/Disposal. In order to select the most appropriate
indicators for intelligent building performance assessment, the
authors integrate a Building Assessment entity with decision
processes (decision-making options) into the TLEBM (refer to
Fig. 1). There are three decision processes involved in the
proposed decision-making model including a Design Review
between the Design phase and the I/C phase; an I/C Review
between the I/C phase and the O&M phase; and an O&M
Review between the O&M phase and the Disposal/Reuse/
Recycle phase, which is integrated with the POE phase. The
new evolving process, which is a TLEBM based prototype for
the lifespan performance assessment of buildings, is entitled
SIBER, which is a Strategic Intelligent Building Evaluation
and Renovation model.
In addition to the review of current rating systems, the
authors are also planning a generic platform of IB assessment
under the SIBER model, which is a representation of
sustainable issues over the whole lifespan performance of
buildings [25]. In this paper, the SIBER model will be used to
effectively control a process in which a group of assessment
indicators is quantitatively selected (refer to Fig. 2).
The SIBER model regulated assessment process requires a
group of indicators, this will include quality of life factors, that
can effectively signify the sustainable lifespan performance of
buildings for peoples. In this regard, three indicator clusters
[11] are adopted to cover the whole range of indicators
including the cluster for People, the cluster for Products, and
the cluster for Processes; and all possible indicators are
evaluated under restraining criteria of natural and social
environmental factors before they can flow into the Indicator
Cluster (refer to Fig. 1). In order to find the most appropriate
indicators for the Building Assessment entity of the SIBER
model under the restraining criteria, the authors create a
quantitative energy–time based indicator evaluation approach,
and introduce it below.
4.2. An energy–time consumption index
It is generally accepted that both energy and time
consumptions exist in each process, in term of Products and
Processes, for any building component or building system to
fulfill all kinds of requirements for People. Regarding the
energy consumption, embodied energy is one important
measurement. Embodied energy is the energy consumed by
all of the procedures associated with the production of a

Z. Chen et al. / Energy and Buildings 38 (2006) 393–409 399
Fig. 1. The Strategic Intelligent Building Evaluation and Renovation (SIBER) model.
building, from the acquisition of natural resources to product
delivery, including mining, manufacturing of materials and
equipment, transport and administrative functions [26].
Previous research that focus on the LCA of cost and
Fig. 2. The Tactical Intelligent Building Eva
environmental impacts of construction projects include the
embodied energy of products such as material, component,
equipment and building [13,15,16,80,81,110]; and the pro-
cesses such as construction, installation and maintenance
luation and Renovation (TIBER) model.
Z. Chen et al. / Energy and Buildings 38 (2006) 393–409400
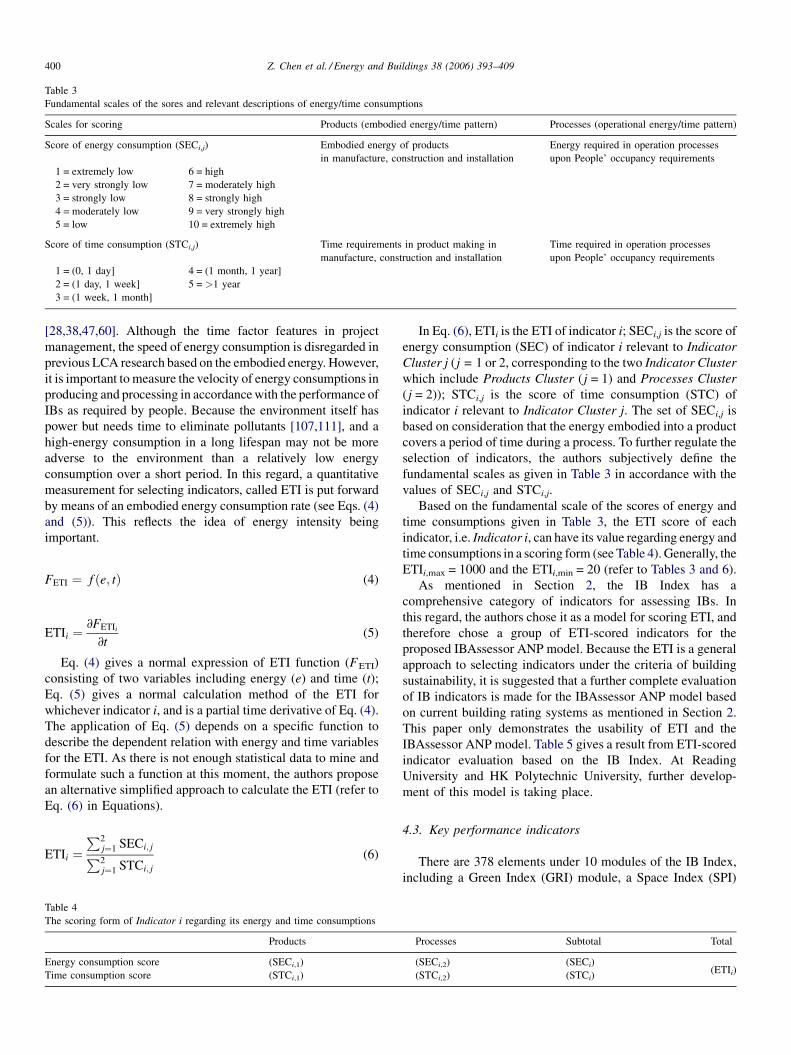
Table 3
Fundamental scales of the sores and relevant descriptions of energy/time consumptions
Scales for scoring Products (embodied energy/time pattern) Processes (operational energy/time pattern)
Score of energy consumption (SECi,j) Embodied energy of products
in manufacture, construction and installation
Energy required in operation processes
upon People’ occupancy requirements
1 = extremely low 6 = high
2 = very strongly low 7 = moderately high
3 = strongly low 8 = strongly high
4 = moderately low 9 = very strongly high
5 = low 10 = extremely high
Score of time consumption (STCi,j) Time requirements in product making in
manufacture, construction and installation
Time required in operation processes
upon People’ occupancy requirements
1 = (0, 1 day] 4 = (1 month, 1 year]
2 = (1 day, 1 week] 5 = >1 year
3 = (1 week, 1 month]
[28,38,47,60]. Although the time factor features in project
management, the speed of energy consumption is disregarded in
previous LCA research based on the embodied energy. However,
it is important to measure the velocity of energy consumptions in
producing and processing in accordance with the performance of
IBs as required by people. Because the environment itself has
power but needs time to eliminate pollutants [107,111], and a
high-energy consumption in a long lifespan may not be more
adverse to the environment than a relatively low energy
consumption over a short period. In this regard, a quantitative
measurement for selecting indicators, called ETI is put forward
by means of an embodied energy consumption rate (see Eqs. (4)
and (5)). This reflects the idea of energy intensity being
important.
FETI ¼ f ðe; tÞ (4)
ETIi ¼@FETIi
@t(5)
Eq. (4) gives a normal expression of ETI function (FETI)
consisting of two variables including energy (e) and time (t);
Eq. (5) gives a normal calculation method of the ETI for
whichever indicator i, and is a partial time derivative of Eq. (4).
The application of Eq. (5) depends on a specific function to
describe the dependent relation with energy and time variables
for the ETI. As there is not enough statistical data to mine and
formulate such a function at this moment, the authors propose
an alternative simplified approach to calculate the ETI (refer to
Eq. (6) in Equations).
ETIi ¼P2
j¼1 SECi; jP2j¼1 STCi; j
(6)
Table 4
The scoring form of Indicator i regarding its energy and time consumptions
Products
Energy consumption score (SECi,1)
Time consumption score (STCi,1)
In Eq. (6), ETIi is the ETI of indicator i; SECi,j is the score of
energy consumption (SEC) of indicator i relevant to Indicator
Cluster j (j = 1 or 2, corresponding to the two Indicator Cluster
which include Products Cluster ( j = 1) and Processes Cluster
( j = 2)); STCi,j is the score of time consumption (STC) of
indicator i relevant to Indicator Cluster j. The set of SECi,j is
based on consideration that the energy embodied into a product
covers a period of time during a process. To further regulate the
selection of indicators, the authors subjectively define the
fundamental scales as given in Table 3 in accordance with the
values of SECi,j and STCi,j.
Based on the fundamental scale of the scores of energy and
time consumptions given in Table 3, the ETI score of each
indicator, i.e. Indicator i, can have its value regarding energy and
time consumptions in a scoring form (see Table 4). Generally, the
ETIi,max = 1000 and the ETIi,min = 20 (refer to Tables 3 and 6).
As mentioned in Section 2, the IB Index has a
comprehensive category of indicators for assessing IBs. In
this regard, the authors chose it as a model for scoring ETI, and
therefore chose a group of ETI-scored indicators for the
proposed IBAssessor ANP model. Because the ETI is a general
approach to selecting indicators under the criteria of building
sustainability, it is suggested that a further complete evaluation
of IB indicators is made for the IBAssessor ANP model based
on current building rating systems as mentioned in Section 2.
This paper only demonstrates the usability of ETI and the
IBAssessor ANP model. Table 5 gives a result from ETI-scored
indicator evaluation based on the IB Index. At Reading
University and HK Polytechnic University, further develop-
ment of this model is taking place.
4.3. Key performance indicators
There are 378 elements under 10 modules of the IB Index,
including a Green Index (GRI) module, a Space Index (SPI)
Processes Subtotal Total
(SECi,2) (SECi)(ETIi)(STCi,2) (STCi)
Z. Chen et al. / Energy and Buildings 38 (2006) 393–409 401
Table 5
Selected indicators using ETI based on the IB Index
Indicator IB Index code SECi,1 SECi,2 SECi STCi,1 STCi,2 STCi ETIi
Electricity and electrical services GRI25 7 5 12 1 5 6 200
Heating services GRI27 7 9 16 3 5 8 200
Ventilation and airconditioning GRI31 6 9 15 3 5 8 188
Building services automation system HTI25 9 7 16 4 5 9 178
Construction materials HTI35 8 8 16 4 5 9 178
IT&C facilities and services WEI30 8 6 14 3 5 8 175
Thermal comfort and indoor air quality GRI22 5 8 13 3 5 8 163
Lifts/escalators and controls GRI02 5 8 13 3 5 8 163
Security and safety control SSI19 6 5 11 3 5 8 138
Reserve electric power SSI26 7 3 10 3 5 8 125
Green materials MPS18 5 5 10 3 5 8 125
Flushing water system HSI07 6 4 10 3 5 8 125
External decoration SSI05 5 6 11 4 5 9 122
Building architectural design HTI28 4 2 6 4 1 5 120
Lavatory accommodation GRI18 4 5 9 3 5 8 113
Refuse collection HSI21 5 4 9 3 5 8 113
Circulation for the disabled SSI11 5 5 10 4 5 9 111
Computer aided construction/installation MPS03 2 8 10 4 5 9 111
Waste disposal GRI64 1 2 3 1 2 3 100
Flexibility for renovation SPI15 4 3 7 2 5 7 100
Internal decoration CLI03 4 4 8 3 5 8 100
Structural monitoring and control SSI04 4 4 8 3 5 8 100
Computer aided manufacturing MPS03 8 1 9 4 5 9 100
Potable water system HSI01 5 3 8 3 5 8 100
Green design MPS01 6 2 8 4 5 9 89
Lighting GRI45 4 3 7 3 5 8 88
Fire detection and resistance SSI13 4 3 7 4 4 8 88
Cleanliness HSI20 4 3 7 3 5 8 88
Property management WEI70 1 5 6 2 5 7 86
Computer aided design MPS02 5 2 7 4 5 9 78
Carpark/transportation facilities SPI06 2 3 5 2 5 7 71
Entertainment facilities CFI48 1 4 5 2 5 7 71
External landscape CLI07 2 3 5 2 5 7 71
Extensive use of artificial intelligence HTI31 4 2 6 4 5 9 67
Electromagnetic compatibility GRI66 3 1 4 2 5 7 57
Environmental friendliness GRI53 1 2 3 1 5 6 50
Conference and meeting facilities WEI77 1 3 4 3 5 8 50
Drainage GRI65 2 1 3 2 5 7 43
Existence of green features GRI01 1 1 2 1 5 6 33
Access sign and directory WEI61 1 1 2 1 5 6 33
Maintainality SSI28 1 1 2 1 5 6 33
Usable areas SPI01 1 1 2 2 5 7 29
Means of escape SSI14 1 1 2 3 5 8 25
Note: Green Index (GRI), Space Index (SPI), Comfort Index (CFI), Working Efficiency Index (WEI), Culture Index (CLI), High-tech Image Index (HTI), Safety and
Structure Index (SSI), Management Practice and Security (MPS), Cost Effectiveness Index (CEI), Health and Sanitation Index (HSI).
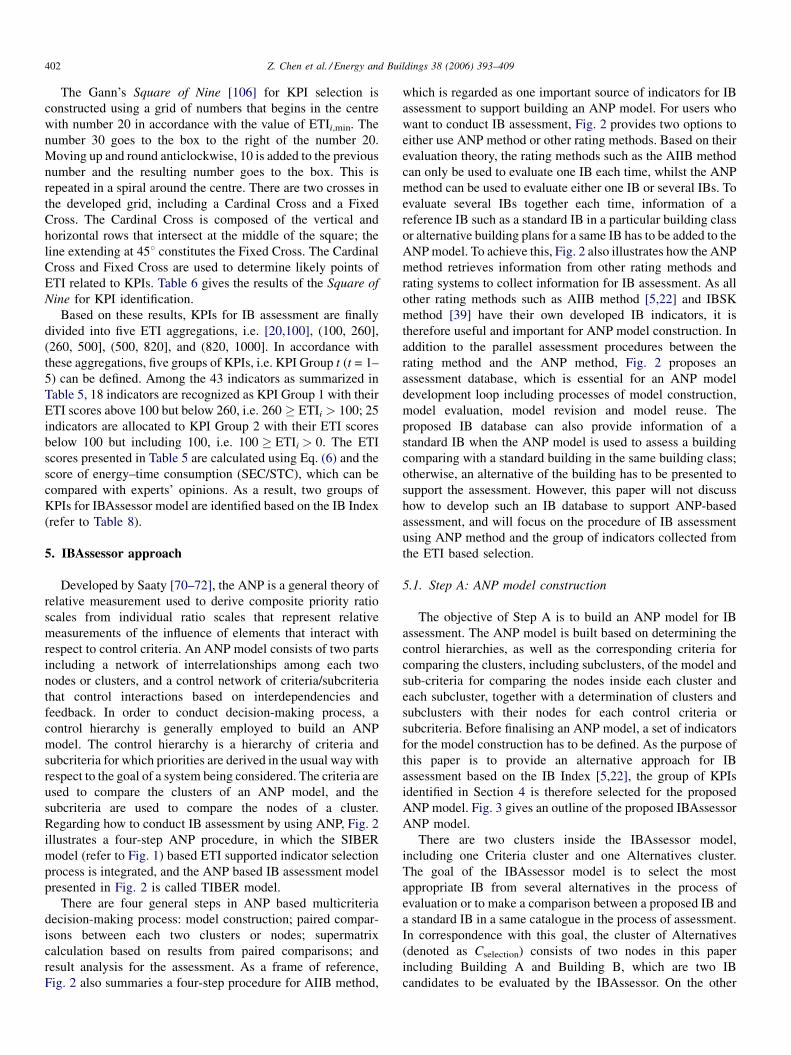
Table 6
Gann’s square of nine [106] for KPI identification
module, a Comfort Index (CFI) module, a Working Efficiency
Index (WEI) module, a Culture Index (CLI) module, a High-
tech Image Index (HTI) module, a Safety and Structure Index
(SSI) module, a Management Practice and Security Index
(MPS) module, a Cost Effectiveness Index (CEI), and a Health
& Sanitation Index (HSI) module. As summarized in Table 5,
43 indicators emerge from these 378 indicators following the
ETI based identification. To finally select a group of key
performance indicators (KPIs) for the ANP model, the authors
further estimate the scope of ETI, i.e. ETIi,max = 1000 and the
ETIi,min = 20, based on Gann’s Square of Nine [106] (refer to
Table 6). The purpose of this study is to explain concisely but in
detail simple mathematical and graphical techniques for
applying Gann’s Square of Nine to KPI selection.
Z. Chen et al. / Energy and Buildings 38 (2006) 393–409402
The Gann’s Square of Nine [106] for KPI selection is
constructed using a grid of numbers that begins in the centre
with number 20 in accordance with the value of ETIi,min. The
number 30 goes to the box to the right of the number 20.
Moving up and round anticlockwise, 10 is added to the previous
number and the resulting number goes to the box. This is
repeated in a spiral around the centre. There are two crosses in
the developed grid, including a Cardinal Cross and a Fixed
Cross. The Cardinal Cross is composed of the vertical and
horizontal rows that intersect at the middle of the square; the
line extending at 458 constitutes the Fixed Cross. The Cardinal
Cross and Fixed Cross are used to determine likely points of
ETI related to KPIs. Table 6 gives the results of the Square of
Nine for KPI identification.
Based on these results, KPIs for IB assessment are finally
divided into five ETI aggregations, i.e. [20,100], (100, 260],
(260, 500], (500, 820], and (820, 1000]. In accordance with
these aggregations, five groups of KPIs, i.e. KPI Group t (t = 1–
5) can be defined. Among the 43 indicators as summarized in
Table 5, 18 indicators are recognized as KPI Group 1 with their
ETI scores above 100 but below 260, i.e. 260 � ETIi > 100; 25
indicators are allocated to KPI Group 2 with their ETI scores
below 100 but including 100, i.e. 100 � ETIi > 0. The ETI
scores presented in Table 5 are calculated using Eq. (6) and the
score of energy–time consumption (SEC/STC), which can be
compared with experts’ opinions. As a result, two groups of
KPIs for IBAssessor model are identified based on the IB Index
(refer to Table 8).
5. IBAssessor approach
Developed by Saaty [70–72], the ANP is a general theory of
relative measurement used to derive composite priority ratio
scales from individual ratio scales that represent relative
measurements of the influence of elements that interact with
respect to control criteria. An ANP model consists of two parts
including a network of interrelationships among each two
nodes or clusters, and a control network of criteria/subcriteria
that control interactions based on interdependencies and
feedback. In order to conduct decision-making process, a
control hierarchy is generally employed to build an ANP
model. The control hierarchy is a hierarchy of criteria and
subcriteria for which priorities are derived in the usual way with
respect to the goal of a system being considered. The criteria are
used to compare the clusters of an ANP model, and the
subcriteria are used to compare the nodes of a cluster.
Regarding how to conduct IB assessment by using ANP, Fig. 2
illustrates a four-step ANP procedure, in which the SIBER
model (refer to Fig. 1) based ETI supported indicator selection
process is integrated, and the ANP based IB assessment model
presented in Fig. 2 is called TIBER model.
There are four general steps in ANP based multicriteria
decision-making process: model construction; paired compar-
isons between each two clusters or nodes; supermatrix
calculation based on results from paired comparisons; and
result analysis for the assessment. As a frame of reference,
Fig. 2 also summaries a four-step procedure for AIIB method,
which is regarded as one important source of indicators for IB
assessment to support building an ANP model. For users who
want to conduct IB assessment, Fig. 2 provides two options to
either use ANP method or other rating methods. Based on their
evaluation theory, the rating methods such as the AIIB method
can only be used to evaluate one IB each time, whilst the ANP
method can be used to evaluate either one IB or several IBs. To
evaluate several IBs together each time, information of a
reference IB such as a standard IB in a particular building class
or alternative building plans for a same IB has to be added to the
ANP model. To achieve this, Fig. 2 also illustrates how the ANP
method retrieves information from other rating methods and
rating systems to collect information for IB assessment. As all
other rating methods such as AIIB method [5,22] and IBSK
method [39] have their own developed IB indicators, it is
therefore useful and important for ANP model construction. In
addition to the parallel assessment procedures between the
rating method and the ANP method, Fig. 2 proposes an
assessment database, which is essential for an ANP model
development loop including processes of model construction,
model evaluation, model revision and model reuse. The
proposed IB database can also provide information of a
standard IB when the ANP model is used to assess a building
comparing with a standard building in the same building class;
otherwise, an alternative of the building has to be presented to
support the assessment. However, this paper will not discuss
how to develop such an IB database to support ANP-based
assessment, and will focus on the procedure of IB assessment
using ANP method and the group of indicators collected from
the ETI based selection.
5.1. Step A: ANP model construction
The objective of Step A is to build an ANP model for IB
assessment. The ANP model is built based on determining the
control hierarchies, as well as the corresponding criteria for
comparing the clusters, including subclusters, of the model and
sub-criteria for comparing the nodes inside each cluster and
each subcluster, together with a determination of clusters and
subclusters with their nodes for each control criteria or
subcriteria. Before finalising an ANP model, a set of indicators
for the model construction has to be defined. As the purpose of
this paper is to provide an alternative approach for IB
assessment based on the IB Index [5,22], the group of KPIs
identified in Section 4 is therefore selected for the proposed
ANP model. Fig. 3 gives an outline of the proposed IBAssessor
ANP model.
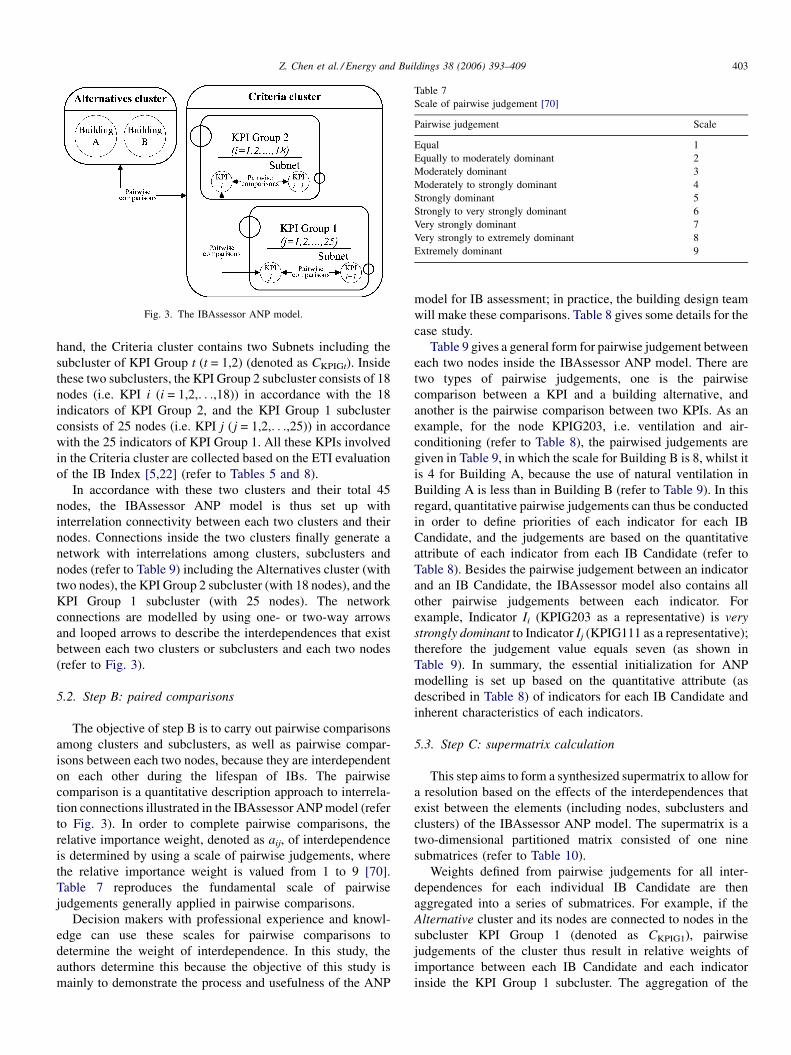
There are two clusters inside the IBAssessor model,
including one Criteria cluster and one Alternatives cluster.
The goal of the IBAssessor model is to select the most
appropriate IB from several alternatives in the process of
evaluation or to make a comparison between a proposed IB and
a standard IB in a same catalogue in the process of assessment.
In correspondence with this goal, the cluster of Alternatives
(denoted as Cselection) consists of two nodes in this paper
including Building A and Building B, which are two IB
candidates to be evaluated by the IBAssessor. On the other
Z. Chen et al. / Energy and Buildings 38 (2006) 393–409 403
Fig. 3. The IBAssessor ANP model.
Table 7
Scale of pairwise judgement [70]
Pairwise judgement Scale
Equal 1
Equally to moderately dominant 2
Moderately dominant 3
Moderately to strongly dominant 4
Strongly dominant 5
Strongly to very strongly dominant 6
Very strongly dominant 7
Very strongly to extremely dominant 8
Extremely dominant 9
hand, the Criteria cluster contains two Subnets including the
subcluster of KPI Group t (t = 1,2) (denoted as CKPIGt). Inside
these two subclusters, the KPI Group 2 subcluster consists of 18
nodes (i.e. KPI i (i = 1,2,. . .,18)) in accordance with the 18
indicators of KPI Group 2, and the KPI Group 1 subcluster
consists of 25 nodes (i.e. KPI j ( j = 1,2,. . .,25)) in accordance
with the 25 indicators of KPI Group 1. All these KPIs involved
in the Criteria cluster are collected based on the ETI evaluation
of the IB Index [5,22] (refer to Tables 5 and 8).
In accordance with these two clusters and their total 45
nodes, the IBAssessor ANP model is thus set up with
interrelation connectivity between each two clusters and their
nodes. Connections inside the two clusters finally generate a
network with interrelations among clusters, subclusters and
nodes (refer to Table 9) including the Alternatives cluster (with
two nodes), the KPI Group 2 subcluster (with 18 nodes), and the
KPI Group 1 subcluster (with 25 nodes). The network
connections are modelled by using one- or two-way arrows
and looped arrows to describe the interdependences that exist
between each two clusters or subclusters and each two nodes
(refer to Fig. 3).
5.2. Step B: paired comparisons
The objective of step B is to carry out pairwise comparisons
among clusters and subclusters, as well as pairwise compar-
isons between each two nodes, because they are interdependent
on each other during the lifespan of IBs. The pairwise
comparison is a quantitative description approach to interrela-
tion connections illustrated in the IBAssessor ANP model (refer
to Fig. 3). In order to complete pairwise comparisons, the
relative importance weight, denoted as aij, of interdependence
is determined by using a scale of pairwise judgements, where
the relative importance weight is valued from 1 to 9 [70].
Table 7 reproduces the fundamental scale of pairwise
judgements generally applied in pairwise comparisons.
Decision makers with professional experience and knowl-
edge can use these scales for pairwise comparisons to
determine the weight of interdependence. In this study, the
authors determine this because the objective of this study is
mainly to demonstrate the process and usefulness of the ANP
model for IB assessment; in practice, the building design team
will make these comparisons. Table 8 gives some details for the
case study.
Table 9 gives a general form for pairwise judgement between
each two nodes inside the IBAssessor ANP model. There are
two types of pairwise judgements, one is the pairwise
comparison between a KPI and a building alternative, and
another is the pairwise comparison between two KPIs. As an
example, for the node KPIG203, i.e. ventilation and air-
conditioning (refer to Table 8), the pairwised judgements are
given in Table 9, in which the scale for Building B is 8, whilst it
is 4 for Building A, because the use of natural ventilation in
Building A is less than in Building B (refer to Table 9). In this
regard, quantitative pairwise judgements can thus be conducted
in order to define priorities of each indicator for each IB
Candidate, and the judgements are based on the quantitative
attribute of each indicator from each IB Candidate (refer to
Table 8). Besides the pairwise judgement between an indicator
and an IB Candidate, the IBAssessor model also contains all
other pairwise judgements between each indicator. For
example, Indicator Ii (KPIG203 as a representative) is very
strongly dominant to Indicator Ij (KPIG111 as a representative);
therefore the judgement value equals seven (as shown in
Table 9). In summary, the essential initialization for ANP
modelling is set up based on the quantitative attribute (as
described in Table 8) of indicators for each IB Candidate and
inherent characteristics of each indicators.
5.3. Step C: supermatrix calculation
This step aims to form a synthesized supermatrix to allow for
a resolution based on the effects of the interdependences that
exist between the elements (including nodes, subclusters and
clusters) of the IBAssessor ANP model. The supermatrix is a
two-dimensional partitioned matrix consisted of one nine
submatrices (refer to Table 10).
Weights defined from pairwise judgements for all inter-
dependences for each individual IB Candidate are then
aggregated into a series of submatrices. For example, if the
Alternative cluster and its nodes are connected to nodes in the
subcluster KPI Group 1 (denoted as CKPIG1), pairwise
judgements of the cluster thus result in relative weights of
importance between each IB Candidate and each indicator
inside the KPI Group 1 subcluster. The aggregation of the
Z. Chen et al. / Energy and Buildings 38 (2006) 393–409404
Table 8
A case details about KPI and their values for the IBAssessor model
Classification Refence number Indicators Score of design alternatives [5,19,22]
Design A Design B
KPI Group 2 KPIG201 Electricity and electrical services 90 90
KPIG202 Heating services 90 90
KPIG203 Ventilation and airconditioning 80 90
KPIG204 Building services automation system 90 100
KPIG205 Construction materials 100 70
KPIG206 IT&C facilities and services 90 90
KPIG207 Thermal comfort and indoor air quality 80 100
KPIG208 Lifts/escalators and controls 90 80
KPIG209 Security and safety control 90 90
KPIG210 Reserve electric power 80 90
KPIG211 Green materials 100 80
KPIG212 Flushing water system 80 90
KPIG213 External decoration 80 80
KPIG214 Building architectural design 90 80
KPIG215 Lavatory accommodation 60 90
KPIG216 Refuse collection 70 80
KPIG217 Circulation for the disabled 90 90
KPIG218 Computer aided construction/installation 90 70
KPI Group 1 KPIG101 Waste disposal 80 80
KPIG102 Flexibility for renovation 50 70
KPIG103 Internal decoration 80 70
KPIG104 Structural monitoring and control 50 70
KPIG105 Computer aided manufacturing 90 70
KPIG106 Potable water system 70 90
KPIG107 Green design 90 80
KPIG108 Lighting 70 90
KPIG109 Fire detection and resistance 80 80
KPIG110 Cleanliness 70 80
KPIG111 Property management 80 80
KPIG112 Computer aided design 90 80
KPIG113 Carpark/transportation facilities 70 80
KPIG114 Entertainment facilities 70 80
KPIG115 External landscape 90 70
KPIG116 Extensive use of artificial intelligence 50 70
KPIG117 Electromagnetic compatibility 70 80
KPIG118 Environmental friendliness 90 90
KPIG119 Conference and meeting facilities 70 90
KPIG120 Drainage 70 80
KPIG121 Existence of green features 70 70
KPIG122 Access sign and directory 80 90
KPIG123 Maintainality 70 90
KPIG124 Usable areas 90 70
KPIG125 Means of escape 80 100
determined weights thus forms a 2 � 25 submatrix located at
‘‘W13’’ and ‘‘W31’’ in Table 10. It is necessary to note that
pairwise comparisons are necessary to all connections among
each node, subcluster and cluster in the IBAssessor ANP model
Table 9
Pairwise judgement of indicator Ii (KPIG203) and Ij (KPIG111)
Pairwise judgement 1 2 3
Indicator Ii Building A � � �Building B � � �
Indicator Ii Indicator Ij � � �
Note: The fundamental scale of pairwise judgement is given in Table 7. The symbo
denotes selected pairwise judgement.
to identify the level of interdependences, which are funda-
mental in the ANP procedure. Upon the completion of pairwise
judgements, the nine submatrices are then aggregated into a
supermatrix, which is denoted to supermatrix A in this study
4 5 6 7 8 9
U � � � � �� � � � U �
� � � U � �
l (�) denotes item under selection for pairwise judgement, and the symbol (U)

Z. Chen et al. / Energy and Buildings 38 (2006) 393–409 405
Table 11
Selection of the most appropriate IB
Model Number
of nodes
Synthesized priority weight Wi Selection
Building A Building B
IBAssessor 45 0.44 0.56 Building B
Table 10
Formulation of supermatrix and its submatrix for IBAssessor ANP model
General format of supermatrix A General format of submatrix
W ¼W1;1 W1;2 W1;3
W2;1 W2;2 W2;3
W3;1 W3;2 W3;3
264
375
Ci ¼ ðCsel: CKPIG2 CKPIG1 ÞNi ¼ ðN2
sel: N18KPIG2 N25
KPIG1 Þ
WIJ ¼
w1jI;J � � � w1jI;Jw2jI;J � � � w2jI;J� � � � � � � � �
wijI;J � � � wijI;J� � � � � � � � �
wNI1jI;J � � � wNIn
jI;J
26666664
37777775
Note: I is the index number of rows; and J is the index number of columns; both
I and J correspond to the number of cluster and their nodes (I, J 2 (1, 2, . . ., 45)),
NI is the total number of nodes in cluster I, n is the total number of columns in
cluster I. Thus, a 45 � 45 supermatrix is formed.
(refer to Table 10). And it is then used to derive the initial
supermatrix in the later calculation in Step C, and the
calculation of the IBAssessor ANP model can thus be
conducted following Step C to D.
In order to obtain useful information for IB assessment, the
calculation of supermatrix is to be conducted following three
substeps, which transform an initial supermatrix to a weighted
supermatrix, and then to a synthesized supermatrix.
At first, an initial supermatrix of the IBAssessor model is
created. The initial supermatrix consists of local priority vectors
obtained from the pairwise comparisons among clusters and
nodes. A local priority vector is an array of weight priori-
ties containing a single column (denoted as wT ¼ðw1; . . . ;wi; . . . ;wnÞ), whose components (denoted as wi) are
derived from a judgment comparison matrix A and deduced by
Eq. (7) [70–72].
wijI;J ¼
PIi¼1
�ai j=
PJj¼1 ai j
�
J(7)
where wijI;J is the weighted/derived priority of node i at row I
and column J; aij is a matrix value assigned to the interdepen-
dence relationship of node i to node j. The initial supermatrix is
constructed by substituting the submatrices into the superma-
trix as indicated in Table 10. A detailed initial supermatrix is
not given in this paper.
After formating the initial supermatrix, a weighted super-
matrix is then transformed. This process is to multiply all nodes
in a cluster of the initial supermatrix by the weight of the
cluster, which has been established by pairwise comparison
among clusters. In the weighted supermatrix, each column is
stochastic, i.e. sum of the column amounts to 1 [70–72].
The last substep of supermatrix calculation is to compose a
limiting supermatrix, which is to raise the weighted super-
matrix to powers until it converges/stabilizes when all the
columns in the supermatrix have the same values. Saaty [70]
indicated that as long as the weighted supermatrix is stochastic,
a meaningful limiting result could be obtained for prediction.
The approach to arrive at a limiting supermatrix is by taking
repeatedly the power of the matrix, i.e. the original weighted
supermatrix, its square, and its cube, etc., until the limit is
attained (converges), in which case the numbers in each row
will all become identical. A calculus type algorithm is
employed in the software environment of Super Decisions
by Bill Adams and the Creative Decision Foundation to
facilitate the formation of the limiting supermatrix and the
calculation result is omitted in this paper. As the limiting
supermatrix is set up, the following step is to select a proper
plan alternative using results from the limiting supermatrix.
5.4. Step D: selection
This step aims to select the most appropriate IB Candidate
based on the computation results from the limiting supermatrix
of the IBAssessor model. Main results of the ANP model
computations are the overall priorities of IB Candidates
obtained by synthesizing the priorities of individual IB
Candidate against different KPIs. The selection of the most
appropriate IB Candidate that has the highest priority of
lifespan energy efficiency is conducted by a limiting priority
weight, which is defined in Eq. (8).
Wi ¼wCIB;i
wCIB
¼ wCIB;iPi wCIB;i
(8)
where Wi is the synthesized priority weight of IB Candidate i
(i = 1,. . ., n) (n is the total number of IB Candidates, n = 2 in
this study), and wCIB;i is the limited weight of IB Candidate i in
the limiting supermatrix. Because the wCIB;i is transformed
from pairwise judgements conducted in Step B, it is reasonable
to be treated as the priority of IB Candidate i and thus to be used
in Eq. (8). According to the computation results in the limiting
supermatrix, wCIB;i ¼ ð0:433; 0:561Þ, so the Wi = (0.44, 0.56),
as a result, the most appropriate IB is Candidate B (refer to
Table 11).
According to the attributes of each IB Candidate listed in
Table 8, the comparison results using Wi also implies that the
most preferable building is the candidate that regulates the
building performance of lifespan energy efficiency with best
solutions for building services systems, least energy consump-
tion, lowest ratio of wastage, and lower adverse environmental
impacts. This indicates that the IBAssessor ANP model
provides a quite logical comparison result for the aim of a
sense of emotional and physical well-being of people and
lifespan energy efficiency of IBs and thus can be applied in
practice.
6. Conclusions and recommendations
This paper presents an ANP model, named as IBAssessor,
for IB assessments emphasizing the lifespan energy efficiency
of buildings. The IBAssessor ANP model is developed based on
Z. Chen et al. / Energy and Buildings 38 (2006) 393–409406
the ANP containing feedback and self-loops among clusters
and subclusters (refer to Fig. 3), but without the control model
to simplify the ANP model. KPIs for the IBAssessor model are
selected by a quantitative approach called energy–time
consumption index (ETI) based on a Strategic Intelligent
Building Evaluation and Renovation (SIBER) model (refer to
Fig. 1) and a Tactical Intelligent Building Evaluation and
Renovation (TIBER) model (refer to Fig. 2). However, there are
implicit control criteria with respect to which all pairwise
judgments are made in this model, i.e. lifespan energy
efficiency of buildings focusing on products and processes
with respect to the well-being of people. The supermatrix
computations are conducted for the overall priorities of IB
Candidates, and the priorities are obtained by synthesizing the
priorities of the Candidates from all the subnetworks of the
IBAssessor ANP model. Finally, the synthesized priority
weight Wi is used to distinguish the degree of lifespan energy
efficiency due to the deployment of design and construction
plans from each IB Candidate. The authors believe that the
IBAssessor approach has advantages over the current building
rating methods such as the Asian IB index because it can tackle
both values and interrelationships among KPIs, which the
current building rating systems do not achieve.
In summary, in order to apply the IBAssessor ANP model
into practice, this paper recommends the following steps:
1. a
ssess IB Candidates on all KPIs using Table 8 and thescoring criteria of IB Index by the AIIB [5,22];
2. m
ake pairwise comparisons among all indicators usingTables 7 and 9;
3. c
alculate supermatrix calculation to transform an initialsupermatrix to a limiting supermatrix;
4. c
alculate each limiting priority weight of IB Candidatesusing limiting supermatrix;
5. s
elect IB Candidate using Table 11.6. I
f none of the candidates meets lifespan energy efficiencyand well-being requirements, adjust the plans and re-
evaluate by repeating the above procedure.
Although the IBAssessor ANP model has been built based
on a group of KPIs extracted from IB Index, the authors admit
that the KPIs adopted in current IBAssessor model are not
perfect to provide a complete coverage to lifespan energy
efficiency of products and processes as well as well-being of
people. Further research needs to go through all current
building rating systems and conduct more surveys with
practitioners to collect a conclusive group of KPIs to develop
a revised IBAssessor model.
Acknowledgements
The authors of this paper gratefully acknowledge the
financial support from the UK government Engineering and
Physical Sciences Research Council (EPSRC) Sustainable
Urban Environment (SUE) programme under grant number
GR/T04878/01. The title of the research project under EPSRC
SUE programme is Innovation in Design, Construction and
Operation of Buildings for People (IDCOP), partners include
ARUP, Imperial College of Science, Technology & Medicine,
the University of Greenwich, the University of Southampton,
and the University of Reading.
The authors would also like to acknowledge Louis Landre
from the U.S. Army Corps of Engineers (USACE), Xavier
Menage from the Buildings & Government Efficiency Team of
Australian Government Department of the Environment &
Heritage (DEH) for providing valuable reference information.
Appendix A. Equations
The following equations are used in this paper:
IBI ¼Y9
i¼1
Mwi=P9
i¼1wi
i (1)
Mi ¼Ymj¼1
xwx j=Pm
j¼1wx j
j (2)
IBI ¼ xwx=ðwxþwyÞywy=ðwxþwyÞ (3)
FETI ¼ f ðe; tÞ (4)
ETIi ¼@FETIi
@t(5)
ETIi ¼P2
j¼1 SECi; jP2j¼1 STCi; j
(6)
wijI;J ¼
PIi¼1
�ai j=
PJj¼1 ai j
�
J(7)
Wi ¼wCIB;i
wCIB
¼ wCIB;iPi wCIB;i
(8)
References
[1] ABCB, Building Code of Australia, Australian Building Codes Board
(ABCB), Australia, 2005.
[2] ABS, Overall Liking Score (OLS), ABS Consultanting, London, 2004.
http://www.absconsulting.uk.com/ols.htm, 31 May 2005.
[3] H. Adeli, K. Sarma, Life-Cycle Cost Optimization of Structures: Fuzzy
Logic, Genetic Algorithm, and Parallel Computing, John Wiley & Sons,
New York, 2005.
[4] D. Adler, Metric Handbook: Planning and Design Data, Elsevier
Architectural Press, Oxford, UK, 1999.
[5] AIIB, IB Index, third ed., Asian Institute of Intelligent Buildings (AIIB),
Hong Kong, 2005.
[6] T. Alhazmi, R. McCaffer, Project procurement system selection model,
ASCE Journal of Construction Engineering and Management 126 (3)
(2000) 176–184.
[7] A. Amato, A Comparative Environmental Appraisal of Alternative
Framing Systems for Offices, Ph.D. thesis, Oxford Brookes University,
UK, 1996.
[8] J. Anderson, K. Mills, Refurbishment or Redevelopment of Office
Buildings? Sustainability Comparisons, Building Research Establish-

Z. Chen et al. / Energy and Buildings 38 (2006) 393–409 407
ment Ltd. (BRE), Garston, UK, 2002, http://www.brebookshop.com/
details.jsp?id=139909, http://www.officescorer.info, 31 May 2005.
[9] J. Anderson, D.E. Shiers, M. Sinclair, The Green Guide to Specification:
An Environmental Profiling System for Building Materials and
Components, 3rd ed., Blackwell Science Publishing, Oxford, UK,
2002.
[10] K.J. Arrow, H.B. Chenery, B.S. Minhas, R.M. Solow, Capital-labor
substitution and economic efficiency, The Review of Economics and
Statistics 43 (3) (1961) 225–250.
[11] A.S. Bahaj, D.J. Clements-Croome, D.M. Gann, K. Jones, S.B. Riffat,
Suatainable Urban Environment – Innovation in Design, Construction
and Operation of Buildings for People (IDCOP) – Case for Support to the
EPSRC, IDCOP Consortium, UK, 2002.
[12] R. Bassi, MATOOL: a matrix tool for assessing the performance of
intelligent buildings, in: Proceedings of the BRE Seminar on Intelligent
Buildings, Building Research Establishment Ltd., UK, 2005.
[13] B. Berge, The Ecology of Building Materials, Architectural Press,
Oxford, UK, 2000.
[14] D.T. Bickley, Probability distribution of maximum sustained load, ASCE
Journal of the Structural Division 100 (11) (1974) 2361–2365.
[15] S. Blanchard, P. Reppe, Life Cycle Analysis of A Residential Home in
Michigan, Report No. 1998-5, Master Project, School of Natural
Resources and Environment, University of Michigan, USA, 1998,
http://alcor.concordia.ca/�raojw/crd/reference/reference001522.html,
31 May 2005.
[16] S. Blanchard, P. Reppe, Life Cycle Analysis of a Residential Home in
Michigan, M.Sc. thesis, University of Michigan, USA, 1998.
[17] D.C. Brown, M.J. Ashleigh, M.J. Riley, R.D. Shaw, New project pro-
curement process, ASCE Journal of Management in Engineering 17 (4)
(2001) 192–201.
[18] CABA, Building IQ Rating Criteria. Task Force 1—Intelligent Building
Ranking System, Continental Automated Building Association (CABA),
Ottawa, Canada, 2004.
[19] A. Campagno, Intelligent Glass Facades: Material, Practice, Design,
Birkhauser Verlag, AG, Switzerland, 1995.
[20] Z. Chen, H. Li, C.T.C. Wong, Environmental management of urban
construction projects in China, ASCE Journal of Construction Engineer-
ing and Management 126 (4) (2000) 320–324.
[21] Z. Chen, An Integrated Analytical Approach to Environmental Manage-
ment in Construction. ProQuest, USA. UMI Number: AAT 3107430, 2004,
http://wwwlib.umi.com/dissertations/preview/3107430, 20 October 2005.
[22] L. Chow, K.L. Cheung, The Intelligent Building Index (IBI) Manual. 10.
Health & sanitation: version 3.0, Asian Institute of Intelligent Buildings,
Hong Kong, 2004.
[23] D.K.H. Chua, D. Li, Key factors in bid reasoning model, ASCE Journal
of Construction Engineering and Management 126 (5) (2000) 349–357.
[24] D.J. Clements-Croome, Intelligent Buildings: Design, Management and
Operation, Thomas Telford, London, 2004.
[25] D.J. Clements-Croome, K.G. Jones, G. John, Through life environmental
business modelling for sustainable architecture, CIBSE Proceedings of
Conference on Building Sustainability, Value and Profit, Edinburgh, UK,
2003.
[26] CMIT, CSIRO Sustainable Built Environment Online Brochures: Embo-
died Energy, CSIRO Manufacturing & Infrastructure Technology
(CMIT), Commonwealth Scientific and Industrial Research Organisation
(CSIRO), Australia, 2002, http://www.cmit.csiro.au/brochures/tech/
embodied, 31 May 2005.
[27] C.W. Cobb, P.H. Doughlas, A theory of production, American Economic
Review 28 (1928) 139–165.
[28] R.J. Cole, Energy and greenhouse gas emissions associated with the
construction of alternative structural systems, Building and Environment
34 (3) (1999) 335–348.
[29] CSI, An Overview of The United States National CAD Standard, The
Construction Specifications Institute (CSI), USA, 1997, http://www.
nationalcadstandard.org/NCSpres2.pdf, 31 May 2005.
[30] I. Dickie, N. Howard, Assessing Environmental Impacts of Construc-
tion—Industry Consensus, BREEAM and UK Ecopoints, BRE, UK,
2000.
[31] R. Drogemuller, LICHEE: Life Cycle House Energy Estimator, CSIRO
Manufacturing and Infrastructure Technology, Australia, 2004, http://
www.cmit.csiro.au/brochures/tech/lichee, 31 May 2005.
[32] K. Eaton, A. Amato, A Comparative Environmental Life Cycle Assess-
ment of Modern Office Buildings, Steel Construction Institute, Ascot,
UK, 1998.
[33] FIDIC, Guidelines for Business Integrity Management in the Consulting
Industry (Test Edition, 2001), International Federation of Consulting
Engineers (FIDIC), Switzerland, 2001.
[34] R. Flanagan, G. Norman, Life Cycle Costing for Construction, Royal
Institution of Chartered Surveyors, London, UK, 1983.
[35] R. Flanagan, G. Norman, J. Meadows, G. Robinson, Life Cycle Costing:
Theory and Practice, Basil Blackwell Scientific Publishing, Oxford, UK,
1989.
[36] D. Hampton, Procurement issues, ASCE Journal of Management in
Engineering 10 (6) (1994) 45–49.
[37] D.F. Heathfield, S. Wibe, An Introduction to Cost and Production
Functions, Macmillan Education, London, 1986.
[38] C. Hendrickson, A. Horvath, Resource use and environmental emissions
of U.S. construction sectors, ASCE Journal of Construction Engineering
and Management 126 (1) (2000) 38–44.
[39] IBSK, Assessment Standards for Certifying Intelligent Buildings 2002,
Intelligent Building Society of Korea (IBSK), Seoul, Korea, 2002.
[40] S. Islam, Effect of an essential input on isoquants and substitution
elasticities, Energy Economics 7 (3) (1985) 194–196.
[41] ISO, ISO 9000:1994—Quality Management and Quality Assurance
Standards, International Organization for Standardization (ISO), Swit-
zerland, 1993.
[42] ISO, ISO 14040:1997—Environmental Management—Life Cycle
Assessment - Principles and framework, International Organization
for Standardization (ISO), Switzerland, 2003.
[43] ISO, ISO 9000:2000—Quality Management Systems—Fundamentals
and Vocabulary, International Organization for Standardization (ISO),
Switzerland, 2004.
[44] W.T. Hetherington, Canadian Automated Building Protocol (CAB Pro-
tocolTM) Main Document Version 01—Release 2.0-2.01, Public Works
and Government Services Canada, Canada, 1997, http://tech-env.com/
cab.html, 31 May 2005.
[45] A. Jablonski, R. Klempous, B. Licznerski, Diversified approach to
methodology and technology in distributed intelligent building systems,
in: R. Moreno-Dıaz, F. Pichler, Computer Aided Systems Theory
(Revised Selected Papers of EUROCAST 2003, Nineth International
Workshop on Computer Aided Systems Theory Las Palmas de Gran
Canaria, Spain, 24–28 February 2003), Lecture Notes in Computer
Science, Springer-Verlag GmbH, Berlin, Germany, 2004.
[46] M. Jakob, R. Madlener, Riding down the experience curve for energy-
efficient building envelopes: the Swiss case for, 2020, International
Journal of Energy Technology and Policy 2 (1–2) (2004) 153–178.
[47] J.E. Rowings Jr., R.O. Walker Jr., Construction energy use, ASCE
Journal of Construction Engineering and Management 110 (4) (1984)
447–458.
[48] M. Kagioglou, R. Cooper, G. Aouad, J. Hinks, M. Sexton, D.M. Sheath,
A Generic Guide to the Design and Construction Process Protocol,
University of Salford, Salford, UK, 1998.
[49] S.J. Kirk, A.J. Dell’Isola, Life Cycle Costing for Design Professionals,
McGrew-Hill Book Company, New York, 1995.
[50] S. Kotaji, A. Schuurmans, S. Edwards, Life-Cycle Assessment in Building
and Construction: A State-Of-The-Art Report of Setac Europe, Society of
Environmental Toxicology and Chemistry, Brussels, Belgium, 2003.
[51] R. Kumar, S.N. Garg, S.C. Kaushik, Performance evaluation of multi-
passive solar applications of a non air-conditioned building, International
Journal of Environmental Technology and Management 5 (1) (2005) 60–
75.
[52] B. Li, Assessing the influence of indoor environment on productivity in
offices, Ph.D. thesis, University of Reading, UK, 1998.
[53] H. Li, Z. Chen, C.T.C. Wong, P.E.D. Love, A quantitative approach to
construction pollution control based on resource levelling, Construction
Innovation 2 (2) (2002) 71–81.

Z. Chen et al. / Energy and Buildings 38 (2006) 393–409408
[54] W. Lo, C.H. Chao, A. Hadavi, R.J. Krizek, Contractor selection process
for Taipei mass rapid transit system, ASCE Journal of Management in
Engineering 14 (3) (1998) 57–65.
[55] J. Myerson, Workplace Design, Design Council, London, 2005, http://
www.design-council.org.uk/webdav/servlet/XRM?Page/@id=6047&
Session/@id=D_l42wd0mH2OzKacvlm2kD&Document%5B@id%
3D1640%5D/Chapter/@id=2, 31 May 2005.
[56] NAHB, The Quiet Revolution. National Association of Home Builders
(NAHB), Washington, USA, 2002, http://www.nahb.org/publication_
details.aspx?sectionID=222&publicationID=17, 31 May 2005.
[57] NAHB, Life Cycle Assessment Tools to Measure Environmental
Impacts: Assessing Their Applicability to the Home Building Industry,
Prepared for: U.S. Department of Housing and Urban Development.
NAHB Research Center, Inc., Upper Marlboro, USA, 2001, http://www.
toolbase.org/tertiaryT.asp?TrackID=&CategoryID=1&DocumentID=
4305, 31 May 2005.
[58] NHER, Home Energy Rating: Introduction, National Home Energy Rat-
ings (NHER), The National Energy Centre, Milton Keynes, UK, 2004,
http://www.nher.co.uk/home-energy-rating-intro.shtml, 31 May 2005.
[59] ODPM (1987), The Town and Country Planning (Use Classes) Order
1987. Office of the Deputy Prime Minister (ODPM), UK, http://www.
odpm.gov.uk/stellent/groups/odpm_planning/documents/downloadable/
odpm_plan_033434.pdf, 31 May 2005.
[60] T. Oka, M. Suzuki, T. Konnya, The estimation of energy consumption
and amount of pollutants due to the construction of buildings, Energy and
Buildings 19 (1993) 303–311.
[61] P.G.T. Owens, Intelligent skings for buildings, ASHRAE Transactions 96
(1) (1990) 3–8.
[62] E. Palaneeswaran, M.M. Kumaraswamy, Contractor selection for design/
build projects, ASCE Journal of Construction Engineering and Manage-
ment 126 (5) (2000) 331–339.
[63] PMI, A Guide to the Project Management Body of Knowledge (PMBOK
Guide), third ed., Project Management Institute, USA, 2004.
[64] Profiles, New YorkCity Building Classification Codes, Profiles Publica-
tions, Inc., New York, USA, 2004, http://www.nyforeclosures.com/cgi-
bin/SoftCart.exe/articles/biccodes.htm?L+scstore+vwgx5689ffb2aeb2+
1113088040, 31 May 2005.
[65] X. Qi, Effective utility function and its criterion, in: Proceedings of the
Second China Economics Annual Conference, Northwest University,
China, 2002, http://www.cenet.org.cn/cn/ReadNews.asp?NewsID=6035,
31 May 2005.
[66] S. Raymond, R. Cunliffe, Tomorrow’s Office: Creating Effective and
Humane Interiors, E&FN Spon, London, UK, 1997.
[67] S. Roaf, Adapting Buildings and Cities for Climate Change: A 21st
Century Survival Guide, Architectural Press, Oxford, UK, 2005.
[68] S. Roaf, A. Horsley, R. Gupta, Closing the Loop: Benchmarks for
Suatainable Buildings, RIBA Enterprises Ltd., London, UK, 2004.
[69] S. Roaf, M. Hancock, Energy Efficient Building: A Design Guide,
Blackwell Scientific, Oxford, UK, 1992.
[70] T.L. Saaty, Decision-making with the AHP: why is the principal eigen-
vector necessary, in: Proceedings of ISAHP 2001, Berne, Switzerland,
2001.
[71] T.L. Saaty, Fundamentals of the ANP, in: ISAHP Proceedings, Kobe,
Japan, 1999.
[72] T.L. Saaty, Decision Making with Dependence and Feedback: The
Analytic Network Process, RWS Publications, Pittsburgh, USA, 1996.
[73] S. Sayce, A. Walker, A. McIntosh, Building Sustainability in the
Balance: Promoting Stakeholder Dialogue, Estates Gazette, UK, 2004.
[74] SCC, Shanghai Intelligent Building Appraisal Specification, Shanghai
Construction Council (SCC), Shanghai, China, 2002.
[75] J. Seddon, The Case Against ISO 9000, second ed., Cork, Ireland, 2001.
[76] SEDO, Introduction to House Energy Principles, Sustainable Energy
Development Office (SEDO), Government of Western Australia, Aus-
tralia, 2004, http://www1.sedo.energy.wa.gov.au/pages/her_intro.asp#2,
31 May 2005.
[77] SEEDA, Sustainability Checklist, the South East Development Agency
(SEEDA), Guildford, UK, 2004, http://www.sustainability-checklist.
co.uk/index.html, 31 May 2005.
[78] D.K. Smith, Total Life-cycle Cost Model (Presentation), Facility Infor-
mation Council, National Institute of Building Sciences, USA, 2000,
http://nibs.org/TLCM/TotalLifeCycle2000B.pdf, 31 May 2005.
[79] E. Teicholz, Facility Design and Management Handbook, McGraw-Hill,
New York, USA, 2001.
[80] G. Treloar, R. Fay, S. Tucker, in: Proceedings of the embodied energy:
the current state of play Seminar, The School of Architecture & Building,
Deakin University, Australia, 1998.
[81] G. Treloar, R. Fay, P.E.D. Love, U. Iyer-Raniga, Analysing the life-cycle
energy of an Australian residential building and its householders,
Building Research & Information 28 (3) (2000) 184–195.
[82] H. Tufty, Value engineering made mandatory on EPA projects over
$10,000,000, Civil Engineering, ASCE 46 (9) (1976) 101–103.
[83] USACE, Engineering and Design—Life Cycle Design and Performance,
ER 1110-2-8159, CECW-ED, The U.S. Army Corps of Engineers
(USACE), USA, 1997.
[84] USACE, A Guide for Project Partners – Life Cycle of a Civil Works
Project, The U.S. Army Corps of Engineers (USACE), USA, 2000, http://
www.nwp.usace.army.mil/re/LifeCycle.htm, 31 May 2005.
[85] USACE, Sustainable Project Rating Tool (SPiRiT) (Version 1.4.1), The
U.S. Army Corps of Engineers (USACE), USA, 2001, http://www.cecer.
army.mil/SustDesign/SPiRiT.cfm, 31 May 2005.
[86] USACE, Management—U.S. Army Corps of Engineers Business Pro-
cess, Publication Number: ER 5-1-11, The U.S. Army Corps of Engi-
neers (USACE), Washington, USA, 2001, http://www.usace.army.mil/
inet/usace-docs/eng-regs/er5-1-11/entire.pdf, 31 May 2005.
[87] USACE, Programs Management (CECW-B), Directorate of Civil
Works, the U.S. Army Corps of Engineers (USACE), Washington,
USA, 2001, http://www.usace.army.mil/inet/functions/cw/cecwb, 31
May 2005.
[88] USACE, Facility Composer: a life-cycle facility model based on industry
standards, the U.S. Army Corps of Engineers (USACE), Washington,
USA, 2002, http://www.erdc.usace.army.mil/pls/erdcpub/www_welcome.
navigation_page?tmp_next_page=46970, 31 May 2005.
[89] USGBC, LEED: Leadership in Energy and Environmental Design, the
U.S. Green Building Council (USGBC), Washington, USA, 2005, http://
www.usgbc.org, 31 May 2005.
[90] USGSA, The Integrated Workplace: A Comprehensive Approach to
Developing Workspace, Office of Real Property, the Office of Govern-
mentwide Policy, the U.S. General Services Administration (USGSA),
Washington, USA, 1999, http://www.gsa.gov/gsa/cm_attachments/GSA_
DOCUMENT/integrated_workplace_rpt_pdf_R2OD26_0Z5RDZ-i34K-
pR.pdf, 31 May 2005.
[91] USNIBS, Excellence in Facilities Management: Five Federal Case
Studies, The U.S. National Institute of Building Sciences (USNIBS),
Washington, USA, 1998, http://nibs.org/casestdy.pdf, 31 May 2005.
[92] USNIBS, Facility performance evaluation (FPE), National Institute of
Building Sciences (USNIBS), Washington, USA, 2005, http://www.
wbdg.org/design/fpe.php, 31 May 2005.
[93] M. Wigginton, J. Harris, Intelligent Skins, Elsevier Architectural Press,
London, 2002.
[94] K.C. Wong, A. So, N. Yu, The financial viability of intelligent buildings:
a Faustmann approach of assessment, Journal of Financial Management
of Property and Construction 6 (1) (2001) 41–50.
[95] K.C. Wong, T.P. So, Y.T. Leung, The Intelligent Building Index (IBI)
Manual: Version 2.0, Asian Institute of Intelligent Buildings, Hong
Kong, 2001.
[96] J.K.W. Wong, H. Li, S.W. Wang, Intelligent building research: a review,
Automation in Construction 14 (1) (2005) 143–159.
[97] X. Yin, A tractable alternative to Cobb–Douglas utility for imperfect
competition, Australian Economic Papers 40 (1) (2001) 14–21.
[98] J.L. Zachariah, C. Kennedy, K. Pressnail, What makes a building green?
International Journal of Environmental Technology and Management 2
(1–3) (2002) 38–53.
[99] JSBC, Comprehensive Assessment System for Building Environmental
Efficiency (CASBEE), Japan Sustainable Building Consortium (JSBC),
Institute for Built Environment and Energy Conservation (IBEC), Tokyo,
Japan, 2004.

Z. Chen et al. / Energy and Buildings 38 (2006) 393–409 409
[100] R.J. Cole, Review of GBTool and Analysis of GBC 2002 Case-Study
Projects, International Initiative for a Sustainable Built Environment
(IISBE), Canada, 2002, http://greenbuilding.ca/iisbe/gbc2k2/GBC_
2002_Analysis.pdf, 31 May 2005.
[101] HK-BEAM Society, Hong Kong Building Environmental Assessment
Method, HK-BEAM Society, Hong Kong, 2004.
[102] DEH, National Australian Built Environment Rating System, Depart-
ment of the Environment and Heritage (DEH), Australia, 2004.
[103] Arup, SPeAR1: Product overview, Arup, London, 2002, http://www.
arup.com/environment/feature.cfm?pageid=1685, 31 May 2005.
[104] GMB, Green Mark for Builfings, Building and Construction Authority,
Singapore, http://www.bca/gov.sg, 31 May 2005.
[105] A. Amato, L. Brimacombe, N. Howard, Development of quantitative
methodology for assessing embodied energy of recyclable and reusable
materials/products, Ironmaking and Steelmaking 23 (3) (1996) 235–241.
[106] P. Mikula, The Definitive Guide to Forecasting Using W.D. Gann’s
Square of Nine, Mikula Forecasting Company, 2003.
[107] T. Stephens, Impact of earlier global warming long-lasting: new findings
show a slow recovery from extreme global warming episode 55 million
years ago, Currents Online, UC Santa Cruz, 2005, http://currents.ucsc.
edu/04-05/06-13/ocean.asp, 16 June 2005.
[108] P.B. Meyer, Econterms, EconPort (A microeconomics digital library),
http://www.econport.org:8080/econport/request?page=web_glossary&
glossaryLetter=C, 16 June 2005.
[109] E.E. Vargas, D.F. Schreiner, G. Tembo, D.W. Marcouiller, Computable
General Equilibrium Modeling for Regional Analysis, Regional
Research Institute, West Virginia University, USA, http://www.rri.wvu.
edu/WebBook/Schreiner/contents.htm, 16 June 2005.
[110] BRE, Embodied Energy of Building Materials. Building Research
Establishment Ltd., UK, 1994, http://www.ecosite.co.uk/depart/backinfo/
bldmat.htm, 16 June 2005.
[111] Ricoh, Pursuing the Ideal Society. Ricoh Co., Ltd., 2005, http://www.
ricoh.com/environment/management/earth.html, 16 June 2005.
[112] A.R. Schotter, Microeconomics:, A Modern Approach, 3/E, Addison-
Wesley, Boston, USA, 2001.
[113] M.J. Osborne, Tutorial on the theory of the firm and industry equilibrium,
on-line tutorials, Department of Economics of the University of Toronto,
Toronto, Canada, 1997, http://www.chass.utoronto.ca/�osborne, 6 Octo-
ber 2005.
[114] S.L. Wen, Manual of Intelligent Building Assessment, Architecture and
Building Research Institute, Ministry of the Interior, Taiwan, China,
ISBN: 957016137X, 2003.