Embed Size (px)
Citation preview
14
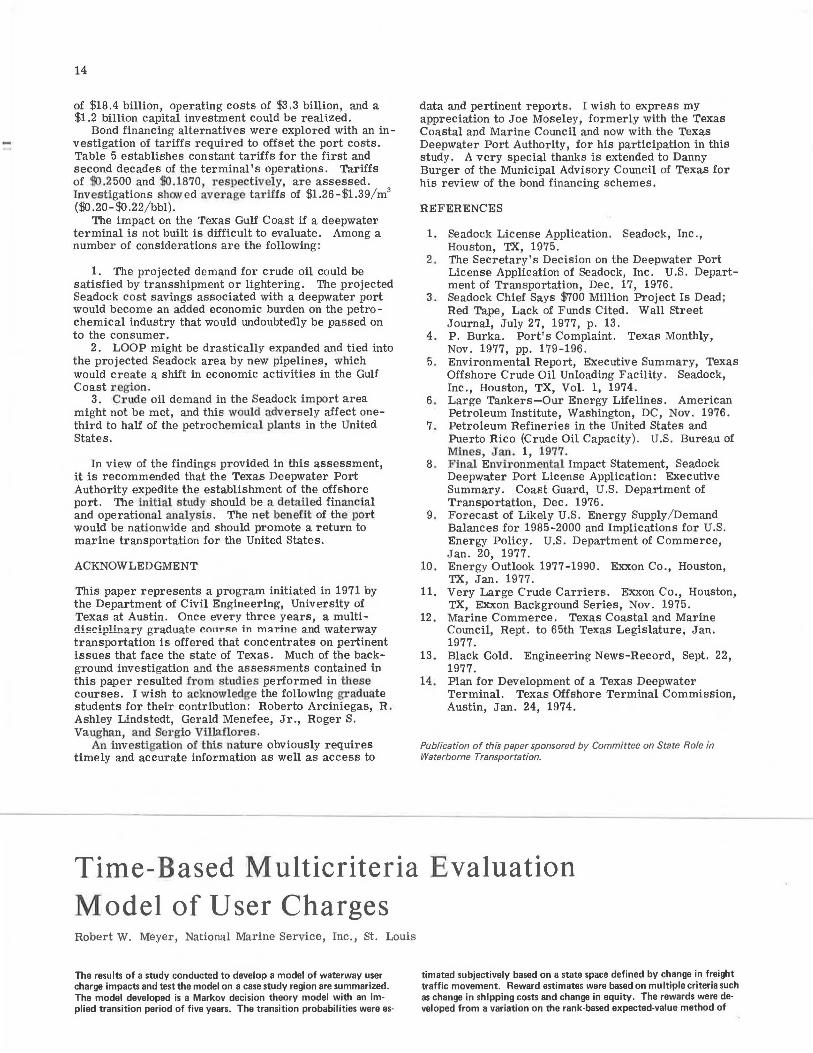
of $18.4 billion, operating costs of $3.3 billion, and a $1.2 billion capital investment could be realized.
Bond financing alternatives were explored with an investigation of tariffs required to offset the port costs. Table 5 establishes constant tariffs for the first and second decades of the terminal's operations. Tariffs of $!'0.2500 and !0.1870, respectively, are assessed. Investigations sho.ved average tariffs of $1.26-$1.39/m3
($0 .20-$0 .22/bbl). The impact on the Texas Gulf Coast if a deepwater
terminal is not built is difficult to evaluate. Among a number of considerations are the following:
1. The projected demand for crude oil could be satisfied by transshipment or lightering. The projected Seadock cost savings associated with a deepwater port would become an added economic burden on the petro -chemical industry that would undoubtedly be passed on to the consumer.
2. LOOP might be drastically expanded and tied into the projected Seadock area by new pipelines, which would create a shift in economic activities in the Gulf Coast region.
3. Crude oil demand in the Seadock import area might not be met, and this would adversely affect onethird to half of the petrochemical plants in the United States.
In view of the findings provided in this assessment, it is recommended that the Texas Deepwater Port Authority expedite the establishment of the offshore port. The initial study should be a detailed financial and operational analysis. The net benefit of the port would be nationwide and should promote a return to marine transportation for the United States.
ACKNOWLEDGMENT
This paper represents a program initiated in 1971 by the Department of Civil Engineering, University of Texas at Austin. Once every three years, a multidisciplinary graduate course in marine and waterway transportation is offered that concentrates on pertinent issues that face the state of Texas. Much of the background investigation and the assessments contained in this paper resulted from studies performed in these courses. I wish to acknowledge the following graduate students for their contribution: Roberto Arciniegas, R. Ashley Lindstedt, Gerald Menefee, Jr., Roger S. Vaughan, and Se1·gio Villaflo1·es.
An investigation of this nature obviously requires timely and accurate information as well as access to
data and pertinent reports. I wish to express my appreciation to Joe Moseley, formerly with the Texas Coastal and Marine Council and now with the Texas Deepwater Port Authority, for his participation in this study. A very special thanks is extended to Danny Burger of the Municipal Advisory Council of Texas for his review of the bond financing schemes.
REFERENCES
1. Seadock License Application. Seadock, Inc., Houston, TX, 1975.
2. The Secretary's Decision on the Deepwater Port License Application of Seadock, Inc. U.S. Department of Transportation, Dec. 17, 1976.
3. Seadock Chief Says $700 Million Project Is Dead; Red Tape, Lack of Funds Cited. Wall E'treet Journal, July 27, 1977, p. 13.
4. P. Burka. Port's Complaint. Texas Monthly, Nov. 1977, pp. 179-196.
5. Environmental Report, Executive Summary, Texas Offshore Crude Oil Unloading Facility. Seadock, Inc., Houston, TX, Vol. 1, 1974.
6. Large Tankers-Our Energy Lifelines. American Petroleum Institute, Washington, DC, Nov. 1976.
7. Petroleum Refineries in the United States and Puerto Rico (Crude Oil Capacity). U.S. Bureau of Mines, Jan. 1, 1977.
8. Final Environmental Impact Statement, Seadock Deepwater Port License Application: Executive Summary. Coast Guard, U.S. Department of Transportation, Dec. 1976.
9. Forecast of Likely U.S. Energy Supply/ Demand Balances for 1985-2000 and Implications for U.S. Energy Policy. U.S. Department of Commerce, Jan. 20, 1977.
10. Energy Outlook 1977-1990. Exxon Co., Houston, TX, Jan. 1977.
11. Very Large Crude Carriers. Exxon Co., Houston, TX, Exxon Background Series, Nov. 1975.
12. Marine Commerce. Texas Coastal and Marine Council, Rept. to 65th Texas Legislature, Jan. 1977.
13. Black Gold. Engineering News-Record, Sept. 22, 1977.
14. Plan for Development of a Texas Deepwater Terminal. Texas Offshore Terminal Commission, Austin, Jan. 24, 1974.
Publication of this paper sponsored by Committee on State Role in Waterborne Transportation.
Time-Based Multicriteria Evaluation Model of User Charges Robert W. Meyer, National l\lfarine Service, Inc., St. Louis
The results of a study conducted to develop a model of waterway user charge impacts and test the model on a case study region are summarized. The model developed is a Markov decision theory model with an implied transition period of five years. The transition probabilities were es-
timated subjectively based on a state space defined by change in freight traffic movement. Reward estimates were based on multiple criteria such as change in shipping costs and change in equity. The rewards were developed from a variation on the rank-based expected-value method of
evaluation. These were also produced subjectively based on the results of previous studies. The input on the upper Mississippi River case study site was processed by a Markov decision theory computer program. Considerable sensitivity analysis on rewards and transition probabilities was done. In the majority of cases, the alternative of no user charge was favored. In certain periods of high growth in freight traffic, a low-level fuel tax was favored. The case study results themselves are not as significant as the problem structuring that was accomplished and the introduction of time and nonmonetary criteria into the evaluation process.
A review of the history of transportation in the United States reveals that one of the distinguishing features crossing nearly all modes has been the need for government assistance in establishing and maintaining the transportation network. There has not been sufficient incentive in the private sector to build and maintain transportation facilities on a national scale. Reasons for this include the economies of scale necessary to make transportation facilities attractive to the private firm, the jointly reinforcing nature of the provision of transportation facilities and economic growth, and the usual lag between investment and profitability. These factors have joined to make transportation systems investments undesirable to the private firm, at least in the infancy of a mode.
A controversy that has existed in the freight transportation area for nearly 40 years is that of user charges for users of the inland waterway system. The controversy has been particularly strong in the past five years; legislation has been introduced in Congress to enable the recovery, by various means, of the federal investment in facilities as well as federal expenditures on operations and maintenance. Many studies have been done by various agencies and organizations on different aspects of user charges. This paper addresses the need for evaluation of longer-term and noneconomic impacts of inland waterway user charges. It focuses primarily on the development of a planning model that can be used to investigate various forms of user charges as they affect a transportation system and a national economy that demonstrate considerable uncertainty.
PROBLEM PARAMETERS
The development of a model of the effects on freight transportation caused by the imposition of various forms of waterway user charges requires model parameters that are broader than the inland waterway system itself. To model the public perspective adequately, the model must include the effects of policies on water, rail, truck, and pipeline transport. The geographic range of the model could be either the entire country or a major river basin. For planning purposes, the time horizon should be 10 or 20 years.
MARKOV DECISION THEORY
The case study model is the Markov decision theory model. It is similar in some respects to the dynamic programming model. The states are parametric descriptions of the system under study. There also exists the concept of a transition. The probability of going from state i to state j in one stage is called a transition proba -bility. A matrix of transition probabilities exists for each alternative solution for the system proposed by the analyst. The transition period may be 1 s or 10 years, depending on the system being modeled.
In a similar way, the reward to the decision maker for each possible transition is described in a matrix. For each alternative there exists a reward matrix. The Markov model solution is known as a policy vector. It arrays the optimal alternative to pursue contingent on
15
the present state of the system. There are several excellent sources on Markov decision theory and its applications (.!_-!).
CASE STUDY ANALYSIS
Study Area
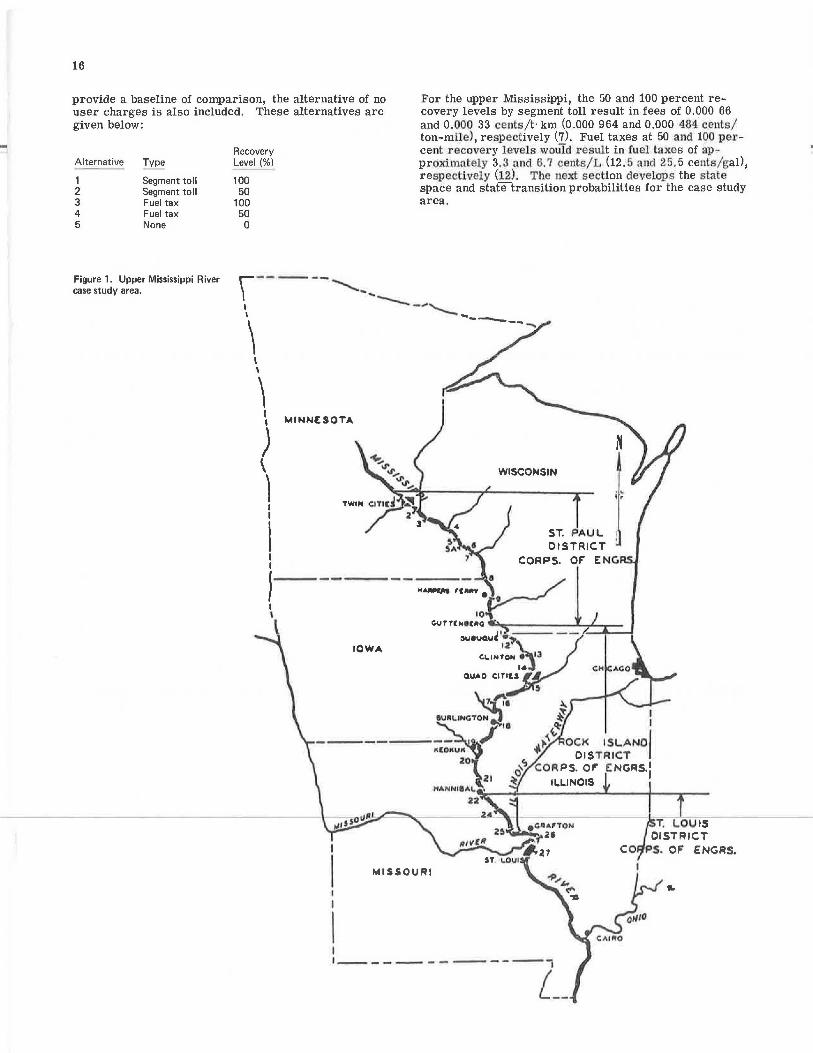
The area selected for case study analysis is the upper Mississippi River, which runs for 1375 km (852 miles ) from Minneapolis to Cairo, Illinois (at the mouth of the Ohio River) . Most of the 26 locks and dams on Ute reai::h between Minneapolis and St. Louis (see Figure 1) have a single lock champ er. Minimum channel depth is 2. 7 m (9 ft), and channel width is 91-106 m (300 - 350 ft).
The following data on freight transport on the upper Mississippi are taken from statistics of the American Waterways Operators, Inc. (5). The section of the upper Mississippi between Minneapo lis and St. Louis carried more than 57 million t (63 million tons) of cargo in 1975. Net tonnage on that same section of the upper Mississippi grew from nearly 23. 6 million t (26 million tons) in 1968 to more than 57 million tin 1975. The principal commodities carried in 1975 were grains and petroleum products, which constituted almost 62 percent of the tonnage. Towing industry costs on the upper Mississippi are estimated to be 1.85 mills/t •km (2. 7 mills/ton-mile). This is 0.3 mills more than costs on the lower Mississippi, principally because of delays caused by locking and the need to limit tows to 10 to 12 barges.
The upper Mississippi represents one link in the 40 300-km (2·5 000-mUe) iltland wate1·way system in the United States. It was selected as a basis for case study analysis of user charge policies for several reasons:
1. It has two major sections that have characteristics similar to those of most other inland waterways. The section above St. Louis has many locks and suffers from capacity problems at Locks and Dam 26. The section below St. Louis is free flowing and operates at relatively low cost.
2. The upper Mississippi handles a spectrum of commodities. The grain and petroleum commodities that are important on the upper Mississippi form a large percentage of all traffic on the inland waterways.
3. In terms of modal competition, there exists considerable parallel rail trackage with excess capacity (6).
4. Preliminary impact data for various user charge s chemes were available from the U.S. Department of Tra nsportation (DOT) (.:?.-~ and others (10,!!).
Alternatives for Case Study
This section presents the alternatives that were selected for analysis by the case study model. The two most commonly mentioned and studied forms of waterway user charges are the fuel tax and the segment toll. The lockage fee is commonly considered in conjunction with either of these . Studies by both DOT and CACI, Inc. (7, 12), consider systemwide fuel taxes and segment-spe cific ton-kilometer tolls in their analyses. The study by the Iowa DOT (10) deals with a combination fuel tax and lockage fee. Tile Tennessee study (11) considers a full range of lockage fees with and without congestion tolls, license fees, segment tolls, and fuel taxes.
Since the studies by the U.S. DOT and CACI develop preliminary levels of some impacts on the upper Mississippi case study area, it was decided to use both fuel taxes and segment tolls as alternatives. Further, to provide a range for each type of alternative, recovery levels of 50 and 100 percent of waterway operation, maintenance, and rehabilitation costs were chosen. To
16
provide a baseline of comparison, the alternative of no user charges is also included. These alternatives are given below:
Recovery Alternative Type Level(%)
1 Segment toll 100 2 Segment toll 50 3 Fuel tax 100 4 Fuel tax 50 5 None 0
For the upper Mississippi, the 50 and 100 percent recovery levels by segment toll result in fees of 0.000 66 and 0.000 33 cents/t· km (0.000 964 and 0.000 484 cents/ ton-mile) , respectively (7). Fuel taxes at 50 and 100 pe1·cent recovery levels woUld result in fuel taxes of approximately 3.3 and 6.7 cents/L (12. 5 a.nd 25.5 cents/gal), respectively (12). The next section develops the state space and statetransition probabilities for the case study area.
Figure 1. Upper Mississippi River r -- - -----.. case study area. ) -.....,..
I --._ _ _.'-._ \ -----~ \ \
\ \ MINNtSOTA
) \ ) I I
I I I
'
MISSOURI
I
ST. PAUL 1
DISTRICT ' CORPS. or ENC.
'----------j L __
~T. LOUIS
DISTRICT CO S. OF ENGAS.
1
State-Space Formulation
As discussed earlier, one of the central concepts of the Markov model is that of the states of the system. For the purposes of this case study, the states need to be able to reflect the behavior of the freight transportation system in response to various alternative user charge policies. The states should also portray realistic levels of change in the system over the transition period chosen. On this basis, the transition period was set at five years, and a single state parameter of change in freight traffic tonnage carried was chosen. This parameter is a good measure of the health of the freight system and the economic health of the nation as a whole. Freight traffic moves in response to manufacturing activity. Currently about half of the nation's gross national product (GNP) consists of goods (as opposed to services). GNP itself is perhaps the best known measure of national economic health. In this context, freight traffic is an excellent state parameter.
The definition of freight traffic is restricted here to rail and water. The various growth and decline rates were chosen to be reasonable for a five-year period. Between 1968 and 1973, waterway tonnage grew by roughly 5 percent (5). The five-year transition period represents a reasonable period for the perturbations caused by policy changes to settle out of the system. The states are given below:
Change in Freight Tonnage
State c...(o/c-'o) ____ _
1 0 2 +5 3 +10 4 -5 5 -10
The 5 and 10 percent rates of growth and decline provide a reasonable balance of possible freight system activity over a five-year period.
Estimation of Transition Probability
Given the system states defined above, the next task was to develop a logical and consistent process whereby the state transition probabilities PtJ could be estimated for each alternative. To provide some sensitivity analysis, two sets of transition probabilities were estimated for each alternative. The first set reflects general low economic growth for both the nation and the study area, and the second set assumes relatively high economic growth conditions. If they were related to the GNP, these statements would represent a 5 percent decline in real GNP for the low economic growth set and a 5 percent rise in real GNP for the second set of transition probabilities. The actual process of estimating the transition probabilities was subjective; quantitative and qualitative guidelines were applied that were consistent with underlying economic assumptions.
Transition Probabilities for Low Economic Growth
The basic assumption that underlay the estimation of the transition probabilities for conditions of low economic growth was that the system would tend to move toward a decline in freight traffic carried and that probabilities of moving toward an increase in freight traffic would be low. Another assumption relevant to the system is that the system tends to have an "inertia" that results in smaller probabilities for transitions that imply large changes in
17
traffic carried. A practical rule of implementation was that the combined probabilities of ending up in a state of no growth, low growth, or high growth (state 1, 2, or 3) did not exceed 0.45. The table below gives an example of this for low economic growth transition probabilities for alternative 1:
State
State 2 3 4 5
1 0.20 0.10 0.05 0.4 0.25 2 0.5 0.10 0.10 0.15 0.15 3 0.5 0.10 0.10 0.15 0.15 4 0.2 0.05 0.05 0.45 0.25 5 0.1 0.05 0.05 0.35 0.45
By summing the first three elements in each row, we obtain the probability of going to a period of equilibrium, low growth, or high growth. These sums range from 0.2 for starting in state 5 to 0.35 for starting in state 1. In moving from one alternative to the next, the assumption was that, the higher the effective user charge was, the higher shipping costs would become. Based on this, higher recovery rates resulted in less freight traffic and probabilities that increasingly leaned toward low decline and high decline (states 4 and 5) in cargo carried.
Transition Probabilities for High Economic Growth
Transition probabilities for high economic growth were estimated by using assumptions similar in concept but opposite in effect to those for the low economic growth transition probabilities. The combined probabilities of ending a transition in a state of no growth, low decline, or high decline (state 3, 4, or 5) were limited to 0.45. This works in a fashion similar to that of the example given earlier for transition probabilities of low growth. Again, since alternatives implied higher shipping costs, the probabilities of ending in a state of no growth, low decline, or high decline increased. The system inertia previously discussed was also assumed. These transition probabilities and the system rewards for the alternatives (developed below) are used to develop the case study results.
REWARD ESTIMATION
Overview
The general method of reward estimation is the technique of the rank-based expected value. It is particularly useful in evaluation situations in which multiple criteria are appropriate. It provides a way to combine criteria for different types, units, and levels of precision and thus produce relative scores for the alternatives evaluated. The application used here uses as alternatives the possible ending states given a particular starting state. These alternative ending states are rated on a fixed scale with regard to the specific criteria being considered. The relation to the other user charge alternatives is also considered.
Criteria
The criteria selected for the estimation of system rewards represent a broad range of national policy issues and attempt to capture the major potential impacts of alternative user charge policies. They have all been identified in other reports on user charges.
18
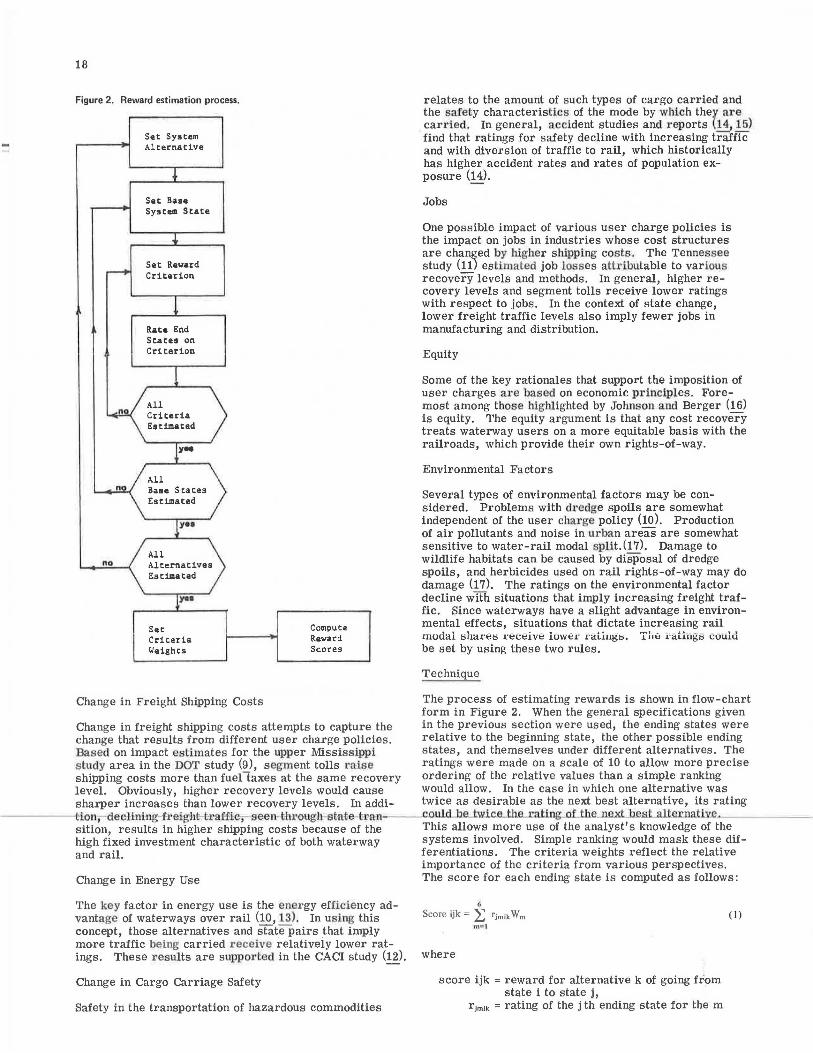
Figure 2. Reward estimation process.
no
Set System Alternative
Set Base System State
Set Reward Criterion
Rate End States on Criterion
All Criteria Estimated
All Base States Estimated
yH
All Alternatives Estimated
yH
Set Criteria Weights
Change in Freight Shipping Costs
Compute Reward Scores
Change in freight shipping costs attempts to capture the change that results from different user charg·e policies. Based on impact estimates for the upper Mississippi study area in the DOT study (9), s egment tolls raise shipping costs more than fuellaxes at the same recovery level. Obviously, higher recovery levels would cause sharper increases than lower recovery levels. In addition,-decMning-freigh t-rafH , seen-blu eug·h mte a•a·n sition, results in higher shipping costs because of the high fixed investment characteristic of both waterway and rail.
Change in Energy Use
The key factor in energy use is the energy effic iency advantage of waterways over rail (10, 13). In us ing this concept, those alternatives and statepairs that imply more traffic being carried receive relatively lower ratings. These r esults are suppor ted in the CACI study (12).
Change in Cargo Carriage Safety
Safety in the transportation of hazardous commodities
relates to the amount of such types of cargo carried and the safety characteristics of the mode by which they are carried. In general, accident studies and reports (14, 15) find that ratings for safety decline with increasing traffic and with diversion of traffic to rail, which historically has higher accident rates and rates of population exposure (14).
Jobs
One possible impact of various user charge policies is the impact on jobs in industries whose cost structures are changed by higher shipping cos ts . The Tennessee study (11) es timated job losses attl·ibutable to various recovery levels and methods. In general, higher recovery levels and segment tolls receive lower ratings with respect to jobs. In the context of state change, lower freight traffic levels also imply fewer jobs in manufacturing and distribution.
Equity
Some of the key rationales that support the imposition of user charges are based on economic p1·inciples. Foremost among those highlighted by Johnson and Berger (16) is equity. The equity argument is that any cost recovery treats waterway users on a more equitable basis with the railroads, which provide their own rights-of-way.
Environmental Factors
Several types of environmental factors may be considered. Problems with dredge spoils are somewhat independent of the user charge policy (10). Production of air pollutants and noise in urban areas are somewhat sensitive to water-rail modal split. (17). Damage to wildlife habitats can be caused by disposal of dredge spoils, and herbicides used on rail rights-of-way may do damage (17). The ratings on the environmental factor decline with situations that imply increasing freight traffic. Since waterways have a slight advantage in environmental effects, situations that dictate increasing rail modal shares receive lower ratings. The ratings could be set by using these two rules.
Technique
The process of estimating rewards is shown in flow-chart form in Figure 2. When the general specifications given in the previous section were used, the ending states were relative to the beginning state, the other possible ending states, and themselves under different alternatives. The ratings were made on a scale of 10 to allow more precise ordering of the relative values than a simple ranking would allow. In the case in which one alternative was twice as desirable as the next best alternative, its rating cou.l..cLbcLl:wi.c.e_the_xating_oLth.e.JteXLbes.Lalt.e.rnativ .. e,~--__ _ This allows more use of the analyst's knowledge of the systems involved. Simple ranking would mask these differentiations. The criteria weights reflect the relative importance of the criteria from various perspectives. The score for each ending state is computed as follows :
6 Score ijk = ~ fjmikWm
mwt
where
score ijk =reward for alternative k of going from state i to state j, ·
r;mik = rating of the j th ending state for the m
(!)
criterion beginning in state i for alternative k, and
W. = criterion weight for the m th criterion.
The weight is multiplied by the rating for each ending state a nd for each cr iterion. The scores are summed for each ending state. The score for ending state j associated with base state i and alternative k can be seen to be the r IJ element of the reward matrix for the k th alternative.
Results
The reward-estimation process described above was used to produce four sets of rewa1·d estimates. The difference was in the criteria weights used . In the first set of rewards, all criteria received equal weights. This functions as a baseline. The weights for alternative 1 are given in the table below:
State
State 2 3 4 5
1 4.17 3.83 3.83 4.0 4.0 2 3.83 3.83 3.67 3.33 3.67 3 4.0 3.5 3.5 2.83 3.17 4 4.67 3.5 3.17 3.5 3.5 5 4.83 3.17 3.0 4.0 2.83
The second set of reward estimates assumes a hierarchy of criteria weights. At the top, ener gy and safety each receive a weight of 0.25, which reflects their prominance as national issues. At the next tier, shipping costs , jobs, and environmental criteria receive weights of 0.15. Finally, equity i·eceives a weight of 0.05.
The third set of x·ewai·d estimates stresses a national economic policy emphasis on reducing inflationary pressures and unemployment. Shipping cost and jobs criteria receive weights of 0.25, equity receives a weight of 0.05, and all other criteria receive weights of 0.15.
The final set of reward estimates reflects a policy emphasis on equity and envir onmental concerns which get weights of 0.25 each. These have at times been dominant national policies. Shipping cos t r eceives a weight of 0.05. All other criteria receive weights of 0.15.
Results of Application of Markov Model
The alternatives, transition probabilities, and rewards are now brought together in the Markov model analysis of user charge policies for the upper Mississippi case study area. The various analysis runs, their results, and the significance of the results are discussed.
Analysis of Problem Combinations
Earlier, two sets of transition probabilities were de veloped to represent s cenarios for low and high economic growth for the s tudy a rea. In addition, fou r sets of r ewards wer e estimated under differ ent weighting schemes for the reward criteria. Bringing these toget her r esults in eight possible combinations of transition probabilities and reward estima tes. A summary of these combinations is given below:
Transition Probability
Low economic growth Low economic growth High economic growth High economic growth Low economic growth Low economic growth High economic growth High economic growth
Reward Estimate
Uniform criteria weights Emphasis on energy and safety Uniform criteria weights Emphasis on energy and safety Emphasis on equity and environment Emphasis on shipping cost and jobs Emphasis on equity and environment Emphasis on shipping cost and jobs
19
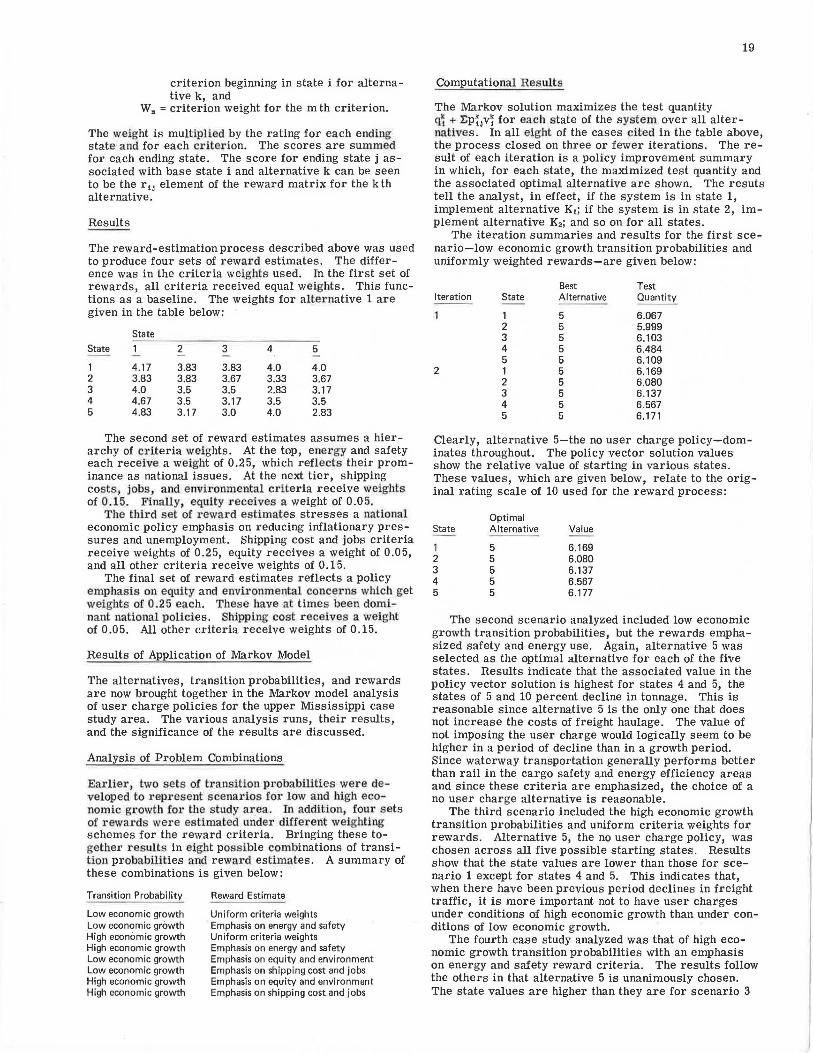
Computational Results
The Markov solution maximizes the test quantity q~ + I:p~Jv~ for each state of the system over all alternative s. In all eight of the cases cited in the table above, the process closed on three or fewer iterations. The result of each iteration is a policy improvement summary in which, for each state, the maximized test quantity and the associated optimal alternative are shown. The resuts tell the analyst, in effect, if the system is in state 1, implement alternative K1; if the system is in state 2, implement alternative K2; and so on for all states.
The iteration summaries and results for the first scenario-low economic growth transition probabilities and uniformly weighted rewards-are given below:
Best Test Iteration State Alternative Quantity
1 5 6.067 2 5 5.999 3 5 6.103 4 5 6.484 5 5 6.109
2 1 5 6.169 2 5 6.080 3 5 6.137 4 5 6.567 5 5 6.171
Clearly, alternative 5-the no user charge policy-dominates throughout. The policy vector solution values show the relative value of starting in various states. These values, which are given below, relate to the original rating scale of 10 used for the reward process:
Optimal State Alternative Value
1 5 6.169 2 5 6.080 3 5 6.137 4 5 6.567 5 5 6.177
The second scenario analyzed included low economic growth transition probabilities, but the rewards emphasized safety and energy use. Again, alternative 5 was selected as the optimal alternative for each of the five states . Results indicate that the associated value in the policy vector solution is highest for states 4 and 5, the states of 5 and 10 percent decline in tonnage. This is reasonable since alternative 5 is the only one that does not increase the costs of freight haulage. The value of not imposing the user charge would logically seem to be higher in a period of decline than in a growth period. Since waterway transportation generally performs better than rail in the cargo safety and energy efficiency areas and since these criteria are emphasized, the choice of a no user charge alternative is reasonable.
The third scenario included the high economic growth transition probabilities and uniform criteria weights for rewards. Alternative 5, the no user charge policy, was chosen across all five possible starting states. Results show that the state values are lower than those for scenario 1 except for states 4 and 5. This indicates that, when there have been previous period declines in freight traffic, it is more important not to have user charges under conditions of high economic growth than under conditions of low economic growth.
The fourth case study analyzed was that of high economic growth transition probabilities with an emphasis on energy and safety reward criteria. The results follow the others in that alternative 5 is unanimously chosen. The state values are higher than they are for scenario 3
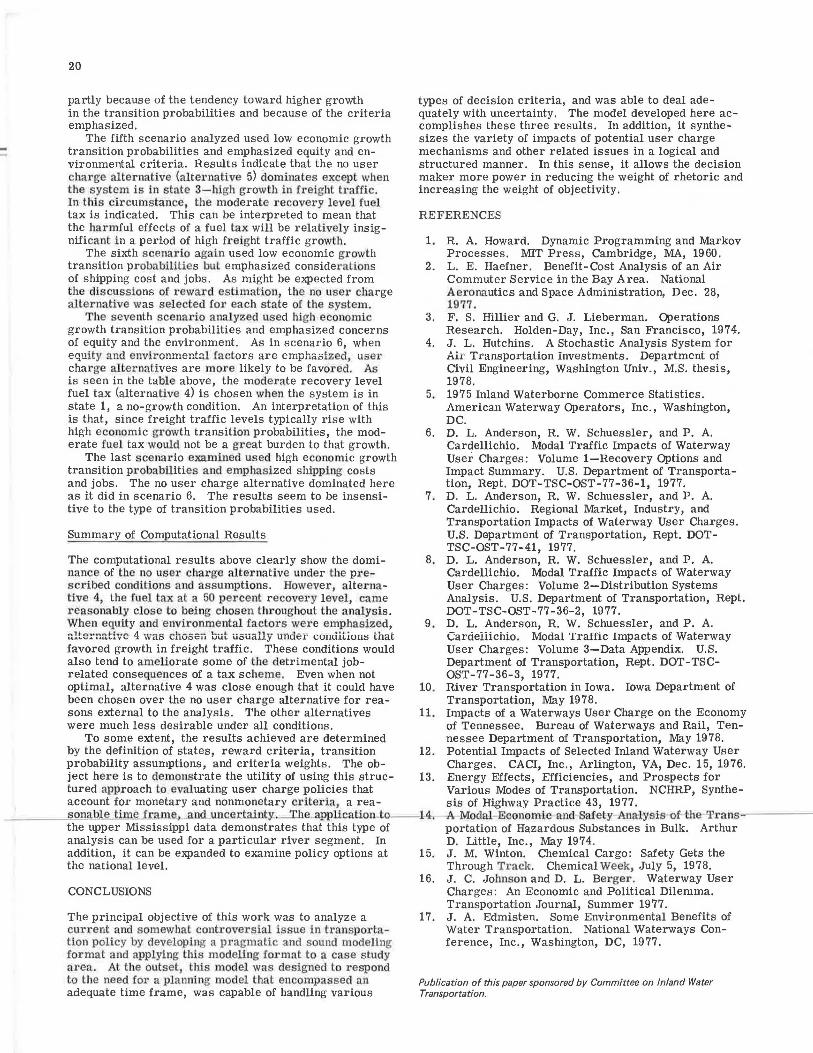
20
partly because of the tendency toward higher growth in the transition probabilities and because of the criteria emphasized.
The fifth scenario analyzed used low economic growth transition probabilities and emphasized equity and environmental criteria. Results indicate that the no user charge a1terna.tive (alternative 5) dominates except when the system is in state 3-high growth in freight traffic. In this circumstance, the moderate recove1·y level f uel tax is indicated. This can be interpreted to mean that the harmful effects of a fuel tax will be relatively insignificant in a period of high freight traffic growth.
The sixth scenario again used low economic growth transition probabilities bul emphasized conside1·alions of shipping cost and jobs. As might be expected from the dis cussions of reward estimation, the no user charge alternative was selected £01• each state of the system.
The seventh scenario analyzed used high eco1}omic growth transition probabilities and emphasized concerns of equity and the environment. As in scenario 6, when equity and environmental factors are emphasized, user charge alternatives are more likely to be favored. As is seen in the table above, the moderate recovery level fuel tax (alternative 4) is chosen when the system is in state 1, a no-growth condition. An interpretation of this is that, since freight traffic levels typically rise with high economic gi:owth transition probabilities, the moderate fuel tax would not be a great burden to that growth.
The last scenario examined used high economic growth transition probabilities and emphasized shipping costs and jobs. The no user charge alternative dominated here as it did in scenario 6. The results seem to be insensitive to the type of transition probabilities used.
Summary of Computational Results
The computational results above clearly show the dominance of the no use1· charge alternative under the pres cribed conditions and assumptions. However, alterna-tive 4, the fuel tax at a 50 percent r ecovery level, came reasonably close to being chosen throughout the analysis. When equity and environmental factors we1·e emphasized, n.lterr:.atiyc 4 ·was chose·n but usually under coiu..iltlon8 that favored growth in freight traffic. These conditions would also tend to ameliorate some of the detrimental job-related consequences of a tax scheme. Even when not optimal, alternative 4 was close enough that it could have been chosen over the no user charge alternative for reasons external to the analysis. The other alternatives were much less desirable under all conditions.
To some extent, the results achieved are determined by the definition of states, reward criteria, transition probability assumptions, and criteria weights. The object here is to demonstrate the utility of using this structured approach to evaluating user charge policies that account for monetary and nonmonetary criteria, a rea -
types of decision criteria, and was able to deal adequately with uncertainty. The model developed here accomplishes these three results. In addition, it synthesizes the variety of impacts of potential user charge mechanisms and other related issues in a logical and structured manner. In this sense, it allows the decision maker more power in reducing the weight of rhetoric and increasing the weight of objectivity.
REFERENCES
1. R. A. Howard. Dynamic Programming and Markov Processes. MIT Press, Cambridge, MA, 1960.
2. L. E. Haefner. Benefit-Cost Analysis of an Air Commuter Service in the Bay Area. National Aeronautics and Space Administration, Dec. 28, 1977.
3. F. S. Hillier and G. J. Lieberman. Operations Research. Holden-Day, Inc., San Francisco, 1974.
4. J. L. Hutchins. A Stochastic Analysis System for Air Transportation Investments. Department of Civil Engineering, Washington Univ., M.S. thesis, 1978.
5. 1975 Inland Waterborne Commerce Statistics. American Waterway Operators, Inc., Washington, DC.
6. D. L. Anderson, R. W. Schuessler, and P. A. Cardellichio. Modal Traffic Impacts of Waterway User Charges: Volume 1-Recovery Options and Impact Summary. U.S. Department of Transportation, Rept. DOT-TSC-OST-77-36-1, 1977.
7. D. L. Anderson, R. W. Schuessler, and P. A. Cardellichio. Regional Market, Industry, and Transportation Impacts of_ Waterway User Charges. U.S. Department of Transportation, Rept. DOTTSC-OST-77-41, 1977.
8, D. L. Anderson, R. W. Schuessler, and P. A. Cardellichio. Modal Traffic Impacts of Waterway User Charges: Volume 2-Distribution Systems Analysis. U.S. Department of Transportation, Rept. DOT-TSC-OST-77-36-2, 1977.
9. D. L. Anderson, R. W. Schuessler, and P. A.
10.
11.
12.
13.
Cardeiiichio. Modal Traffic Impacts of Waterway User Charges: Volume 3-Data Appendix. U.S. Department of Transportation, Rept. DOT-TSC-OST-77-36-3, 1977. River Transportation in Iowa. Iowa Department of Transportation, May 1978. Impacts of a Waterways User Charge on the Economy of Tennessee. Bureau of Waterways and Rail, Tennessee Department of Transportation, May 1978. Potential Impacts of Selected Inland Waterway User Charges. CACI, Inc., Arlington, VA, Dec. 15, 1976. Energy Effects, Efficiencies, and Prospects for Various Modes of Transportation. NCHRP, Synthesis of Highway Practice 43, 1977.
----""s=o11aj;>J..~_Ji..1Jl!Lf.r_alne ,~an!Luncertainty.. ~le_a_pplication -to--14. the upper Mississippi data demonstrates that this type of analysis can be used for a particular river segment. In addition, it can be expanded to examine policy options at 15.
A Moaal-Eeonomic-and-Saf-et-y-Ana:lysis-of the..lf1•ans - ----portation of Hazardous Substances in Bulk. Arthur D. Little, Inc., May 1974. J. M. Winton. Chemical Cargo: Safety Gets the Through Track. Chemical Week, July 5, 1978. the national level.
CONCLUSIONS
The principal objective of this work was to analyze a current and somewhat cont1·oversial issue in ti·ansportation policy by developing a pragmatic ancl sound modeling format and applying this modeling format to a case study area. At the outset, this model was designed to respond to the need for a planning model that encompassed an adequate time frame, was capable of handling various
16.
17.
J. C. Johns on and D. L. Berger . Waterway User Charges: An Economic and Political Dilemma. Transportation Journal, Summer 1977. J. A. Edmisten. Some Environmental Benefits of Water Transportation. National Waterways Con-ference, Inc., Washington, DC, 1977.
Publication of this paper sponsored by Committee on Inland Water Transportation.