Embed Size (px)
Citation preview

A Multi-Stage Impact Assessment Method for Freight Transport Management Measures The Example of Vietnamese Rice Production and Logistics
Nguyen Thi Binh, MBA
from Hanoi, Vietnam
D17 Darmstadt 2017
A dissertation approved in fulfilment of the requirements for the Degree of Doctor of Political
Science (Dr. rer. pol.) of the Department of Civil and Environmental Engineering, Technische
Universität Darmstadt.
Supervisor: Prof. Dr.-Ing. Manfred Boltze
Co-supervisor: Prof. Dr. Hanno Friedrich
Date of submission: 15.06.2016 Date of oral examination: 18.10.2016
Fachgebiet
Verkehrsplanung und
Verkehrstechnik
Chair of Transport
Planning and Traffic
Engineering
Prof. Dr.-Ing.
Manfred Boltze

Herausgeber:
Technische Universität Darmstadt
Fachgebiet Verkehrsplanung und Verkehrstechnik
Otto-Berndt-Str. 2
64287 Darmstadt
www.tu-darmstadt.de/verkehr
Schriftenreihe des Instituts für Verkehr Fachgebiet Verkehrsplanung und Verkehrstechnik
Heft V 36
ISSN 1613-8317
Darmstadt 2017

Acknowledgement
This dissertation could not have been completed without the generous and valuable support
of several people and organizations. My sincere thanks is directed to all directly and indirectly
involved.
First and foremost, I would like to acknowledge and thank the partnership program between
Darmstadt University of Technology of Germany (TUD), and Vietnamese-German University
of Vietnam (VGU). Through this partnership, I have had the chance to make my dream come
true with the completion of my doctoral research.
I would like to express my deepest gratitude and admiration to my supervisor, Professor Dr.-
Ing. Manfred Boltze. During a hard and long period of studying, I have been closely super-
vised and encouraged by both his critical comments and warm motivation. I could not have
completed this study without his devoted and valuable guidance, instruction and advice. I
must also thank my co-supervisor, Prof. Dr. Hanno Friedrich. He was very patient, spending
long hours discussing and working with me. Without his understanding and tolerance, I could
not have finished writing this thesis.
My further thanks go to my former manager, Dr. Khuat Viet Hung, who is currently the Vice
Chairman of the National Traffic Safety Committee of Vietnam. He was the first to encourage
me to pursue doctoral level studies. Without the recommendation of Dr. Khuat Viet Hung, I
would not have had the chance to study at the Vietnamese-German Transport Research Cen-
tre (VGTRC).
Special thanks also go to my manager, Dr. Vu Anh Tuan for his unconditional support in ar-
ranging various in-house seminars through VGTRC. These seminars have provided many
thoughtful recommendations and inspiring discussions on my work.
For the completion of this dissertation, I urgently need to thank Ms. Lily Kentmann-a senior
teacher of British Council Vietnam and Dr.-Ing. Tran Ngoc Linh from TU Darmstadt for their
help in difficult times of my research.
I was lucky to have very nice colleagues from VGTRC. I would like to take this opportunity to
thank my colleagues, Dr. Chu Cong Minh, Dr. An Minh Ngoc, Vu Anh Tuan, Huynh Duc Ngu-
yen, Nguyen Thi Cam Van, Tran Quang Vuong, Truong Thi My Thanh for their listening and
giving me sincere advice on my research work. I will never forget the good times we had to-
gether at VGTRC.
During my staying at TUD, I have had the opportunity to work with colleagues from the Chair
of Transport Planning and Traffic Engineering. I would like to express my thanks to my col-
leagues, Leif Fornauf, Stefan Groer, Jessica Balluff, Frederik Rühl, Moritz von Mörner, Marc
Lüke, Wei Jiang, Danny Wauri, Karin Menges, Ole Ottemöller, Andreas Balster, Kevin Rolko,
and Gillich Kim for their strong support in a number of ways.
I wish to thank also my colleagues at the University of Transport and Communication, Hanoi,
Professor Nguyen Van Thu, Dr. Dinh Thi Thanh Binh, Le Thu Huyen, Tran Thi Thao, Nguyen
Thanh Tu, Nguyen Van Truong, and Vu Kim Hung for providing me friendly assistance.
I would also like to convey my heartfelt thanks to Mr Le Minh Truong - Vice Director of Vi-
etnam Southern Food Corporation, who generously supported me in data collection processes,

in which he gave me valuable suggestions and access to large volumes of reliable data. My
appreciation is also extended to the many food companies and Departments of Transport in
the Mekong Delta for their kind cooperation and help with my data collection.
Last, but definitely not least, I thank all of my family for their continuous and unconditional
support. Following our Vietnamese tradition, I would like to first extend my deep gratitude to
my parents for their love and encouragement to pursue my interests. I do not have words to
express the gratitude to my mother in-law for her great devotion to my children while I was
away from home. From the bottom of my heart, many thanks are given to my husband and
my children for their patience and selflessness regarding my research work. I have the great-
est happiness when they are by my side.
A Multi-Stage Impact Assessment Method for Freight Transport Management Measures
Abstract
The concept of freight transport management (FTM) is perceived as an aspect of traffic man-
agement that has a significant influence on freight transport. A review of relevant literature
gives descriptions of numerous FTM measures. Multi-dimensional approaches to optimize
freight transport, production and logistics processes should be considered when assessing the
impacts of FTM measures. The assessment method utilised during the planning process stages
for estimating these impacts should be based on the type of measures being reviewed, and on
the sector under consideration. In addition, for efficiency reasons, it is not appropriate to car-
ry out impact assessments of all measures or to select only one single method for all circum-
stances. Therefore, a multi-stage assessment method is necessary for first assessment and clas-
sification, and then a detailed quantitative analysis of the selected measures only needs to oc-
cur. With this approach, the risk associated with limitations of individual measures is mitigat-
ed in initial pre-selection stages and efficiency is improved, as a thorough and detailed impact
assessment of the core effects of measures shortlisted in the classification stage are examined.
The objective of this study is to develop a method to investigate and assess the impacts of
FTM measures on production, logistics and traffic. In this study, firstly, a framework for FTM
is discussed to provide a theoretical foundation for this study as a whole. It includes freight
transport system analysis, an overview of the FTM concept, and a summary of FTM measures
identified in various case studies. Secondly, a multi-stage impact assessment method for FTM
measures is developed, which enables quick classification of adopted measures, and detailed
quantitative impact analysis. Explanation of the development process starts with a review of
the overall transport decision-making process in general and the impact assessment methods
for FTM measures in particular. The discussion of pros and cons of existing assessment meth-
ods is brought into focus. Subsequently, a multi-stage impact assessment method for FTM
measures is developed by which the core effects of the measures can be effectively estimated
and captured. The proposed method is composed of two main stages. The first stage serves as
a pre-selection of measures with a focus on defining and classifying the measures based on
qualitative or partly-quantitative methods. The second stage investigates the core effects of se-
lected measures using quantitative methods to carry out detailed analysis.
The rice industry in Vietnam was selected to be a case study for this application since data is
available to test various kinds of impacts caused by FTM measures. Additionally, there is a
high level of freight traffic with a bundle of FTM measures applied in the rice industry. Traffic
volume due to rice transport is increasing quickly and contributes up to 21% of the total
freight traffic volume on some key transport corridors, for example from the Mekong Delta to
Ho Chi Minh City (HCMC). Vietnam is also currently the second largest rice exporter in the
world. The rice industry involves various stakeholders such as farmers, collectors, millers, pol-
ishers, food companies, wholesalers, retailers and so forth, and knowledge of the decision-
making behaviour of those stakeholders is needed to predict their reactions to FTM measures.
The results of the first assessment stage in the rice industry show that high ratings have been
given to two FTM measures: the establishment of a regional rice logistics centre and the im-
provement of national highway (NH) 1A from the Mekong Delta to HCMC. The second as-
sessment stage is a detailed impact assessment of pre-selected measures based on a detailed

A Multi-Stage Impact Assessment Method for Freight Transport Management Measures
and comprehensive sector analysis. In this stage, quantitative assessment is carried out to de-
termine impacts related to changes in the supply chain, and impacts on transport mode choic-
es in the rice industry. A total logistics cost (TLC) model serves as the core tool for analysis of
the rice industry, differentiating a disaggregated population of rice commodity flows and dis-
tribution centre locations. Final assessment results show that an establishment of a regional
rice logistics centre can result in a modal shift away from trucks and this is contributing to
improved traffic safety and the quality of the environment in affected areas. The improvement
of NH 1A is expected to increase average speeds and reduce freight transport time from the
Mekong Delta to HCMC. Combining the measures of rice logistics centre establishment and
NH 1A improvement can maximise economic efficiency through significant reduction in TLC
for the rice industry. Safety and environmental benefits can also be achieved at the rice indus-
try and transport network level.
In summary, with a multi-stage impact assessment approach it has been demonstrated that it
is possible to investigate and assess the impacts of FTM measures on production and logistics.
Also, the proposed method in this study emphasises the involvement of multiple stakeholders
in the assessment process, and allows for capturing and estimating the core effects of these
measures. As noted above, the TLC model is utilised to assess the impacts of FTM measures
and the application of the TLC model, as in this study, can be seen as one of the key methods
in assessing FTM measure impacts that is based on comprehensive sector analysis. The study
is expected to be of value for governmental and local transport authorities in providing suita-
ble methods for assessing FTM policies.
Although the study has achieved its goal, there are some inevitable limitations. Firstly, de-
tailed quantitative impact assessment can only take place when extensive data is available,
which may hinder the application of the proposed method in practice. Secondly, the applica-
tion of the method developed in this study focuses on the Vietnamese rice industry and the
specific constraints and demands of freight transport management in this context. Therefore,
it should be applied to other sectors to determine further the potential generalization of find-
ings in other contexts. Lastly, the study addresses a new and complex field of research in its
focus on impact assessment methods for FTM measures. However, this field continues to re-
ceive less attention than passenger transport due to the complex characteristics of freight
transport systems. This study is expected to contribute to enriching the theoretical and empir-
ical understanding of FTM measures and their effective management.

A Multi-Stage Impact Assessment Method for Freight Transport Management Measures
Zusammenfassung
Das Konzept des Güterverkehrsmanagements, im Englischen „Freight Transport Management“
(FTM), wird als ein Aspekt des Verkehrsmanagements betrachtet, das einen signifikanten Ein-
fluss auf den gesamten Güterverkehr nimmt. Eine Übersicht relevanter Literatur gibt Be-
schreibungen zahlreicher FTM-Maßnahmen wieder. Multidimensionale Ansätze zur Optimie-
rung des Gütertransports, der Produktions- und Logistikprozesse müssen bei der Bewertung
der Auswirkungen solcher Steuerungsmaßnahmen berücksichtigt werden. Die in den einzel-
nen Stufen des Planungsprozesses angewandte Bewertungsmethode zur Einschätzung solcher
Einflüsse sollte auf geprüften Maßnahmen und dem betrachteten Sektor basieren. Aus Effizi-
enzgründen ist es zudem nicht angemessen, Wirkungsanalysen aller Maßnahmen durchzufüh-
ren oder nur eine einzelne Methode auf alle möglichen Bedingungen anzuwenden. Dazu ist
ein mehrstufiges Verfahren zur Klassifikationsbewertung notwendig. Danach muss nur noch
eine detaillierte quantitative Analyse ausgewählter Maßnahmen erfolgen. Mit diesem Ansatz
wird das mit den Einschränkungen von Individualmaßnahmen verbundene Risiko bereits in
den Anfangsphasen der Vorauswahl gemildert und damit die Effizienz gesteigert. Dies wird
durch eine sorgfältige und detaillierte Wirkungsanalyse der Kerneffekte der in der Klassifika-
tionsstufe bestimmten näheren Auswahl von Maßnahmen ermöglicht.
Das Ziel dieser Studie ist die Entwicklung einer Methode, um die Wirkung von FTM-
Maßnahmen auf Produktion und Logistik zu untersuchen. In dieser Studie werden zunächst
die Rahmenbedingungen für Güterverkehrsmanagement diskutiert, um ihr eine theoretische
Grundlage voranzustellen. Sie beinhaltet eine Güterverkehrssystemanalyse, einen Überblick
über das FTM-Konzept und eine Zusammenfassung von FTM-Maßnahmen, die in zahlreichen
Fallstudien identifiziert wurden. Daran anschließend wird eine mehrstufige Methode zur Wir-
kungsanalyse für FTM-Maßnahmen entwickelt, die eine schnelle Klassifikation der übernom-
menen Maßnahmen sowie eine detaillierte quantitative Wirkungsanalyse ermöglichen. Die Er-
läuterung des Entwicklungsprozesses beginnt mit einer Übersicht über den grundlegenden
Entscheidungsprozess im Transportwesen und die Methoden zur Wirkungsanalyse für FTM-
Maßnahmen. Die Diskussion um das Pro und Kontra bestehender Bewertungsmethoden wird
ebenso aufgegriffen. Daran anschließend wird eine mehrstufige Methode zur Wirkungsanaly-
se von FTM-Maßnahmen entwickelt, die als Grundlage dient, um Kerneffekte dieser Maß-
nahmen effektiv einzuschätzen und festzuhalten. Die vorgeschlagene Methode besteht aus
zwei Stufen. Die erste Stufe dient der Vorauswahl der Methoden zur Definition und Klassifika-
tion der auf qualitativen oder zum Teil quantitativen Methoden basierenden Maßnahmen. Die
zweite Stufe untersucht die Kerneffekte ausgewählter Maßnahmen unter Einbeziehung quan-
titativer Methoden, um eine detaillierte Analyse durchzuführen.
Die vietnamesische Reisindustrie diente als Fallbeispiel für diese Studie, da genügend Daten
verfügbar sind, um verschiedene Wirkungsarten von FTM-Maßnahmen zu testen. Zusätzlich
findet in der Reisindustrie eine hohe Güterverkehrsauslastung, gebündelt mit FTM-
Maßnahmen Anwendung. Das durch den Reistransport rapide anwachsende Verkehrsvolumen
trägt rund 21% des Güterverkehrsgesamtvolumens in bestimmten Verkehrskorridoren, bei-
spielsweise aus dem Mekong Delta nach Ho Chi Minh City (HCMC). Vietnam ist gegenwärtig
der zweitgrößte Reisexporteur weltweit. Die Reisindustrie schließt zahlreiche Stakeholder,
wie zum Beispiel den Farmer und den Aufkäufer, Müller, Polierer, Lebensmittelunternehmen,
Großhandelsunternehmen, Einzelhandel usw. mit ein. Es ist unbedingt erforderlich, das Ent-
scheidungsverhalten dieser Stakeholder zu kennen, um ihre Reaktionen hinsichtlich entspre-
chender FTM-Maßnahmen abschätzen zu können.

A Multi-Stage Impact Assessment Method for Freight Transport Management Measures
Die Resultate der ersten Bewertungsphase in der Reisindustrie zeigen, dass zwei FTM-
Maßnahmen hohe Bewertungen erhielten: der Aufbau eines Reis-Logistikzentrums und die
Verbesserung der Bundesstraße (National Highway) 1A, die das Mekong Delta mit Ho Chi
Minh City verbindet. Die zweite Bewertungsstufe ist eine detaillierte Wirkungsanalyse ausge-
wählter Maßnahmen, basierend auf einer detaillierten und umfassenden Sektoranalyse. In
dieser Stufe wird die quantitative Bewertung durchgeführt, um die Auswirkungen im Hinblick
auf Veränderungen in der Lieferkette und Auswirkungen auf die Wahl der Transportart in der
Reisindustrie zu bestimmen. Ein Logistik-Gesamtkostenmodell, im Englischen „total logistic
cost“ (TLC) model, dient als zentrales Instrument für die Analyse der Reisindustrie, das eine
disaggregierter Population von Handelsströmen und Standorten von Distributionszentren dif-
ferenziert. Die abschließenden Bewertungsergebnisse zeigen, dass der Aufbau eines Reis-
Logistikzentrums zu einer modalen Verlagerung, weg von Kraftfahrzeugen, und damit zu ei-
ner Verbesserung der Verkehrssicherheit und der Umweltqualität in betroffenen Gebieten
führt. Die Verbesserung der Bundesstraße 1A soll erwartungsgemäß die Durchschnittsge-
schwindigkeit erhöhen und damit die Gütertransportdauer vom Mekong Delta nach Ho Chi
Minh City reduzieren. Die Kombination von Maßnahmen zum Aufbau von Reis-
Logistikzentren und der Verbesserung der Bundesstraße 1A kann durch eine signifikante TLC-
Reduktion die ökonomische Effizienz erheblich maximieren. Erhöhte Sicherheit sowie Um-
weltvorteile können dadurch ebenso in der gesamten Reisindustrie und dem Transportnetz-
werk entstehen.
Zusammenfassend wurde mit einem mehrstufigen Wirkungsanalyseansatz demonstriert, dass
es möglich ist, den Einfluss von FTM-Maßnahmen auf die Bereiche Produktion und Logistik
anzuwenden. Die in der Studie vorgeschlagene Methode betont zudem die Beteiligung zahl-
reicher Stakeholder an dem Bewertungsprozess und ermöglicht damit das Festhalten und die
Bewertung der Kerneffekte dieser Maßnahmen. Wie oben erwähnt wird das TLC-Model ver-
wendet, um die Einflüsse von FTM-Maßnahmen abzuschätzen. Basierend auf einer umfassen-
den Sektoranalyse, kann das in dieser Studie verwendete TLC Modell, als eine der Kernme-
thoden zur Bewertung der Auswirkungen von FTM-Maßnahmen betrachtet werden. Die Stu-
die soll von großer Bedeutung für die Regierung und die lokalen Verkehrsbehörden haben,
indem sie passende Methoden für die Erfassung von FTM-Richtlinien bereitstellt.
Obwohl die Studie ihr Ziel erreicht hat, so gibt es dennoch unvermeidbare Einschränkungen.
Zunächst einmal kann eine detaillierte quantitative Bewertung der Auswirkungen nur dann
stattfinden, wenn umfassende Daten zur Verfügung stehen. Dies kann die Anwendung der
vorgeschlagenen Methode in der Praxis behindern. Zweitens, bezieht sich die Anwendung der
in dieser Studie entwickelten Methode auf die vietnamesische Reisindustrie sowie deren spezi-
fischen Hürden und den FTM-Bedarf in diesem Bereich. Deshalb sollte die Methode auch auf
andere Sektoren angewandt werden, um eine potentielle Generalisierung der Forschungser-
gebnisse in weiteren Kontexten zu bestimmen. Schlussendlich greift die Studie in ihrem Fokus
auf Bewertungsmethoden für FTM-Maßnahmen ein neues und komplexes Studienfeld auf.
Nichtsdestotrotz erhält dieser Forschungsbereich aufgrund seiner hohen Komplexität nach-
wievor weithin weniger Aufmerksamkeit als der Personentransport. Die Studie soll dazu bei-
tragen, das theoretische und empirische Verständnis des gesamten Themenfeldes „FTM- Maß-
nahmen“ und dessen effizientes Management zu bereichern.
A Multi-Stage Impact Assessment Method for Freight Transport Management Measures
Table of Contents
1 Introduction 1
1.1 Background and motivation 1
1.2 Research questions 2
1.3 Goal and objectives 2
1.4 Methodology 2
1.5 Structure of the Study 4
2 Freight Transport Management Framework 6
2.1. Systematic analysis of the freight transport 6
2.1.1. Stakeholders 6
2.1.2. Stakeholder Objectives 7
2.1.3. Freight transport supply 9
2.1.4. Freight transport demand 9
2.2. Freight transport management measures - Concepts and classifications 10
2.2.1. Basic concepts 10
2.2.2. Classification 11
2.3. Compilation of FTM measures 12
2.4. Conclusions 23
3 Development of a Multi-Stage Impact Assessment Method for Freight Transport Management Measures 25
3.1 Overall transport decision-making and impact assessment process 25
3.1.1 Transport decision-making 25
3.1.2 Objectives setup 26
3.1.3 Impact categories and types 27
3.1.4 Assessment criteria and performance indicators 29
3.2 Requirements and criteria for the selection of the assessment method 33
3.3 Review of impact assessment methods for FTM measures 35
3.3.1 Qualitative methods 36
3.3.2 Partly-quantitative methods 38
3.3.3 Quantitative methods 42
3.3.4 Conclusions 48
3.4 Discussion of existing methods 48
3.5 Developing a multi-stage impact assessment method for FTM measure 55
3.6 Conclusions 61
4 Analysis of the Rice Industry in the Mekong Delta of Vietnam 62
4.1 Overview of the rice industry in the Mekong Delta 62
4.1.1 Introduction to the Mekong Delta 62
4.1.2 The role of the rice industry 65

A Multi-Stage Impact Assessment Method for Freight Transport Management Measures
4.1.3 Rice growing seasons 66
4.2 Rice supply chain 67
4.2.1 Overview of the rice supply chain 67
4.2.2 Transport modes 69
4.2.3 Transport routes 70
4.3 Logistics 72
4.3.1 Costs 72
4.3.2 Lead-time 74
4.4 Safety and environmental issues 74
4.5 Conclusions 76
5 Application of Multi-Stage Impact Assessment for FTM Measures 78
5.1 Definition of FTM measures in the rice industry 78
5.1.1 Compilation of FTM measures in the rice industry 78
5.1.2 Detailed content of FTM measures 79
5.2 Interdependency check, weighting and ranking FTM measures 85
5.2.1 Interdependency check 85
5.2.2 Weighting and ranking of FTM measures 86
5.2.3 Final evaluation of FTM measures 94
5.3 Detailed analysis of impacts of FTM measures 96
5.3.1 Determination of scenarios 96
5.3.2 Rice generation sources 97
5.3.3 Generation of establishments in Ho Chi Minh City 99
5.3.4 Development of TLC model in the rice industry 102
5.3.5 Model calibration and validation 110
5.4 Results and discussion 111
5.4.1 Base scenario 111
5.4.2 Sensitivity analysis 112
5.4.3 Scenario 1 impacts 113
5.4.4 Scenario 2 impacts 116
5.4.5 Scenario 3 impacts 119
5.4.6 Discussions 120
5.5 Conclusions 122
6 Conclusions and Recommendations 123
6.1 Contributions of the study 123
6.2 Discussion on the generalization of the proposed method 124
6.3 Limitations and recommendations for future research 126
References 127
List of Tables 137

A Multi-Stage Impact Assessment Method for Freight Transport Management Measures
List of Figures 139
List of Abbreviations 141
Appendices 143
Appendix A. Survey on rice transport and logistics in the Mekong Delta 144
Appendix B. Expert Survey Documentation 152
Appendix C. Key Sources of Rice in the Mekong Delta 179

Introduction
A Multi-Stage Impact Assessment Method for Freight Transport Management Measures 1
1 Introduction
This chapter provides an overview of the research work. Section 1.1 presents the context and ra-
tionale for the study. Research questions, goal, objectives and methodology are introduced in Sec-
tion 1.2, 1.3 and 1.4. Finally, the structure of the overall report is outlined in Section 1.5.
1.1 Background and motivation
There are strong interactions among the three sectors of production, logistics and traffic, es-
pecially in the context of global supply chains. Decisions made in one sector often have im-
pacts on the others. Traffic management measures like HGV (Heavy Goods Vehicle) toll in
Germany or load factor control in Vietnam are examples. These measures have apparently in-
fluenced carriers or logistics service providers deciding on modes and routes. Production and
logistics processes are also influenced by these measures as, for example; orders or stocks can
be changed to minimize negative impacts on costs.
It is a fact that there are lots of methods that could be utilised to measure the impacts of
freight transport management (FTM) measures. However, the research in multi-stage assess-
ment method is considerably scarce as compared to the number of single methods. Qualitative
methods such as expert consultation or multi-criteria assessment (MCA) permit a quick classi-
fication and a first assessment of adopted measures and their impacts, but they do not give a
precise analysis of those impacts. Quantitative analysis of the core effects of the measures can,
however, overcome some limitations associated with qualitative methods, but data availability
and overall efforts are usually limited. Therefore, the incorporation of both qualitative and
quantitative approaches in assessing the impacts of the measures can yield more understand-
ing of the impacts of FTM measures on production and logistics.
A literature review shows that most of the analysed impacts of freight transport management
(FTM) measures are changes in mode and route choices (Browne et al., 2005; Hosoya and
Sano, 2003; Regmi and Hanaoka, 2015; Taniguchi and Tamagawa, 2005a). Many impacts
analyse in a relatively abstract way, with little quantification of core effects caused by FTM
measures. The reason for this may be that core effects of the measures can only be analysed if
sufficient data is available. Also, to predict behavioural changes, the analysis of core effects
requires detailed knowledge of the structure or network, stakeholders involved and factors in-
fluencing their decisions. Without access to this information, the impacts of FTM measures
may emerge as modal shift or changes in route choice but with little insight into causalities
and explanatory factors.
Clearly, the methods selected for detailed analysis should depend on planning process stages,
on the type of measure, and on the sector considered. For efficiency reason, it is not appropri-
ate to select only one single method for all circumstances. Therefore, in this study, a multi-
stage method of impact assessment will be developed. The first stage serves as a pre-selection
of measures and will define and classify the measures based on qualitative methods. The sec-
ond stage investigates specific measures with a detailed quantitative impact analysis.
The rice sector in Vietnam is chosen as an application case. It is suitable for this experiment,
as data is available to test various kinds of impact. In particular, there are numerous FTM
measures applied in the rice industry. Traffic volume due to rice transport is increasing quick-
ly and contributes up to 21% of the total freight traffic volume on some key transport corri-
dors (VITRANSS-2, 2009), for example from the Mekong Delta to Ho Chi Minh City (HCMC).

Introduction
A Multi-Stage Impact Assessment Method for Freight Transport Management Measures 2
Vietnam is also currently the second largest rice exporter in the world. The rice industry has
the involvement of various stakeholders such as farmers, collectors, millers, polishers, food
companies, wholesalers, retailers, and so forth. The knowledge on decisions of those stake-
holders is very useful for the prediction of their reactions to FTM measures.
1.2 Research questions
The focus of this study is to answer four concrete research questions as follows:
Research question 1:
What is the theoretical foundation of FTM?
Research question 2:
What are the existing methods to assess the impacts of FTM measures? What are
their pros and cons as well as their application?
Research question 3:
What does a multi-stage impact assessment for FTM measures look like?
Research question 4:
How could the multi-stage impact assessment of FTM measures be applied in an
example sector?
1.3 Goal and objectives
The overall goal of this study is to develop a method to investigate and assess the impacts of
FTM measures on production and logistics.
To reach such a goal, the following objectives should be fulfilled:
• Review of literature on the freight transport system, freight transport management
(FTM) measures, and potential impacts of such measures;
• Discussion on different approaches to impact assessment;
• Development of a multi-stage impact assessment method for FTM measures;
• Analysis of the Vietnamese rice industry to identify freight transport problems and
causes;
• Application of the developed method for assessing the impacts of FTM measures in the
example sector;
• Generalized conclusions and recommendations on the application of the developed
method for the impact assessment.
1.4 Methodology
The research flow of this study is presented in Figure 1-1. It consists of a literature review,
surveys, observations, and comprehensive quantitative analysis in a specific sector. The re-
search flow starts with collecting data from a broad range of literature on traffic management
and FTM measures to define the objectives as well as the scope of the study. Next, a large
body of literature relating to the methods for assessing the impact of FTM measures has been
identified and an attempt has been made to compare and assess those different approaches.
The analysis shows the gaps in existing assessment methods and their practical application.
Consequently, the study develops a multi-stage assessment method by which the core effects

Introduction
A Multi-Stage Impact Assessment Method for Freight Transport Management Measures 3
of FTM measures can be identified and economic, safety and environmental impacts can be
estimated.
Figure 1-1: The research flow of the study
Source: Own representation
The study takes the Vietnamese rice industry as an example for the application. Surveys and
observations are employed to investigate current practices in the chosen example sector (rice
production and logistics). For impact assessment of the FTM measures on production and lo-
gistics processes in the rice industry, this study differentiates two levels of analysis as men-
tioned above.
Qualitative or partly-quantitative methods such as expert consultation or the MCA method are
used for a first classification of the measures. Usually, FTM measures aim to achieve more
than one goal, and there is always a trade-off needed between the objectives of different
stakeholders involved. Within this context, expert consultation or the MCA method are likely
suitable tools since they enable to deal with multi-criteria analysis in weighting and ranking
Traffic manage-
ment
Literature Review
FTM
Literature Re-
view
Study area identification (Impact assessment)
Problem statement
and study objec-
tives
Chapter 1: Introduction
Chapter 2: Freight
transport management (FTM) framework
Discussion on different impact assessment methods
Development of a multi-stage impact assessment method for
FTM measures
Chapter 3: Develop-
ment of a multi-stage
method for impact as-
sessment of FTM measures
Stage 1
Pre-selection of
measures
Stage 2
Detailed assessment of
the pre-selected measures
Application in an example sector
Chapter 4: Analysis of
the rice industry in the
Mekong Delta
Chapter 5: Application
of the multi-stage im-
pact assessment meth-
od for FTM measures
Generalized conclusions and recommendation on the applica-
tion of the proposed method
Chapter 6: Conclusions
and recommendation
Inter-dependence
check of measures
Weight and rank
Sectorial analysis and
TLC model development
Quantification of im-
pacts

Introduction
A Multi-Stage Impact Assessment Method for Freight Transport Management Measures 4
FTM measures. Several impact assessment criteria, specifically transport, social-economic and
environmental effects are taken into account when selecting measures. The initial results of
the first assessment stage in the rice industry have revealed that high ratings have been given
to two freight transport management measures: the establishment of a regional rice logistics
centre and the improvement of NH 1A from the Mekong Delta to HCMC.
The next stage is a detailed impact assessment of pre-selected measures, based on a compre-
hensive sector analysis and defined measure application scenarios. The first scenario considers
only the establishment of a new regional rice logistics centre. The second scenario is only the
improvement of NH 1A. The third scenario is the combination of the two measures above: re-
gional rice logistics centre establishment and NH 1A improvement. In this stage, a detailed
quantitative assessment is carried out to determine the impacts related to the changes in the
supply chain, and the impacts on mode choices in the rice industry. A total logistics cost (TLC)
model serves as the core of the analysis, differentiating a disaggregated population of com-
modity flows and locations of distribution centres. The model takes into account mode and
route choices for each rice commodity flow. Consequently, the traffic, economic, safety and
environmental benefits can be estimated at the sector level and transport network level.
1.5 Structure of the Study
The structure of this study is shown in Figure 1-1. After the Introduction, Chapter 2 provides
theoretical foundations for the whole study in its entirety. It comprises a system analysis of
freight transport, presentation of the FTM concept, and a compilation of FTM measures identi-
fied in various case studies.
Chapter 3 focuses on developing a multi-stage assessment method that enables the capture of
core effects of FTM measures. Following this objective, firstly, overall transport decision-
making processes are introduced briefly to understand the position of impact assessment in
this process. Next, a review of the impact assessment methods for FTM measures and discus-
sion on their pros and cons are presented. In addition, meta-criteria used for the assessment
of methods in the freight transport sector are also discussed. Finally, a multi-stage assessment
method for FTM measures is developed and recommended as the important outcome of this
study.
In Chapter 4, the current situation of the rice industry in Vietnam‘s Mekong Delta is presented
in details to identify freight transport problems and their causes. The analysis is conducted by
examining the rice supply chain, vehicles used, frequency, TLC and route choice from the
commodity origin to domestic and export markets. As a result, the limitations of freight
transport in the rice industry are identified, highlighting the need for the consideration and
application of various traffic management measures that can contribute to increased efficien-
cy.
A commentary on the detailed application of the method developed for this study is carried
out in Chapter 5. More specifically, the study takes the rice industry as a case study for analys-
ing the utility of a multi-stage method to FTM impact assessment. This part contains two stag-
es of assessment. The first stage is conducted by inventorying, interdependency checking and
assessing FTM measures applicable to the rice industry. Partly-quantitative methods such as
MCA or the expert consultation method is employed to estimate the applicability and effec-
tiveness of these measures. Consequently, a list of the most effective and applicable measures
for the unique conditions of the rice industry are recommended. In the second stage, a deep
Introduction
A Multi-Stage Impact Assessment Method for Freight Transport Management Measures 5
quantitative impact assessment of recommended measures is implemented. A total logistics
cost (TLC) model serves as the core of the analysis, differentiating a whole population of rice
commodity flows and location of distribution centres. The model takes mode and route choic-
es for each commodity flow into account. Accordingly, the traffic, economic, safety and envi-
ronmental benefits can be estimated at sector level and transport network.
Generalized conclusions and recommendations on the application of methods for the impact
assessment of FTM measures are presented in the last chapter.

Freight Transport Management Framework
A Multi-Stage Impact Assessment Method for Freight Transport Management Measures 6
2 Freight Transport Management Framework
The purpose of this chapter is to provide the theoretical framework for FTM. Section 2.1 gives a
basis for the study of FTM. Particularly, it comprises the analysis of stakeholders involved in
freight transport system and their goal conflicts; the consideration of components constructing
freights transport supply and demand inside the transport system are also addressed. Section 2.2
provides a thorough review of the concept of FTM and its classification. The final section focuses
on the compilation of FTM measures through the review of numerous case studies, where
measures have been successfully or unsuccessfully applied in a range of contexts.
2.1. Systematic analysis of the freight transport
The first fundamental step in the systematic analysis of freight transport involves determining
all stakeholders whose decisions affect freight transport operations. Next, goal conflicts of
these stakeholders shall be discussed in details. Throughout this analysis, the study shall de-
termine component parts of freight transport demand and supply which constitute the freight
transport system.
2.1.1. Stakeholders
A number of attempts have been made to describe stakeholders involved in the freight
transport system. Comprehensive reviews of the freight transport system (Visser et al., 1999;
Boerkamps et al., 2000; Taniguchi and Nemoto, 2003; Wisetjindawat et al., 2006; Friedrich,
2010; Russo and Comi, 2011; Anderson et al., 2005) have shown that it involves very com-
plex linkages among many stakeholders, including shippers, carriers, receivers, infrastructure
providers, residents, administrators, and so on. Stakeholders may have different perspectives
on the freight transport system. Figure 2-1 presents an overview of stakeholders involved in
the freight transport system.
Figure 2-1: Stakeholders involved in the freight transport system
Source: Own representation
Shippers are people or agents who send goods to other companies or persons. Logistics ser-
vice providers (LSPs) do not work on the production of goods but provide logistic services to
other companies. They can be either carriers who provide the physical transport service or
Shipper Logistics
Service
Provider
Receiver Infrastructure
provider End-
consumer Administrator
Producer
Wholesal-
er
Retailer
Inhabitant
Carrier
Freight
forwarder
Producer
Wholesal-
er
Retailer
Inhabit-
ant
Govern-
ment
Private
company
Local resi-
dent
Local busi-
ness
City/region
govern-
ment
Traffic
planner
Market
regulator

Freight Transport Management Framework
A Multi-Stage Impact Assessment Method for Freight Transport Management Measures 7
freight forwarders who organize the transport. Receivers are people or agents receiving the
goods. Infrastructure providers are the actors responsible for providing infrastructure for
transporting goods (e.g. roads, bridges, terminals, etc.); in most cases, this is the task of the
government. End-consumers are people indirectly affected by freight transport activities.
They could be residents who are living in a particular place in a city, or local businesses who
are working in a city. Administrators are people responsible for the performance of transport
system and are required to play a major role in resolving any conflict among these stakehold-
ers.
In the context of the chosen example sector in this study - the rice industry, key stakeholders
involved are described as follows. Shipper refers to economic agents associated with produc-
tion and the shipping of rice (e.g. farmers or food companies). The carriers represent the
agents or companies that are physically in charge of transporting rice from the origin - the
Mekong Delta to final destination - HCMC (e.g. collectors, transport companies, LSPs). Carri-
ers represent a very heterogeneous group, ranging from very small companies with a single
truck or small boat/vessel to conglomerates that operate hundreds of trucks, or vessels of
thousand-ton capacity. Receivers represent the consignees of rice cargo. This group of whole-
salers/retailers or export companies typically represents the end consumers of the rice supply
chain.
2.1.2. Stakeholder Objectives
As mentioned above, there are quite a lot of actors involved in the freight transport system.
Some actors are directly involved (e.g. shipper, logistics service provider, and receiver)
whereas some others provide supporting factors for freight transport activities (e.g. infrastruc-
ture providers, and administrators). Residents, however, do not really have a direct involve-
ment; they have a certain effect on the policy of freight transport by way of voicing their opin-
ions to administrators. Obviously, each stakeholder plays a different role in the freight
transport system. The goals of the stakeholders involved are identified based on their individ-
ual viewpoint. Figure 2-2 provides an overview of the objectives of different stakeholders as
follows.
The objectives of the shipper often concentrate on the efficiency in terms of cost and time and
reliability of transport (safe delivery of goods to customer without delay). Following the study
of Gibson et al. (2002) costs hold the highest importance for shippers when doing business
with carrier partners. They tend to prioritise minimizing transportation costs. After deciding
the shipment size/delivery frequency, the shipper will announce this to all carriers for bid-
ding. In addition to the cost element, commodity characteristics are also a critical considera-
tion for the shippers and carriers/logistics service providers. To some extent, the products’
characteristics determine the transport modes, and thereby dictate the transporting time and
cost. For example, looking at the modal split of the freight transportation in Vietnam, it re-
vealed that most heavy raw materials such as construction materials (73%) and coal (79%)
are shipped by IWT. Meanwhile, a large proportion of manufactured goods (88%) and animal
meat products (85%) are transported by road (VITRANSS-2, 2009). Obviously, the inland wa-
terway transport (IWT) mode is much cheaper than roadway but it is not competitive in terms
of time. Therefore, bulk low-value goods are often favoured for transport via IWT. Beside the
interests of cost and time, shippers take into consideration the safety of goods, reviewing
freight loss history before doing business with a carrier (Premeaux, 2009).
With respect to Logistics Service Provider (LSP), operational efficiency is considered as their

Freight Transport Management Framework
A Multi-Stage Impact Assessment Method for Freight Transport Management Measures 8
most important objective. LSPs typically attempt to minimize the costs related to collecting
and delivering goods to customers, thereby maximizing their profits. At the same time, they
usually assure that their operation is safe and damage to goods minimized. They also place
importance on customer satisfaction through providing good quality services. In the long-
term, the objectives of LSPs should be in line with customer needs and expectations. As stated
by the study by Aguezzoul (2012), customers often consider the following aspects when eval-
uating LSPs: logistics information systems, on-time deliveries, capacity to handle specific
business requirements, responsiveness including accessibility to contact persons, price, experi-
ence in a similar industry, reputation, market share, logistic equipment, and business devel-
opment strategy. If LSPs take all elements into account, they can satisfy customer needs and
also fulfil their business objectives. Ultimately, customer satisfaction emerges as the most cru-
cial objective of LSPs.
Figure 2-2: Goal conflicts of stakeholders involved in the freight transport system
Source: Own representation
Similar to shippers, the objective of receiver is efficiency in term of cost and time. Generally
speaking, receivers want to receive the right goods at low cost at the right time. Furthermore,
they are also greatly concerned about the safety of goods, reliability, punctuality and flexibil-
ity of deliveries. Regarding the transport chain, the receiver is seen as an end point in this
study. A receiver has the power in making decision related to delivery time in normal cases.
However, in cases where specific FTM measures put in place (e.g. toll pricing to push trucks
working in off-peak hours); this decision is jointly made by receivers and carriers (Holguín-
Veras et al., 2007). Receivers and carriers, to some extent, have to agree on mutual objectives,
for example minimization of total logistics cost.
Infrastructure provider has two main objectives, namely “economic efficiency” and “provid-
ing safe infrastructure”. Criteria associated with these objectives include saving transport costs
and reducing emission costs. Additionally, infrastructure providers are further interested in
safe infrastructure provision, which can ensure the sustainable development of freight
transport system.
The objectives of end-consumer can be identified as minimum negative impacts and safe
movement of freight traffic. End-consumer would like to receive their commodities at a con-
venient time. However, they do not welcome large trucks coming into local streets for fear
that these trucks will cause traffic congestion, traffic accidents and air pollution near/within
Shipper Logistics
Service
Provider
Receiver Infrastructure
provider End-
consumer Administrator
Efficiency
(cost,
time)
Reliability
(Safety of
goods and delay min-
imization)
Efficiency
of opera-
tion
Safety of
operation
Customer
satisfaction
Low cost
Safety of
goods
Punctuali-
ty and
flexibility
Economic efficiency
(cost)
Safe in-
frastruc-
ture pro-
vision
Minimum
hindrance
caused by
freight
traffic
Safety
Safety of all
traffic
movement
Minimization
of external
impacts
Economic
development

Freight Transport Management Framework
A Multi-Stage Impact Assessment Method for Freight Transport Management Measures 9
their residential areas. End-consumer is therefore indirectly involved in freight transport but
their opinions, to some extent, can affect the feasibility of FTM measures.
The objectives of administrator could vary in the following ways: ensuring safe movement of
all kinds of traffic, minimizing external impacts caused by transport activities; improving envi-
ronmental quality in the city/region; or enhancing economic development. Given the poten-
tially differing objectives, administrators play the most important role in resolving conflicts
among the stakeholders, which possibly makes sense for smooth and effective freight
transport.
2.1.3. Freight transport supply
This section will focus on the analysis of components of freight transport supply from stake-
holders’ perspectives. In general, transport supply is expressed in term of infrastructure (ca-
pacity), services (frequency) and network (coverage). According to Sinha and Labi (2007)
there are basically two aspects of transport supply: quantity and quality. Quantity refers to the
amount of products or services that the providers make available or the capacity of the
transport system. Quality refers to the level of services. Examples of transit quality are clean-
ness, security, and vehicle track condition. For highway systems, examples are the level of
traffic congestion and the road surface condition. A well-functioning transport system should
allow transport supply to meet transport demand in order to satisfy the mobility needs of both
passengers and goods.
In the context of stakeholder involvement in freight transport, the supply side comprises of ac-
tors that are physically in charge of transporting goods (e.g. carriers, LSPs) or providing
transport facilities (e.g. infrastructure providers). The carriers are considered to be the central
part of the freight transport supply, whereas infrastructure providers play a structuring role in
the formation of freight transport supply. The operation of carriers are often characterised by
the kinds of service offered, frequency, and itinerary. The provision of these services is closely
connected to the characteristics of items being transported such as their origin-destination,
type, size of shipment, and value. In operational processes, carriers often require the use of
fixed transport facilities (e.g. road, railway, warehouse, and transhipment points) supplied by
infrastructure providers. The location of these fixed facilities can affect the decisions of carri-
ers. For example, carriers may consider designing different commodity flow options, and
tours; depending on the location of distribution warehouses, transhipment terminals or other
fixed transport facilities (Combes and Leurent, 2009).
2.1.4. Freight transport demand
Transport demand is built on the foundation of the theory of goods demand in economics. Ul-
timately, transport is one kind of goods processing full characteristics as the others goods such
as use value, demand and supply sides. The term of transport demand, in general, is defined
as the number of trips that an individual or firm is prepared to make under a given set of con-
ditions (i.e. trip time, cost, security, comfort, safety) (Sinha and Labi, 2007). Passenger and
freight transport demand have several key differences that make the estimation of freight
transport demand more difficult. Fundamentally, there are many actors involved in the deci-
sions leading to freight transport demand. To explain the emergence of freight transport de-
mand, Rühl and Ottemöller (2013) work on the analysis of stakeholders with a direct impact
on freight transport (i.e. shippers, carriers, receivers, infrastructure operators, public authori-
ties), and assign them to the markets for goods, traffic and transport which determine freight

Freight Transport Management Framework
A Multi-Stage Impact Assessment Method for Freight Transport Management Measures 10
transport demand. According to Combes and Leurent (2009) the decision of these stakehold-
ers has a substantial effect on the original formation of freight transport demand for two rea-
sons. First, it initially determines the commodity flow from shippers to carriers. Second, it can
enhance the movement of these flows if rational location for inbound and outbound transpor-
tation is set out.
The decisions determining freight transport demand essentially involve in designing flows of
goods, choices of logistics facilities (e.g. warehouse, transhipment points, terminal), and
choices of mode and frequency of transport. Addressing these decisions is a complicated task
and has been investigated in some recent research, for instance Tavasszy et al. (2000) repre-
sent production-consumption flows as physical commodity flows, and Friedrich (2010) has at-
tempted to model the food supply chain in Germany, which focuses more on the optimization
procedures for warehouse structures within the food retailing sector.
Looking back to stakeholders involved in the freight transport system, the main agents formu-
lating freight transport demand are shippers. Shippers are very heterogeneous in that they can
be producers, wholesalers, retailers, or even individuals. Their decisions to mandate carriers
often require considerations of multiple dimensions such as freight rate, transport time, relia-
bility, delivery tracking, and safety of goods. Freight transport demand, finally, emerges as
flows of freight movement through many steps and measured by various units such as ton,
ton.km, container, truckload, and so forth.
2.2. Freight transport management measures - Concepts and classifications
2.2.1. Basic concepts
Traffic management
The term traffic management occurs in different contexts, for example in transport demand
management (Taniguchi and Nemoto, 2003), congestion control (Strickland and Berman,
1995), mobility pricing (Roth, 2009), or freight road pricing (Holguín-Veras et al., 2006). All
these authors express basically the same meaning of traffic management, which is a system
which “influences the supply of traffic and transport systems as well as the demand for travel
and transport through a bundle of measures with the aim to optimize the positive and nega-
tive impacts of traffic and transport” (Boltze, 2003). It is obvious that the mechanism of traffic
management deals with the conflict and trade-off between transport demand and supply sides
to optimize the efficiency of the existing transport situation.
Traffic management measures
The conventional thinking about traffic management measures is simply the application of
traffic control devices in order to perform traffic regulation and road operation. Along with
the development of new concepts, many new traffic management approaches and measures
have been applied and implemented. Khuat (2006) defined traffic management measures as
“a set of activities that creates technical traffic management impacts toward desired improve-
ments of a defined transport situation”. Under the given aims of traffic management, a bundle
of activities should have impacts on the both sides of transport system, demand and supply.
The technical impacts of those activities should lead to changes in characteristics of transport
demand and supply and this will be explored in detail the following section.
Freight Transport Management Framework
A Multi-Stage Impact Assessment Method for Freight Transport Management Measures 11
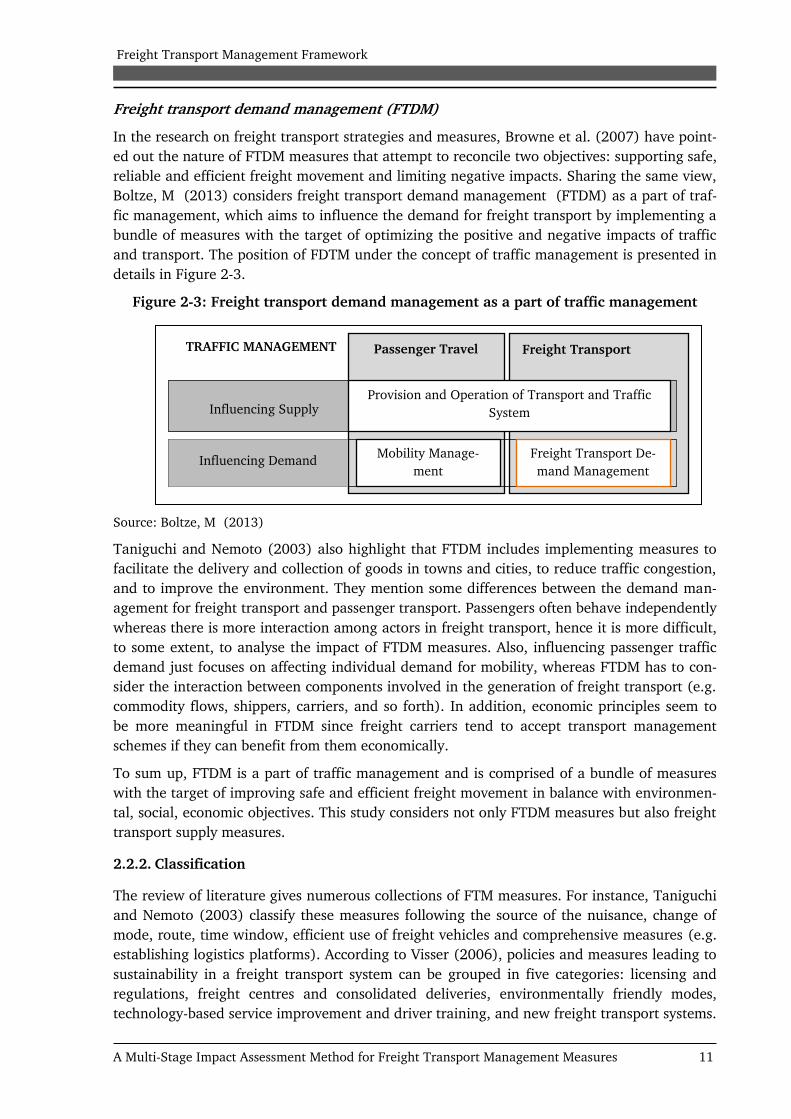
Freight transport demand management (FTDM)
In the research on freight transport strategies and measures, Browne et al. (2007) have point-
ed out the nature of FTDM measures that attempt to reconcile two objectives: supporting safe,
reliable and efficient freight movement and limiting negative impacts. Sharing the same view,
Boltze, M (2013) considers freight transport demand management (FTDM) as a part of traf-
fic management, which aims to influence the demand for freight transport by implementing a
bundle of measures with the target of optimizing the positive and negative impacts of traffic
and transport. The position of FDTM under the concept of traffic management is presented in
details in Figure 2-3.
Figure 2-3: Freight transport demand management as a part of traffic management
Source: Boltze, M (2013)
Taniguchi and Nemoto (2003) also highlight that FTDM includes implementing measures to
facilitate the delivery and collection of goods in towns and cities, to reduce traffic congestion,
and to improve the environment. They mention some differences between the demand man-
agement for freight transport and passenger transport. Passengers often behave independently
whereas there is more interaction among actors in freight transport, hence it is more difficult,
to some extent, to analyse the impact of FTDM measures. Also, influencing passenger traffic
demand just focuses on affecting individual demand for mobility, whereas FTDM has to con-
sider the interaction between components involved in the generation of freight transport (e.g.
commodity flows, shippers, carriers, and so forth). In addition, economic principles seem to
be more meaningful in FTDM since freight carriers tend to accept transport management
schemes if they can benefit from them economically.
To sum up, FTDM is a part of traffic management and is comprised of a bundle of measures
with the target of improving safe and efficient freight movement in balance with environmen-
tal, social, economic objectives. This study considers not only FTDM measures but also freight
transport supply measures.
2.2.2. Classification
The review of literature gives numerous collections of FTM measures. For instance, Taniguchi
and Nemoto (2003) classify these measures following the source of the nuisance, change of
mode, route, time window, efficient use of freight vehicles and comprehensive measures (e.g.
establishing logistics platforms). According to Visser (2006), policies and measures leading to
sustainability in a freight transport system can be grouped in five categories: licensing and
regulations, freight centres and consolidated deliveries, environmentally friendly modes,
technology-based service improvement and driver training, and new freight transport systems.
Passenger Travel TRAFFIC MANAGEMENT Freight Transport
Influencing Supply Provision and Operation of Transport and Traffic
System
Influencing Demand
Mobility Manage-
ment
Freight Transport De-
mand Management

Freight Transport Management Framework
A Multi-Stage Impact Assessment Method for Freight Transport Management Measures 12
Browne et al. (2007) emphasize that the classification of measures should address the prob-
lems caused by freight operation. In particular, those measures can be directly divided into
four groups namely land use, the freight transport system itself, vehicles, and the traffic sys-
tem. Boltze et al. (1996) identify and arrange the measures according to the hierarchical lev-
els of traffic management, including traffic reduction, traffic diversion and traffic control. Fol-
lowing the concepts mentioned above, the FTM measures in this study are addressed from the
perspective of transport engineering and sorted by the objectives of the measures in a defined
traffic situation. These objectives are to avoid traffic, to shift traffic, and to control traffic. This
is presented in detail in Figure 2-4 below.
Figure 2-4: Classification of FTM measures by their potential impacts
Source: Adapted from Boltze (2003)
Measures to avoid freight traffic are aiming at reducing freight transport demand in the tar-
geted area by combining, modifying and substituting trips. Mechanisms for combining trips
are applied to reduce the number of trips and trip length. Modifying trip is related to the trip
chain and multi-purpose trips. Freight traffic demand can be also reduced by e-commercial
transport. Measures to shift freight traffic try to move freight traffic demand between differ-
ent modes, times and destinations. Mechanisms for shifting traffic involve shifting to high ca-
pacity freight transport modes, shifting to off-peak hours to reduce the peak period traffic,
and shifting destination closer to trip origin to reduce the average trip length. Measures to
control freight traffic are usually part of the traffic supply management but they also have an
influence on traffic demand. These measures include truck route restriction, controlling speed
or loading of vehicle, and the enhancement of driving behaviour to stabilize traffic condition
of a specific area.
2.3. Compilation of FTM measures
There are a number of studies on FTM measures and their application. Based on the classifica-
tion in the previous section, the study compiles FTM measures identified from the literature
review as illustrated in Table 2-1.
To avoid traffic
Combination
Modification
Substitution
To shift traffic
Time
Mode
Location (trip‘s destination)
To control traffic
Route choice
Speed/Loading control
Driving behaviour
Man
agem
en
t of
tran
sport
su
pp
ly M
an
agem
en
t of
tran
sport
dem
an
d

Freight Transport Management Framework
A Multi-Stage Impact Assessment Method for Freight Transport Management Measures 13
Table 2-1: Compilation of freight transport management measures
No List of candidate FTM measures
To avoid
traffic
To shift
traffic
To control
traffic
Com
bin
a-
tion
Mod
ific
a-
tion
Su
bst
itu
tio
n
Tim
e
Mod
e
Dest
inati
on
Rou
te
ch
oic
e
Sp
eed
/Load
ing c
on
tro
l
Dri
vin
g b
e-
havio
ur
M1 Freight centres and consolidated deliveries
M2 Co-operative freight transport system
M3 Harvesting time
M4 Time window for truck entering the city
M5 Time window for loading and unloading at
curb-side parking places
M6 Incentive for off-peak delivery
M7 Promotion of intermodal transport
M8 Image campaigns, concept for “Green Logistics"
M9 Low-emission zones
M10 Vehicle restrictions (weight -, width-, based)
M11 Promotion of regional products
M12 Business cooperation
M13 Provision of loading/unloading areas
M14 Truck routes/Freight – exclusive lanes
M15 Infrastructure capacity improvement
M16 Road pricing schemes
M17 Load factor control or speed limit
M18 Technology-based route planning and fleet
management
Primary impact Secondary impact
Source: Boltze, M. (2013); Boltze et al. (2012); Browne et al. (2007); Castro and Mario (2010); Hol-
guín-Veras et al. (2007); Hung (2006); Taniguchi and Nemoto (2003); VITRANSS-2 (2009), Loc
(2010)
For this study, eighteen FTM measures have been identified, which are categorised by their
potential impacts such as avoiding traffic, shifting traffic, and controlling traffic. The measures
are numbered from M1 to M18. Some of the described measures are already applied in prac-
tice while others are currently the subject of research. Therefore, the following text will focus
on a detailed analysis of the application of all measures in order to show what is working and
what is not, identifying underlying causes of success or failure.

Freight Transport Management Framework
A Multi-Stage Impact Assessment Method for Freight Transport Management Measures 14
Table 2-2: List of examples for the application of FTM measures
No List of candidate
FTM measures
Examples for relevant case
studies Source
Application level
Stu
dy
Tri
als
Op
era
-
tion
al
sch
em
es
M1
Freight centres and
consolidated deliv-
eries
Multimodal freight centre in
Bremen Germany
Browne et al.
(2005)
https://www.wfb-
bremen.de
x
Bologna and Vicenza freight
village, Italy
Boile et al. (2009)
Ville et al. (2010) x
Urban freight centre in Kassel,
Germany
Browne et al.
(2005)
Wisetjindawat
(2011)
x
Consolidation centre in
Heathrow Airport
Browne et al.
(2005)
x
M2 Co-operative freight
transport system
Tenjin co-operative delivery
system in Japan
Taniguchi, E and
Nemoto, T (2003) x
M3 Harvesting time Research on potential impacts
of climate change on freight
transport
Caldwell et al.
(2002) x
M4
Time window for
truck entering the
city
Governmental time-window
schemes in the Netherlands
Quak and De Koster
(2006) x
Truck ban in Manila, Philippine Castro, J.T and
Mario, R (2010) x
M5
Time window for
loading/unloading
at curb-side parking
places
The case of London and Nor-
wich, England
Allen et al. (2000)
Browne et al.
(2007)
x
M6 Incentive for off-
peak delivery
Off-peak deliveries in New
York City
Holguín-Veras et al.
(2007) x
M7 Promotion of in-
termodal transport
A study of FTM measures in se-
lected European countries
Nemoto, T et al.
(2006) x
M8
Image campaigns,
concept for “Green
Logistics”
Green Logistics at Eroski (food
distribution sector in Spain)
Ubeda, S et al.
(2011) x
Green Logistics management in
Chinese manufacturing export-
ers
Lai, K. and Wong,
C.W.Y. (2012) x
M9 Low-emission zones
Application in Austria, Den-
mark, Italy, the Netherland,
and Germany
Allen and Browne
(2010) x
M10
Vehicle weight-
based /width-based
restriction
Limited accessibility of large
trucks to enter certain areas in
the Netherlands
Browne et al.
(2007)
Quak and De Koster
(2006)
x
Truck ban in Manila, Philippine Castro, J.T and
Mario, R (2010) x

Freight Transport Management Framework
A Multi-Stage Impact Assessment Method for Freight Transport Management Measures 15
Table 2-3: List of examples for the application of FTM measures (cont.)
No List of candidate
FTM measures
Examples for relevant case
studies Sources
Application
level
Stu
dy
Tri
als
Op
era
tio
nal
sch
em
es
M11 Promotion of re-
gional products
The development of Japanese
regional products
Januszewska, R et
al. (2005) x
M12 Business coopera-
tion
The project of co-operation be-
tween fashion shop retail
chains in Amsterdam
Visser et al.
(1999) x
M13 Provision of load-
ing/unloading areas
Loading/unloading zone re-
striction in London, Paris, Fu-
kushima cities
Browne et al.
(2005)
Wisetjindawat
(2011)
x
M14
Truck
routes/Freight – ex-
clusive lanes
Case studies on some freeways
of the United States and Cana-
dian urban areas
Allen and Browne
(2010) x
M15 Infrastructure ca-
pacity improvement
The development of multimod-
al freight facilities and railway
system in European countries
including Germany, Italy,
France
Nemoto, T et al.
(2006) x
M16 Road pricing
schemes
Distance-based charging sys-
tem for heavy goods vehicles in
selected European countries
Vrtic, M et al.
(2009) x
M17 Load factor control
(LFC)
LFC in Amsterdam and Copen-
hagen
Taniguchi, E and
Nemoto, T (2003) x
M18
Technology-based
route planning and
fleet management
The case of IT applicability or
e-commerce in Hong Kong and
Taiwan
http://www.pland
.gov.hk/ x
Application of ITS such as Elec-
tronic Toll Collection (ETC)
and the Global Positioning Sys-
tem (GPS) in Singapore
Chan and Al-
Hawamdeh
(2002)
x
A summary of the most important findings from each case study is provided in the following
texts.
M1. Freight centres and consolidated deliveries
Freight centres and consolidated deliveries can refer to the terms such as multimodal freight
centres, or urban consolidated deliveries. Typical case studies for establishing freight centres
and consolidated deliveries are:
• Multimodal freight centre in Bremen, Germany
• Bologna freight village, Bologna, Italy
• Urban freight centre (UFC) in Kassel, Germany
• Consolidation centre in Heathrow Airport, the United Kingdom
These case studies have one thing in common - promoting the consolidation of commodities

Freight Transport Management Framework
A Multi-Stage Impact Assessment Method for Freight Transport Management Measures 16
and reducing freight road traffic. The first project of this kind is the multimodal freight centre
in Bremen (Germany) which is currently in operation. Bremen freight centre is located in a
specific area, which connects to three important seaports including Hamburg, Bremen and
Wilhelmshaven ports. This centre is seen as a multimodal transport hub dealing with road,
rail, and inland waterway and many kinds of commodities with the involvement of various
LSPs (i.e. freight forwarders, shippers, and transport operators). In addition to this, it serves
as a transhipment point where both short-and long-distance freight traffic meet. The essential
aim of such a centre is to promote co-operation between industries by creating common lo-
gistic terminals. Bologna freight village in Italy is another example of a multimodal freight
centre, which was created with the crucial objectives of reducing heavy truck traffic from cit-
ies by promoting rail transport. This freight village is located in an important area of econom-
ic production, crossing by five major rail routes and four motorways. In order to operate the
Bologna freight centre, there is strong Public-Private-Partnership (PPP) cooperation, including
at city level, at provincial level, with the road haulage association, transport operators, and
freight forwarding companies.
Urban freight centre (UFC) is another type of freight centre and consolidated delivery system
on a smaller scale that provides facilities for a single transport mode only (typically road
transport). This model can be seen in the case of the urban freight centre in Kassel and the
consolidation centre at Heathrow Airport (Browne et al., 2005). Kassel is known as the loca-
tion of many important German industries including automobile, transport, software, and en-
ergy technologies. Kassel freight centre was established by the co-operation of many freight
forwarding companies in order to facilitate the deliveries of commodities, thereby reducing
commercial vehicles and congestion levels in the city centre. Since the operation of this model
is based on the voluntary involvement of freight forwarders, forwarders could easily leave the
cooperation if they find benefit from participation intangible. The consolidation centre at
Heathrow Airport operates with the objective of reducing commercial vehicle traffic and im-
proving of goods handling in the terminals. The empirical studies have shown that this model
has brought many improvements to the traffic situation in and around the airport (Browne et
al., 2005).
In essence, crucial benefits identified in the literature on practical application of freight centre
and consolidated delivery system are the reduction in the number of commercial vehicles via
promoting consolidation and multimodal transport (e.g. Bremen, Germany; Bologna, Italy).
This measure also addresses the change in number of vehicle trips or vehicle-km, ton-km,
changes in vehicle emissions (e.g. Kassel, Germany). However, these measures are not always
successful in practice, especially the urban freight centre model as illustrated in the case of Vi-
cenza, Italy (Ville et al., 2010). There are a number of reasons behind this failure. One reason
is inaccurate estimation of potential demand for UFC. Unsuccessful initiatives usually assume
a far higher level of demand for UFC, often resulting in not enough goods handling at the UFC
(Takahasi and Hyodo, 1999). Furthermore, failure is associated in a deficiency in strict deliv-
ery regulation, and in some cases, transport and forwarding companies are reluctant to use
the facilities due to the fear of losing competiveness.
M2. Co-operative freight transport system
Typical case studies for co-operative freight transport systems have been seen in many cities
of Japan, of which Tenjin co-operative delivery system in Fukuoka city is considered the old-
est model. This initiative stems from a particular problem faced by the city that loading spaces
Freight Transport Management Framework
A Multi-Stage Impact Assessment Method for Freight Transport Management Measures 17
on and off street are very limited which generates illegal parking and compounds traffic con-
gestion. Twenty-nine freight carriers established the Tenjin District Joint Distribution Compa-
ny Ltd. to address these problems by promoting co-operative delivery.
The operation of the co-operative delivery systems gets strong support and involvement from
stakeholders like shippers, freight carriers, local residents and administration. Particularly,
freight carriers take responsibility for bringing their goods to the distribution centre located in
the suburb of Fukuoka, and then these commodities are sorted by customer orders and deliv-
ered by member carriers. Those members, at the same time, collect goods from customers in
central districts and unload them at the distribution centre.
Empirical studies have identified significant beneficiaries from this kind of model such as a
decrease in numbers of trucks in the served area, a decrease in total distance travelled, fre-
quency of parking, and total parking time (Browne et al., 2005). However, similar to the initi-
atives of freight centre and consolidated delivery systems, the co-operative delivery system is
only successful if key stakeholders are actively involved and the government enforces suffi-
ciently rigorous regulation on deliveries.
M3. Harvesting time
Very little literature has focused on how interventions at harvesting time can effect on freight
transport demand. This is likely because this approach requires consideration of many com-
plex conditions such as weather condition, geological condition, and custom production. In
his study on the potential impacts of climate change on freight transport, Caldwell et al.
(2002) suggest that climate change may result in shifting agricultural production spatially,
causing the demand for freight transport in some regions in the United States to increase and
to decrease in other regions. With the expectation of Caldwell however, quantitative evalua-
tion of the impact of harvesting time measure on freight transport demand was rarely seen in
the literature.
M4. Time window for truck entering the city
Typical case studies for this measure focus on in various European and Asian cities, for exam-
ple London, Paris, Parma, Bologna, Copenhagen, Amsterdam, Manila, and Seoul. Its form and
objective are highly differentiated across different cities. For example, time restriction can be
applied in morning peak times (e.g. Parma city) to reduce the impacts of trucks on congestion
or night time and weekends (e.g. London) to reduce noise nuisance, all day long (e.g. Bolo-
gna), or entry may be allowed only during a specific given period of time for deliveries (The
Netherlands). Among these strategies, truck bans in the Netherlands and Philippine (Manila)
are good examples where clear explanation of impacts of the restrictions on traffic character-
istics and supply chain operation are provided (Castro and Kuse, 2005; Quak and De Koster,
2006). As Castro and Kuse ‘s study shows the application of restriction in Manila has resulted
in a temporal shift in truck traffic from day time to night time and a modal shift from heavy
trucks to smaller vehicles. The research in the Netherlands placed more emphasis if policies
impact the supply chain. In particular, Quak and De Koster argued that the restriction scheme
could add more costs to retailers who have to use vehicles nearly 24 hours per day. Also, the
emission situation might not be improved remarkably due to the rapid increase in deliveries
before and after regulated time. Many other researchers also confirm the negative impacts
possibly arising from delivery time restriction and night time deliveries (Browne et al., 2005).
For example, a very restrictive delivery time-window can lead to an increase in supply chain

Freight Transport Management Framework
A Multi-Stage Impact Assessment Method for Freight Transport Management Measures 18
costs, vehicle trips and vehicle-km ratios. The only obvious positive effect of this approach is a
shift in the number of truck trips into off-peak times that potentially leads to a reduction in
congestion, improving social and environmental problems in given areas. However, finding an
acceptable way to practice and balance private economic and social economic costs caused by
this measure remain a point of contentions.
M5. Time window for loading and unloading at curb side parking places
Another form of time restriction is regulated times for loading and unloading in urban areas.
This practice can be seen in the case studies of London and Norwich (Allen et al., 2000).
Analogous to time restrictions for vehicles entering cities, this measure can affect the opera-
tion of supply chain and have impacts on freight transport. Taking Norwich city is an exam-
ple, loading time restrictions on streets in the morning can conflict with the times at which
the premises would like to receive deliveries. Consequently, the total number of vehicle trips
and vehicle kilometres for receiver s’ premises could actually increase, thereby potentially hav-
ing an effect on fuel consumption, and pollutant emission. However, this measure seems more
suitable in city centre locations where there is likely a high density of deliveries, and there are
few available parking places. For that reason, the application of this measure might either
shift truck traffic into off-peak loading/unloading times (night time for instance) and better
protect pedestrianized areas located around loading/unloading bays in the city.
M6. Incentive for off-peak delivery
The relevant case study for incentives for off-peak delivery is New York City, where more than
67 million trucks operate every year (Holguín-Veras et al., 2007). The rational for incentives
for off-peak deliveries stems from the fact that New York City faces the severe traffic conges-
tion and high transportation cost. As a result, increasing off-peak deliveries can reduce truck
traffic during the peak hours, thereby reducing in pollution and congestion in the city. The
most obvious impact from such a measure is to shift large traffic from peak to off peak peri-
ods. However, successful implementation of incentive policy for off-peak delivery should in-
corporate financial incentives such as tax deductions, shipping cost, discounts, toll savings,
and financial rewards.
M7. Promotion of intermodal transport
For a long time, the coordination of regional rail networks with urban distribution networks
or the combination of road and IWT in many EU member countries has been an important
part of public policy aimed at encouraging a modal shift from road freight traffic to rail and
coastal shipping (Nemoto et al., 2006). The reason behind these measures is the growth of
road freight traffic in Europe, averagely 2.1%/year (EU, 2012) as a source of environmental
and social problem. Under the concept of city logistics, Nemoto et al. (2006) also put forward
a strong argument for the case of Japan, noting that improvement of access routes to railway
stations and seaports is a crucial condition for promoting intermodal freight transport, and for
increasing the attractiveness of shifting road cargo transport into intermodal system. Howev-
er, the implementation of the intermodal transport framework faces many obstacles in prac-
tice due to the complexity of different transport modes involved. The practice of the inter-
modal transport framework in Europe is an example as these networks may potentially create
an increase of friction costs for transport operation because of a lack of infrastructure inter-
connectivity, transport means and regulations (EU, 2005).

Freight Transport Management Framework
A Multi-Stage Impact Assessment Method for Freight Transport Management Measures 19
M8. Image campaigns - the concept of “Green Logistics”
The concept of “Green Logistics” has recently been recognised as a new research trend in FTM
literature, dealing with the integration of environmental management and supply chain oper-
ation. It has been found that environmental issues can impact numerous logistical decisions
such as sourcing of raw material, modal selection, and warehouse, and terminal location (Wu
and Dunn, 1995). Among these factors, transport is often considered a central part of the con-
cept of “Green Logistics” due to the high proportion of negative impacts-freight transport has
on the environment. Thus, decisions regarding transport modes, vehicle types, lot-sizes, and
consolidation of goods can determine the extent of adverse environmental impacts. “Green lo-
gistics” image campaigns have taken place at national level via EU regulations on NOx, SO2
and PM emissions for trucks (Dekker et al., 2012), or at sector level such as the green logis-
tics-strategy for the food distribution sector in Spain (Ubeda et al., 2011) and among Chinese
manufacturing exporters (Lai and Wong, 2012). At the governmental level, using “Green Lo-
gistics” concepts encourages cleaner and less polluting freight transport modes; and at com-
pany or industry levels benefits of this approach include optimizing the operation of supply
chain through improved delivery routes scheduling; reducing the number of trips by adding
backhaul movements, and developing an environmental friendly method to solve routing
problems (for instance in the case of the food distribution sector of Spain). However, the ex-
tent to which “Green Logistics” policies are implemented seems very modest in practice. At a
business level, Gong and Kong (2013) explain how a “Green logistics” approach is implement-
ed in the supermarkets of China and Sweden, and explore how to improve such approach in
the future. “Green logistics” in these supermarkets can start with green packing that does not
require coals or other fossil fuel as raw materials. Next steps are green transport by using
friendly-environmental vehicles and green warehousing by main use of eco-technology when
designing facilities (e.g. roofs with solar panels, doors with sensor which can automatically
close, etc.)
M9. Low-emission zones
The aim of such zones is the control of emission and charging polluting vehicles when their
emission exceeds the set level. By doing so, a low-emission zone (LEZ) can lead to better air
quality, especially in contexts where road freight is experiencing rapid growth. This practice is
seen in regulation in many European countries like Austria, Denmark, Italy, The Netherlands,
and Germany. Initial results have shown that the application of this measure has impacts on
the supply chain organization and operation, but not really significant for overall emission
levels with statistics indicating for the reductions in PM, NOx, and SO2 emission in zones
where low-emission regulations are in place (Allen and Browne, 2010). The case of Germany
is an example (Wei et al., 2016). The introduction of LEZ could bring positive impacts on fleet
compositions, but the potential in further reducing air pollution under the current characteris-
tics of Germany seems to be modest. The reason for this is that vehicle emission standards in
Germany are reached 89%. To deal with, stricter limit and regulation combining with com-
prehensive optimization of traffic signal control should be developed as new instrument of
LEZ (Wei et al., 2016). To sum up, with the concept of “Green Logistics”, this measure can po-
tentially contribute to safer and cleaner freight transport modes in the economy.
M10. Vehicle weight-based/width-based restriction
Reviewing the literature has shown that vehicle weight/width-based restrictions alongside
time restriction are the most commonly adopted regulation in urban freight transport policies

Freight Transport Management Framework
A Multi-Stage Impact Assessment Method for Freight Transport Management Measures 20
in many European countries. The main function of these measures is to restrict large vehicles
(up to certain weight) entering specific urban areas, where there are many pedestrians and
road users, thereby reducing commonly perceived impacts of trucks such as noise, pollution,
safety concerns and vibration (Browne et al., 2007). The application of such measures has the
biggest impact on the operation of retailers and transport companies. According to the re-
search findings of Quak and De Koster (2006), the impacts of vehicle weight restriction can
lead to an increase in smaller vehicles carrying out distribution, thereby increasing the num-
ber of vehicle kilometres, number of round-trips, and transport cost. Emission is not improved
as expected since even though smaller vehicles produce fewer emissions than large vehicles,
total sum of CO2 emissions of those smaller vehicles can actually be higher. Browne et al.
(2005) also confirm that the level of impacts of this measure depend much on the scale of a
company’s vehicle fleets. Those companies operating heavy goods vehicles, which are restrict-
ed, have to make significant changes to their fleet by acquiring smaller vehicles or to their dis-
tribution patterns. Consequently, total operating costs are likely to increase. Although many
researchers have raised questions about the impact of vehicle restrictions, from governmental
perspectives those measures are still believed to improve traffic condition in urban city cen-
tres. A good topic for further research could be which cities would benefit from implementing
these policies and which would be better off avoiding vehicle restrictions, as well as how to
integrate vehicle restriction regulation into broader governmental urban freight policies.
M11. Promotion of regional products
The promotion of regional products has long been regarded as a tool for regional develop-
ment (Januszewska et al., 2009). This measure stems from the economic development agen-
das, which aim to create competitive advantages for traditional products, and then promote
regional development and attract tourism. Regional products are typically characterised as of
special quality, as authentic, as trademark or special services. They are also recognized as spe-
cialized production areas with high production volume. The development of Japanese region-
al products is an example (Davis and Weinstein, 1999). The consolidation of freight transport
appears hidden behind the establishment of such regions; however, shifts in trip destination
are likely occur since more of efforts are placed on promoting regional products, thereby in-
creasing consumption of those products in a wide range of contexts. So far, there has been
very little research on the impacts of this measure on traffic and transport activities. Signifi-
cantly, however this approach is utilised in the rice industry in Vietnam; therefore potential
impacts will be justified more clearly in the later part of this study focused on the rice sector
in Vietnam.
M12. Business cooperation
Business cooperation measures for FTM have been investigated using case studies on the co-
operation of different interest groups involved in the supply chain. The co-operation initiative
between fashion shop retail chains in Amsterdam is an example (Visser et al., 1999). The re-
sults of this project is expected to brings spatial shift to traffic since it promotes cooperation
among fashion retail shops for upstream consolidation purposes, thereby potentially reducing
independent transport by fashion shop owners. The cooperation of farmers, collectors, millers
and export companies in the rice supply chain in Vietnam is another example (Loc, 2011). In
essence, striking qualitative effects can be seen as middleman in the rice purchasing process
are reduced considerably, and also trip destinations (export companies) tend to located closer
to trip origins (production site) to achieve increased efficiency. A detail analysis of this ap-
Freight Transport Management Framework
A Multi-Stage Impact Assessment Method for Freight Transport Management Measures 21
proach contents will be in a later part of this study focused on the rice sector in Vietnam.
M13. Provision of loading/unloading areas
The efficient usage of infrastructure capacity in urban areas has become an urgent need for
many European countries. Provision of loading/unloading areas is one of a number of supply
side freight transport measures. If the time window for loading/unloading in the city centre is
considered as “software”, “loading/unloading areas” are seen as “hardware”. This is because
this measure aims to provide dedicated spaces or locations for carriers loading and unloading
their goods. As a matter of fact there are not always enough spaces for such areas in cities
such as London and Paris, and some bus lanes are also used for loading/unloading activities
in Fukushima (Japan) (Dablanc, 2009). Barcelona (Spain) municipality has implemented an
initiative for dynamic usage of traffic lanes during the day by, for example devoting them to
traffic in peak hours, loading/unloading and handling activities during off-peak hours, and
residential parking at night. Loading/unloading zone restriction can, however, bring a spatial
shift in traffic flows since delivery vehicles are only allowed to perform their activities in regu-
lated areas in the city; therefore high traffic density may occur in and around these areas. Fur-
thermore, this approach increases the total number of vehicle trips and vehicle kilometres
necessary to deliver goods at any one time. However, these impacts are likely not addressed
comprehensively in the literature, where primary focus is mainly on lack of loading/unloading
spaces and handling problems in urban areas.
M14. Truck routes/Freight – exclusive lanes
Truck routes or freight-exclusive lanes are considered as another infrastructure measure de-
ployed to control freight traffic in the city. The concept of freight-exclusive lanes can be un-
derstood as a traffic lane dedicated to trucks only, and trucks are separated from other traffic
either through physical or operational techniques (TAC, 2014). Truck routes are expected to
address traditional issues associated with urban freight transport such as mobility, safety, and
environmental impacts. Although we can find this practice in urban freight policies in many
countries (e.g. United States, Canada, the United Kingdom; the Netherlands), there is a little
comprehensive researches on its impacts, except for a small sample of case studies on some
freeways in the United States and in Canadian urban areas (TAC, 2014). In the research on
the United States, Cost-Benefit Analysis tool was employed for impact assessment, and rec-
ommendation concerning potential implementation was made. The proposal for truck-lanes
implementation in Canada takes careful consideration of the operation and impacts of that
measure, in which mobility issue and safety performance of truck lanes are analysed qualita-
tively. Lack of experience in implementing such measures and insufficient data emerge as
hindering the exploration of the real effects of this measure.
M15. Infrastructure capacity improvement
Infrastructure capacity improvement is a common supply side measures but has quite a strong
influence on freight transport demand. Freight infrastructure not only refers to roads, rail-
ways, and inland waterway systems, but also refers to facilitating the handling of goods or
multimodal freight facilities such as freight centres, intermodal terminals, and load-
ing/unloading bays. Within the boundary of a city or urban area, inadequate infrastructure
capacity can be one of the great obstacles to efficiency, leading to poor accessibility for freight
transport and increased congestion. The case of Mexico City is an example (OECD, 2004). For
long-distance freight transport, insufficient freight transport infrastructure for bulk transport

Freight Transport Management Framework
A Multi-Stage Impact Assessment Method for Freight Transport Management Measures 22
modes like railway and inland waterborne vessels makes it difficult for transport operators to
use options other than trucks. Vietnam and Thailand are also exemplifies for this problem,
where rail freight represents only 2% of the total freight transport volume (VITRANSS-2,
2009). Since rail and IWT is often cheaper than road transport; improving railway IWT capac-
ity is a very promising option for affecting a modal shift in freight transport. Alongside these
measures, many countries have allocated resources to the development of multimodal freight
facilities in an effort to facilitate transhipment between different transport modes. Germany is
an example (Dablanc, 2009). Multimodal freight centres like those in Bremen, Berlin and
Nurnberg are considered an important part of freight infrastructure systems responsible for
handling goods from different transport modes. In supporting the development of these cen-
tres, the use of railway and IWT in Germany has increased (Umwelt bundes amt, 2009). Fur-
thermore, German policies have also promoted the consolidation of shipments resulting in re-
duced transport costs and energy expenditure for companies as well as a reduction in emis-
sions.
M16. Road pricing schemes
Road pricing schemes differentiated by time, space and/or emission have long been seen as
ideal measures for traffic control by urban planners (Anderson et al., 2005; Holguín-Veras et
al., 2007; TRT, 2008) . The aim of such schemes is to reduce the negative impacts of road
transport (including passenger and freight transport) on the environment, society and the
economy. Road pricing schemes can be separated into two areas: one focusing more on im-
pacts on passenger transport in urban areas for which the London Congestion Charge Scheme
and the Stockholm Congestion Charge are very typical examples; another affects freight
transport via introducing distance-based charging system for heavy goods vehicles in various
European countries namely Austria, the Czech Republic, Germany and Switzerland, or via
time-based systems in other countries like Belgium, Denmark, and The Netherlands. Early re-
sults given in those studies suggest that the expected impacts of road freight charging systems
are as follows. There are little indications of modal shift, except for the case of large shippers
in Germany that likely increased the use of railway transport due to a relative rise in road
freight transport costs. Tendencies to re-route in order to avoid road system usage charges can
be seen as a negative impact of this measure (there is evidence for this in the case of Germany
and Austria for instance). The striking positive effect of this measure however is the increased
efficiency in the road freight transport sector as well as in increasing load factor. According to
the research results on pricing system for road freight transport in EU member states and
Switzerland (TRT, 2008) there is some evidence indicating the positive changes related to
fleet composition (the case of Germany for instance), fleet renewal (the case of Switzerland
for instance), and a load factor optimisation (the case of Austria for instance). However, due
to lack of data, the effects of this measure are quantified in very few studies. Consequently,
further research into the implication of freight road pricing scheme would be useful.
M17. Load factor control
Load factor schemes are often employed by policy makers alongside other schemes in traffic
management such as vehicle weight-based /width-based restriction or road pricing scheme
(Browne et al., 2007; Castro and Mario, 2010; Kohler, 1997). The concept of load factor con-
trol can function differently, which depends on the specific situation. The objective of load
factor control - in the past - was to encourage maximum utilization of truck capacity. The case
of Amsterdam and Copenhagen are practical examples (Taniguchi et al., 2002). It is engaged
Freight Transport Management Framework
A Multi-Stage Impact Assessment Method for Freight Transport Management Measures 23
with regulation on satisfaction of certain load factor and environmental standard. The rational
of this scheme comes from the fact that small vehicles are often more preferable in the cities
given their flexibility in meeting individual/company demands and limitation of delivery time.
Today, this measure can be used to control overloading vehicle, and the case of Vietnam is an
example for this. Implementing load factor control regulation is recommended for long-
distance transportation in Vietnam. That is because most of trucks are overloaded, which ena-
bles an increase in road competitiveness in term of cost. It is recognised that controlling over-
loaded trucks would help to reduce the negative effects on the infrastructure system. Also, it
would cause an increase in road transport cost, thereby reducing its competitiveness of the
road system. One could argue that traffic on the highways will likely increase since the more
trucks used to transport all the goods. Consequently, the traffic condition may not improve as
expected. According to the experience of some countries, this solution should coexist with the
road pricing scheme which can manage traffic congestion efficiently (Teo et al., 2014). By ap-
plication of those measures, transport companies may consider modal shift from road to wa-
terway to achieve more efficiency.
M18. Technology-based route planning and fleet management
Application of technology in the process of production, logistics, transport and traffic has be-
come an attractive option for both private and public sector, and has contributed significantly
to the improved economic performance of those activities. As a freight transport management
measure, this scheme aims to facilitate freight transport activities. The impacts of technology
advancement on traffic and transport have been examined in many recent studies (Quayle,
2002; Chan and Al-Hawamdeh, 2002). The first traffic engineering impact to be considered is
reduction in freight transport demand. The applicable cases of information technology or e-
commerce in Hong Kong, Taiwan, and Singapore are examples. These approaches involve e-
commerce, and e shopping, which can potentially reduce the retail level through online trad-
ing, thereby likely affecting the overall freight transport demand. Other technologies that also
enable to change traffic and transport patterns are Intelligent Transport Systems such as Elec-
tronic Toll Collection (ETC) and the Global Positioning System (GPS). Freight vehicles under
the operation of ETC can reduce delay time that typically occurs at tollgate; or can identify
vehicle real-time position on the network map, giving the exact location of vehicles and guid-
ing vehicles on the most efficient routes.
To sum up, all the case studies above are typical examples of the application of FTM measures
employed worldwide. Many of them have been implemented within the boundaries of cities
or urban areas, therefore, in some contexts; they are recognized as City Logistics measures.
Obviously, there are many commonalities between FTM and City Logistics measures, since
both aim to improve safe and efficient freight movement in balance with environmental, and
social, economic issues. Apart from that, most of distribution centres and intermodal terminals
are often located in urban areas. However, the range of activities that comprise freight
transport management is broader than those associated to City Logistics. Specifically, freight
transport management focuses not only on urban areas but also on long-distance deliveries. In
this study, FTM measures are analysed both locally in the Mekong Delta and in the transport
corridor from the Mekong Delta to HCMC, and relevant measures are discussed in relation to
the rice industry production and logistics in the region.
2.4. Conclusions
This chapter reviews the available contemporary research related to several key aspects of

Freight Transport Management Framework
A Multi-Stage Impact Assessment Method for Freight Transport Management Measures 24
FTM including stakeholder involvement in the freight transport system and competing stake-
holder priorities, the components of freight transport demand and supply, definitions of FTM
measures and their classification, case studies of FTM applications and discussion on the rea-
sons behind their success or failure.
In general, FTM is a part of traffic management, which is comprised of a bundle of measures
with the target of improving safe and efficient freight movement in balance with environmen-
tal, social, and economic issues. The literature review presents numerous collections of FTM
measures that can be classified into many groups depending on the research objectives or the
impacts of measures. The FTM measures, in this study, focus on transport engineering and are
sorted by impacts in a defined traffic situation, where key impacts are defined as avoid traffic,
to shift traffic, and to control traffic. Based on each measure description, the study comes up
with a qualitative assessment of its effectiveness and applicability, which would be very useful
for the consideration of FTM measures in the example sector of this study.
Table 2-4: Qualitative assessment of the effectiveness and applicability of FTM measures
No List of candidate FTM measures Effectiveness Applicability
M1 Freight centres and consolidated deliveries ++ +
M2 Co-operative freight transport system + +
M3 Harvesting time + --
M4 Time window for truck entering the city + ++
M5 Time window for loading and unloading at curb-side
parking places + -
M6 Incentive for off-peak delivery + o
M7 Promotion of intermodal transport ++ -
M8 Image campaigns, concept for “Green Logistics" o --
M9 Low-emission zones + -
M10 Vehicle restrictions (weight -, width-, based) ++ o
M11 Promotion of regional products + +
M12 Business cooperation + +
M13 Provision of loading/unloading areas o -
M14 Truck routes/Freight – exclusive lanes o o
M15 Infrastructure capacity improvement ++ o
M16 Road pricing schemes ++ +
M17 Load factor control or speed limit ++ +
M18 Technology-based route planning and fleet manage-
ment + -
Explanation:
++: very high +: high o: average - : low --: very low
To sum up, although numerous FTM measures are currently utilised, studies on measuring
impacts are few. Therefore, a more specific analysis should be carried out to ascertain for the
strengths and limitations of these measures. FTM measures relevant in the case study sector of
this thesis, which will be discussed in detail in later chapters.
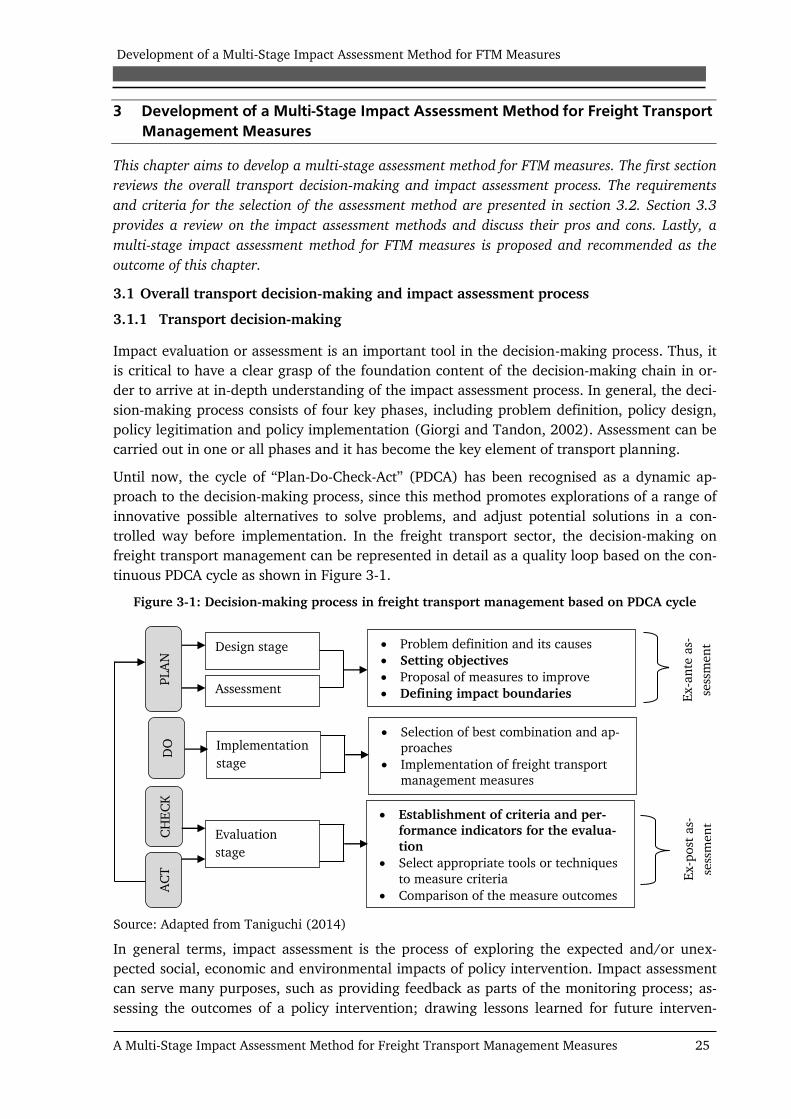
Development of a Multi-Stage Impact Assessment Method for FTM Measures
A Multi-Stage Impact Assessment Method for Freight Transport Management Measures 25
3 Development of a Multi-Stage Impact Assessment Method for Freight Transport
Management Measures
This chapter aims to develop a multi-stage assessment method for FTM measures. The first section
reviews the overall transport decision-making and impact assessment process. The requirements
and criteria for the selection of the assessment method are presented in section 3.2. Section 3.3
provides a review on the impact assessment methods and discuss their pros and cons. Lastly, a
multi-stage impact assessment method for FTM measures is proposed and recommended as the
outcome of this chapter.
3.1 Overall transport decision-making and impact assessment process
3.1.1 Transport decision-making
Impact evaluation or assessment is an important tool in the decision-making process. Thus, it
is critical to have a clear grasp of the foundation content of the decision-making chain in or-
der to arrive at in-depth understanding of the impact assessment process. In general, the deci-
sion-making process consists of four key phases, including problem definition, policy design,
policy legitimation and policy implementation (Giorgi and Tandon, 2002). Assessment can be
carried out in one or all phases and it has become the key element of transport planning.
Until now, the cycle of “Plan-Do-Check-Act” (PDCA) has been recognised as a dynamic ap-
proach to the decision-making process, since this method promotes explorations of a range of
innovative possible alternatives to solve problems, and adjust potential solutions in a con-
trolled way before implementation. In the freight transport sector, the decision-making on
freight transport management can be represented in detail as a quality loop based on the con-
tinuous PDCA cycle as shown in Figure 3-1.
Figure 3-1: Decision-making process in freight transport management based on PDCA cycle
Source: Adapted from Taniguchi (2014)
In general terms, impact assessment is the process of exploring the expected and/or unex-
pected social, economic and environmental impacts of policy intervention. Impact assessment
can serve many purposes, such as providing feedback as parts of the monitoring process; as-
sessing the outcomes of a policy intervention; drawing lessons learned for future interven-
PLA
N
DO
C
HE
CK
A
CT
Design stage
Assessment
stage
Implementation
stage
Evaluation
stage
• Problem definition and its causes
• Setting objectives
• Proposal of measures to improve
• Defining impact boundaries
• Selection of best combination and ap-proaches
• Implementation of freight transport management measures
• Establishment of criteria and per-formance indicators for the evalua-
tion
• Select appropriate tools or techniques
to measure criteria
• Comparison of the measure outcomes and expected outcomes
•
Ex-a
nte
as-
sess
men
t
Ex-p
ost
as-
sess
men
t

Development of a Multi-Stage Impact Assessment Method for FTM Measures
A Multi-Stage Impact Assessment Method for Freight Transport Management Measures 26
tions.
The impact assessment process starts with the identification of problems and their causes.
Then, the objectives and potential measures for problem solutions are defined. Also, in this
step, boundaries of the assessment need to be identified prior to detailed analysis of the im-
pacts. The boundaries include the analysis of stakeholders affected, types of impacts and the
scope of impacts. The next steps involve the selection of best combinations and approaches
measures. In the evaluation stage, establishing criteria to evaluate objectives and selecting
appropriate methods to measures those criteria are needed. Since collection of assessment in-
formation is generally costly, it is important to concentrate on the main indicators and using
standardized approaches. The final step of this process is to compare the observed outcomes
with expected outcomes. If the outcomes are not good, they can feedback and the re-start
from the beginning.
Looking closely into the whole process, there are two kinds of impact assessment carried out
in the phase of policy design (ex-ante) and policy implementation (ex-post). Ex ante impact
assessment aims at estimating potential initial impacts and likely future impacts of proposed
policies/measures for a given target area. Ex post impact assessment, in contrast, tries to
clarify real impacts during and after implementation, to enable responsive action or to provide
information to improve the design of future interventions.
Throughout the whole PDCA cycle, the definition of objectives and impacts boundaries as well
as the establishment of criteria and performance indicators utilised for assessing the objectives
is essential, since without which it is difficult to solve problems and establish concrete
measures to improve freight transport activities. Therefore, the following sections will review
the art of objectives setup and identification of various types and levels of impacts as well as
assessment criteria in evaluating freight transport management.
3.1.2 Objectives setup
Identification of objectives is an important stage in the impact assessment process. This is be-
cause the objectives are considered as a link between problems identified and the ulterior im-
plementation scheme oriented to problem solutions. When describing and formulating the ob-
jectives, it was found that no clear and defined method has been developed or applied at this
stage in the process. The most common qualitative techniques used are “goals system” or “ob-
jective tree” analysis. A diversity of objectives represented in “goal system” or “objective trees”
is desirable for the impact assessment since it reflects the different expectations held by vari-
ous stakeholders. The following example about improved freight transport effectiveness ex-
emplifies the use of “objective trees” in impact assessment process in detail.
The example in Figure 3-2 shows that the objective is clearer when it defined by a hierarchy
of desired outcomes. In “objective tree” models, a diversity of goals and objectives are derived,
which are geared towards achieving the overall goal. For example, from the overall goal of the
improved freight transport effectiveness, goals may involve improvement of freight move-
ment, improvement of economic efficiency, improvement of traffic safety, and environmental
protection. If the goal is to improve freight movement, the corresponding objectives could be
to reduce the number of trips, to reduce the number of ton per km, change in modal split, or
change in time choice of freight traffic. Analogous to this, multiple objectives can be associat-
ed with other goals of the freight transport system
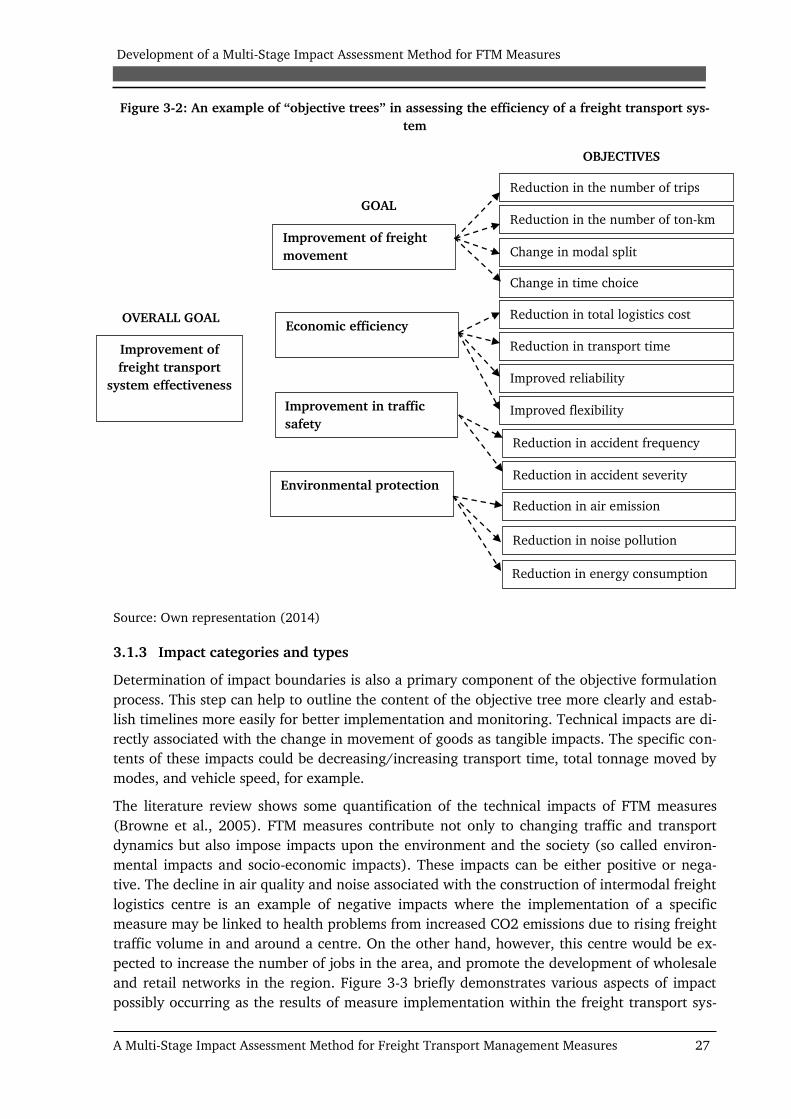
Development of a Multi-Stage Impact Assessment Method for FTM Measures
A Multi-Stage Impact Assessment Method for Freight Transport Management Measures 27
Figure 3-2: An example of “objective trees” in assessing the efficiency of a freight transport sys-
tem
Source: Own representation (2014)
3.1.3 Impact categories and types
Determination of impact boundaries is also a primary component of the objective formulation
process. This step can help to outline the content of the objective tree more clearly and estab-
lish timelines more easily for better implementation and monitoring. Technical impacts are di-
rectly associated with the change in movement of goods as tangible impacts. The specific con-
tents of these impacts could be decreasing/increasing transport time, total tonnage moved by
modes, and vehicle speed, for example.
The literature review shows some quantification of the technical impacts of FTM measures
(Browne et al., 2005). FTM measures contribute not only to changing traffic and transport
dynamics but also impose impacts upon the environment and the society (so called environ-
mental impacts and socio-economic impacts). These impacts can be either positive or nega-
tive. The decline in air quality and noise associated with the construction of intermodal freight
logistics centre is an example of negative impacts where the implementation of a specific
measure may be linked to health problems from increased CO2 emissions due to rising freight
traffic volume in and around a centre. On the other hand, however, this centre would be ex-
pected to increase the number of jobs in the area, and promote the development of wholesale
and retail networks in the region. Figure 3-3 briefly demonstrates various aspects of impact
possibly occurring as the results of measure implementation within the freight transport sys-
Improvement of
freight transport
system effectiveness
OVERALL GOAL
Improvement of freight
movement
GOAL
Economic efficiency
Improvement in traffic
safety
Environmental protection
OBJECTIVES
Reduction in the number of trips
Reduction in the number of ton-km
Change in modal split
Change in time choice
Reduction in total logistics cost
Reduction in transport time
Improved reliability
Improved flexibility
Reduction in accident frequency
Reduction in accident severity
Reduction in air emission
Reduction in noise pollution
Reduction in energy consumption
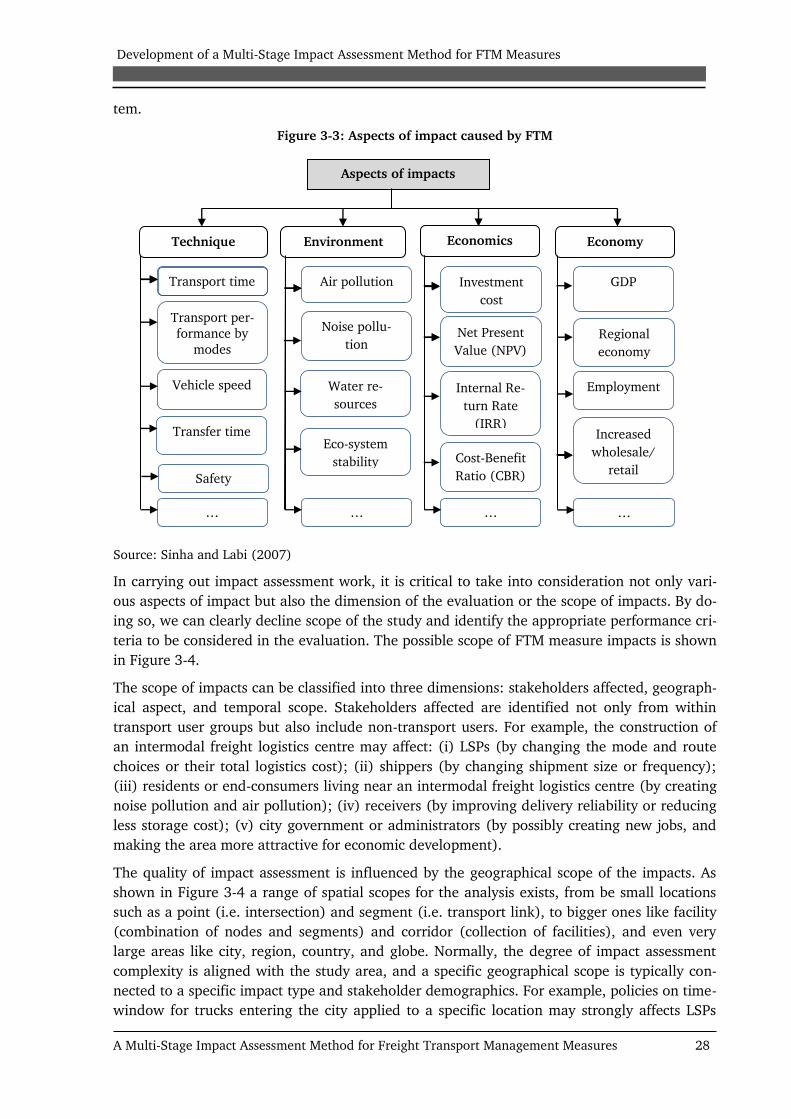
Development of a Multi-Stage Impact Assessment Method for FTM Measures
A Multi-Stage Impact Assessment Method for Freight Transport Management Measures 28
tem.
Figure 3-3: Aspects of impact caused by FTM
Source: Sinha and Labi (2007)
In carrying out impact assessment work, it is critical to take into consideration not only vari-
ous aspects of impact but also the dimension of the evaluation or the scope of impacts. By do-
ing so, we can clearly decline scope of the study and identify the appropriate performance cri-
teria to be considered in the evaluation. The possible scope of FTM measure impacts is shown
in Figure 3-4.
The scope of impacts can be classified into three dimensions: stakeholders affected, geograph-
ical aspect, and temporal scope. Stakeholders affected are identified not only from within
transport user groups but also include non-transport users. For example, the construction of
an intermodal freight logistics centre may affect: (i) LSPs (by changing the mode and route
choices or their total logistics cost); (ii) shippers (by changing shipment size or frequency);
(iii) residents or end-consumers living near an intermodal freight logistics centre (by creating
noise pollution and air pollution); (iv) receivers (by improving delivery reliability or reducing
less storage cost); (v) city government or administrators (by possibly creating new jobs, and
making the area more attractive for economic development).
The quality of impact assessment is influenced by the geographical scope of the impacts. As
shown in Figure 3-4 a range of spatial scopes for the analysis exists, from be small locations
such as a point (i.e. intersection) and segment (i.e. transport link), to bigger ones like facility
(combination of nodes and segments) and corridor (collection of facilities), and even very
large areas like city, region, country, and globe. Normally, the degree of impact assessment
complexity is aligned with the study area, and a specific geographical scope is typically con-
nected to a specific impact type and stakeholder demographics. For example, policies on time-
window for trucks entering the city applied to a specific location may strongly affects LSPs
Aspects of impacts
Technique Environment Economics Economy
Air pollution
Noise pollu-
tion
Investment
cost
Regional
economy
…
Transport time
Transport per-
formance by
modes
Vehicle speed
Transfer time
Safety
…
Water re-
sources
Eco-system
stability
…
Net Present
Value (NPV)
Internal Re-
turn Rate
(IRR)
Cost-Benefit
Ratio (CBR)
…
GDP
Employment
Increased
wholesale/
retail

Development of a Multi-Stage Impact Assessment Method for FTM Measures
A Multi-Stage Impact Assessment Method for Freight Transport Management Measures 29
(i.e. carriers, forwarding companies) and receivers (i.e. wholesalers/retailers) by dictating de-
livery time and route choice.
Figure 3-4: Scope of FTM measure impacts
Source: Adapted from Sinha and Labi (2007)
3.1.4 Assessment criteria and performance indicators
Based on the identification of objectives, the criteria and performance indicators for evalua-
tion can be established. The aims of such criteria are to supplement the specified goals and
objectives mentioned in the previous section. There are two kinds of criteria: qualitative and
quantitative criteria. Both of these can be used to measure physical and visible (measurable)
outcomes as well as changes in attitudes and behaviour, which are often less tangible and not
always easy to count.
In practice, the choice of criteria depends very much on which stakeholders are focused in the
impact assessment, and the types of impacts to the assessment team want to better under-
stand and assess. For example, if we want to assess the impacts of a consolidation centre on
carriers, the assessment criteria could be the change in the number of vehicle trips, change in
the number of vehicle-kilometres, change in the number of vehicle used, change in total fuel
consumed, or change in vehicle emissions. Clearly, those criteria are directly associated with
carriers and geared toward achieving economic freight transport efficiency.
The literature review has revealed that a multi-criteria system is often employed for transport
impact assessment (BESTUFS II, 2006; Browne et al., 2005; Sinha and Labi, 2007). This crite-
ria system allows the evaluation of various alternatives (policy measures, scenarios and tech-
nologies for examples) by taking into account different objectives of the stakeholders involved
in the decision-making process. Steer Davies Gleave’s (2009) research on the evaluation of
EU‘s Common Transport Policy (CTP) from 2000 to 2008 identifies three assessment criteria
groups for transport policies as presented as Table 3-1.
Scope of impacts
Stakeholders affected Geography Time
Medium term
Shippers/ Receiv-
ers
Infrastructure
providers
Administrators
Global/National
Regional
Corridor
Facility
Segment
Point
Long term
Short term
LSPs (carriers,
freight forwarder)
End-consumers

Development of a Multi-Stage Impact Assessment Method for FTM Measures
A Multi-Stage Impact Assessment Method for Freight Transport Management Measures 30
Table 3-1: Assessment criteria categories
Society
Mobility and Accessi-
bility
Concerned with the ability to move and reach differ-
ent facilities and locations
Safety Concerned with reducing number of vehicle collisions
and accidents
Economy Economic improve-
ment
Concerned with improving economic efficiency for
transport users and non-users.
Environment Environment and re-
sources
Involves reducing direct and indirect impacts of
transport facilities on the environments of both users
and non-users.
Source: Steer Davies Gleave (2009)
All assessment criteria obviously correlate closely with the objective system mentioned in the
previous section. They cover various aspects of impacts, however still at the abstract level.
Looking more closely at the freight transport system, the study reviewed five studies on per-
formance indicators for freight transport policy impact assessment. By matching the perfor-
mance indicators from reviewed studies with general assessment criteria given by Steer Davies
Gleave (2009), a comparison with the results from other case studies becomes possible (see
Table 3-2).
Sinha and Labi (2007) proposed a long list of candidate performance indicators for various
transportation program goals and objectives. They are represented in qualitative and quantita-
tive terms. Accordingly, the freight transport sector is often evaluated on four main aspects:
mobility and accessibility, operational efficiency, economic development and quality of life,
and safety and environment consideration. For each aspect, there is a set of possible perfor-
mance indicators stated in measurable terms that reflect the satisfaction of the transport user
as well as the concerns of the administrators or other stakeholders. However, since the objec-
tives of Sinha and Labi ‘s assessment is project development, multiyear programming, budget-
ing, and financing, most proposed indicators are considered from project level.
BESTUFS II project (2006) suggested a multi-criteria impact assessment for urban freight
measures and structured criteria them into six categories. They are freight volumes in urban
areas, urban freight transport fleets, urban deliveries, contribution to economy, environment,
and safety. For each category, a number of performance indicators are defined and an initial
data set is collected. These proposed indicators clearly reflect all impact dimensions of freight
transport within urban areas.
Browne et al. (2005) authored a large body of literature relating to urban consolidation cen-
tres and established a bundle of performance indicators used to assess the impacts of these
centres. Among them, relatively few of the indicators contain quantification criteria for the
mobility, accessibility, and safety and environment impacts. The most commonly quantified
impacts are changes in vehicle trips, vehicle kilometres, parking time and frequency, total fuel
consumed, and vehicle emissions.
At the early stage of freight transport impact assessment research, Taniguchi and Tamagawa
(2005b) examined the methodology of assessing the city logistics measures while taking into
account various behaviours of stakeholders involved in freight transport activities. There are
five stakeholders considered in their research, including freight carriers, shippers, residents,
administrators and urban express operators. From their research, performance indicators for

Development of a Multi-Stage Impact Assessment Method for FTM Measures
A Multi-Stage Impact Assessment Method for Freight Transport Management Measures 31
each stakeholder are developed. Since these proposed indicators are mostly based on assump-
tions that stakeholder’s behaviour is pre-defined and stakeholder economic attributes (e.g.
economic scale, amount of sales) are fixed, they may be meaningfully applied at the micro
level to assess the impact of a single freight measure on a specific transport corridor.
Table 3-2: Overview on impact assessment performance indicators concerning FTM measures
Categories
defined in
Steer Davies
Gleave
(2009)
Summary of performance indicators concerning impact assessment of FTM
measures
Tan
igu
ch
i
an
d T
am
a-
gaw
a,
(2005b)
Bro
wn
e e
t
al.
, (2
005)
BE
ST
UFS I
I,
(2006)
Sin
ha a
nd
Labi,
(200
7)
Mobility and
Accessibility
Freight transport
time
Time reliability
Delay time at cus-
tomer
Change in number
of vehicle trips
Change in number
of vehicle kilome-
tres
Changes in number
of vehicles used
Changes in travel
time
Vehicle load factor
Volume transported
into urban areas
Logistics costs
Share of urban
transport costs
compared to total
supply chain
Population density
and share of popu-
lation in
urbanized areas
Travel time
Delay, congestion
Connection and
transfer
Modal choice
Population access to
destination
Percentage of whole-
sale and retail opera-
tors in the economic
centre
Safety Not mentioned
Injuries and death
resulting from
freight traffic acci-
dents
Number of acci-
dents
Number of fatalities
Number and cost of
incidents
Involvement of
freight vehicles in ac-
cidents
Economic
improvement
Minimize transport
freight costs
Reduce total ship-
per costs
Increase toll reve-
nue for expressway
operators
Changes in operat-
ing costs
Contribution to
congestion
Number of jobs in
transport
Number of
transport related
companies
Indirect jobs support-
ed and created
Environment
and re-
sources
Reduce NOx truck
emissions
Reduce number of
complaints from
residents
Change in fossil
fuels consumption
Change in vehicle
emission
Other quality of life
issues
Fuel consumption
by vehicle types
Energy consump-
tion in urban FT
Non-renewable fuel
consumption
Air pollution
Fuel usage
Impacts on wetlands
and other ecosystems
Source: Taniguchi and Tamagawa (2005b); Browne et al. (2005); BESTUFS II project (2006); Sinha
and Labi (2007)

Development of a Multi-Stage Impact Assessment Method for FTM Measures
A Multi-Stage Impact Assessment Method for Freight Transport Management Measures 32
Table 3-3: Summary of criteria and performance indicators for FTM impact assessment
Objectives Criteria category Performance indicators (*)
Improvement
of freight
movements
Freight
transport per-
formance
▪ The number of ton-km
▪ The number of vehicle trips
▪ Total travel time
▪ Vehicle load factor
▪ Average trip length
▪ Average line-haul speed
▪ Loading/unloading time
▪ Transfer time between modes
▪ Modal split by ton-km
▪ Temporal shift
Accessibility
▪ The number of intermodal facilities
▪ Time to access intermodal factilities
▪ Delay of freight vehicle at facility per ton-km
▪ Percentage of whosales, retails and manufacturies within
a specified distance from freight facilities
Improvement
in economic
efficiency and
development
Economic
efficiency
▪ Revenue per ton-km by mode
▪ Cost per ton-km by mode
▪ Tons transported per hour
▪ Total time of the whole supply chain
▪ Total logistics cost
▪ Reliability
▪ Flexibility
Economic
development
▪ Percent increase of freight facilities used
▪ Direct and indirect jobs created
▪ Increase of business sales
▪ Economic attractiveness of the city and region
Improvement
in safety
Safety of goods ▪ Risk of damaged shipments
▪ Risk of lost shipments
Safety of road-
user
▪ The number of accidents caused by freight transport
▪ Cost of accidents caused by freight transport
▪ Percentage of accident frequency
▪ Percentage of severe accidents
▪ Involvement of freight vehicles in accidents
Environmental
and resource
conservation
Exhaust
emissions
▪ Share of freight transport in exhaust emissions
▪ Tons of pollutants generated
▪ Air pollution
▪ Noise pollution
Resource
conservation
▪ Typical fuel consumption by vehicle type
▪ Energy consumption in freight transport
▪ Consumption of non-renewable fuel resources
▪ Water quality
▪ Habitat degradation
▪ Land use
▪ Wetland and ecosystem
(*) This list of indicators is not exhaustive and each assessment criterion only provides simple examples
among the various formulations in literature

Development of a Multi-Stage Impact Assessment Method for FTM Measures
A Multi-Stage Impact Assessment Method for Freight Transport Management Measures 33
To sum up, Table 3-3 summaries criteria and performance indicators for FTM impact assess-
ment, and these are compared with the four impact dimensions identified by Steer Davies
Gleave (2009). Having established the dimensions on scope and potential impact assessment
criteria for FTM measures, the next section is to focus on discussing the requirements and cri-
teria for the selection of an assessment method.
3.2 Requirements and criteria for the selection of the assessment method
This section discusses meta-assessment criteria, which are used for the selection of an assess-
ment method. TASTe (1999) proposes objectives of an assessment process and their relevant
criteria as presented in Table 3-4.
Table 3-4: Assessment process objectives and evaluation criteria
Source: TASTe (1999) and Boltze/Plank Wiedenbeck (1998), S.19f
Following the proposal of TASTe (1999), the selection of the assessment method should com-
ply with the objectives of the study and also fulfil the objectives of the assessment process de-
fined as maximize significance, minimize errors, minimize efforts and maximize acceptance.
When analysing the detail assessment criteria some conflicts may arise. For example, minimiz-
ing the errors or an increase in acceptance will be difficult to achieve without significant ex-
penses in term of costs, personnel and time. Further, higher quality and therefore accuracy of
results generally requires an increased effort in dealing with specific measures.
In a study on the assessment of method for the modelling and appraisal of the sub-national,
regional, and local economic impacts on transport, McCartney et al., (2013) develop a set of
meta-assessment criteria which can help to identify the features of a good method including
Maximize signifi-
cance
Minimize
errors
Minimize
efforts Maximize ac-
ceptance
Inp
ut
Imp
lem
en
-
tati
on
Ou
tpu
t O
thers
Consider all rele-
vant influences
Recognition and
consideration of
errors in the data-
base
Avoiding input er-
rors
Minimize cost of
data collection and
preparation
Accurate represen-
tation of reality
Ensure the con-
sistency of the ap-
plied models
Minimize errors in
the impact ap-
praisal
Minimise cost for hardware and
software
Minimize cost for
the execution
Ensure the repro-
ducibility of the
evaluation process
Aiming to full and
high quality results
Describe the cor-
rectness of state-
ments
Minimize errors in
reading results
Minimize errors in
inter-prettying the
results
Shorten the decision
-making process
within the planning
process
Ensure comparabil-
ity of results
Enable the applica-
bility of results to
other plans
Enable the continu-
ation of the assess-
ment process
Proper selection of
actors and commu-
nications in the as-
sessment process
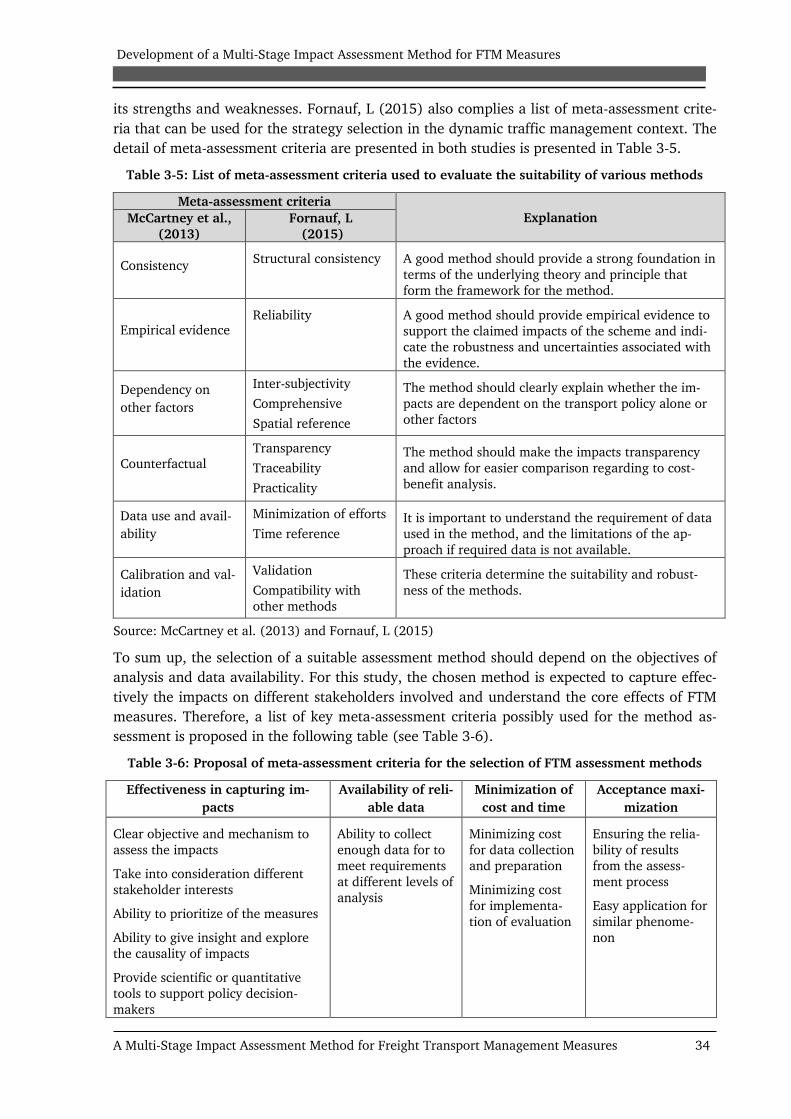
Development of a Multi-Stage Impact Assessment Method for FTM Measures
A Multi-Stage Impact Assessment Method for Freight Transport Management Measures 34
its strengths and weaknesses. Fornauf, L (2015) also complies a list of meta-assessment crite-
ria that can be used for the strategy selection in the dynamic traffic management context. The
detail of meta-assessment criteria are presented in both studies is presented in Table 3-5.
Table 3-5: List of meta-assessment criteria used to evaluate the suitability of various methods
Meta-assessment criteria
Explanation McCartney et al.,
(2013)
Fornauf, L
(2015)
Consistency Structural consistency A good method should provide a strong foundation in
terms of the underlying theory and principle that
form the framework for the method.
Empirical evidence Reliability A good method should provide empirical evidence to
support the claimed impacts of the scheme and indi-
cate the robustness and uncertainties associated with
the evidence.
Dependency on
other factors
Inter-subjectivity
Comprehensive
Spatial reference
The method should clearly explain whether the im-
pacts are dependent on the transport policy alone or
other factors
Counterfactual Transparency
Traceability
Practicality
The method should make the impacts transparency
and allow for easier comparison regarding to cost-
benefit analysis.
Data use and avail-
ability
Minimization of efforts
Time reference
It is important to understand the requirement of data
used in the method, and the limitations of the ap-
proach if required data is not available.
Calibration and val-
idation
Validation
Compatibility with
other methods
These criteria determine the suitability and robust-
ness of the methods.
Source: McCartney et al. (2013) and Fornauf, L (2015)
To sum up, the selection of a suitable assessment method should depend on the objectives of
analysis and data availability. For this study, the chosen method is expected to capture effec-
tively the impacts on different stakeholders involved and understand the core effects of FTM
measures. Therefore, a list of key meta-assessment criteria possibly used for the method as-
sessment is proposed in the following table (see Table 3-6).
Table 3-6: Proposal of meta-assessment criteria for the selection of FTM assessment methods
Effectiveness in capturing im-
pacts
Availability of reli-
able data
Minimization of
cost and time
Acceptance maxi-
mization
Clear objective and mechanism to
assess the impacts
Take into consideration different
stakeholder interests
Ability to prioritize of the measures
Ability to give insight and explore
the causality of impacts
Provide scientific or quantitative
tools to support policy decision-
makers
Ability to collect
enough data for to
meet requirements
at different levels of
analysis
Minimizing cost
for data collection
and preparation
Minimizing cost
for implementa-
tion of evaluation
Ensuring the relia-
bility of results
from the assess-
ment process
Easy application for
similar phenome-
non

Development of a Multi-Stage Impact Assessment Method for FTM Measures
A Multi-Stage Impact Assessment Method for Freight Transport Management Measures 35
3.3 Review of impact assessment methods for FTM measures
From the literature review, many attempts have been made to develop methods for carrying
out effective impact assessment on transport policies or measures. The selection and applica-
tion of a particular method much depends on the purpose of assessment, the socio-economic
context, available budget, available data and other factors. For this study, in order to develop
an impact assessment method for FTM measures, it is necessary to identify and examine com-
prehensive and innovative existing impact assessment methods employed in the freight
transport sector.
Figure 3-5: Categorisation of impact assessment methods for FTM measures
Explanations
SWTO Strengths-Weakness-Opportunities-Threats CEA Cost-Effectiveness Analysis
AHP Analytical Hierarchy Process SCBA Social Cost-Benefit Analysis
MCA Multi-Criteria Analysis TLC Total Logistics Cost CBA Cost-Benefit Analysis MRIO Multi-Regional Input-Output
Source: Adapted Fornauf, L (2015)
It is apparent from the literature review that the methods used to assess the impacts of FTM
measures are diversified. These methods can be classified by their purpose, their objects, or
their scope. In his research on the development of methodologies for the assessment of dy-
namic (road) traffic management strategies, Fornauf, L (2015) classified different assessment
methods based on transport planning process defined by the German Road and Transport Re-
search Association (FGSV, 2010a). In principle, these methods can be assigned to one of three
groups: formalized, semi-formalized and non-formalized assessment methods. With formal-
ized or standardized assessment methods, quantitative results are provided which allow a di-
rect comparison between different alternatives. For non-formal methods, the assessment is
evaluated on an argumentative and qualitative level. The semi-formalized methods, ultimate-
ly, are a hybrid of the two methods described above, in which, for example, different alterna-
Qualitative assessment methods
(Non-formalized)
Partly-quantitative assessment methods
(Semi-formalized)
Quantitative assessment methods
(Formalized)
Incr
easi
ng
math
em
ati
zati
on
Benchmarking Brainstorming
Expert consultation
Focus group SWOT
Delphi method MCA
Matrix approach AHP
Impact estimation methods
Gravity model Discrete choice model Agent-based model MRIO
Impact assessment methods
CBA/CEA SCBA TLC

Development of a Multi-Stage Impact Assessment Method for FTM Measures
A Multi-Stage Impact Assessment Method for Freight Transport Management Measures 36
tives are compared based on individual criteria, and consequently, a plausible basis for deci-
sion-making can be generated. The degree of mathematization increases with the degree of
formalization.
Building on the work of Fonauf, L (2015), assessment methods for FTM measures, in this
study, are categorised by data generated in the research process. Specifically, they are divided
into three groups: qualitative; partly-quantitative, and quantitative methods. The qualitative
assessment methods are mostly based on data stated in prose or textual form while quantita-
tive assessment methods tend to use data in the form of numbers. Partly-quantitative assess-
ment has similarities with qualitative methods in regards to data collection but then goes on
to provide numerical values or scaling for the qualitative data when conducting the impact as-
sessment.
Figure 3-5 summarizes impact assessment methods which have been applied in the freight
transport sector and identified in the literature review. The following paragraphs will not ex-
plore in depth the rationales underpinning those methods; however, some key aspects and
some illustrative examples of application in the freight transport sector shall be highlighted.
3.3.1 Qualitative methods
Benchmarking
Benchmarking is defined as a continuous and systematic process of comparing products, ser-
vices, processes and outcomes with other organisations or exemplars, for the purpose of im-
proving outcomes by identifying, adapting and implementing best practice approaches (Scott,
2011). There are two types of benchmarking: qualitative and quantitative benchmarking. Il-
lustrative examples of benchmarking methods are identified as follows:
• Benchmarking Intermodal Freight Transport by OECD (2002)
• Use of Benchmark Methodology in Environmental Impact Assessment (Pubule and
Blumberga, 2010).
In OECD (2002), the focus is comparing the most important dimensions of intermodal per-
formance among EU members contributing to sustainable development, and then insight is
provided into the reasons for performance differences. Attention is then paid to theoretical
foundations for performance improvement. The OECD research also points out various diffi-
culties in benchmarking intermodal activities such as the use of aggregated freight indicators
(e.g. ton-kilometres), the complexity in defining intermodal transport chain, high level of data
requirement. Finally, the research comes up with the need to draw conclusions carefully from
the application of benchmarking methods in the intermodal freight transport sector for two
reasons. First, it is immensely complex to benchmark the entire intermodal transport perfor-
mance since this chain includes a broad range of activities and their interactions, and second,
there is often a lack of consistency in comparable data.
The benchmarking method is also used in the initial assessment of environmental issues
caused by projects in Latvia (Pubule and Blumberga, 2010). The benchmark methodology to
evaluate environmental impacts involves three main steps. First, indicators from relevant en-
vironmental assessment research are collected. Then the choice of eco-criteria for benchmark-
ing method is made based on the judgment of these above indicators in qualitative and quan-
titative manners. For this step, regression analysis is employed to set up first equation to
measure the eco-criteria. Finally, different empiric benchmark equations are proposed to de-

Development of a Multi-Stage Impact Assessment Method for FTM Measures
A Multi-Stage Impact Assessment Method for Freight Transport Management Measures 37
termine range of criteria values which conform to principles of sustainable development.
These illustrative examples indicate that benchmarking method can be employed for first as-
sessment of initiative impacts. In order to carry out further analysis of impacts, other methods
need to be incorporated alongside benchmarking in order to identify and address the core po-
tential benefits and problems that may arise during the application of specific measures.
Brainstorming
Brainstorming is typically viewed as a process of generating creative ideas and solutions
through intensive and free group discussion (Osborn and Alex, 1963). Analysis, discussion,
or criticism of the arisen ideas generated is allowed only when the brainstorming session fin-
ishes and the evaluation session begins.
A representative example of the application of a brainstorming approach is the study of “Intel-
ligent Growth in the Transport Corridor Germany-Scandinavia; Visions for Sustainable and
Connecting Infrastructures and Strategies” (Gaßner and Christian Kamburow Robe, 2006)
within the COINCO project (2006). At the outset of the project, a group of experts were invit-
ed to join a workshop on the topic. Three groups were formed; each group drafted a list of
criticisms of the development of Germany-Scandinavia transport corridor and associated im-
pacts. The study gathers a list of ideas spontaneously contributed by experts during brain-
storming session, and based on session outcomes, conclusions on potential impacts can be
generated.
The method is quite simple, inexpensive and needs few material resources. Also, many ideas
can be generated in a short time. However, there is often a lack of reliable criteria
to determine the quality of solutions. Therefore, this method is recommended for use during
the initial stage of assessment procedures.
Expert consultation
This method is often adopted in the process of developing policy and legislation. However, in
some cases, it can be applied in the ex-ante impact assessment process to identify the poten-
tial impacts of some specific measures. The formulation of the proposal for the Logistics Ac-
tion Plan in the EU (EU, 2007) is an example. During the preliminary stage of the project, the
EU launched a number of workshops and conferences as forums for consulting industry ac-
tors, experts and other interested parties over choices for action. Next, an interview survey of
representatives was carried out and the data generated was used to rank the importance level
of measures contained in the Action Plan based on their perceived benefits.
It is clear that consultation of interested parties is a qualitative method which is more suitable
for the step of option analysis in ex-ante assessment processes. Throughout the consultation
phase, the policy maker can listen to, take note and consolidate as much information as possi-
ble from all interested parties - a necessary process for policy makers responsible for deciding
and implementing selected measures.
Focus groups
Focus groups are also a common qualitative method used to identify impacts of freight
transport systems. This method focuses on interviews with affected communities (public and
private), often taking place during initial stage of the assessment procedure.

Development of a Multi-Stage Impact Assessment Method for FTM Measures
A Multi-Stage Impact Assessment Method for Freight Transport Management Measures 38
As stated in the guideline for freight policy, planning and programming in small-and medium-
sized metropolitan areas (Cambridge Sys., 2007), focus groups are frequently used in as-
sessing the potential impacts of freight transport projects. Stakeholders consisting of industry
representatives (carriers, manufacturers, and retail operations for example.) and the general
public (for instance, residential areas, community centres) located in close proximity to the
project area are involved in series of meetings and discussions to identify qualitative impacts
and issues. Based on discussion outcomes, a summary of potential impacts is generated and
fed into prioritization and funding activities. There is often a dynamic within focus groups,
which makes them quite different to individual expert interviews.
Focus groups are employed widely in initial stages of the impact assessment process, and can
help to outline key impacts of proposed measures, however do not yield precise analysis of
those impacts.
Strengths-Weaknesses-Opportunities-Threats (SWOT) analysis
SWOT analysis is seen as an effective qualitative assessment tool. This approach originates
from business and marketing literature and encourages groups to analyse and assess the
strengths, weaknesses, opportunities and threats of a particular strategy and develop an im-
plementation plan accordingly. SWOT analysis is used for various qualitative impact assess-
ments in different fields including in freight transport measures and city logistics solutions. In-
terviews or surveys with decision-makers, key stakeholders, strategic planners, experts, and
employees are necessary to identify the strengths, weaknesses, opportunities and threats,
which are basis for building up a SWOT matrix.
Focusing specifically on the topic of freight transport, SWOT analysis can be utilised in as-
sessing a group of freight transport and logistics measures within a city or in an organization.
For example, Papoutsis et al. (2012) employed SWOT analysis to assess the best practice in
urban logistics solutions. A range of city logistics solutions such as urban consolidation cen-
tres, clean vehicle standards, urban freight transport management procedures, and supply
chain monitoring with the use of information and communication technology (ICT) tools are
investigated via SWOT analysis. Also, this research process identifies the needs and implica-
tions for successful implementation of each measure. Chen (2011) used SWOT analysis to
evaluate logistics processes in a company. He divided the logistics processes into multiple
stages including purchasing and ordering, warehousing, transportation and delivery, and re-
serve logistics. The advantages, disadvantages as well as opportunities of each step are then
investigated through interviews survey with experts and key stakeholders involved in logistics
processes.
SWOT analysis is a useful tool for qualitative assessment even though its structure is quite
simple. It enables decision-makers to deal with a complex problem at reasonable cost by using
structured brainstorming session. However, this tool does not provide a mechanism for rank-
ing the significance of one factor versus another within any list. As a result, it is difficult to of-
fer key solutions or alternatives to deal with problems identified via the analysis.
3.3.2 Partly-quantitative methods
Delphi method
The Delphi method is understood as “a structured communication technique, originally devel-

Development of a Multi-Stage Impact Assessment Method for FTM Measures
A Multi-Stage Impact Assessment Method for Freight Transport Management Measures 39
oped as a systematic, interactive forecasting method which relies on a panel of experts. The
experts answer questionnaires in two or more rounds” (Hsu and Sandford, 2007).
Figure 3-6: Organisation of the Delphi process
Source: Adapted from Hsu and Sandford, 2007
This method is used in various studies such as program planning, policy determination, im-
pact assessment, and resource utilization. The ultimate goal of this technique is to gain a con-
vergence of opinion concerning real-world knowledge solicited from experts within topic are-
as. Theoretically, the Delphi method is a continuous circle designed to achieve consensus
among experts. However, this process, in practice, often consists of three or four rounds of da-
ta collection, depending on the degree of consensus. In the first round, the Delphi process tra-
ditionally starts with sending an open-ended questionnaire as a cornerstone to gather the
opinions of exerts on the study area. After receiving this initial feedback, investors convert this
information into well and consensually-structured questionnaire. This questionnaire is then
used to survey experts in the second round. Each Delphi participant is asked to review and re-
assess his/her initial judgments about the information provided in the previous stage. As a re-
sult of the second round, areas of disagreement and agreement are identified (Wigan et al.,
1995). In the third round, all interviewees receive the final questionnaire which summarizes
all items and their rating restructured by the investigators, and participant experts are asked
to revise or make further clarifications on their judgments regarding the relative importance
level of different items. For the final round, the results of the weighting exercise, remaining
issues and minority opinion are distributed to all participants.
Delphi method involves qualitative and quantitative estimates. The first step of this process
deals with judgements of Delphi participant as a kind of qualitative data. Statistic technique
are employed in the next stage to measure tendencies (mean, medium) and level of dispersion
(standard deviation, range) of the collective responses of survey participants. The incorpora-
tion of qualitative and quantitative analysis aims to ensure that opinions generated by each
Delphi participant are well represented in the final iteration (Hsu and Sandford, 2007). In the
Round 1 Open questionnaire
Initial assessment
Round 2 Structured questionnaire
Round 3 Expert
pan
els
A
B
C
D
E
F
G
Reassessment of initial judgments
Consensually-structured
questionnaire
Rating/ Revision
Round 4
Consensually-structured
questionnaire
Remaining issues

Development of a Multi-Stage Impact Assessment Method for FTM Measures
A Multi-Stage Impact Assessment Method for Freight Transport Management Measures 40
literature review of freight transport research, application of Delphi method includes assessing
the environmental impacts of road freight transport (Piecyk and McKinnon, 2009), prioritiz-
ing events that have an impact on operations in the maritime domain (Victor et al., 2008),
factors that affect location decisions in international operations (MacCarthy and Atthirawong,
2003), and even forecasting the most important issues for transport research needs in the fu-
ture (Wigan et al., 1995). In most the aforementioned studies, the Delphi method is estab-
lished as the most appropriate method for getting high consensus in ranking and prioritizing
research problems and alternatives. However, the application of this method, in practice, has
potential difficulties in terms of subject selection, expert choices and time frame for conduct-
ing and completing a Delphi survey. These advantages and disadvantages will be discussed
further later in this study.
Multi-Criteria Assessment (MCA)
In theory, MCA mainly involves the following phases. The first is defining alternative man-
agement initiatives and identifying what are potential impacts. Usually, the effects of a given
measure are presented in ordinal or cardinal scales. Next, a list of assessment criteria needs to
be established in order to measure impact. Since it is possible to use different scale factors, a
wide range of qualitative impact categorises and criteria can be represented in formats that
can be meaningfully compared. Finally, a rating system is employed to compare various
measures from both qualitative and quantitative perspectives. Within this method, the rating
system involves two steps: weighting and scaling. The weighting of assessment criteria is often
obtained through expert survey. The qualitative scaling of an initiative is based on the under-
standing of the measure under given criteria. Therefore, results of measure comparison must
carried out on the expert judgment and argumentative basis.
Figure 3-7: Illustration of the MCA method in the assessment and selection of measures
Source: Khuat, V.H. (2006)
An application of MCA can be found on the work of Khuat, V.H (2006), which focuses on the

Development of a Multi-Stage Impact Assessment Method for FTM Measures
A Multi-Stage Impact Assessment Method for Freight Transport Management Measures 41
assessment of traffic management measures and strategies in motorcycle dependent cities
(MDCs) (see Figure 3-7). For this study, several FTM measures have been considered for the
impact assessment. FTM measures often aim to achieve more than one goal; these can be the
improvement of mobility, accessibility, safety, economic efficiency or environmental en-
hancement. There is always a trade-off among those objectives advocated for by different
stakeholders and interest groups.
Many difficulties can arise when attempting to measure all relevant impacts of an FTM initia-
tive with intangible impacts, particularly problematic to evaluate. In this context, the MCA is
seen as a suitable tool since it enables multi-criteria analysis to take place via the weighting
and ranking of a proposed FTM measure. Also, MCA is useful for a quick classification and ini-
tial assessment of a proposed initiative from a social-economic perspective, since this method
takes into account multiple stakeholder’s opinions on soft and indirect effects. In addition to
this, MCA further incorporates the perspectives of researchers, which could reduce bias and
eliminate the gap in stakeholders’ opinions and therefore can provide a solid foundation for
pre-selection. For these reason, MCA will be explored further in the later section of the impact
assessment work in this study (in particular in Chapter 5).
Analytical Hierarchy Process (AHP)
The AHP is a typical branch of multi-criteria analysis. It is often used to address different al-
ternatives featuring high degrees of uncertainty, conflicting objectives, different forms of data
and information, and multiple interests and perspectives (Beria et al., 2012). The main steps
of the AHP are, firstly, the establishment of goal system progressing from the general to the
specific. Next, a matrix is constructed addressing the relative values of a set of criteria. Math-
ematical tools are then employed to generate a list of the relative weights, importance, or val-
ue, of the criteria. Finally, a consistency ratio (CR) is calculated to measure how consistent
the evaluations are relative to large samples of purely random judgments. In a simplest form,
the AHP method can consist of three levels as presented in the Figure 3-8 below.
Figure 3-8: Overview of AHP structure
Source: Saaty (1980)
The AHP is a partly-quantitative impact assessment method since it combines both qualitative
and quantitative data in the process. In-depth interviews with experts are conducted to pro-
vide data. Normally, experts with deep understanding of the issue are chosen to present their
evaluation of the relative importance of assessment criteria. These evaluations are then ex-
pressed verbally, numerically or graphically to determine the overall level of importance of
each criterion. A pairwise comparison is then performed to verify the evaluation and sensitivi-
ty analysis is carried out to determine how strongly the ranking of measures/alternatives is in-
Alternatives
Goal
C1 C2 …….
Alternative1 …… Alternative n
Criteria/
Objectives Cn-1 Cn

Development of a Multi-Stage Impact Assessment Method for FTM Measures
A Multi-Stage Impact Assessment Method for Freight Transport Management Measures 42
fluenced by priorities of the individual expert.
Increasing popularity of the AHP method can be observed in modern theories of freight
transport and supply chain management. Berrittella et al. (2007) used the AHP method for
evaluation of transport policies designed to reduce climate change impacts. Kayikci (2010)
applied the AHP and artificial neural networks (ANN) methods in order to select the most ap-
propriate for a location of logistics centre. Furthermore, Dung (2012) listed out 70 papers
published in high quality management journals from 1999 to 2009 that reference use of the
AHP method assessment of a range of different supply chain processes.
The AHP has a big advantage that allows for a hierarchical structure assessment criteria.
Based on that, the established hierarchy, priorities for different courses of action are formu-
lated. Significantly, AHP incorporates both subjective and objective data in the assessment
process, and provides a rigorous mechanism for checking the consistency of evaluations, thus
reducing bias in decision making (Beria et al., 2012). Although the use of AHP is quite appeal-
ing, limitations remain. This method is often associated with considerable mathematics, and is
time-consuming which somehow limits its application in practice. Founauf, L (2015) identifies
potential problems that can arise when using the AHP method for the impact assessment. For
example, the results of the process change when different goal hierarchies are included. Fur-
thermore, there is often also the problem of an insufficient link between semantic and numer-
ical ratio scales. If a hypothetical alternative A is ranked slightly better than an alternative B,
and in turn the alternative B outperforms an alternative C; alternative A will be superior to al-
ternative C, but in reality this is often not the case. However, this is quite justified in the AHP
method since assessment outcomes using this method should be arrived at intuitive reasons.
For these reasons, the AHP method should be considered carefully in the context of the FTM
impact assessment. Advantages and disadvantages of this method will be discussed in further
in the later section.
Matrix method
The primary objective of a matrix approach is to indicate cause and effect by listing activities
along a horizontal axis and their potential impacts along a vertical axis. Where an impact is
anticipated, the matrix is marked with a symbol or number. A pair-wise comparison is then
carried out to identify the preferred course of action.
A matrix approach can be employed to assess the impacts of freight transport projects on the
environment (Banerjee et al., 2015; Canter, 1996; Glen Dhu, 2010). In the research project on
cumulative impact assessment (CIA) for the Eastern dedicated freight corridor ‘s Ludhiana to
Mughalsarai section (Banerjee et al., 2015), series of matrixes on potential environmental im-
pacts have been developed in order to better understand the implications of shifting freight
movement from rail to road. Conclusions in terms of broad cumulative impacts of the eastern
dedicated freight corridor are also generated.
This approach provides a relatively simple way to list out a large number of potential impacts,
which can help to compare options and identify a short list of preferred actions. The drawback
of these matrixes is that they often consider primary impacts but do adequately represent the
cross cause-effect links of a proposed change and other aspects of freight transport system.
3.3.3 Quantitative methods
Quantitative impact assessment is a key aid for governmental and transport authorities justify
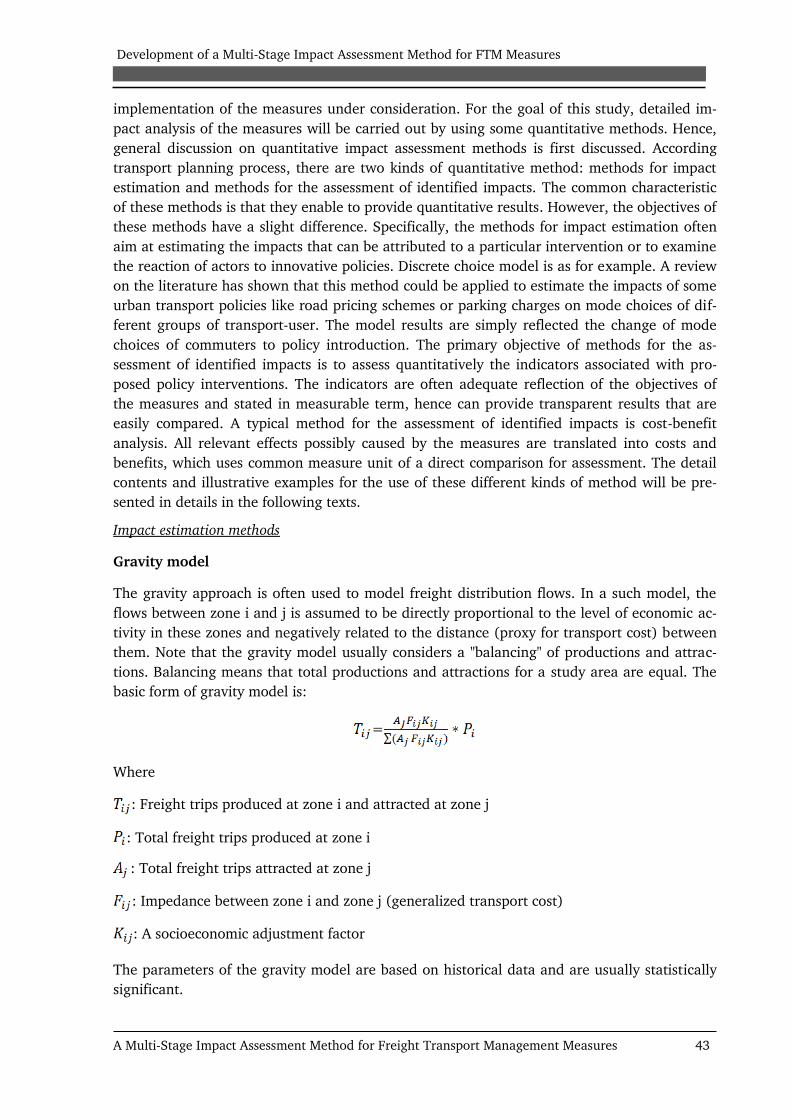
Development of a Multi-Stage Impact Assessment Method for FTM Measures
A Multi-Stage Impact Assessment Method for Freight Transport Management Measures 43
implementation of the measures under consideration. For the goal of this study, detailed im-
pact analysis of the measures will be carried out by using some quantitative methods. Hence,
general discussion on quantitative impact assessment methods is first discussed. According
transport planning process, there are two kinds of quantitative method: methods for impact
estimation and methods for the assessment of identified impacts. The common characteristic
of these methods is that they enable to provide quantitative results. However, the objectives of
these methods have a slight difference. Specifically, the methods for impact estimation often
aim at estimating the impacts that can be attributed to a particular intervention or to examine
the reaction of actors to innovative policies. Discrete choice model is as for example. A review
on the literature has shown that this method could be applied to estimate the impacts of some
urban transport policies like road pricing schemes or parking charges on mode choices of dif-
ferent groups of transport-user. The model results are simply reflected the change of mode
choices of commuters to policy introduction. The primary objective of methods for the as-
sessment of identified impacts is to assess quantitatively the indicators associated with pro-
posed policy interventions. The indicators are often adequate reflection of the objectives of
the measures and stated in measurable term, hence can provide transparent results that are
easily compared. A typical method for the assessment of identified impacts is cost-benefit
analysis. All relevant effects possibly caused by the measures are translated into costs and
benefits, which uses common measure unit of a direct comparison for assessment. The detail
contents and illustrative examples for the use of these different kinds of method will be pre-
sented in details in the following texts.
Impact estimation methods
Gravity model
The gravity approach is often used to model freight distribution flows. In a such model, the
flows between zone i and j is assumed to be directly proportional to the level of economic ac-
tivity in these zones and negatively related to the distance (proxy for transport cost) between
them. Note that the gravity model usually considers a "balancing" of productions and attrac-
tions. Balancing means that total productions and attractions for a study area are equal. The
basic form of gravity model is:
=
Where
: Freight trips produced at zone i and attracted at zone j
: Total freight trips produced at zone i
: Total freight trips attracted at zone j
: Impedance between zone i and zone j (generalized transport cost)
: A socioeconomic adjustment factor
The parameters of the gravity model are based on historical data and are usually statistically
significant.

Development of a Multi-Stage Impact Assessment Method for FTM Measures
A Multi-Stage Impact Assessment Method for Freight Transport Management Measures 44
A review of the existing literature on the gravity model has shown that it works at the level of
aggregated flows. The SIMLE model (Tavassy, 1998) is an example. Under this aggregated
model, the differences of various commodities and trade patterns between regions are often
neglected, leading to a challenges in reaching conclusions for decision-makers in regard to
particular sectors and commodities.
For this study, to capture the core effects of FTM measures in a particular sector, the analysis
requires detailed knowledge of the sector, stakeholders involved and their decisions. Conse-
quently, the feasibility of the gravity model is limited as it does not adequately address the ef-
fects of sector-specific information or stakeholder behaviours on the outcomes of regulatory
changes.
Discrete choice model
Discrete choice models are often used to explain and predict choices between two or more
discrete alternatives, such as the choice of transport mode and vehicle size. An overview of
discrete choice model methodology can be found in the work of McFadden (2001). This mod-
el is based on random utility theory that predicts customer behaviours or purchasing choices
as influenced by utility maximisation or cost minimization. The basic forms of discrete choice
models are logit and nested logit types. These models closely relate the choice of each person
or sector to the attributes of the person/sector and the attributes of the alternatives, by which
the probability of choosing a particular alternative can be estimated.
There is quite a large body of literature relating to the application of discrete choice models in
the freight transport sector. The work of de Jong and Ben-Akiva (2007); Ben-Akiva, Bolduc, &
Park (2008); Arunotayanun (2009); Fries. N et al., (2010) are typical examples. Most of these
studies employed discrete choice models to estimate impacts associated with modal shift be-
tween road transport, railway and combined road and railway transport.
There are some challenges associated with the application of discrete choice models in freight
transport. The difficulties are caused by the high degree of heterogeneity in stakeholders and
diversity of freight transport alternatives. There are many stakeholders involved in freight
transport activity and they often have different concerns of their own (see Section 2.1.1).
Friedrich, H. (2010) pointed out some main causes for heterogeneity and diversity in freight
transport. Firstly, each of stakeholders (i.e. companies) can have different logistics structures,
different possibilities for bundling commodity flows, and also different outsourcing of logistics
services. Hence, availability of logistics service alternatives can be very different depending on
the actor. Secondly, the existence of numerous discrete alternatives can result in combinatori-
al problems (i.e. the warehouse location problem).
For this study, in order to apply a discrete choice model in the example sector, many behav-
ioural data on micro level are needed. The logic behind different behaviours is that their use
of modal choice and route choice differ. Therefore the detailed data associated with modal
choice decision (i.e. transport time, freight rates, lot-size, frequency) should be analysed. Un-
fortunately, such data is not available in this study. Instead, the approach of minimizing total
logistics cost based on the detailed knowledge of stakeholders and their behaviour is used to
model modal choice decision-making patterns. Therefore, TLC model seems to be more pow-
erful in explaining the structure of a specific sector when articulation of the influence of cost
and other factors on transport selection and resulting modal shift.

Development of a Multi-Stage Impact Assessment Method for FTM Measures
A Multi-Stage Impact Assessment Method for Freight Transport Management Measures 45
Agent-based model
The agent-based model increasingly applied in assessing urban freight and city logistics initia-
tives (Tamagawa et al., 2010; Taniguchi and Tamagawa, 2005a; Wisetjindawat et al., 2006).
In agent-based modelling, the stakeholders are described individually with their own objec-
tives outlined, and they tend to behave in line with achieving those objectives. Since this ap-
proach deals with very detailed behavioural level analysis, it can connect to discrete choice
models. More specifically, both models try to identify possible reactions of stakeholders to pol-
icy interventions. The model of Taniguchi and Tamagawa (2005) is an example. This study
works on modelling logistics decisions involving shipment size, use of distribution centres,
mode and vehicle type, and loading units at the firm level. Following this detailed analysis,
the impacts of urban freight measures such as truck ban, road pricing, or logistics consolida-
tion centre emerge as changes in delivery time, truck size, shipment size or mode shift occurs
at firm level.
The big advantage of the agent-based model commonly recognised in the literature is the abil-
ity of the model to facilitate the explicit examining and modelling of different behavioural
changes of stakeholders to policy interventions potentially capturing the causality of impacts
(Holmgren et al., 2014). However, Knaak and Kruse (2006) have identified limitations to this
method in terms of model validation and calibration.
Multi-regional input output (MRIO)
It is apparent from the literature that the impacts of FTM measures can be effectively evaluat-
ed via the application of the MRIO model. The MRIO is often used to generate inter-sectorial
and inter-regional commodity flow matrices with high levels of aggregation. The MRIO model
put forward by Cascetta (2009) and Cascetta et al., (2013) are examples. These studies seek
to determine the deliveries between sectors based on “observational data of economic links
between zones by sector pairs” (Tavasszy et al., 2014). Within this model, there are often two
conversions including from sector classification to commodity classification and from flows in
money units to flows in tons. In order to construct an MRIO model, existing standard conver-
sion tables and value-to-weight data are necessary. According to Tavassy et al., (2014), a
MRIO approach is useful for freight modelling given its focus on from economic linkages since
freight transport demand is considered as directly related to these linkages. The results of this
freight model can then provide freight transport-land use interactions, namely the influence of
spatial distribution on transport. Because of the existence of intermediate warehouses systems
however, the MRIO model does not accurately reflect freight transport flows. Furthermore,
the behaviours of stakeholders involved in freight transport system are neglected in this ap-
proach. This fact may cause difficulty in explaining the causality of identified impacts.
To sum up, MRIO model is useful for analysis at the level of aggregated flow, however, is
based on fix coefficients from statistics. The impacts best explored by the MRIO model are
hence often those related to some typical aspects of a transport network such as new modal
splits, altered aggregate traffic assignment, or other change in logistics structure.
Impact assessment methods
Cost-Benefit Analysis (CBA) and Cost-Effectiveness Analysis (CEA)
Cost-Benefit Analysis has historically been the standard technique used in transport infrastruc-
Development of a Multi-Stage Impact Assessment Method for FTM Measures
A Multi-Stage Impact Assessment Method for Freight Transport Management Measures 46
ture appraisal. Today, it is still widely recognised as a basic tool in a majority of European
countries and the international consulting agencies (Eliasson, 2009; Lambert and Bray, 2012).
According to the Guide to CBA for investment projects (EU, 2008), the CBA appraisal method
is defined as a process of quantifying the costs and benefits of the impacts of a proposed initi-
ative in order to have a single scale of comparison for evaluation. From a practical point of
view, the performance of CBA across different countries could have some differences in term
of unit prices and general economic parameters used; however, it always refers to a single
theoretical framework. CBA is based on monetisation and temporal discount (Beria et al.,
2012). All transport costs and benefits related to a measure or policy are translated into a sim-
ilar monetary unit. It should be noted that the monetizing process covers not only visible costs
and benefits but also their non-monetary attributes. Temporal discounting is used to convert
future costs and benefits into present values for consistency of comparison.
Cost-Effectiveness Analysis (CEA) is an alternative to CBA when the benefits are not able to
monetised within method standard CBA framework. Unlike the CBA method, CEA compares
the relative cost to the effectiveness of the measures in fulfilling a particular objective, i.e. the
volume of CO2 emission that can be reduced per unit of implementation cost of the measure.
The literature review has shown that CEA can help decision-makers to answer basic questions
such as which measure can bring the highest effectiveness at the lowest cost or which meas-
ure can provide the highest effectiveness for a given total cost (Kok et al., 2011). It is obvious,
within the CEA approach, expected outcomes are pre-defined and this ensures that the meas-
ure being applied will contribute to accomplishing stated outcomes.
Regarding the freight transport sector, the application of CEA for the impact assessment of
freight transport initiatives is often limited to specific issues such as pollution emissions and
noise. For example, Corbett et al. (2009) employed CEA to assess the impact of vessel speed
reduction on CO2 mitigation for international shipping. The authors structured a profit-
maximization function with three variables of the speed, fuel use and CO2 emissions. In the
next step, they tried to investigate how shipping firms ‘motivation for profit maximization
CO2 emissions affects ship speed and CO2 emission generation. They achieved quite a good
ratio of cost and effectiveness. Specifically, average speed-related CO2 reduction could reach
20%-30% if fuel tax is set at $150/ton fuel. However, estimation based on the assumption of
constant shipping demand is a significant limitation of this study.
Moving to the topic of the freight transport sector, although widely applied in the evaluation
of transport infrastructure projects, CBA and CEA are rarely utilised in assessing the impact of
FTM measures. Instead, the combination of CBA and multi-criteria analysis (MCA) is seen
more often in the literature review. For example, Kapros (2011) assessed the expected im-
pacts of intermodal freight villages in term of their financial and socio-economic aspects. CBA
is one criterion in their integrated method focusing on potential private benefits and contribu-
tion to national economy.
It can be said then that, difficulties in defining fully and accurately the scope of costs and
benefits, to some extent, makes CBA and CEA appraisal methods less popular in the freight
transport sector. To overcome these limitations, the incorporation of CBA and MCA has be-
come a promising approach for the impact assessment of freight transport management poli-
cies or initiatives.
Social cost benefit analysis (SCBA)

Development of a Multi-Stage Impact Assessment Method for FTM Measures
A Multi-Stage Impact Assessment Method for Freight Transport Management Measures 47
Social-cost benefit analysis (SCBA) is seen as an extension of CBA that incorporates non-
monetary costs and benefits related to social and environmental impacts. In the other word,
SCBA aims at quantifying economic, social and environmental costs and benefits, by using
monetary values. Gonzalez-Feliu (2014) developed an SCBA-based analysis framework for the
assessment of a strategy scenario in the context of railway project development, which covers
all kinds of possible costs and benefits generated for investors, carriers, passengers, and socie-
ty. The proposed framework is applied in evaluating the freight tramway project in Paris
(France). The interesting result demonstrated that the project is not effective from a CBA
evaluation due to negative internal rate ratio (IRR). However, solid equilibrium can be arrived
by adding non-monetary costs and benefits such as a decrease in pollution, noise and conges-
tion for example. SCBA can therefore be a useful tool for decision-makers seeking to impose
policy interventions without discussion and consensus among stakeholders. As a result, a
SCBA appraisal should provide a solid foundation for decision-making groups justify imple-
mentation of the measures under consideration.
Total Logistics Cost (TLC) Model
The total logistics cost (TLC) model is an application of microscopic analysis in the impact as-
sessment. Theoretically, total logistics cost is the sum of transport cost, handling cost, invento-
ry cost and any other costs of doing business with a particular mode of carriers. Many innova-
tive models are based on choices associated with total logistics cost rather than just transport
cost only. For example, Sheffi et al ‘s (1988) model was developed to look at mode choice
from the shippers’ point of view, based on EOQ-type optimal trade-offs between inventory
carrying costs and transportation cost. Also, using this model, one can easily see the impact of,
for example long transit time or unreliable service on shippers’ inventory cost. More recently,
Chow (2007) attempted to develop a TLC model to assess the potential impacts of security in-
itiatives or other supply chain improvements to a particular routing and gateway alternative.
Figure 3-9: Example of TLC model for impact assessment of changes in logistics and transport
systems on distribution structures
O D S1
Chain type 1 (direct) – TLC1
O D S2 W S3
Chain type 2 (one warehouse) – TLC2
O D S2 S3 S4
Chain type 3 (two warehouses) – TLC3
W W
Notes: O – Origin; D- Destination; S- Segment; W-Warehouse
Source: Tavassy et al. (2014)
The ADA (aggregate-disaggregate-aggregate) model given by Ben-Akiva & de Jong (2008) al-

Development of a Multi-Stage Impact Assessment Method for FTM Measures
A Multi-Stage Impact Assessment Method for Freight Transport Management Measures 48
so bases the choice of transport chain (number of stops, mode and vehicle type, and terminal
used) on lowest total logistics cost. Davydenko et al. (2012) published research results for es-
timating freight flow generation using a discrete choice model based on total logistics costs at
sectorial level.
In his research, Davydenko et al. (2013) divided transport chains into different segments, and
took into account value of time (VOT), transport mode and transport tariffs for each segment
in estimating TLC. The changes in TLC are assumed a main driver for changes in behaviours
of shippers as a result of policy intervention. The results of this study imply that using TLC
model, the impact of regulatory changes can be quantified and causality identified. The im-
perative for access to detailed data, however, is one of biggest limitation of this approach.
For this study, the Vietnamese rice industry will serve as an example for the assessment of the
core effects of FTM initiatives. In this context, TLC could be very useful for carrying out de-
tailed impact analysis in the rice industry. This is because it enables differentiation of a dis-
aggregate population of rice commodity flows and distribution locations. More specifically, it
accommodates taking into account mode and route choices for each rice commodity flow.
Based on this understanding, the impacts of FTM policy changes can be captured at a dis-
aggregate level. The TLC model will be further explained and applied in more detail in a later
part of this study (Chapter 5).
3.3.4 Conclusions
With such a large body of literature reviewed, a number of impact assessment methods for
FTM measures have been identified, methods that differ in scopes and core objectives as well.
It is difficult to compare these methods directly due to the fact that each of them is identified
as suitable for a given objective, scale of activity and resource set. For this study, the question
of how to develop a comprehensive method for FTM impact assessment cannot be answered
by advocating for one method or another, but requires utilising a combination of approaches,
for example TLC used within a logit model. The next section will focus on the evaluation of all
methods mentioned above in terms of advantages, disadvantages, and application to the
freight transport sector.
3.4 Discussion of existing methods
As noted above, this section aims to discuss advantages and disadvantages of each impact as-
sessment method relevant to the freight transport sector.
Qualitative assessment methods
Within the context of freight transport, qualitative approaches have shown the most ad-
vantage in their ability to assess complex issues through relatively simple structures. In partic-
ular, most qualitative methods such as brainstorming, expert survey or focus group discussion
accommodate extensive involvement of stakeholders in the impact assessment process, which
enables a quick highlighting of problems and consideration of a wide range of potential im-
pacts. Furthermore, some qualitative methods have the ability to explore the causality of im-
pacts within their context, SWOT methods for instance. It can be stated then that most quali-
tative assessment methods are relatively simple and inexpensive compared to other assess-
ment techniques. The common characteristic of these methods is that they allow the issue un-
der analysis to be explored not through one lens alone, but rather multiple lenses, which ena-

Development of a Multi-Stage Impact Assessment Method for FTM Measures
A Multi-Stage Impact Assessment Method for Freight Transport Management Measures 49
bles solid justification of FTM measures with reference to different aspects of anticipated im-
pacts. The input data for these approaches require less use of mathematical formula during
analysis. However, the key disadvantages of qualitative methods lies in the challenges associ-
ated with explaining the core effect of measure. Qualitative methods support thorough under-
standing of a range or list of important impacts, but hardly provide a rigorous mechanism for
ranking the significance of one impact versus another within the list. In addition to this, most
indicators used in the qualitative impact assessment processes are formed at an aggregate lev-
el, thus limiting the quality of assessment. Qualitative methods are further prone to higher
degrees of subjectively and therefore potentially bias in research results. Detailed pros and
cons of each qualitative method used in FTM impact assessment process are presented com-
prehensively in Table 3-7.
To summarise, qualitative approaches provide a major advantage in quickly highlighting a
range of problems and their potential impacts. Also, they often facilitate significant involve-
ment of stakeholders in the assessment process, which can allow for multiple aspects of the
problems to be revealed and understood. The most significant disadvantages of these methods
are potential subjectivity and limited explanation of the causality of impacts. Furthermore,
analysis of qualitative data lacks a rigorous and scientific base for the generalisation of con-
clusions.
For the purpose of this study, to formulate a comprehensive framework for the impact as-
sessment of FTM measures, qualitative methods are suggested for use in defining a list of po-
tential impacts possibly caused by FTM measures. Based on possible impacts generated from
qualitative assessment, quickly screening and narrowing down of the list of measures for as-
sessment can take place. Among the methods considered, brainstorming, expert surveys and
focus group could be ideal for achieving this stated objective. The rational is that these meth-
ods often consider multiple dimensions of impacts by considering the opinions of various
stakeholders involved in freight transport. Moreover, they have the ability to generate a clear
mechanism for classifying and assessing qualitatively the impacts of specific measures. For
these reasons, the study will employ these qualitative methods for the first assessment stage of
FTM measures.
Partly-quantitative assessment methods
As discussed previously, partly-quantitative methods involve both qualitative and quantitative
data analysis. This means that these methods incorporate a combination of subjective judg-
ments and quantitative estimations in the assessment process. Therefore, their first advantage
is the potential ability to provide sound reasoning for an impact assessment. Secondly, most of
these methods employ rigours mechanism for comparing and assessing data, which is useful
for the process of pre-selection of measures. Detailed advantages and disadvantages of each
method are discussed as follows.
The Delphi method produces a high level of consensus in the impact assessment through use
of multiple iterations of expert surveys, which results in the generation of a list of impacts un-
der consideration and rating for relative levels of importance each potential impact. However,
the disadvantage of this method is that implementation can be complex in practice due to the
need for the selection of panel experts, making the method time and cost consuming.
MCA and AHP are powerful tools for selecting alternative policies or strategies since they take
into account various impact dimensions (for example, socio-economic, environmental, safety,
Development of a Multi-Stage Impact Assessment Method for FTM Measures
A Multi-Stage Impact Assessment Method for Freight Transport Management Measures 50
and mobility aspects) and further facilitate involvement of different stakeholders in the as-
sessment process. More specifically, intangible and soft impacts are better measured within
MCA and AHP methods; therefore, conclusions arrive at via MCA and AHP widely acknowl-
edged in transport decision-making processes. Broadly speaking, the MCA and AHP appear
more rigorous and formal, providing a rational framework for weighting and ranking the rela-
tive level of importance of FTM measures. Nevertheless, the technical procedures involved
MCA and AHP are quite complex and sensitive to the changes in the goal hierarchy system
and the scales established at the beginning of the impact assessment process. Additionally, the
assignment of a numerical scale in qualitative assessment, from the most important to the
least important, is not always sufficient. The reason for this is that the assessment of experts
as verbal comparison can go through such a varied range of emotion than numbers. Both
methods also neglect to provide sufficient insight into the causality of policy impacts. Particu-
larly, the reaction of stakeholders to policy intervention cannot be adequately captured via
these methods, and their usefulness in identifying causality is limited.
The matrix method is a simple technique for listing out a large number of potential impacts
and it enables the inclusion of qualitative comments on their causes and effects. However,
given specific characteristics of freight transport as heterogeneous and the diversity of poten-
tial alternatives; the limitation of this method is that typically only primary impacts are illus-
trated within matrices. In addition, the overall impact estimate is a number or single mark,
thus the ranking order of overall impacts can be quite different when qualitative data is repre-
sented in numerical scale. Detailed pros and cons of each partly-quantitative method are pre-
sented in Table 3-8.
Moving to focus of this study, there is often a bundle of measures that can be applied in the
freight transport sector. Given a specific situation, these measures can have differences in
their degree of importance. For the reason of efficiency, it is not appropriate to evaluate all
measures for an impact assessment. Therefore, this study will carry out a pre-selection and
classification process to identify which initiatives to assess. A review and analysis of the pros
and cons of partly-quantitative methods has revealed that the Delphi, MCA and AHP methods
can be powered useful tools for fulfilling this objective. Those methods allow for screening of
the impacts under considerations with reference to of socio-economic, environmental, safety,
and mobility implications in order to provide useful overall comparisons between proposed
FTM measures. However, the Delphi, MCA and AHP methods are often more subjective in na-
ture and do not provide sufficient insights into the causality which noted above. For these rea-
sons, within a comprehensive framework for impact assessment that this study will develop,
the recommendation is to use these tools for initial selection and quick assessment of potential
impacts. This step in the process will provide input data for the prioritisation of measures for
assessment, allowing the selection of specific measures for detailed quantitative analysis.
Quantitative assessment methods
A review of the application of quantitative assessment methods has shown that they can actu-
ally be performed on different aspects of policy under assessment. Specifically, CBA, CEA, and
SCBA deal with the detailed quantitative level of costs and benefits possibly caused by freight
transport activities. These methods are especially useful in assessing impacts in terms of eco-
nomic efficiency, hence can provide transparent results that are easily communicated. In addi-
tion, CBA, CEA, and SCBA facilitate the comparison between different policy interventions
since they generally use common units of measurement. SCBA methods in particular usually

Development of a Multi-Stage Impact Assessment Method for FTM Measures
A Multi-Stage Impact Assessment Method for Freight Transport Management Measures 51
reflect the interests of various stakeholders involved, which can provide compelling evidences
for policy decision-making. Nevertheless, CBA, CEA, and SCBA also face some limitations in
practice. Most encounter difficulty in precisely defining and quantifying all kinds of external
costs and benefits caused by freight transport. Therefore, the potential for double counting is
a visible risk. Moreover, these methods do not take into account interactions among stake-
holders. Instead, they are based on the assumption that there is equal willingness-to-pay
among stakeholders (for example CBA, SCBA). This may consequently provide assessment
outcomes that focus on quantitative data related to policy implications in terms of costs and
benefits but that do not offer sufficient explanation the reasons behind those impacts.
The TLC, discrete choice and agent-based models are seen as disaggregate approaches that fo-
cus on detailed analysis of stakeholder behaviours. The big advantage of such methods is the
ability to model fundamental reactions of stakeholders to policy intervention, which ultimate-
ly enables explanation of the causality of impacts. The TLC model focuses on detailed popula-
tion of commodity flows and allows taking into account mode and route choice for each
commodity flow in the impact assessment process. Also, TLC has the ability to explain the
most important drivers within a sector and their interdependencies which determines the be-
haviour of stakeholders. Meanwhile, the agent-based model deals with detailed behavioural
level and then explains possible reactions of stakeholders to policy interventions. However,
the agent-based model often encounters numerous difficulties related to validation and cali-
bration. The discrete choice model can be applied to estimate and explain freight modal sec-
tion based on shipper characteristics. However, while the discrete choice model is a powerful
tool in analysing of discrete alternatives for passenger transport, its application is challenging
in the freight transport sector due to the heterogeneity of stakeholders and diversity of alter-
natives present. Finally, three disaggregate approaches mentioned above demand high vol-
umes of data and large amounts of processing work in order to model all entities at a micro-
level.
Unlike disaggregate approaches; gravity model and MRIO are especially useful in large-scale
impact assessments at s international, national or regional levels. Data requirements for these
models are limited compared to disaggregate approaches. However, they operate based on the
assumption of deterministic stakeholder relationship, and this presents a difficulty in explain-
ing policy impact causality. Detailed information on pros and cons for each quantitative
method is shown in Table 3-9.

Development of a Multi-Stage Impact Assessment Method for FTM Measures
A Multi-Stage Impact Assessment for Freight Transport Management Measures 52
Table 3-7: Advantages and disadvantages of qualitative impact assessment methods
Benchmarking Brainstorming Expert consultation Focus groups SWOT
analysis
Application in the eval-
uation process
Ex-ante
Ex-post Ex-ante Ex-ante Ex-ante
Ex-ante
Ex-post
Pros of method
Clear objective and mech-
anism to compare differ-
ent aspects of freight op-
eration to similar phe-
nomenon
Possibly classify and as-
sess qualitatively (or even
quantitatively) the im-
pacts of measures
Simple and low cost
Involvement of many
stakeholders in the
qualitative impact as-
sessment
Ability to generate ide-
as around potential
impacts in a short time
Simple and inexpen-
sive technique
Utilization of deep
knowledge of experts
for the impact as-
sessment
Quick highlighting of
problems and poten-
tial improvements
Participation of many
stakeholders in im-
pact assessment pro-
cess
Ability to define an-
ticipated impacts
with low level of ef-
fort
Consideration of a
wide range of im-
pacts
Possibly deals with
complex issues through
a simple structure
Ability to explore the
important factors af-
fecting measure im-
plementation and its
impacts
Cons of method
Utilises aggregate indica-
tors which could make the
assessment results mis-
leading
Need large range and vol-
umes of data, sometimes
unavailable
Narrow scope
Lack of reliable criteria
to determine the quali-
ty of assessment
Does not provide in-
sights into causality of
impacts
Potential subjectivity
Hard to explain the
causality of impacts
Lack of rigorous sci-
entific basis for con-
clusion generalisation
Potential divergent
data collection possi-
bly influencing the
results
Does not provide
mechanism to rank the
significance of one fac-
tor versus another
within the list
Does not sufficiently
explain core effect of
the measure under as-
sessment
Source: Own representation

Development of a Multi-Stage Impact Assessment Method for FTM Measures
A Multi-Stage Impact Assessment for Freight Transport Management Measures 53
Table 3-8: Advantages and disadvantages of partly-quantitative impact assessment methods
Delphi MCA AHP Matrix approach
Application in evalua-
tion process
Ex-ante
Ex-post
Ex-ante
Ex-post
Ex-ante
Ex-post
Ex-ante
Pros of method
Ability to assess impacts
and prioritize measures
Possibly reach consensus in
assessment of the impact
intervention
Combination of qualitative
and quantitative techniques
in impact assessment
Suitable for the assessment of
socio-economic aspects of FTM
measures
Participation of many stake-
holders in the impact assess-
ment which can enlarge “de-
mocracy” in term of public dis-
cussion
Combination of subjective
judgments and quantitative es-
timation in the assessment
process
Clear and rigorously ap-
plied mechanism to meas-
ure and compare different
alternatives featuring high
uncertainty and conflicting
objectives
Allows ranking and priori-
tizing of measures
Indicates qualitatively the causes
and effects of a measure and its
potential impact
Useful in environmental impact
assessment
Simple technique
Cons of method
Difficult to design effective
Delphi study due to high
demands associated with of
expert selection
Potential subjectivity
Time and cost consuming
involves many rounds of
expert survey)
Potential ambiguity and sub-
jectivity
Does not provide insight on
causality of impacts
Does not consider public ex-
penditure efficiency
Extensive data requirement
Possible lack of consistency in
comparing data
Potential insufficient link
between semantic data and
numerical scale
Inaccurate sensitivity to
changes ‘s stakeholders be-
haviour
Involves considerable com-
puting and is time-
consuming
Only considers primary impacts
Simple comparison of different
impacts using single mark or
verbal explanation
Does not sufficiently explain
core effects of the measure un-
der assessment
Source: Own representation

Development of a Multi-Stage Impact Assessment Method for FTM Measures
A Multi-Stage Impact Assessment for Freight Transport Management Measures 54
Table 3-9: Advantages and disadvantages of quantitative impact assessment methods
Gravity Discrete choice
model
Agent-based
model MRIO CBA/CEA SCBA TLC
Application
in evalua-
tion process Ex-post Ex-post Ex-post Ex-post
Ex-ante
Ex-post
Ex-ante
Ex-post Ex-post
Pros of
method
Enables modelling
freight transport
demand between a particular spa-
tial distribution
and origin
Ability to assess
impacts on a
large-scale, such
as international,
national or re-
gional levels
Enables prediction
of mode and logis-
tics choices
Potential to in-
clude many causal
variables in the
model
Ability to model
stakeholder be-
havioural changes resulting from
policy interven-
tion
Potentially cap-
tures the causality
of impacts
Links to wider
economy (produc-
tion and con-sumption sectors)
Ability to consider
the impacts of
land-use on
transport systems
Clearly define the
impact in term of
economic efficien-cy
Use common unit
of measurement
when screening
and ranking
measures
Transparent re-
sults and easily
communicated
Incorporates both
monetary /non-
monetary costs and benefits
Provides scientific
tools to support
policy decision-
makers
Focuses on de-
tailed level of
commodity flows and locations of
distribution
Enables explana-
tion of stakehold-
er behavioural
changes resulting
from policy inter-
vention
Cons of
method
Based on deter-
ministic stake-holder relation-
ship
Neglects the dif-
ferences in com-
modities and
trade patterns
across regions
Needs disaggre-
gated data (ship-pers, commodity
flows, Stated
Preference Sur-
vey)
Limitations to
model validation and calibration
High requirement
of input data and
large amount of
processing power
Does not consider
intermediate steps in the spatial dis-
tribution (i.e.
warehouse sys-
tems)
Limited ability to
monetise external impacts
Based on various
assumption (e.g.
equal willingness-
to-pay)
Extensive data re-
quirements
Difficulty in de-
termining exact external costs and
benefits
Potential double
counting of costs
and benefits
Complicated esti-
mation process
Acknowledges on-
ly TLC driver fac-tors leading to
changes in stake-
holder behaviour
Extensive data re-
quirement and
completed analy-
sis
Source: Own representation

Development of a Multi-Stage Impact Assessment Method for FTM Measures
A Multi-Stage Impact Assessment for Freight Transport Management Measures 55
Conclusion
The assessment method utilised for estimating these impacts should depend on planning pro-
cess stages, on the type of measure, and on the sector considered. Qualitative methods typi-
cally allow quick classification of measures to be adopted and their potential impacts, but they
do not provide precise analysis of those impacts. Quantitative analysis of the core effects of
policy intervention can, however, overcome some of the limitations associated with the quali-
tative assessment processes, but data availability and overall efforts required are usually criti-
cal. Partly-quantitative assessment is in some ways more useful in the first stage of an assess-
ment when policy measures are ranked in terms of importance, generating a list of potential
measures for further detailed analysis. Nevertheless, these approaches do not sufficiently ex-
plain causality. For efficiency reason, it is not appropriate to do impact assessment of all
measures as well as select only one single method for all circumstances. Therefore, a multi-
stage assessment method is necessary for first assessment of classification of measures, and
then detailed quantitative analysis of specific measures.
3.5 Developing a multi-stage impact assessment method for FTM measure
This section focuses on formulating a method for assessing FTM measures. The formulation is
based predominantly on the analysis of the cons of each impact assessment method as dis-
cussed in the outcomes of the previous section. Next, the detailed processes associated with
each step in the method are discussed. Finally, conclusions and recommendations are provid-
ed in the last part of this section.
A literature review on impact assessment methods enables this study to propose a comprehen-
sive impact assessment method for FTM measures as presented in Figure 3-10. As presented
in Figure 3-10, a multi-stage impact assessment method has been developed which systemati-
cally integrates various FTM measures and evaluates them at different levels of detail. Essen-
tially, the proposed method is comprised of two main assessment stages. The first stage aims
to assess and classify FTM measures via qualitative or partly-quantitative methods. The sec-
ond stage focuses on specific measures identified in the first stage and core anticipated effects
are assessed using methods that employ detailed quantitative analysis. The following parts of
this paper will discuss the contents as well as the techniques possibly used in each assessment
stage.
The first assessment stage
The first assessment stage involves two main objectives: defining problems and a list of poten-
tial FTM measures to deal with those problems; and weighting and ranking these measures. In
fact, it is of critical importance to determine and sufficiently understand the problems to
be solved and list of potential measures. This is because the quality of subsequent impact
assessment stages depends on whether problems are correctly defined or not. Numerous tech-
niques are useful for problem definition at this stage. The most common qualitative tech-
niques are brainstorming, focus groups, and expert consultation. These methods enable high-
lighting of problems associated with freight transport and of potential FTM measures to deal
with these problems. It is of note that most of these techniques involve a wide range of stake-
holders in the assessment process, which allows multiple existing aspects and potential freight
transport problems to be identified and understood. These techniques also facilitate formal re-
cording via listing of potential measures to solve these problems.

Development of a Multi-Stage Impact Assessment Method for FTM Measures
A Multi-Stage Impact Assessment for Freight Transport Management Measures 56
After defining the problems and understanding their reasons, latent effects and amplitude, as
well as proposing a list of potential FTM measures, it is necessary to check the interdepend-
ency of proposed measures. The rational for that is there are existing interdependencies be-
tween measures in freight transport, production and logistics. This results in a strong need to
assess these interdependencies and design a measure package that will achieve system opti-
mization. Therefore, for each goal in freight transport management (mentioned in Section
2.1.2), the relationship between measures is qualitatively assessed to determine the way in
which the proposed measures are independent, complementary or substitutability. The as-
sessment can be facilitated through expert consultations or a survey of stakeholders.
For effectiveness assessment criterion, the relationship between measures are evaluated as the
followings:
• Independent: the implementation of two measures (Mi and Mj) together yields a similar
level of effectiveness as the implementation of each measure individually, as presented
in the following formula:
Effectiveness (Mi + Mj) = Effectiveness (Mi) = Effectiveness (Mj)
• Complementary: the implementation of two measures (Mi and Mj) together yields a
higher level of effectiveness than the sum of effectiveness attained by implementing
each measure individually
Effectiveness (Mi + Mj) ≥ max (Effectiveness (Mi); Effectiveness (Mj)
• Substitutability: the implementation of two measures (Mi and Mj) together yields a
lower level of effectiveness than the implementation of each measure individually, as
presented in the following formula:
Effectiveness (Mi + Mj) < max (Effectiveness (Mi); Effectiveness (Mj)
After checking the interdependency of measures, a method is established to weight and rank
the importance level of these measures. A review and analysis of the pros and cons of the
assessment methods has revealed that the Delphi, MCA, and AHP methods are powerful tools
for fulfilling this objective. These methods allow for screening of the impacts under considera-
tions to determine socio-economic, environmental, safety, and mobility implications, which
ultimately allows for an overall comparison between FTM measures. In addition to this, the
involvement of multiple stakeholders in the assessment process demonstrates the effectiveness
of these methods in terms of generalization of inclusions.
Following process outlined above, two hierarchical groups of criteria are employed to weight
and rank FTM measures, namely Effectiveness representing the expected impacts and Ap-
plicability representing the main barriers in implementation of the measures.
Effectiveness is measured by estimating the impacts of measures towards four objectives (cri-
teria): improvement of freight movement; improvement of economic efficiency; improvement
of traffic safety; and improvement of environmental protection. Under each objective, there is
a set of sub-criteria used to measure impacts and to provide more detail. For example, if the
objective is to improve freight transport, the corresponding sub-criteria could be change in the
number of trips; change in the number of ton-km; change in modal split; and change in tem-
poral traffic. All objectives are similarly further broken down into relevant sub-criteria, which
are geared towards achieving corresponding higher objectives.

Development of a Multi-Stage Impact Assessment Method for FTM Measures
A Multi-Stage Impact Assessment for Freight Transport Management Measures 57
Figure 3-10: Proposal of a multi-stage impact assessment method for freight transport management measures
Problem definition and list of potential FTM measures
STAGE 1
STAGE 2
Interdependent check of the measures
Independent
Complementary Substitutability
Weight and rank
Applicability criteria Effectiveness criteria
List of priority measures
Logistics and production analysis
Sectorial analysis
Setting-up scenarios
Identification of main drivers of stakeholder Modelling
Quantification of impacts of the measures
Development of a Multi-Stage Impact Assessment Method for FTM Measures
A Multi-Stage Impact Assessment for Freight Transport Management Measures 58
Applicability is also an important criterion for assessing proposed FTM measures. It is often
indirectly measured by estimating the barriers or difficulties, which an FTM measure will like-
ly to face in the implementation process. A higher level of difficulty in implementation indi-
cates a lower level of applicability, and vice versa. Normally, there are two main barriers to
increasing the applicability of FTM measures - financing the measure and public acceptance.
The criterion of financing proposed measures involves costing, which determines the afforda-
bility to the government/city council of the implementing measures. Costs consist of two main
components: investment costs and operational costs. In addition, the applicability of measures
depends on the support of stakeholders, who are divided into two groups: transport users and
non-transport users. Transport users can be defined as actors who directly involved in the
transport activities such as carriers, or LSPs. Other actors who do not use any mode of
transport but who are indirectly influenced by the implementation of FTM measures are re-
ferred to as non-transport users (e.g. shippers, receivers, residents, and public authorities).
Once criteria and sub-criteria in terms of the effectiveness and the applicability have been es-
tablished, a weighting of criteria is required. The weight assigned represents the relative im-
portance of a criterion; sub-criterion and weighting can be done verbally, numerically or
graphically. The technique commonly adopted to assign weighting and ranking is via ex-
pert survey. In fact, as noted previously, FTM measures aim to achieve multiple goals related
to mobility, accessibility, safety, economic efficiency and environmental enhancement. There-
fore, there is always a trade-off among those objectives advocated for by different stakehold-
ers and interest groups. Within this context, the selection of experts participating in weighting
and rating different criteria need to be handled carefully. Experts may place greater emphasis
on objectives that align with their individual perspectives of the perspectives of the group they
present; therefore, there is a risk of subjectivity associated with the weighting process. It is
recommended then that a range of experts selected for this process represent all interested
parties involved in the freight transport system. Specifically, this requires the inclusion of ex-
perts representing carriers, shippers, LSPs, transport authorities, residents and administrators.
Appropriate representation on the panel or all interest groups can reduce bias and help to
eliminate the gaps in criterion selection and overall outcomes of the qualitative assessment. At
the end of this stage, a final weight will be estimated for each measure.
The second assessment stage
This stage focuses on detailed quantitative analysis of pre-selected measures based on a
comprehensive sector analysis. Because of the multi-dimensional nature of FTM measure
impacts, interdisciplinary consideration of production, logistics and freight transport system is
necessary to identify the main factor driving changes in stakeholder behaviour following poli-
cy intervention. Policy application scenarios can then be defined and detailed quantitative im-
pact analysis can take place.
A review and discussion on the pros and cons of different assessment methods has shown that
the application of disaggregate models is highly necessary to capture and estimate the core ef-
fects of an intervention. Consequently, this study proposes methods for possible use in de-
tailed analysis of the impacts of FTM measures including the TLC model, agent-based model,
and discrete choice model. These models focus on analysis at a detailed behavioural level and
differentiate disaggregate population of commodity flows. In particular, it allows for detailed
knowledge of structure (of network or sector), stakeholders involved and their potential be-
Development of a Multi-Stage Impact Assessment Method for FTM Measures
A Multi-Stage Impact Assessment for Freight Transport Management Measures 59
havioural changes by which the core effects of proposed measures can be estimated and ex-
plained their causalities explained. Finally, as a result, traffic, safety, economic and environ-
mental benefits can be quantified at both company level and transport network level.
To summarise, through this multi-stage impact assessment method for FTM measures it has
been established that it is possible to define and classify the FTM measures and their potential
impacts. Significantly, this method can help to capture and estimate the core effects of these
measures. The proposed impact assessment method also facilitates involvement of a broad
range of stakeholders in different stages of the assessment process, increasing the validity of
conclusion. The limitation to this method is the need for the extensive data and the large
amount of processing work required in the assessment process.
This study plans to take the Vietnamese rice industry as an example sector for application.
Among various methods presented in the proposed multi-stage impact assessment method, it
is necessary to define methods most relevant to assessing the impacts of FTM measures in the
context of the Vietnamese rice industry. Currently, there is a wide range of different stake-
holders involved in the rice industry, namely farmers, collectors, millers, polishers, freight
transport operators, food companies, wholesalers, retailers, and individual/household con-
sumers. Furthermore, FTM measures in the rice industry have been recognised as closely re-
lated to rice production and logistics processes. Rice freight transport plays a connective role
in several immediate steps that involves in moving rice commodities from farmers to final
consumers in HCMC.
In order to both establish a comprehensive understanding of the context and achieve precise
analysis of policy intervention impact, assessment of FTM measures in the Vietnamese rice in-
dustry should take into consideration different stakeholders’ opinions. Furthermore, signifi-
cant impacts related to traffic and transport, environment and safety should be assessed quan-
titatively in order to identify the core effects of proposed measures. By employing the pro-
posed meta-assessment criteria for selection of methods presented in Table 3-6 this study
conducts qualitative evaluation of available assessment methods before reaching conclusions
on the most suitable approach possibly to assessing the impacts of FTM measures in the rice
industry. Details are presented in Table 3-10.
Following the evaluation results, MCA is recommended for the first assessment stage of FTM
measures in the rice industry since they take into account several stakeholders’ interests and a
wide range of impacts. Furthermore, it enables to rank and weight various FTM measures,
which are already and potentially applied in the rice industry. Significantly, the application of
this method can cause less cost than other ones since this study gets strong cooperation from
VINAFOOD 2 and VFA in introducing stakeholders joining the expert interview survey. In the
second assessment stage, TLC model could be very useful for the detail impact analysis of the
measures in the rice industry. This is because TLC model has a strong ability in quantifying
the impacts of FTM measures and explaining their causes. In addition, TLC is also one of the
most crucial factors for transport mode choice which has been widely seen in the literature.
Meanwhile, modal selection has for long seen as the most traditional decision from shippers’
perspective in the rice industry. This decision is not only simply influenced by transport cost
but also by other cost elements facing the particular shipper such as rice handling and inven-
tory cost. All of them form total logistics cost for using a particular transport mode. Apart
from that, available data is also a strong argument to choose TLC model as key method for the
detailed analysis of the impacts of FTM measures in the rice industry.

Development of a Multi-Stage Impact Assessment Method for FTM Measures
A Multi-Stage Impact Assessment for Freight Transport Management Measures 60
Table 3-10: Qualitative assessment of different potential methods for the assessment of FTM measures in the Vietnamese rice industry
Meta-assessment criteria Focus
group
Brain-
storming
Expert
consulta-
tion
Delphi
method MCA AHP TLC
Agent-
based
model
Discrete
choice
model
Effectiveness in capturing impacts
Clear objective of impact assessment + + + + + + + + +
Taking into consideration of perspectives
of different interest groups + + o o + + + + o
Ability to rank measures - - - + + + o o o
Ability to explain causality - - - - - - + + +
Providing scientific or quantitative ana-
lytical tools - - - - - - + + +
Availability of reliable data
Ability to collect enough data to meet
requirement at different levels of analysis + + + o o o + - -
Minimization of cost and time
Minimizing cost for data collection and
preparation + + + o o - + - -
Minimizing cost for implementation of
evaluation + + + o o - + - -
Acceptance maximization
Ensuring the reliability of results - - - o o o + + +
Easy application for similar phenomenon + + + + + + + + +
Notes: + Good o Neutral - Bad Important for the 1st stage of impact assessment
Important for the 2nd stage of impact assessment
Development of a Multi-Stage Impact Assessment Method for FTM Measures
A Multi-Stage Impact Assessment Method for Freight Transport Management Measures 61
3.6 Conclusions
So far, there have been many attempts paid to develop the methods for the impact assessment
of transport policies or measures. The application of those methods much depends on the
purpose of assessment, the socio-economic context, available budget, available data and other
factors. In this chapter, the study tried to comply all methods which can be applied in as-
sessing FDTM measures. They are basically divided into three groups: qualitative, partly-
quantitative and quantitative methods. The contents as well as the pros and cons of each
method are discussed in detail. The discussion lays an emphasis on the detailed level of im-
pact analysis as the results of the method application. Qualitative methods often allow a quick
classification and the first assessment of adopted measures and their impacts, but they do not
provide precise analysis of those impacts. Quantitative analysis of the core effects of the
measures can, however, overcome some limitations of the qualitative process, but data availa-
bility and overall efforts are usually critical. Partly-quantitative methods are somehow useful
in weighting and ranking the measures, but they are hardly in explaining the causes of the
impacts. As a consequence, the study proposes a comprehensive multi-stage impact assess-
ment method for FTM measures, which comprises of two main stages. The first stage covers
two main working items including the definition of problems and list of potential FTM
measures to deal with these problems; and weighting/ranking the important level of these
measures. In the second stage, a detailed quantitative assessment is implemented to analyse
the core effects of FTM measures. The proposed framework also recommends different meth-
ods that could be used to fulfil the objective of each stage. Within the multi-stage impact as-
sessment for FTM measures, it is possible to comprehend the whole picture of the impacts, al-
so by which the core effects can be estimated. The limitations of this method may be the re-
quirement of a large involvement of stakeholders in the first weighting and ranking process of
the FTM measures; and extensive data together with a complicated estimation process in the
stage of detailed analysis of the impacts.
In next chapters, the study plans to take the rice industry in Vietnam as an application case.
The reason for choosing this sector is that it has available data to test various kinds of impact
possibly caused by FTM measures. Besides, there are a lot of FTM measures applied in the rice
industry. Traffic volume due to rice transport is increasing quickly. Vietnam is also known as
the second largest rice exporter in the world. The rice industry involves various stakeholders
such as farmers, collectors, millers, polishers, food companies, wholesalers, retailers etc. The
knowledge on decisions of those stakeholders is very useful for the prediction of their reac-
tions to FTM measures.
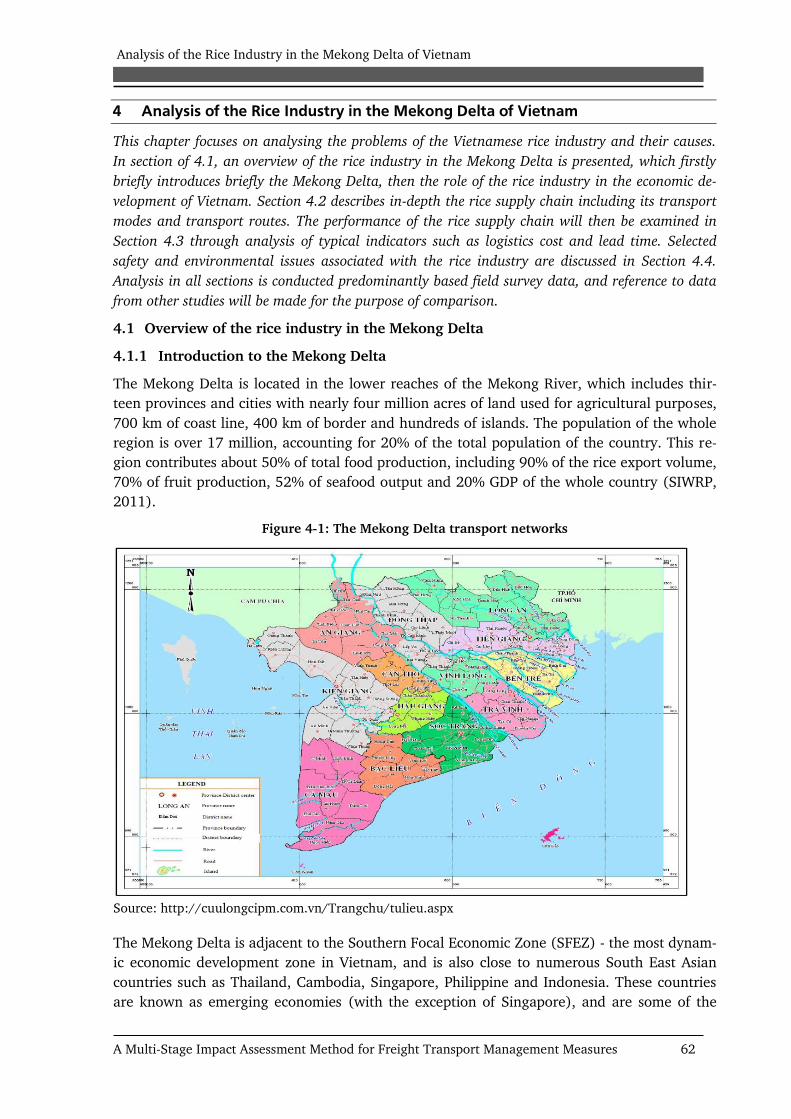
Analysis of the Rice Industry in the Mekong Delta of Vietnam
A Multi-Stage Impact Assessment Method for Freight Transport Management Measures 62
4 Analysis of the Rice Industry in the Mekong Delta of Vietnam
This chapter focuses on analysing the problems of the Vietnamese rice industry and their causes.
In section of 4.1, an overview of the rice industry in the Mekong Delta is presented, which firstly
briefly introduces briefly the Mekong Delta, then the role of the rice industry in the economic de-
velopment of Vietnam. Section 4.2 describes in-depth the rice supply chain including its transport
modes and transport routes. The performance of the rice supply chain will then be examined in
Section 4.3 through analysis of typical indicators such as logistics cost and lead time. Selected
safety and environmental issues associated with the rice industry are discussed in Section 4.4.
Analysis in all sections is conducted predominantly based field survey data, and reference to data
from other studies will be made for the purpose of comparison.
4.1 Overview of the rice industry in the Mekong Delta
4.1.1 Introduction to the Mekong Delta
The Mekong Delta is located in the lower reaches of the Mekong River, which includes thir-
teen provinces and cities with nearly four million acres of land used for agricultural purposes,
700 km of coast line, 400 km of border and hundreds of islands. The population of the whole
region is over 17 million, accounting for 20% of the total population of the country. This re-
gion contributes about 50% of total food production, including 90% of the rice export volume,
70% of fruit production, 52% of seafood output and 20% GDP of the whole country (SIWRP,
2011).
Figure 4-1: The Mekong Delta transport networks
Source: http://cuulongcipm.com.vn/Trangchu/tulieu.aspx
The Mekong Delta is adjacent to the Southern Focal Economic Zone (SFEZ) - the most dynam-
ic economic development zone in Vietnam, and is also close to numerous South East Asian
countries such as Thailand, Cambodia, Singapore, Philippine and Indonesia. These countries
are known as emerging economies (with the exception of Singapore), and are some of the
Analysis of the Rice Industry in the Mekong Delta of Vietnam
A Multi-Stage Impact Assessment Method for Freight Transport Management Measures 63
most important partners in the economic development of Vietnam as a whole, and in the eco-
nomic development of the Mekong Delta in particular.
The freight transport infrastructure system in the Mekong Delta is dominated by two modes,
inland waterway (IWT) and road. Generally, the region is generously endowed with an exten-
sive networks of rivers, lakes and canals. Therefore, IWT has always been the primary mode
of transportation in the region. Road transportation is mainly concentrated on a number of ar-
terial highways and often fragmented by canals. Maritime and air transport are relatively
weak while railway transport does not exist in the region.
To date, this region is still an undeveloped region of Vietnam. Particularly, in comparison with
the Red River Delta, the quality of transport in the Mekong Delta is much lower than in the
Red River Delta. Only 30.53% of road networks in the region are covered with plastic and
concrete, while the percentage is 52.72% in the Red River Delta. The road density is also low-
er than that of the Red River Delta; however, it is higher than the national average.
Table 4-1: Comparison of the Mekong Delta road network to other regions
No Region Road surfaced with plastic and
concrete (%)
Density of road network
(km/km2)
1 The Mekong Delta 30.53 1.29
2 The Red River Delta 52.72 1.35
3 All of Vietnam 28.91 0.77
Source: MOT (2010, 2014)
Although the Mekong Delta has many favourable conditions for developing inland waterway
(IWT), this system has only been exploited based on existing nature inland waterway lines.
The scale of inland ports is very small with low average capacity. The port system in the Me-
kong Delta is only exploited about 20%-50% of capacity, and only accommodate vessels
smaller than 10.000 DWT. Most import-export goods volume are transported through the port
system in HCMC. The reasons for this are, firstly, transport access to smaller ports is often lim-
ited by the shallowness of channels; secondly, loading/unloading technology at ports is still
backward, and so does not adequately support the handling of large cargo volume.
Transport volume in the Mekong Delta has increased quickly from 59 million tons in 2005 to
87 million tons in 2010 (GSO, 2011), making the average growth rate of transport volume for
the whole period is approximately 11%/year. In comparison with other regions and the whole
country, the growth rate of transport volume in the Mekong Delta is lower than that of the
Red River Delta (14.3% per year), and lower still than the average for the whole country
(12.8% per year). However, it is forecast that the cargo volume in the Mekong Delta will in-
crease rapidly in the period 2020-2030, even exceeding the average growth rates for the Red
River Delta and the country. Detail are summarised in Figure 4-2.
The Mekong Delta is projected to be one of the most rapid growth rate regions in Vietnam.
This region also is expected to become a focal economic zone, contributing greatly to the vol-
ume of key export items from Vietnam in the period 2020-2030 (MOT, 2010). A typical trend
observed in freight traffic distribution in the Mekong Delta is the concentration of its goods
trading with HCMC. Specifically, up to 94.4% of commodity volume produced in the region is
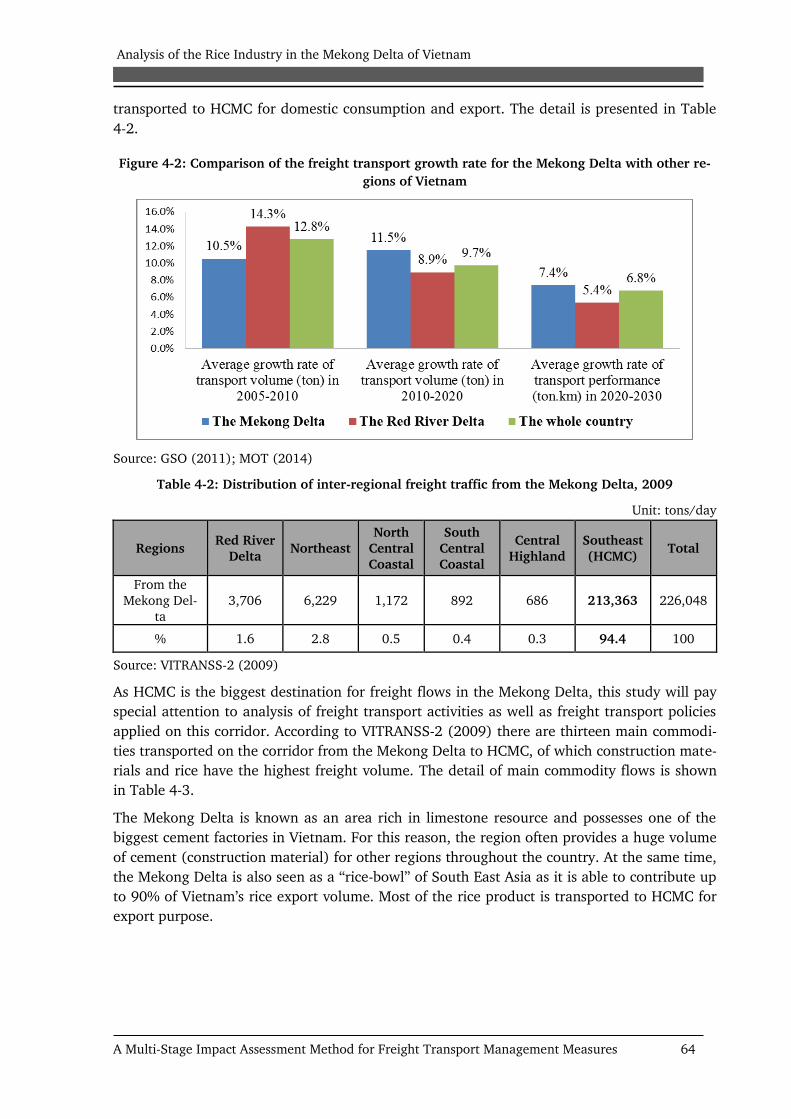
Analysis of the Rice Industry in the Mekong Delta of Vietnam
A Multi-Stage Impact Assessment Method for Freight Transport Management Measures 64
transported to HCMC for domestic consumption and export. The detail is presented in Table
4-2.
Figure 4-2: Comparison of the freight transport growth rate for the Mekong Delta with other re-
gions of Vietnam
Source: GSO (2011); MOT (2014)
Table 4-2: Distribution of inter-regional freight traffic from the Mekong Delta, 2009
Unit: tons/day
Regions Red River
Delta Northeast
North
Central
Coastal
South
Central
Coastal
Central
Highland
Southeast
(HCMC) Total
From the
Mekong Del-
ta
3,706 6,229 1,172 892 686 213,363 226,048
% 1.6 2.8 0.5 0.4 0.3 94.4 100
Source: VITRANSS-2 (2009)
As HCMC is the biggest destination for freight flows in the Mekong Delta, this study will pay
special attention to analysis of freight transport activities as well as freight transport policies
applied on this corridor. According to VITRANSS-2 (2009) there are thirteen main commodi-
ties transported on the corridor from the Mekong Delta to HCMC, of which construction mate-
rials and rice have the highest freight volume. The detail of main commodity flows is shown
in Table 4-3.
The Mekong Delta is known as an area rich in limestone resource and possesses one of the
biggest cement factories in Vietnam. For this reason, the region often provides a huge volume
of cement (construction material) for other regions throughout the country. At the same time,
the Mekong Delta is also seen as a “rice-bowl” of South East Asia as it is able to contribute up
to 90% of Vietnam’s rice export volume. Most of the rice product is transported to HCMC for
export purpose.

Analysis of the Rice Industry in the Mekong Delta of Vietnam
A Multi-Stage Impact Assessment Method for Freight Transport Management Measures 65
Table 4-3: Main commodity flows from the Mekong Delta to HCMC
No Commodity Total volume
% (1000 tons/day)
1 Rice 47.7 21%
2 Sugar & Sugarcane 5.2 2%
3 Wood and Forestry Products 4.5 2%
4 Iron & Steel 2.8 1%
5 Construction Materials 114.7 51%
6 Cement 5.7 3%
7 Fertilizer 3.9 2%
8 Coal 0.8 0%
9 Petroleum Products 4.6 2%
10 Industrial Crops 2.6 1%
11 Manufacturing Goods 7.6 3%
12 Fishery 6.9 3%
13 Meat and Other Product for Daily Con-
sumption 19.1 8%
Total 226.1 100%
Source: VITRANSS-2 (2009)
4.1.2 The role of the rice industry
For a long time, rice has been a dominant food item for approximately 55% of the world’s
population, widely distributed from Asia to Africa, and the Americas. From the early 1990s
until now, Vietnam has been ranked among the three leading rice-exporting countries in the
world.
Table 4-4: Ten biggest rice exporters in the world, 2010
Export Country Export Volume (Mio ton) %
Thailand 9,047 29.1%
Vietnam 6,734 21.6%
United State 4,501 14.5%
Pakistan 4,000 12.8%
India 2,150 8.0%
Cambodia 0,85 2.7%
Uruguay 0,804 2.6%
Burma 0,800 2.6%
China 0,619 2.0%
Brazil 0,423 1.4%
Total global exports 31,135.000
Source: UNDP (2011); VFA (2011)
The rice industry in Vietnam is distributed across six basis economic zones - the Red River
Delta, the Midland and Northern Mountains, the North Central and Central Coast, the Central
Highlands, the Southeast and the Mekong Delta. The contribution of each region to the coun-
try‘s total rice production is presented in Figure 4-3.
The Mekong Delta, as the chart indicates, is the most important region for rice production,
contributing over 50% of the total rice volume in Vietnam and 90% of the country‘s rice ex-
ports.
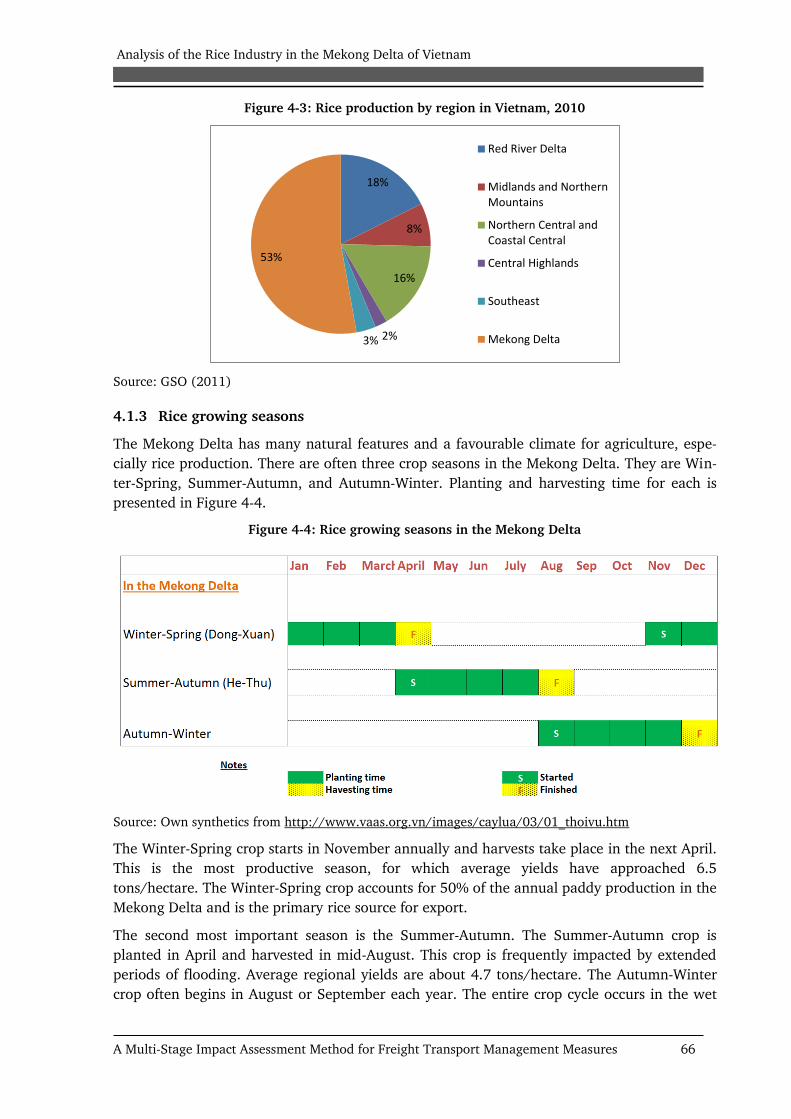
Analysis of the Rice Industry in the Mekong Delta of Vietnam
A Multi-Stage Impact Assessment Method for Freight Transport Management Measures 66
Figure 4-3: Rice production by region in Vietnam, 2010
18%
8%
16%
2%3%
53%
Red River Delta
Midlands and NorthernMountains
Northern Central andCoastal Central
Central Highlands
Southeast
Mekong Delta
Source: GSO (2011)
4.1.3 Rice growing seasons
The Mekong Delta has many natural features and a favourable climate for agriculture, espe-
cially rice production. There are often three crop seasons in the Mekong Delta. They are Win-
ter-Spring, Summer-Autumn, and Autumn-Winter. Planting and harvesting time for each is
presented in Figure 4-4.
Figure 4-4: Rice growing seasons in the Mekong Delta
Source: Own synthetics from http://www.vaas.org.vn/images/caylua/03/01_thoivu.htm
The Winter-Spring crop starts in November annually and harvests take place in the next April.
This is the most productive season, for which average yields have approached 6.5
tons/hectare. The Winter-Spring crop accounts for 50% of the annual paddy production in the
Mekong Delta and is the primary rice source for export.
The second most important season is the Summer-Autumn. The Summer-Autumn crop is
planted in April and harvested in mid-August. This crop is frequently impacted by extended
periods of flooding. Average regional yields are about 4.7 tons/hectare. The Autumn-Winter
crop often begins in August or September each year. The entire crop cycle occurs in the wet
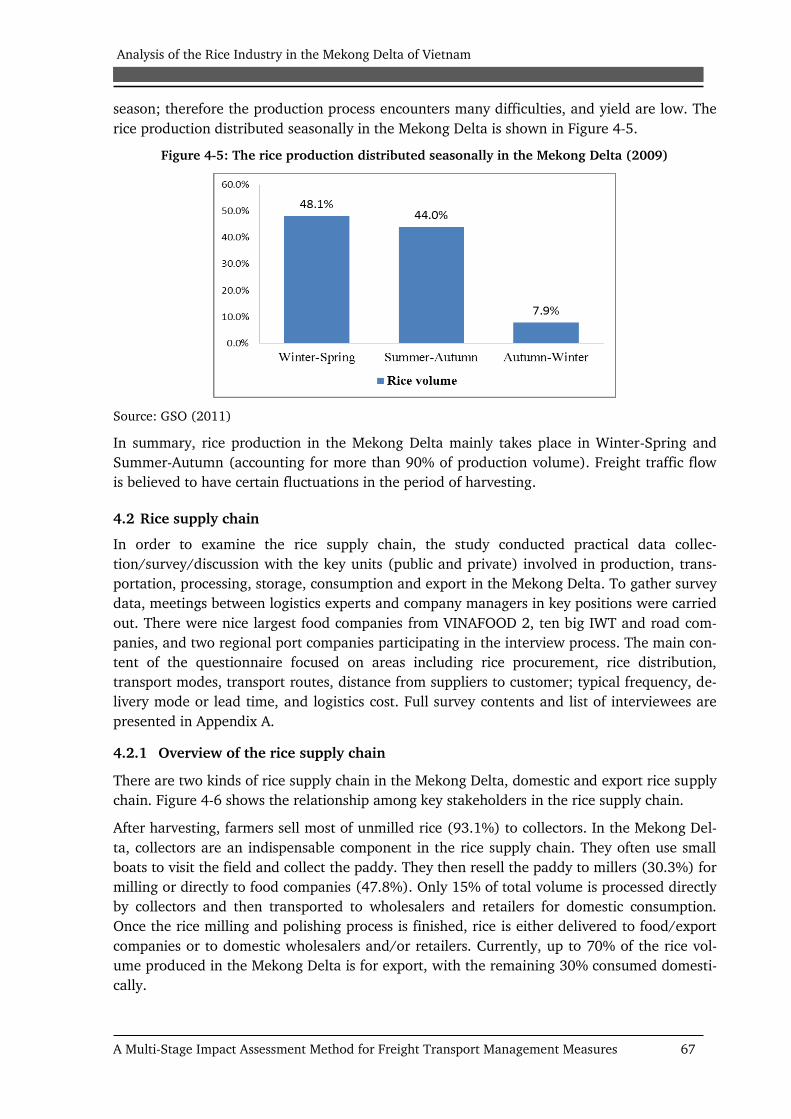
Analysis of the Rice Industry in the Mekong Delta of Vietnam
A Multi-Stage Impact Assessment Method for Freight Transport Management Measures 67
season; therefore the production process encounters many difficulties, and yield are low. The
rice production distributed seasonally in the Mekong Delta is shown in Figure 4-5.
Figure 4-5: The rice production distributed seasonally in the Mekong Delta (2009)
Source: GSO (2011)
In summary, rice production in the Mekong Delta mainly takes place in Winter-Spring and
Summer-Autumn (accounting for more than 90% of production volume). Freight traffic flow
is believed to have certain fluctuations in the period of harvesting.
4.2 Rice supply chain
In order to examine the rice supply chain, the study conducted practical data collec-
tion/survey/discussion with the key units (public and private) involved in production, trans-
portation, processing, storage, consumption and export in the Mekong Delta. To gather survey
data, meetings between logistics experts and company managers in key positions were carried
out. There were nice largest food companies from VINAFOOD 2, ten big IWT and road com-
panies, and two regional port companies participating in the interview process. The main con-
tent of the questionnaire focused on areas including rice procurement, rice distribution,
transport modes, transport routes, distance from suppliers to customer; typical frequency, de-
livery mode or lead time, and logistics cost. Full survey contents and list of interviewees are
presented in Appendix A.
4.2.1 Overview of the rice supply chain
There are two kinds of rice supply chain in the Mekong Delta, domestic and export rice supply
chain. Figure 4-6 shows the relationship among key stakeholders in the rice supply chain.
After harvesting, farmers sell most of unmilled rice (93.1%) to collectors. In the Mekong Del-
ta, collectors are an indispensable component in the rice supply chain. They often use small
boats to visit the field and collect the paddy. They then resell the paddy to millers (30.3%) for
milling or directly to food companies (47.8%). Only 15% of total volume is processed directly
by collectors and then transported to wholesalers and retailers for domestic consumption.
Once the rice milling and polishing process is finished, rice is either delivered to food/export
companies or to domestic wholesalers and/or retailers. Currently, up to 70% of the rice vol-
ume produced in the Mekong Delta is for export, with the remaining 30% consumed domesti-
cally.

Analysis of the Rice Industry in the Mekong Delta of Vietnam
A Multi-Stage Impact Assessment Method for Freight Transport Management Measures 68
Figure 4-6: Rice supply chain in the Mekong Delta
Source: Own illustration based on data from Loc (2011)
Characteristics of each stakeholder in the rice supply chain are briefly outlined as follows.
Farmers are the most abundant group, benefits for the Mekong Delta farmers appear to have
been modest. That is because most of them are smallholder farmers with utilising limited
farming technology. Moreover, their habit is to sell the majority of their paddy, and then buy
back rice with a value equivalent or greater than the value of their paddy sales and this is not
really efficiency from a financial perspective.
As mentioned above, collectors play a key role in collecting rice in the supply chain. While
there are some state-owned companies involved in collecting rice, it is very hard for them to
go directly to individual farmers, so collectors have taken up this role. There are thousands of
collectors with different sized barges operating at localized levels in the Mekong Delta. They
are very flexible in determining price, payment method, and supporting farmers. Furthermore,
having a good geographical knowledge, they are well positioned to carrying out the challeng-
ing task of travelling to remote and isolated areas to buy paddy from farmers and sell on.
Many collectors, however, are not focused on the quality of rice, which can explain the lower
quality of Vietnamese compared with Thai rice.
The milling industry is a traditional industry in the Mekong Delta. Milling is often done in two
stages with the initial process involving husking the paddy. There are currently nearly 500
state-owned milling companies and thousands of private millers in Vietnam. Private millers
have limited milling capacity (about 0.5 -2 ton/hour) and are typically located near farmer
granaries. Once first-stage milling is finished, the intermediate product is transported to larger
millers for the production of white rice and, if for export, of polished rice.
Also participating in the rice market in the Mekong Delta are also Polishers and Food Pro-
cessing Enterprises (FPEs). They may be state-owned companies, provincial or private compa-
nies. Most of these companies are parts of VINAFOOD 2. VINAFOOD 2 is a State-owned Co-
operation, which was established by the Vietnamese government with aim of ensuring nation-
al food security, developing the rice exporting industry, supplying rice for consumption in the
whole country as well as conducting other business. Most FPEs under the Food Company op-
erate as multi-functions organizations as assembling, milling, polishing and storing.
Unit: percentage of total rice volume
Production Collection Processing Consumption
ORIGIN DESTINATION
Farm
ers
Coll
ecto
rs
Mil
lers
/ P
ol-
ish
ers
Food
Co
mp
an
ies/
Ex-
port
Com
pan
ies
Reta
ils/
Wh
ole
sale
s
93.1%
6.9 %
15%
47.8%
30.3%
Port
s in
HC
MC
30%
7.2
%
7.2
%
70 %
7.8
%

Analysis of the Rice Industry in the Mekong Delta of Vietnam
A Multi-Stage Impact Assessment Method for Freight Transport Management Measures 69
Export companies include VINAFOOD 2, provincial food companies established and managed
under the authority of Provincial People Committees, or private companies. Under the food
company management, there are also warehouses that function as agricultural product cen-
tres. They further provide a free rice drying ground, as well as warehouses for hire at a low
price in an effort to support farmers. Furthermore, the company has a convenient storage sys-
tem for rice produced for domestic consumption in order to stabilize prices in the national
market.
At present, about 30% of rice production volume from the Mekong Delta serves for domestic
consumption demands. Rice distribution to the domestic market has been handled via whole-
sale and retail system located in the Mekong Delta and HCMC. Most companies participating
in the system are in small and medium scales, managing rice volumes ranging from hundreds
to thousands of tons per year, and the use of road transport dominates for rice distribution to
HCMC.
4.2.2 Transport modes
IWT and road are considered main transportation modes in the rice industry. Motorcycles are
used mainly for purchasing material inputs such as fertilizers, and pesticides. A detailed rep-
resentation of transport modes used in each stage of the rice supply chain is shown in Figure
4-7.
Figure 4-7: Transport modes used in the rice supply chain
Source: Own illustration based on data from Loc (2011) and field survey in the Mekong Delta (2013)
It becomes apparent that IWT (95%) is very popular in transporting rice to export ports
whereas road (98%) is primarily used to distribute rice for domestic market. Currently, the
share of IWT and road transportation in the rice industry is 90% and 10% respectively (MOT,
2014). However, road transport forecasts to increase fairly rapidly when the road infrastruc-
ture network in the Mekong Delta is significantly upgraded in the period 2020-2030. Specific
changes in road modal share for the rice industry are projected in Figure 4-8.
Production Collection Processing Consumption
ORIGIN DESTINATION
Farm
ers
Coll
ecto
rs
Mil
lers
/ P
oli
sh-
ers
Food
Co
mp
an
ies/
Exp
ort
Com
pan
ies
Reta
ilers
/ W
hole
sal-
ers
<50k
m
30-60km
50-150 km
30-70
km
Port
in
HC
MC
Barge: 98%
Truck: 2%
Barge: 93%
Truck: 7%
Barge: 91%
Truck: 9%
Barge: 13%
Truck: 87%
50-100 km Barge: 96%
Truck: 4%
60-120 km
Barge: 15%
Truck: 85%
50-100
km
Barge: 84% Truck: 16%
Barge: 95%
Truck: 5%
100-250 km
Barge: 12%
Truck: 88%
100-250 km

Analysis of the Rice Industry in the Mekong Delta of Vietnam
A Multi-Stage Impact Assessment Method for Freight Transport Management Measures 70
Figure 4-8: Freight modal share in the Mekong Delta rice industry
Source: Data from Blancas and M. Baher (2014); MOT (2014)
Rice typically transported by small vessel (less than 1000 tons) and/or large truck (15 tons)
to HCMC. The haulage characteristics of long-distance trips from cities in the region, for in-
stance Can Tho (the centre of the Mekong Delta), to HCMC are given in Table 4-5.
Table 4-5: Haulage characteristics for long-distance freight transport
Haulage characteristics Estimated value
Age of truck (year) 17.2
Truck weight without cargo (ton) 12.7
Actual average load (ton) 21
Average overload (ton) 8.3
Average load/truck weight 1.7
Source: WB (2010)
It is found that most truck shipments from the Mekong Delta to HCMC are overloaded. The
trucking industry in Vietnam is, in fact, very competitive and shippers prioritise minimizing
transport costs, so truckers tend to drive transport costs down at the expense of service quali-
ty. Consequently, infrastructure network deteriorate quickly.
4.2.3 Transport routes
Since the Mekong Delta has an interlacing canal system, IWT is considered the most dominant
mode of transport for rice. In fact, there are two major IWT routes from the Mekong Delta to
other areas of the country or foreign countries: the route via Can Tho and My Thoi Ports and
the route via Sai Gon and Cat Lai ports. Routes are represented in Figure 4-9.
Routes via Can Tho and My Thoi ports: These routes can only accommodate vessels smaller
than 10.000DWT because of the shallowness of the Hau river (Dinh An channel) represents a
limitation. Only 8% of the total rice volume transported via Can Tho and My Thoi ports. Actu-
ally, rice is collected in bulk in My Thoi and Can Tho ports, and then loaded to large ships and
transported along the Hau River to export directly to South- Earth Asian countries such as
Singapore and Philippine.
Routes via Saigon Port and Cat Lai Ports: It is possible to export rice on bigger vessels
through Saigon Port (maximum 36,000 DWT) and Cat Lai Port (maximum 15,000 DWT).
Both road and inland waterway are utilized as transport access routes. Up to 92% of total rice

Analysis of the Rice Industry in the Mekong Delta of Vietnam
A Multi-Stage Impact Assessment Method for Freight Transport Management Measures 71
volume from the Mekong Delta is transported through the port system in HCMC. The itinerary
of these routes is as follows: Rice consolidated either at Can Tho and My Thoi ports or ware-
houses belonging to food companies along the Hau River is loaded onto barges of 700-1000
tons, and then transported along two main IWT corridors to HCMC. These are the HCMC-
Long Xuyen and HCMC- Can Tho corridors. Notably, both corridors involve passing through
Cho Gao Channel - the essential IWT channel connecting the Tien and Van Co Rivers. Accord-
ing to the master plan for inland waterway transportation for the Mekong Delta for the period
2010-2020 (MOT, 2010), 65%-70% of cargo transportation from the Mekong Delta to HCMC
will pass through this channel. Traffic jams at Cho Gao channel are currently a serious prob-
lem.
Figure 4-9: Transportation of rice by inland waterway
Source: JICA (2010)
For road transportation, the main roads utilised for rice transport are shown in Figure 4-10.
Clearly, the NH1A, NH 91 and NH 80 play the most important role in rice transport to HCMC.
A typical itinerary is from An Giang to Can Tho via NH 80 and NH 91 and then NH1A and the
Trung Luong Express to HCMC.
Traffic volume on the NH 80 and 91 is very high and these highways are seriously degraded
as a result. The growth in traffic volume is estimated at about 13.02% per year (MOT, 2014).
Given the present volume of traffic, the Ministry of Transport has had to implement the BOT
type project to improve NH 91 and 80. This project is expected to be finished in 2016 and to
meet traffic demand between Can Tho and An Giang. Regarding NH1A, this motorway is cur-
rently seen as a key road for transporting rice from the Mekong Delta to HCMC but is much
overloaded. Freight traffic has increased on averagely 10-14% per year (GSO, 2011), which is
faster than the growth rate of transport construction. To date, NH1A has been partly upgrad-
ed in the section from Trung Luong-Can Tho, which has contributed significantly to managing
freight traffic demand in the region. Plans are in place for the entire remainder of the highway
to be upgraded in 2016.
: Main IWT routes
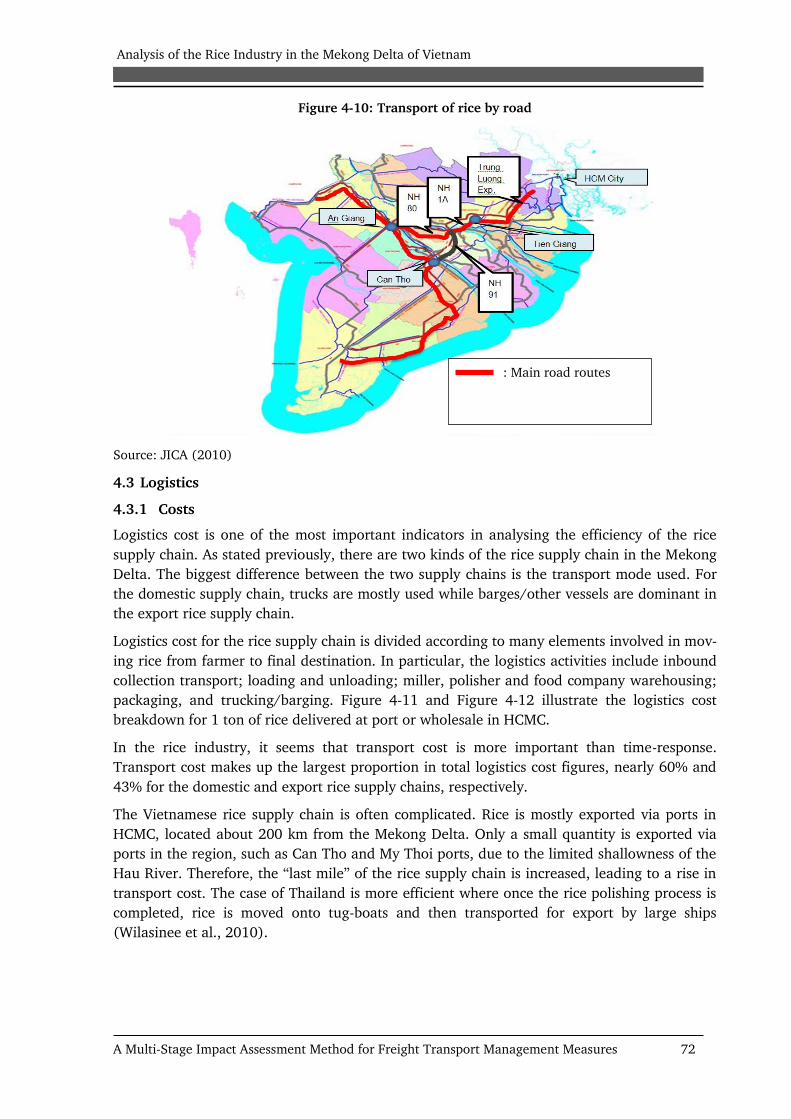
Analysis of the Rice Industry in the Mekong Delta of Vietnam
A Multi-Stage Impact Assessment Method for Freight Transport Management Measures 72
Figure 4-10: Transport of rice by road
Source: JICA (2010)
4.3 Logistics
4.3.1 Costs
Logistics cost is one of the most important indicators in analysing the efficiency of the rice
supply chain. As stated previously, there are two kinds of the rice supply chain in the Mekong
Delta. The biggest difference between the two supply chains is the transport mode used. For
the domestic supply chain, trucks are mostly used while barges/other vessels are dominant in
the export rice supply chain.
Logistics cost for the rice supply chain is divided according to many elements involved in mov-
ing rice from farmer to final destination. In particular, the logistics activities include inbound
collection transport; loading and unloading; miller, polisher and food company warehousing;
packaging, and trucking/barging. Figure 4-11 and Figure 4-12 illustrate the logistics cost
breakdown for 1 ton of rice delivered at port or wholesale in HCMC.
In the rice industry, it seems that transport cost is more important than time-response.
Transport cost makes up the largest proportion in total logistics cost figures, nearly 60% and
43% for the domestic and export rice supply chains, respectively.
The Vietnamese rice supply chain is often complicated. Rice is mostly exported via ports in
HCMC, located about 200 km from the Mekong Delta. Only a small quantity is exported via
ports in the region, such as Can Tho and My Thoi ports, due to the limited shallowness of the
Hau River. Therefore, the “last mile” of the rice supply chain is increased, leading to a rise in
transport cost. The case of Thailand is more efficient where once the rice polishing process is
completed, rice is moved onto tug-boats and then transported for export by large ships
(Wilasinee et al., 2010).
: Main road routes

Analysis of the Rice Industry in the Mekong Delta of Vietnam
A Multi-Stage Impact Assessment Method for Freight Transport Management Measures 73
Source: Binh (2013)
Figure 4-13: Comparison of unit transport price by mode (USD/ton-km)
0.24
0.63
0.00
0.10
0.20
0.30
0.40
0.50
0.60
0.70
Unit price charged perton.km, IWT
Unit price charged perton.km, road
Source: Binh (2013)
There is a large difference between unit transport cost (per ton-km) by road and IWT with
road transport cost up to 2.6 times greater than IWT (Figure 4-13). Although, the cost of road
transport is much more expensive than IWT costs, road transport dominates in the domestic
rice supply chain. This can be partly explained by the fact that IWT system is not directly ac-
cessible to wholesale or retail network in HCMC, and multimodal transport is at an early stage
of development in the Mekong Delta.
Unlike the domestic rice supply chain, road transport has not been significantly competitive
for the export rice supply chain. Export rice is predominantly shipped using IWT. However,
road transportation is forecast to increase quite rapidly when the road infrastructure network
2.86 3.81 8.57 9.05
10.86 17.52
18.48 20.86
25.62 30.38
33.48
- 5.00
10.00 15.00 20.00 25.00 30.00 35.00 40.00
Logistics cost (USD/ton)
2.86 3.81 8.57 9.05
10.86 17.52 18.48
20.86 26.57
38.95
39.90
- 5.00
10.00 15.00 20.00 25.00 30.00 35.00 40.00 45.00
Logistics cost (USD/ton)
Figure 4-12: TLC in the domestic rice supply
chain
Figure 4-11: TLC in the export rice supply chain

Analysis of the Rice Industry in the Mekong Delta of Vietnam
A Multi-Stage Impact Assessment Method for Freight Transport Management Measures 74
in the Mekong Delta is significantly expanded and upgraded in the period 2020-2030. A road
-intensive transport situation could, however, become a potential danger by leading to in-
crease in traffic accidents and environmental issues in the future.
4.3.2 Lead-time
Lead-time is another important part of logistics. Lead-time, in this context, is the clock time
spent in the supply chain to convert paddy into rice and to place it into the hands of the dis-
tributor (export ports or the wholesale system in HCMC). Like logistics cost, lead-time is bro-
ken down into many elements involving moving paddy from farmer to the final destination of
the supply chain. For example, it includes the time required for collecting, loading/unloading,
warehousing, and outbound transport. Lead-time is shown in detail in Figure 4-14 and Figure
4-15.
Source: Binh (2013)
As Figure 4-14 and Figure 4-15 indicate, there is no big difference between the two modes. In
fact, transporting rice from the Mekong Delta to HCMC takes one day and two days by road
and IWT, respectively (Binh, 2013). Interestingly, most time is spent on warehousing by food
companies or export companies in the Mekong Delta. This can be partly explained by the food
storage habits in the Mekong Delta in particular and in Vietnam in general. As rice export or-
ders annually are not stable, export/food companies often keep a portion of their stock in re-
serve to cope with the volatility of the market.
4.4 Safety and environmental issues
Like most developing countries, Vietnam’s traffic accident situation is getting more serious
Figure 4-15: Total lead-time in the domestic
rice supply chain
Figure 4-14: Total lead-time in the export rice
supply chain

Analysis of the Rice Industry in the Mekong Delta of Vietnam
A Multi-Stage Impact Assessment Method for Freight Transport Management Measures 75
and is already alarming. According to traffic accident data form ASEAN countries, the level of
traffic safety in Vietnam is very low. Regarding the total number of fatalities, Vietnam ranked
third after Thailand and Indonesia in 2000 but had overtaken them to become the country
with the highest number of traffic fatalities by 2006 (VITRANSS-2, 2009). Traffic accidents
have become a critical social problems and traffic safety is currently viewed by the govern-
ment as an urgent policy issues.
Table 4-6: Traffic accidents by mode, 2006
Modes Accidents % Fatal % Injury %
Road 14,161 96,16 12373 96.99 11097 98.31
Rail 292 1.98 136 1.07 158 1.40
IWT 215 1.46 210 1.65 18 0.16
Shipping 59 0.40 38 0.29 13 0.13
Total 14,727 100.00 12757 100.00 11,288 100.00
Source: VITRANSS-2 (2009)
In terms of modal shares, road accidents dominate (96%). Table 4-6 shows in detail traffic ac-
cident by mode data in 2006. Vietnam’s heavy dependence on road transport in recent years is
one of the main reasons for the increase in road traffic accidents.
The distribution of road traffic accidents in various main regions of Vietnam is quite different.
Statistics shows that the traffic accident situation in the Mekong is less serious than other
main regions such as the Red River Delta and the Southern region. Table 4-7 and Figure 4-16
provide statistic on the traffic accident situation in the Mekong Delta.
Table 4-7: The distribution of road traffic accidents in some regions of Vietnam, 2006
Region No. of acci-
dents
Traffic accident
per 10,000 popu-
lation
Fatality per
10.000 pop-
ulation
Injury per
10.000
population
The Red River Delta 2716 1.5 1.2 1.0
The Southern Region 3667 2.7 2.2 2.1
The Mekong Delta 2230 1.3 1.1 1.2
The whole country 14572 1.7 1.4 1.4
Source: VITRANSS-2 (2009)
Figure 4-16: The percentage of road traffic accidents by some key regions in Vietnam
19% 25%15%
100%
0%
20%
40%
60%
80%
100%
120%
The Red RiverDelta
The SouthernRegion
The MekongDelta
The wholecountry
Percentage of number of accidents
Source: VITRANSS-2 (2009)
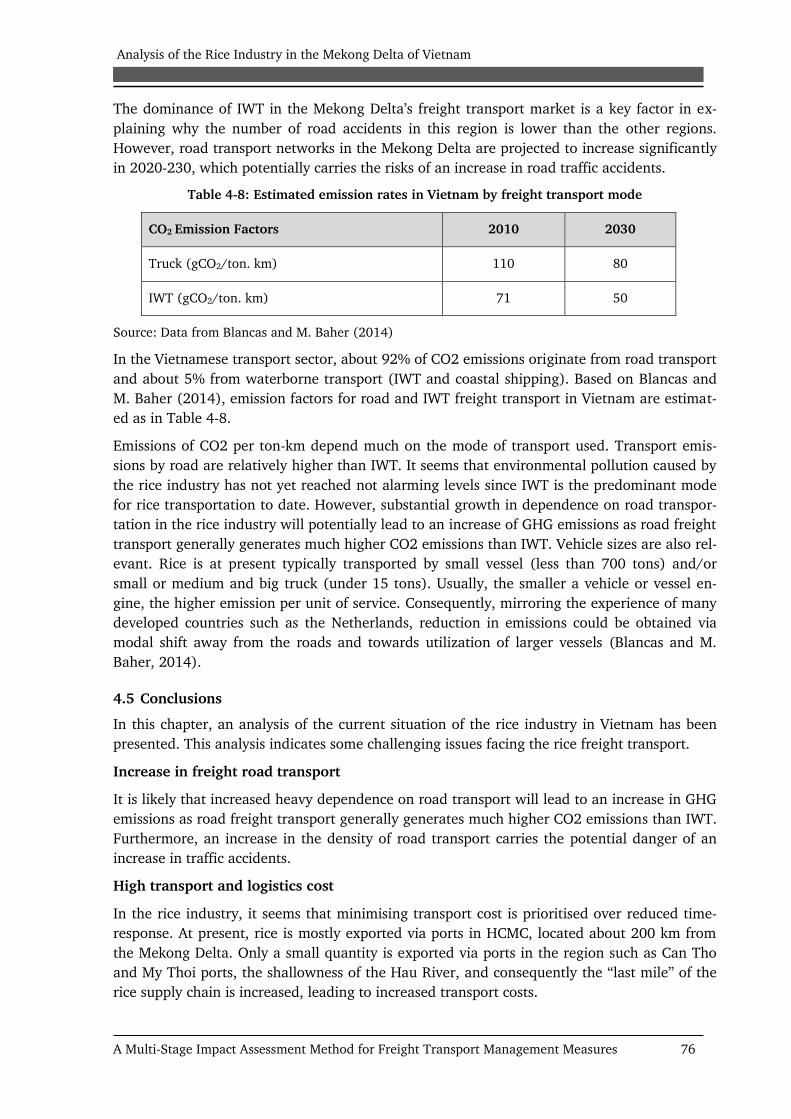
Analysis of the Rice Industry in the Mekong Delta of Vietnam
A Multi-Stage Impact Assessment Method for Freight Transport Management Measures 76
The dominance of IWT in the Mekong Delta’s freight transport market is a key factor in ex-
plaining why the number of road accidents in this region is lower than the other regions.
However, road transport networks in the Mekong Delta are projected to increase significantly
in 2020-230, which potentially carries the risks of an increase in road traffic accidents.
Table 4-8: Estimated emission rates in Vietnam by freight transport mode
CO2 Emission Factors 2010 2030
Truck (gCO2/ton. km) 110 80
IWT (gCO2/ton. km) 71 50
Source: Data from Blancas and M. Baher (2014)
In the Vietnamese transport sector, about 92% of CO2 emissions originate from road transport
and about 5% from waterborne transport (IWT and coastal shipping). Based on Blancas and
M. Baher (2014), emission factors for road and IWT freight transport in Vietnam are estimat-
ed as in Table 4-8.
Emissions of CO2 per ton-km depend much on the mode of transport used. Transport emis-
sions by road are relatively higher than IWT. It seems that environmental pollution caused by
the rice industry has not yet reached not alarming levels since IWT is the predominant mode
for rice transportation to date. However, substantial growth in dependence on road transpor-
tation in the rice industry will potentially lead to an increase of GHG emissions as road freight
transport generally generates much higher CO2 emissions than IWT. Vehicle sizes are also rel-
evant. Rice is at present typically transported by small vessel (less than 700 tons) and/or
small or medium and big truck (under 15 tons). Usually, the smaller a vehicle or vessel en-
gine, the higher emission per unit of service. Consequently, mirroring the experience of many
developed countries such as the Netherlands, reduction in emissions could be obtained via
modal shift away from the roads and towards utilization of larger vessels (Blancas and M.
Baher, 2014).
4.5 Conclusions
In this chapter, an analysis of the current situation of the rice industry in Vietnam has been
presented. This analysis indicates some challenging issues facing the rice freight transport.
Increase in freight road transport
It is likely that increased heavy dependence on road transport will lead to an increase in GHG
emissions as road freight transport generally generates much higher CO2 emissions than IWT.
Furthermore, an increase in the density of road transport carries the potential danger of an
increase in traffic accidents.
High transport and logistics cost
In the rice industry, it seems that minimising transport cost is prioritised over reduced time-
response. At present, rice is mostly exported via ports in HCMC, located about 200 km from
the Mekong Delta. Only a small quantity is exported via ports in the region such as Can Tho
and My Thoi ports, the shallowness of the Hau River, and consequently the “last mile” of the
rice supply chain is increased, leading to increased transport costs.
Analysis of the Rice Industry in the Mekong Delta of Vietnam
A Multi-Stage Impact Assessment Method for Freight Transport Management Measures 77
Overloading in long-distance freight transport
The average loading factor for road freight from the Mekong Delta to HCMC is 1.7. The truck-
ing industry in Vietnam is highly competitive placing downward pressure on transport costs.
Freight companies in the rice industry tend to reduce transport costs to remain competitive by
overloading vehicles. Monitoring and management systems for long distance freight are also
weak making the issue more severe. Consequently, infrastructure network deteriorates quick-
ly.
In short, the rice industry in the Mekong Delta faces various problems related to emissions,
safety, and economic efficiency. More effective management for freight transport system are
therefore necessary to address these problems, and support the development of the rice indus-
try in the future.

Application of Multi-Stage Impact Assessment for FTM Measures
A Multi-Stage Impact Assessment Method for Freight Transport Management Measures 78
5 Application of Multi-Stage Impact Assessment for FTM Measures
In this chapter, the multi-stage impact assessment method for FTM measures is applied in the Vi-
etnamese rice industry as an example. Following this proposed method, firstly, a list of measures
including potential intervention and measures already applied in the rice industry, will be com-
piled. Then, the inter-dependency among the selected measures will be checked to eliminate over-
lapping or opposing impacts. The MCA method is employed for weighting and ranking the im-
portance level of these measures. Building on these results, different scenarios are identified for
detailed quantitative assessment. TLC is employed as the core of this analysis, differentiating a
disaggregate population of rice commodity flows and locations of distribution centres in HCMC.
Consequently, traffic, safety, economic and environmental benefits can be estimated at the rice
sector level and the transport network level.
5.1 Definition of FTM measures in the rice industry
5.1.1 Compilation of FTM measures in the rice industry
To solve the increasing issues associated with freight transport problems in the Mekong Delta,
various traffic management measures need to be considered and applied. Table 5-1 presents a
compilation of FTM measures that have already been applied and can potentially be applied
in the rice industry as follows:
Table 5-1: Compilation of FTM measures in the context of the rice industry
FTM measures identified in the
literature (Table 2-2) List of FTM measures in the rice industry
Level of ap-
plication
M1 Freight centres and con-
solidated deliveries M1-VN
A regional rice logistics centre Hau
Giang province Potential
M2 Co-operative freight
transport system M2-VN
Major markets for rice/paddy in
Can Tho, Long An, and Tien Giang
provinces
Potential
M4 Time window for trucks
entering the city M4-VN
Prohibition of trucks entering
HCMC from 6:00 am to 12:00 pm Already
M11 Promotion of regional
products M11-VN
The establishment of centralized ar-
eas for paddy production Already
M12 Business cooperation M12-VN
Co-operation between collectors
and millers and export companies in
An Giang province
Already
M15
Infrastructure capacity
improvement (inland
waterway, road, port)
M15-VN Improvement of NH 1A from the
Mekong Delta to HCMC Potential
M17 Load factor control or
speed limit M17-VN
Restricting overloaded trucks on the
highway from the Mekong Delta to
HCMC
Already
Source: Own compilation from JICA (2010)
There are seven FTM management measures in the rice industry in which only three potential
measures are listed. This list is incomplete since many others measures which already be ap-
plied in the world could be utilised for the Vietnamese rice industry. For this study, the selec-
tion is firstly based on the literature review and the qualitative assessment of effectiveness
and applicability of each measure (Table 2-4) carried out in chapter 2. Secondly, the
measures selected should deal with identified problems in the Vietnamese rice industry. In

Application of Multi-Stage Impact Assessment for FTM Measures
A Multi-Stage Impact Assessment Method for Freight Transport Management Measures 79
particular, the detailed analysis in Chapter 4 indicated some specific challenges facing the rice
industry including increased heavy dependence on road transport, high logistics cost and
overloading in long-distance freight transport. Therefore, in this case, there are seven
measures considered because of their highly potential implementation. The others, for exam-
ple the measures on harvesting time, incentive for off-peak hours, low-emission zones or
technology-based route planning management, are seen as the next-best measures in the long-
term. Besides, with the aim of illustration of how the proposed multi-stage impact assessment
method works, particularly how MCA method and TLC model look like in the different impact
assessment stages, the chosen measures should be compatible for the application of these two
methods. A review on the literature has shown that the use of logistics facilities can potential-
ly result in traffic, environmental and social benefits, which will be better measured through
MCA method. Meanwhile, TLC seems to be easier to model in detail with the highway im-
provement measures. Therefore, the most interesting measures including the establishment of
rice logistics facilities and the improvement of NH from the Mekong Delta to HCMC will be
further analysed in detail in this study. The following section will briefly review the contents
of seven measures in the rice industry in the Mekong Delta.
5.1.2 Detailed content of FTM measures
M1-VN. Establishment of a regional rice logistics centre in the Mekong Delta
This measure aims to construct a regional rice logistics centre in Hau Giang province to im-
prove rice procurement and to promote consolidated deliveries in the Mekong Delta. The rice
logistics centre would be built on a large land and in a convenient location for traffic and
trading. The intended location is shown on the following map.
Figure 5-1: Location for rice logistics centre in Hau Giang province
Source: Own illustration based on data from JICA (2010)

Application of Multi-Stage Impact Assessment for FTM Measures
A Multi-Stage Impact Assessment Method for Freight Transport Management Measures 80
The regional rice logistics centre will have a reservation capacity of 60.000 tons, with two
rice-processing lines of 50 tons/h capacity, processing 1000tons of rice per day at high quality
(export quality). The planed location for the centre is close to important highways such as
NH61, NH1A, and provincial road 92. Especially, Xa No channel - a major arterial IWT in the
Mekong Delta - will go through this centre, which can contribute significantly to rice product
transhipment from the west of Hau River to HCMC. This measure would help to reduce small
trips to collect paddy/rice since farmers can sell directly to the centre. In addition, in the dis-
tribution stage, it would increase opportunities for consolidated delivery from the Mekong
Delta to HCMC.
M2. Establishment of major markets for rice/paddy in Can Tho, Long An, Tien Giang
provinces
The objective of this measure is to create direct meeting points for farmers and rice buyers in
order to reduce intermediate stages. Furthermore, it can act as a key terminal to promote de-
livery consolidation. Performing a function analogous to the rice logistics centre, rice markets
are often located in convenient areas for traffic and transport. For example, Thot Not rice
market would border the Hau River on one side, which is convenient for IWT to Vinh Long,
Dong Thap provinces, and the other side of the market would be adjacent to Thot Not Indus-
trial Zone and NH 91.
Figure 5-2: Location of major markets for paddy/rice in the Mekong Delta
Source: Own illustration based on data from JICA (2010)
This measure will help to improve the transport infrastructure capacity of the region, because
these markets are not only for collecting and delivering goods but also for consolidation and
transhipment services. In addition, they can reduce markedly intermediate stages in the rice
supply chain since farmers can sell directly at these markets. It is noteworthy that the for-

Application of Multi-Stage Impact Assessment for FTM Measures
A Multi-Stage Impact Assessment Method for Freight Transport Management Measures 81
mation of such markets focuses strongly on facilitating rice business, and therefore would only
be introduced in key rice production provinces such as Can Tho, An Giang, and Tien Giang. In
fact, the plan of rice major markets is facing many difficulties due to some the following rea-
sons. Firstly, the network of rivers and canals is dense, which has contributed to establishing
many floating markets in the Mekong Delta. The collectors and farmers have had the practice
of purchasing in these markets for ages. Secondly, even located at the intersection of road and
IWT transport, the accessibility to most of planned major markets are poor conditions. For ex-
ample, access road (NH 91) to Thot Not market is already congested in the peak hours (MOT,
2014) Therefore, total time of the rice supply chain would be increased under the interven-
tion of establishing major markets for rice. In addition, changing behaviours of collectors and
farmers would take time and overcoming inadequate transport infrastructure would be chal-
lenging for the application of this measure.
M4. Prohibition of trucks with load in excess of 5 tons entering HCMC from 6:00 am to
9:00 pm
This existing measure aims to reduce the volume of incoming traffic to HCMC at peak-hour.
Specifically, urban day-time bans on the trucks are applied along the many main corridors of
the city such as Phan The Hien, Vo Van Kiet, Nguyen Huu Canh-Ton Duc Thang-Nguyen Tat
Thanh; Cong Hoa-Hoang Van Thu-Hai Ba Trung, Dien Bien Phu, Cach mang thang 8, and part
of Nguyen Van Linh Boulevard. These corridors also are accessibility roads to HCMC port sys-
tem, namely Hiep Phuoc port, Tan Thuan 2 port, Cat Lai port.
Figure 5-3: Prohibited roads for trucks entering HCMC from 6:00 am to 12:00 pm
Source: Own illustration based on data from JICA (2010)
Goods flows from the Mekong Delta to ports in HCMC have to change their itinerary or to
wait outside the city until night-time. For example, the old itinerary of Trung Luong Express-
way - Nguyen Van Linh Boulevard - Tan Thuan Port has been changed to a longer one: Trung
Luong Expressway - Nguyen Van Linh - Nguyen Luong Bang-Huynh Tan Phat-Tan Thuan Port.
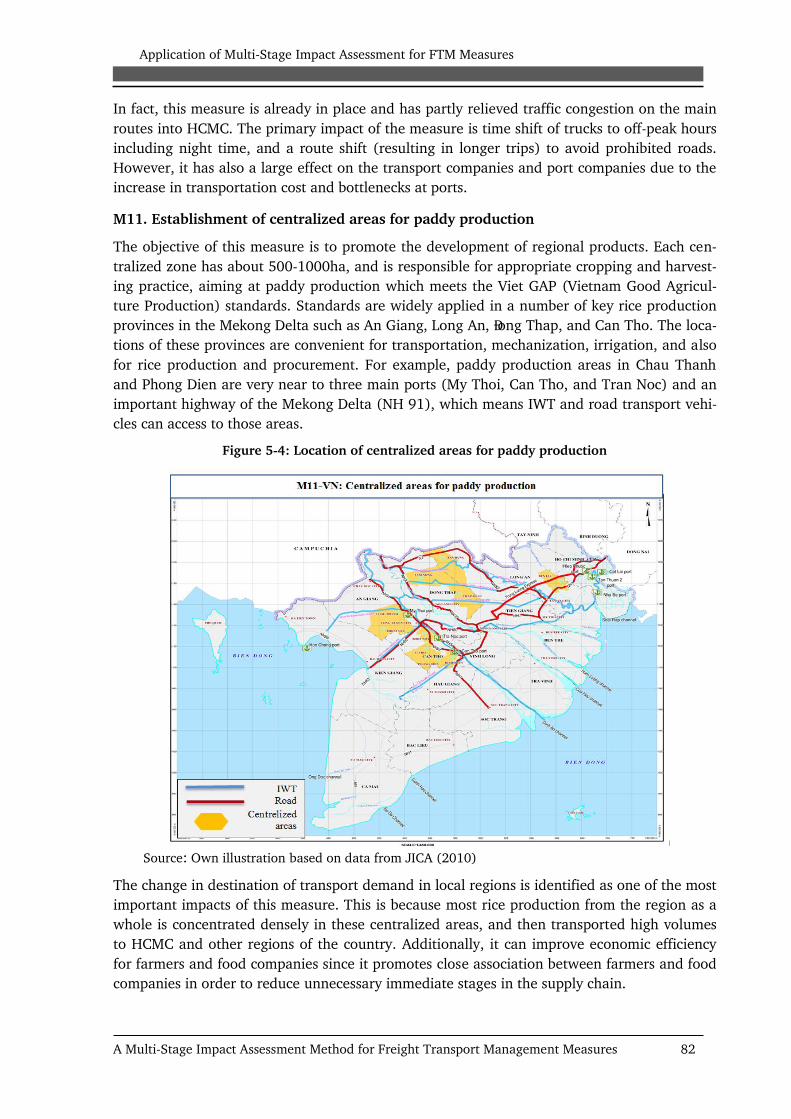
Application of Multi-Stage Impact Assessment for FTM Measures
A Multi-Stage Impact Assessment Method for Freight Transport Management Measures 82
In fact, this measure is already in place and has partly relieved traffic congestion on the main
routes into HCMC. The primary impact of the measure is time shift of trucks to off-peak hours
including night time, and a route shift (resulting in longer trips) to avoid prohibited roads.
However, it has also a large effect on the transport companies and port companies due to the
increase in transportation cost and bottlenecks at ports.
M11. Establishment of centralized areas for paddy production
The objective of this measure is to promote the development of regional products. Each cen-
tralized zone has about 500-1000ha, and is responsible for appropriate cropping and harvest-
ing practice, aiming at paddy production which meets the Viet GAP (Vietnam Good Agricul-
ture Production) standards. Standards are widely applied in a number of key rice production
provinces in the Mekong Delta such as An Giang, Long An, Đong Thap, and Can Tho. The loca-
tions of these provinces are convenient for transportation, mechanization, irrigation, and also
for rice production and procurement. For example, paddy production areas in Chau Thanh
and Phong Dien are very near to three main ports (My Thoi, Can Tho, and Tran Noc) and an
important highway of the Mekong Delta (NH 91), which means IWT and road transport vehi-
cles can access to those areas.
Figure 5-4: Location of centralized areas for paddy production
Source: Own illustration based on data from JICA (2010)
The change in destination of transport demand in local regions is identified as one of the most
important impacts of this measure. This is because most rice production from the region as a
whole is concentrated densely in these centralized areas, and then transported high volumes
to HCMC and other regions of the country. Additionally, it can improve economic efficiency
for farmers and food companies since it promotes close association between farmers and food
companies in order to reduce unnecessary immediate stages in the supply chain.

Application of Multi-Stage Impact Assessment for FTM Measures
A Multi-Stage Impact Assessment Method for Freight Transport Management Measures 83
M12. Co-operation between collectors, millers and export companies in An Giang prov-
ince
From the outset, the objective of this measure has been purely agricultural economics with
aims of controlling rice-purchasing price when deemed necessary based on market behaviour
while simultaneously reducing the intermediate stages in the rice supply chain. The core ap-
proach taken to achieve these aims is the promotion of close cooperation between key stake-
holders involved in the rice supply chain such as farmers, collectors, millers, polishers and ex-
port companies, and all of them have commitment of keeping price stable. Through these
links, the purchasing price of rice is kept stable in each period, adjusted flexibly according to
market fluctuations. This is favourable for all involved, farmers, collectors, and food compa-
nies. This model is widely applied by food companies under VINAFOOD 2 such as An Giang
Food Company, Song Hau Food Company, and Tien Giang Food Company.
Looking at potential traffic and transport implications, this cooperation could facilitate trans-
portation directly from the farmers to food companies as stakeholders in the rice supply estab-
lish close trade relations. Therefore, it may help to reduce the number of pick-up trips in the
region. The co-operation between these stakeholders can also help to shift trip destinations
closer to trip origins, thereby reducing average trip lengths. However, these impacts of the
measure are still emerging, and have only been documented qualitatively. There has not been
any concrete research carried out on the traffic and transport impacts of promoting closer
business cooperation.
M15-VN. Improvement of NH 1A from the Mekong Delta to HCMC
The NH 1A plays the most import role in the road transport in the Mekong Delta. This NH
connects eight provinces in the Mekong Delta to HCMC, and has an overall length of nearly
380 kilometres. The itinerary for NH 1A is presented in Figure 5-5.
Figure 5-5: Improvement of NH 1A from the Mekong Delta to HCMC
Source: Own illustration based on data from JICA (2010)
NH 1A is identified as a main artery since it is responsible for 78% of road freight volume in
Application of Multi-Stage Impact Assessment for FTM Measures
A Multi-Stage Impact Assessment Method for Freight Transport Management Measures 84
the Mekong Delta (MOT, 2014). The NH 1A improvement project is expected to significantly
contribute to the socio-economic development in the Mekong Delta. In particular, it is antici-
pated that the NH 1A improvement would provide greater accessibility to key production
zones and reduce transport time to HCMC. For the case of the rice industry, the NH 1A ac-
counts for most rice freight flows to HCMC for domestic consumption. Furthermore, im-
provements are expected to be creating “door-to-door” service for rice freight transport.
This measure is a transport supply management initiative. However, it may also influence traf-
fic demand in terms of shifting trip mode or trip destination. Improvement of NH 1A in the
Mekong Delta is expected to reduce transport time and transport cost from the Mekong Delta
to HCMC, which potentially improves the economic efficiency in the rice industry.
M17-VN. Restricting overloaded trucks on the highway from the Mekong Delta to HCMC
As mentioned previously, the average loading factor for the road freight from the Mekong
Delta to HCMC is 1.7. Freight companies tend to reduce transport costs to compete with each
other by overloading. Monitoring and management systems for long distance freight are inef-
fective, increasing the severity of the issue. The Ministry of Transport of Vietnam has recently
strengthened road freight load factor control by implementing Decision No 1526/QD-BGTVT
dated 5th June 2013. This scheme proposes short-term and long-term measures to control
road factors for long-distance freight. It includes strengthening state management of load fac-
tor for road, strict punishment for oversized and overloaded vehicles, and rationally restruc-
turing transport modal share of the economy.
Initially, this scheme generated positive impacts, although it has also has the potential to cre-
ate less desirable outcomes. On the one hand, the transport market is more transparent as the
road transport prices have reverted to true value, and the deterioration of road infrastructure
is better controlled. On the other hand, the regulation may increase the total transportation
cost born by carriers. As a result, the price of goods and services could go up. Consequently,
traffic conditions may not improve as expected. According to the experience of some coun-
tries, this solution should be combined with a road pricing scheme which can manage traffic
congestion efficiently (Teo et al., 2014). Through application of those measures, transport
companies may consider a modal shift away from road to waterway to achieve increased effi-
ciency.
In short, the rice industry in the Mekong Delta faces various problems related to emission,
safety, and economic efficiency. This necessitates better management of freight transport sys-
tem to address these problems, thus maintaining the role of the rice industry in the future. So
far, there have been a total of seven FTM measures applied in the rice industry, including
hard measures (e.g. improving NH1A) and soft measures (e.g. load factor control). To address
comprehensively the issues facing the industry, a range of complementary measures will be
required. However, it is important to determine a number of specific measures to address the
immediate issues. In order to do this, the interdependency of the proposed and existing
measures need, firstly, to be checked in order to eliminate overlapping or opposing impacts.
After that, a quick assessment and ranking of the measures will be carried out as a tool for
recommending specific measures. Finally, a detailed quantitative assessment will take place to
determine impacts related to changes in the supply chain as well as impacts on mode choices
in the rice industry.

Application of Multi-Stage Impact Assessment for FTM Measures
A Multi-Stage Impact Assessment Method for Freight Transport Management Measures 85
5.2 Interdependency check, weighting and ranking FTM measures
5.2.1 Interdependency check
The objective of this section is to investigate the interdependencies among FTM measures in
the rice industry. Relationships among measures are classified into three basic types: inde-
pendence, complementary and substitutability. The definition of each form was clearly dis-
cussed in Section 3.5.
Table 5-2: The qualitative analysis of interdependencies of potential FTM measures in the rice
industry
The potential FTM measures in the
rice industry Qualitative assessment
Expected im-
pacts for the
rice industry
Implication
of interde-
pendency
Pair
1
M1-VN
Rice logistics centre in
Chau Thanh A (Hau
Giang province)
Allow farmers to sell pad-
dy directly to the distribu-
tion centre and reduce the role of intermediaries
Reduction in the
number of trips
and ton-km
Substitutabil-
ity
Reduction in
TLC
M2-VN
Major markets for rice/paddies in Can
Tho, Long An, Tien
Giang provinces
Facilitate rice business
and reduce immediate
stages
Limited access to the ma-
jor markets due to poor
infrastructure condition
Reduction in
TLC
Increase in total
time of the rice supply chain
Pair
2
M1-VN
Rice logistics centre in
Chau Thanh A (Hau
Giang province)
Allow farmers to sell pad-
dy directly to the distribu-
tion centre and reduce the
role of intermediaries
Reduction in the
number of trips
and ton-km
Complemen-
tary
Reduction in
TLC
M15-VN
Improvement of NH
1A from the Mekong
Delta to HCMC
Reduce transport time
from the Mekong Delta to
HCMC
Reduction in to-
tal time of the
rice supply chain
Reduction in
TLC
Pair
3
M2-VN
Major markets for
rice/paddies in Can
Tho, Long An, Tien
Giang provinces
Facilitate rice business
and reduce immediate
stages
Limited access to the ma-
jor markets due to poor
infrastructure condition
Reduction in
TLC
Complemen-
tary
Increase in total
time of the rice
supply chain
M15-VN
Improvement of NH
1A from the Mekong
Delta to HCMC
Reduce transport time
from the Mekong Delta to
HCMC
Reduction in to-
tal time of the
rice supply chain
Reduction in
TLC
The first step of investigation of interdependencies is related to qualitatively analysing the ex-
pected impacts (benefits) of individual measures in the rice industry. In order to do it, an in-
troduction of the FTM in the rice industry was given and stakeholders affected were further
described by highlighting their characteristics. The comparison of expected impacts in pairs of
measures then allows conclusions on the type of interdependency as well as reveals the poten-
tial interdependence among these measures. The interdependency analysis process is mostly

Application of Multi-Stage Impact Assessment for FTM Measures
A Multi-Stage Impact Assessment Method for Freight Transport Management Measures 86
based on acknowledging the perspectives of multiple stakeholders and to be open-minded
with regards to unforeseen factors. Table 5-2 presents the detail of qualitative analysis of in-
terdependencies among potential measures in the rice industry. The result of this analysis is
strongly supported from the detailed description of measures that presented in the previous
section.
The qualitative analysis gives a first sight into the emergence of interdependencies between
measures. In particular, the implementation of two measures of M1-VN and M2-VN together
could generate lower level of effectiveness than the implementation of each measure individ-
ually. That is because; firstly, both two measures share the common objective as creating a
key terminal to promote consolidated delivery in the region, and hence concurrent implemen-
tation of two measures, in some cases, is not necessary. Secondly, traffic restriction and sup-
ply chain time could be increased due to the accessibility problem under the intervention of
M2-VN. For this reason, the implication of interdependencies of pairs of M1-VN, M2-VN could
be substitutive relationship. This is in contrast to the combination of measures of M1-VN,
M15-VN and M2-VN, M15-VN, which are expected to yield a higher level of effectiveness than
the sum of effectiveness realised by implementing each measure individually. The reason for
this is that the intervention of both measures would facilitate inbound and outbound rice
commodity flows in the Mekong Delta. The total time of supply chain is also expected to re-
duce through the combination of these measures.
The results of the independency check will serve as input for the weight and rank of FTM
measures in the next section.
5.2.2 Weighting and ranking of FTM measures
Following the framework of the proposed method mentioned in the chapter 3, MCA was em-
ployed to weight and rank the importance level of FTM measures in the rice industry. A re-
view on literature has shown that MCA approach can allow screening the impacts under con-
siderations in regards to socio-economic, environmental, safety, and mobility aspects, which
ultimately provides an overall comparison between FTM measures. In addition to this, the in-
volvement of multiple stakeholders in the assessment process can increase the acceptance of
assessment results in the rice industry in particular and in society in general. The study will
not rank the total list of measures in the rice industry, just potential measures according to
MCA methodology as a tool for selecting potential initiatives.
Set-up criteria for the assessment
There are two groups of criteria used for the first assessment and ranking the FTM measures
in the rice industry. They are Effectiveness and Applicability (or Barrier) criteria. Effectiveness
represents the expected impacts and applicability represents the main barriers in implementa-
tion of these measures in the rice industry.
The analysis of the current state of the rice industry conducted in chapter 4 has shown that
challenging issues for the rice freight transport are as follows. Firstly, the increase in road
freight transport which can potentially lead to a rise in GHG emissions and traffic accidents.
Secondly, high transport and logistics cost are reducing the economic efficiency of this sector.
Lastly, overloading in long-distance freight transport has damaged and deteriorated infra-
structure network quickly.
Stemming from this analysis, the assessment criterion of Effectiveness was measured by esti-
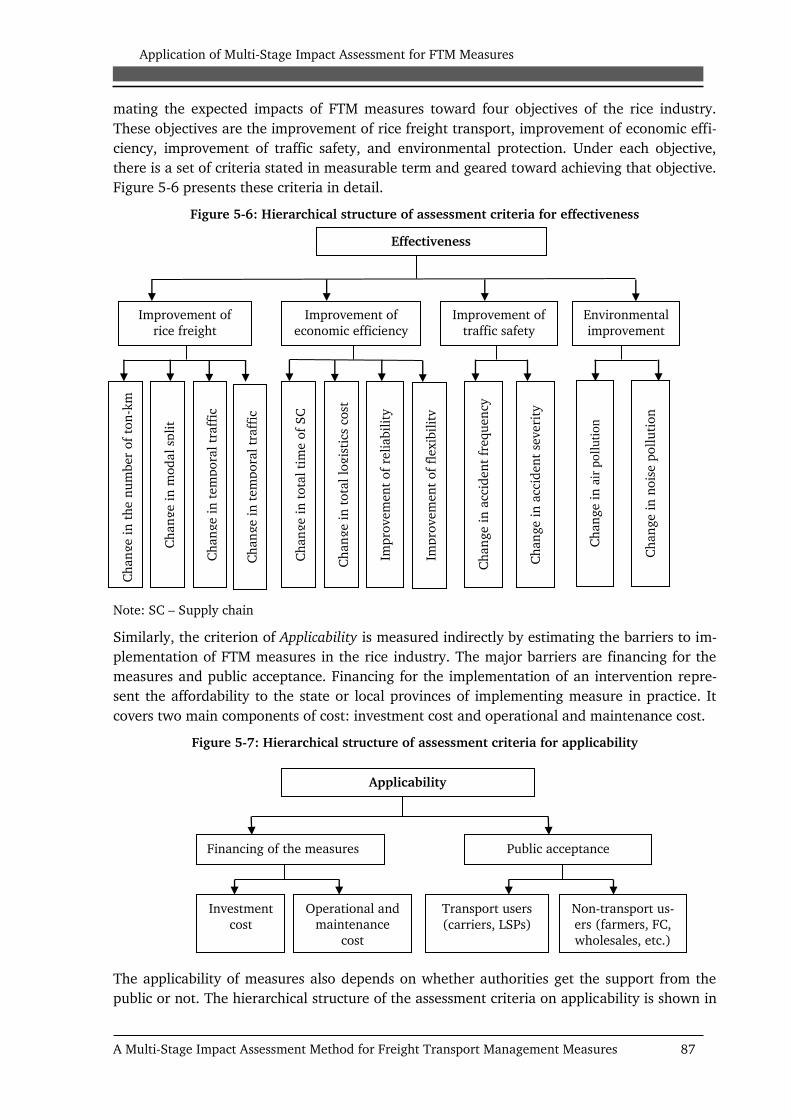
Application of Multi-Stage Impact Assessment for FTM Measures
A Multi-Stage Impact Assessment Method for Freight Transport Management Measures 87
mating the expected impacts of FTM measures toward four objectives of the rice industry.
These objectives are the improvement of rice freight transport, improvement of economic effi-
ciency, improvement of traffic safety, and environmental protection. Under each objective,
there is a set of criteria stated in measurable term and geared toward achieving that objective.
Figure 5-6 presents these criteria in detail.
Figure 5-6: Hierarchical structure of assessment criteria for effectiveness
Note: SC – Supply chain
Similarly, the criterion of Applicability is measured indirectly by estimating the barriers to im-
plementation of FTM measures in the rice industry. The major barriers are financing for the
measures and public acceptance. Financing for the implementation of an intervention repre-
sent the affordability to the state or local provinces of implementing measure in practice. It
covers two main components of cost: investment cost and operational and maintenance cost.
Figure 5-7: Hierarchical structure of assessment criteria for applicability
The applicability of measures also depends on whether authorities get the support from the
public or not. The hierarchical structure of the assessment criteria on applicability is shown in
Effectiveness
Improvement of
rice freight
Improvement of
economic efficiency
Improvement of
traffic safety
Environmental
improvement
Ch
an
ge i
n t
he n
um
ber
of
ton
-km
C
han
ge i
n m
od
al sp
lit
Ch
an
ge i
n t
em
pora
l tr
aff
ic
Ch
an
ge i
n t
ota
l ti
me o
f S
C
Ch
an
ge i
n t
ota
l lo
gis
tics
cost
Impro
vem
en
t of
reli
abil
ity
Impro
vem
en
t of
flexib
ilit
y
Ch
an
ge i
n a
ccid
en
t fr
equ
en
cy
Ch
an
ge i
n a
ccid
en
t se
veri
ty
Ch
an
ge i
n a
ir p
oll
uti
on
Ch
an
ge i
n n
ois
e p
oll
uti
on
Applicability
Financing of the measures Public acceptance
Investment
cost
Operational and maintenance
cost
Transport users
(carriers, LSPs)
Non-transport us-ers (farmers, FC,
wholesales, etc.)
Ch
an
ge i
n t
em
pora
l tr
aff
ic

Application of Multi-Stage Impact Assessment for FTM Measures
A Multi-Stage Impact Assessment Method for Freight Transport Management Measures 88
Figure 5-7. There are two main groups of public concerned: transport users and non-transport
users. The transport users can be clearly defined as people who are directly involved in rice
transport activities such as collectors, carriers or LSPs. Non-transport users are other people
who do not use any mode of transport but who are indirectly influenced by implementing
FTM measures (e.g. farmers, food companies, wholesalers, retailer, and transport authorities).
Weighting the assessment criteria
The weight of effectiveness and the applicability criteria group were obtained by conducting
an expert survey. The main objective of this survey in the context of this study was to gain in-
sights from experts on the relative importance of the assessment criteria. Because of the com-
plexity and scale of freight transport issues in the rice industry, experts with deep understand-
ing of the issue were chosen to participate in interviews.
Figure 5-8: Questionnaires sample
Three groups of experts were selected to complete questionnaires. The first group included
ten experts coming from freight transport companies and LSPs in the rice industry. Though
their works, this group are experience first-hand the conditions of the rice transport and logis-
tics. The second group consisted of five big shippers who are food companies in the rice indus-
try. The last group was comprised of five traffic management experts who have been working
for more than five years as transport decision-makers for transport authorities in HCMC and
in the Mekong Delta. These people also have a wide range of experiences in introducing traf-
fic management system in major cities in Vietnam. The questionnaire was designed to get ex-

Application of Multi-Stage Impact Assessment for FTM Measures
A Multi-Stage Impact Assessment Method for Freight Transport Management Measures 89
perts’ opinions about the weight of assessment criteria for the FTM measures in the context of
the Vietnamese rice industry. An extract of the questionnaire is presented in Figure 5-8.
It should be noted that one expert might display bias towards criteria relevant to his area of
expertise or economic interests; therefore subjectivity is a risk in the weighting process. To
minimize subjectivity and fronting individual interests, experts were provided with a short
presentation about this study and the questionnaire by email before direct interview. They
were also assured that all their personal assessments would be kept confidential and only pub-
lished with written permission. Interviews were carried out at the different workplaces of the
experts involved. On the interview day, at the beginning of the process, objectives of the study
were again explained, as was the interview process. A direct discussion of over an hour then
took place between the author and the experts based on questionnaire designed for the inter-
view.
After collecting different assessments of the experts on the importance levels of criteria, re-
sults were documented in form of assigned percentages using Excel software. The comparison
matrix is based on a standard seven-point scale. The resulting relative weights of importance
were then fixed for further analysis. Table 5-3 presents the scale for pairwise comparison.
Table 5-3: Scale for pairwise comparison
Numerical scale Definition Explanation
1 Equal Importance Two criteria contribute equally to the effectiveness
3 Moderate importance Moderate importance of one criteria over another
5 Significant importance Significant importance of one criteria over another
7 Extreme importance Extreme importance of one criteria over another
The pairwise comparison matrix of each expert was analysed individually to determine the
relative weights of the importance by percentage. The final weighting of importance of each
for each assessment criteria was estimated by using geometric means as an indicator of the
central tendency across individual weighting of all selected experts. Results of the analyses
therefore represent and aggregate expert opinion on the importance level of assessment crite-
ria. Results are presented in detail in Table 5-4.
Following these final results, the most likely expected impacts of FTM measures in the rice in-
dustry are a change modal in split and reduction in total logistics cost which have a relative
weight of 20% and 16%, respectively. “Reduction in the numbers of trips” and “reduction in
total time of the supply chain” are evaluated as the second most important factors with a rela-
tive weight of 10% and 9%, respectively. The factors marked third and fourth in terms of im-
portance are improved traffic safety and enhanced environmental protection with a relative
weight of 8% and 6%, respectively.
In terms of barriers to the implementation of FTM measures in the rice industry, the relative
weight of importance indicates that financing of the measure is rated as the most difficult fac-
tor with a relative weight of 71%, while the requirement of public acceptance is ranked as the
second in difficulty. More specifically, investment cost and the acceptance of non-transport
users (e.g. food companies, wholesalers, and retailers) have the strongest effect on putting
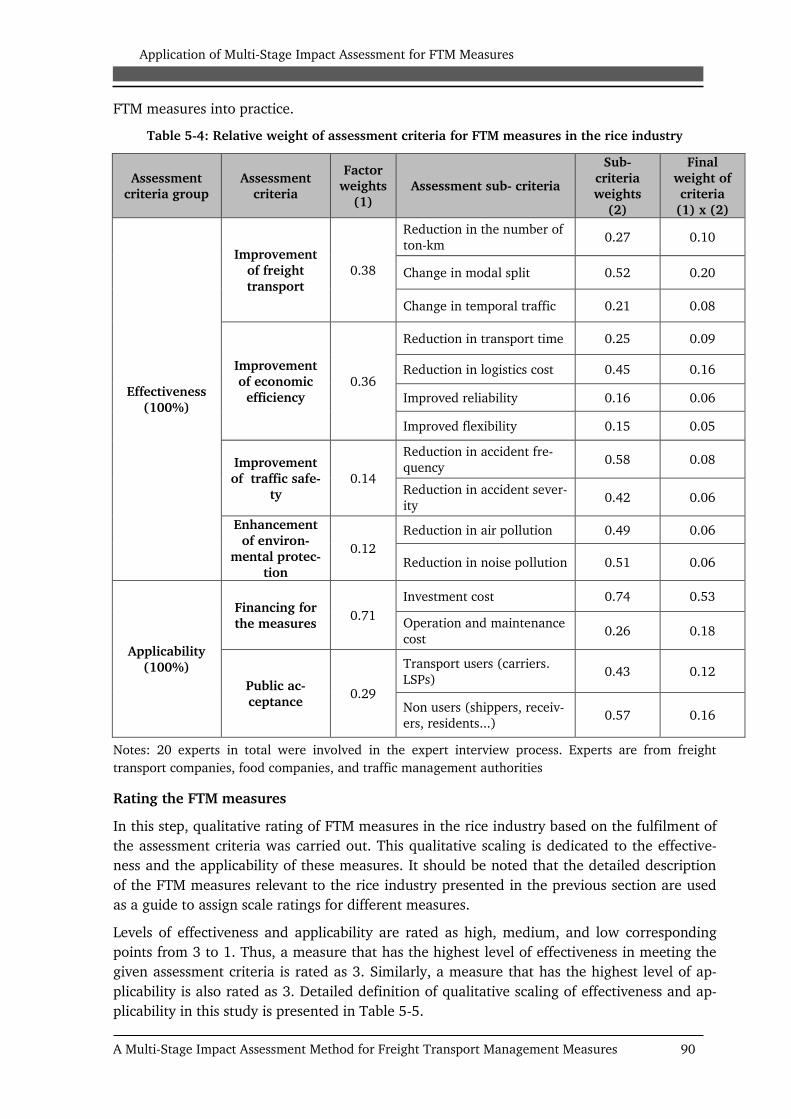
Application of Multi-Stage Impact Assessment for FTM Measures
A Multi-Stage Impact Assessment Method for Freight Transport Management Measures 90
FTM measures into practice.
Table 5-4: Relative weight of assessment criteria for FTM measures in the rice industry
Assessment criteria group
Assessment criteria
Factor weights
(1)
Assessment sub- criteria
Sub-
criteria weights
(2)
Final
weight of criteria
(1) x (2)
Effectiveness
(100%)
Improvement
of freight
transport
0.38
Reduction in the number of
ton-km 0.27 0.10
Change in modal split 0.52 0.20
Change in temporal traffic 0.21 0.08
Improvement
of economic
efficiency
0.36
Reduction in transport time 0.25 0.09
Reduction in logistics cost 0.45 0.16
Improved reliability 0.16 0.06
Improved flexibility 0.15 0.05
Improvement
of traffic safe-
ty
0.14
Reduction in accident fre-
quency 0.58 0.08
Reduction in accident sever-
ity 0.42 0.06
Enhancement
of environ-
mental protec-
tion
0.12
Reduction in air pollution 0.49 0.06
Reduction in noise pollution 0.51 0.06
Applicability
(100%)
Financing for
the measures 0.71
Investment cost 0.74 0.53
Operation and maintenance
cost 0.26 0.18
Public ac-
ceptance 0.29
Transport users (carriers.
LSPs) 0.43 0.12
Non users (shippers, receiv-
ers, residents...) 0.57 0.16
Notes: 20 experts in total were involved in the expert interview process. Experts are from freight
transport companies, food companies, and traffic management authorities
Rating the FTM measures
In this step, qualitative rating of FTM measures in the rice industry based on the fulfilment of
the assessment criteria was carried out. This qualitative scaling is dedicated to the effective-
ness and the applicability of these measures. It should be noted that the detailed description
of the FTM measures relevant to the rice industry presented in the previous section are used
as a guide to assign scale ratings for different measures.
Levels of effectiveness and applicability are rated as high, medium, and low corresponding
points from 3 to 1. Thus, a measure that has the highest level of effectiveness in meeting the
given assessment criteria is rated as 3. Similarly, a measure that has the highest level of ap-
plicability is also rated as 3. Detailed definition of qualitative scaling of effectiveness and ap-
plicability in this study is presented in Table 5-5.
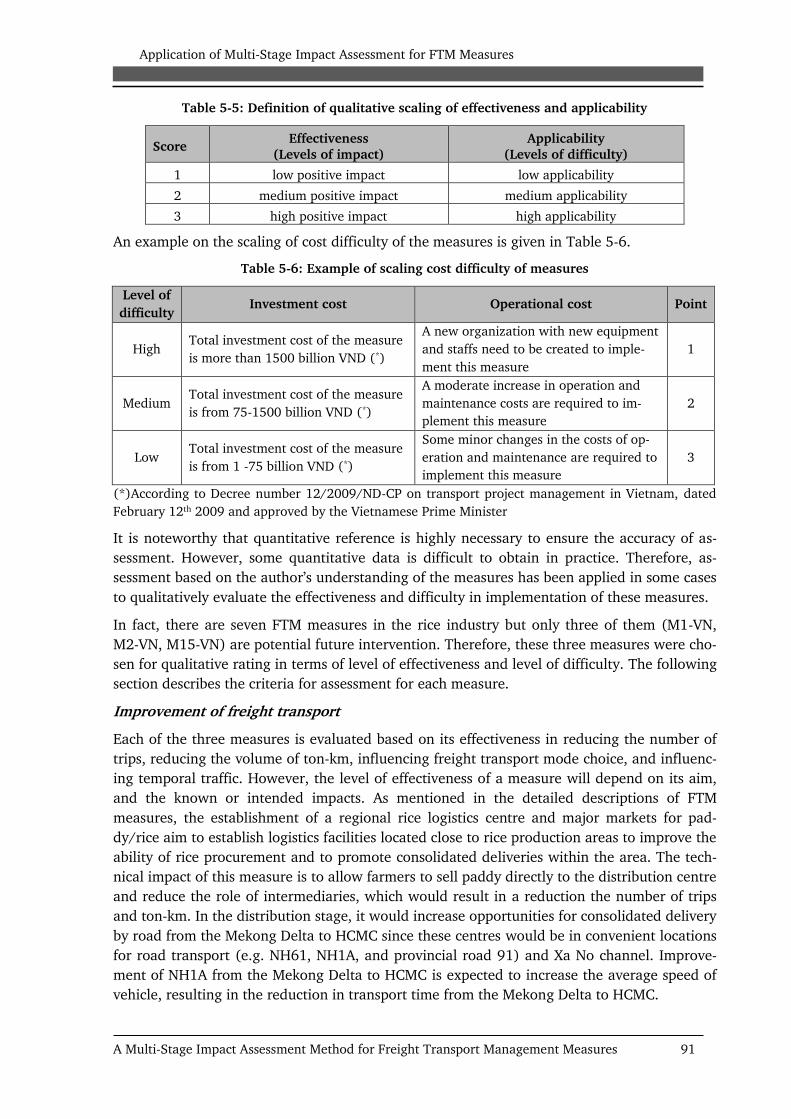
Application of Multi-Stage Impact Assessment for FTM Measures
A Multi-Stage Impact Assessment Method for Freight Transport Management Measures 91
Table 5-5: Definition of qualitative scaling of effectiveness and applicability
Score Effectiveness
(Levels of impact)
Applicability
(Levels of difficulty)
1 low positive impact low applicability
2 medium positive impact medium applicability
3 high positive impact high applicability
An example on the scaling of cost difficulty of the measures is given in Table 5-6.
Table 5-6: Example of scaling cost difficulty of measures
Level of
difficulty Investment cost Operational cost Point
High Total investment cost of the measure
is more than 1500 billion VND (*)
A new organization with new equipment
and staffs need to be created to imple-
ment this measure
1
Medium Total investment cost of the measure
is from 75-1500 billion VND (*)
A moderate increase in operation and
maintenance costs are required to im-
plement this measure
2
Low Total investment cost of the measure
is from 1 -75 billion VND (*)
Some minor changes in the costs of op-
eration and maintenance are required to
implement this measure
3
(*)According to Decree number 12/2009/ND-CP on transport project management in Vietnam, dated
February 12th 2009 and approved by the Vietnamese Prime Minister
It is noteworthy that quantitative reference is highly necessary to ensure the accuracy of as-
sessment. However, some quantitative data is difficult to obtain in practice. Therefore, as-
sessment based on the author’s understanding of the measures has been applied in some cases
to qualitatively evaluate the effectiveness and difficulty in implementation of these measures.
In fact, there are seven FTM measures in the rice industry but only three of them (M1-VN,
M2-VN, M15-VN) are potential future intervention. Therefore, these three measures were cho-
sen for qualitative rating in terms of level of effectiveness and level of difficulty. The following
section describes the criteria for assessment for each measure.
Improvement of freight transport
Each of the three measures is evaluated based on its effectiveness in reducing the number of
trips, reducing the volume of ton-km, influencing freight transport mode choice, and influenc-
ing temporal traffic. However, the level of effectiveness of a measure will depend on its aim,
and the known or intended impacts. As mentioned in the detailed descriptions of FTM
measures, the establishment of a regional rice logistics centre and major markets for pad-
dy/rice aim to establish logistics facilities located close to rice production areas to improve the
ability of rice procurement and to promote consolidated deliveries within the area. The tech-
nical impact of this measure is to allow farmers to sell paddy directly to the distribution centre
and reduce the role of intermediaries, which would result in a reduction the number of trips
and ton-km. In the distribution stage, it would increase opportunities for consolidated delivery
by road from the Mekong Delta to HCMC since these centres would be in convenient locations
for road transport (e.g. NH61, NH1A, and provincial road 91) and Xa No channel. Improve-
ment of NH1A from the Mekong Delta to HCMC is expected to increase the average speed of
vehicle, resulting in the reduction in transport time from the Mekong Delta to HCMC.
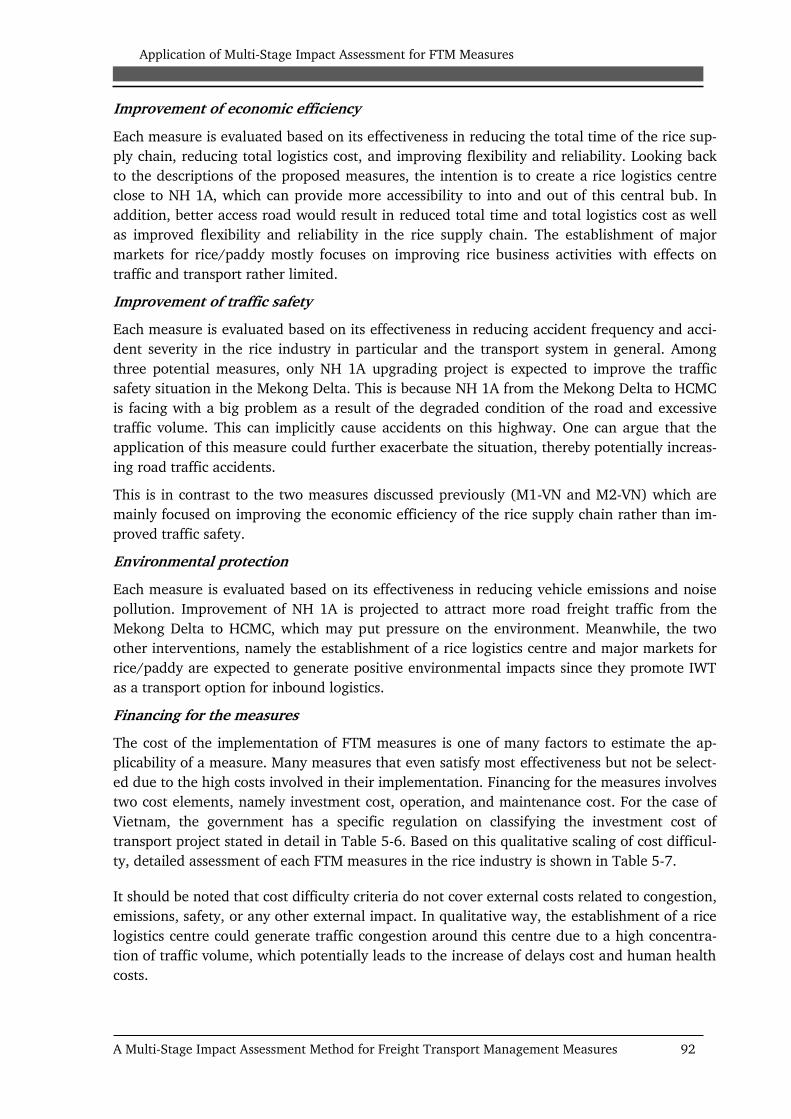
Application of Multi-Stage Impact Assessment for FTM Measures
A Multi-Stage Impact Assessment Method for Freight Transport Management Measures 92
Improvement of economic efficiency
Each measure is evaluated based on its effectiveness in reducing the total time of the rice sup-
ply chain, reducing total logistics cost, and improving flexibility and reliability. Looking back
to the descriptions of the proposed measures, the intention is to create a rice logistics centre
close to NH 1A, which can provide more accessibility to into and out of this central bub. In
addition, better access road would result in reduced total time and total logistics cost as well
as improved flexibility and reliability in the rice supply chain. The establishment of major
markets for rice/paddy mostly focuses on improving rice business activities with effects on
traffic and transport rather limited.
Improvement of traffic safety
Each measure is evaluated based on its effectiveness in reducing accident frequency and acci-
dent severity in the rice industry in particular and the transport system in general. Among
three potential measures, only NH 1A upgrading project is expected to improve the traffic
safety situation in the Mekong Delta. This is because NH 1A from the Mekong Delta to HCMC
is facing with a big problem as a result of the degraded condition of the road and excessive
traffic volume. This can implicitly cause accidents on this highway. One can argue that the
application of this measure could further exacerbate the situation, thereby potentially increas-
ing road traffic accidents.
This is in contrast to the two measures discussed previously (M1-VN and M2-VN) which are
mainly focused on improving the economic efficiency of the rice supply chain rather than im-
proved traffic safety.
Environmental protection
Each measure is evaluated based on its effectiveness in reducing vehicle emissions and noise
pollution. Improvement of NH 1A is projected to attract more road freight traffic from the
Mekong Delta to HCMC, which may put pressure on the environment. Meanwhile, the two
other interventions, namely the establishment of a rice logistics centre and major markets for
rice/paddy are expected to generate positive environmental impacts since they promote IWT
as a transport option for inbound logistics.
Financing for the measures
The cost of the implementation of FTM measures is one of many factors to estimate the ap-
plicability of a measure. Many measures that even satisfy most effectiveness but not be select-
ed due to the high costs involved in their implementation. Financing for the measures involves
two cost elements, namely investment cost, operation, and maintenance cost. For the case of
Vietnam, the government has a specific regulation on classifying the investment cost of
transport project stated in detail in Table 5-6. Based on this qualitative scaling of cost difficul-
ty, detailed assessment of each FTM measures in the rice industry is shown in Table 5-7.
It should be noted that cost difficulty criteria do not cover external costs related to congestion,
emissions, safety, or any other external impact. In qualitative way, the establishment of a rice
logistics centre could generate traffic congestion around this centre due to a high concentra-
tion of traffic volume, which potentially leads to the increase of delays cost and human health
costs.

Application of Multi-Stage Impact Assessment for FTM Measures
A Multi-Stage Impact Assessment Method for Freight Transport Management Measures 93
Table 5-7: Assessment on the cost difficulty of each measure
No FTM measures in the rice industry Estimated invest-
ment cost (Billions
VND)
Assessment of difficulty in the
cost of measure
Point
M1-VN A rice logistics centre in Chau
Thanh A (Hau Giang province)
1000
(Ref: VINAFOOD 2) Medium 2
M2-VN
Major markets for rice/paddy in
Can Tho, Long An, Tien Giang prov-
inces
1200
(Ref: VINAFOOD 2) Medium 2
M15-VN Improvement of NH1A from the Mekong Delta to HCMC
6000 (Ref: MOT)
High 1
Similarity, the improvement of NH 1A could have an intrinsic risk of increased traffic acci-
dents on this highways due to high speed limit. This implies that external costs generated by
transport accidents such as medical costs or production losses would be increased. For this
study, it was not possible to consider all external impacts but CO2 and local air (SOx and NOx)
pollution and traffic accident borne by rice freight transport will be taken into account when
assessing the impacts of FTM measures.
Public acceptance
For implementing a FTM measure, two main demographics of the public are concerned:
transport users and non-transport users. The transport users are defined as people who are di-
rectly involved in rice transport activities such as collectors, transport companies or LSPs.
Non-transport users are other people who do not use any mode of transport but who are indi-
rectly influenced by implementing FTM measures (e.g. farmers, food companies, wholesalers,
retailer, residents). The adopted qualitative scaling index ranges from 1 to 3, in the decreas-
ing order of difficulty in getting public acceptance. Thus, the measure that provokes the high-
est acceptance due to any factors related to the implementation of the measure is rated as 3.
After describing the assessment criteria, the study will scale qualitatively the effectiveness and
applicability score for each measure. As mentioned above, effectiveness of measure is assessed
by the impacts on the rice transport towards four dimensions including improvement of
freight transport, improvement of economic efficiency, improvement of traffic safety, and en-
hanced environmental protection. Applicability of measures is evaluated by estimating the dif-
ficulty level in getting the basic requirements involving costs and the support of stakeholders.
The final qualitative scaling of three potential measures in terms of the effectiveness and ap-
plicability is presented in Table 5-8.
The tables show the initiatives of establishing a regional rice logistics centre (M1-VN) is ex-
pected to change significantly freight mode share towards more IWT usage, reduce the num-
ber of ton-km and improve remarkably the economic efficiency of the rice industry. The
measure on improving NH1A (M15-VN) will face the difficulty of high investment cost (1
point in applicability level) but expect to gain many supports among the public (3 point in
public acceptance of transport users) because of their potential benefits in term of improve-
ment of freight transport and economic efficiency. Non-transport users may have a little con-
cern on negative impacts on the environment and traffic safety when a regional rice logistics
centre and the project improving for NH 1A is implemented. The implementation of major
markets for rice/paddies (M2-VN) is very hard to get the support from collectors, transport
companies or LSPs in the Mekong Delta (1 point in applicability level) due to congested access

Application of Multi-Stage Impact Assessment for FTM Measures
A Multi-Stage Impact Assessment Method for Freight Transport Management Measures 94
in and out of these markets. To date, there is little in the literature that provides quantifica-
tion of the actual transport impacts in implementing major markets for rice or paddy in the
Mekong Delta. Therefore, communicating the initiative to the public and generating support
from both transport and non-transport users may be challenging.
Table 5-8: Qualitative scaling of three potential FTM measures in the rice industry
M1-VN M2-VN M15-VN
Criteria Sub-criteria
Regional rice lo-
gistics centres in Hau Giang prov-
ince
Major markets for rice in the
Mekong Delta
Improvement
of NH1A from the Mekong
Delta to HCMC
EFFECTIVENESS
Improvement
of rice freight
transport
Reduction in the number of ton-
km 2 2 3
Change in modal split 3 1 3
Change in temporal traffic 1 1 1
Improvement
of economic
efficiency
Reduction in total time of the
supply chain 2 1 3
Reduction in logistics cost 3 1 2
Improved reliability 2 1 3
Improved flexibility 1 1 2
Improvement
of
traffic safety
Reduction in accident frequency 2 2 1
Reduce in accident severity 2 1 1
Environmen-
tal protection
Reduction in air pollution 3 1 1
Reduction in noise pollution 2 1 1
APPLICABILITY
Financing of
the measures
Investment cost 2 2 1
Operation and maintenance cost 2 2 3
Public ac-
ceptance
Transport users 3 1 3
Non-transport users 2 1 2
5.2.3 Final evaluation of FTM measures
Qualitative assessment model has been developed to calculate the final effectiveness and diffi-
culty score of each measure. The formulas consist of three elements: (i) the relative weight of
assessment criteria (Cm or Cx), (ii) the relative weight of assessment sub-criteria (CS,mn or
CS,xy), (iii) author’s rating of the measure (eijmn and aij
xy). A measure would be more effective
and more easily applied if the effectiveness and applicability scores are higher and vice versa.
In which

Application of Multi-Stage Impact Assessment for FTM Measures
A Multi-Stage Impact Assessment Method for Freight Transport Management Measures 95
: Total effectiveness score of FTM measure i under modal category j
: Weight of criteria m (m=1 to 4)
: Weight of sub-criteria n under criteria m
: Effectiveness point of measure i on category j, on criteria m and sub-criteria n
In which
: Total applicability score of FTM measure i under modal category j
: Weight of criteria x (x=1 to 2)
: Weight of sub-criteria y under criteria x
: Applicability point of measure i on category j, on criteria x and sub-criteria y
The calculation of effectiveness and difficulty scores of the measures provided the formation
of priority classes of FTM measures. Table 5-9 gives the detailed results of the qualitative as-
sessment of FTM measures in the rice industry.
Table 5-9: Final assessment of pre-selected measures
Measures Effectiveness
score ( )
Applicability
score ( ) Ranking
M1-VN A regional rice logistics cen-
tre in Hau Giang province 2.3 2.1 First priority
M2-VN Major markets for rice in Can Tho, Long An, Tien
Giang provinces
1.2 1.7 Third priority
M15-VN Improvement of NH1A from the Mekong Delta to HCMC
2.1 1.8 Second priority
The assessment of FTM measures in the rice industry inferred that the measures that have the
highest level of effectiveness and applicability would belong to the first priority group. The
second priority group consists of measures that either have a high level of effectiveness and a
medium level of difficulty or a medium level of effectiveness and a low level of difficulty. Re-
maining measures will belong to the last priority group.
According to the assessment results, an establishment of a regional rice logistics centre in Hau
Giang province is recommended as the first priority measure because of its high level of effec-
tiveness and low level of difficulty in implementation. Next, improvement of NH 1A is ranked
in the second priority group since it involves a moderate level of effectiveness and ease to ap-
plication. The establishment of major markets for rice/paddy is assigned as last priority meas-
ure due to low level of effectiveness and high level of difficulty involved in implementation.
M1-VN and M15-VN will be the focus of a detailed quantitative impact assessment in the next
section.

Application of Multi-Stage Impact Assessment for FTM Measures
A Multi-Stage Impact Assessment Method for Freight Transport Management Measures 96
5.3 Detailed analysis of impacts of FTM measures
In this step, a detailed quantitative assessment is carried out to determine the impacts related
to the change in the supply chain, and the impacts on mode and route choices in the rice in-
dustry. According to the proposed framework for impact assessments defined in the Chapter
3, the application of disaggregate models, i.e. TLC, is highly necessary. This is because such a
model allows understanding detailed knowledge of structure of sector, as well as stakeholders
involved and their decisions making behaviours, key underlying factors for the analysis of core
effects. Before going into detail regarding the application of TLC model, the study presents
some scenarios for detailed quantitative impact assessment.
5.3.1 Determination of scenarios
The scenarios, presented in this section, are formed based on the assessment results of the
first step. Particularly, the results of the first step have revealed that a high rating was given to
the following FTM measures: the establishment of a regional rice logistics centre (M1-VN) and
NH 1A improvement (M15-VN). Building on this, three scenarios can be set-up for impact as-
sessment. The first scenario is if only a new rice logistics centre is established. The second
scenario is the improvement of NH1A. The third scenario is the combination of the two
measures above.
Table 5-10: Different scenarios for the application of FTM measures in the rice industry
Base scenario
(including all already applied measures) Scenario 1 Scenario 2 Scenario 3
M4-VN
Prohibition of trucks entering
HCMC from 6:00 am to 12:00
pm
Base scenario
+ implementa-
tion of M1-VN
Base scenario
+ implementa-
tion of M15-
VN
Base scenario
+ implementa-
tion of both
M1-VN and
M15-VN
M11-VN The establishment of centralized
areas for paddy production
M12-VN
Co-operation between collectors
and millers and export compa-
nies in An Giang province
M17-VN
Restricting overloaded trucks on
the highway from the Mekong
Delta to HCMC
Explanations:
M1-VN: A regional rice logistics centre in Hau Giang province
M15-VN: NH1A improvement from the Mekong Delta to HCMC
Base scenario
For this case study, the base scenario reflects existing condition in the rice industry. It in-
cludes all FTM measures already applied in practice, namely M4-VN, M11-VN, M12-VN, and
M17-VN. The base scenario is compared to other scenarios for which the impacts of freight
transport management can be measured.
Scenario 1
Scenario 1 is defined by the establishment of a regional rice logistics centre in Hau Giang
province. This centre will hold a key position, bordering Can Tho city and Kien Giang prov-

Application of Multi-Stage Impact Assessment for FTM Measures
A Multi-Stage Impact Assessment Method for Freight Transport Management Measures 97
ince - “the rice bowls” of the Mekong Delta; and Xa No channel; and be close to important
highways such as NH61, NH1A, provincial road 92.
Scenario 2
Scenario 2 is developed by the implementation of the project on upgrading NH 1A from the
Mekong Delta to HCMC. Construction is scheduled to commence in early 2016 and plans indi-
cate the project should be completed at the end of 2018. The planned NH 1A upgrade is be-
lieved to increase road access to many key rice production areas in the Mekong Delta, which
can facilitate commodity flows in and out of the region.
Scenario 3
Scenario 3 is the combination of the establishment of a rice logistics centre and upgrading NH
1A from the Mekong Delta to HCMC. The concurrent implementation of these two measures is
believed to strongly influence the economic efficiency in the rice industry.
The following sections will apply a TLC model to assess deeply the impacts of these scenarios.
This model starts with analysing the generation of sources of rice in the Mekong Delta and the
generation of establishments in HCMC. Then, analysis of the allocation of rice commodity
flows from the Mekong Delta to HCMC is carried out, taking into consideration mode and
route choices for each rice commodity flow. Accordingly, the TLC of different transport mode
choices will be estimated. Expected modal shift under the intervention of the scenarios will be
based on an optimization of TLC for the individual rice commodity flows.
5.3.2 Rice generation sources
The sources of rice in the Mekong Delta are defined based on data from GSO under People
Committees in the Mekong Delta and Vietnam Food Association (VFA). GSO provides data in
an aggregate form; examples are total rice outputs and aggregate distribution flows from the
Mekong Delta to other regions. Data from VFA focuses on the statistics of rice volume for each
FPEs and food companies. Most of these FPEs are the members of the VINAFOOD 2. In some
cases, both data sources can be compared to check consistency.
Table 5-11: Rice production and consumption in the Mekong Delta
Unit: Million tons
Items Paddy % Rice
1. Total volume (Q) 21.995 14.517
2. Losses in harvesting process 2.156 9.8 1.4226
3. Total consumption output (Q1) 19.839 13.094
4. Materials and animal breeding 1.445 0.954
- Rice seeds: 165kg*3,870 mil.ha 0.64
0.42
- Animal breeding: 3,13%*Q rice 0.41 0.27
- Materials for industries: 2%*Q1 rice 0.40 0.26
5. Losses in processing rice 9.8 1.287
- Milling: 2,47%
- Polishing: 4%
- Warehousing: 1%
- Transporting : 2,36%
6. Rice commodity from the Mekong Delta 16.44 10.853
Source: GSO (2011)

Application of Multi-Stage Impact Assessment for FTM Measures
A Multi-Stage Impact Assessment Method for Freight Transport Management Measures 98
According to GSO (2011), total rice output from the Mekong Delta in 2010 was more than
14.5 million tons. However, rice commodity was about 10.85 million tons since there is a cer-
tain percentage of total output lost in the harvesting process and used as materials for other
industries. Detailed data is shown in Table 5-11.
Distribution of rice flows from the Mekong Delta to other regions is presented in Figure 5-9
This figure shows that HCMC is the focal point of rice demand and trade. Meanwhile, central
and northern regions have very small rice flows with the Mekong Delta.
Figure 5-9 : Distribution of rice flows in the Mekong Delta, 2010
Source: GSO (2011)
According to the statistics from VINAFOOD 2, there are 74 FPEs with an annual rice handling
volume of more than 25,000 tons, which can be seen as key sources of rice in the Mekong
Delta.
Table 5-12: Key sources of rice in the Mekong Delta
No Name of province in the Me-
kong Delta
Numbers of key rice
sources
Total rice handling vol-
ume per year (ton)
1 Long An 6 820,000
2 Tien Giang 8 510,000
3 Ben Tre 2 110,000
4 Vinh Long 1 170,000
5 Dong Thap 4 690,000
6 An Giang 14 2,165,000
7 Can Tho 10 828,000
8 Tra Vinh 3 120,000
9 Soc Trang 5 447,000
10 Hau Giang 6 275,000
11 Kien Giang 9 1,770,000
12 Bac Lieu 6 200,000
Total 74 7,985,000
Share in total rice volume of the Mekong Delta 73.6%
Source: VFA (2011)
Total rice commodity in the Mekong Delta (2010)
10.85 Mio. tons
Local consumption
(20%)
2.17 Mio. tons
HCMC
(75%)
8.14 Mio. tons
Domestics
(30%)
Export
(70%)
2.44 Mio.
tons
5.70 Mio.
tons
Central and North-
ern regions (5%)
(75%) 0.54 Mio. tons

Application of Multi-Stage Impact Assessment for FTM Measures
A Multi-Stage Impact Assessment Method for Freight Transport Management Measures 99
Total rice volume from these sources makes up more than 73.6% of rice commodity output of
the whole region. The name, address as well as annual rice handling volume of each source
are presented in detail in Appendix C. The location of these sources is noted on the map of the
Mekong Delta (see Figure 5-10)
Figure 5-10: Locations of key rice sources in the Mekong Delta
Source: Own illustration
It can be seen that key sources of rice are concentrated very much in An Giang, Kien Giang,
Long An provinces, and Can Tho city. These provinces are seen as “rice bowls” of the Mekong
Delta.
In the both scenarios 1 and 3, a regional rice logistics centre is formed in Chau Thanh District,
part of Hau Giang province, which borders with Can Tho city and Kien Giang province. There-
fore, this centre is expected to attract a lot of rice sources in surrounding area because of its
ability to facilitate the consolidation and deliveries of rice going to HCMC. However, most key
rice sources often have their own warehouses, so the utilisation of the rice logistics centre de-
pends much on the convenience of transport or accessibility as well as TLC optimization.
The question can be raised then, of how these scenarios can affect a modal shift from barge to
road transport or vice versa on the way to HCMC. The answer is dependent mostly on changes
in the TLC of road and IWT transport modes, which will be estimated in detail in the follow-
ing sections.
5.3.3 Generation of establishments in Ho Chi Minh City
As mentioned in the previous section, HCMC is the biggest consumption market for the Me-
kong Delta rice. Therefore, the analysis will focus more on rice transport from the Mekong
Delta to establishments in HCMC. Friedrich (2010) describes the establishments as the loca-
tions between which goods are transported. Establishments belong to companies and repre-
sent the locations where companies are active. In this study, establishment can be wholesal-
ers, distribution centres and warehouses of food companies in HCMC.
For generating data on establishments, the study employed the statistics of freight and ware-
housing companies located in HCMC provided by GSO. In Vietnam, GSO often provides the
A regional rice logistics
centre
Key rice source
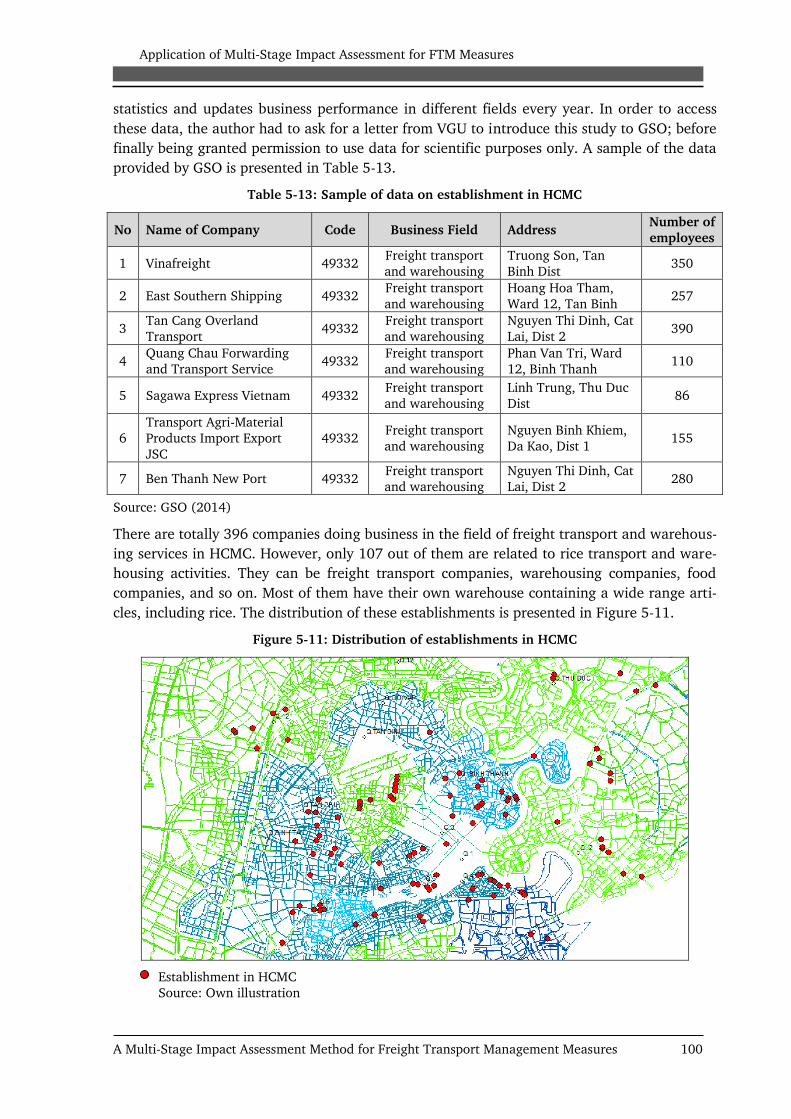
Application of Multi-Stage Impact Assessment for FTM Measures
A Multi-Stage Impact Assessment Method for Freight Transport Management Measures 100
statistics and updates business performance in different fields every year. In order to access
these data, the author had to ask for a letter from VGU to introduce this study to GSO; before
finally being granted permission to use data for scientific purposes only. A sample of the data
provided by GSO is presented in Table 5-13.
Table 5-13: Sample of data on establishment in HCMC
No Name of Company Code Business Field Address Number of
employees
1 Vinafreight 49332 Freight transport
and warehousing
Truong Son, Tan
Binh Dist 350
2 East Southern Shipping 49332 Freight transport
and warehousing
Hoang Hoa Tham,
Ward 12, Tan Binh 257
3 Tan Cang Overland
Transport 49332
Freight transport
and warehousing
Nguyen Thi Dinh, Cat
Lai, Dist 2 390
4 Quang Chau Forwarding
and Transport Service 49332
Freight transport
and warehousing
Phan Van Tri, Ward
12, Binh Thanh 110
5 Sagawa Express Vietnam 49332 Freight transport
and warehousing
Linh Trung, Thu Duc
Dist 86
6
Transport Agri-Material
Products Import Export
JSC
49332 Freight transport
and warehousing
Nguyen Binh Khiem,
Da Kao, Dist 1 155
7 Ben Thanh New Port 49332 Freight transport
and warehousing
Nguyen Thi Dinh, Cat
Lai, Dist 2 280
Source: GSO (2014)
There are totally 396 companies doing business in the field of freight transport and warehous-
ing services in HCMC. However, only 107 out of them are related to rice transport and ware-
housing activities. They can be freight transport companies, warehousing companies, food
companies, and so on. Most of them have their own warehouse containing a wide range arti-
cles, including rice. The distribution of these establishments is presented in Figure 5-11.
Figure 5-11: Distribution of establishments in HCMC
Establishment in HCMC
Source: Own illustration
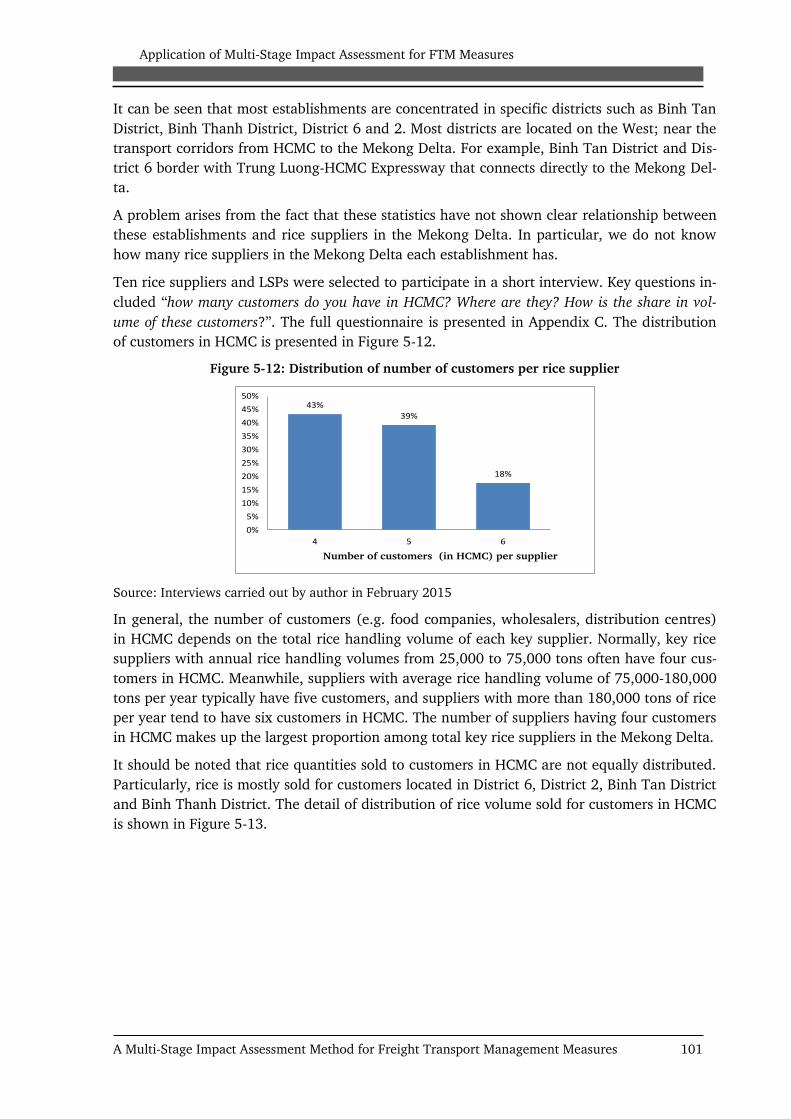
Application of Multi-Stage Impact Assessment for FTM Measures
A Multi-Stage Impact Assessment Method for Freight Transport Management Measures 101
It can be seen that most establishments are concentrated in specific districts such as Binh Tan
District, Binh Thanh District, District 6 and 2. Most districts are located on the West; near the
transport corridors from HCMC to the Mekong Delta. For example, Binh Tan District and Dis-
trict 6 border with Trung Luong-HCMC Expressway that connects directly to the Mekong Del-
ta.
A problem arises from the fact that these statistics have not shown clear relationship between
these establishments and rice suppliers in the Mekong Delta. In particular, we do not know
how many rice suppliers in the Mekong Delta each establishment has.
Ten rice suppliers and LSPs were selected to participate in a short interview. Key questions in-
cluded “how many customers do you have in HCMC? Where are they? How is the share in vol-
ume of these customers?”. The full questionnaire is presented in Appendix C. The distribution
of customers in HCMC is presented in Figure 5-12.
Figure 5-12: Distribution of number of customers per rice supplier
43%39%
18%
0%
5%
10%
15%
20%
25%
30%
35%
40%
45%
50%
4 5 6
Number of customers (in HCMC) per supplier
Source: Interviews carried out by author in February 2015
In general, the number of customers (e.g. food companies, wholesalers, distribution centres)
in HCMC depends on the total rice handling volume of each key supplier. Normally, key rice
suppliers with annual rice handling volumes from 25,000 to 75,000 tons often have four cus-
tomers in HCMC. Meanwhile, suppliers with average rice handling volume of 75,000-180,000
tons per year typically have five customers, and suppliers with more than 180,000 tons of rice
per year tend to have six customers in HCMC. The number of suppliers having four customers
in HCMC makes up the largest proportion among total key rice suppliers in the Mekong Delta.
It should be noted that rice quantities sold to customers in HCMC are not equally distributed.
Particularly, rice is mostly sold for customers located in District 6, District 2, Binh Tan District
and Binh Thanh District. The detail of distribution of rice volume sold for customers in HCMC
is shown in Figure 5-13.

Application of Multi-Stage Impact Assessment for FTM Measures
A Multi-Stage Impact Assessment Method for Freight Transport Management Measures 102
Figure 5-13: Distribution of rice volume sold for customers in HCMC
17.4%
20.8%
10.2%
16.5%
8.1%
0.3%
7.5%
12.1%
7.1%
0.0%
5.0%
10.0%
15.0%
20.0%
25.0%
District2
District6
District8
BinhTan
District
BinhChanhDistrict
Thu DucDistrict
District9
BinhThanhDistrict
Nha BeDistrict
Source: Interviews carried out by author in February 2015
The analysis of distribution of customers in HCMC as well as the distribution of suppliers in
the Mekong Delta is underlying data for the development of a TLC model in the rice industry,
which will be presented in the next section.
5.3.4 Development of TLC model in the rice industry
The development of the TLC model involves the following assumptions. Firstly, rice demand
in HCMC is met in full provided by suppliers from the Mekong Delta. Secondly, a key rice
supplier in the Mekong Delta serves at least four customers in HCMC. A customer, though, in-
volved several rice commodity flows attached to different rice supply paths from the Mekong
Delta. However, since the rice demand of a customer is believed to be much smaller than the
capacity of a key rice supplier in the Mekong Delta, it is assumed that these commodity flows
are allocated to one supplier. These assumptions are reasonable; that is because, as stated in
section 5.3.2, HCMC is responsible for about 75% of the total rice volume of the Mekong Del-
ta. In addition to this, the statement from the survey in section 5.3.3 implies that the number
of customers for rice produced in the Mekong Delta is concentrated densely in HCMC, ranging
from 4 to 6 customers per supplier.
A Pareto distribution of quantities per supplier is utilised to generate the commodity flows in
the rice industry. The cumulated Pareto distribution function is defined by the following for-
mula:
Where, is a positive minimum possible value of x, called a “scale parameter” and is a
positive parameter, called a “shape parameter”.
For this study, the number of customers per supplier depends on the annual rice handling
volume of supplier. Suppliers in the Mekong Delta with high volume would have more cus-
tomers in HCMC. For each relation of a supplier and one customer a commodity flow is gen-
erated. The number of commodity flows is determined proportionally to the number of cus-
tomers. For each supplier the volume of a commodity flow is determined based on Pareto dis-
tribution and the differences in the annual rice handling volumes of suppliers. Shape parame-

Application of Multi-Stage Impact Assessment for FTM Measures
A Multi-Stage Impact Assessment Method for Freight Transport Management Measures 103
ter indicates these differences. In particular, there are three different shape parameters as-
suming in this model: = 1 for suppliers with annual rice handling volumes from 25,000 to
75,000 tons; = 2 for suppliers with annual rice handling volumes from 75,000 to 180,000
tons; and = 3 for suppliers with annual rice handling volumes more than 180,000 tons.
Figure 5-14: Current supply paths in the rice industry (Base scenario)
In this study, there are 351 commodity flows generated from 74 key rice sources in the Me-
kong Delta. In fact, rice commodity flows can pass through different supply paths, which in-
corporate the usage of different stakeholder warehouses, transport modes, reloading points
and transport links. There are currently five rice supply paths from the Mekong Delta to
HCMC presented schematically in Figure 5-14.
We assume that supply chain managers try to minimize their total logistics cost while main-
taining a certain level of service as required by their customers. Therefore, decisions on utilis-
ing supply path will be based on total logistics cost (TLC). In particular, given a volume of a
commodity flow and distance from key rice generation sources to HCMC, the choice of
transport mode or route will be associated with optimizing total logistics costs of individual
commodity flows under the supply path i. The total logistics cost function of individual com-
modity flow is determined on a simple approach as follows:
𝑇𝐿𝐶𝑐𝑓𝑖 = 𝑇𝐶 + 𝐻𝐶 + 𝑊𝐶 + 𝑃𝑎𝑐𝑘
In which:
By IWT By road The Mekong
Delta
Farmers
Millers/Polishers
Food Companies
Port system
Barg
e
Barg
e
Barg
e
Barg
e
B
arg
e
Barg
e
Collectors
Farmers
Collectors
Millers/Polishers
Food Companies
Establishments
3
Barg
e
Tru
ck
Barg
e
Tru
ck
Tru
ck
Tru
ck
1
1
1
3
2
2
2
2
Tru
ck
4
4
5
HCMC B
arg
e
5 4
5

Application of Multi-Stage Impact Assessment for FTM Measures
A Multi-Stage Impact Assessment Method for Freight Transport Management Measures 104
Total logistics cost of a commodity
flow under supply path i WC Warehousing cost
TC Transport cost Pack Packaging cost
HC Handling cost
Looking more closely into the rice industry, TLC for each supply path is estimated as below:
In which:
F Farmer FC Food company
Coll Collector ES Establishment
Mil Miller
The cost components will be described in different levels of details depending on its influence
on TLC. The following text will discuss cost components of TLC in the rice industry.
Total transport cost depends on volume of goods, transport mode used, and transport dis-
tance. In particular, the model estimation for total transport cost of a commodity flow
(TCcf) is composed of inbound transport and outbound transport costs.
As for inbound transport, lot sizes and transport rates are used as input. Due to the geograph-
ical characteristics of Mekong Delta River that has an interlacing system of long and narrow
rivers and ditches, small boats are often used for the inbound transport. For this study, in-
bound transport cost per ton is collected through the interview with collectors in the Mekong
Delta. The total outbound transport from the Mekong Delta to HCMC has to be modelled in
more detail since this influences significantly total transport costs for the whole supply chain.
Specifically, the outbound transport cost is determined on a simple approach including
transport cost rate per ton ( ) and the volume of a commodity flow (Qcf).
Usually, transport cost rate per ton is used in the descriptive analysis of influencing factors on
transport cost. This rate can be expressed as a function of fuel cost, crew cost, depreciation
cost, repair and maintenance cost, and capital opportunity cost. It is calculated as follows:
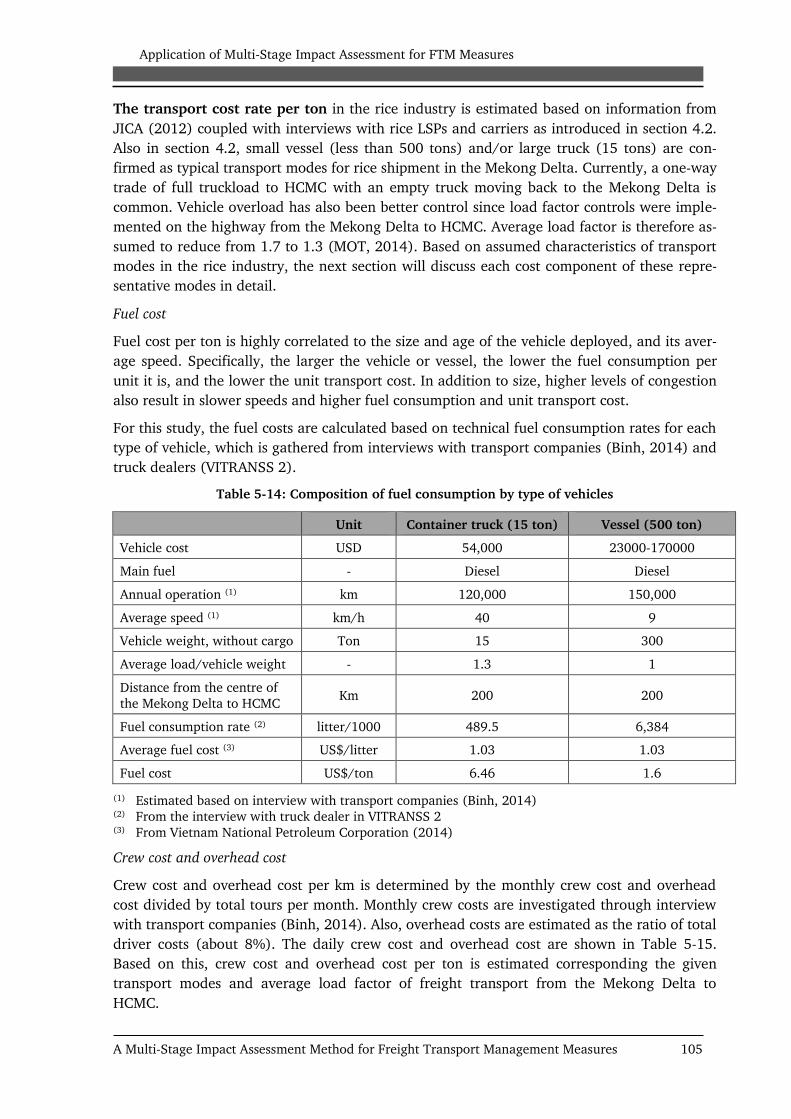
Application of Multi-Stage Impact Assessment for FTM Measures
A Multi-Stage Impact Assessment Method for Freight Transport Management Measures 105
The transport cost rate per ton in the rice industry is estimated based on information from
JICA (2012) coupled with interviews with rice LSPs and carriers as introduced in section 4.2.
Also in section 4.2, small vessel (less than 500 tons) and/or large truck (15 tons) are con-
firmed as typical transport modes for rice shipment in the Mekong Delta. Currently, a one-way
trade of full truckload to HCMC with an empty truck moving back to the Mekong Delta is
common. Vehicle overload has also been better control since load factor controls were imple-
mented on the highway from the Mekong Delta to HCMC. Average load factor is therefore as-
sumed to reduce from 1.7 to 1.3 (MOT, 2014). Based on assumed characteristics of transport
modes in the rice industry, the next section will discuss each cost component of these repre-
sentative modes in detail.
Fuel cost
Fuel cost per ton is highly correlated to the size and age of the vehicle deployed, and its aver-
age speed. Specifically, the larger the vehicle or vessel, the lower the fuel consumption per
unit it is, and the lower the unit transport cost. In addition to size, higher levels of congestion
also result in slower speeds and higher fuel consumption and unit transport cost.
For this study, the fuel costs are calculated based on technical fuel consumption rates for each
type of vehicle, which is gathered from interviews with transport companies (Binh, 2014) and
truck dealers (VITRANSS 2).
Table 5-14: Composition of fuel consumption by type of vehicles
Unit Container truck (15 ton) Vessel (500 ton)
Vehicle cost USD 54,000 23000-170000
Main fuel - Diesel Diesel
Annual operation (1) km 120,000 150,000
Average speed (1) km/h 40 9
Vehicle weight, without cargo Ton 15 300
Average load/vehicle weight - 1.3 1
Distance from the centre of
the Mekong Delta to HCMC Km 200 200
Fuel consumption rate (2) litter/1000 489.5 6,384
Average fuel cost (3) US$/litter 1.03 1.03
Fuel cost US$/ton 6.46 1.6
(1) Estimated based on interview with transport companies (Binh, 2014) (2) From the interview with truck dealer in VITRANSS 2
(3) From Vietnam National Petroleum Corporation (2014)
Crew cost and overhead cost
Crew cost and overhead cost per km is determined by the monthly crew cost and overhead
cost divided by total tours per month. Monthly crew costs are investigated through interview
with transport companies (Binh, 2014). Also, overhead costs are estimated as the ratio of total
driver costs (about 8%). The daily crew cost and overhead cost are shown in Table 5-15.
Based on this, crew cost and overhead cost per ton is estimated corresponding the given
transport modes and average load factor of freight transport from the Mekong Delta to
HCMC.

Application of Multi-Stage Impact Assessment for FTM Measures
A Multi-Stage Impact Assessment Method for Freight Transport Management Measures 106
Table 5-15: Crew cost and overhead cost by type of vehicles
Unit Container truck (15 ton) Vessel (500 ton)
Driver wages (1) (US$/month) 400 450
Overhead cost (1) % 20 15
Number of working days per year day 300 300
Daily total crew and overhead cost US$/day 19.2 20.7
Crew and overhead cost US$/ton 2.2 1.9
(1) Estimated based on interview with transport companies (Binh, 2014)
Depreciation cost
Depreciation related cost depends significantly on vehicle life and annual operation. This cost
is estimated by assuming the percentage of salvage value to vehicle cost and ratios of depreci-
ations subject to use and time. Salvage value data and the life of vehicle are assumed based
on interviews with transport companies.
Table 5-16: Depreciation cost estimation
Unit Container truck (15 ton) Vessel (500 ton)
Vehicle cost USD 54,000 23000-170000
Salvage value to vehicle cost % 15 10-12
% of depreciation of use and time
Subject to use % 70 70
Subject to time % 30 30
Annual operation km 120,000 150,000
Average speed km/h 30 9
Vehicle life year 12 15
Depreciation cost subject to use and time US$/ton 0.98 0.48
Repair and maintenance cost
The cost of maintenance and repair are calculated assuming the percentage of annual repair
cost to vehicle cost. In fact, through the interview with transport companies, annual cost of
repair and maintenance is typically ranges from 3%-8% of new vehicle purchase price de-
pending on vehicle size and operation speed. The results of this cost estimation are shown in
Table 5-17.
Table 5-17: Repair and maintenance cost estimation
Unit Container truck (15 ton) Vessel (500 ton)
Vehicle cost USD 54,000 23,000-170,000
Percentage of repair cost to vehi-
cle cost (1) % 8 3-8
Annual operation km 120,000 150,000
Average speed km/h 30 9
Repair and maintenance cost US$/1000km 34 5100
Repair and maintenance cost US$/ton 0.67 0.24
(1) Estimated based on JICA (2012)
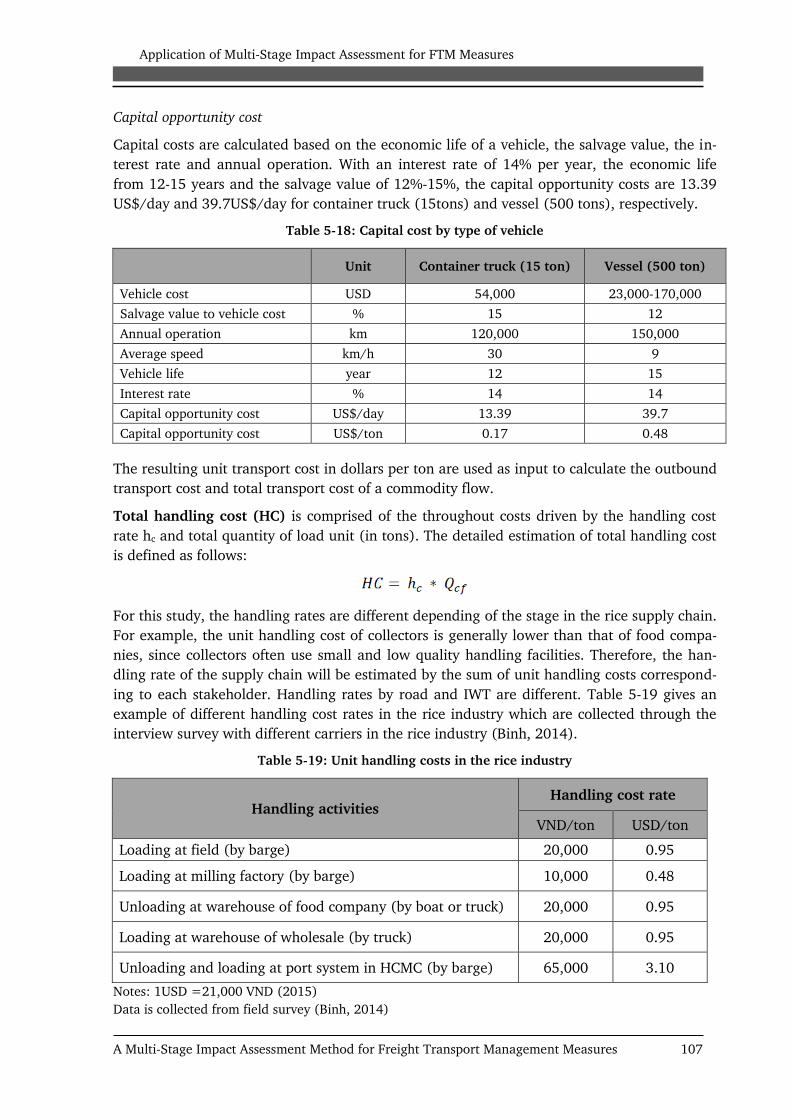
Application of Multi-Stage Impact Assessment for FTM Measures
A Multi-Stage Impact Assessment Method for Freight Transport Management Measures 107
Capital opportunity cost
Capital costs are calculated based on the economic life of a vehicle, the salvage value, the in-
terest rate and annual operation. With an interest rate of 14% per year, the economic life
from 12-15 years and the salvage value of 12%-15%, the capital opportunity costs are 13.39
US$/day and 39.7US$/day for container truck (15tons) and vessel (500 tons), respectively.
Table 5-18: Capital cost by type of vehicle
Unit Container truck (15 ton) Vessel (500 ton)
Vehicle cost USD 54,000 23,000-170,000
Salvage value to vehicle cost % 15 12
Annual operation km 120,000 150,000
Average speed km/h 30 9
Vehicle life year 12 15
Interest rate % 14 14
Capital opportunity cost US$/day 13.39 39.7
Capital opportunity cost US$/ton 0.17 0.48
The resulting unit transport cost in dollars per ton are used as input to calculate the outbound
transport cost and total transport cost of a commodity flow.
Total handling cost (HC) is comprised of the throughout costs driven by the handling cost
rate hc and total quantity of load unit (in tons). The detailed estimation of total handling cost
is defined as follows:
For this study, the handling rates are different depending of the stage in the rice supply chain.
For example, the unit handling cost of collectors is generally lower than that of food compa-
nies, since collectors often use small and low quality handling facilities. Therefore, the han-
dling rate of the supply chain will be estimated by the sum of unit handling costs correspond-
ing to each stakeholder. Handling rates by road and IWT are different. Table 5-19 gives an
example of different handling cost rates in the rice industry which are collected through the
interview survey with different carriers in the rice industry (Binh, 2014).
Table 5-19: Unit handling costs in the rice industry
Handling activities Handling cost rate
VND/ton USD/ton
Loading at field (by barge) 20,000 0.95
Loading at milling factory (by barge) 10,000 0.48
Unloading at warehouse of food company (by boat or truck) 20,000 0.95
Loading at warehouse of wholesale (by truck) 20,000 0.95
Unloading and loading at port system in HCMC (by barge) 65,000 3.10
Notes: 1USD =21,000 VND (2015)
Data is collected from field survey (Binh, 2014)

Application of Multi-Stage Impact Assessment for FTM Measures
A Multi-Stage Impact Assessment Method for Freight Transport Management Measures 108
The higher number of stops will be reflected in the higher handling cost. For this study, the
impacts of FTM measures would reduce some immediate stages in the rice supply chain,
which can translate into the reduction in handling cost and total logistics cost.
The warehousing cost (WS) is proportional to warehousing cost per storing position (wcpp)
and is driven by the total commodity volume in stock, while capital costs are driven by the
weighted average cost of capital (wacc), the value of a commodity (vpc) and total volume in
stock (Qcfstock). The detailed estimation of total warehousing cost is as follows:
For the rice industry, a food company warehouses can be used to bundle rice flows from dif-
ferent collectors. Cross docking is assumed at collector level, meaning that no storage cost on
collector level has to be considered. The data on warehousing cost per storing position is col-
lected from empirical surveys covering a large number of food companies and milling compa-
nies in the rice industry, and the effectiveness of one or more level of warehouse structure is
discussed based on the optimization of TLC. The warehousing cost per storing position at food
companies and millers/polishers are different depending on warehouse technology. Under
miler/polisher’s management, there are often warehouses responsible for basic functions such
as assembling, drying that do need less investment in warehouse technology.
The total packaging cost of a commodity is calculated by multiplying the demand expressed
as number of tons (Qcf) with the packaging cost rate PC. This cost has a slightly difference be-
tween scenarios as confirmed by the expert survey in Section 4.2. Therefore, the effects of
packaging cost are not so high to the change of TLC.
To sum up, the TLC modelled in this study consists of transport cost, warehousing cost, han-
dling cost and packaging cost. The estimation of these cost components are used as input of
the TLC model. The changes in TLC are assumed a main factor that determines the modal
choice of shippers. The reflected indicator of the TLC model is therefore oriented to TLC per
ton-km via different transport modes ( )
As for the estimation of TLC per ton-km of individual commodity flow, rather than using av-
erage distance and volume, different distances, different volumes and different mode choices
from key rice sources in the Mekong Delta to the establishment in HCMC are taken into con-
sideration. GIS can delineate the distance of each origin destination pair. The quantity of one
commodity flow is based on the analysis of generation of key rice sources and establishments
as mentioned at the beginning of this section. Table 5-10 gives an example of TLC model de-
velopment and the estimation of TLC per ton-km via road and IWT in the rice industry.

Application of Multi-Stage Impact Assessment for FTM Measures
A Multi-Stage Impact Assessment Method for Freight Transport Management Measures 109
Table 5-20: Example of the TLC model development and the estimation of TLC per ton-km for different transport modes
Fuel cost
(USD/ton)
Driver
cost and
overhead
cost
(USD/ton)
Depreciation
cost
(USD/ton)
Repair and
maintenance
(USD/ton)
Capital
cost
(USD/ton)
Unit
outbound
transport
(USD/ton)
CS1 10% 12,000 101 7.62 91,429 6.46 2.20 0.98 0.67 0.17 10.48 125,794 2.38 28,560 2.86 34,286 4.76 57,143 337,211 0.278
12,000 80 6.19 74,286 1.60 1.90 0.48 0.24 0.48 4.69 56,286 1.81 21,720 3.33 39,960 4.76 57,143 249,394 0.260
CS2 20% 24,000 120 7.62 182,857 6.46 2.20 0.98 0.67 0.17 10.48 251,589 2.38 57,120 2.86 68,571 4.76 114,286 674,423 0.234
24,000 80 6.19 148,571 1.60 1.90 0.48 0.24 0.48 4.69 112,571 2.38 57,120 3.33 79,920 4.76 114,286 512,469 0.267
CS3 20% 24,000 103 7.62 182,857 6.46 2.20 0.98 0.67 0.17 10.48 251,589 1.81 43,440 3.33 80,000 4.76 114,286 672,171 0.272
24,000 80 6.19 148,571 1.60 1.90 0.48 0.24 0.48 4.69 112,571 2.81 67,440 2.38 57,143 4.76 114,286 500,011 0.260
CS4 40% 48,000 130 7.62 365,714 6.46 2.20 0.98 0.67 0.17 10.48 503,177 2.38 114,240 3.33 159,840 4.76 228,571 1,371,543 0.220
48,000 80 6.19 297,143 1.60 1.90 0.48 0.24 0.48 4.69 225,143 2.38 114,240 3.10 148,571 4.76 228,571 1,013,669 0.264
CS5 10% 12,000 108 7.62 91,429 6.46 2.20 0.98 0.67 0.17 10.48 125,794 2.38 28,560 3.33 39,960 4.76 57,143 342,886 0.265
12,000 80 6.19 74,286 1.60 1.90 0.48 0.24 0.48 4.69 56,286 1.81 21,720 2.86 34,286 4.76 57,143 243,720 0.254
CS1 10% 15,000 86 7.62 114,286 6.46 2.20 0.98 0.67 0.17 10.48 157,243 1.81 27,150 2.86 42,857 4.76 71,429 412,964 0.320 barge
15,000 67 6.19 92,857 1.60 1.90 0.48 0.24 0.48 4.69 70,357 2.38 35,700 3.33 49,950 4.76 71,429 320,293 0.319
CS2 30% 42,000 91 7.62 320,000 6.46 2.20 0.98 0.67 0.17 10.48 440,280 1.81 76,020 2.86 120,000 4.76 200,000 1,156,300 0.303 barge
42,000 80 6.19 260,000 1.60 1.90 0.48 0.24 0.48 4.69 197,000 1.81 76,020 3.33 139,860 4.76 200,000 872,880 0.260
CS3 30% 28,000 101 7.62 213,333 6.46 2.20 0.98 0.67 0.17 10.48 293,520 2.38 66,640 2.38 66,667 4.76 133,333 773,493 0.274 barge
28,000 80 6.19 173,333 1.60 1.90 0.48 0.24 0.48 4.69 131,333 2.86 80,080 2.38 66,667 4.76 133,333 584,747 0.261
CS4 20% 333,200 111 7.62 2,538,667 6.46 2.20 0.98 0.67 0.17 10.48 3,492,888 1.81 603,092 3.33 1,109,556 4.76 1,586,667 9,330,869 0.252 road
333,200 80 6.19 2,062,667 1.60 1.90 0.48 0.24 0.48 4.69 1,562,867 2.38 793,016 3.10 1,031,333 4.76 1,586,667 7,036,549 0.264
CS5 10% 14,000 86 7.62 106,667 6.46 2.20 0.98 0.67 0.17 10.48 146,760 1.81 25,340 3.33 46,620 4.76 66,667 392,053 0.326 barge
14,000 80 6.19 86,667 1.60 1.90 0.48 0.24 0.48 4.69 65,667 2.38 33,320 2.86 40,000 4.76 66,667 292,320 0.261
barge
2
Food Processing
Enterprise (FPE)
No1
150,000
Mode
choice
(Base
scenario)
barge
road
barge
road
Package
cost rate
(USD/ton)
Total PC
cost (USD)
Total
logistics cost
(USD)
TLC
per ton-
km
(USD/ton-
km)
1
Tan Thanh Food
Processing
Enterprise
120,000
Unit outbound transport cost (USD/ton)
Total
ounbound
TC cost
(USD)
WC rate
(USD/ton)
Total WC
(USD)
HC rate
(USD/ton)
Total HC
cost (USD)
Share in
total
volume
(%)
Volume
(ton)
Distance to
HCMC (km)
-By road
- By IWT
Inbound
transport
cost rate
(USD/ton)
Total
inbound TC
(USD)
No
Key rice sources
in the Mekong
Delta
Average rice
handling
volume per
year (ton)
Customers
(CS)
Explanation:
CS: Customer TC: Transport cost WC: Warehousing cost HC: Handling cost TLC: Total logistics cost

Application of Multi-Stage Impact Assessment for FTM Measures
A Multi-Stage Impact Assessment Method for Freight Transport Management Measures 110 110
5.3.5 Model calibration and validation
The model calibration and validation are carried out based on the available data. More im-
portantly, the results of TLC model calibration will be used to analyse the impacts of FTM
measures resulting in shifts between road and IWT in the rice industry. In the first step, it is
necessary to make clear which parameters are assumed as fix and which are utilised for cali-
bration. Table 5-21 lists all important inputs data derived from the field survey in section 4.2
and JICA (2012), and Blancas and M. Baher (2014), which is not changeable for calibration.
Table 5-21: Overview of model input data
Input data Value
For trucking haulage
Big truck (ton) 15
Economic life time (year) 12
Price (US$) 54,000
Main fuel Diesel
Annual operation (km) 120,000
Average speed (km/h) 40
Crew size (people) 1-2
Interest rate (%/year) 14%
For IWT vessels
Average size (ton) 500
Economic life time (year) 15
Price (US$) 23,000-170,000
Main fuel Diesel
Design speed (km/h) 10
Operation speed (km/h) 9
Crew size (people) 5
Parameters in TLC model are mostly needed to determine four components of logistics cost:
inbound transport cost, outbound transport cost, warehousing cost, handling cost, and pack-
aging cost. An overview of fix parameters is given in Table 5-22.
Table 5-22: Overview of fixed parameters in the model
Model parameters USD/ton
Inbound transport cost rate
From farmer to collector (by barge) 2.86
Collectors to food company (by barge) 4.76
Millers to food company (by truck) 6.67
Packaging cost rate
Packing cost per ton for both domestic and export purposes 4.76
Handling cost rate
Loading at field 0.95
Unloading and loading at port system in HCMC 3.1
Source: Loc (2010) and field surveys to the Mekong Delta by author in February 2014
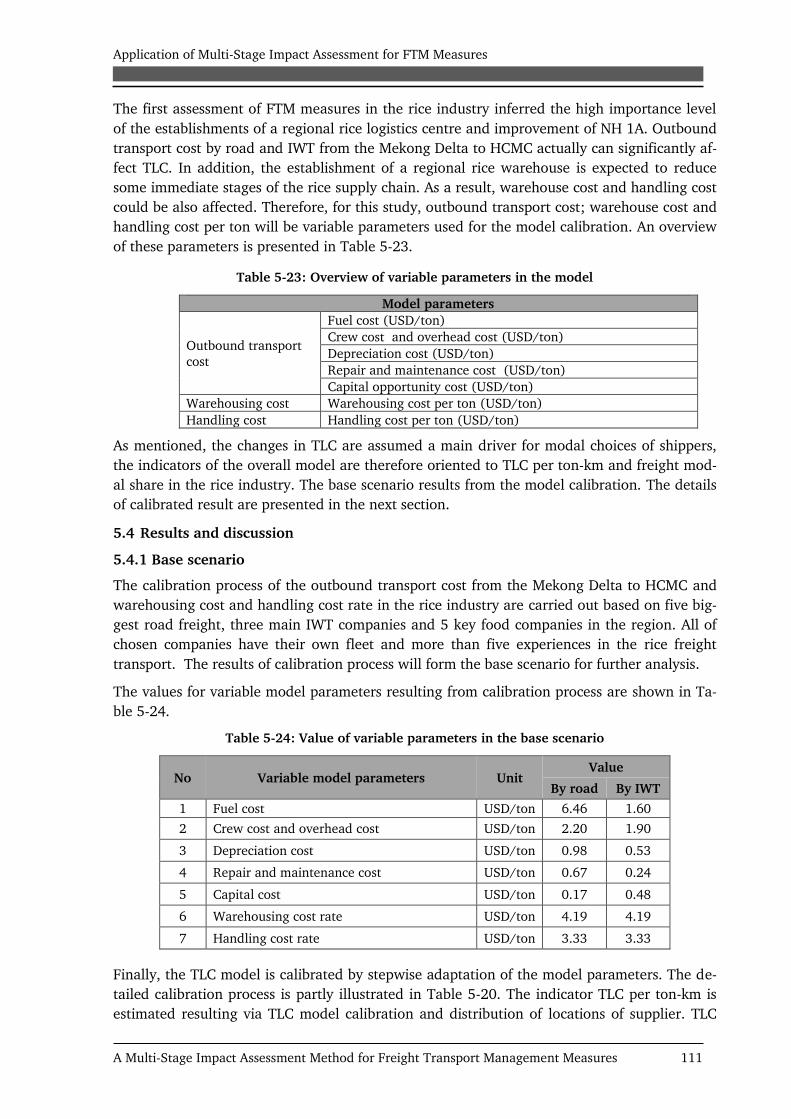
Application of Multi-Stage Impact Assessment for FTM Measures
A Multi-Stage Impact Assessment Method for Freight Transport Management Measures 111 111
The first assessment of FTM measures in the rice industry inferred the high importance level
of the establishments of a regional rice logistics centre and improvement of NH 1A. Outbound
transport cost by road and IWT from the Mekong Delta to HCMC actually can significantly af-
fect TLC. In addition, the establishment of a regional rice warehouse is expected to reduce
some immediate stages of the rice supply chain. As a result, warehouse cost and handling cost
could be also affected. Therefore, for this study, outbound transport cost; warehouse cost and
handling cost per ton will be variable parameters used for the model calibration. An overview
of these parameters is presented in Table 5-23.
Table 5-23: Overview of variable parameters in the model
Model parameters
Outbound transport
cost
Fuel cost (USD/ton)
Crew cost and overhead cost (USD/ton)
Depreciation cost (USD/ton)
Repair and maintenance cost (USD/ton)
Capital opportunity cost (USD/ton)
Warehousing cost Warehousing cost per ton (USD/ton)
Handling cost Handling cost per ton (USD/ton)
As mentioned, the changes in TLC are assumed a main driver for modal choices of shippers,
the indicators of the overall model are therefore oriented to TLC per ton-km and freight mod-
al share in the rice industry. The base scenario results from the model calibration. The details
of calibrated result are presented in the next section.
5.4 Results and discussion
5.4.1 Base scenario
The calibration process of the outbound transport cost from the Mekong Delta to HCMC and
warehousing cost and handling cost rate in the rice industry are carried out based on five big-
gest road freight, three main IWT companies and 5 key food companies in the region. All of
chosen companies have their own fleet and more than five experiences in the rice freight
transport. The results of calibration process will form the base scenario for further analysis.
The values for variable model parameters resulting from calibration process are shown in Ta-
ble 5-24.
Table 5-24: Value of variable parameters in the base scenario
No Variable model parameters Unit Value
By road By IWT
1 Fuel cost USD/ton 6.46 1.60
2 Crew cost and overhead cost USD/ton 2.20 1.90
3 Depreciation cost USD/ton 0.98 0.53
4 Repair and maintenance cost USD/ton 0.67 0.24
5 Capital cost USD/ton 0.17 0.48
6 Warehousing cost rate USD/ton 4.19 4.19
7 Handling cost rate USD/ton 3.33 3.33
Finally, the TLC model is calibrated by stepwise adaptation of the model parameters. The de-
tailed calibration process is partly illustrated in Table 5-20. The indicator TLC per ton-km is
estimated resulting via TLC model calibration and distribution of locations of supplier. TLC

Application of Multi-Stage Impact Assessment for FTM Measures
A Multi-Stage Impact Assessment Method for Freight Transport Management Measures 112 112
per ton-km by mode is then used to calibrate the mode choice model for the rice industry with
the assumption that rational decision-making by supply chain managers often includes TLC
maximization. More specifically, the TLC model quantifies shifts between modes as a result of
changes in the determining factors that drive modal choice. Mode choice calibration is imple-
mented for each key rice source in the Mekong Delta, which finally results in an estimate for
the overall modal share in the rice industry.
5.4.2 Sensitivity analysis
Sensitivity analysis serves to demonstrate model behaviour to changes of parameters. For the
parameters, changes from -50% to +50% to values in the base scenario are
assumed. For each parameter change, other parameters are assumed stable. The results of
sensitive analysis is presented in details in Table 5-25.
It shows the changes of indicator of modal share in the rice industry by the changes of varia-
ble model parameters. In general, this indicator is affected in all cases but at different rates.
Table 5-25: Sensitivity analysis of variable model parameters
-50% -40% -30% -20% -10% +10% +20% +30% +40% +50%
Road modal share 9.64% 8.24% 6.24% 4.24% 1.14% -0.56% -1.76% -1.76% -1.96% -1.96%
IWT modal share 1.16% 0.86% 0.56% 0.56% 0.56% -0.54% -0.54% -0.84% -0.84% -2.84%
Road modal share 3.14% 2.24% 0.84% 0.54% 0.54% 0.04% -0.56% -0.56% -0.86% -1.16%
IWT modal share 1.76% 0.56% 0.56% 0.56% -0.04% -0.54% -0.54% -1.14% -2.54% -3.44%
Road modal share 0.54% 0.54% 0.54% 0.54% 0.04% 0.04% 0.04% 0.04% -0.56% -0.56%
IWT modal share 1.76% 1.76% 0.86% 0.56% 0.26% -0.54% -0.54% -0.54% -0.54% -0.54%
Road modal share 0.54% 0.54% 0.54% 0.04% 0.04% 0.04% 0.04% 0.04% 0.04% -0.26%
IWT modal share 0.56% 0.56% 0.56% 0.56% 0.56% -0.04% -0.04% -0.04% -0.04% -0.04%
Road modal share 0.54% 0.54% 0.54% 0.04% 0.04% 0.04% 0.04% 0.04% 0.04% -0.26%
IWT modal share 0.26% 0.26% 0.56% 0.56% 0.56% -0.04% -0.04% -0.04% -0.54% -0.54%
Road modal share -0.57% -0.57% -0.10% -0.06% -0.01% -0.02% 0.01% 0.03% 0.56% 0.56%
IWT modal share 0.57% 0.57% 0.10% 0.06% 0.01% 0.02% -0.01% -0.03% -0.57% -0.57%
Road modal share -0.57% -0.57% -0.57% -0.05% -0.01% -0.01% -0.01% 0.57% 0.58% 0.56%
IWT modal share 0.57% 0.57% 0.57% 0.05% 0.01% 0.01% 0.01% -0.57% -0.58% -0.56%
Model parameters IndicatorChange of indicators for a change of model parameters by
Warehousing
cost
Warehouse cost per
ton
Handling cost Handling cost per ton
Capital cost
Outbound
transport cost
Fuel cost
Crew cost and
overhead cost
Depreciation cost
Repair and
maintenance cost
Explanation: Grey columns indicates that these changes can be feasible
Fuel cost parameter is the most sensitive factor caused to the changes of the model indicators.
If it fuel cost is lowered, road modal share increase and vice versa. The reason for this is that
fuel cost makes up the largest proportion in total outbound transport cost. A big change of
fuel cost can translate to a significant change of total truck costs and affect strongly to the
choice of transport mode. Fuel cost has a smaller effect for the case of IWT transport. The rea-
son is fuel cost makes up smaller proportion than that of road transport cost. In addition, the
Mekong Delta processes many advantages of waterways in transporting bulk cargo at lower
costs. This region is generously endowed with navigable rivers, lakes and canals. The compar-
ative advantage for road transport may only extend in the future of the Mekong Delta as a
high-grade road network continues to expand and modernize. However, it should be noted
that the change of fuel cost may be plausible from -30% to 30% to values in the base scenario.
That is because; the government has so far controlled the price of fuel in Vietnam.
Crew cost and overhead cost also directly affect the model indicator. An increase of crew cost
and overhead cost leads to a higher of outbound transport cost and TLC, and resulting a lower

Application of Multi-Stage Impact Assessment for FTM Measures
A Multi-Stage Impact Assessment Method for Freight Transport Management Measures 113 113
percentage of correspondence transport modes. Since the companies mostly regulate driver’s
wages, the variation in the rate of crew cost and overhead cost can be more flexible.
The model also reacts to the changes of depreciation, repair and maintenance and capital
costs. However, the road modal shares do only change very little. Since in the base scenario
the proportion of these costs in unit outbound transport cost is already low, an increase does
not cause large changes in the indicator of TLC per ton-km, which drives the choice of
transport mode the rice industry. An improvement of transport infrastructure would result in
higher vehicle speed and lower round-trip times, leading to lower depreciation, repair and
maintenance and total transport cost. At present, the average vehicle speed is about 40km/h
and the expected speed under the policy intervention in this study is 70km/h. Thus, the model
parameters on depreciation repair and maintenance cost could only be changed to a certain
degree compared to the base scenario.
For the change of warehouse and handling cost to the base scenario, rice commodity flows
would get two effects of overlap: warehouse and handling cost reduction due to the decrease
of immediate stages of the rice supply chain, and the increase of warehouse and handling cost
rate because of using modern technology and facility in the regional warehouse. Finally, a
small effect in the change of modal shares in the rice industry can be seen for the changes of
warehouse cost and handling cost rate. It has to be noted that, these changes should be plau-
sible to get more attractive for shippers and LSPs to the new central warehouse.
5.4.3 Scenario 1 impacts
Within the first scenario, a rice logistics centre is established in Chau Thanh district of Hau
Giang province. Under this scenario, the role of middlemen (e.g. collectors or millers) can be
significantly reduced since farmers can go directly (by IWT or road) to the rice logistics centre
to sell paddy or rice. The functions of milling and polishing are integrated in the rice logistics
centre, which also can reduce some intermediate stages in the rice supply chain. A reduction
in the number of stops would help to reduce significantly total warehouse and handling cost
of the rice supply chain. On the other hand, the service quality of new central warehouse is
expected to improve; the handling cost and warehouse cost rate is then believed to be slightly
increased.
Since proposed centre will be convenient for IWT accessibility, and an extensive network of
rivers, lakes and canals has long supported IWT throughout the Mekong Delta region, it is an-
ticipated that TLC would significantly decrease, with a focus on reduction in inbound
transport cost. Outbound transport cost is assumed unchangeable since the transport distance
from the logistics centre to HCMC does not change between scenarios.
It is assumed that all parameters are affected in the same way. The difference in value be-
tween the parameter values of the base scenario results mainly from less stops in inbound lo-
gistics resulting in the reduction of inbound transport cost, warehousing and handling cost
which is directly affected by the establishment of the regional rice logistics centre. The model
results for Scenario 1 are shown in Figure 5-15, Figure 5-16 and Figure 5-17.
Inbound transport cost reduces significantly, about 37.5% and 46.1% for road and IWT
transport respectively. The impact of lower stops in the rice supply chain, as suggested by the
intervention of Scenario 1, in the end offsets the negative impact of higher warehouse cost
and handling cost rate per ton. The final rates of warehousing and handling cost are expected
to reduce about 32.4% and 37.5%, respectively. There is a slight increase in IWT resulting
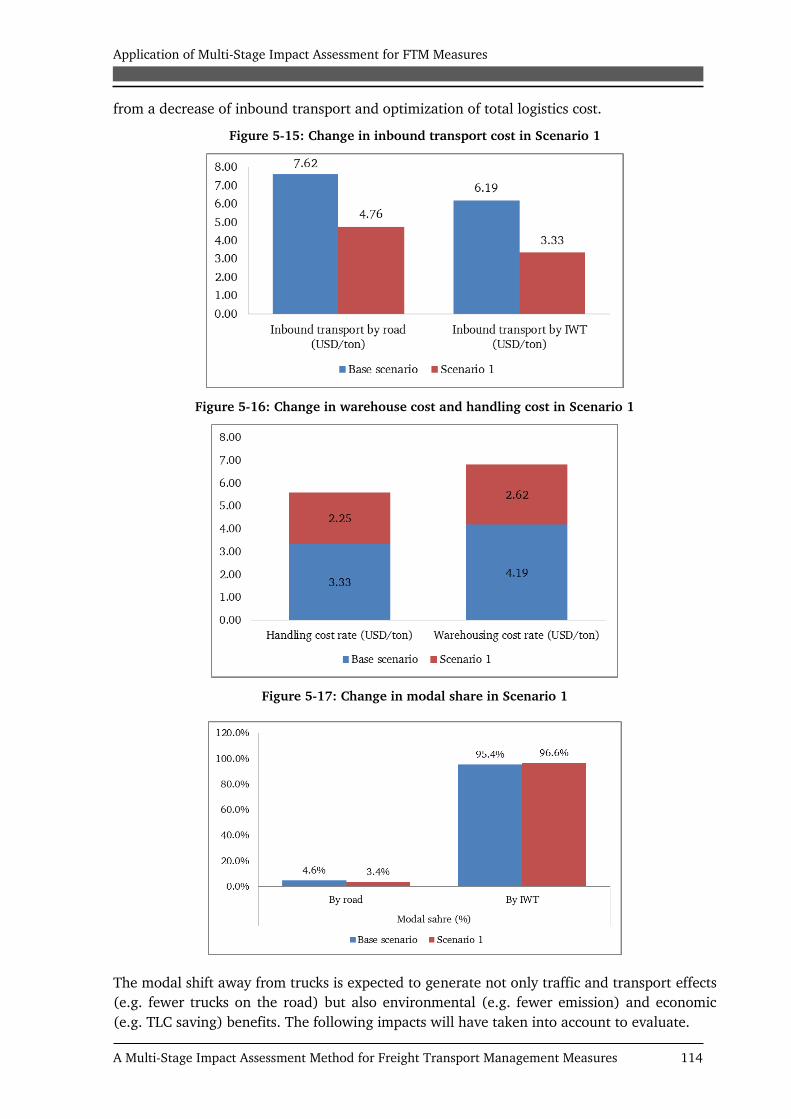
Application of Multi-Stage Impact Assessment for FTM Measures
A Multi-Stage Impact Assessment Method for Freight Transport Management Measures 114 114
from a decrease of inbound transport and optimization of total logistics cost.
Figure 5-15: Change in inbound transport cost in Scenario 1
Figure 5-16: Change in warehouse cost and handling cost in Scenario 1
Figure 5-17: Change in modal share in Scenario 1
The modal shift away from trucks is expected to generate not only traffic and transport effects
(e.g. fewer trucks on the road) but also environmental (e.g. fewer emission) and economic
(e.g. TLC saving) benefits. The following impacts will have taken into account to evaluate.

Application of Multi-Stage Impact Assessment for FTM Measures
A Multi-Stage Impact Assessment Method for Freight Transport Management Measures 115 115
• Modal share of IWT and road in the base scenario and the with-intervention scenario
• Change in the number of ton-km per year: this refers to the change in total number of
ton-km transported in the rice industry as a result of scenario introduction.
• Change in TLC per year: this refers to the change of TLC in the rice industry as a result of
scenario introduction. Specifically, the change of TLC will be analysed through the change
of its cost components.
• Change in shipping inventory cost for road transport: this implies that at the beginning
of the shipment, the cargo being transported had a cash amount worth. Such an amount
would have gained some interest by the time the cargo reaches its destination are called
shipping inventory cost. Thus, an increase in shipping speed (for example due to the im-
provement of NH) would result in the reduction in shipping time, which finally translates
to lower shipping inventory cost. The shipping inventory cost will be estimated based on
hourly discount rate, total shipping time, cargo volume and average value of cargo.
• Economic cost of safety: In this study, both safety value for people and cargo are consid-
ered. As for safety of people, this value is believed to gain from modal shift from roads to
IWT which can generate fewer accidents and fatalities per ton-kilometre (ton-km). The
safety value of goods will be measured through the changes in cost of damaged rice ship-
ment in transport. It is assumed that damaged rate of rice shipment is directly proportional
to total number of ton-km transported within different scenarios.
• Total emission reduction per year: this realizes through scenario implementation. It in-
cludes the reduction of carbon dioxide (CO2) as well as local air pollutant (nitrogen oxide -
NO and sulphur oxide - SO). Local pollutant emission volumes are estimated about 0.1–2.0
percent of CO2 emission volumes (Blancas and M. Baher, 2014). Based on total emission
reduction, the study will estimate environmental cost savings in different scenarios.
In order to estimate the economic value of these impacts, coefficients related to safety valua-
tion and emissions in Vietnam are employed. These coefficients are widely applied in the re-
search of transport impact assessment introduced by the World Bank and JICA (see Blancas
and M. Baher,2014; and VITRANSS-2, 2009). Coefficients are presented in Table 5-26 as be-
low:
Table 5-26: Selection of coefficients applied for safety and environmental impact assessment in
Vietnam
Coefficients Value
Valuation of transportation safety (US$/veh.km) 0.005
CO2 emission factor for truck (g/ton-km) 110
CO2 emission factor for barge (g/ton-km) 71
Economic price of CO2 emission (USD/ton) 35
Economic price of NO emission (USD/ton) 900
Economic price of SO emission (USD/ton) 1800
Source: Blancas and M. Baher, 2014; and VITRANSS-2, 2009
Finally, traffic, safety and environmental impacts resulting from Scenario 1 are presented in
detail in Table 5-27.

Application of Multi-Stage Impact Assessment for FTM Measures
A Multi-Stage Impact Assessment Method for Freight Transport Management Measures 116 116
Table 5-27: Estimation of the impacts of Scenario 1
Aspects of impact Unit Base scenario
Scenario 1
(Base scenario +
M1-VN*)
Rice freight transport
Number of ton-km by road million ton-km 126.84 98.44
Number of ton-km by IWT million ton-km 3,012.94 2,811.34
Economic efficiency
Total logistics cost per year million US$ 153.08 129.49
- Transport cost million US$ 100.61 90.59
- Warehousing cost million US$ 33.46 20.91
- Handling cost million US$ 19.01 17.99
Shipping inventory cost for road transport million US$ 0.31 0.19
Safety
Cost of damaged rice shipments in transport million US$ 17.57 16.28
Accident cost caused by rice freight transport million US$ 6.34 4.92
Environment
Total emission cost per year (CO2, SOx,NOx) million US$ 12.39 8.32
Total cost of different scenarios million US$ 189.69 159.21
Change compared to Base scenario % -16.1%
(*) M1-VN: An establishment of a regional rice logistics centre
Within Scenario 1, rice industry supply paths are towards more IWT usage. This would lead to
a decrease in total number of ton-km for road. In addition, this intervention would result in
savings more than US$23.6 million in TLC and nearly US$2.71 million in economic cost of
safety for people and rice cargo as well as about US$4.07 million of emission reduction cost in
the rice industry. Finally, the implementation of Scenario 1 would lead to total cost savings,
about 16.1% compared to Base scenario.
5.4.4 Scenario 2 impacts
Scenario 2 is defined by the implementation of the project on upgrading NH 1A from the Me-
kong Delta to HCMC. This highway has been congested many years. Adding more traffic on
this highway would further increase road congestion. The improvement of NH 1A is expected
to reduce traffic pressure, and save freight transport time from the Mekong Delta to HCMC.
The intervention of Scenario 2 can have two directional impacts in term of environment. Eco-
nomic benefits of the improvement of NH 1A are concerned with saving fuel cost resulting in
lower road transport cost and TLC savings. Besides, the reduction in CO2 and local pollutant
emission could also gain due to higher speed and the decrease in fuel consumption. The im-
provement of NH 1A would be expected to increase traffic rather than the base scenario. The
reason for this is that highway measure would cause a decrease in road transport cost, thereby
increasing the competitiveness of the road system. The following texts will analyse these im-
pacts in details.

Application of Multi-Stage Impact Assessment for FTM Measures
A Multi-Stage Impact Assessment Method for Freight Transport Management Measures 117 117
Under the intervention of Scenario 2, the average speed of vehicle is projected to increase
from 40km/h to 70km/h (JICA, 2010). This increase in speed would translate to a decrease in
fuel cost, which will ultimately result in a reduction in transport cost. Based on data on tech-
nical fuel consumption rates for each type of vehicle given in the JICA (2012) study, the dif-
ference in fuel consumption rates by speed is shown in Figure 5-18.
Figure 5-18: Fuel consumption rate and cost by speed of vehicle
Source: JICA (2012)
It is clear that higher speed will result in more fuel efficiency and lower fuel cost. Assuming
that all parameters are affected in the same way, the difference in value between the fuel cost
of the base scenario and Scenario 2 will be directly affected by the improvement of NH1A. In
particular, fuel consumption and fuel cost savings would obtain via fuel efficiency gains,
which finally lead to emission reduction. The detailed results are presented in Table 5-28.
The intervention of Scenario 2 would lead to a modal shift from IWT to road transport since
NH 1A helps to facilitate inter-regional trade by reducing freight transport costs and transport
time from the Mekong Delta to HCMC. However, the expected traffic diversion from IWT to
truck in the rice industry is modest. The reason for this is that shipments of rice commodities
in the Mekong Delta can become much more economical for IWT rather than road transport
especially for long distance to HCMC. Nonetheless, a small increase in road usage could result
in some negative implications the environment. The details of modal shift impacts and change
in emission volumes are shown in Table 5-28.
Table 5-28: The change of emission in Scenario 2
Unit
Fuel consumption savings resulting
in the change of emission
Modal shift impacts resulting in the
change of emission
CO2
volume SOx volume NOx volume
CO2
volume SOx volume NOx volume
Base scenario ton 209,797 4,196 2,518 133,276 2,666 1,599
Scenario 2 ton 172,357 3,447 2,068 166,581 3,332 1,999
Comparing the results of emission volumes reveals that the positive impacts of fuel consump-
tion savings appears to be larger than the increased road volume in emission as a result of
modal shift impacts. The implementation of Scenario 2 is also expected to reduce total ware-

Application of Multi-Stage Impact Assessment for FTM Measures
A Multi-Stage Impact Assessment Method for Freight Transport Management Measures 118 118
housing and handling cost for the rice industry. The primary reason for this is that the im-
provement of NH 1A from the Mekong Delta to HCMC offers many opportunities to increase
inventory turnover ratio, which can be understood as the number of times company’s invento-
ry sold or used over a time period such as a year. For this aspect, food companies are assumed
to be affected strongly under this policy intervention. That is because, for rice logistics and
business in the Mekong Delta, most of food companies under VINAFOOD 2 have a system of
warehouse, which is serving for a large demand of rice assembling and processing in the re-
gion. It was assumed that the warehousing and handling cost rate in the food companies
would be decreased about 10% compared to Base scenario. This rate is in line with warehouse
and handling cost of food companies in HCMC, where there are many freight transport activi-
ties taking place.
Regarding safety impacts, it is believes that expected traffic safety improvement under the in-
tervention of Scenario 2 could be quite modest since road traffic is seen as more dangerous
than IWT traffic. However, the impact on transport safety for this case would be relatively
small because of limited shift between road and IWT.
Table 5-29 provides final implications for traffic, safety, economic efficiency and environmen-
tal issues resulting from Scenario 2.
Table 5-29: Estimation of the impacts of Scenario 2
Aspects of impact Unit Base scenario
Scenario 2
(Base scenario
+ M15-VN*)
Rice freight transport
Number of ton-km by road million ton-km 126.84 131.75
Number of ton-km by IWT million ton-km 3,012.94 2,999.96
Economic efficiency
Total logistics cost per year million US$ 153.08 129.23
- Transport cost million US$ 100.61 79.42
- Warehousing cost million US$ 33.46 31.56
- Handling cost million US$ 19.01 18.25
Shipping inventory cost for road transport million US$ 0.31 0.17
Safety
Cost of damaged rice shipments in transport million US$ 17.57 17.52
Accident cost caused by rice freight transport million US$ 6.34 6.59
Environment
Total emission cost per year (CO2, SOx,NOx) million US$ 12.39 12.24
Total cost of different scenarios million US$ 189.69 165.76
Change compared to Base scenario % -12.6%
(*)M15-VN: Improvement of NH 1A from the Mekong Delta to HCMC
The majority of benefits associated with the intervention of Scenario 2 stems from lower
transport cost, as higher speed enables lower fuel cost. Therefore, Scenario 2 can improve the
economic efficiency for the rice industry through significantly reducing TLC as a whole. Addi-

Application of Multi-Stage Impact Assessment for FTM Measures
A Multi-Stage Impact Assessment Method for Freight Transport Management Measures 119 119
tionally, CO2 volumes and local pollutant emissions are projected to be reduced under Sce-
nario 2. Only projected economic benefits of safety improvement could be limited due to un-
expected modal shift. However, the Mekong Delta is generously endowed with an extensive
networks of rivers and canals, rice products in this region are substantially captured by the
waterways already, thereby leaving limited opportunities for shifting to road. Finally, the im-
plementation of Scenario 2 is expected to result in total cost savings, about 12.6%, compared
to Base scenario.
5.4.5 Scenario 3 impacts
In the Scenario 3, the combination of the two measures - the establishment of a regional rice
logistics centre and the improvement of NH 1A - is expected to yields a synergy of benefits.
Under this scenario, improved efficiency in rice cargo flows will be facilitated through the re-
duction of immediate stages in the rice supply chain and the improvement of the road
transport system. The modal shift result for Scenario 3 is shown in Figure 5-19.
Figure 5-19: Change in modal share in Scenario 3
4.6%
95.4%
4.0%
96.0%
0.0%
20.0%
40.0%
60.0%
80.0%
100.0%
120.0%
By road By IWT
Modal sahre (%)
Base scenario Scenario 3
Within Scenario 3, the modal shift impact of establishing a rice logistics centre appears to be
larger than the impacts of improvements to NH 1A. More specifically, there is a small increase
in IWT (about 0.6%) in the rice industry. This can be partly explained by acknowledging that
the planned rice logistics centre in the Mekong Delta intends to be situated on a convenient
location for road and IWT transport. In particular, such a rice logistics centre would not only
support the existing intensive use of IWT network in the region, but also support the devel-
opment of the use of multi-modal transport. For this meaning, rice would be collected by
trucks and then consolidated deliveries from the rice logistics centre to HCMC by barge. Addi-
tionally, many activities related to rice logistics, distribution transport and other value-added
would be integrated in this centre. Table 5-30 shows a comprehensive socio-economic impacts
resulting from the implementation of Scenario 3.
It is estimated that annual savings in TLC in the rice industry can reach more than US$39 mil-
lion through an establishment of a new rice logistics centre and better highway and road de-
sign. Also, the intervention of Scenario 3 is expected to provide better environmental safety
performance compared with the base scenario. Economic costs of CO2 and air pollutant emis-
sions are projected to decrease to roughly US$4.86 million per year. Through modal shift
from road to IWT, traffic safety is also expected to improve, which can be valued via the eco-
nomic cost savings of fewer accident and cost reduction of damaged rice shipment per year.

Application of Multi-Stage Impact Assessment for FTM Measures
A Multi-Stage Impact Assessment Method for Freight Transport Management Measures 120 120
Table 5-30: Estimation of the impacts of Scenario 3
Aspects of impact Unit Base sce-
nario
Scenario 3
(Base scenario +
M1-VN and M15-VN)
Rice freight transport
Number of ton-km by road million ton-km 126.84 97.74
Number of ton-km by IWT million ton-km 3,012.94 2,635.05
Economic efficiency
Total logistics cost per year million US$ 153.08 114.05
- Transport cost million US$ 100.61 76.86
- Warehousing cost million US$ 33.46 19.96
- Handling cost million US$ 19.01 17.22
Shipping inventory cost for road transport million US$ 0.31 0.14
Safety
Cost of damaged rice shipments in transport million US$ 17.57 15.29
Accident cost caused by rice freight transport million US$ 6.34 4.89
Environment
Total emission cost per year (CO2, SOx,NOx) million US$ 12.39 7.53
Total cost of different scenarios million US$ 189.69 141.90
Change compared to Base scenario % -25.2%
To sum up, the concurrent implementation of the two measures in scenario 3 is believed to
bring highest level of effectiveness at the lowest cost for the rice industry.
5.4.6 Discussions
In the above sections, a detailed quantitative assessment has been carried out to determine
the impacts of three scenarios related to changes in the supply chain, and modal shift and
other external effects in the rice industry. Table 5-31 summaries the breakdown of economic
benefits associated with each scenario.
According to the assessment results, Scenario 1 focusing on the establishment of the rice logis-
tics centre in Hau Giang province, can affect a modal shift toward more IWT usage. There
could be a reduction in some intermediate stages of inbound transport, which could potential-
ly lead to a decrease in collecting trips from production sites to the consolidated centre. A re-
duction in the number of stops in the rice supply chain is expected to generate high level of
economic efficiency through reducing inbound transport cost, warehousing and handling cost
as well as TLC as a whole. A modal shift away from truck under the intervention of Scenario 1
could also generate impacts to the broader economy. More specifically, ton-kilometres shifts
from road to barge would lead to a reduction in CO2 emissions and the improvement of traffic
safety for both transport users and rice commodity.
Under Scenario 2, the improvement of NH 1A is expected to increase average speeds and re-
duce freight transport time from the Mekong Delta to HCMC. While some transport cost sav-
ings would be obtained via fuel efficiency, the larger impacts under the intervention of Sce-
nario 2 is expected to originate from much higher savings of shipping inventory cost com-
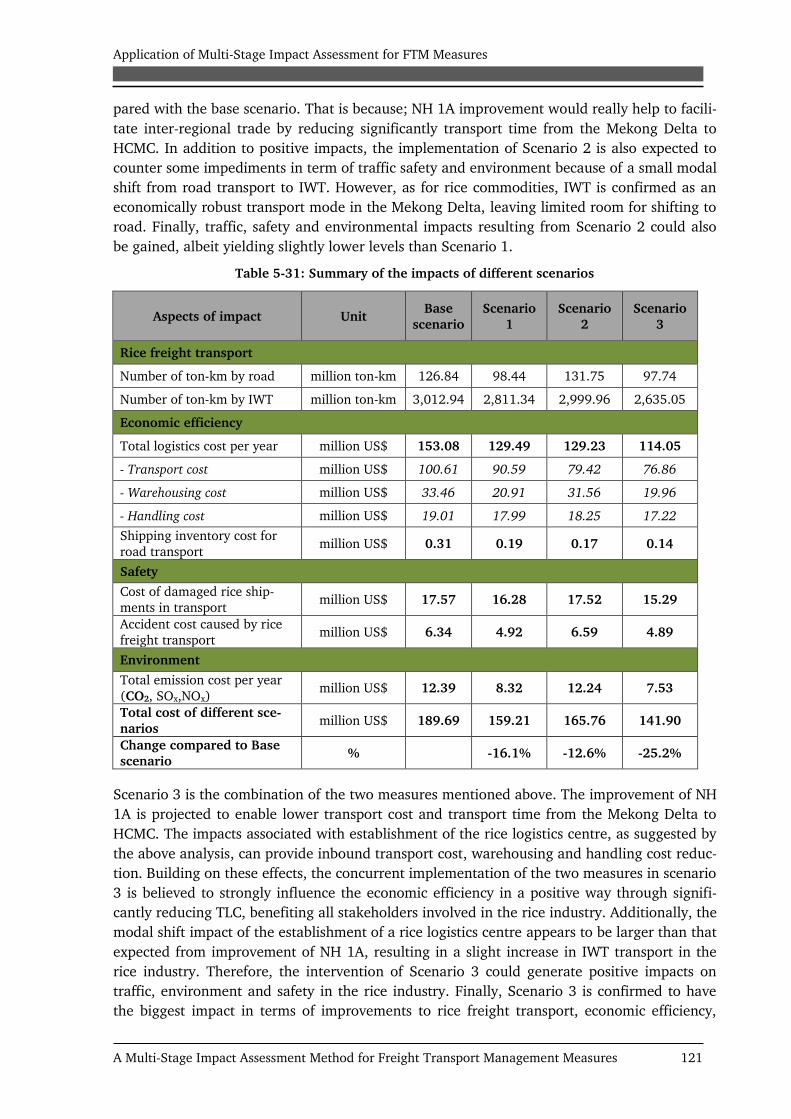
Application of Multi-Stage Impact Assessment for FTM Measures
A Multi-Stage Impact Assessment Method for Freight Transport Management Measures 121 121
pared with the base scenario. That is because; NH 1A improvement would really help to facili-
tate inter-regional trade by reducing significantly transport time from the Mekong Delta to
HCMC. In addition to positive impacts, the implementation of Scenario 2 is also expected to
counter some impediments in term of traffic safety and environment because of a small modal
shift from road transport to IWT. However, as for rice commodities, IWT is confirmed as an
economically robust transport mode in the Mekong Delta, leaving limited room for shifting to
road. Finally, traffic, safety and environmental impacts resulting from Scenario 2 could also
be gained, albeit yielding slightly lower levels than Scenario 1.
Table 5-31: Summary of the impacts of different scenarios
Aspects of impact Unit Base
scenario
Scenario
1
Scenario
2
Scenario
3
Rice freight transport
Number of ton-km by road million ton-km 126.84 98.44 131.75 97.74
Number of ton-km by IWT million ton-km 3,012.94 2,811.34 2,999.96 2,635.05
Economic efficiency
Total logistics cost per year million US$ 153.08 129.49 129.23 114.05
- Transport cost million US$ 100.61 90.59 79.42 76.86
- Warehousing cost million US$ 33.46 20.91 31.56 19.96
- Handling cost million US$ 19.01 17.99 18.25 17.22
Shipping inventory cost for
road transport million US$ 0.31 0.19 0.17 0.14
Safety
Cost of damaged rice ship-
ments in transport million US$ 17.57 16.28 17.52 15.29
Accident cost caused by rice
freight transport million US$ 6.34 4.92 6.59 4.89
Environment
Total emission cost per year
(CO2, SOx,NOx) million US$ 12.39 8.32 12.24 7.53
Total cost of different sce-
narios million US$ 189.69 159.21 165.76 141.90
Change compared to Base
scenario % -16.1% -12.6% -25.2%
Scenario 3 is the combination of the two measures mentioned above. The improvement of NH
1A is projected to enable lower transport cost and transport time from the Mekong Delta to
HCMC. The impacts associated with establishment of the rice logistics centre, as suggested by
the above analysis, can provide inbound transport cost, warehousing and handling cost reduc-
tion. Building on these effects, the concurrent implementation of the two measures in scenario
3 is believed to strongly influence the economic efficiency in a positive way through signifi-
cantly reducing TLC, benefiting all stakeholders involved in the rice industry. Additionally, the
modal shift impact of the establishment of a rice logistics centre appears to be larger than that
expected from improvement of NH 1A, resulting in a slight increase in IWT transport in the
rice industry. Therefore, the intervention of Scenario 3 could generate positive impacts on
traffic, environment and safety in the rice industry. Finally, Scenario 3 is confirmed to have
the biggest impact in terms of improvements to rice freight transport, economic efficiency,

Application of Multi-Stage Impact Assessment for FTM Measures
A Multi-Stage Impact Assessment Method for Freight Transport Management Measures 122 122
traffic safety and environment for the rice industry.
In the second assessment stage, the results of detailed quantitative impact estimation in the
rice industry has provided good evidence to support the claimed impacts of the measures,
which are realized by the experts in the first assessment stage. Specifically, the results of both
assessment stages confirmed that the important impacts of FTM measures in the rice industry
are change in modal split, reduction in total logistics cost, reduction in total ton-km, and re-
duction in transport time from the Mekong Delta to HCMC. However, if the first assessment
results have shown more road transport usage as the most significant impact of FTM measures
in the Vietnamese rice industry (Table 5-4), the quantitative impact estimation in the second
assessment stage indicates that this impact is quite modest compared to the others. The pri-
marily reason is related to economic geography factor. Particularly, transport system in the
Mekong Delta is featured by an extensive networks of rivers and channels, which is more fa-
vour for IWT. Conclusively, with the multi-stage impact assessment approach applied in the
Vietnamese rice industry, the benefits and costs of different policy interventions in the rice in-
dustry are examined in a consistent way. The results of this process would therefore help
transport decision makers to design measure package that will achieve system optimization.
5.5 Conclusions
In this chapter the proposed multi-stage impact assessment method for FTM measures is ap-
plied comprehensively to the Vietnamese rice industry. There are seven measures, including
initiatives already in place and potential future interventions. Following the proposed method,
a partly-quantitative method (MCA) was employed for a first classification of FTM measures
in the rice industry. The results of this stage revealed a high rating for two FTM measures, the
establishment of a regional rice logistics centre and improvement of NH 1A. These measures
then became the focus for a detailed quantitative impact assessment. In this stage, the TLC
model serves as the core of the impact analysis related to changes to the supply chain, and
mode choices in the rice industry. According to the quantitative assessment results, the estab-
lishment of a regional rice logistics centre can bring a high level of economic efficiency
through reducing TLC for the rice industry. In addition, this measure is meaningful for modal
shift effects. The reason is that TLC by road would be higher than by barge transport follow-
ing establishment of the rice logistics centre. Within the intervention focused on the im-
provement of NH 1A from the Mekong Delta to HCMC, there will be much fuel-efficient and
transport time savings, which could potentially lead to positive impacts on the environment
and economic efficiency in the rice industry. The combination of both measures is anticipated
to result in the biggest economic impact thanks to substantial TLC saving.
The assessment results from the example sector could be of interests to transport decision-
makers and logistics researcher as the different scenarios above demonstrate. Significantly,
this assessment model is based on a deep knowledge of the sector, which enables clear expla-
nation of anticipated impacts and their causality. However, it is noteworthy that the detailed
quantitative impact assessment aspect of the assessment process requires access to various da-
ta sources including data coming from field surveys conducted by the author and from other
researches on the freight transport in Vietnam.
Conclusions and recommendations
A Multi-Stage Impact Assessment Method for Freight Transport Management Measures 123 123
6 Conclusions and Recommendations
6.1 Contributions of the study
The impact assessment for FTM measures remains a field with a need for comprehensive
evaluation methods in order to understand the core effects of measures applied in the indus-
try. The main contribution of this study is the development of a multi-stage assessment meth-
od through which the core effects of FTM measures can be identified and impact estimated. In
order to achieve these objectives, four key research questions have been addressed the study.
The response to Research question 1 about the theoretical foundation of FTDM is a systemat-
ic review of innovations in freight transport management and their application. It includes as-
pects such as the analysis of stakeholders involved in the freight transport system and stake-
holder goal conflicts; concepts associated with FTM measures and their classification; and the
introduction of typical successes and failures of FTM measures in various contexts around the
world. The first research question contributes to the overall objectives of the study by increas-
ing understanding of how freight transport systems perform and by identifying what lessons
can be learned from how FTM measures are applied around the world and the resulting im-
plications for the example sector the study focuses on (the Vietnamese rice industry).
Research question 2 provides an in-depth review of the impact assessment methods available
for evaluating FTM measures, including their pros and cons. In discussing these different
methods, it is established that qualitative methods often permit quick classification of
measures under consideration and their impacts, but they do not give precise analysis of those
impacts. Quantitative analysis of the core effects of a measure can, however, overcome some
of the limitations inherent in the qualitative assessment process, but data availability and
overall efforts are usually critical to successful assessment outcomes. Partly-quantitative as-
sessment is somehow more useful in the initial evaluation of the importance level of different
measures, providing a short list of potential measures for further detailed analysis. However,
the main shortcoming of this approach is the limited insight provided on causality. From this
analysis of current impact assessment methods for FTM measures, a new approach has there-
fore been developed and this approach is presented in detail in Research question 3.
The objective of Research question 3 is to frame a multi-stage impact assessment method for
FTM measures. With this approach, the risk associated with limitations of individual measures
is mitigated in initial pre-selection stages and efficiency is improved, as a thorough and de-
tailed impact assessment of the core effects of measures shortlisted in the classification stage
are examined. The multi-stage impact assessment method for FTM measures, as in this study,
can be divided into two stages of assessment. The first stage covers two main working items
including listing and checking the interdependence of FTM measures and then
weighting/ranking the importance level of these measures. In the second stage, a detailed
quantitative assessment is carried out to capture and estimate the core effects of the FTM
measures. The framework also recommends different methods that could be used to fulfil
stated objectives at each stage. The findings of Research question 3 contributes to the overall
goal of this study by providing a comprehensive framework for the impact assessment of FTM
measures. In particular, the proposed method could, to a certain extent, overcome the limita-
tions of existing approaches in impact assessment as covered in the findings from Research
question 2.
Research question 4 describes the application of the proposed method to the Vietnamese rice

Conclusions and recommendations
A Multi-Stage Impact Assessment Method for Freight Transport Management Measures 124 124
industry. The major contribution of this research question is to empirically validate and gen-
eralize the research results over several contexts. Regarding the scale of application, seven
FTM measures are currently or could potentially be applied in the context of the Vietnam rice
industry. Among these, two FTM measures namely the establishment of a regional rice logis-
tics centre and the improvement of NH 1A from the Mekong Delta to HCMC are identified as
first and second priorities, respectively. Detailed quantitative assessment of these measures
has shown that the establishment of a regional rice logistics centre can bring increased eco-
nomic efficiency through markedly reducing TLC for the rice industry. Additionally, this
measure can potentially lead to a modal shift away from trucks, significantly contributing to
increasing traffic safety improvement and reduction in CO2 emissions. The improvement of
NH 1A is projected to increase average speeds. This increase in speed would translate to a de-
crease in fuel cost, which will ultimately result in a reduction in transport cost and transport
time from the Mekong Delta to HCMC. The combination of the two measures above could
cause a slight modal shift from roads to IWT and yield the highest economic efficiency out-
comes for the rice industry. Since these results are quite specific for this case study, the trans-
ferability of assessment results should not be assumed. Rather, the study findings advocate for
using the same methodology for quantitative impact assessment of FTM measures across other
sectors, adjusted for sector-specific parameters. More specifically, the TLC model, as part of a
multi-stage impact assessment process, can be applied to evaluate quantitatively the impacts
of FTM measures based on comprehensive sector analysis. Although more research may be re-
quired, the application of the TLC model in this study can be used for further research as it is
identified as one of the key models in the impact assessment of FTM measures.
To sum up, the multi-stage impact assessment method for FTM measures presented in this
study proved that it is possible to investigate and assess the impacts of FTM measures on pro-
duction and logistics. Specifically, this method can help to identify relevant interventions and
estimate the core effects of these measures. Additionally, the proposed method has been ap-
plied to a specific sector, taking the rice industry in Vietnam as an example. Quantitative es-
timation of impacts has been carried out in the second stage of assessment at both govern-
mental and company levels. This research is therefore expected to be of value for the govern-
ment and local transport authorities in providing suitable methods for assessing decisions in
freight transport management.
6.2 Discussion on the generalization of the proposed method
This section discusses generalisation of the research results, identifying the extent to which
the findings are valid in different contexts. As presented, the multi-stage impact assessment
method for FTM measures in this study is developed primarily from a comprehensive litera-
ture review and then applied in a case study of the Vietnamese rice industry. It is developed
with the aim of being generalised across multiple contexts and it should, therefore possible to
apply this assessment approach to different sectors.
In the first stage of the proposed impact assessment process, there are two working items in-
cluding an interdependency checks, and weighting and ranking of the measures selected for
assessment. There are numerous techniques that could be useful for this stage. Among them,
qualitative methods such as focus groups, brainstorming exercises and expert consultation can
be used for problem definition, listing of potential measures and interdependency check. Part-
ly-quantitative methods such as the Delphi, MCA and AHP methods can fulfil the objective of
a quick classification of adopted measures and their impacts. It is a fact that FTM measures

Conclusions and recommendations
A Multi-Stage Impact Assessment Method for Freight Transport Management Measures 125 125
seek to achieve multiple goals. These goals can be the improvement of mobility and accessibil-
ity, safety, economic efficiency or environmental improvement. Consequently, there is always
a trade-off between those goals advocated for by different stakeholders. Within this context,
the methods proposed for the first stage correspond well to the essence of FTM measures
identified in the literature review. In particular, these methods enable identification and in-
creased understanding of multiple aspects of the challenges facing the freight transport indus-
try. Also, the method identified have the ability to form a clear mechanism for classifying and
qualitatively assessing potential impacts. The approach emphasises the involvement of multi-
ple stakeholders in the assessment process, should increase the generalization potential of the
proposed assessment method.
The first assessment stage was tested within the context of the Vietnamese rice industry, and a
MCA method was chosen for screening impacts related to socio-economics, the environment,
safety, and mobility. It should also be possible to apply this assessment process to other sec-
tors with similar features (e.g. existing interactions among production, transport and logistics;
or the involvement of a lot of freight transport modes with a bundle of FTM measures applied
to the sector). However, it should be noted that while the MCA method is applied to a single
case in this study, in other contexts other methods could be usefully employed, e.g. Delphi
method which has the advantage of getting high consensus in ranking and prioritizing re-
search problems and alternatives. It is also worth considering whether the impact assessment
framework for this stage can be employed on a large scale, for instance, at city or regional
level. Detailed description of the first stage of the proposed assessment method presented in
Figure 3-10 does not imply the approach should be restricted to a single context. It is feasible
therefore, that the methodology used in the first assessment stage could be applied on differ-
ent scales.
The second stage involved a detailed quantitative assessment to determine the core effects of
the selected FTM measures. As stated in Section 3.5, the use of disaggregate models is highly
necessary in this step. Such models allow detailed understanding of sector knowledge of
structure, stakeholders involved and stakeholder decision-making behaviours, which are key
underlying factors requiring consideration in the analysis of core effects. As such, TLC, dis-
crete choice or agent-based models are most relevant for a quantitative analysis of the impacts
of specific measures. Again, the second stage of the proposed assessment framework is ap-
plied to the specific case of the Vietnamese rice industry. A TLC model is employed to assess
the impacts of FTM measures on disaggregating populations of rice commodity flows and dis-
tribution centre locations in HCMC. There are other methods for possible use when carrying
out detailed impact analysis in other contexts, e.g. discrete choice models or agent-based
model, which has the advantage of explaining and predicting choices between discrete alter-
natives or modelling of different behavioural changes of stakeholders to policy interventions.
However, the TLC model covers extensively the interaction of production, transport and logis-
tics, and could more easily apply because discrete choice model and agents models require a
lot of behavioural data. As presented in chapter 5, some of the results of the case study are
relatively specific such as the prioritisation of specific FTM measures and their impacts on the
supply path choices of rice commodity flows. However, the rice industry in Vietnam has expe-
rienced freight transport problems that have led to many issues related production and logis-
tics. The case study therefore addresses many elements of FTM that are relevant to other
manufacturing sectors (e.g. procurement, processing and physical movement of goods), and
as such it presents an opportunity to generalize the research findings to different industries

Conclusions and recommendations
A Multi-Stage Impact Assessment Method for Freight Transport Management Measures 126 126
where different FTM measures require assessment.
6.3 Limitations and recommendations for future research
Although the study has achieved its goal, there were some inevitable limitations. This section
summarises some of the main limitation of the study, and suggests areas for further research.
Firstly, the application of the proposed method focuses on the Vietnamese rice industry, which
may limit the generalization of conclusions regarding the impact assessment of FTM measures
to other sectors, as discussed in the previous section. Despite the fact that the Vietnamese rice
industry presents ideal conditions for the application of a multi-stage impact assessment
method for FTM measures, future research focused on applying the assessment approach to
other industries would be useful, for example, the seafood industry, the garments and the tex-
tiles industry, and the automobile industry. This would provide greater evidence of generali-
zability and extend current knowledge of the impact assessment method.
Secondly, in the first stage of the impact assessment, the sample size was constrained by lim-
ited financial resources and time. Although the sample size was sufficient for the demands of
the model, future research projects should increase the number of experts involved in the in-
terview survey to reduce the possibility of bias in responses as much as possible.
Thirdly, the detailed quantitative impact assessment implemented in the second stage can on-
ly be carried out with extensive data, which may hinder the application of the proposed
methods in other sectors. If future research intends to extend the application of the method, it
is suggested that prior to beginning a research project, the availability of data associated with
the target sector is reviewed or assumptions identified that could simplify the analysis re-
quired by the model.
Fourthly, this study addresses a new and complicated research area in the field of impact as-
sessment methods for FTM measures; hence the theoretical framework developed and vali-
dated in chapter 3 and chapter 5 should be more thoroughly examined in future research.
Although, this proposal for a multi-stage impact assessment method for FTM measures is car-
ried out based on extensive examination of the existing literature on impact assessment meth-
ods; and it has been implemented comprehensively in assessing FTM measures in the Viet-
namese rice industry, findings can only by fully confirmed through a series of research initia-
tives that further refine and test the results across different contexts and sectors.
Finally, impact assessment methods for FTM measures are significant research topic from both
academic and practical perspectives. However, it still seems to attract less attention than pas-
senger transport due to the complicated characteristics of freight transport. This study was
implemented with the aim of investigating and assessing the impacts of FTM measures on
production and logistics. It may contribute to enriching theoretical and empirical understand-
ing of FTM measures, and their effective implementation.
References
A Multi-Stage Impact Assessment Method for Freight Transport Management Measures 127 127
References
A
Aguezzoul, A. (2012): Overview on supplier selection of goods versus 3PL selection, Journal
of Logistics Management, Vol.1 No.3, pp.18-23
Allen, J., Anderson, S., Browne, M. and Jones, P. (2000): Current goods and service opera-
tions in urban areas, Report on a framework for considering policies to encourage sustainable
urban freight traffic and goods/service flows, University of Westminster
Allen, J. and Browne, M. (2010): Sustainability strategies for city logistics, Book on green
logistics: improving the environmental sustainability of logistics, Kogan Page, London
Allen, J., Thorne, G. and Browne, M. (2009): BESTUFS-Good practice guide on urban
freight transport, www.bestufs.net
Ambrosino, G., Sassoli, P., Bielli, M., Carotenuto, P. and Romanazzo, M. (1999): A mod-
elling framework for impact assessment of urban transport systems, Transportation Research
Part D: Transport and Environment, Vol.4 No.2, pp.73-79
Anderson, S., Allen, J. and Browne, M. (2005): Urban logistics-how can it meet policy mak-
ers’ sustainability objectives ? Journal of Transport Geography, Vol.13 No.1, pp.71-81
Arunotayanun, K. (2009): Modelling freight supplier behaviour and response, Dissertation of
London Centre for Transport Studies, Imperial College
B
Banerjee, D., Mishra, D., van Kuijk, A. and Joshi, S. (2015): Scoping report on cumulative
impact assessment of eastern dedicated freight corridor (Ludhiana - Mughalsarai Section), In-
dia: Kadam - Environmental Consultants
Beria, P., Maltese, I. and Mariotti, I. (2012): Multi-criteria versus Cost Benefit Analysis: a
comparative perspective in the assessment of sustainable mobility, European Transport Re-
search Review, Vol.4 No.3, pp. 137-152
Berrittella, M., Certa, A., Enea, M. and Zito, P. (2007): An analytic hierarchy process for
the evaluation of transport policies to reduce climate change impacts, available at
http://papers.ssrn.com/sol3/papers.cfm?abstract_id=962379 (accessed 11 August 2015)
BESTUFS II (2006): Quantification of urban freight transport effects, Report of European
Commission
Binh, N. (2014): Report of field survey on rice logistics and transport in the Mekong Delta,
Vietnamese-German Transport Research Centre, Vietnamese-German University.
Binh, N. (2013): Logistics barrier to the rice industry in the Mekong Delta, Presented at the
Vietnam Supply Chain Congress, Ho Chi Minh City, Vietnam
Blancas, L.C. and M. Baher, E.H. (2014): Facilitating Trade through Competitive, Low-
Carbon Transport. The Case for Vietnam’s Inland and Coastal Waterways, Report of the World
Bank
Blancas, Luis C., John Isbell, Monica Isbell, Hua Joo Tan, and Wendy Tao (2014): Effi-
cient Logistics: A Key to Vietnam’s Competitiveness. Directions in Development. Washington,
DC: World Bank
Ben-Akiva, M., Bolduc, D., & Park, J. Q. (2008): Discrete choice analysis of shipper’s prefer-
ences. In M. Ben-Akiva, H. Meersman, & E. van de Voorde (Eds.),Recent developments in
transport modelling: Lessons for the freight sector. Bingley, UK: Emerald

References
A Multi-Stage Impact Assessment Method for Freight Transport Management Measures 128 128
Boerkamps, J.H.K., Arjan J. van Binsbergen and Piet H. L. Bovy. (2000): Modelling behav-
ioural aspects of urban freight movement in supply chains, Transportation Research Record,
Vol.1725 No.1, pp.17-25
Boltze, M., Rühl. F., Berbner. U., and Friedrich, H. (2015): The interdisciplinary decision
map - A reference model for production, logistics and traffic. In: TRB 94th Annual Meeting
Compendium of Papers DVD, 11-15. January 2015, Washington D.C., USA
Boltze, M. (2013): Transportmanagemen-Güterverkehrsnachfrage stadtverträglich beeinflus-
sen (Freight Transport Management - Influencing Freight Transport Demand in a City-friendly
Manner). In: Urbane Räume in Bewegung. Edition Difu - Stadt Forschung Praxis. Deutsches
Institut für Urbanistik, Berlin. 2013, S. 277-286
Boltze, M., Rühl, F., and Friedrich, H. (2012): Freight transport demand management – A
contribution to urban traffic management and sustainability of logistics. World Conference on
Transport Research Society (WCTR), 14th-16th March 2012, Austria
Boltze, M. (2003): Transport planning and traffic engineering - Part C, Lecture at Technische
Universität Darmstadt
Boltze, M. (1998): Integration von städtischen und regionalen Verkehrsmanagement strate-
gien. Seminar VSVI Friedberg, 24.06.1998
Boltze, M., (1996): Verkehrsmanagement in Frankfurt am Main. Ergebnisse des Projektes
FRUIT und Hemmnisse bei der Umsetzung. In: Zeitschrift für Verkehrssicherheit (42), S. 16-
23
Browne, M., Allen, J. and Attlassy, M. (2007): Comparing freight transport strategies and
measures in London and Paris, International Journal of Logistics Research and Applications,
Vol.10 No.3, pp. 205-219
Browne, M., Sweet, M., Woodburn, A. and Allen, J. (2005): Urban freight consolidation
centres, Report of University of Westminster
C
Caldwell, H., Quinn, K.H., Meunie, J., Suhrbier, J., and Grenzeback, L. (2002): Impacts of
global climate change on freight, Presented at the Potential Impacts of Climate Change on
Transportation, U.S. Department of Transportation
Cambridge Sys. (2007): Guidebook for freight policy, planning, and programming in small-
and medium-sized metropolitan areas, NCHRP report, Transportation Research Board, Wash-
ington, D.C
Canter, L.W. (1996): Environmental impact assessment, available at:
ftp://www.energia.bme.hu/pub/hullgazd/Environmental%20Engineers%27%20Handbook/
Ch02.pdf (accessed 11 August 2015).
Castro, J.T. and Kuse, H. (2005): Impacts of large truck restriction in freight carriers opera-tion in metro Manila, Journal of the Eastern Asia Society for Transportation Studies, Vol.6,
pp.2947-2962
Cascetta, E. (2009): Transportation systems analysis - Models and applications. New York:
Springer
Cascetta, E., Marzano, V., Papola, A., & Vitillo, R. (2013): A multimodal elastic trade coef-
ficient MRIO model for freight demand in Europe. In M. E. Ben-Akiva, H. Meersman,
& E. van de Voorde (Eds.), Freight transport modelling. Bingley: Emerald
Castro, J.T. and Mario, R. (2010): Estimating Traffic and Emissions for Various Scenarios of
References
A Multi-Stage Impact Assessment Method for Freight Transport Management Measures 129 129
Freight Vehicle Restrictions in Metro Manila, Asian Transport Studies, Vol. 1 No. 1, pp. 4–17
Chan, B. and Al‐Hawamdeh, S. (2002): The development of e‐commerce in Singapore: The
impact of government initiatives, Business Process Management Journal, Vol.8 No.3, pp.278-
288
Chen, J.N. (2011): SWOT analysis of the logistics process of Shun Yue Cement Company
Limited, Savonia University of Applied Science, China
Chow, G. (2007): A total logistics cost approach to measuring collateral benefits of security
and supply chain improvements at international gateways, Presented at the Calgary Asia Pa-
cific Gateway and Corridor Round Table, Columbia
Combes, F. and Leurent, F. (2009): Representation of the freight transport” Association for
European Transport and contributors
Corbett, J.J., Wang, H. and Winebrake, J.J. (2009): The effectiveness and costs of speed
reductions on emissions from international shipping, Transportation Research Part D:
Transport and Environment, Vol.14 No.8, pp. 93-598
D
Dablanc, L. (2009): Freight transport, a key for the new urban economy, Freight Transport
for Development Toolkit, World Bank, p.52
Danielis, R. and Rotaris, L. (1999): Analysing freight transport demand using stated prefer-
ence data: a survey and a research project for the Friuli-Venezia Giulia Region, Trasporti Eu-
ropei, Vol.13, pp.30-38
Davis, D.R. and Weinstein, D.E. (1999), Economic geography and regional production struc-
ture: An empirical investigation, European Economic Review, Vol.43, pp.379-407
Davydenko, I., Tavasszy, L. A., & Smeets, P. S. G. M. (2012): Commodity freight and tripgeneration by logistics distribution centres based on sectorial employment data. In: Pro-
ceedings of the ninety first annual TRB meeting. Washington, DC: Transportation Research
Board
Davydenko, I., & Tavasszy, L. A. (2013): Estimation of warehouse throughput in a freight
transport demand model for the Netherlands. In: 92nd annual meeting of the transportation
research board, Washington DC
Dekker, R., Bloemhof, J. and Mallidis, I. (2012): Operations research for green logistics-An
overview of aspects, issues, contributions and challenges, European Journal of Operational
Research, Vol.219 No.3, pp. 671-679
Dung, T.T.M. (2012): Overview on the application of AHP in the supply chain management,
Scientific Journal, Can Tho University, Vietnam, Vol.21a, pp.180-189
E
Eckhard Szimba (2006): Interdependence between transport infrastructure projects, Disser-
tation Institut für Wirtschaftspolitik und Wirtschaftsforschung (IWW)
Eliasson, J. (2009): A cost–benefit analysis of the Stockholm congestion charging system,
Transportation Research Part A: Policy and Practice, Vol.43 No.4, pp.468–480
EU (2005): Inter-modality freight transport in the European Union. A systems approach to
freight transport strategies and actions to enhance efficiency, services and sustainability, Re-
port of European Union
EU (2007): Freight transport logistics action plan-Impact assessment, Report of European Un-
References
A Multi-Stage Impact Assessment Method for Freight Transport Management Measures 130 130
ion
EU (2008): Guide to cost-benefit analysis of investment projects, Report of European Union,
Regional Policy
EU (2011): Road map to a single European transport area-Towards a competitive and re-
source efficient transport system, Report of European Commission
EU (2012): EU Transport in Figure-Statistical Pocket Book 2012
F
FGSV (2012a): Hinweise zur Evaluation von verkehrsbezogenen Maßnahmen. Köln: FGSV-
Verlag
FHWA (2011): FHWA scenario planning guidebook, Federal Highway Administration’s Office
of Planning, Environment, Realty (HEP), USA
Fries, N., de Jong, G. C., Patterson, Z., & Weidmann, U. (2010): Shipper willingness to pay to increase environmental performance in freight transportation. Transportation Research
Record (2168), 33-42
Federal Register (2009): Environmental protection agency, 40 CFR Parts 86, 87, 89 et al.
Mandatory Reporting of Greenhouse Gases; Final Rule
Fornauf, L. (2015): Entwicklung einer Methodik zur Bewertung von Strategien für dadyna-
mische Straßenverkehrsmanagement, Dissertation at Technischen Universität Darmstadt
(Germany)
G
Gaßner and Christian, K.R. (2006): Intelligent growth in the transport corridor Germany-
Scandinavia visions for sustainable and connecting infrastructures and strategies, Presented at
the corridor of innovation and cooperation, Institute for future studies and technology as-
sessment
Gibson, B.J., Rutner, S.M. and Keller, S.B. (2002): Shipper‐carrier partnership issues, rank-
ings and satisfaction, International Journal of Physical Distribution & Logistics Management,
Vol.32 No.8, pp.669-681
Giorgi, L. and Tandon, A. (2002): Introduction: The theory and practice of evaluation, Pro-
ject and policy evaluation in transport, England
Glen Dhu. (2010): Assessment of environmental impacts, Environmental Assessment and
Registration Document, Shear Wind Inc., Vol.1
Gonzalez-Feliu, J. (2014): Costs and benefits of railway urban logistics: a prospective social
cost benefit analysis, available at: https://halshs.archives-ouvertes.fr/halshs-01056135/ (ac-
cessed 11 August 2015)
Grosso, M. (2011): Variables influencing transport mode choice: a generalized cots ap-
proach, Presented at the Società Italiana di Economia dei Trasportie della Logistica-XIII Reun-
ion, Messina, Greek
GSO (2011): General Statistics Office, Ministry of Planning and Investment, Vietnam
GSO (2014): General Statistics Office, Ministry of Planning and Investment, Vietnam
H
Friedrich, H. (2010): Simulation of logistics in food retailing for freight transportation analy-
sis (Dissertation). KIT, Institut für Wirtschaftspolitik und Wirtschaftsforschung (IWW), publis-

References
A Multi-Stage Impact Assessment Method for Freight Transport Management Measures 131 131
hed online:,http://digbib.ubka.uni-karlsruhe.de/volltexte/1000020602
Hanssen, T.-E.S., Mathisen, T.A. and Jørgensen, F. (2012): Generalized Transport Costs in
Intermodal Freight Transport, Procedia-Social and Behavioural Sciences, Vol.54, pp.189-200
Holguín-Veras, J. (2010): The truth, the myths and the possible in freight road pricing in
congested urban areas, Procedia-Social and Behavioral Sciences, The Sixth International Con-
ference on City Logistics, Vol.2 No.3, pp. 6366-6377
Holguín-Veras, J., Silas, M., Polimeni, J. and Cruz, B. (2007): An Investigation on the Ef-
fectiveness of Joint Receiver-Carrier Policies to Increase Truck Traffic in the Off-peak Hours,
Networks and Spatial Economics, Vol.7 No.3, pp.277-295
Holguín-Veras, J., Wang, Q., Xu, N., Ozbay, K., Cetin, M. and Polimeni, J. (2006): The
impacts of time of day pricing on the behaviour of freight carriers in a congested urban area:
Implications to road pricing, Transportation Research Part A: Policy and Practice, Vol.40 No.9,
pp.744-766
Holmgren, J., Ramstedt, L., Davidsson, P., Edwards, H. and Persson, J.A. (2014): Com-
bining Macro-level and Agent-based Modeling for Improved Freight Transport Analysis, Pro-
cedia Computer Science, Vol.32, pp.380-387
Hosoya, R. and Sano, K. (2003): Evaluation of logistics policies in the Tokyo Metropolitan
area using a micro-simulation model for urban goods movements, Journal of the Eastern Asia
Society for Transportation Studies, Vol.5, pp.3097-3110
Hsu, C.C. and Sandford, B.A. (2007): The Delphi technique: making sense of consensus,
Practical Assessment, Research & Evaluation, Vol.12 No.10, pp.1-8
I
IAG-EU (2014): Impact assessment guidelines-Public consultation document, European
Commission
J
Januszewska, R., Viaene, J., Gheysen, C. and De Steur, D. (2009): Strategic options for re-gional products as a tool for regional development, Bulletin UASVM Horticulture, Vol.66
No.2, pp. 260-267
JICA (2010): Survey report on rice logistics in the Mekong Delta, Vietnam: Japanese Interna-
tional Cooperation Agency
JICA (2012): Technical report no 3: Demand forecast methodology and transportation cost,
Study for the formulation of high-speed railway projects on Hanoi-Vinh and Hochiminh-Nha
Trang Section, Vietnam: Japanese International Cooperation Agency
de Jong, G. and Ben-Akiva, M. (2007): A micro-simulation model of shipment size and
transport chain choice, Transportation Research Part B: Methodological, Behavioural insights
into the Modelling of Freight Transportation and Distribution Systems, Vol.41 No.9, pp.950-
965
de Jong, G., Gunn, H. and Walker, W. (2004): National and international freight transport
models: an overview and ideas for further development, Transport Reviews, Vol.24 No.1,
pp.103-124
K
Kapros, S. (2011): Governance of logistics infrastructure: Policy and business approaches for
freight village, Presented at the European Transport Conference

References
A Multi-Stage Impact Assessment Method for Freight Transport Management Measures 132 132
Kayikci, Y. (2010): A conceptual model for intermodal freight logistics centre location deci-
sions, Procedia -Social and Behavioural Sciences, Vol.2 No.3, pp.6297-6311
Khuat, V.H. (2006): Traffic management in motorcycle dependent cities, Dissertation at
Technische Universität Darmstadt, Germany
Knaak, N. and Kruse, S. (2006): An agent-based simulation tool for modelling sustainable
logistics systems, Presented at the iEMS third biennial meeting on environmental modelling
and software", Burlington, USA
Kohler, U. (1997): An innovating concept for city logistics, Proceedings 4th World Congress
on Intelligent Transport System, Berlin
Kok, R., Annema, J.A. and van Wee, B. (2011): Cost-effectiveness of greenhouse gas mitiga-
tion in transport: A review of methodological approaches and their impact, Energy Policy,
Vol.39 No.12, pp.7776-7793
Kroes, E.P. and Sheldon, R.J. (1988): Stated preference methods - An Introduction, Journal
of Transport and Policy, Vol.22 No.1, pp.11-25
L
Lai, K. and Wong, C.W.Y. (2012): Green logistics management and performance: Some em-
pirical evidence from Chinese manufacturing exporter”, Omega, Vol.40 No.3, pp.267-282
Lambert, J.H. and Schroeder, M.J. (2009): Scenario-based transportation planning with in-
volvement of metropolitan planning organisation, USA: Centre for Risk Management of Engi-
neering Systems, University of Virginia
Lambert, M.B. and Bray, L.G. (2012): Applying benefit-cost analysis to freight project selec-
tion: Lessons from the Corps of Engineers, available at:
http://onlinepubs.trb.org/onlinepubs/ncfrp/docs/NCFRP22_FR.pdf (accessed 11 August
2015)
Fornauf, L. (2015): Entwicklung einer Methodik zur Bewertung von Strategien für dadyna-
mische Straßenverkehrsmanagement, Dissertation at Technischen Universität Darmstadt
(Germany)
Loc, V. (2010): Value chain analysis of rice product in the Mekong Delta, Scientific Journal,
Can Tho University, Vol.19a, pp.96-108
M
McFadden (2001): Disaggregate Behavioural Travel Demand’s RUM Side - A 30 Year Retro-
spective. In: HENSHER, D. (Editor.): Travel behaviour research: The leading edge, Pegamon,
2001, p. 17–64
MacCarthy, B.L. and Atthirawong, W. (2003): Factors affecting location decisions in inter-
national operations - a Delphi study, International Journal of Operations & Production Man-
agement, Vol.23 No.7, pp.794-818
McCartney, P., Lowe, S., Worsley, T. and Mackie, P. (2013): Assessment of methods for modelling and appraisal of the sub-national, regional and local economy impacts of transport,
Department for Transport, UK
Miyagi, T. (2001): Economic appraisal for multi-regional impacts by a large-scale expressway
project. Tinbergen Institute Discussion Paper, TI 2001-066/3
MGIA (2009): Methodological guide on ex-ante assessment of the impacts of public policies,
Government of the Republic of Moldova

References
A Multi-Stage Impact Assessment Method for Freight Transport Management Measures 133 133
MOT (2010): The transport master plan of the focal economic zones in the Mekong Delta,
Ministry of Transport, Vietnam
MOT (2014): Development strategy on transport service of Vietnam to 2020 and 2030, Minis-
try of Transport, Vietnam.
Mozafari, M. (2011): Pricing for freight carriers in a competitive environment: A game theo-
ry approach, International Journal of Industrial Engineering Computations, Vol.2 No.3,
pp.467-478
N
Roth, N. (2009): Wirkungen des Mobility Pricing, Dissertation at Technische Universität
Darmstadt., Germany
Nemoto, T., Browne, M., Visser, J. and Castrp, J. (2006): Intermodal transport and city lo-
gistics policies, Presented at the Recent Advances in City Logistics. The fourth International
Conference on City Logistics, Malaysia, pp.15-29
O
OECD (2002): Benchmarking Intermodal Freight Transport, Report of Organisation for Eco-
nomic Co-Operation and Development (OECD)
OECD (2004): OECD Territorial Reviews: Mexico City, Report of OECD, p.149
Osborn and Alex, F. (1963): Applied imagination: principles and procedures of creative
problem-solving, Scribner, New York
P
Papoutsis, K., Gogas, M. and Nathanail, E. (2012): Urban distribution concepts: a SWOT
analysis on best practices of urban logistics solutions, Presented at the 2nd International Con-
ference on Supply Chains, Gothenburg, Sweden
Piecyk, M. and McKinnon, A. (2009): Environmental impact of road freight transport in
2020, Full Report of a Delphi Survey. Edinburgh, LRC, Heriot-Watt University
Premeaux, S.R. (2009): Perceptual differences between shippers And motor carriers regard-
ing the Importance Of carrier selection criteria, Journal of the Transportation Research Fo-
rum, Vol.48 No.1, pp.39-47
Pubule, J. and Blumberga, D. (2010): Use of benchmark methodology in environmental im-pact assessment, Scientific Journal of Riga Technical University. Environmental and Climate
Technologies, Vol.4 No.1, pp.91-96
Q
Quak, H. and van Duin, J.H.R. (2010): The influence of road pricing on physical distribution
in urban areas, Procedia-Social and Behavioural Sciences, The Sixth International Conference
on City Logistics, Vol.2 No.3, pp.6141-6153
Quak, H. and De Koster, F. (2006): The impacts of time access restrictions and vehicle
weight restrictions on food retailers and the environment, European Journal of Transport and
Infrastructure Research, Vol.6 No.2, pp.131-150
Quayle, M. (2002): E‐commerce: the challenge for UK SMEs in the twenty‐first century, In-
ternational Journal of Operations & Production Management, Vol.22 No.10, pp.1148-1161
R

References
A Multi-Stage Impact Assessment Method for Freight Transport Management Measures 134 134
Regmi, M.B. and Hanaoka, S. (2013): Location analysis of logistics centres in Laos, Interna-
tional Journal of Logistics Research and Applications, Vol.16 No.3, pp.227-242
Regmi, M.B. and Hanaoka, S. (2015): Assessment of modal shift and emissions along a
freight transport corridor between Laos and Thailand, International Journal of Sustainable
Transportation, Vol.9 No.3, pp.192-202
Rühl, F., & Ottemöller, O. (2013): Nachfragebeeinflussung im Güterverkehr. In Institut für
Stadtbauwesen und Stadtverkehr, RWTH Aachen (Ed.): Tagungsband der “AMUS + ACMoVe
2013 User-friendly Mobility - Trends, Challenges and Innovations", pp.35–37
Russo, F. and Comi, A. (2011): Measures for Sustainable Freight Transportation at Urban Scale: Expected Goals and Tested Results in Europe, Journal of Urban Planning and Develop-
ment, Vol.137 No.2, pp.142-152
S
Saaty, T.L. (1980): The Analytic Hierarchy Process, McGraw Hill Company, New York.
Scott, R. (2011): Benchmarking: A Literature Review, Edith Cowan University, Australia, Ac-
ademic Excellence, Centre for Learning & Development
Sheffi, Y. and Koutsopoulos, H.N. (1988): Transportation mode choice based on total logis-
tics costs, Journal of Business and Logistics, Vol.9 No.2, pp.137-154
Sinha, K.C. and Labi, S. (2007): Transportation decision-making: Principles of project evalu-
ation and programming, John Wiley & Sons, Inc
SIWRP (2011): Master plan of water resource in the Mekong Delta, the Southern Institute for
Water Resource Planning
Steer Davies Gleave. (2009): Evaluation of the common transport policy (CTP) of the EU
from 2000 to 2008 and analysis of the evolution and structure of the European transport sec-tor in the context of the long-term development of the CTP, Belgium: European Commission,
Directorate-General Energy and Transport
Strickland, S. and Berman, W. (1995): Congestion control and demand management, Public
road online, Vol.58 No.3
T
TAC (2014): Draft primer on truck lanes in Canadian urban area, Transportation Association
of Canada
TASTe (1999): Analysis and Development of Tools for Assessing Traffic Demand Manage-
ment Strategies. Guidelines on the Use of Tools for Assessing Traffic Demand Management Strategies. Forschungsprojekt der Europäischen Kommission. European (4th RTD Framework
Programme) - 01/1997-01/1999. Unter Mitarbeit von R. Andree, K. W. Axhausen, M. Boltze,
H.-G. Retzko und u.a. Albert Speer & Partner; Barcelona Tecnologia; Beratung und Planung
im Verkehrswesen; Frankfurt am Main; Transport Operation Research Group
Tamagawa, D., Taniguchi, E. and Yamada, T. (2010): Evaluating city logistics measures us-
ing a multi-agent model, Procedia-Social and Behavioural Sciences, Vol.2 No.3, pp. 6002-
6012
Taniguchi, E. (2014): Concepts of city logistics for sustainable and liveable cities, Procedia-
Social and Behavioural Sciences, Vol.151, pp.310-317
Taniguchi, E. and Tamagawa, D. (2005a): Evaluating city logistics measures considering the
behavior of several stakeholders”, Journal of the Eastern Asia Society for Transportation Stud-

References
A Multi-Stage Impact Assessment Method for Freight Transport Management Measures 135 135
ies, Vol.6, pp.3062-3076
Taniguchi, Eiichi; Nemoto, Toshinori (2002): Transport-demand management for freight
transport. In: Eiichi Taniguchi and R. G. Thompson (Ed.): Innovations in freight transport.
Southampton, Boston: WIT, p. 101–124
Tavasszy, L. Smeenk, B., & Ruijgrok, C. J. (1998): ADSS for modelling logistics chains in
freight transport systems analysis. International Transactions in Operational Research, 50(6),
pp 447-459
Tavasszy, L., Groothedde, B. and Ruijgrok, C. (2000): Aggregate models of spatial logistic”,
Third International Meeting for Research in Logistics, Trois-Rivieres, Canada
Tavasszy, L., Huijsman E., & Cornelissen C. (2001): Forecasting the impacts of changing
patterns of physical distribution on freight transport flows in Europe. In: Proceedings of the
ninth World Conference for Transport Research
Tavasszy, L. and de Jong, G. (2014): Modelling freight transport, Elsevier Publication, ISBN:
978-0-12-410400-6
Teo, J.S.E., Taniguchi, E. and Qureshi, A.G. (2014): Evaluation of load factor control and
urban freight road pricing joint schemes with multi-agent systems learning models, Procedia-
Social and Behavioural Sciences, Eighth International Conference on City Logistics 17-19 June
2013, Bali, Indonesia, Vol.125, pp.62-74
TfL (2014): Impact assessment of the London safer lorry scheme, UK: Department for
Transport, London
TRT–Transporti e Territorio, Milan, Italy (2008): Pricing system for road freight transport
in EU member states and Switzerland.
U
Ubeda, S., Arcelus, F.J. and Faulin, J. (2011): Green logistics at Eroski: A case study, Inter-
national Journal of Production Economics, Vol.131 No.1, pp.44-51
Umwelt bundes amt. (2009): Avoidance, modal shift and technological improvements: Rec-
ommendations by the Federal Environment Agency for sustainable freight transport, German
Federal Environment Agency
UNDP (2011): Sustainable rice production systems: Scoping paper, Food and Agriculture Or-
ganisation (FAO), Vol.14 No.1
V
VFA (2011): Vietnam Food Association
Ville, S., Gonzalez-Feliu, J. and Dablanc, L. (2010): The limits of public policy intervention
in urban logistics: The case of Vicenza (Italy) and lessons for other European cities, Presented
at the 12th World Conference on Transport Research, Lisbon, Portugal
Visser, J. (2006): Urban freight transport policies and planning in Europe: an overview and
classification of policy measures, Presented at the National Urban Freight Conference, Califor-
nia
Visser, J., van Binsbergen, A. and Nemoto, T. (1999): Urban freight transport policy and
planning, Presented at the First International Symposium on City Logistics, Cairns, Australia
VITRANSS-2 (2009): The comprehensive study on the sustainable development of transport
system in Vietnam, Vietnam: JICA
Vrtic, M., Schuessler, N., Erath, A. and Axhausen, K.W. (2009): The impacts of road pric-
References
A Multi-Stage Impact Assessment Method for Freight Transport Management Measures 136 136
ing on route and mode choice behaviour, Journal of Choice Modelling, Vol.3 No.1, pp.109-
126
W
WB (2010): Vietnam urbanization review-Technical assistance report, the World Bank Vi-
etnam
Wei, Jiang; Boltze, Manfred (2016): Impacts of low emission zones in Germany on air pollu-
tion levels. World Conference on Transport Research (WCTR), 10th-15th July 2016 Shanghai
(accepted paper)
Wigan, M.R., Hensher, D.A. and Raimond, T. (1995): Results of Delphi Study on Transpor-
tation Research, Presented at the World Conference on Transportation Research, Sydney,
pp.1-20
Wilasinee, S., Imran, A. and Athapol, N. (2010): Optimization of Rice Supply Chain in Thailand: A Case Study of Two Rice Mills, Sustainability in Food and Water, Alliance for
Global Sustainability Book series, Springer Netherlands, pp.263-280
Wisetjindawat, W. (2011): Review of good practices in urban freight transportation,
Transport and Communications Bulletin for Asia and the Pacific, Vol.80.
Wisetjindawat, W., Sano, K. and Matsumoto, S. (2006): Commodity distribution model in-
corporating spatial interactions for urban freight movement, Transportation Research Record,
Vol.1996, pp.41-50
Wu, H. and Dunn, S. (1995): Environmentally responsible logistics systems, International
Journal of Physical Distribution and Logistics Management, Vol.25 No.2, pp.20-38
Y
Yang, L., Choudhury, C.F., Ben-Akiva, M., e Silva, J.A. and Carvalho, D. (2009): Stated
preference survey for new smart transport modes and services, working paper, MIT Portugal
Yin, R.K. (2006): Case Study Research: Design and Methods, SAGE Publication, Inc

A Multi-Stage Impact Assessment Method for Freight Transport Management Measures 137
List of Tables
Table 2-1: Compilation of freight transport management measures ...................................... 13
Table 2-2: List of examples for the application of FTM measures ......................................... 14
Table 2-3: List of examples for the application of FTM measures (cont.) .............................. 15
Table 2-4: Qualitative assessment of the effectiveness and applicability of FTM measures ... 24
Table 3-1: Assessment criteria categories ............................................................................... 30
Table 3-2: Overview on impact assessment performance indicators concerning FTM
measures ............................................................................................................... 31
Table 3-3: Summary of criteria and performance indicators for FTM impact assessment ...... 32
Table 3-4: Assessment process objectives and evaluation criteria .......................................... 33
Table 3-5: List of meta-assessment criteria used to evaluate the suitability of various
methods ................................................................................................................. 34
Table 3-6: Proposal of meta-assessment criteria for the selection of FTM assessment
methods ................................................................................................................. 34
Table 3-7: Advantages and disadvantages of qualitative impact assessment methods ........... 52
Table 3-8: Advantages and disadvantages of partly-quantitative impact assessment
methods ................................................................................................................. 53
Table 3-9: Advantages and disadvantages of quantitative impact assessment methods ......... 54
Table 3-10: Qualitative assessment of different potential methods for the assessment of FTM
measures in the Vietnamese rice industry ............................................................. 60
Table 4-1: Comparison of the Mekong Delta road network to other regions.......................... 63
Table 4-2: Distribution of inter-regional freight traffic from the Mekong Delta, 2009 ........... 64
Table 4-3: Main commodity flows from the Mekong Delta to HCMC ..................................... 65
Table 4-4: Ten biggest rice exporters in the world, 2010 ....................................................... 65
Table 4-5: Haulage characteristics for long-distance freight transport ................................... 70
Table 4-6: Traffic accidents by mode, 2006 ........................................................................... 75
Table 4-7: The distribution of road traffic accidents in some regions of Vietnam, 2006 ........ 75
Table 4-8: Estimated emission rates in Vietnam by freight transport mode ........................... 76
Table 5-1: Compilation of FTM measures in the context of the rice industry ......................... 78
Table 5-2: The qualitative analysis of interdependencies of potential FTM measures
in the rice industry ................................................................................................ 85
Table 5-3: Scale for pairwise comparison ............................................................................... 89
Table 5-4: Relative weight of assessment criteria for FTM measures in the rice industry ...... 90
Table 5-5: Definition of qualitative scaling of effectiveness and applicability ........................ 91
Table 5-6: Example of scaling cost difficulty of measures ...................................................... 91

A Multi-Stage Impact Assessment Method for Freight Transport Management Measures 138
Table 5-7: Assessment on the cost difficulty of each measure ................................................ 93
Table 5-8: Qualitative scaling of three potential FTM measures in the rice industry ............. 94
Table 5-9: Final assessment of pre-selected measures ............................................................ 95
Table 5-10: Different scenarios for the application of FTM measures in the rice industry ....... 96
Table 5-11: Rice production and consumption in the Mekong Delta ....................................... 97
Table 5-12: Key sources of rice in the Mekong Delta ............................................................... 98
Table 5-13: Sample of data on establishment in HCMC ......................................................... 100
Table 5-14: Composition of fuel consumption by type of vehicles ......................................... 105
Table 5-15: Crew cost and overhead cost by type of vehicles ................................................. 106
Table 5-16: Depreciation cost estimation ............................................................................... 106
Table 5-17: Repair and maintenance cost estimation ............................................................. 106
Table 5-18: Capital cost by type of vehicle ............................................................................. 107
Table 5-19: Unit handling costs in the rice industry ............................................................... 107
Table 5-20: Example of the TLC model development and the estimation of TLC per
ton-km for different transport modes .................................................................. 109
Table 5-21: Overview of model input data ............................................................................. 110
Table 5-22: Overview of fixed parameters in the model ........................................................ 110
Table 5-23: Overview of variable parameters in the model .................................................... 111
Table 5-24: Value of variable parameters in the base scenario .............................................. 111
Table 5-25: Sensitivity analysis of variable model parameters ............................................... 112
Table 5-26: Selection of coefficients applied for safety and environmental impact
assessment in Vietnam ........................................................................................ 115
Table 5-27: Estimation of the impacts of Scenario 1 .............................................................. 116
Table 5-28: The change of emission in Scenario 2 ................................................................. 117
Table 5-29: Estimation of the impacts of Scenario 2 .............................................................. 118
Table 5-30: Estimation of the impacts of Scenario 3 .............................................................. 120
Table 5-31: Summary of the impacts of different scenarios ................................................... 121

A Multi-Stage Impact Assessment Method for Freight Transport Management Measures 139
List of Figures
Figure 1-1: The research flow of the study ................................................................................ 3
Figure 2-1: Stakeholders involved in the freight transport system ............................................ 6
Figure 2-2: Goal conflicts of stakeholders involved in the freight transport system .................. 8
Figure 2-3: Freight transport demand management as a part of traffic management ............. 11
Figure 2-4: Classification of FTM measures by their potential impacts.................................... 12
Figure 3-1: Decision-making process in freight transport management based on PDCA
cycle ...................................................................................................................... 25
Figure 3-2: An example of “objective trees” in assessing the efficiency of a freight transport
system ................................................................................................................... 27
Figure 3-3: Aspects of impact caused by FTM .......................................................................... 28
Figure 3-4: Scope of FTM measure impacts ............................................................................. 29
Figure 3-5: Categorisation of impact assessment methods for FTM measures ......................... 35
Figure 3-6: Organisation of the Delphi process ........................................................................ 39
Figure 3-7: Illustration of the MCA method in the assessment and selection of measures ..... 40
Figure 3-8: Overview of AHP structure .................................................................................... 41
Figure 3-9: Example of TLC model for impact assessment of changes in logistics and
transport systems on distribution structures ......................................................... 47
Figure 3-10: Proposal of a multi-stage impact assessment method for freight transport
management measures .......................................................................................... 57
Figure 4-1: The Mekong Delta transport networks .................................................................. 62
Figure 4-2: Comparison of the freight transport growth rate for the Mekong Delta with
other regions of Vietnam ....................................................................................... 64
Figure 4-3: Rice production by region in Vietnam, 2010 ......................................................... 66
Figure 4-4: Rice growing seasons in the Mekong Delta ........................................................... 66
Figure 4-5: The rice production distributed seasonally in the Mekong Delta (2009) .............. 67
Figure 4-6: Rice supply chain in the Mekong Delta ................................................................. 68
Figure 4-7: Transport modes used in the rice supply chain ..................................................... 69
Figure 4-8: Freight modal share in the Mekong Delta rice industry ........................................ 70
Figure 4-9: Transportation of rice by inland waterway ........................................................... 71
Figure 4-10: Transport of rice by road ....................................................................................... 72
Figure 4-11: TLC in the export rice supply chain ....................................................................... 73
Figure 4-12: TLC in the domestic rice supply chain ................................................................... 73
Figure 4-13: Comparison of unit transport price by mode (USD/ton-km) ................................. 73

A Multi-Stage Impact Assessment Method for Freight Transport Management Measures 140
Figure 4-14: Total lead-time in the export rice supply chain ..................................................... 74
Figure 4-15: Total lead-time in the domestic rice supply chain ................................................. 74
Figure 4-16: The percentage of road traffic accidents by some key regions in Vietnam ............ 75
Figure 5-1: Location for rice logistics centre in Hau Giang province ....................................... 79
Figure 5-2: Location of major markets for paddy/rice in the Mekong Delta ............................ 80
Figure 5-3: Prohibited roads for trucks entering HCMC from 6:00 am to 12:00 pm ............... 81
Figure 5-4: Location of centralized areas for paddy production .............................................. 82
Figure 5-5: Improvement of NH 1A from the Mekong Delta to HCMC .................................... 83
Figure 5-6: Hierarchical structure of assessment criteria for effectiveness .............................. 87
Figure 5-7: Hierarchical structure of assessment criteria for applicability ............................... 87
Figure 5-8: Questionnaires sample .......................................................................................... 88
Figure 5-9 : Distribution of rice flows in the Mekong Delta, 2010 ............................................ 98
Figure 5-10: Locations of key rice sources in the Mekong Delta ................................................ 99
Figure 5-11: Distribution of establishments in HCMC ............................................................. 100
Figure 5-12: Distribution of number of customers per rice supplier ........................................ 101
Figure 5-13: Distribution of rice volume sold for customers in HCMC .................................... 102
Figure 5-14: Current supply paths in the rice industry (Base scenario) ................................... 103
Figure 5-15: Change in inbound transport cost in Scenario 1 ................................................. 114
Figure 5-16: Change in warehouse cost and handling cost in Scenario 1 ................................ 114
Figure 5-17: Change in modal share in Scenario 1 .................................................................. 114
Figure 5-18: Fuel consumption rate and cost by speed of vehicle ........................................... 117
Figure 5-19: Change in modal share in Scenario 3 .................................................................. 119

A Multi-Stage Impact Assessment Method for Freight Transport Management Measures 141
List of Abbreviations
ADA Aggregate-Disaggregate-Aggregate
ADB Asian Development Bank
AHP Analytical Hierarchy Process
BOT Build-Operate-Transfer
CEA Cost-Effectiveness Analysis
CBA Cost-Benefit Analysis
CBR Cost-Benefit Ratio
CTP Common Transport Policy
DoT Department of Transport
EOQ Economic Order Quantity
ETC Electronic Toll Collection
EU European Union
ES Establishment
FC Food Company
FGSV German Road and Transport Research Association
FPEs Food Processing Enterprises
FTDM Freight Transport Demand Management
FTM Freight Transport Management
FTL Full Truck Load
GHG Greenhouse Gas
GIS Geographical Information System
GPS Global Positioning System
GSO General Statistics Office of Vietnam
IO Input-Output
IRR Internal Rate of Return
JICA Japanese International Cooperation Agency
LFC Load Factor Control
LSPs Logistics Service Providers
HC Handling Cost
HCMC Ho Chi Minh City
HGV Heave Goods Vehicles
IT Information Technology
ITS Intelligent Transport System

A Multi-Stage Impact Assessment Method for Freight Transport Management Measures 142
IWT Inland Waterway Transport
MCA Multi-Criteria Analysis
MDCs Motorcycle Dependent Cites
MOT Ministry of Transport
MPI Ministry of Planning and Investment
MRIO Multi-Regional Input-Output
NH National Highway
NPV Net Present Value
OECD Organization for Economic Co-operation and Development
PDCA Plan-Do-Check-Act
TC Transport Cost
TLC Total Logistics Cost
UFC Urban Freight Centre
UNDP United Nations Development Programme
SCBA Social Cost Benefit Analysis
SCGE Spatial Computable General Equilibrium
SFEZ Southern Focal Economic Zone
SWOT Strengths-Weakness-Opportunities-Threats
VFA Vietnam Food Association
VINAFOOD II Vietnam Southern Food Corporation
VISSTRANS Comprehensive Study on the Sustainable Development of Transport
System in Vietnam
VOT Value of Time
WB World Bank
WC Warehousing Cost

Appendix
A Multi-Stage Impact Assessment Method for Freight Transport Management Measures 143
Appendices
Appendix A. Survey on rice transport and logistics in the Mekong Delta 144
Appendix B. Expert survey documentation 152
Appendix C. Key sources of rice in the Mekong Delta 179
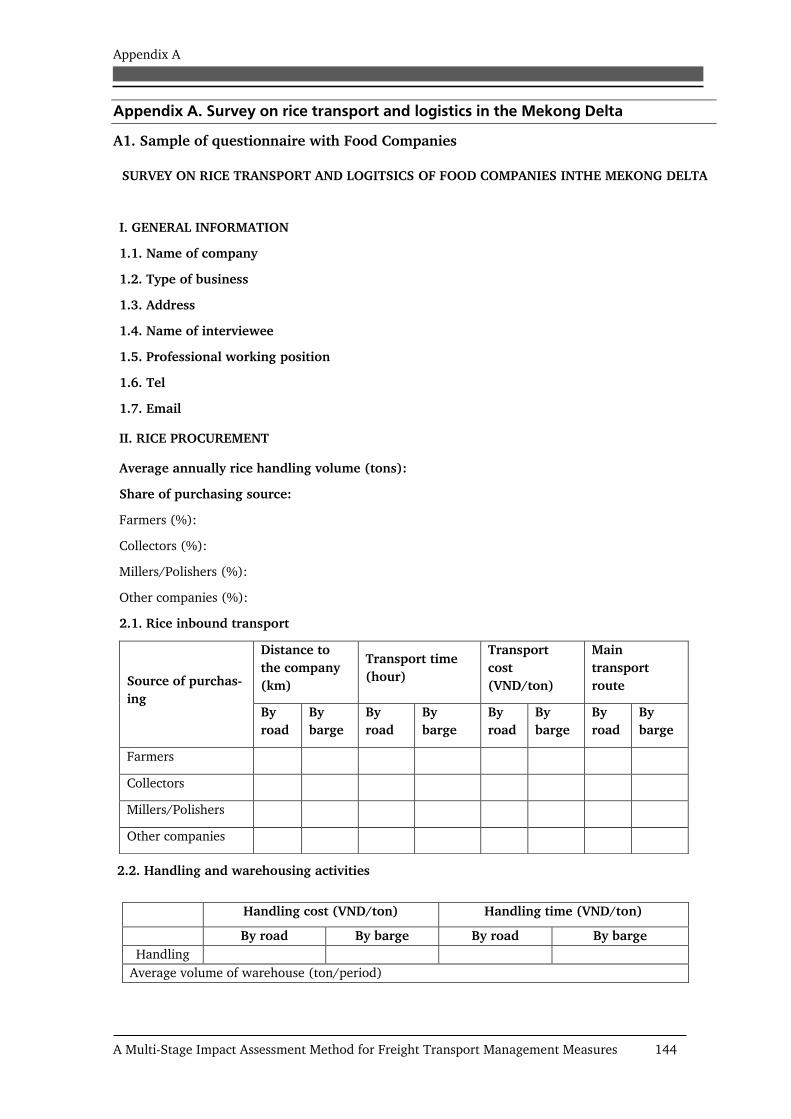
Appendix A
A Multi-Stage Impact Assessment Method for Freight Transport Management Measures 144
Appendix A. Survey on rice transport and logistics in the Mekong Delta
A1. Sample of questionnaire with Food Companies
SURVEY ON RICE TRANSPORT AND LOGITSICS OF FOOD COMPANIES INTHE MEKONG DELTA
I. GENERAL INFORMATION
1.1. Name of company
1.2. Type of business
1.3. Address
1.4. Name of interviewee
1.5. Professional working position
1.6. Tel
1.7. Email
II. RICE PROCUREMENT
Average annually rice handling volume (tons):
Share of purchasing source:
Farmers (%):
Collectors (%):
Millers/Polishers (%):
Other companies (%):
2.1. Rice inbound transport
Source of purchas-
ing
Distance to
the company
(km)
Transport time
(hour)
Transport
cost
(VND/ton)
Main
transport
route
By
road
By
barge
By
road
By
barge
By
road
By
barge
By
road
By
barge
Farmers
Collectors
Millers/Polishers
Other companies
2.2. Handling and warehousing activities
Handling cost (VND/ton) Handling time (VND/ton)
By road By barge By road By barge
Handling
Average volume of warehouse (ton/period)

Appendix A
A Multi-Stage Impact Assessment Method for Freight Transport Management Measures 145
III. RICE DISTRIBUTION
3.1. Annual rice distribution volume?
3.2. Share of distribution market
- Domestic (%):
- Export (%):
3.3. Rice outbound transport
Distribution
market
Distance to the
company (km)
Transport time
(hour)
Transport cost
(VND/ton)
Main transport
route
By
road
By
barge
By
road
By
barge
By
road
By
barge
By
road
By
barge
Domestic
Export
3.4. Handling at HCMC port system (for export purpose)
- Time waiting at port (day)
o Average
o Maximum
- Handling cost at port (VND/ton):
3.5. Your assessment on major barriers to improve rice logistics performance in the Mekong Del-
ta?
Thank you for your kind cooperation!
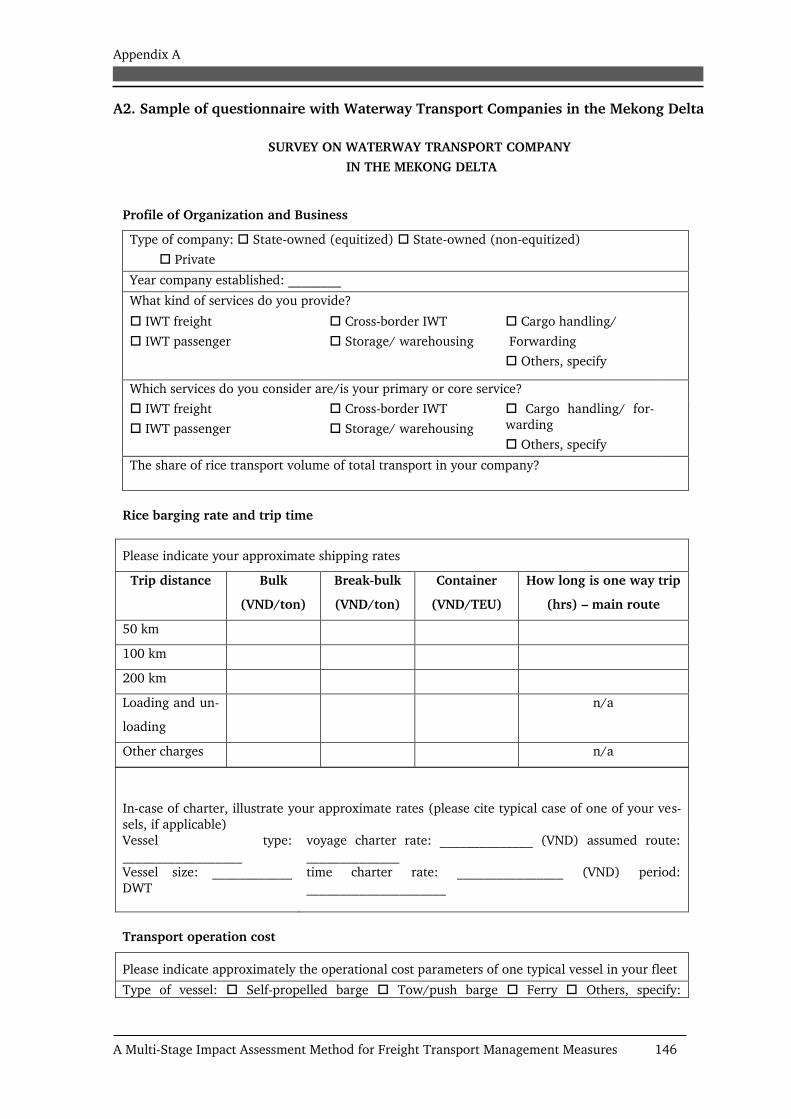
Appendix A
A Multi-Stage Impact Assessment Method for Freight Transport Management Measures 146
A2. Sample of questionnaire with Waterway Transport Companies in the Mekong Delta
SURVEY ON WATERWAY TRANSPORT COMPANY
IN THE MEKONG DELTA
Profile of Organization and Business
Type of company: State-owned (equitized) State-owned (non-equitized)
Private
Year company established: ________
What kind of services do you provide?
IWT freight
IWT passenger
Cross-border IWT
Storage/ warehousing
Cargo handling/
Forwarding
Others, specify
Which services do you consider are/is your primary or core service?
IWT freight
IWT passenger
Cross-border IWT
Storage/ warehousing
Cargo handling/ for-
warding
Others, specify
The share of rice transport volume of total transport in your company?
Rice barging rate and trip time
Please indicate your approximate shipping rates
Trip distance Bulk
(VND/ton)
Break-bulk
(VND/ton)
Container
(VND/TEU)
How long is one way trip
(hrs) – main route
50 km
100 km
200 km
Loading and un-
loading
n/a
Other charges n/a
In-case of charter, illustrate your approximate rates (please cite typical case of one of your ves-
sels, if applicable)
Vessel type: __________________
Vessel size: ____________
DWT
voyage charter rate: ______________ (VND) assumed route: ______________
time charter rate: ________________ (VND) period:
_____________________
Transport operation cost
Please indicate approximately the operational cost parameters of one typical vessel in your fleet
Type of vessel: Self-propelled barge Tow/push barge Ferry Others, specify:

Appendix A
A Multi-Stage Impact Assessment Method for Freight Transport Management Measures 147
______________
Size of vessel: _____________ Reg. Ton Typical operating speed: _____________ km/hr
Purchase price: _________________VND USD Age of vessel when acquired: _________ yrs.
old
Average fuel consumption: _________ lit/km Price of fuel: ______________ VND/lit
Ave. maintenance and repair cost per year (labor, supplies, and spare parts):
_________________ VND
No. of crew: _________________ Average wage of crew: ______________ VND/month
Other annual expenses: ____________________ VND/yr
Days in a year, not available for service (i.e. under repair or maintenance): _______ (days/yr)
Days in a year operating for revenue: __________ (days/yr)
Average load factor (note, if full one way and empty on the return LF=50%): ________ (%)
Accidents and Cargo Safety
Average number of accidents per year:
In the last three years, in your opinion IWT accidents have been: Stable Increase De-
crease
What do you think is the primary cause of
accidents:
weather
human error
vessel problem
navigational aids
problem
port and channel
problem
others:
__________________
Estimate the average cost per accident in your company: ________ VND/accident
Please give your assessment on major problems in IWT operation in the Mekong Delta?
Thank you for your kind cooperation!

Appendix A
A Multi-Stage Impact Assessment Method for Freight Transport Management Measures 148
A3. Sample of questionnaire with Trucking Companies in the Mekong Delta
SURVEY ON ROAD TRANSPORT COMPANY IN THE MEKONG DELTA
Profile of Organization and Business
Type of company: State-owned (equitized) State-owned (non-equitized)
Private
Year company established: ________
What kind of services do you provide?
Trucking
Cross-border trucking
Forwarding
Storage/ warehousing
Custom clearance
Others, specify
Which services do you consider are/is your primary or core service?
Trucking
Cross-border trucking
Forwarding
Storage/ warehousing
Custom clearance
Others, specify
The share of rice transport volume of total transport in your company?
Rice transport rate and trip time
Please indicate your approximate rice trucking rates in your company
Distance Truck
(<5 ton)
Truck
(5-15ton)
20’ con-
tainer
(VND)
40’ con-
tainer
(VND)
45’ con-
tainer
(VND)
How many
hours is the
trip (one
way)-for
main routes
50 km
200 km
800 km
1,600 km
Loading and
unloading n/a
Other charg-
es n/a
In-case of charter, illustrate your approximate rates (please cite typical case of one of your trucks,
if applicable)
Truck type:
________________
trip charter fee (2-way): ______________ (VND) assumed route:
______________
time charter fee: _____________ (VND) period:
_____________________
Transport operation cost
Please indicate approximately the operational cost parameters of one typical truck in your fleet
Type of truck: Container Gen. Cargo Tanker Others, specify: ______________
GVW (truck+max. load): _____________ (tons)
Purchase price: _________________VND USD Age of truck when acquired: _________ yrs. old
Average fuel consumption: _________ lit/km Price of fuel: ______________ VND/lit
Ave. maintenance and repair cost per year (labor, supplies, and spare parts): _________________
VND

Appendix A
A Multi-Stage Impact Assessment Method for Freight Transport Management Measures 149
No. of drivers and assistants: _________ Average wage of operators: ___________ VND/month
Other annual expenses: ____________________ VND/yr
Days in a year, not available for service (i.e. under repair or maintenance): _______ (days/yr)
Days in a year operating for revenue: __________ (days/yr)
Average load factor (note, if full one way and empty on the return LF=50%): ________ (%)
Accidents and Cargo Safety
Average number of accidents per year:
In the last three years, in your opinion IWT accidents have been: Stable Increase De-
crease
What do you think is the primary cause of
accidents:
weather
human error
vessel problem
navigational aids
problem
port and channel
problem
others:
__________________
Estimate the average cost per accident in your company: ________ VND/accident
Please give your assessment on major problems in trucking operation in the Mekong Delta?
Thank you for your kind cooperation!

Appendix A
A Multi-Stage Impact Assessment Method for Freight Transport Management Measures 150
A4. List of surveyed companies
No Name Type of com-
pany Address Tel
I. Food Companies
1 Song Hau Food Company State-owned Tra Noc ward, Binh Thuy
district, Can Tho city
84. (0)710.
3841299
2 Tra Noc Food Processing
Enterprise State-owned
Tra Noc Industrial Zone,
Binh Thuy district, Can
Tho city
84. (0)710.
3842284
3 Thoi Lai Food Processing Enterprise
State-owned Lo Vong Cung, Ninh Kieu district, Can Tho city
84. (0)710. 3689437
4 An Giang Food Company State-owned
Nguyen Du, My Binh
ward, Long Xuyen city, An
Giang province
84 (0)76
3955802
5 Chau Phu Food Processing
Enterprise State-owned
Thanh Trung commune,
Chau Phu district, An
Giang province
84 (0) 76
3955802
6 Phu Cuong Agriculture
Product Centre State-owned
5 commune, Cai Lay dis-
trict, Tien Giang drovince
84 (0)
73.3827338
7 Tien Giang Food Company State-owned Ward 10, My Tho city,
Tien Giang province
84 (0) 73) 3855
47
8 Food Processing Enterprise
No 2 State-owned
Thach Hoa commune,
Thach Hoa distric, Tien
Giang province
84 (0)
73.3853042
9 Viet Nguyen Food Pro-
cessing Enterprise Private
Binh Duc commnune,
Chau Thanh district, Tien
Giang province
84 (0)
73.3853036
10 Thanh Hong Trading-
Service Company Private
An cu commune, Cai Be
district, Tien Giang prov-
ince
84 (0) 73 3722
529
11 Cuu Long Food Processing
Enterprise Private
Thoi Thuan commune,
Thot Not District, Can Tho
city
84
(0)7103859639
12 Thanh Tin Food Compnay Private
Bach Dang ward, Soc
Trang City, Soc Trang
province
84 (0) 793
621226
II. Waterway Transport Company
1 Can Tho Port Company State-owned Tan Phu ward, Cai Rang
district, Can Tho city
84 (0) 7106 516
463
2 An Giang Port Joint-Stock
Company State-owned
NH91, My Thanh ward,
Long Xuyen city, An Giang
province
84 (0) 76
3831447
3 VINALINES Can Tho Private
Le Hong Phong Street, Tra
An ward, Binh Thuy dis-
trict, Can Tho city
84 (0) 710-
3842801
4 Can Tho-Ha Noi Maritime
Company Private
Hung Loi ward, Ninh Kieu
district, Can Tho city
84 (0) 7109 523
469
5 GEMADEPT Can Tho Private
Le Hong Phong street,
Binh Thuy district, Can
Tho city
84 (0) 7103 885
818

Appendix A
A Multi-Stage Impact Assessment Method for Freight Transport Management Measures 151
No Name Type of com-
pany Address Tel
II. Road Transport Company
1 Nhon Hoa Transportation
Corporation Private
Long Xuyen city, An
Giang province
84 (0)76
39340002
2 VINALINES Can Tho Private
Le Hong Phong Street,
Tra An ward, Binh Thuy
district, Can Tho city
84 (0) 710-
3842801
3 GEMADEPT Can Tho Private
Le Hong Phong street,
Binh Thuy district, Can
Tho city
84 (0) 7103 885
818
4 Hung Phu Thinh Forwarding
Transport Company Private
An Phu ward, Ninh Kieu
district, Can Tho city 84 0977220488
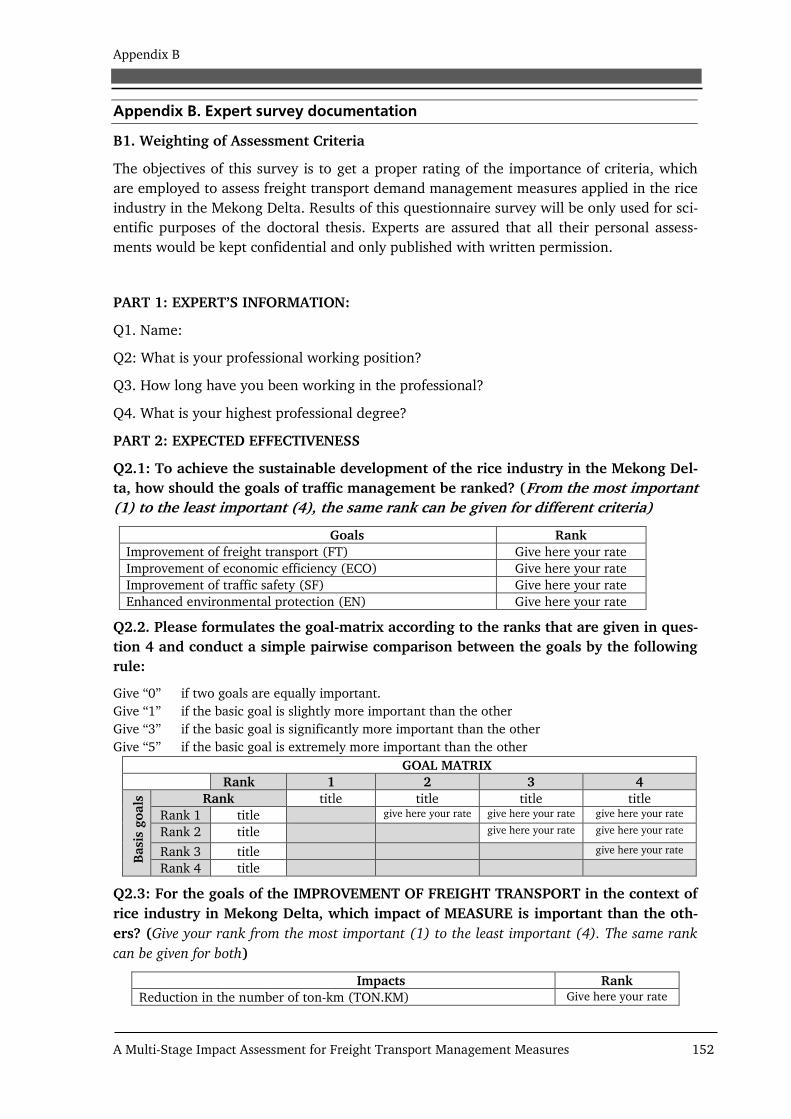
Appendix B
A Multi-Stage Impact Assessment for Freight Transport Management Measures 152
Appendix B. Expert survey documentation
B1. Weighting of Assessment Criteria
The objectives of this survey is to get a proper rating of the importance of criteria, which
are employed to assess freight transport demand management measures applied in the rice
industry in the Mekong Delta. Results of this questionnaire survey will be only used for sci-
entific purposes of the doctoral thesis. Experts are assured that all their personal assess-
ments would be kept confidential and only published with written permission.
PART 1: EXPERT’S INFORMATION:
Q1. Name:
Q2: What is your professional working position?
Q3. How long have you been working in the professional?
Q4. What is your highest professional degree?
PART 2: EXPECTED EFFECTIVENESS
Q2.1: To achieve the sustainable development of the rice industry in the Mekong Del-
ta, how should the goals of traffic management be ranked? (From the most important
(1) to the least important (4), the same rank can be given for different criteria)
Goals Rank
Improvement of freight transport (FT) Give here your rate
Improvement of economic efficiency (ECO) Give here your rate
Improvement of traffic safety (SF) Give here your rate
Enhanced environmental protection (EN) Give here your rate
Q2.2. Please formulates the goal-matrix according to the ranks that are given in ques-
tion 4 and conduct a simple pairwise comparison between the goals by the following
rule:
Give “0” if two goals are equally important.
Give “1” if the basic goal is slightly more important than the other
Give “3” if the basic goal is significantly more important than the other
Give “5” if the basic goal is extremely more important than the other
GOAL MATRIX
Rank 1 2 3 4
Basi
s goals
Rank title title title title
Rank 1 title give here your rate give here your rate give here your rate
Rank 2 title give here your rate give here your rate
Rank 3 title give here your rate
Rank 4 title
Q2.3: For the goals of the IMPROVEMENT OF FREIGHT TRANSPORT in the context of
rice industry in Mekong Delta, which impact of MEASURE is important than the oth-
ers? (Give your rank from the most important (1) to the least important (4). The same rank
can be given for both)
Impacts Rank
Reduction in the number of ton-km (TON.KM) Give here your rate
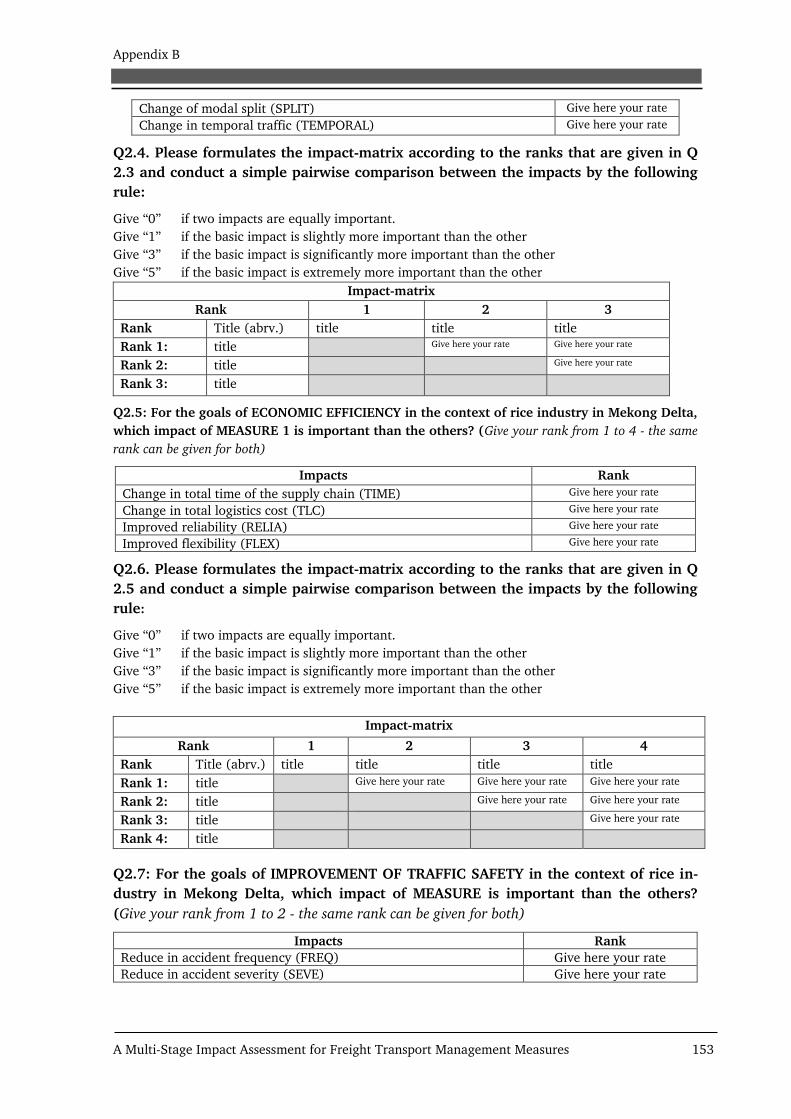
Appendix B
A Multi-Stage Impact Assessment for Freight Transport Management Measures 153
Change of modal split (SPLIT) Give here your rate
Change in temporal traffic (TEMPORAL) Give here your rate
Q2.4. Please formulates the impact-matrix according to the ranks that are given in Q
2.3 and conduct a simple pairwise comparison between the impacts by the following
rule:
Give “0” if two impacts are equally important.
Give “1” if the basic impact is slightly more important than the other
Give “3” if the basic impact is significantly more important than the other
Give “5” if the basic impact is extremely more important than the other
Impact-matrix
Rank 1 2 3
Rank Title (abrv.) title title title
Rank 1: title Give here your rate Give here your rate
Rank 2: title Give here your rate
Rank 3: title
Q2.5: For the goals of ECONOMIC EFFICIENCY in the context of rice industry in Mekong Delta,
which impact of MEASURE 1 is important than the others? (Give your rank from 1 to 4 - the same
rank can be given for both)
Impacts Rank
Change in total time of the supply chain (TIME) Give here your rate
Change in total logistics cost (TLC) Give here your rate
Improved reliability (RELIA) Give here your rate
Improved flexibility (FLEX) Give here your rate
Q2.6. Please formulates the impact-matrix according to the ranks that are given in Q
2.5 and conduct a simple pairwise comparison between the impacts by the following
rule:
Give “0” if two impacts are equally important.
Give “1” if the basic impact is slightly more important than the other
Give “3” if the basic impact is significantly more important than the other
Give “5” if the basic impact is extremely more important than the other
Impact-matrix
Rank 1 2 3 4
Rank Title (abrv.) title title title title
Rank 1: title Give here your rate Give here your rate Give here your rate
Rank 2: title Give here your rate Give here your rate
Rank 3: title Give here your rate
Rank 4: title
Q2.7: For the goals of IMPROVEMENT OF TRAFFIC SAFETY in the context of rice in-
dustry in Mekong Delta, which impact of MEASURE is important than the others?
(Give your rank from 1 to 2 - the same rank can be given for both)
Impacts Rank
Reduce in accident frequency (FREQ) Give here your rate
Reduce in accident severity (SEVE) Give here your rate

Appendix B
A Multi-Stage Impact Assessment for Freight Transport Management Measures 154
Q2.8. Please formulates the impact-matrix according to the ranks that are given in Q
2.7 and conduct a simple pairwise comparison between the impacts by the following
rule:
Give “0” if two impacts are equally important.
Give “1” if the basic impact is slightly more important than the other
Give “3” if the basic impact is significantly more important than the other
Give “5” if the basic impact is extremely more important than the other
Impact-matrix
Rank 1 2
Rank Title (abrv.) title title
Rank 1: title Give here your rate
Rank 2: title
Q2.9: For the goals of ENVIRONMENTAL IMPROVEMENT in the context of rice indus-
try in Mekong Delta, which impact of MEASURE is important than the others? (Give
your rank from 1 to 2 - the same rank can be given for both)
Impacts Rank
Reduction in air emission (EMISSION) Give here your rate
Reduction in total noise pollution (POLLUTION) Give here your rate
Q2.10. Please formulates the impact-matrix according to the ranks that are given in
Q2.9 and conduct a simple pairwise comparison between the impacts by the follow-
ing rule:
Give “0” if two impacts are equally important.
Give “1” if the basic impact is slightly more important than the other
Give “3” if the basic impact is significantly more important than the other
Give “5” if the basic impact is extremely more important than the other
Impact-matrix
Rank 1 2
Rank Title (abrv.) title title
Rank 1 title Give here your rate
Rank 2 title
PART 3: BARRIERS IN IMPLEMENTATION
Q3.1: In condition of Vietnam in general and in the rice industry in particular, how
do you rank the DIFFICULTIES in implementation of freight transport demand man-
agement measures? (From the most difficult (1) to the least difficult (4) - the same
rank can be given for different criteria)
Barriers Rank
Cost of measures (MCOST) Give here your rate
Public acceptance (ACCEPT) Give here your rate
Q3.2. Please formulates the criteria-matrix according to the ranks that are given in
question 3.1 and conduct a simple pairwise comparison between the criteria by the
following rule:
Give “0” if two criteria are equally difficult
Give “1” if the basic criterion is slightly more difficult than the other
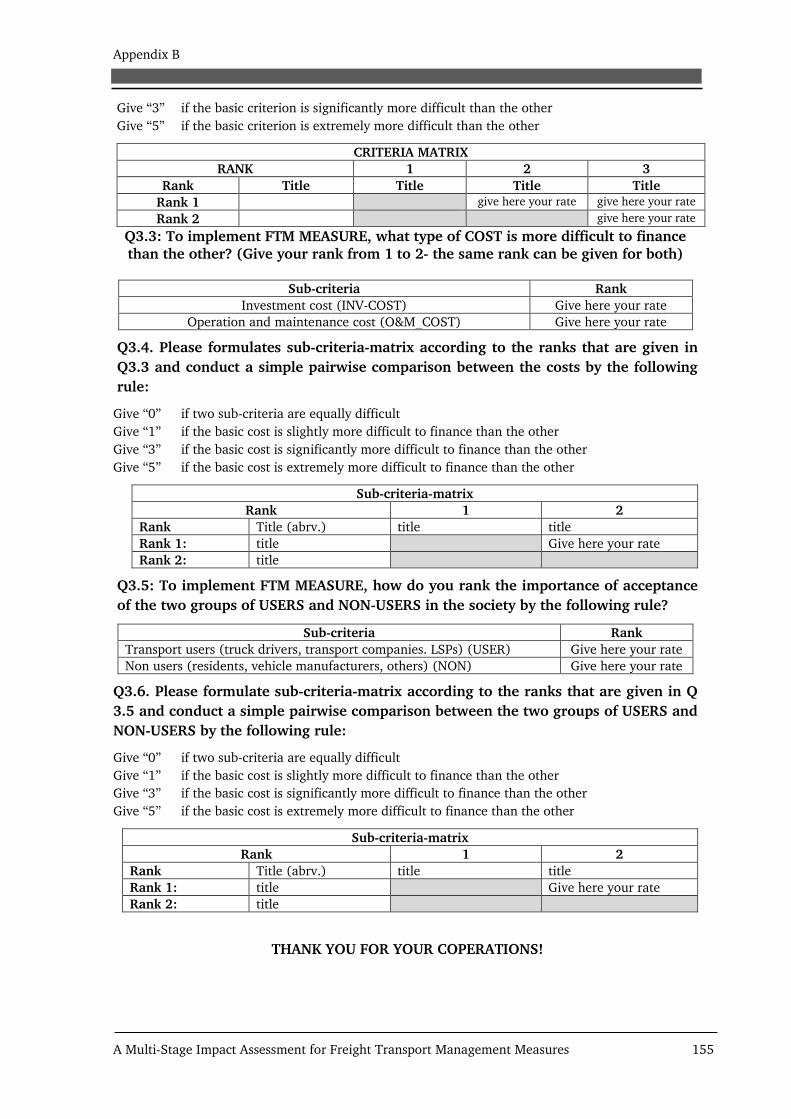
Appendix B
A Multi-Stage Impact Assessment for Freight Transport Management Measures 155
Give “3” if the basic criterion is significantly more difficult than the other
Give “5” if the basic criterion is extremely more difficult than the other
CRITERIA MATRIX
RANK 1 2 3
Rank Title Title Title Title
Rank 1 give here your rate give here your rate
Rank 2 give here your rate
Q3.3: To implement FTM MEASURE, what type of COST is more difficult to finance than the other? (Give your rank from 1 to 2- the same rank can be given for both)
Sub-criteria Rank
Investment cost (INV-COST) Give here your rate
Operation and maintenance cost (O&M_COST) Give here your rate
Q3.4. Please formulates sub-criteria-matrix according to the ranks that are given in
Q3.3 and conduct a simple pairwise comparison between the costs by the following
rule:
Give “0” if two sub-criteria are equally difficult
Give “1” if the basic cost is slightly more difficult to finance than the other
Give “3” if the basic cost is significantly more difficult to finance than the other
Give “5” if the basic cost is extremely more difficult to finance than the other
Sub-criteria-matrix
Rank 1 2
Rank Title (abrv.) title title
Rank 1: title Give here your rate
Rank 2: title
Q3.5: To implement FTM MEASURE, how do you rank the importance of acceptance
of the two groups of USERS and NON-USERS in the society by the following rule?
Sub-criteria Rank
Transport users (truck drivers, transport companies. LSPs) (USER) Give here your rate
Non users (residents, vehicle manufacturers, others) (NON) Give here your rate
Q3.6. Please formulate sub-criteria-matrix according to the ranks that are given in Q
3.5 and conduct a simple pairwise comparison between the two groups of USERS and
NON-USERS by the following rule:
Give “0” if two sub-criteria are equally difficult
Give “1” if the basic cost is slightly more difficult to finance than the other
Give “3” if the basic cost is significantly more difficult to finance than the other
Give “5” if the basic cost is extremely more difficult to finance than the other
Sub-criteria-matrix
Rank 1 2
Rank Title (abrv.) title title
Rank 1: title Give here your rate
Rank 2: title
THANK YOU FOR YOUR COPERATIONS!

Appendix B
A Multi-Stage Impact Assessment for Freight Transport Management Measures 156
B2. Calculating the weight of assessment criteria
The first respondent
PART 1: GENERAL INFORMATION
Record No: #1
Working organisation: VINALINE Can Tho
Experience: Forwarding and Logistics, LEAN management
Year of working: 10
PART 2: EFFECTIVENESS
Q2.1. Rank the goal
FT ECO SF EN
FT 1 5 5 1
ECO 1/5 1 3 3
SF 1/5 1/3 1 3
EN 1 1/3 1/3 1
Q2.4. Freight transport improvement
TRIP TON-KM SPLIT TEMPORAL
TRIP 1 1/5 1/7 1/3
TON-KM 5 1 1/5 1/5
SPLIT 7 5 1 1
TEMPORAL 7 5 1 1
Q2.6. Economic efficiency improvement
TIME TLC RELIA FLEX
TIME 1 1 3 5
TLC 1 1 5 3
RELIA 1/3 1/5 1 5
FLEX 1/5 1/3 1/5 1
Q2.8. Traffic safety improvement
FREQ SEVE
FREQ 1 3
SEVE 1/3 1
Q2.10. Environmental protection
EMISSION POLLUTION
EMISSION 1 1/3
POLLUTION 3 1
PART 3: BARRIERS
Q3.1. Rank the barriers
MCOST ACCEPT
MCOST 1 5
ACCEPT 1/5 1
Q3.4. Cost of measures
INV-COST O&M - COST
INV-COST 1 3
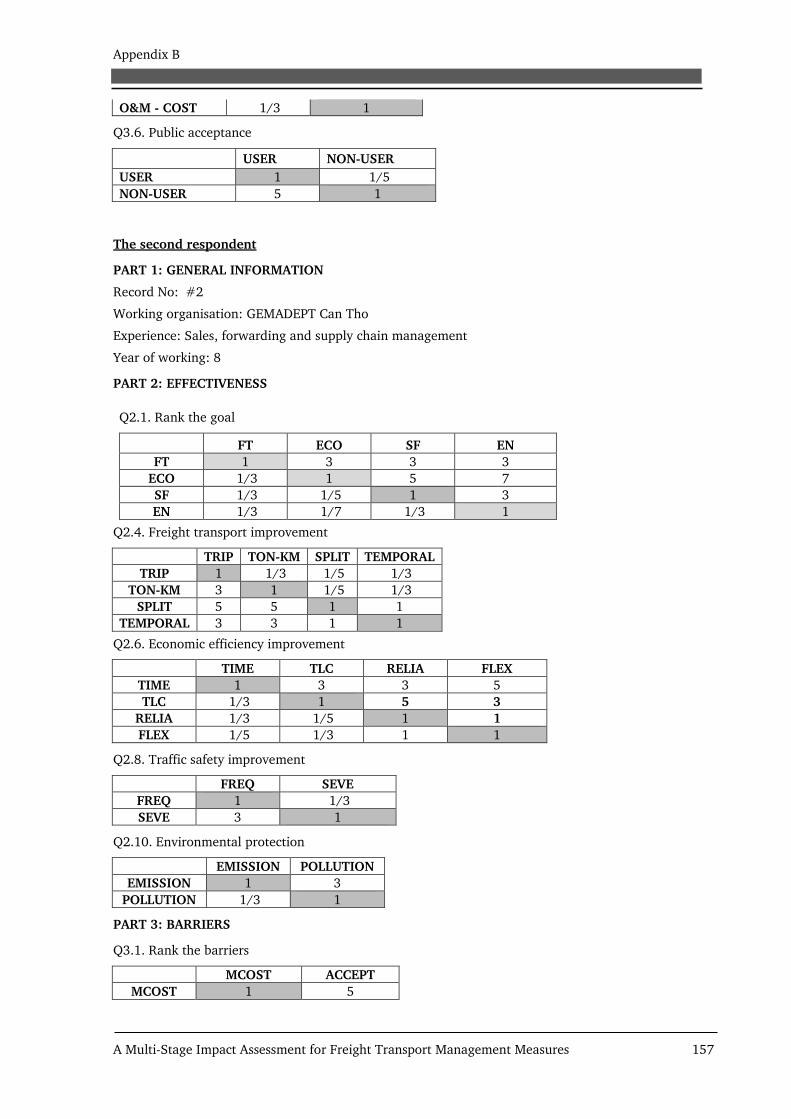
Appendix B
A Multi-Stage Impact Assessment for Freight Transport Management Measures 157
O&M - COST 1/3 1
Q3.6. Public acceptance
USER NON-USER
USER 1 1/5
NON-USER 5 1
The second respondent
PART 1: GENERAL INFORMATION
Record No: #2
Working organisation: GEMADEPT Can Tho
Experience: Sales, forwarding and supply chain management
Year of working: 8
PART 2: EFFECTIVENESS
Q2.1. Rank the goal
FT ECO SF EN
FT 1 3 3 3
ECO 1/3 1 5 7
SF 1/3 1/5 1 3
EN 1/3 1/7 1/3 1
Q2.4. Freight transport improvement
TRIP TON-KM SPLIT TEMPORAL
TRIP 1 1/3 1/5 1/3
TON-KM 3 1 1/5 1/3
SPLIT 5 5 1 1
TEMPORAL 3 3 1 1
Q2.6. Economic efficiency improvement
TIME TLC RELIA FLEX
TIME 1 3 3 5
TLC 1/3 1 5 3
RELIA 1/3 1/5 1 1
FLEX 1/5 1/3 1 1
Q2.8. Traffic safety improvement
FREQ SEVE
FREQ 1 1/3
SEVE 3 1
Q2.10. Environmental protection
EMISSION POLLUTION
EMISSION 1 3
POLLUTION 1/3 1
PART 3: BARRIERS
Q3.1. Rank the barriers
MCOST ACCEPT
MCOST 1 5
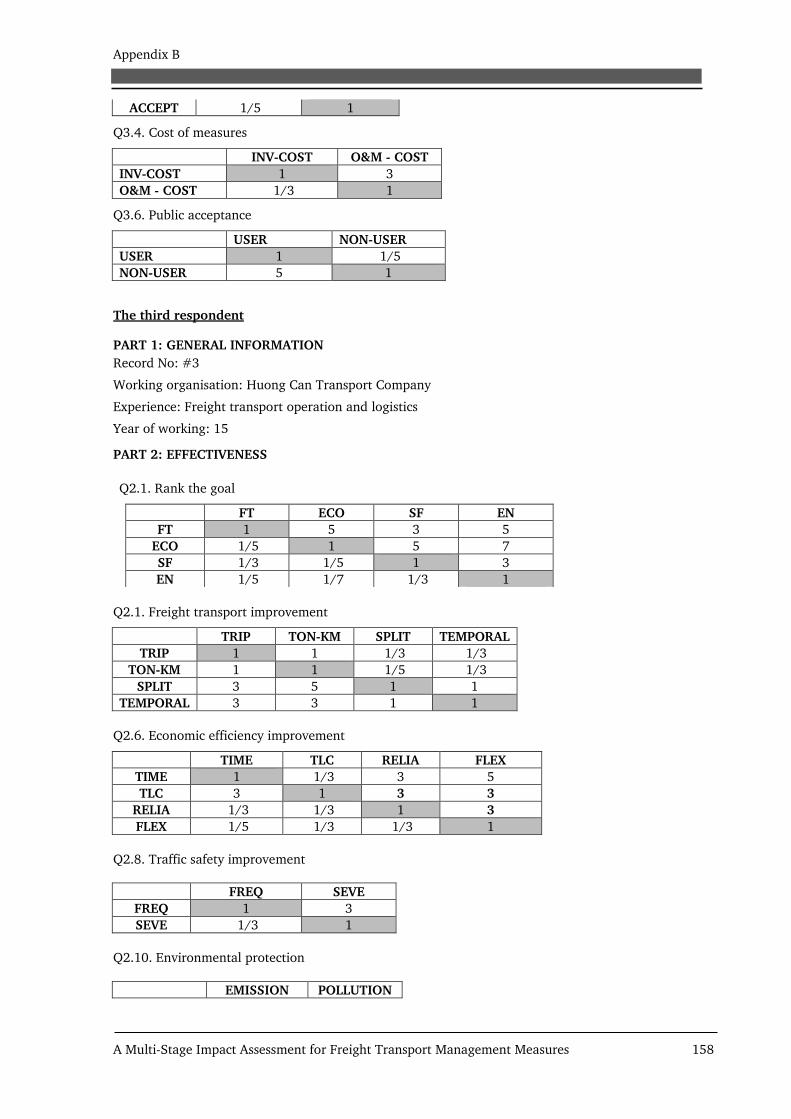
Appendix B
A Multi-Stage Impact Assessment for Freight Transport Management Measures 158
ACCEPT 1/5 1
Q3.4. Cost of measures
INV-COST O&M - COST
INV-COST 1 3
O&M - COST 1/3 1
Q3.6. Public acceptance
USER NON-USER
USER 1 1/5
NON-USER 5 1
The third respondent
PART 1: GENERAL INFORMATION
Record No: #3
Working organisation: Huong Can Transport Company
Experience: Freight transport operation and logistics
Year of working: 15
PART 2: EFFECTIVENESS
Q2.1. Rank the goal
FT ECO SF EN
FT 1 5 3 5
ECO 1/5 1 5 7
SF 1/3 1/5 1 3
EN 1/5 1/7 1/3 1
Q2.1. Freight transport improvement
TRIP TON-KM SPLIT TEMPORAL
TRIP 1 1 1/3 1/3
TON-KM 1 1 1/5 1/3
SPLIT 3 5 1 1
TEMPORAL 3 3 1 1
Q2.6. Economic efficiency improvement
TIME TLC RELIA FLEX
TIME 1 1/3 3 5
TLC 3 1 3 3
RELIA 1/3 1/3 1 3
FLEX 1/5 1/3 1/3 1
Q2.8. Traffic safety improvement
FREQ SEVE
FREQ 1 3
SEVE 1/3 1
Q2.10. Environmental protection
EMISSION POLLUTION
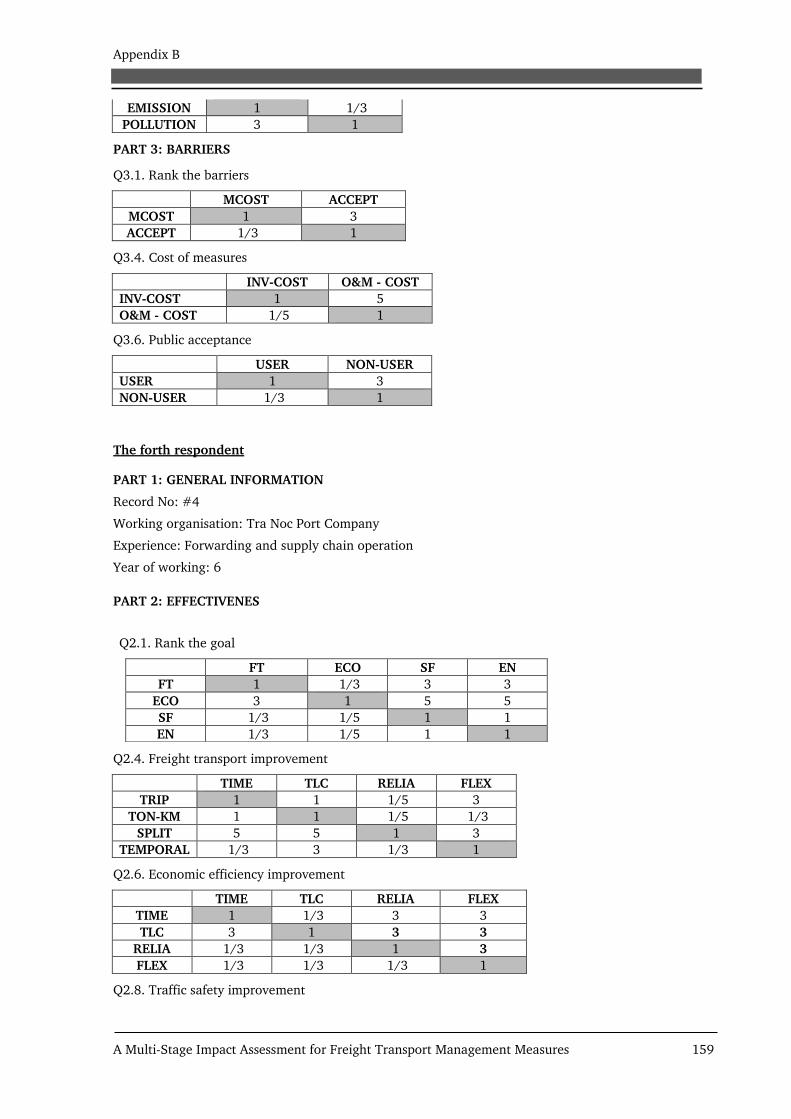
Appendix B
A Multi-Stage Impact Assessment for Freight Transport Management Measures 159
EMISSION 1 1/3
POLLUTION 3 1
PART 3: BARRIERS
Q3.1. Rank the barriers
MCOST ACCEPT
MCOST 1 3
ACCEPT 1/3 1
Q3.4. Cost of measures
INV-COST O&M - COST
INV-COST 1 5
O&M - COST 1/5 1
Q3.6. Public acceptance
USER NON-USER
USER 1 3
NON-USER 1/3 1
The forth respondent
PART 1: GENERAL INFORMATION
Record No: #4
Working organisation: Tra Noc Port Company
Experience: Forwarding and supply chain operation
Year of working: 6
PART 2: EFFECTIVENES
Q2.1. Rank the goal
FT ECO SF EN
FT 1 1/3 3 3
ECO 3 1 5 5
SF 1/3 1/5 1 1
EN 1/3 1/5 1 1
Q2.4. Freight transport improvement
TIME TLC RELIA FLEX
TRIP 1 1 1/5 3
TON-KM 1 1 1/5 1/3
SPLIT 5 5 1 3
TEMPORAL 1/3 3 1/3 1
Q2.6. Economic efficiency improvement
TIME TLC RELIA FLEX
TIME 1 1/3 3 3
TLC 3 1 3 3
RELIA 1/3 1/3 1 3
FLEX 1/3 1/3 1/3 1
Q2.8. Traffic safety improvement

Appendix B
A Multi-Stage Impact Assessment for Freight Transport Management Measures 160
FREQ SEVE
FREQ 1 5
SEVE 1/5 1
Q2.10. Environmental protection
EMISSION POLLUTION
EMISSION 1 1/3
POLLUTION 3 1
PART 3: BARRIERS
Q3.1. Rank the barriers
MCOST ACCEPT
MCOST 1 7
ACCEPT 1/7 1
Q3.4. Cost of measures
INV-COST O&M - COST
INV-COST 1 7
O&M - COST 1/7 1
Q3.6. Public acceptance
USER NON-USER
USER 1 1/5
NON-USER 5 1
The fifth respondent
PART 1: GENERAL INFORMATION
Record No: #5
Working organisation: VINALINES Can Tho
Experience: Logistics and industrial management, LEAN management
Year of working: 8
PART 2: EFFECTIVENESS
Q2.1. Rank the goal
FT ECO SF EN
FT 1 1 3 3
ECO 1 1 3 1/3
SF 1/3 1/3 1 1
EN 1/3 3 1 1
Q2.1. Freight transport improvement
TRIP TON-KM SPLIT TEMPORAL
TRIP 1 1 1/7 5
TON-KM 1 1 1/5 1/3
SPLIT 7 5 1 3
TEMPORAL 1/5 3 1/3 1
Q2.6. Economic efficiency improvement
TIME TLC RELIA FLEX

Appendix B
A Multi-Stage Impact Assessment for Freight Transport Management Measures 161
TIME 1 1/5 3 5
TLC 5 1 5 3
RELIA 1/3 1/5 1 3
FLEX 1/5 1/3 1/3 1
Q2.8. Traffic safety improvement
FREQ SEVE
FREQ 1 1
SEVE 1 1
Q2.10. Environmental protection
EMISSION POLLUTION
EMISSION 1 1/7
POLLUTION 7 1
PART 3: BARRIERS
Q3.1. Rank the barriers
MCOST ACCEPT
MCOST 1 1/3
ACCEPT 3 1
Q3.4. Cost of measures
INV-COST O&M - COST
INV-COST 1 3
O&M - COST 1/3 1
Q3.6. Public acceptance
USER NON-USER
USER 1 5
NON-USER 1/5 1
The sixth respondent
PART 1: GENERAL INFORMATION
Record No: #6
Working organisation: My Thoi Port Enterprise
Experience: Freight transport and logistics
Year of working: 10
PART 2: EFFECTIVENESS
Q2.1. Rank the goal
FT ECO SF EN
FT 1 1/5 5 3
ECO 5 1 3 1/3
SF 1/5 1/3 1 1
EN 1/3 3 1 1
Q2.4. Freight transport improvement
TRIP TON-KM SPLIT TEMPORAL

Appendix B
A Multi-Stage Impact Assessment for Freight Transport Management Measures 162
TRIP 1 1 1/7 3
TON-KM 1 1 1/5 1/3
SPLIT 7 5 1 3
TEMPORAL 1/3 3 1/3 1
Q2.6. Economic efficiency improvement
TIME TLC RELIA FLEX
TIME 1 1/3 3 3
TLC 3 1 5 3
RELIA 1/3 1/5 1 1
FLEX 1/3 1/3 1 1
Q2.8. Traffic safety improvement
FREQ SEVE
FREQ 1 3
SEVE 1/3 1
Q2.10. Environmental protection
EMISSION POLLUTION
EMISSION 1 1
POLLUTION 1 1
PART 3: BARRIERS
Q3.1. Rank the barriers
MCOST ACCEPT
MCOST 1 3
ACCEPT 1/3 1
Q3.4. Cost of measures
INV-COST O&M - COST
INV-COST 1 1
O&M - COST 1 1
Q3.6. Public acceptance
USER NON-USER
USER 1 1/5
NON-USER 5 1
The seventh respondent
PART 1: GENERAL INFORMATION
Record No: #7
Working organisation: HCMC University of Technology
Experience: Road freight transport, logistics and industrial management
Year of working: 10
PART 2: EFFECTIVENESS
Q2.1. Rank the goal

Appendix B
A Multi-Stage Impact Assessment for Freight Transport Management Measures 163
FT ECO SF EN
FT 1 1/3 3 3
ECO 3 1 3 1/3
SF 1/3 1/3 1 1
EN 1/3 3 1 1
Q2.4. Freight transport improvement
TRIP TON-KM SPLIT TEMPORAL
TRIP 1 1/3 1/5 1
TON-KM 3 1 1/5 1/3
SPLIT 5 5 1 3
TEMPORAL 1 3 1/3 1
Q2.6. Economic efficiency improvement
TIME TLC RELIA FLEX
TIME 1 1/5 3 3
TLC 5 1 5 3
RELIA 1/3 1/5 1 1
FLEX 1/3 1/3 1 1
Q2.8. Traffic safety improvement
FREQ SEVE
FREQ 1 1/5
SEVE 5 1
Q2.10. Environmental protection
EMISSION POLLUTION
EMISSION 1 3
POLLUTION 1/3 1
PART 3: BARRIERS
Q3.1. Rank the barriers
MCOST ACCEPT
MCOST 1 5
ACCEPT 1/5 1
Q3.4. Cost of measures
INV-COST O&M - COST
INV-COST 1 5
O&M - COST 1/5 1
Q3.6. Public acceptance
USER NON-USER
USER 1 1
NON-USER 1 1
The eighth respondent
PART 1: GENERAL INFORMATION
Record No: #8
Working organisation: University of Transport and Communication
Experience: Maritime transport and logistics

Appendix B
A Multi-Stage Impact Assessment for Freight Transport Management Measures 164
Year of working: 12
PART 2: EFFECTIVENESS
Q2.1. Rank the goal
FT ECO SF EN
FT 1 1 5 3
ECO 1 1 3 1/3
SF 1/5 1/3 1 1
EN 1/3 3 1 1
Q2.4. Freight transport improvement
TRIP TON-KM SPLIT TEMPORAL
TRIP 1 1/3 1/7 1
TON-KM 3 1 1/5 1/3
SPLIT 7 5 1 3
TEMPORAL 1 3 1/3 1
Q2.6. Economic efficiency improvement
TIME TLC RELIA FLEX
TIME 1 1/3 3 3
TLC 3 1 5 3
RELIA 1/3 1/5 1 1
FLEX 1/3 1/3 1 1
Q2.8. Traffic safety improvement
FREQ SEVE
FREQ 1 7
SEVE 1/7 1
Q2.10. Environmental protection
EMISSION POLLUTION
EMISSION 1 1
POLLUTION 1 1
PART 3: BARRIERS
Q3.1. Rank the barriers
MCOST ACCEPT
MCOST 1 5
ACCEPT 1/5 1
Q3.4. Cost of measures
INV-COST O&M - COST
INV-COST 1 5
O&M - COST 1/5 1
Q3.6. Public acceptance
USER NON-USER
USER 1 1
NON-USER 1 1

Appendix B
A Multi-Stage Impact Assessment for Freight Transport Management Measures 165
The ninth respondent
PART 1: GENERAL INFORMATION
Record No: 9
Working organisation: University of Transport and Communication
Experience: Logistics and supply chain management
Year of working: 10
PART 2: EFFECTIVENESS
Q2.1. Rank the goal
FT ECO SF EN
FT 1 3 3 5
ECO 1/3 1 5 3
SF 1/3 1/5 1 1
EN 1/5 1/3 1 1
Q2.4. Freight transport improvement
TRIP TON-KM SPLIT TEMPORAL
TRIP 1 1 3 5
TON-KM 1 1 1/5 1/3
SPLIT 1/3 5 1 3
TEMPORAL 1/5 3 1/3 1
Q2.6. Economic efficiency improvement
TIME TLC RELIA FLEX
TIME 1 1/3 3 3
TLC 3 1 5 3
RELIA 1/3 1/5 1 1
FLEX 1/3 1/3 1 1
Q2.8. Traffic safety improvement
FREQ SEVE
FREQ 1 1
SEVE 1 1
Q2.10. Environmental protection
EMISSION POLLUTION
EMISSION 1 1
POLLUTION 1 1
PART 3: BARRIERS
Q3.1. Rank the barriers
MCOST ACCEPT
MCOST 1 3
ACCEPT 1/3 1
Q3.4. Cost of measures
INV-COST O&M - COST
INV-COST 1 3
O&M - COST 1/3 1
Q3.6. Public acceptance

Appendix B
A Multi-Stage Impact Assessment for Freight Transport Management Measures 166
USER NON-USER
USER 1 1/3
NON-USER 3 1
The tenth respondent
PART 1: GENERAL INFORMATION
Record No: #10
Working organisation: Indochina Logistics Corporation
Experience: Forwarding and logistics, supply chain organisation
Year of working: 10
PART 2: EFFECTIVENESS
Q2.1. Rank the goal
FT ECO SF EN
FT 1 1/3 5 7
ECO 3 1 7 7
SF 1/5 1/7 1 3
EN 1/7 1/7 1/3 1
Q2.4. Freight transport improvement
TRIP TON-KM SPLIT TEMPORAL
TRIP 1 3 1/5 1/3
TON-KM 1/3 1 1/5 1/3
SPLIT 5 3 1 3
TEMPORAL 3 3 1/3 1
Q2.6. Economic efficiency improvement
TIME TLC RELIA FLEX
TIME 1 1/5 1/5 1/3
TLC 5 1 5 3
RELIA 5 1/5 1 1
FLEX 3 1/3 1 1
Q2.8. Traffic safety improvement
FREQ SEVE
FREQ 1 1/5
SEVE 5 1
Q2.10. Environmental protection
EMISSION POLLUTION
EMISSION 1 1/3
POLLUTION 3 1
PART 3: BARRIERS
Q3.1. Rank the barriers
MCOST ACCEPT
MCOST 1 1
ACCEPT 1 1
Q3.4. Cost of measures

Appendix B
A Multi-Stage Impact Assessment for Freight Transport Management Measures 167
INV-COST O&M - COST
INV-COST 1 5
O&M - COST 1/5 1
Q3.6. Public acceptance
USER NON-USER
USER 1 1/3
NON-USER 3 1
The eleventh respondent
PART 1: GENERAL INFORMATION
Record No: 11
Working organisation: Song Hau Food Company
Experience: Rice procurement and distribution
Year of working: 18
PART 2: EFFECTIVENESS
Q2.1. Rank the goal
FT ECO SF EN
FT 1 1 3 5
ECO 1 1 3 5
SF 1/3 1/3 1 3
EN 1/5 1/5 1/3 1
Q2.4. Freight transport improvement
TRIP TON-KM SPLIT TEMPORAL
TRIP 1 3 1/3 5
TON-KM 1/3 1 1/5 1/3
SPLIT 3 1/5 1 3
TEMPORAL 1/5 3 1/3 1
Q2.6. Economic efficiency improvement
TIME TLC RELIA FLEX
TIME 1 1/3 1/3 1/5
TLC 3 1 5 3
RELIA 3 1/5 1 3
FLEX 1/5 1/3 1/3 1
Q2.8. Traffic safety improvement
FREQ SEVE
FREQ 1 3
SEVE 1/3 1
Q2.10. Environmental protection
EMISSION POLLUTION
EMISSION 1 1
POLLUTION 3 1
PART 3: BARRIERS
Q3.1. Rank the barriers

Appendix B
A Multi-Stage Impact Assessment for Freight Transport Management Measures 168
MCOST ACCEPT
MCOST 1 3
ACCEPT 1/3 1
Q3.4. Cost of measures
INV-COST O&M - COST
INV-COST 1 5
O&M - COST 1/5 1
Q3.6. Public acceptance
USER NON-USER
USER 1 1/3
NON-USER 3 1
The twelfth respondent
PART 1: GENERAL INFORMATION
Record No: #12
Working organisation: An Giang Food Company
Experience: Rice supply chain management
Year of working: 10
PART 2: EFFECTIVENESS
Q2.1. Rank the goal
FT ECO SF EN
FT 1 3 3 5
ECO 1/3 1 3 5
SF 1/3 1/3 1 3
EN 1/5 1/5 1/3 1
Q2.4. Freight transport improvement
TRIP TON-KM SPLIT TEMPORAL
TRIP 1 1/5 1/3 3
TON-KM 5 1 1/5 1/3
SPLIT 3 5 1 3
TEMPORAL 1/3 3 1/3 1
Q2.6. Economic efficiency improvement
TIME TLC RELIA FLEX
TIME 1 1/5 1/3 1/5
TLC 5 1 3 3
RELIA 3 1/3 1 3
FLEX 5 1/3 1/3 1
Q2.8. Traffic safety improvement
FREQ SEVE
FREQ 1 5
SEVE 1/5 1
Q2.10. Environmental protection

Appendix B
A Multi-Stage Impact Assessment for Freight Transport Management Measures 169
EMISSION POLLUTION
EMISSION 1 1
POLLUTION 1 1
PART 3: BARRIERS
Q3.1. Rank the barriers
MCOST ACCEPT
MCOST 1 5
ACCEPT 1/5 1
Q3.4. Cost of measures
INV-COST O&M - COST
INV-COST 1 5
O&M - COST 1/5 1
Q3.6. Public acceptance
USER NON-USER
USER 1 1/7
NON-USER 7 1
The thirteenth respondent
PART 1: GENERAL INFORMATION
Record No: #13
Working organisation: Thanh Tin Food Company-Soc Trang province
Experience: Rice production and distribution
Year of working: 10
PART 2: EFFECTIVENESS
Q2.1. Rank the goal
FT ECO SF EN
FT 1 1/5 3 5
ECO 5 1 5 7
SF 1/3 1/5 1 3
EN 1/5 1/7 1/3 1
Q2.4. Freight transport improvement
TRIP TON-KM SPLIT TEMPORAL
TRIP 1 1 3 3
TON-KM 1 1 1/5 3
SPLIT 1/3 1/5 1 3
TEMPORAL 1/3 1/3 1/3 1
Q2.6. Economic efficiency improvement
TIME TLC RELIA FLEX
TIME 1 3 3 5
TLC 1/3 1 3 3
RELIA 1/3 1/3 1 3
FLEX 1/5 1/3 1/3 1
Q2.8. Traffic safety improvement

Appendix B
A Multi-Stage Impact Assessment for Freight Transport Management Measures 170
FREQ SEVE
FREQ 1 1/7
SEVE 7 1
Q2.10. Environmental protection
EMISSION POLLUTION
EMISSION 1 1
POLLUTION 1 1
PART 3: BARRIERS
Q3.1. Rank the barriers
MCOST ACCEPT
MCOST 1 3
ACCEPT 1/3 1
Q3.4. Cost of measures
INV-COST O&M - COST
INV-COST 1 5
O&M - COST 1/5 1
Q3.6. Public acceptance
USER NON-USER
USER 1 3
NON-USER 1/3 1
The fourteenth respondent
PART 1: GENERAL INFORMATION
Record No: #14
Working organisation: Soc Trang Food Company
Experience: Rice procurement and distribution
Year of working: 14
PART 2: EFFECTIVENESS
Q2.1. Rank the goal
FT ECO SF EN
FT 1 3 3 5
ECO 1/3 1 3 5
SF 1/3 1/3 1 1
EN 1/5 1/5 1 1
Q2.1. Freight transport improvement
TRIP TON-KM SPLIT TEMPORAL
TRIP 1 1 1/5 1/3
TON-KM 1 1 1/5 1/3
SPLIT 5 5 1 3
TEMPORAL 3 3 1/3 1
Q2.6. Economic efficiency improvement

Appendix B
A Multi-Stage Impact Assessment for Freight Transport Management Measures 171
TIME TLC RELIA FLEX
TIME 1 1 3 5
TLC 1 1 3 3
RELIA 1/3 1/3 1 3
FLEX 1/5 1/3 1/3 1
Q2.8. Traffic safety improvement
FREQ SEVE
FREQ 1 1
SEVE 1 1
Q2.10. Environmental protection
EMISSION POLLUTION
EMISSION 1 3
POLLUTION 1/3 1
PART 3: BARRIERS
Q3.1. Rank the barriers
MCOST ACCEPT
MCOST 1 1/3
ACCEPT 3 1
Q3.4. Cost of measures
INV-COST O&M - COST
INV-COST 1 3
O&M - COST 1/3 1
Q3.6. Public acceptance
USER NON-USER
USER 1 1/3
NON-USER 3 1
The fifteenth respondent
PART 1: GENERAL INFORMATION
Record No: #15
Working organisation: Chi Cong Food Processing Enterprise
Experience: Logistics and industrial management, LEAN management
Year of working: 10
PART 2: EFFECTIVENESS
Q2.1. Rank the goal
FT ECO SF EN
FT 1 3 3 5
ECO 1/3 1 3 5
SF 1/3 1/3 1 1
EN 1/5 1/5 1 1
Q2.1. Freight transport improvement

Appendix B
A Multi-Stage Impact Assessment for Freight Transport Management Measures 172
TRIP TON-KM SPLIT TEMPORAL
TRIP 1 1 1/5 1/3
TON-KM 1 1 1/5 1/3
SPLIT 5 5 1 3
TEMPORAL 3 3 1/3 1
Q2.6. Economic efficiency improvement
TIME TLC RELIA FLEX
TIME 1 1 3 5
TLC 1 1 3 3
RELIA 1/3 1/3 1 3
FLEX 1/5 1/3 1/3 1
Q2.8. Traffic safety improvement
FREQ SEVE
FREQ 1 1
SEVE 1 1
Q2.10. Environmental protection
EMISSION POLLUTION
EMISSION 1 3
POLLUTION 1/3 1
PART 3: BARRIERS
Q3.1. Rank the barriers
MCOST ACCEPT
MCOST 1 1/3
ACCEPT 3 1
Q3.4. Cost of measures
INV-COST O&M - COST
INV-COST 1 3
O&M - COST 1/3 1
Q3.6. Public acceptance
USER NON-USER
USER 1 1/3
NON-USER 3 1
The sixteenth respondent
PART 1: GENERAL INFORMATION
Record No: #16
Working organisation: HCMC Department of Transport
Experience: Traffic management
Year of working: 7
PART 2: EFFECTIVENESS
Q2.1. Rank the goal
FT ECO SF EN
FT 1 7 5 3
ECO 1/7 1 5 7

Appendix B
A Multi-Stage Impact Assessment for Freight Transport Management Measures 173
SF 1/5 1/5 1 3
EN 1/3 1/7 1/3 1
Q2.4. Freight transport improvement
TRIP TON-KM SPLIT TEMPORAL
TRIP 1 3 3 3
TON-KM 1/3 1 5 7
SPLIT 1/3 1/5 1 5
TEMPORAL 1/3 1/7 1/5 1
Q2.6. Economic efficiency improvement
TIME TLC RELIA FLEX
TIME 1 1/5 5 1/3
TLC 5 1 5 3
RELIA 1/5 1/5 1 7
FLEX 3 1/3 1/7 1
Q2.8. Traffic safety improvement
FREQ SEVE
FREQ 1 7
SEVE 1/7 1
Q2.10. Environmental protection
EMISSION POLLUTION
EMISSION 1 3
POLLUTION 1/3 1
PART 3: BARRIERS
Q3.1. Rank the barriers
MCOST ACCEPT
MCOST 1 1/3
ACCEPT 3 1
Q3.4. Cost of measures
INV-COST O&M - COST
INV-COST 1 3
O&M - COST 1/3 1
Q3.6. Public acceptance
USER NON-USER
USER 1 1/3
NON-USER 3 1
The seventeenth respondent
PART 1: GENERAL INFORMATION
Record No: #17
Working organisation: HCMC University of Technology
Experience: Traffic Engineering and transport planning
Year of working: 13
PART 2: EFFECTIVENESS

Appendix B
A Multi-Stage Impact Assessment for Freight Transport Management Measures 174
Q2.1. Rank the goal
FT ECO SF EN
FT 1 3 3 3
ECO 1/3 1 5 5
SF 1/3 1/5 1 1
EN 1/3 1/5 1 1
Q2.4. Freight transport improvement
TRIP TON-KM SPLIT TEMPORAL
TRIP 1 1 1/3 3
TON-KM 1 1 1/5 1/3
SPLIT 3 5 1 5
TEMPORAL 1/3 3 1/5 1
Q2.6. Economic efficiency improvement
TIME TLC RELIA FLEX
TIME 1 1/7 5 5
TLC 7 1 5 5
RELIA 1/5 1/5 1 1/5
FLEX 1/5 1/5 5 1
Q2.8. Traffic safety improvement
FREQ SEVE
FREQ 1 1
SEVE 1 1
Q2.10. Environmental protection
EMISSION POLLUTION
EMISSION 1 5
POLLUTION 1/5 1
PART 3: BARRIERS
Q3.1. Rank the barriers
MCOST ACCEPT
MCOST 1 3
ACCEPT 1/3 1
Q3.4. Cost of measures
INV-COST O&M - COST
INV-COST 1 3
O&M - COST 1/3 1
Q3.6. Public acceptance
USER NON-USER
USER 1 5
NON-USER 1/5 1
The eighteenth respondent
PART 1: GENERAL INFORMATION
Record No: #19
Working organisation: An Giang Port Company

Appendix B
A Multi-Stage Impact Assessment for Freight Transport Management Measures 175
Experience: Maritime transport management
Year of working: 15
PART 2: EFFECTIVENESS
Q2.1. Rank the goal
FT E O SF EN
FT 1 5 /3 1/5
ECO 1/5 1 1/5 1/5
SF 3 5 1 1
EN 5 5 1 1
Q2.4. Freight transport improvement
TRIP TON-KM SPLIT TEMPORAL
TRIP 1 3 3 3
TON-KM 1/3 1 5 3
SPLIT 1/3 1/5 1 7
TEMPORAL 1/3 1/3 1/7 1
Q2.6. Economic efficiency improvement
TIME TLC RELIA FLEX
TIME 1 1/3 1/3 1/3
TLC 3 1 3 5
RELIA 3 1/3 1 3
FLEX 3 1/5 1/3 1
Q2.8. Traffic safety improvement
FREQ SEVE
FREQ 1 1/5
SEVE 5 1
Q2.10. Environmental protection
EMISSION POLLUTION
EMISSION 1 1/3
POLLUTION 3 1
PART 3: BARRIERS
Q3.1. Rank the barriers
MCOST ACCEPT
MCOST 1 1
ACCEPT 1 1
Q3.4. Cost of measures
INV-COST O&M - COST
INV-COST 1 1
O&M - COST 1 1
Q3.6. Public acceptance
USER NON-USER
USER 1 1/3
NON-USER 3 1

Appendix B
A Multi-Stage Impact Assessment for Freight Transport Management Measures 176
The nineteenth respondent
PART 1: GENERAL INFORMATION
Record No: #19
Working organisation: Can Tho Department of Transport
Experience: Traffic and transport management
Year of working: 10
PART 2: EFFECTIVENESS
Q2.1. Rank the goal
FT ECO SF EN
FT 1 1 3 7
ECO 1 1 5 5
SF 1/3 1/5 1 1/3
EN 1/7 1/5 3 1
Q2.4. Freight transport improvement
TRIP TON-KM SPLIT TEMPORAL
TRIP 1 1/3 1/5 1
TON-KM 3 1 1/5 1/3
SPLIT 5 5 1 1
TEMPORAL 1 3 1 1
Q2.6. Economic efficiency improvement
TIME TLC RELIA FLEX
TIME 1 1/3 3 3
TLC 3 1 5 7
RELIA 1/3 1/5 1 1
FLEX 1/3 1/7 1 1
Q2.8. Traffic safety improvement
FREQ SEVE
FREQ 1 3
SEVE 1/3 1
Q2.10. Environmental protection
EMISSION POLLUTION
EMISSION 1 5
POLLUTION 1/5 1
PART 3: BARRIERS
Q3.1. Rank the barriers
MCOST ACCEPT
MCOST 1 7
ACCEPT 1/7 1
Q3.4. Cost of measures
INV-COST O&M - COST
INV-COST 1 5
O&M - COST 1/5 1
Q3.6. Public acceptance
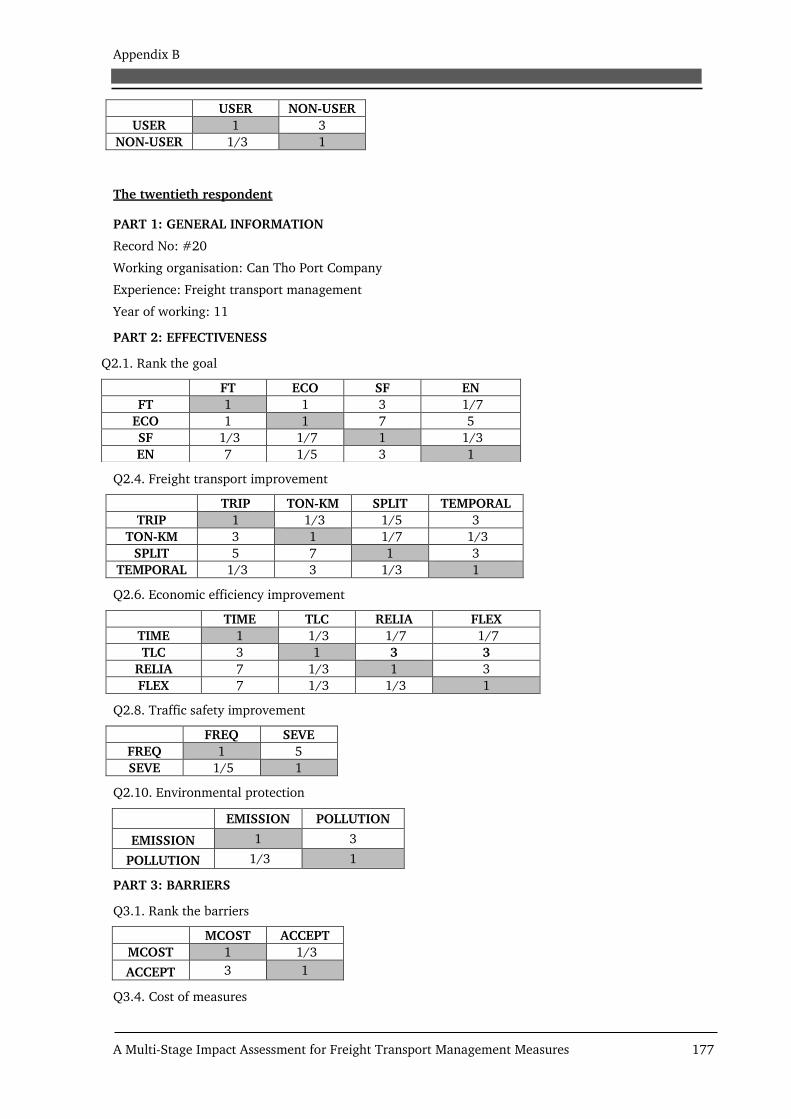
Appendix B
A Multi-Stage Impact Assessment for Freight Transport Management Measures 177
USER NON-USER
USER 1 3
NON-USER 1/3 1
The twentieth respondent
PART 1: GENERAL INFORMATION
Record No: #20
Working organisation: Can Tho Port Company
Experience: Freight transport management
Year of working: 11
PART 2: EFFECTIVENESS
Q2.1. Rank the goal
FT ECO SF EN
FT 1 1 3 1/7
ECO 1 1 7 5
SF 1/3 1/7 1 1/3
EN 7 1/5 3 1
Q2.4. Freight transport improvement
TRIP TON-KM SPLIT TEMPORAL
TRIP 1 1/3 1/5 3
TON-KM 3 1 1/7 1/3
SPLIT 5 7 1 3
TEMPORAL 1/3 3 1/3 1
Q2.6. Economic efficiency improvement
TIME TLC RELIA FLEX
TIME 1 1/3 1/7 1/7
TLC 3 1 3 3
RELIA 7 1/3 1 3
FLEX 7 1/3 1/3 1
Q2.8. Traffic safety improvement
FREQ SEVE
FREQ 1 5
SEVE 1/5 1
Q2.10. Environmental protection
EMISSION POLLUTION
EMISSION 1 3
POLLUTION 1/3 1
PART 3: BARRIERS
Q3.1. Rank the barriers
MCOST ACCEPT
MCOST 1 1/3
ACCEPT 3 1
Q3.4. Cost of measures

Appendix B
A Multi-Stage Impact Assessment for Freight Transport Management Measures 178
INV-COST O&M - COST
INV-COST 1 1/5
O&M - COST 5 1
Q3.6. Public acceptance
USER NON-USER
USER 1 1/3
NON-USER 3 1

Appendix C
179
Appendix C. Key sources of rice in the Mekong Delta
C1. List of key sources of rice in the Mekong Delta
No Key rice sources in the Me-
kong Delta (2010)
Average rice
handling vol-
ume per year
(ton)
Commune/
Ward
District/
City Province
1 Food Processing Enterprise
(FPE) No1 150,000 Ward 5 Tan An Long An
2 FPE No2 140,000 Thach Hoa Thach Hoa Long An
3 Tan Thanh FPE 120,000 Tan Thach Tan Thanh Long An
4 Cau Tre FPE 90,000 Loi Binh
Nhon Tan An Long An
5 Vinh Hung FPE 100,000 Vinh Hung Vinh Hung Long An
6 Long An Foodstuff Enterprise 220,000 Ward 3 Tan An Long An
7 Phu Cuong Agricultural
products center 80,000
Commune
5A Cai Lay Tien Giang
8 FPE No 2 85,000 Binh Duc Chau
Thanh Tien Giang
9 FPE No 3 75,000 Hau Bac My
A Cai Be Tien Giang
10 FPE No 4 65,000 Phu An Cai Lay Tien Giang
11 Viet Nguyen FPE 80,000 Binh Duc Chau
Thanh Tien Giang
12 My Phuoc Warehouse 50,000 Tan Phuoc Tan Phuoc Tien Giang
13 Convenience store system 30,000 Châu
Thành Tien Giang
14 My Loi B Warehouse 45,000 My Loi Cai Be Tien Giang
15 FPE No1 50,000 Binh Thanh Giong Tom Ben Tre
16 Cho Thom FPE 60,000 Thanh Thoi
B
Mo Cay
Nam Ben Tre
17 Vinh Long Food Co. 170,000 Hung Dao
Vuong Vinh Long Vinh Long
18 FPE No 1 150,000 QL 80 Sa Dec Dong Thap
19 FPE No 2 140,000 QL30 Cao Lanh Dong Thap
20 Tam Nong FPE 160,000 An Long Tam Nong Dong Thap
21 DOCIMEXCO JSC 240,000 Phuong 1 Cao Lanh Dong Thap
22 Long Xuyen FPE 120,000 My Thanh Long Xuyên An Giang
23 Chau Phu FPE 80,000 Vinh Thanh
Chung Châu Phú An Giang
24 Binh Khanh FPE 75,000 Phan Boi
Chau Long Xuyen An Giang
25 An Giang Import-Export Co-
Agrimex 350,000 Ngo Gia Tu Long Xuyen An Giang
26
An Giang Agriculture and
foods import & export joint
stock company- Afiex
150,000 My Thoi Long Xuyen An Giang
27 Hoa Binh FPE 70,000 Hoa Binh Chợ Mới An Giang
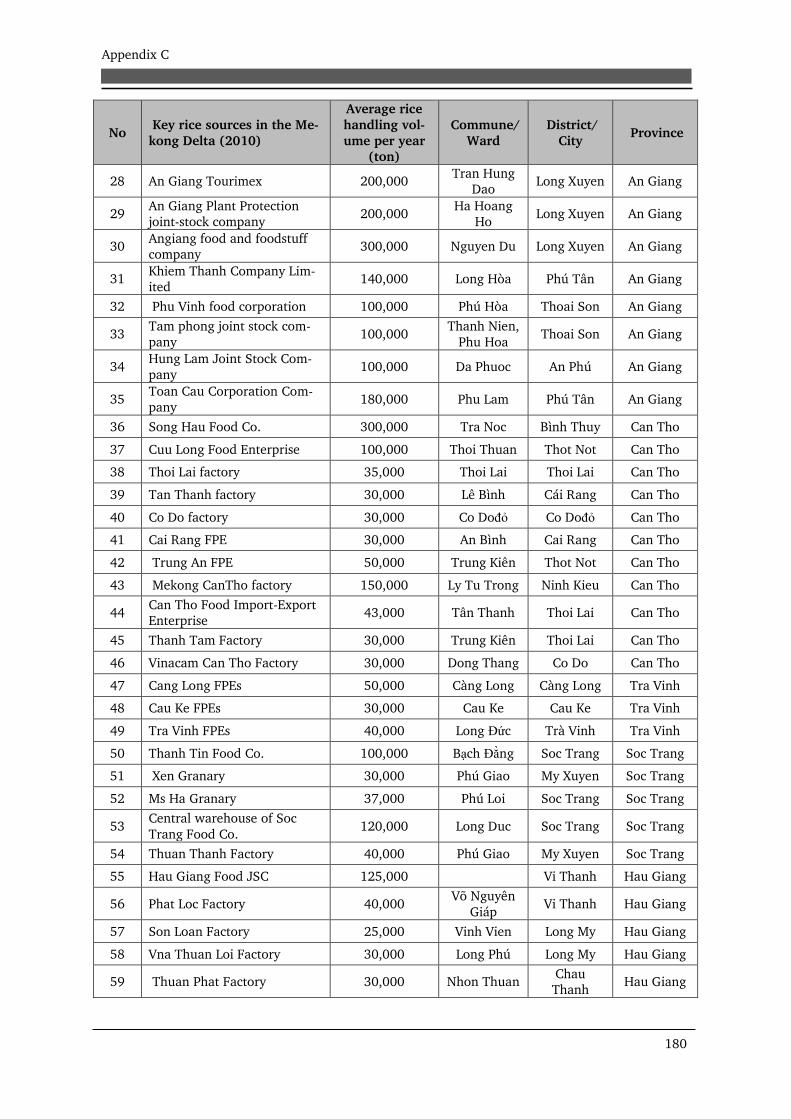
Appendix C
180
No Key rice sources in the Me-
kong Delta (2010)
Average rice
handling vol-
ume per year (ton)
Commune/
Ward
District/
City Province
28 An Giang Tourimex 200,000 Tran Hung
Dao Long Xuyen An Giang
29 An Giang Plant Protection joint-stock company
200,000 Ha Hoang
Ho Long Xuyen An Giang
30 Angiang food and foodstuff company
300,000 Nguyen Du Long Xuyen An Giang
31 Khiem Thanh Company Lim-ited
140,000 Long Hòa Phú Tân An Giang
32 Phu Vinh food corporation 100,000 Phú Hòa Thoai Son An Giang
33 Tam phong joint stock com-
pany 100,000
Thanh Nien,
Phu Hoa Thoai Son An Giang
34 Hung Lam Joint Stock Com-
pany 100,000 Da Phuoc An Phú An Giang
35 Toan Cau Corporation Com-
pany 180,000 Phu Lam Phú Tân An Giang
36 Song Hau Food Co. 300,000 Tra Noc Bình Thuy Can Tho
37 Cuu Long Food Enterprise 100,000 Thoi Thuan Thot Not Can Tho
38 Thoi Lai factory 35,000 Thoi Lai Thoi Lai Can Tho
39 Tan Thanh factory 30,000 Lê Bình Cái Rang Can Tho
40 Co Do factory 30,000 Co Dođỏ Co Dođỏ Can Tho
41 Cai Rang FPE 30,000 An Bình Cai Rang Can Tho
42 Trung An FPE 50,000 Trung Kiên Thot Not Can Tho
43 Mekong CanTho factory 150,000 Ly Tu Trong Ninh Kieu Can Tho
44 Can Tho Food Import-Export Enterprise
43,000 Tân Thanh Thoi Lai Can Tho
45 Thanh Tam Factory 30,000 Trung Kiên Thoi Lai Can Tho
46 Vinacam Can Tho Factory 30,000 Dong Thang Co Do Can Tho
47 Cang Long FPEs 50,000 Càng Long Càng Long Tra Vinh
48 Cau Ke FPEs 30,000 Cau Ke Cau Ke Tra Vinh
49 Tra Vinh FPEs 40,000 Long Đức Trà Vinh Tra Vinh
50 Thanh Tin Food Co. 100,000 Bạch Đằng Soc Trang Soc Trang
51 Xen Granary 30,000 Phú Giao My Xuyen Soc Trang
52 Ms Ha Granary 37,000 Phú Loi Soc Trang Soc Trang
53 Central warehouse of Soc
Trang Food Co. 120,000 Long Duc Soc Trang Soc Trang
54 Thuan Thanh Factory 40,000 Phú Giao My Xuyen Soc Trang
55 Hau Giang Food JSC 125,000 Vi Thanh Hau Giang
56 Phat Loc Factory 40,000 Võ Nguyên
Giáp Vi Thanh Hau Giang
57 Son Loan Factory 25,000 Vinh Vien Long My Hau Giang
58 Vna Thuan Loi Factory 30,000 Long Phú Long My Hau Giang
59 Thuan Phat Factory 30,000 Nhon Thuan Chau Thanh
Hau Giang

Appendix C
181
No Key rice sources in the Me-
kong Delta (2010)
Average rice
handling vol-
ume per year (ton)
Commune/
Ward
District/
City Province
60 Le Tran Rice Basket 25,000 Thi Tu Chau Thanh
Hau Giang
61 Tan Phu FPE 250,000 Tan Hiep B Tan Hiep Kien Giang
62 Hon Dat FPE 160,000 Kien Son Hon Dat Kien Giang
63 An Hoa FPE 140,000 An Bình Rach Giá Kien Giang
64 Thanh Hung FPE 120,000 Thanh hung Giong Rieng
Kien Giang
65 Vinh Thang FPE 180,000 Vinh Thang Gò Quao Kien Giang
66 Tân Hiệp FPE 350,000 Tan Hiep A Tân Heệp Kien Giang
67 Giong Rieng FPE 220,000 Thanh Hung Giong
Rieng Kien Giang
68 Kien Giang Agriculture Prod-
uct Trading, JSC. 350,000 Ly Tu Trong Rach Giá Kien Giang
69 Ninh Quoi A FPE 40,000 Ninh Quoi A Hong Dan Bac Lieu
70 Bac Lieu FPE 45,000 QL1A Bac Lieu Bac Lieu
71 Phuoc Long FPE 35,000 Phuoc Long Phuoc Long Bac Lieu
72 Chi Cong III FPE 25,000 Long Thanh Vinh Loi Bac Lieu
73 Hai Quyen Factory 30,000 Long Taạnh Vinh Loi Bac Lieu
74 Tai Loi Factory 25,000 Châu Hung Vinh Loi Bac Lieu
Total 7,985,000
Share in total rice volume of the Mekong Delta
73.6%

Appendix C
182
C2. Additional survey on rice distribution from key rice sources to HCMC
ADDITIONAL SURVEY ON RICE DISTRIBUTION ON HO CHI MINH CITY
General information
Name of interviewee: Professional working position:
Working organization:
Address:
Tel:
Profile of rice distribution
Approximately how much is the volume of your rice distribution __________ (tons) monthly , or
yearly
Approximately how much is the volume of rice distributed in HCMC? __________ (tons) monthly ,
or yearly
How many customers do you have in HCMC?
Please specify some information related to your customers in HCMC as below:
Customers
in HCMC
Approximate
share in
volume (%)
Estimate
distance
to buyers
(km)
Typical fre-
quency of
delivery (de-
livery per
month or
day)
Delivery
mode
Average
order
quantity
(ton)
Lead time
(from placing
of order to de-
livery) (speci-
fy hrs. or
days)
Customer 1
Customer 2
Customer 3
Customer 4
Customer 5
Customer 6
Customer 7
Customer 8
Customer 9
Customer 10
Thank you for your cooperation!

183
Curriculum Vitae
Full name: Nguyen Thi Binh
Date of birth: July 19th 1980
Place of birth: Ninh Binh, Vietnam
Nationality: Vietnamese
Sex: Female
Phone number: +84 1669770307
Email: [email protected]
Current address: 409/A9-No 3 Cau Giay District, Hanoi
City, Vietnam
EDUCATION
08/2010 - 10/2016
Doctoral Candidate
Transport Planning and Traffic Engineering,
Technische Universität Darmstadt, Germany, at Vietnamese-German Transport Research Centre,
Vietnamese-German University, Vietnam
012/2002 - 9/2005
Master of Foreign Economics
University of Economics, Vietnam National University, Hanoi
09/1998 - 6/2002
Bachelor of Foreign Economics
University of Economics, Vietnam National University
OCCUPATION
09/2003 - 06/2005
Teaching Assistant
Section of Transport Planning and Management
University of Transport and Communication (UTC)
07/2005- Present
Lecturer
Section of Transport Planning and Management
University of Transport and Communication (UTC)
PRIZE
Scholarship of Ryoichi Sasakawa Young Leaders Fellowship (Nippon-Japan) for Outstanding Graduate Students of Vietnam National University