Embed Size (px)
Citation preview
A Modern Paradigm for Improving Healthcare Quality
Rashad Massoud, Karen Askov, Jolee Reinke,
Lynne Miller Franco, Thada Bornstein, Elisa Knebel,
and Catherine MacAulay

ii ◆ A Modern Paradigm for Improving Healthcare Quality
Table of Contents
List of Tables and Figures ........................................................................................................ viii
List of Acronyms ........................................................................................................................... x
Acknowledgements ..................................................................................................................... x
Executive Summary .................................................................................................................... 1
1 The History of the Quality Assurance Project in Quality Improvement ............................ 3
2 The Modern Improvement Paradigm ................................................................................... 3
2.1 Quality Assurance in Healthcare ............................................................................... 3
2.2 Evidence-Based Medicine .......................................................................................... 5
2.3 Fundamental Concept of Improvement ................................................................... 6
2.4 Principles of Improvement ......................................................................................... 6
2.4.1 Client Focus ................................................................................................... 7
2.4.2 Understanding Work as Processes and Systems ..................................... 8
2.4.3 Teamwork ...................................................................................................... 9
2.4.4 Testing Changes and Emphasizing the Use of Data .............................. 10
3 The Spectrum of Quality Improvement Approaches ....................................................... 13
4 QI Steps ................................................................................................................................. 15
4.1 Step One: Identify ..................................................................................................... 15
4.2 Step Two: Analyze ..................................................................................................... 17
4.3 Step Three: Develop ................................................................................................ 18
4.4 Step Four: Test and Implement .............................................................................. 18
4.4.1 The Cycle for Learning and Improvement ................................................ 19
5 Approach A: Individual Problem Solving ........................................................................... 23
5.1 Step One: Identify .................................................................................................... 23
5.2 Step Two: Analyze .................................................................................................... 23
5.3 Step Three: Develop ................................................................................................ 23
5.4 Step Four: Test and Implement ............................................................................... 24
5.5 Case Example of an Individual Problem Solving .................................................. 25
A Modern Paradigm for Improving Healthcare Quality ◆ iii

6 Approach B: Rapid Team Problem Solving ........................................................................ 27
6.1 Step One: Identify ..................................................................................................... 27
6.2 Step Two: Analyze .................................................................................................... 28
6.3 Step Three: Develop ................................................................................................ 28
6.4 Step Four: Test and Implement .............................................................................. 29
6.5 Case Example of a Rapid Team Problem Solving ................................................ 30
7 Approach C: Systematic Team Problem Solving .............................................................. 33
7.1 Step One: Identify .................................................................................................... 33
7.2 Step Two: Analyze .................................................................................................... 34
7.3 Step Three: Develop ................................................................................................ 36
7.4 Step Four: Test and Implement .............................................................................. 36
7.5 Case Example of a Systematic Team Problem Solving ........................................ 37
8 Approach D: Process Improvement ................................................................................... 43
8.1 Step One: Identify .................................................................................................... 44
8.2 Step Two: Analyze .................................................................................................... 45
8.3 Step Three: Develop ................................................................................................ 46
8.4 Step Four: Test and Implement .............................................................................. 46
8.5 Case Example of a Process Improvement ............................................................ 48
9 Quality Improvement Tools .................................................................................................. 51
9.1 Data Collection .......................................................................................................... 51
When to Use Existing Data ........................................................................ 51
How to Collect Data ................................................................................... 52
Caution ........................................................................................................ 52
9.2 Brainstorming ........................................................................................................... 52
When to Brainstorm .................................................................................. 53
How to Brainstorm ..................................................................................... 53
Caution ........................................................................................................ 53
9.3 Affinity Analysis ........................................................................................................ 53
When to Use It ............................................................................................ 53
How to Use It .............................................................................................. 54
Caution ........................................................................................................ 54
9.4 Creative Thinking Techniques ................................................................................. 54
When to Use Element Modification and Random Word Provocation ....................................................................... 54
iv ◆ A Modern Paradigm for Improving Healthcare Quality
9.5 Prioritization Tools: Making Decisions among Options ....................................... 54
Voting ..................................................................................................................... 55
When to Use It ............................................................................................ 55
How to Use It .............................................................................................. 55
Multivoting ................................................................................................................ 55
When to Use It ............................................................................................ 55
How to Use It .............................................................................................. 55
Weighted Voting ....................................................................................................... 55
When to Use It ............................................................................................ 55
How to Use It .............................................................................................. 55
Caution ..................................................................................................................... 56
Criteria (Prioritization) Matrix ................................................................................. 56
When to Use It ............................................................................................ 56
How to Use It .............................................................................................. 56
Caution ...................................................................................................................... 57
9.6 Expert Decision Making .......................................................................................... 58
9.7 System Modeling ...................................................................................................... 58
When to Use It .......................................................................................................... 58
Elements of System Modeling ................................................................................ 58
How to Use It ............................................................................................................ 59
Using the System Model for Problem Analysis ..................................................... 60
Caution ..................................................................................................................... 60
9.8 Flowchart .................................................................................................................. 60
When to Use It .......................................................................................................... 60
Types of Flowcharts ................................................................................................. 60
High-Level Flowchart ................................................................................. 60
Detailed Flowchart .................................................................................... 60
Deployment or Matrix Flowchart ............................................................... 61
When to Use Which Flowchart ................................................................................. 61
How to Use It ............................................................................................................. 61
Hints for Constructing Flowcharts .......................................................................... 62
Analyzing the Detailed Flowchart to Identify Problem Areas .............................. 63
Caution ..................................................................................................................... 63
A Modern Paradigm for Improving Healthcare Quality ◆ v
9.9 Cause-and-Effect Analysis ...................................................................................... 63
When to Use It .......................................................................................................... 63
Types of Cause-and-Effect Analyses ...................................................................... 64
Causes by Categories (Fishbone Diagram) ........................................................... 64
A Chain of Causes (Tree Diagram) and the Five Why�s ....................................... 65
How to Use Cause-and-Effect Analysis .................................................................. 65
Caution ..................................................................................................................... 65
9.10 Force-Field Analysis ................................................................................................. 66
When to Use It .......................................................................................................... 66
How to Use It ............................................................................................................ 66
Caution ..................................................................................................................... 66
9.11 Statistical/Data Presentation Tools ...................................................................... 66
Bar and Pie Charts .................................................................................................. 67
When to Use Them .................................................................................... 67
Selecting a Type of Bar Chart ................................................................... 67
How to Use a Bar Chart ............................................................................ 67
How to Use a Pie Chart ............................................................................. 68
Caution ..................................................................................................................... 68
Run and Control Charts ........................................................................................... 68
When to Use a Run Chart ......................................................................... 68
How to Use a Run Chart ............................................................................ 68
When and How to Use a Control Chart ................................................... 69
Caution ..................................................................................................................... 70
Histogram ................................................................................................................. 70
When to Use It ............................................................................................ 70
How to Use It .............................................................................................. 70
Caution ...................................................................................................................... 71
Scatter Diagram ........................................................................................................ 71
When to Use It ............................................................................................. 71
How to Use It .............................................................................................. 72
Caution ..................................................................................................................... 72
Pareto Chart ............................................................................................................. 72
When to Use It ............................................................................................ 73
How to Use It .............................................................................................. 73
Caution ..................................................................................................................... 73
vi ◆ A Modern Paradigm for Improving Healthcare Quality

Client Window ............................................................................................................ 74
When to Use It ............................................................................................. 74
How to Use It ............................................................................................... 74
Caution ...................................................................................................................... 74
9.12 Benchmarking ........................................................................................................... 74
When to Use It .......................................................................................................... 75
How to Use It ............................................................................................................ 75
Caution ..................................................................................................................... 75
9.13 Gantt Chart ............................................................................................................... 75
When to Use It .......................................................................................................... 75
How to Use It ............................................................................................................ 75
9.14 Quality Assurance Storytelling ................................................................................ 75
When to Use It ........................................................................................................... 76
How to Use the QA Storybook ................................................................................. 76
How to Use the QA Storyboard ................................................................................ 76
Caution ...................................................................................................................... 76
References ................................................................................................................................ 77
A Modern Paradigm for Improving Healthcare Quality ◆ vii
List of Tables and Figures
Figure 2.1 Inputs, Processes, and Outputs/Outcomes ............ 4 Table 4.5 Comparison of the Quality Improvement
Figure 2.2 Quality Improvement Integrates Content Approaches for Each Step ....................................... 21
of Care and the Process of Providing Care. ............ 4 Figure 5.1 The Spectrum of Quality Improvement
Figure 2.3 Integrating Changes in the Content and Approaches .............................................................. 23
Process of Care (Tver, Russia) .................................. 4 Table 5.1 PDSA for Individual Problem Solving ...................... 24
Table 2.1 Coding System for Hierarchy of Evidence ................ 5 Figure 5.2 Summary of the Individual
Summary: Evidence-Based Medicine ......................................... 5 Problem-Solving Approach ...................................... 24
Figure 2.4 Improvement Efforts Must Address Processes .................................................................... 6
Figure 6.1 The Spectrum of Quality Improvement Approaches ............................................................... 27
Summary: Fundamental Concepts of Improvement ................. 6 Table 6.1 Sample Indicators for Improvement Goals ........... 28
Figure 2.5 Conceptual Model of a Process ................................ 8 Figure 6.2 Summary of the Rapid Team
Problem-Solving Approach ..................................... 30 Figure 2.6 Conceptual Model of a System ................................. 9
Figure 6.3 Duration of Phototherapy before and after Figure 2.7 Components of the System of the Improvement (Al-Naser Hospital,
Hypertension Care in the Tula Oblast ...................... 9 Gaza, Palestine) ...................................................... 32
Figure 2.8 People Representing Different Steps Figure 7.1 The Spectrum of Quality Improvement in a Process ............................................................... 10 Approaches .............................................................. 33
Figure 2.9 Hypothesis Testing ................................................... 10 Figure 7.2 Summary of the Systematic Team
Figure 2.10 Differentiating Common and Problem-Solving Approach ..................................... 38
Special Cause Variation .......................................... 12 Table 7.1 Prioritization of Problems ....................................... 39
Figure 2.11 Acting on Common Cause and Figure 7.3 High-Level Flowchart of the Process of Special Cause Variation .......................................... 12 Administering Malaria Medication ........................ 39
Figure 3.1 Spectrum of Approaches to Figure 7.4 Process Flowchart of the Administration Quality Improvement ............................................... 13 of Malaria Medication ............................................. 40
Table 3.1 Comparison of QI Approaches ................................ 14 Figure 7.5 Fishbone Diagram of Possible Root Causes of
Figure 3.2 Choosing a QI approach .......................................... 14 Why Children Do Not Improve ................................. 41
Figure 4.1 Four Steps to Quality Improvement ........................ 15 Table 7.2 Data Collected with the Check Sheet .................... 41
Figure 4.2 Continuous Quality Improvement ........................... 15 Figure 7.6 Reasons Why Children Did Not
Take Medication ....................................................... 41 Table 4.1 Common Problems/Quality Dimensions ............... 16
Figure 8.1 The Spectrum of Quality Improvement Table 4.2 Test Result Determines Next Step ......................... 19 Approaches .............................................................. 43
Table 4.3 Plan, Do, Study, Act .................................................. 19 Table 8.1 Sample Indicators for Key Processes
Figure 4.3 Shewhart�s Cycle for Learning and in a Vaccination Program ....................................... 44
Improvement ............................................................ 20 Figure 8.2 Summary of the Process Improvement
Table 4.4 Matrix of QI Tools and Other Essential Approach ................................................................... 47
Elements Related to QI ........................................... 20
viii ◆ A Modern Paradigm for Improving Healthcare Quality
Figure 8.3 Reasons Cited for Not Attending Figure 9.10 Run Chart of Arterial Hypertension Postpartum Appointments ..................................... 48 Patients under Observation (per 1,000)
Figure 8.4 Percentage of Women Who Return in Tula Oblast, Russia ............................................. 69
for Appointments ..................................................... 49 Figure 9.11 Control Chart of Average Wait Time
Figure 8.5 Reasons Cited for Not Attending Postpartum before and after a Redesign .................................. 69
Appointments: Round 2 .......................................... 49 Table 9.13 When to Use the Histogram ................................... 70
Table 9.1 Quality Improvement Tools and Activities .............. 51 Table 9.14 Compilation Table for Constructing
Table 9.2 Precautions for Avoiding Data Collection a Histogram .............................................................. 70
Problems .................................................................. 52 Figure 9.12 Types of Histograms ................................................. 71
Table 9.3 Straight Voting ......................................................... 55 Figure 9.13 Scatter Diagram ....................................................... 71
Table 9.4 Multivoting ................................................................ 55 Figure 9.14 Scatter Diagram Interpretation .............................. 72
Table 9.5 Weighted Voting ....................................................... 56 Figure 9.15 Pareto Chart ............................................................. 72
Table 9.6 Criteria Matrix .......................................................... 56 Table 9.15 Tallying Items in a Compilation Table .................... 73
Table 9.7 Complex Rating Scale .............................................. 57 Table 9.16 Arranging Items in a Compilation Table ................ 73
Figure 9.1 System Model for Malaria Treatment ................... 59 Table 9.17 Client Window Framework ....................................... 74
Figure 9.2 High-Level Flowchart of Prenatal Care .................. 61
Figure 9.3 Detailed Flowchart of Patient Registration ........... 61
Figure 9.4 Deployment or Matrix Flowchart ............................ 61
Table 9.8 Type of Flowchart Indicated for Various Purposes ..................................................... 62
Table 9.9 Basic Elements for Various Types of Flowcharts ................................................. 62
Table 9.10 Basic Symbols for Any Type of Flowchart ............. 62
Table 9.11 Symbols for Detailed Flowcharts ........................... 62
Figure 9.5 Fishbone Diagram Structure .................................. 64
Figure 9.6 Fishbone Diagram Used at the San Carlos Hospital ................................................. 64
Figure 9.7 Tree Diagram ............................................................ 65
Table 9.12 Choosing Data Display Tools .................................. 67
Figure 9.8 Bar Charts ................................................................ 67
Figure 9.9 Pie Chart ................................................................... 68
A Modern Paradigm for Improving Healthcare Quality ◆ ix
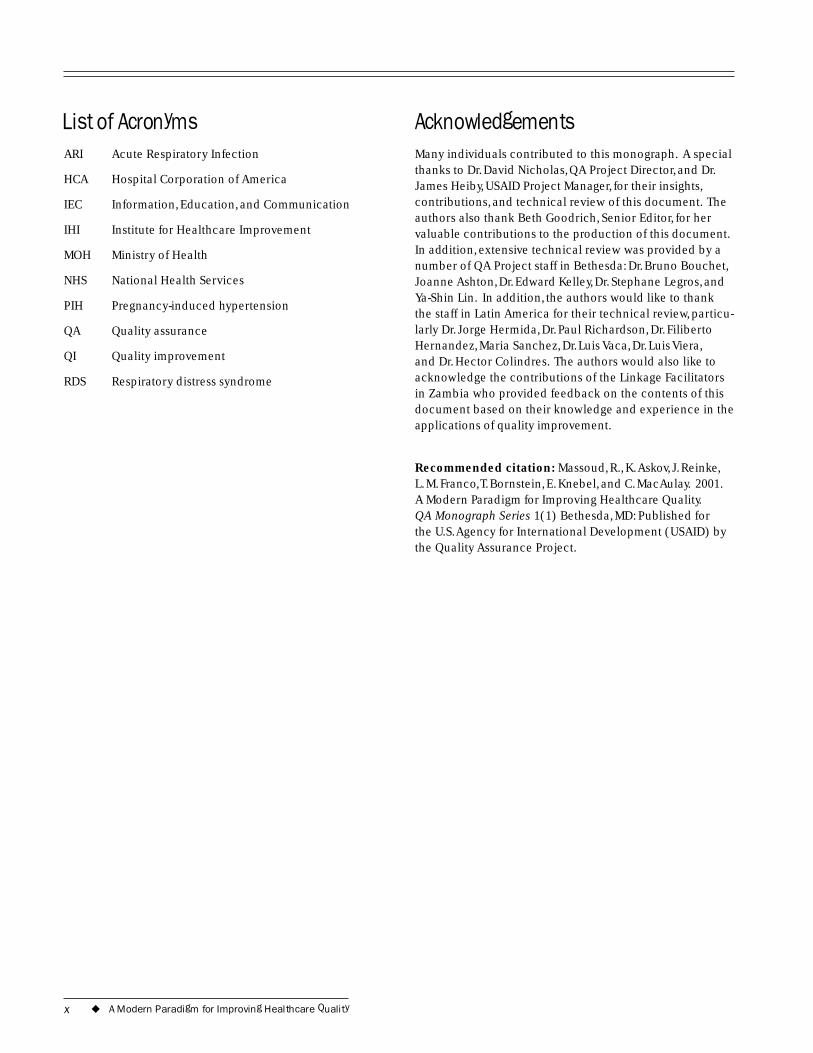
List of AcronymsARI Acute Respiratory Infection
HCA Hospital Corporation of America
IEC Information, Education, and Communication
IHI Institute for Healthcare Improvement
MOH Ministry of Health
NHS National Health Services
PIH Pregnancy-induced hypertension
QA Quality assurance
QI Quality improvement
RDS Respiratory distress syndrome
AcknowledgementsMany individuals contributed to this monograph. A special thanks to Dr. David Nicholas, QA Project Director, and Dr. James Heiby, USAID Project Manager, for their insights, contributions, and technical review of this document. The authors also thank Beth Goodrich, Senior Editor, for her valuable contributions to the production of this document. In addition, extensive technical review was provided by a number of QA Project staff in Bethesda: Dr. Bruno Bouchet, Joanne Ashton, Dr. Edward Kelley, Dr. Stephane Legros, and Ya-Shin Lin. In addition, the authors would like to thank the staff in Latin America for their technical review, particu-larly Dr. Jorge Hermida, Dr. Paul Richardson, Dr. Filiberto Hernandez, Maria Sanchez, Dr. Luis Vaca, Dr. Luis Viera, and Dr. Hector Colindres. The authors would also like to acknowledge the contributions of the Linkage Facilitators in Zambia who provided feedback on the contents of this document based on their knowledge and experience in the applications of quality improvement.
Recommended citation: Massoud, R., K.Askov, J. Reinke, L. M. Franco,T. Bornstein, E. Knebel, and C. MacAulay. 2001. A Modern Paradigm for Improving Healthcare Quality. QA Monograph Series 1(1) Bethesda, MD: Published for the U.S.Agency for International Development (USAID) by the Quality Assurance Project.
x ◆ A Modern Paradigm for Improving Healthcare Quality
Executive Summary
THE methodology for improving quality in healthcare has evolved rapidly over the past decade. This has come about as a result of several factors: the large
number of field experiences that have taken place in many countries worldwide and in a variety of different areas and specialities in healthcare delivery; the increasing complex-ity of healthcare delivery and with that the emerging new needs for efficient and cost-effective care; the increased expectations of our customers; and lastly, the advances in our knowledge on improvement, management, and clinical practice. This monograph represents an update on quality improvement methodology, which incorporates the most recent thinking on how to implement improvement.
This monograph describes several major advances:
◆ The view of different quality improvement approaches along a spectrum of increasing complexity. This allows us to think in terms of one improvement methodology, with many different approaches to using it depending on the situation at hand.
◆ The integration of evidence-based medicine and quality improvement. The methodology described in this mono-graph can be used for clinical (as well as non-clinical) improvement. In improving clinical quality, the integra-tion of evidence-based medicine is described as part of the methodology.
◆ Simplifying the quality improvement methodology. The methodology described is a simple and flexible one, which can be used in a variety of approaches. Addition-ally, it allows for creativity and innovation in its use and application.
The monograph starts by outlining the principles and frameworks underlying modern quality improvement in healthcare. It describes “change” as the key element of any improvement. It next describes the framework for quality improvement in healthcare, including the integration of evidence-based medicine and quality improvement. It explains the four principles of quality improvement: focus
on the client, understanding work as processes and systems, teamwork, and testing changes to processes and systems using data.
Section 2 describes the spectrum that covers the range of quality improvement methods. This shows how, depending on the needs of the improvement, there exists an infinite number of quality improvement approaches all built upon the quality improvement principles and methodology. The monograph arbitrarily defines four points along this spec-trum of increasing complexity that demonstrate the appli-cation of the methodology to different situations. These are:
◆ Individual Problem Solving: The hallmark of this approach is that there is no interdependency in the improvement, which can be accomplished by one individual.
◆ Rapid Team Problem Solving: This approach to improvement emphasizes accomplishing the results as quickly as possible through the elimination of all non-vital steps.
◆ Systematic Team Problem Solving: This is a more rigorous approach that uses root cause analysis.
◆ Process Improvement: This approach is used when the team is dealing with a core service process and where a permanent team continually follows up the process.
The next four sections detail the methodology for improve-ment for each of the four approaches. Each approach is illustrated with an example.
The final section describes a number of tools used in qual-ity improvement. These include data collection, process description, and data analysis tools. Examples of the use of each tool are also provided. The tools section also serves as a reference on the use of the tools of quality manage-ment in various situations. Most of these tools have been used in the examples in the previous sections, and detail regarding their application may be found in this section.
A Modern Paradigm for Improving Healthcare Quality ◆ 1

2 ◆ A Modern Paradigm for Improving Healthcare Quality
1The History of theQuality AssuranceProject in Quality Improvement
THE Quality Assurance Project has worked since 1990 to improve the quality of healthcare worldwide. This experience has generated ten years of knowl-
edge and information about applying quality assurance concepts in areas as diverse as Niger, Ecuador, Chile, Russia, Jordan, and Guatemala. Quality assurance has proved to be a means of delivering cost-effective, efficient, high-quality healthcare services.
One area of quality assurance where the QA Project has accumulated much knowledge is quality improvement methodology. In the beginning stages of the QA Project, quality improvement in health settings largely followed and adapted ideas from management disciplines. These ideas emphasized Systematic Team Problem Solving to involve organizational members in quality improvement. These ideas have evolved over time as the QA Project experiences demonstrated that improvement efforts may be viewed along a continuum of complexity where differ-ent approaches to improvement are used in different situa-tions. This document describes four approaches to quality improvement on that continuum and provides examples of settings and situations in which these approaches have been successfully used.
Kare
n As
kov
2001
2The ModernImprovementParadigm
2.1 Quality Assurance in Healthcare
QUALITY assurance (QA) includes all the actions taken to make healthcare better. These activities build on the principles of quality management, “a systematic managerial transformation designed
to address the needs and opportunities of all organizations as they try to cope with the increasing change, complexity and tension within their environments” (Berwick 1991). The QA Project has used and adapted concepts of quality management to healthcare environments worldwide, particularly in lower- and middle-income countries.
This document summarizes QA Project knowledge in one area of QA activities: quality improvement. Quality improvement (QI) identifies where gaps exist between services actually provided and expectations for services. It then lessens these gaps not only to meet customer needs and expectations, but to exceed them and attain unprec-edented levels of performance. QI is based on principles of quality management that focus on the client, systems and processes, teamwork, and the use of data.
QI has evolved over the years to arrive at the ideas pre-sented in this document. Originally, improvements were thought to depend on adding new or more things, such as a new machine, procedure, training, or supplies. It was believed that more of these resources or inputs would improve quality. People working to improve quality learned that increasing resources does not always ensure their efficient use and consequently may not lead to improve-ments in quality. For example, the purchase of a new machine in a hospital does not alone improve the quality of care. In order to benefit from the machine’s advance-ment in technology, employees need training to learn to use the machine, patients need access to the services that the machine provides, and the system of healthcare deliv-ery must be changed in ways that permit the use of this new technology. In other words, improvement involves not only adding new resources to a system, but also making changes to an organization in order to make the best use of resources.
A Modern Paradigm for Improving Healthcare Quality ◆ 3
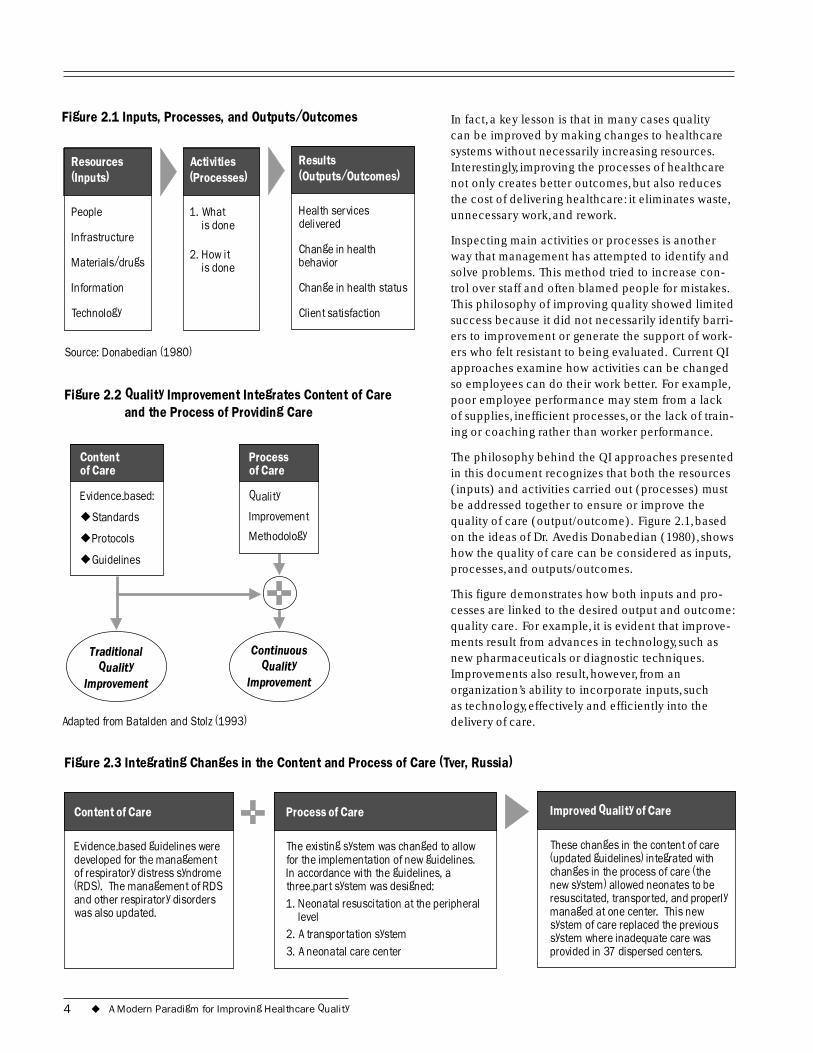
Figure 2.1 Inputs, Processes, and Outputs/Outcomes
(Outputs/Outcomes)
Change in health
Change in health status
Results
Health services delivered
behavior
Client satisfaction
(Inputs)
Infrastructure
(Processes)
is done
is done
Resources
People
Materials/drugs
Information
Technology
Activities
1. What
2. How it
Source: Donabedian (1980)
In fact, a key lesson is that in many cases quality can be improved by making changes to healthcare systems without necessarily increasing resources. Interestingly, improving the processes of healthcare not only creates better outcomes, but also reduces the cost of delivering healthcare: it eliminates waste, unnecessary work, and rework.
Inspecting main activities or processes is another way that management has attempted to identify and solve problems. This method tried to increase con-trol over staff and often blamed people for mistakes. This philosophy of improving quality showed limited success because it did not necessarily identify barri-ers to improvement or generate the support of work-ers who felt resistant to being evaluated. Current QI approaches examine how activities can be changed so employees can do their work better. For example, poor employee performance may stem from a lack of supplies, inefficient processes, or the lack of train-ing or coaching rather than worker performance.
The philosophy behind the QI approaches presented in this document recognizes that both the resources (inputs) and activities carried out (processes) must be addressed together to ensure or improve the quality of care (output/outcome). Figure 2.1, based on the ideas of Dr. Avedis Donabedian (1980), shows how the quality of care can be considered as inputs, processes, and outputs/outcomes.
This figure demonstrates how both inputs and pro-cesses are linked to the desired output and outcome: quality care. For example, it is evident that improve-ments result from advances in technology, such as new pharmaceuticals or diagnostic techniques. Improvements also result, however, from an organization’s ability to incorporate inputs, such as technology, effectively and efficiently into the delivery of care.
Figure 2.2 Quality Improvement Integrates Content of Care and the Process of Providing Care
Content of Care
Evidence-based:
◆
◆
◆ Guidelines
Process of Care
Quality
IStandards
Protocols
mprovement
Methodology
Quality Continuous
Quality Traditional
Improvement Improvement
Adapted from Batalden and Stolz (1993)
Figure 2.3 Integrating Changes in the Content and Process of Care (Tver, Russia)
(RDS). The management of RDS
Content of Care
Evidence-based guidelines were developed for the management of respiratory distress syndrome
and other respiratory disorders was also updated.
Process of Care
l
The existing system was changed to allow for the implementation of new guidelines. In accordance with the guidelines, a three-part system was designed: 1. Neonatal resuscitation at the peripheral
leve
2. A transportation system 3. A neonatal care center .
Improved Quality of Care
These changes in the content of care (updated guidelines) integrated with changes in the process of care (the new system) allowed neonates to be resuscitated, transported, and properly managed at one center. This new system of care replaced the previous system where inadequate care was provided in 37 dispersed centers
4 ◆ A Modern Paradigm for Improving Healthcare Quality
Activities contain two major components: what is done (content) and how it is done (process of care). Improve-ment can be achieved by addressing either of these com-ponents. The most powerful impact, however, occurs by addressing both content and process of care at the same time. This paradigm for QI makes organizations more efficient and able to provide quality care with increased access and decreased waste, often at less cost.
In looking at the content of care, we review and update the clinical management of patients for improvements that address clinical care. In doing so, we use evidence-based medicine literature and the highest level of evidence avail-able in order to update clinical practices. In looking at the process of care, the objective is to enhance the capacity in healthcare delivery such that it will allow the implementa-tion of the updated content. This concept is illustrated through Figure 2.2 (Batalden and Stoltz 1993) and the example in Figure 2.3.
Figure 2.3 presents an example from Tver, Russia, illustrat-ing how a system to care for neonates with respiratory distress syndrome (RDS) integrated changes in the content of care and the process of providing care. These changes produced the desired outcome: an improved quality of care.
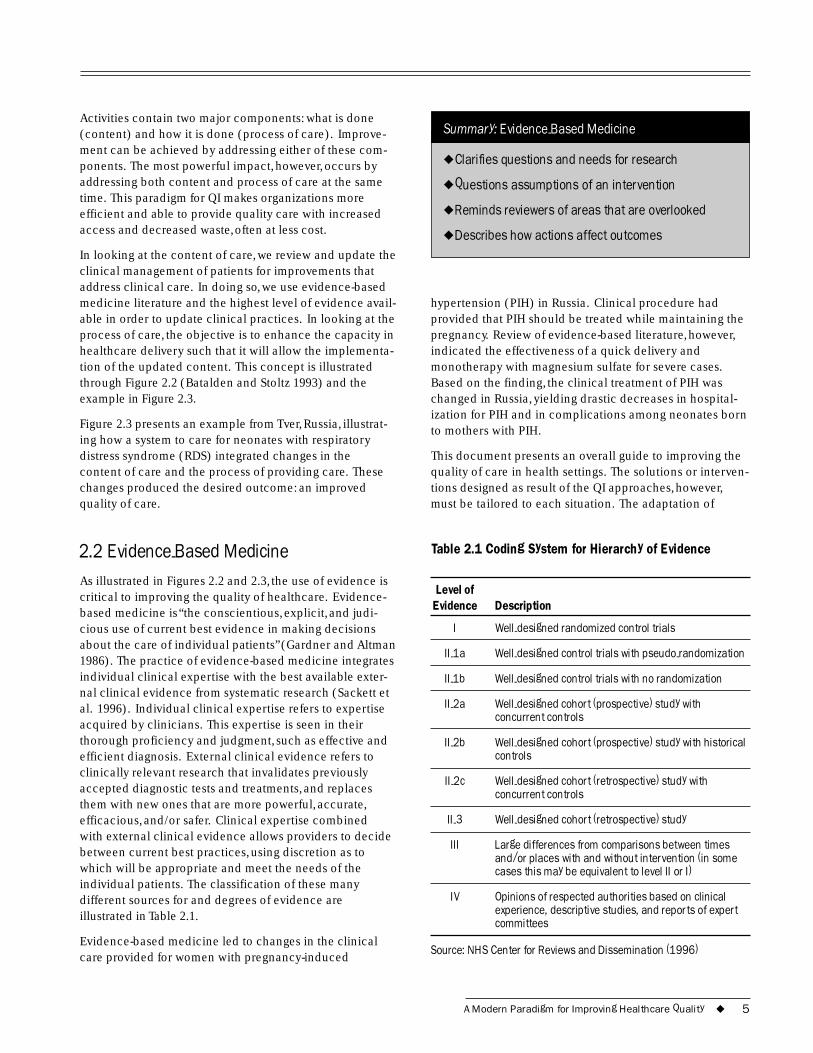
2.2 Evidence-Based Medicine As illustrated in Figures 2.2 and 2.3, the use of evidence is critical to improving the quality of healthcare. Evidence-based medicine is “the conscientious, explicit, and judi-cious use of current best evidence in making decisions about the care of individual patients” (Gardner and Altman 1986). The practice of evidence-based medicine integrates individual clinical expertise with the best available exter-nal clinical evidence from systematic research (Sackett et al. 1996). Individual clinical expertise refers to expertise acquired by clinicians. This expertise is seen in their thorough proficiency and judgment, such as effective and efficient diagnosis. External clinical evidence refers to clinically relevant research that invalidates previously accepted diagnostic tests and treatments, and replaces them with new ones that are more powerful, accurate, efficacious, and/or safer. Clinical expertise combined with external clinical evidence allows providers to decide between current best practices, using discretion as to which will be appropriate and meet the needs of the individual patients. The classification of these many different sources for and degrees of evidence are illustrated in Table 2.1.
Evidence-based medicine led to changes in the clinical care provided for women with pregnancy-induced
Evidence-Based Medicine
◆
◆
◆
◆
Summary:
Clarifies questions and needs for research
Questions assumptions of an intervention
Reminds reviewers of areas that are overlooked
Describes how actions affect outcomes
hypertension (PIH) in Russia. Clinical procedure had provided that PIH should be treated while maintaining the pregnancy. Review of evidence-based literature, however, indicated the effectiveness of a quick delivery and monotherapy with magnesium sulfate for severe cases. Based on the finding, the clinical treatment of PIH was changed in Russia, yielding drastic decreases in hospital-ization for PIH and in complications among neonates born to mothers with PIH.
This document presents an overall guide to improving the quality of care in health settings. The solutions or interven-tions designed as result of the QI approaches, however, must be tailored to each situation. The adaptation of
Table 2.1 Coding System for Hierarchy of Evidence
Level of Evidence Description
I Well-designed randomized control trials
II-1a Well-designed control trials with pseudo-randomization
II-1b Well-designed control trials with no randomization
II-2a Well-designed cohort (prospective) study with concurrent controls
II-2b Well-designed cohort (prospective) study with historical controls
II-2c Well-designed cohort (retrospective) study with concurrent controls
II-3 Well-designed cohort (retrospective) study
III Large differences from comparisons between times and/or places with and without intervention (in some cases this may be equivalent to level II or I)
IV Opinions of respected authorities based on clinical experience, descriptive studies, and reports of expert committees
Source: NHS Center for Reviews and Dissemination (1996)
A Modern Paradigm for Improving Healthcare Quality ◆ 5
medical or improvement knowledge to each situation is important as quality improvement initiatives occur in a wide variety of settings, from local health posts and hospi-tals to national systems, such as, ministries of health. Needs and priorities for technology and/or QI methodology will vary based on the circumstances surrounding needs for improvement.
2.3 Fundamental Concept of Improvement It is of paramount importance to understand that improve-ment requires change, but that not every change is an improvement. If a system is not changed, it can only be expected that the system will continue to achieve the same results. In the words of D.M. Berwick (1998),“Every system is perfectly designed to achieve exactly the results that it achieves.”Within this phrase is embedded the central idea underlying modern QI: performance is a characteristic of a system. Therefore, in order to achieve a different level of performance, it is essential to make changes to that system in ways that permit it to produce better results. Poorly designed systems lend themselves to inefficiency and poor quality. QI approaches identify unnecessary, redundant, or missing parts of processes and attempt to improve quality by clarifying and/or simplifying proce-dures. Because not every change is necessarily an improve-ment, changes must be tested and studied to determine whether the change improves the quality of care. This concept is addressed in more detail later in this section.
Effective change takes into account how parts of a system are coordinated and link together, rather than focusing on just one part. For example, changes in staff skills and knowledge through training will only yield improvement to the extent that the lack of training was the major cause of
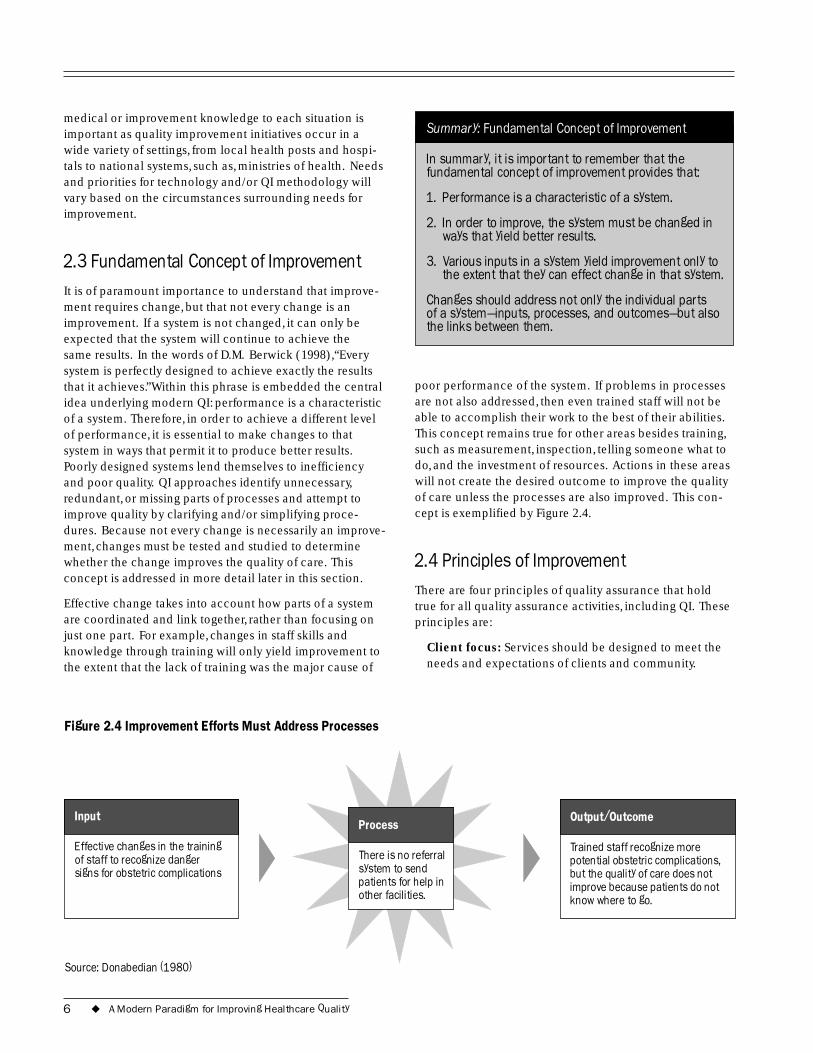
Figure 2.4 Improvement Efforts Must Address Processes
Input
i
Process
Effect ve changes in the training of staff to recognize danger signs for obstetric complications
There is no referral system to send patients for help in other facilities.
Summary: Fundamental Concept of Improvement
In summary, it is important to remember that the fundamental concept of improvement provides that:
1. Performance is a characteristic of a system.
2. In order to improve, the system must be changed in ways that yield better results.
3. Various inputs in a system yield improvement only to the extent that they can effect change in that system.
Changes should address not only the individual parts of a system�inputs, processes, and outcomes�but also the links between them.
poor performance of the system. If problems in processes are not also addressed, then even trained staff will not be able to accomplish their work to the best of their abilities. This concept remains true for other areas besides training, such as measurement, inspection, telling someone what to do, and the investment of resources. Actions in these areas will not create the desired outcome to improve the quality of care unless the processes are also improved. This con-cept is exemplified by Figure 2.4.
2.4 Principles of Improvement There are four principles of quality assurance that hold true for all quality assurance activities, including QI. These principles are:
Client focus: Services should be designed to meet the needs and expectations of clients and community.
Output/Outcome
Trained staff recognize more potential obstetric complications, but the quality of care does not improve because patients do not know where to go.
Source: Donabedian (1980)
6 ◆ A Modern Paradigm for Improving Healthcare Quality
Understanding work as processes and systems: Providers must understand the service system and its key service processes in order to improve them.
Testing changes and emphasizing the use of data: Changes are tested in order to determine whether they yield the required improvement. Data are used to ana-lyze processes, identify problems, and to determine whether the changes have resulted in improvement.
Teamwork: Improvement is achieved through the team approach to problem solving and quality improvement.
2.4.1 Client Focus
Health services exist to meet the health needs of clients, so the delivery of health services should be designed to meet those needs. A focus on the client examines how and whether each step in a process is relevant to meeting client needs and eliminates steps that do not ultimately lead to client satisfaction or desired client outcomes. This focus on the client can be achieved by gathering information
Case Example: Customer Focus (Bolivia)
A maternal mortality project aimed at improving access to and the use of obstetric care in hospitals for women analyzed low service utilization. Focus group discussions with potential customers revealed that women preferred to stay home during childbirth because the hospitals did not provide the foods the women believed to be necessary during childbirth. This kind of information�cultural context�is important in order to make services more acceptable to patients. By understanding and meeting the women�s needs, the hospital could attract a higher percentage of expectant mothers
about clients and then designing services to cater to the needs that are discovered. Client-focused organizations meet client needs and expectations, thereby providing higher quality care. This encourages clients to return when they need additional care and to recommend the services to others.
A focus on clients not only involves people that come to a facility to receive services (referred to as external custom-
Case Example: Customer Focus
Dr. David Gustafson et al. (1993) explored customer needs through a study of breast cancer patients and their families. He found that patients tended not to prioritize their needs related to the delivery of care, as is generally assumed by the providers. Rather, patients and their families emphasized needs for information and support, such as knowing the prospects for the future, making medical decisions, maximizing recovery, and understanding the implications of the diagnosis. Understanding and addressing customer needs help healthcare providers to better meet the needs of customers and exceed patient expectations.
ers), but also addresses the work-related needs of person-nel (referred to as internal customers) involved in the delivery of care. External customers include the people receiving the end product, or output, of a system. For example, patients are external customers of healthcare in a hospital. Internal customers are organizational members involved in the processes necessary to produce the output, healthcare.
Internal customers benefit from system efficiency by being able to perform their jobs better, thereby better meeting the needs of external customers. Doctors, nurses, adminis-trative, and cleaning staff are all examples of internal cus-tomers in a hospital, and each is important in achieving the overall goal of quality care. People switch roles from being suppliers1 to customers many times during work processes, creating an interdependency to carry out work.
The needs and expectations of customers change with technology and education. Although needs vary, some common concerns of internal and external customers have been identified through research and have been labeled as dimensions of quality. There are many dimen-sions of quality, some of the most important ones are:
Technical performance: The degree to which the tasks carried out by health workers and facilities meet expec-tations of technical quality (i.e., comply with standards)
Effectiveness of care: The degree to which desired results (outcomes) of care are achieved
1 Suppliers are the people who provide a product or service in and/or at the end of a work process.
A Modern Paradigm for Improving Healthcare Quality ◆ 7
Efficiency of service delivery: The ratio of the outputs of services to the associated costs of producing those services
Safety: The degree to which the risks of injury, infection, or other harmful side effects are minimized
Access to services: The degree to which healthcare services are unrestricted by geographic, economic, social, organizational, linguistic, or other barriers
Interpersonal relations: Trust, respect, confidentiality, courtesy, responsiveness, empathy, effective listening, and communication between providers and clients
Continuity of services: Delivery of care by the same healthcare provider throughout the course of care (when appropriate) and appropriate and timely referral and communication between providers
Physical infrastructure and comfort: The physical appearance of the facility, cleanliness, comfort, privacy, and other aspects that are important to clients
Choice: When appropriate, client choice of provider, insurance plan, or treatment
Understanding and addressing client needs are critical to quality care. Based on how well these needs are met, clients determine whether they will return for further visits, complete the care suggested, pay for services, and/or recommend the services to others.
Along with understanding different dimensions of quality, it is also important to recognize that clients have different needs. First, in addition to the actual services that clients require for their health, clients also have expectations or desires for services that providers might not necessarily understand. This presents a challenge to healthcare pro-viders to not only deliver the healthcare that is needed, but also deliver it in a way that is acceptable to their clients. Secondly, a focus on clients does not just involve making clients happy. Clients also need information in order to access services and make appropriate decisions.
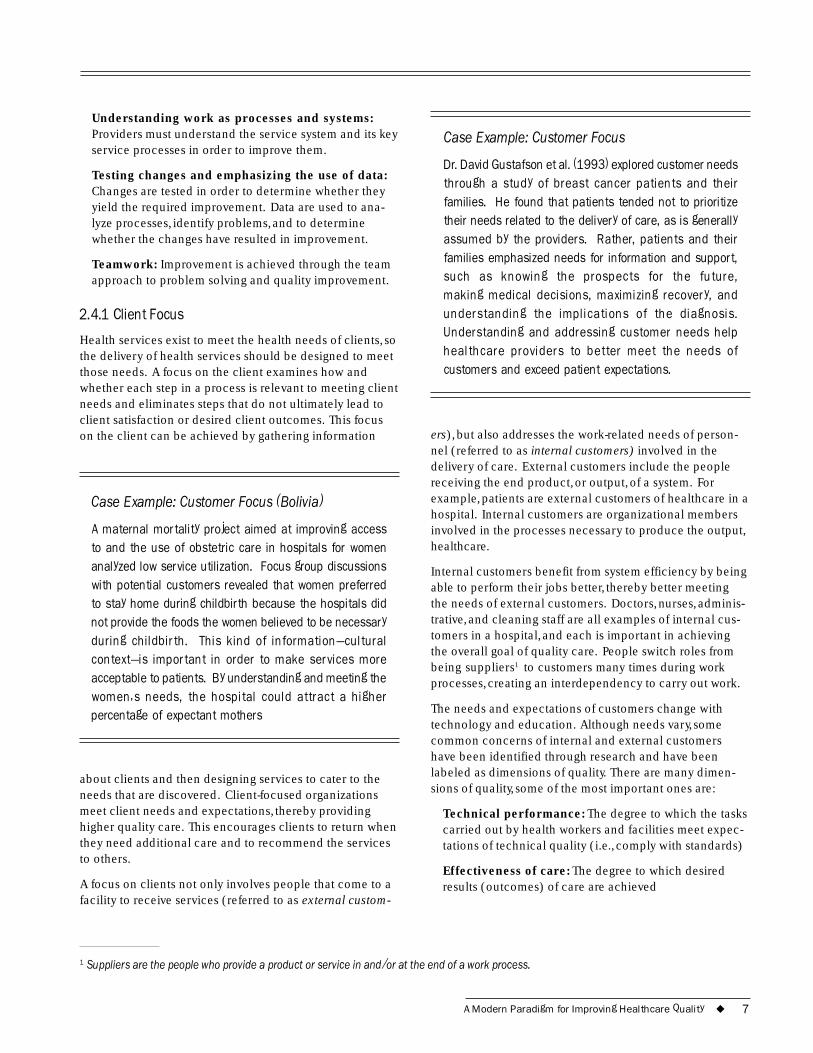
Figure 2.5 Conceptual Model of a Process
2.4.2 Understanding Work as Processes and Systems
Quality management views all work in the form of pro-cesses and systems. A process is defined as “a sequence of steps through which inputs from suppliers are converted into outputs for customers.”A system is defined as “the sum total of all the elements (including processes) that interact together to produce a common goal or product.” (See Figure 2.5.)
There are different types of processes in healthcare. These include:
Clinical algorithms: The processes by which clinical decisions are made
Information flow processes: The processes by which information is shared across the different persons involved in the care
Material flow processes: The processes by which materials (e.g., drugs, supplies, food) are passed through the system
Patient flow processes: The processes by which patients move through the medical facility as they seek and receive care
Multiple flow processes: Most processes are actually multiple flow processes, whereby patients, materials, information, and others are involved simultaneously in the same process of care.
In routine healthcare delivery, many processes occur simul-taneously and involve many professional functions in the organization. All processes are directed at achieving one goal or output from the system. A system consists of inputs, processes, and outputs/outcomes that link together as shown in Figure 2.6. This principle of improvement expands upon the idea introduced in the beginning of this section—changes are made with the coordination of the parts of a system in mind. Systems are arrangements of organizations, people, materials, and procedures associated with a particular function or outcome.
EndStart
8 ◆ A Modern Paradigm for Improving Healthcare Quality
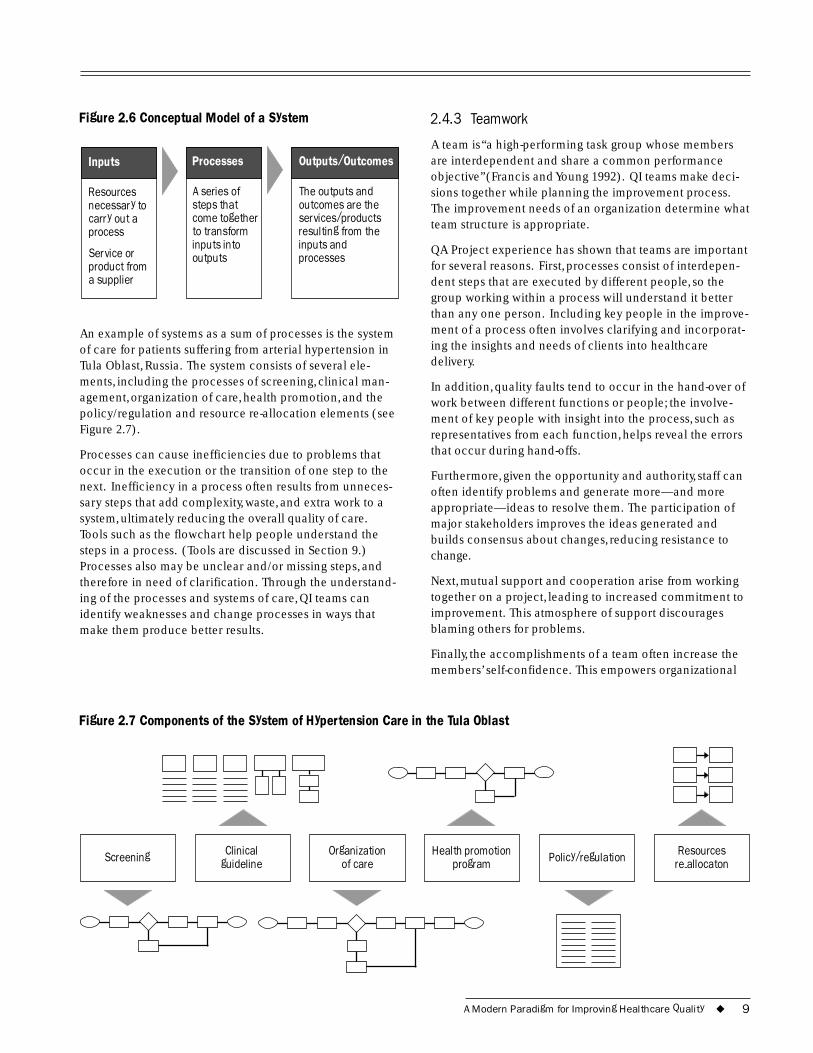
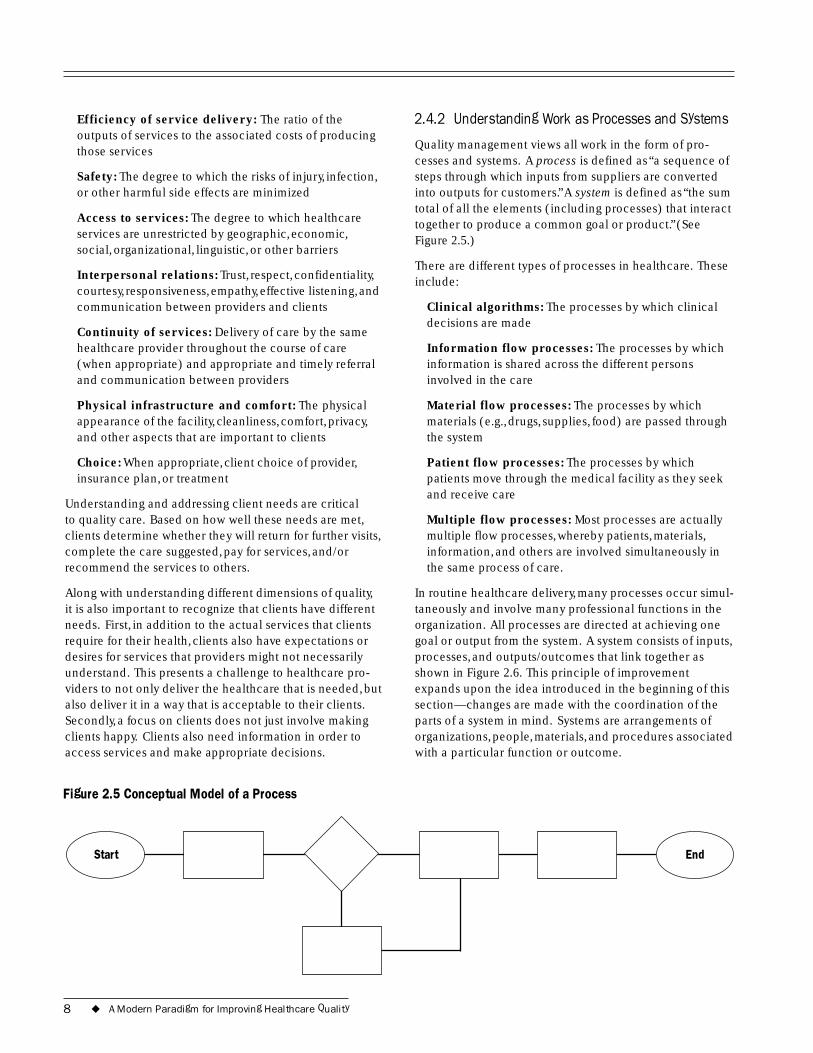
Figure 2.6 Conceptual Model of a System
Inputs
a supplier
Processes
A series of
outputs
Outputs/Outcomes
The outputs and outcomes are the
Resources necessary to carry out a process
Service or product from
steps that come together to transform inputs into
services/products resulting from the inputs and processes
An example of systems as a sum of processes is the system of care for patients suffering from arterial hypertension in Tula Oblast, Russia. The system consists of several ele-ments, including the processes of screening, clinical man-agement, organization of care, health promotion, and the policy/regulation and resource re-allocation elements (see Figure 2.7).
Processes can cause inefficiencies due to problems that occur in the execution or the transition of one step to the next. Inefficiency in a process often results from unneces-sary steps that add complexity, waste, and extra work to a system, ultimately reducing the overall quality of care. Tools such as the flowchart help people understand the steps in a process. (Tools are discussed in Section 9.) Processes also may be unclear and/or missing steps, and therefore in need of clarification. Through the understand-ing of the processes and systems of care, QI teams can identify weaknesses and change processes in ways that make them produce better results.
2.4.3 Teamwork
A team is “a high-performing task group whose members are interdependent and share a common performance objective” (Francis and Young 1992). QI teams make deci-sions together while planning the improvement process. The improvement needs of an organization determine what team structure is appropriate.
QA Project experience has shown that teams are important for several reasons. First, processes consist of interdepen-dent steps that are executed by different people, so the group working within a process will understand it better than any one person. Including key people in the improve-ment of a process often involves clarifying and incorporat-ing the insights and needs of clients into healthcare delivery.
In addition, quality faults tend to occur in the hand-over of work between different functions or people; the involve-ment of key people with insight into the process, such as representatives from each function, helps reveal the errors that occur during hand-offs.
Furthermore, given the opportunity and authority, staff can often identify problems and generate more—and more appropriate—ideas to resolve them. The participation of major stakeholders improves the ideas generated and builds consensus about changes, reducing resistance to change.
Next, mutual support and cooperation arise from working together on a project, leading to increased commitment to improvement. This atmosphere of support discourages blaming others for problems.
Finally, the accomplishments of a team often increase the members’ self-confidence. This empowers organizational
Figure 2.7 Components of the System of Hypertension Care in the Tula Oblast
Screening Clinical guideline
Organization of care
Health promotion program Policy/regulation Resources
re-allocaton
A Modern Paradigm for Improving Healthcare Quality ◆ 9
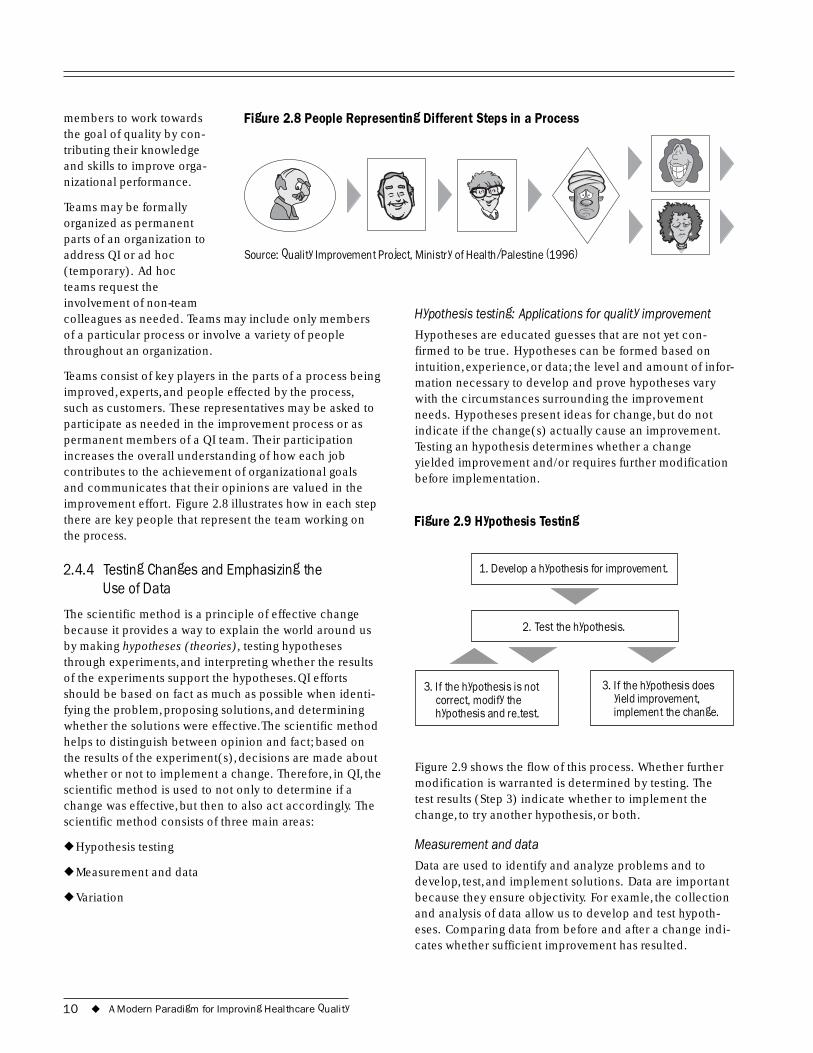
members to work towards Figure 2.8 People Representing Different Steps in a Process the goal of quality by con-tributing their knowledge and skills to improve orga-nizational performance.
Teams may be formally organized as permanent parts of an organization to address QI or ad hoc Source: Quality Improvement Project, Ministry of Health/Palestine (1996) (temporary). Ad hoc teams request the involvement of non-team colleagues as needed. Teams may include only members of a particular process or involve a variety of people throughout an organization.
Teams consist of key players in the parts of a process being improved, experts, and people effected by the process, such as customers. These representatives may be asked to participate as needed in the improvement process or as permanent members of a QI team. Their participation increases the overall understanding of how each job contributes to the achievement of organizational goals and communicates that their opinions are valued in the improvement effort. Figure 2.8 illustrates how in each step there are key people that represent the team working on the process.
2.4.4 Testing Changes and Emphasizing the Use of Data
The scientific method is a principle of effective change because it provides a way to explain the world around us by making hypotheses (theories), testing hypotheses through experiments, and interpreting whether the results of the experiments support the hypotheses. QI efforts should be based on fact as much as possible when identi-fying the problem, proposing solutions, and determining whether the solutions were effective.The scientific method helps to distinguish between opinion and fact; based on the results of the experiment(s), decisions are made about whether or not to implement a change. Therefore, in QI, the scientific method is used to not only to determine if a change was effective, but then to also act accordingly. The scientific method consists of three main areas:
◆ Hypothesis testing
◆ Measurement and data
◆ Variation
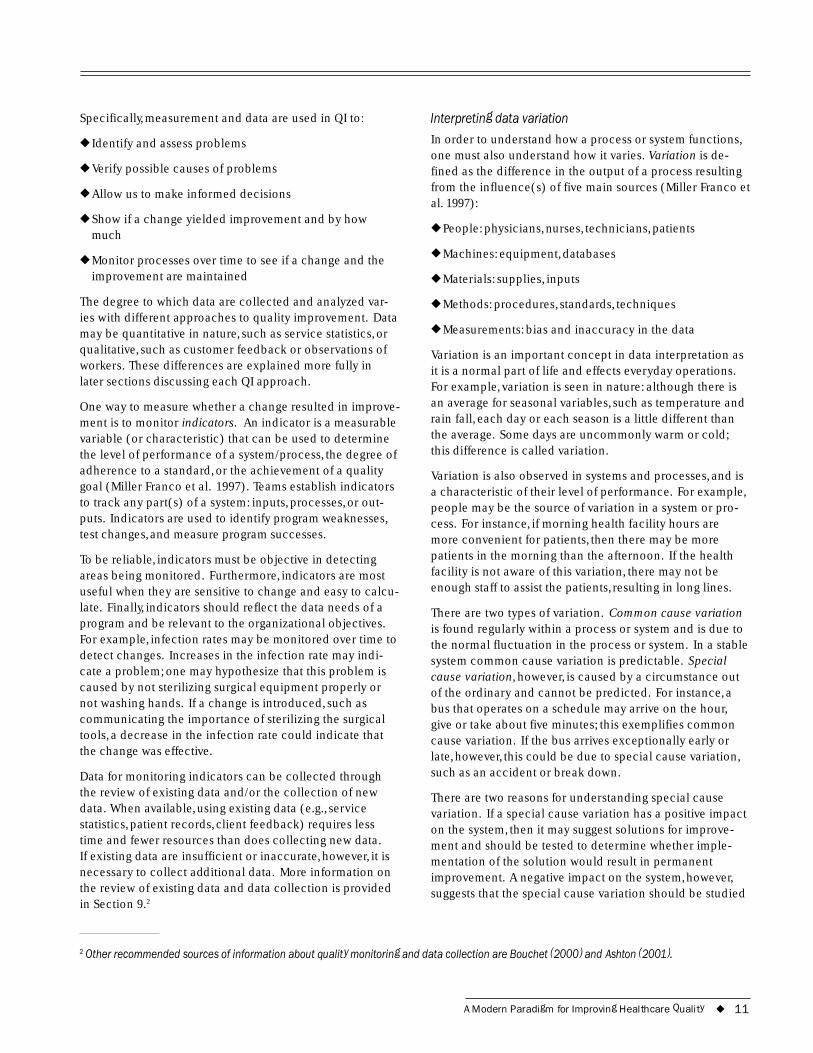
Hypothesis testing: Applications for quality improvement
Hypotheses are educated guesses that are not yet con-firmed to be true. Hypotheses can be formed based on intuition, experience, or data; the level and amount of infor-mation necessary to develop and prove hypotheses vary with the circumstances surrounding the improvement needs. Hypotheses present ideas for change, but do not indicate if the change(s) actually cause an improvement. Testing an hypothesis determines whether a change yielded improvement and/or requires further modification before implementation.
Figure 2.9 Hypothesis Testing
1.
3. If the hypothesis is not correct, modify the hypothesis and re-test.
3. If the hypothesis does yield improvement, implement the change.
Develop a hypothesis for improvement.
2. Test the hypothesis.
Figure 2.9 shows the flow of this process. Whether further modification is warranted is determined by testing. The test results (Step 3) indicate whether to implement the change, to try another hypothesis, or both.
Measurement and data
Data are used to identify and analyze problems and to develop, test, and implement solutions. Data are important because they ensure objectivity. For examle, the collection and analysis of data allow us to develop and test hypoth-eses. Comparing data from before and after a change indi-cates whether sufficient improvement has resulted.
10 ◆ A Modern Paradigm for Improving Healthcare Quality
Specifically, measurement and data are used in QI to:
◆ Identify and assess problems
◆ Verify possible causes of problems
◆ Allow us to make informed decisions
◆ Show if a change yielded improvement and by how much
◆ Monitor processes over time to see if a change and the improvement are maintained
The degree to which data are collected and analyzed var-ies with different approaches to quality improvement. Data may be quantitative in nature, such as service statistics, or qualitative, such as customer feedback or observations of workers. These differences are explained more fully in later sections discussing each QI approach.
One way to measure whether a change resulted in improve-ment is to monitor indicators. An indicator is a measurable variable (or characteristic) that can be used to determine the level of performance of a system/process, the degree of adherence to a standard, or the achievement of a quality goal (Miller Franco et al. 1997). Teams establish indicators to track any part(s) of a system: inputs, processes, or out-puts. Indicators are used to identify program weaknesses, test changes, and measure program successes.
To be reliable, indicators must be objective in detecting areas being monitored. Furthermore, indicators are most useful when they are sensitive to change and easy to calcu-late. Finally, indicators should reflect the data needs of a program and be relevant to the organizational objectives. For example, infection rates may be monitored over time to detect changes. Increases in the infection rate may indi-cate a problem; one may hypothesize that this problem is caused by not sterilizing surgical equipment properly or not washing hands. If a change is introduced, such as communicating the importance of sterilizing the surgical tools, a decrease in the infection rate could indicate that the change was effective.
Data for monitoring indicators can be collected through the review of existing data and/or the collection of new data. When available, using existing data (e.g., service statistics, patient records, client feedback) requires less time and fewer resources than does collecting new data. If existing data are insufficient or inaccurate, however, it is necessary to collect additional data. More information on the review of existing data and data collection is provided in Section 9.2
Interpreting data variation
In order to understand how a process or system functions, one must also understand how it varies. Variation is de-fined as the difference in the output of a process resulting from the influence(s) of five main sources (Miller Franco et al. 1997):
◆ People: physicians, nurses, technicians, patients
◆ Machines: equipment, databases
◆ Materials: supplies, inputs
◆ Methods: procedures, standards, techniques
◆ Measurements: bias and inaccuracy in the data
Variation is an important concept in data interpretation as it is a normal part of life and effects everyday operations. For example, variation is seen in nature: although there is an average for seasonal variables, such as temperature and rain fall, each day or each season is a little different than the average. Some days are uncommonly warm or cold; this difference is called variation.
Variation is also observed in systems and processes, and is a characteristic of their level of performance. For example, people may be the source of variation in a system or pro-cess. For instance, if morning health facility hours are more convenient for patients, then there may be more patients in the morning than the afternoon. If the health facility is not aware of this variation, there may not be enough staff to assist the patients, resulting in long lines.
There are two types of variation. Common cause variation is found regularly within a process or system and is due to the normal fluctuation in the process or system. In a stable system common cause variation is predictable. Special cause variation, however, is caused by a circumstance out of the ordinary and cannot be predicted. For instance, a bus that operates on a schedule may arrive on the hour, give or take about five minutes; this exemplifies common cause variation. If the bus arrives exceptionally early or late, however, this could be due to special cause variation, such as an accident or break down.
There are two reasons for understanding special cause variation. If a special cause variation has a positive impact on the system, then it may suggest solutions for improve-ment and should be tested to determine whether imple-mentation of the solution would result in permanent improvement. A negative impact on the system, however, suggests that the special cause variation should be studied
2 Other recommended sources of information about quality monitoring and data collection are Bouchet (2000) and Ashton (2001).
A Modern Paradigm for Improving Healthcare Quality ◆ 11
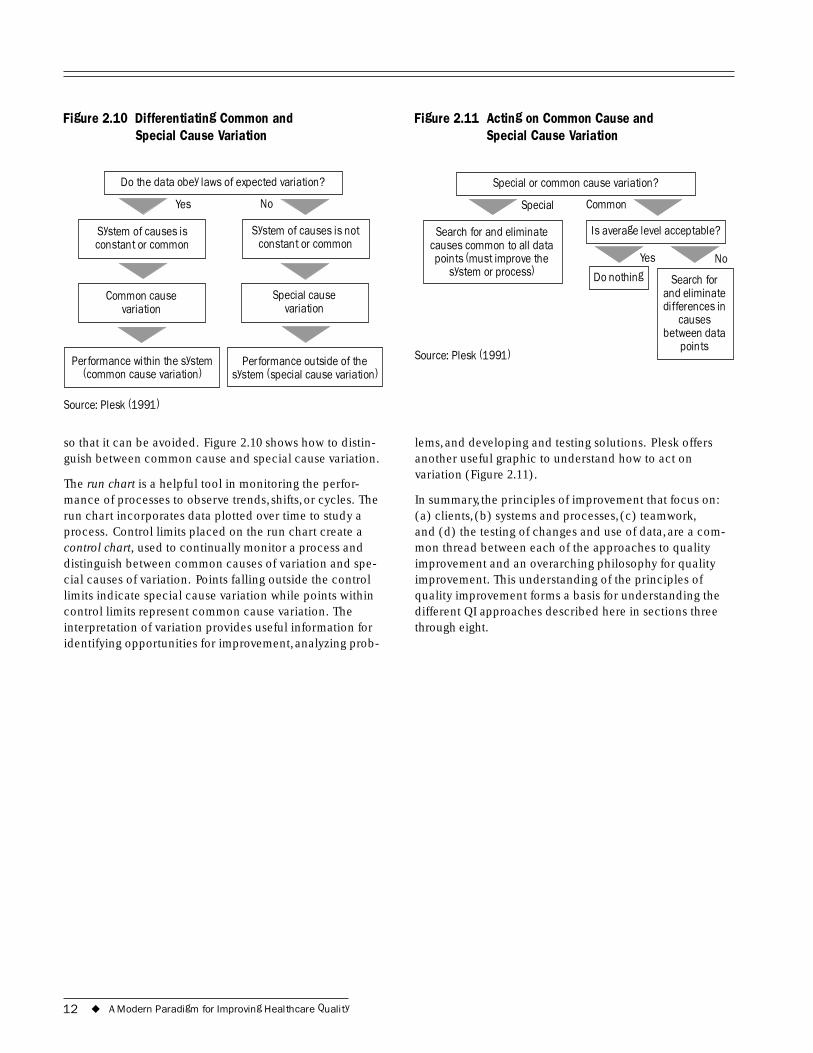
Figure 2.10 Differentiating Common and Figure 2.11 Acting on Common Cause and Special Cause Variation Special Cause Variation
Do the data obey laws of expected variation? Special or common cause variation?
constant or commonconstant or common
Common cause Special cause
System of causes is not System of causes is
variation
Performance within the system (common cause variation)
variation
Performance outside of the system (special cause variation)
Source: Plesk (1991)
so that it can be avoided. Figure 2.10 shows how to distin-guish between common cause and special cause variation.
The run chart is a helpful tool in monitoring the perfor-mance of processes to observe trends, shifts, or cycles. The run chart incorporates data plotted over time to study a process. Control limits placed on the run chart create a control chart, used to continually monitor a process and distinguish between common causes of variation and spe-cial causes of variation. Points falling outside the control limits indicate special cause variation while points within control limits represent common cause variation. The interpretation of variation provides useful information for identifying opportunities for improvement, analyzing prob-
Yes No Special Common
Search for and eliminate causes common to all data points (must improve the
system or process) Yes No
Source: Plesk (1991)
causes
points
Do nothing Search for and eliminate differences in
between data
Is average level acceptable?
lems, and developing and testing solutions. Plesk offers another useful graphic to understand how to act on variation (Figure 2.11).
In summary, the principles of improvement that focus on: (a) clients, (b) systems and processes, (c) teamwork, and (d) the testing of changes and use of data, are a com-mon thread between each of the approaches to quality improvement and an overarching philosophy for quality improvement. This understanding of the principles of quality improvement forms a basis for understanding the different QI approaches described here in sections three through eight.
12 ◆ A Modern Paradigm for Improving Healthcare Quality
3 The Spectrum of Quality Improvement Approaches
THE need for QI varies widely, depending on the health setting and circumstances: from rural health posts, to urban hospitals, to entire systems (such as
ministries of health), and from a simple process in a small system to a complex process in a large system. Although the principles of QI apply in all circumstances, different QI approaches work better under certain circumstances.
In response to the wide variety of settings and circum-stances it has encountered in over 30 developing countries, the QA Project has identified many approaches to QI. Some problems are simple in nature and can be resolved rapidly, while others involve core processes and require extensive data collection and analysis. QA Project experi-ence has demonstrated that a wide range of QI approaches exists and that they range from simple to complex.
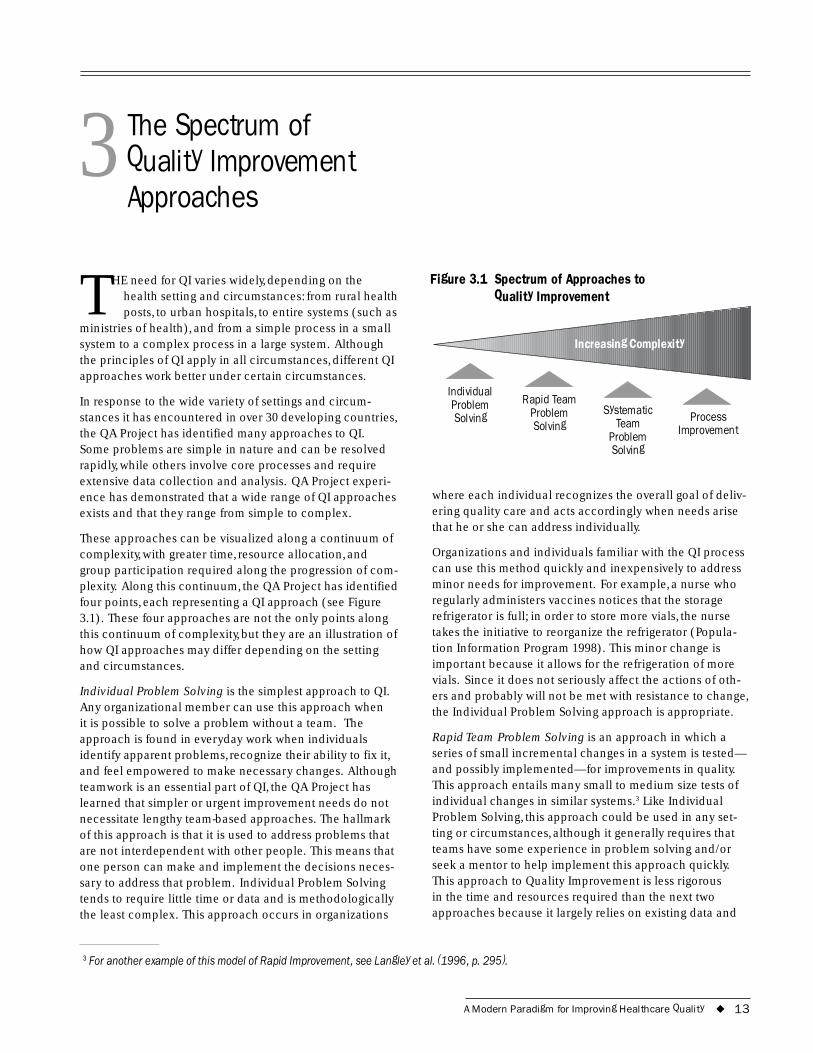
These approaches can be visualized along a continuum of complexity, with greater time, resource allocation, and group participation required along the progression of com-plexity. Along this continuum, the QA Project has identified four points, each representing a QI approach (see Figure 3.1). These four approaches are not the only points along this continuum of complexity, but they are an illustration of how QI approaches may differ depending on the setting and circumstances.
Individual Problem Solving is the simplest approach to QI. Any organizational member can use this approach when it is possible to solve a problem without a team. The approach is found in everyday work when individuals identify apparent problems, recognize their ability to fix it, and feel empowered to make necessary changes. Although teamwork is an essential part of QI, the QA Project has learned that simpler or urgent improvement needs do not necessitate lengthy team-based approaches. The hallmark of this approach is that it is used to address problems that are not interdependent with other people. This means that one person can make and implement the decisions neces-sary to address that problem. Individual Problem Solving tends to require little time or data and is methodologically the least complex. This approach occurs in organizations
Figure 3.1 Spectrum of Approaches to Quality Improvement
Individual Rapid Team Problem
Increasing Complexity
Solving Problem Systematic Process Solving Team Improvement Problem
Solving
where each individual recognizes the overall goal of deliv-ering quality care and acts accordingly when needs arise that he or she can address individually.
Organizations and individuals familiar with the QI process can use this method quickly and inexpensively to address minor needs for improvement. For example, a nurse who regularly administers vaccines notices that the storage refrigerator is full; in order to store more vials, the nurse takes the initiative to reorganize the refrigerator (Popula-tion Information Program 1998). This minor change is important because it allows for the refrigeration of more vials. Since it does not seriously affect the actions of oth-ers and probably will not be met with resistance to change, the Individual Problem Solving approach is appropriate.
Rapid Team Problem Solving is an approach in which a series of small incremental changes in a system is tested— and possibly implemented—for improvements in quality. This approach entails many small to medium size tests of individual changes in similar systems.3 Like Individual Problem Solving, this approach could be used in any set-ting or circumstances, although it generally requires that teams have some experience in problem solving and/or seek a mentor to help implement this approach quickly. This approach to Quality Improvement is less rigorous in the time and resources required than the next two approaches because it largely relies on existing data and
3 For another example of this model of Rapid Improvement, see Langley et al. (1996, p. 295).
A Modern Paradigm for Improving Healthcare Quality ◆ 13
group intuition, thereby minimizing lengthy data collection procedures. Teams are ad hoc (temporary) and disband once the desired level of improvement has been achieved.
Systematic Team Problem Solving is often used for complex or recurring problems that require a detailed analysis; it frequently results in significant changes to a system or process. The mainstay of this approach is a detailed study of the causes of problems and then developing solutions accordingly. This detailed analysis often involves data collection and therefore often requires considerable time and resources. While Systematic Team Problem Solving can be used in any setting, due to its depth in nature, it is most appropriate when the ad hoc team can work together over a period of time, but it typically disbands once sufficient improvement objectives are reached.
Process Improvement is the most complex of the four approaches as it involves a permanent team that continu-ously collects, monitors, and analyzes data to improve a key process over time. Therefore, Process Improvement generally occurs in organizations where permanent re-sources are allocated to quality improvement. This team can use any of the other three QI approaches, for example forming ad hoc teams to solve specific problems. This approach is often used to assure the quality of important services in a health facility or organization. Since this approach is often used to respond to core processes of a system, various stakeholders contribute to the analysis stage.
Table 3.1 summarizes the differences between the QI approaches.
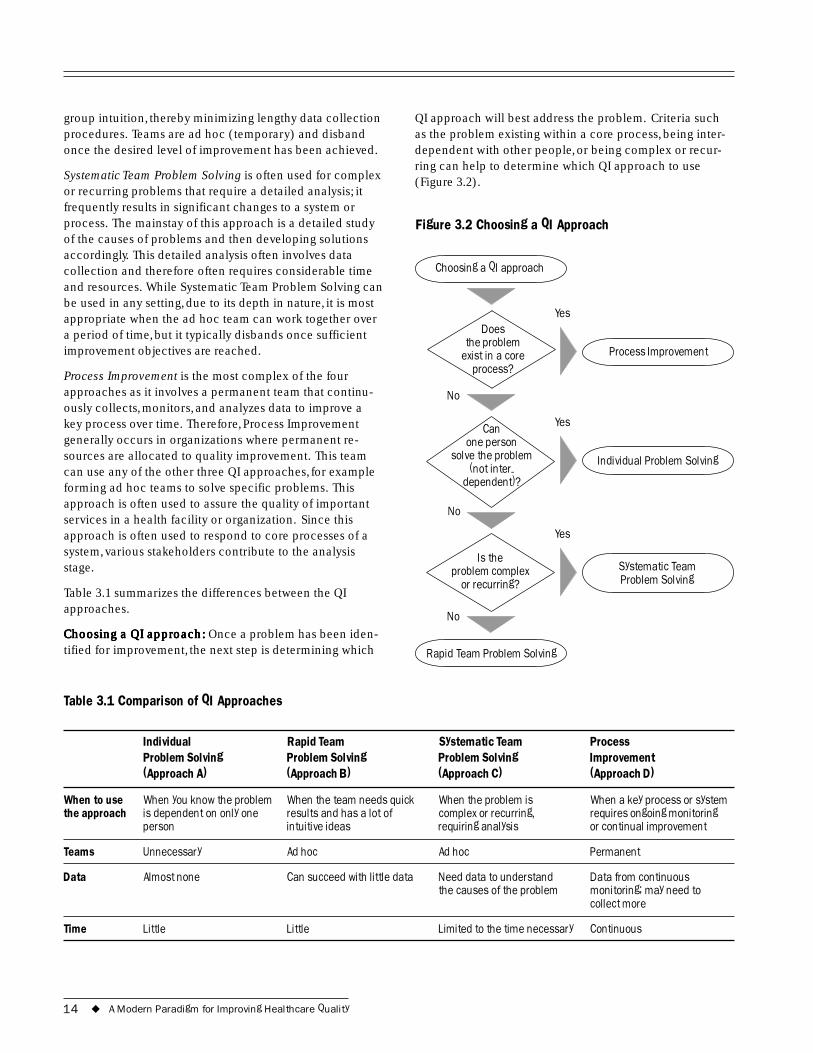
h: Once a problem has been iden-tified for improvement, the next step is determining which Choosing a QI aChoosing a QI aChoosing a QI aChoosing a QI aChoosing a QI apprpprpprpprpproacoacoacoacoach:h:h:h:
Table 3.1 Comparison of QI Approaches
QI approach will best address the problem. Criteria such as the problem existing within a core process, being inter-dependent with other people, or being complex or recur-ring can help to determine which QI approach to use (Figure 3.2).
Figure 3.2 Choosing a QI Approach
Choosing a QI approach
Does the problem
exist in a core process?
Can one person
solve the problem (not inter-
dependent)?
Is the problem complex
or recurring?
Rapid Team Problem Solving
Systematic Team Problem Solving
Individual Problem Solving
Process Improvement
Yes
No
No
No
Yes
Yes
Individual Rapid Team Systematic Team Process Problem Solving Problem Solving Problem Solving Improvement (Approach A) (Approach B) (Approach C) (Approach D)
When to use When you know the problem When the team needs quick When the problem is When a key process or system the approach is dependent on only one results and has a lot of complex or recurring, requires ongoing monitoring
person intuitive ideas requiring analysis or continual improvement
Teams Unnecessary Ad hoc Ad hoc Permanent
Data Almost none Can succeed with little data Need data to understand Data from continuous the causes of the problem monitoring; may need to
collect more
Time Little Little Limited to the time necessary Continuous
14 ◆ A Modern Paradigm for Improving Healthcare Quality
4 QI Steps
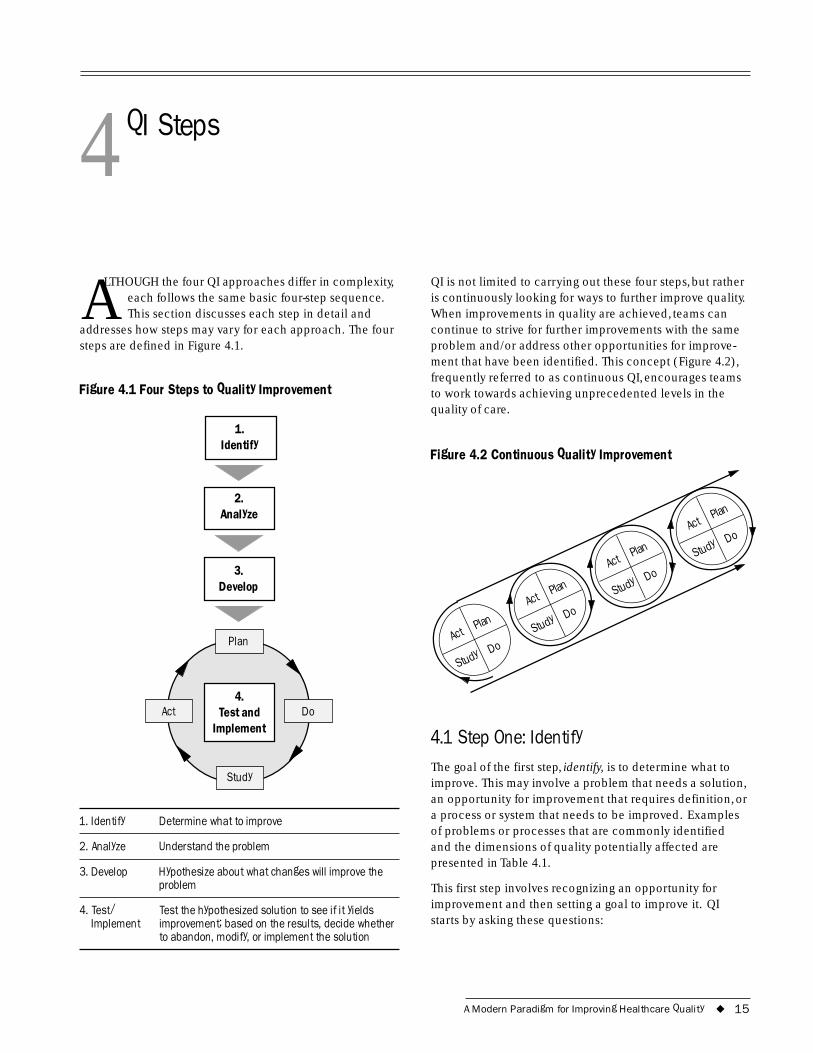
ALTHOUGH the four QI approaches differ in complexity, each follows the same basic four-step sequence. This section discusses each step in detail and
addresses how steps may vary for each approach. The four steps are defined in Figure 4.1.
Figure 4.1 Four Steps to Quality Improvement
1. Identify
2. Analyze
3.
Plan
Study
Do 4.
Implement
Develop
Act Test and
1. Identify Determine what to improve
2. Analyze Understand the problem
3. Develop Hypothesize about what changes will improve the problem
4. Test/ Test the hypothesized solution to see if it yields Implement improvement; based on the results, decide whether
to abandon, modify, or implement the solution
QI is not limited to carrying out these four steps, but rather is continuously looking for ways to further improve quality. When improvements in quality are achieved, teams can continue to strive for further improvements with the same problem and/or address other opportunities for improve-ment that have been identified. This concept (Figure 4.2), frequently referred to as continuous QI, encourages teams to work towards achieving unprecedented levels in the quality of care.
Figure 4.2 Continuous Quality Improvement
Act Plan
Study
Do
Act Plan
Study
Do
Act Plan
Study
Do
Act Plan
Study
Do
4.1 Step One: Identify The goal of the first step, identify, is to determine what to improve. This may involve a problem that needs a solution, an opportunity for improvement that requires definition, or a process or system that needs to be improved. Examples of problems or processes that are commonly identified and the dimensions of quality potentially affected are presented in Table 4.1.
This first step involves recognizing an opportunity for improvement and then setting a goal to improve it. QI starts by asking these questions:
A Modern Paradigm for Improving Healthcare Quality ◆ 15
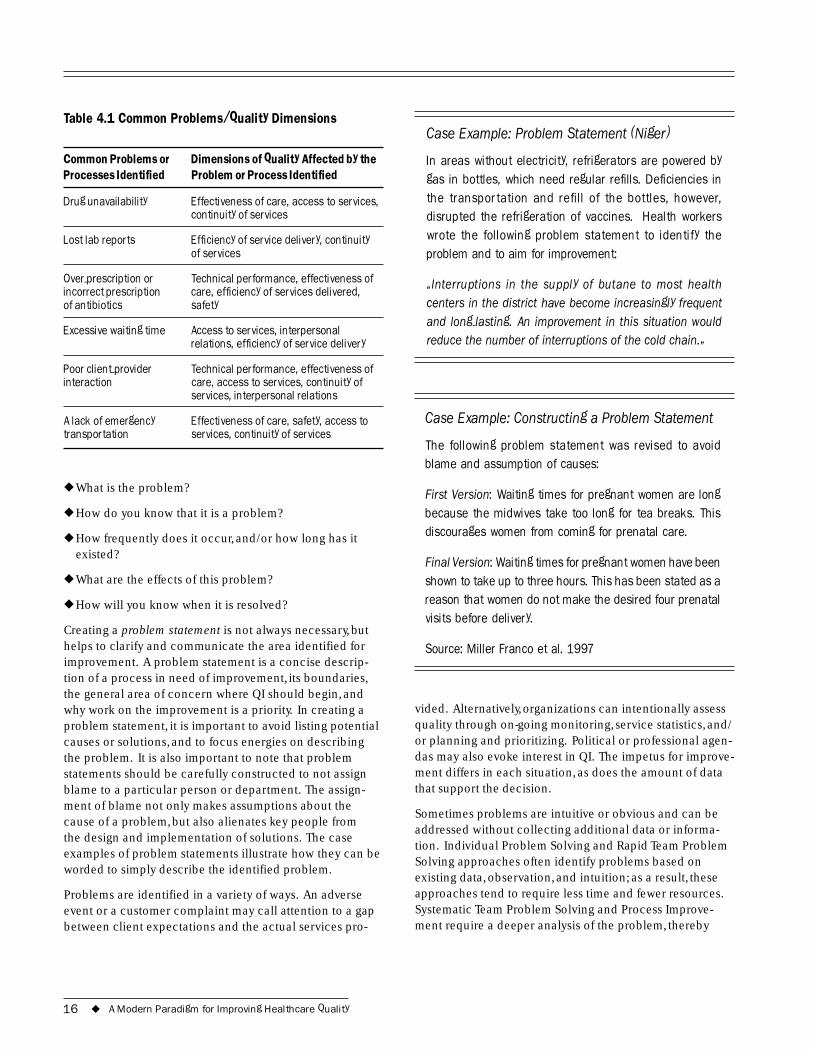
Table 4.1 Common Problems/Quality Dimensions
Common Problems or Dimensions of Quality Affected by the Processes Identified Problem or Process Identified
Drug unavailability Effectiveness of care, access to services, continuity of services
Lost lab reports Efficiency of service delivery, continuity of services
Over-prescription or Technical performance, effectiveness of incorrect prescription care, efficiency of services delivered, of antibiotics safety
Excessive waiting time Access to services, interpersonal relations, efficiency of service delivery
Poor client-provider Technical performance, effectiveness of interaction care, access to services, continuity of
services, interpersonal relations
A lack of emergency Effectiveness of care, safety, access to transportation services, continuity of services
◆ What is the problem?
◆ How do you know that it is a problem?
◆ How frequently does it occur, and/or how long has it existed?
◆ What are the effects of this problem?
◆ How will you know when it is resolved?
Creating a problem statement is not always necessary, but helps to clarify and communicate the area identified for improvement. A problem statement is a concise descrip-tion of a process in need of improvement, its boundaries, the general area of concern where QI should begin, and why work on the improvement is a priority. In creating a problem statement, it is important to avoid listing potential causes or solutions, and to focus energies on describing the problem. It is also important to note that problem statements should be carefully constructed to not assign blame to a particular person or department. The assign-ment of blame not only makes assumptions about the cause of a problem, but also alienates key people from the design and implementation of solutions. The case examples of problem statements illustrate how they can be worded to simply describe the identified problem.
Problems are identified in a variety of ways. An adverse event or a customer complaint may call attention to a gap between client expectations and the actual services pro-
Case Example: Problem Statement (Niger)
In areas without electricity, refrigerators are powered by gas in bottles, which need regular refills. Deficiencies in the transportation and refill of the bottles, however, disrupted the refrigeration of vaccines. Health workers wrote the following problem statement to identify the problem and to aim for improvement:
�Interruptions in the supply of butane to most health centers in the district have become increasingly frequent and long-lasting. An improvement in this situation would reduce the number of interruptions of the cold chain.�
Case Example: Constructing a Problem Statement
The following problem statement was revised to avoid blame and assumption of causes:
First Version: Waiting times for pregnant women are long because the midwives take too long for tea breaks. This discourages women from coming for prenatal care.
Final Version: Waiting times for pregnant women have been shown to take up to three hours. This has been stated as a reason that women do not make the desired four prenatal visits before delivery.
Source: Miller Franco et al. 1997
vided. Alternatively, organizations can intentionally assess quality through on-going monitoring, service statistics, and/ or planning and prioritizing. Political or professional agen-das may also evoke interest in QI. The impetus for improve-ment differs in each situation, as does the amount of data that support the decision.
Sometimes problems are intuitive or obvious and can be addressed without collecting additional data or informa-tion. Individual Problem Solving and Rapid Team Problem Solving approaches often identify problems based on existing data, observation, and intuition; as a result, these approaches tend to require less time and fewer resources. Systematic Team Problem Solving and Process Improve-ment require a deeper analysis of the problem, thereby
16 ◆ A Modern Paradigm for Improving Healthcare Quality
Case Example: Problem Identification through an Adverse Event (Zambia)
A quality assurance team at a hospital in Zambia noted a shortage in medication for Acute Respiratory Infections (ARI) for children under five.
What is the problem? A shortage of ARI drugs for children under five exists.
How do you know it is a problem? Drugs run out by the third week of the month.
How frequently does it occur? This shortage has occurred every month for the past nine months.
What are the effects of this problem? Patients develop complications and increased referrals to a first-level facility.
How will you know when it is resolved? The problem will be resolved when ARI drugs last until the end of the month.
Case Example: Problem Identification through On-Going Monitoring (Niger)
A quality assurance team at a rural health center reviewed vaccination data and found low coverage rates for the measles vaccine.
What is the problem? The coverage of the measles vaccine (children 0�11 months) is low.
How do you know it is a problem? The vaccine data from the previous year revealed the low coverage rate.
How frequently does it occur? Approximately 8 out of 10 children (0�11 months) do not receive the measles vaccine.
What are the effects of this problem? There are measles epidemics causing children to suffer.
How will you know when it is resolved? Increased coverage of children with the measles vaccine.
necessitating data collection and team work. Although the identification process varies according to which approach is appropriate, this step remains crucial for all approaches in order to define the problem or opportunity for improvement.
4.2 Step Two: Analyze Once a problem or opportunity for improvement has been identified, the second step analyzes what must be known or understood before changes are considered. The objectives of the analysis can be any combination of the following:
◆ Clarify why the process or system produces the effect that we aim to improve
◆ Measure the performance of the process or system that produces the effect
◆ Formulate research questions, such as:
Who is involved or affected?
Where does the problem occur?
When does the problem occur?
What happens when the problem occurs?
Why does the problem occur?
◆ Learn about internal and external clients, such as their involvement in the process being analyzed and needs and opinions about the problem
To reach these goals, the analysis stage uses existing data or requires data collection. The extent to which data are used depends on the QI approach chosen. Data are an important part of problem analysis in that they help to:
◆ Document the problem
◆ Provide credibility regarding the need for improvement
◆ Help to identify possible solutions
A few techniques for analyzing problems include:
◆ Clarifying the processes through flowcharts or cause-and-effect analyses
◆ Reviewing existing data
◆ Collecting additional data
A Modern Paradigm for Improving Healthcare Quality ◆ 17
Data can also be used to conduct a root cause analysis of the problem to discover the underlying causes for the occurrence of a problem. This in-depth analysis is useful when the causes of a complex and/or recurring problem are unclear, or require more definition. A root cause is defined by the following criteria (IHI 1995):
◆ Directly and economically controllable
◆ A fixed part of the area in need of improvement
◆ If the root cause is eliminated, the problem is drastically reduced
Possible causes are first identified through tools such as cause-and-effect diagrams (Section 9) and then screened to determine which are most likely to cause the problem. Causes are then ruled in or out as a root cause through further investigation. If resources and time allow, data collection can be used to narrow down the list of hypoth-esized causes as well as test and quantify the most likely causes of the problem. Intuition and team consensus are also valuable in determining root causes, especially when time and resources are limited.
Although a root cause analysis could be conducted in the problem analysis of any of the quality improvement approaches, it is most commonly used by Systematic Team Problem Solving teams that are addressing complex and recurring problems with unclear causes.
Like the identification stage, the analysis step is an essen-tial element of each approach, but varies in its depth depending on which QI approach is being used. Individual Problem Solving could rely on one individual’s analysis or intuition of a problem and does not normally require extensive additional data in order to understand the prob-lem. Rapid Team Problem Solving uses as much existing data as possible to analyze the problem, saving time and money by collecting only minimal additional data. System-atic Team Problem Solving uses existing data and data collection to conduct an in-depth analysis of the problem and often requires extensive time and resources. Finally, Process Improvement requires detailed knowledge of the area identified for improvement and necessitates ongoing data collection to monitor the process over time.
4.3 Step Three: Develop The first two steps helped us to: (a) identify what we want to improve, and (b) analyze the information we need to understand to make the improvement. The third step, “develop,” uses the information from the previous steps to
ask what changes will yield improvement. The answer provides a hypothesis about what changes, would solve the problem and in turn improve the quality of care. A hypoth-esis is an educated guess; in Step 3, a hypothesis is an edu-cated guess about what would solve the problem. It is crucial to remember that at this point the hypothesis remains a theory, as it has not yet been tested.
Hypotheses are developed in a variety of ways, depending on the QI approach being used. Using the Individual Prob-lem Solving, individuals develop specific minor changes in the system. These small changes effect few people and require less planning and time. This method generally does not require teams or outside experts for the development of hypotheses for improvements.
The other three approaches generally require hypotheses development:
◆ Rapid Team Problem Solving involves the development of a series of small changes to be sequentially tested and possibly implemented.
◆ Systematic Team Problem Solving develops solutions directed towards the root cause of a problem and there-fore these changes are generally large.
◆ Process Improvement involves the permanent monitor-ing and improvement of a key process and therefore encounters a variety of improvement needs over-time.
Changes may affect different processes and impact a lot of people, so they require significant planning. Although the change may result in improved quality, people often feel apprehensive about change and resist it, especially if they did not participate in developing the change. Therefore, changes at this level require time for organizational mem-bers to grow accustomed to the new ideas and learn the new methods. Resistance to change can be prevented through group participation and time for adjustment.
4.4 Step Four: Test and Implement This stage of quality improvement builds upon the previous steps where an improvement area was identified, analyzed, and then hypothetical interventions4 or solutions were posed. This final step in the process tests the hypothesis to see if the proposed intervention yields the expected im-provement. It is important to remember that large changes should be tested extensively and modified to reduce the risk of the intervention not working and that interventions may not yield immediate results even if they are effective. Allowing time for change to occur is important in the
4 �Intervention� refers to any change in the existing system or process that would likely yield an improvement.
18 ◆ A Modern Paradigm for Improving Healthcare Quality
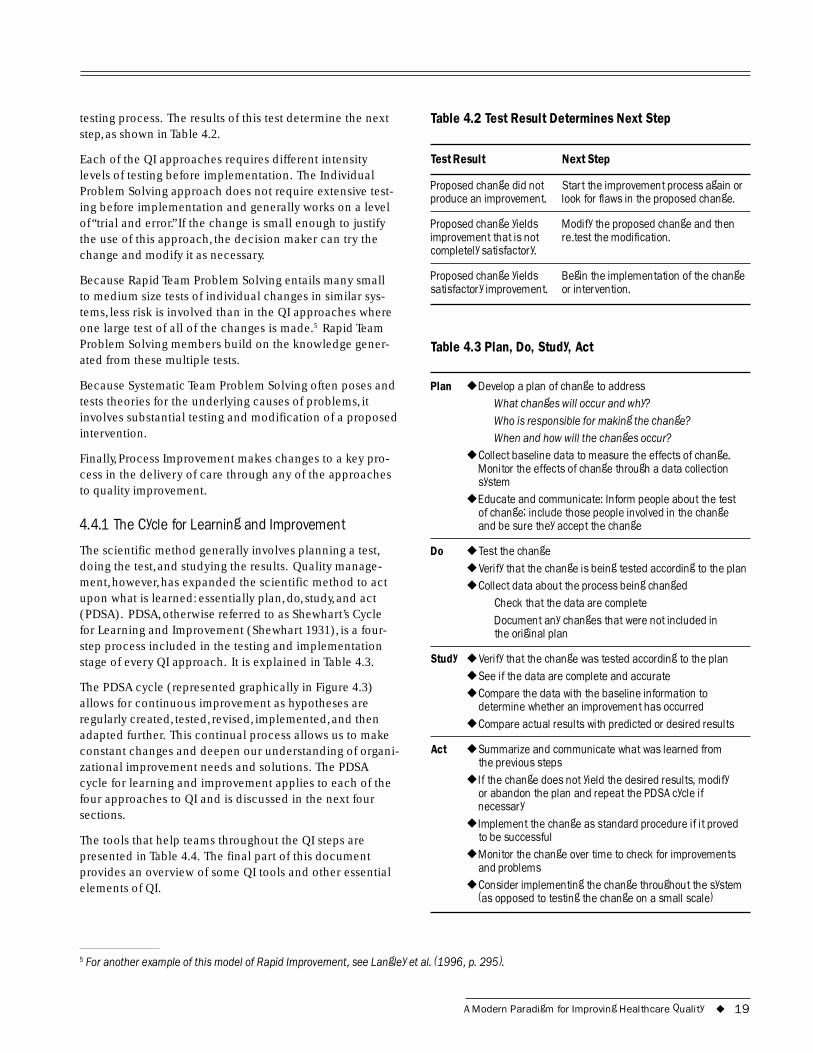
testing process. The results of this test determine the next step, as shown in Table 4.2.
Each of the QI approaches requires different intensity levels of testing before implementation. The Individual Problem Solving approach does not require extensive test-ing before implementation and generally works on a level of “trial and error.” If the change is small enough to justify the use of this approach, the decision maker can try the change and modify it as necessary.
Because Rapid Team Problem Solving entails many small to medium size tests of individual changes in similar sys-tems, less risk is involved than in the QI approaches where one large test of all of the changes is made.5 Rapid Team Problem Solving members build on the knowledge gener-ated from these multiple tests.
Because Systematic Team Problem Solving often poses and tests theories for the underlying causes of problems, it involves substantial testing and modification of a proposed intervention.
Finally, Process Improvement makes changes to a key pro-cess in the delivery of care through any of the approaches to quality improvement.
4.4.1 The Cycle for Learning and Improvement
The scientific method generally involves planning a test, doing the test, and studying the results. Quality manage-ment, however, has expanded the scientific method to act upon what is learned: essentially plan, do, study, and act (PDSA). PDSA, otherwise referred to as Shewhart’s Cycle for Learning and Improvement (Shewhart 1931), is a four-step process included in the testing and implementation stage of every QI approach. It is explained in Table 4.3.
The PDSA cycle (represented graphically in Figure 4.3) allows for continuous improvement as hypotheses are regularly created, tested, revised, implemented, and then adapted further. This continual process allows us to make constant changes and deepen our understanding of organi-zational improvement needs and solutions. The PDSA cycle for learning and improvement applies to each of the four approaches to QI and is discussed in the next four sections.
The tools that help teams throughout the QI steps are presented in Table 4.4. The final part of this document provides an overview of some QI tools and other essential elements of QI.
Table 4.2 Test Result Determines Next Step
Test Result Next Step
Proposed change did not Start the improvement process again or produce an improvement. look for flaws in the proposed change.
Proposed change yields Modify the proposed change and then improvement that is not re-test the modification. completely satisfactory.
Proposed change yields Begin the implementation of the change satisfactory improvement. or intervention.
Table 4.3 Plan, Do, Study, Act
Plan ◆ Develop a plan of change to address What changes will occur and why? Who is responsible for making the change? When and how will the changes occur?
◆ Collect baseline data to measure the effects of change. Monitor the effects of change through a data collection system
◆ Educate and communicate: Inform people about the test of change; include those people involved in the change and be sure they accept the change
Do ◆ Test the change ◆ Verify that the change is being tested according to the plan ◆ Collect data about the process being changed
Check that the data are complete Document any changes that were not included in the original plan
Study ◆ Verify that the change was tested according to the plan ◆ See if the data are complete and accurate ◆ Compare the data with the baseline information to
determine whether an improvement has occurred ◆ Compare actual results with predicted or desired results
Act ◆ Summarize and communicate what was learned from the previous steps
◆ If the change does not yield the desired results, modify or abandon the plan and repeat the PDSA cycle if necessary
◆ Implement the change as standard procedure if it proved to be successful
◆ Monitor the change over time to check for improvements and problems
◆ Consider implementing the change throughout the system (as opposed to testing the change on a small scale)
5 For another example of this model of Rapid Improvement, see Langley et al. (1996, p. 295).
A Modern Paradigm for Improving Healthcare Quality ◆ 19
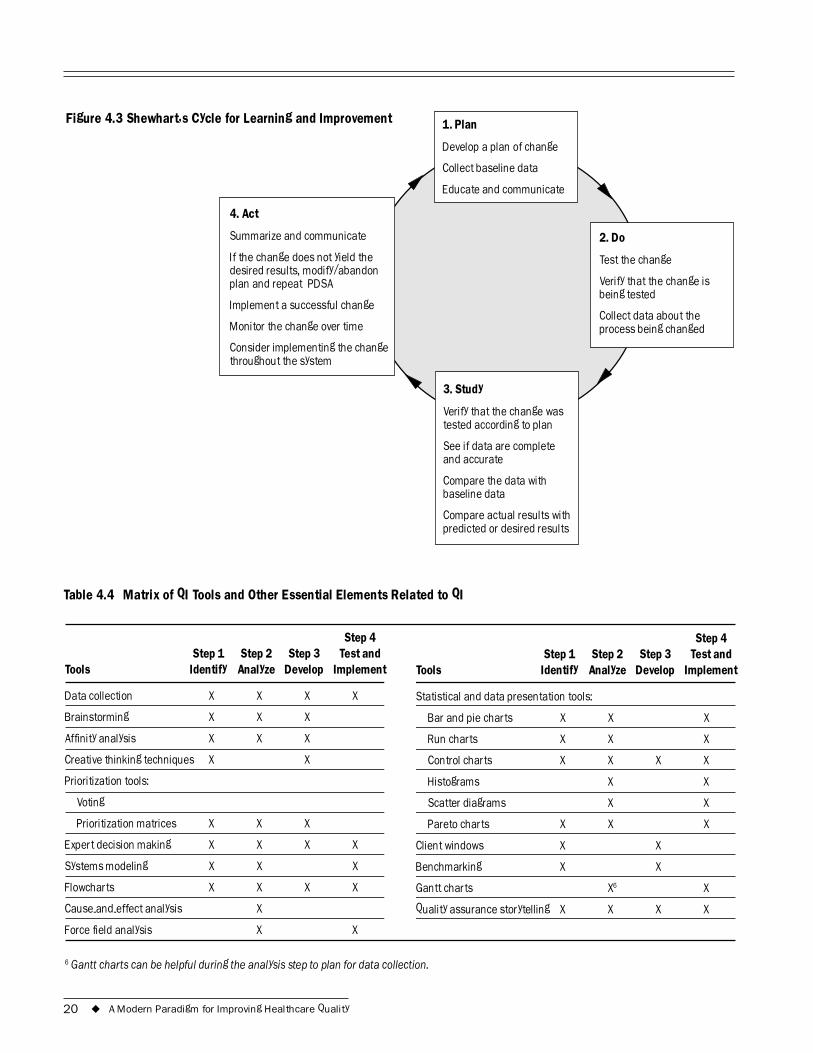
1. Plan
Collect baseline data
2. Do
Collect data about the
baseline data
desired results, modify/abandon plan and repeat PDSA
I
Figure 4.3 Shewhart�s Cycle for Learning and Improvement
Develop a plan of change
Educate and communicate
Test the change
Verify that the change is being tested
process being changed
3. Study
Verify that the change was tested according to plan
See if data are complete and accurate
Compare the data with
Compare actual results with predicted or desired results
4. Act
Summarize and communicate
If the change does not yield the
mplement a successful change
Monitor the change over time
Consider implementing the change throughout the system
Table 4.4 Matrix of QI Tools and Other Essential Elements Related to QI
Step 4 Step 4 Step 1 Step 2 Step 3 Test and Step 1 Step 2 Step 3 Test and
Tools Identify Analyze Develop Implement Tools Identify Analyze Develop Implement
Data collection X X X X Statistical and data presentation tools:
Brainstorming X X X Bar and pie charts X X X
Affinity analysis X X X Run charts X X X
Creative thinking techniques X X Control charts X X X X
Prioritization tools: Histograms X X
Voting Scatter diagrams X X
Prioritization matrices X X X Pareto charts X X X
Expert decision making X X X X Client windows X X
Systems modeling X X X Benchmarking X X
Flowcharts X X X X Gantt charts X6 X
Cause-and-effect analysis X Quality assurance storytelling X X X X
Force field analysis X X
6 Gantt charts can be helpful during the analysis step to plan for data collection.
20 ◆ A Modern Paradigm for Improving Healthcare Quality
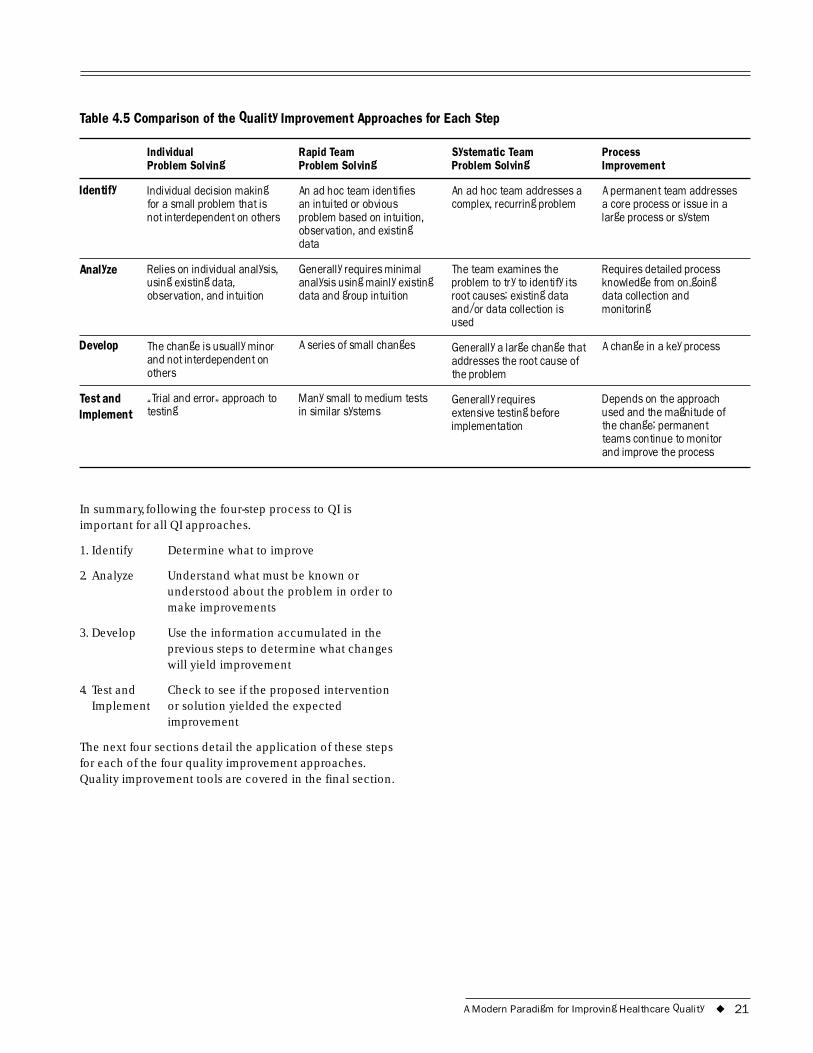
Table 4.5 Comparison of the Quality Improvement Approaches for Each Step
Individual Problem Solving
Rapid Team Problem Solving
Systematic Team Problem Solving
Process Improvement
Identify Individual decision making for a small problem that is not interdependent on others
An ad hoc team identifies an intuited or obvious problem based on intuition, observation, and existing data
An ad hoc team addresses a complex, recurring problem
A permanent team addresses a core process or issue in a large process or system
Analyze Relies on individual analysis, using existing data, observation, and intuition
Generally requires minimal analysis using mainly existing data and group intuition
The team examines the problem to try to identify its root causes; existing data and/or data collection is used
Requires detailed process knowledge from on-going data collection and monitoring
Develop The change is usually minor and not interdependent on others
A series of small changes Generally a large change that addresses the root cause of the problem
A change in a key process
Test and Implement
�Trial and error� approach to testing
Many small to medium tests in similar systems
Generally requires extensive testing before implementation
Depends on the approach used and the magnitude of the change; permanent teams continue to monitor and improve the process
In summary, following the four-step process to QI is important for all QI approaches.
1. Identify Determine what to improve
2. Analyze Understand what must be known or understood about the problem in order to make improvements
3. Develop Use the information accumulated in the previous steps to determine what changes will yield improvement
4. Test and Implement
Check to see if the proposed intervention or solution yielded the expected improvement
The next four sections detail the application of these steps for each of the four quality improvement approaches. Quality improvement tools are covered in the final section.
A Modern Paradigm for Improving Healthcare Quality ◆ 21

22 ◆ A Modern Paradigm for Improving Healthcare Quality
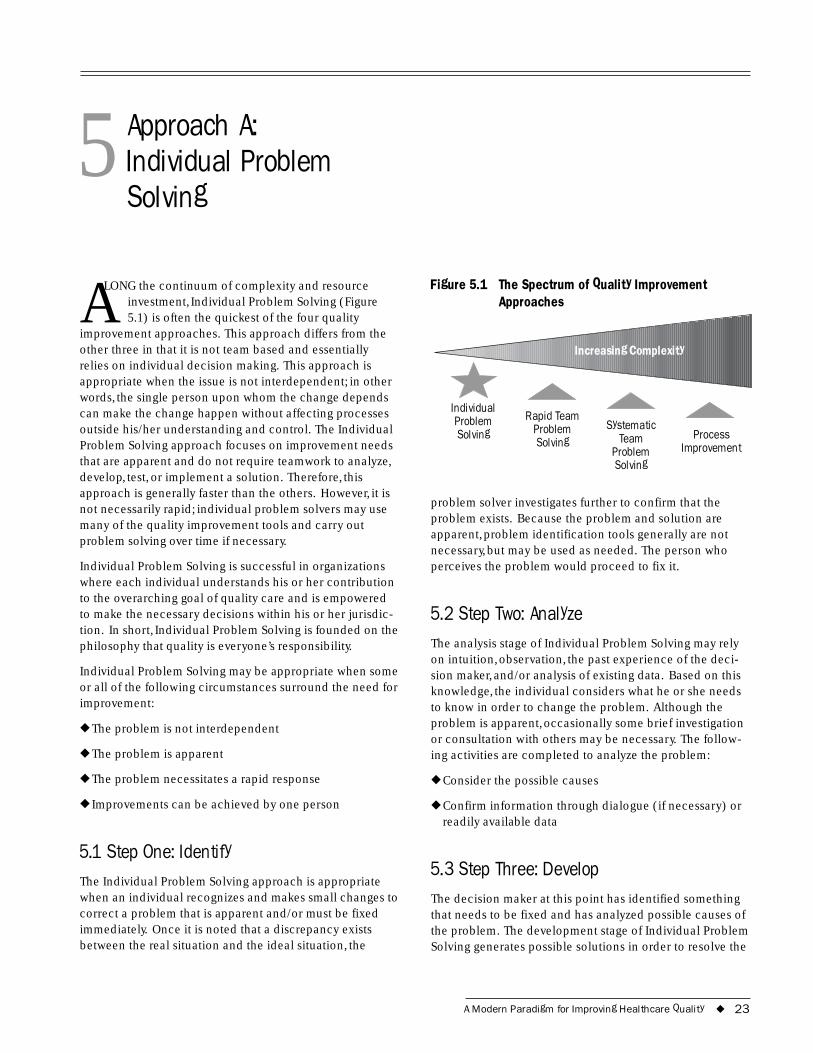
5 Approach A: Individual Problem Solving
ALONG the continuum of complexity and resource investment, Individual Problem Solving (Figure 5.1) is often the quickest of the four quality
improvement approaches. This approach differs from the other three in that it is not team based and essentially relies on individual decision making. This approach is appropriate when the issue is not interdependent; in other words, the single person upon whom the change depends can make the change happen without affecting processes outside his/her understanding and control. The Individual Problem Solving approach focuses on improvement needs that are apparent and do not require teamwork to analyze, develop, test, or implement a solution. Therefore, this approach is generally faster than the others. However, it is not necessarily rapid; individual problem solvers may use many of the quality improvement tools and carry out problem solving over time if necessary.
Individual Problem Solving is successful in organizations where each individual understands his or her contribution to the overarching goal of quality care and is empowered to make the necessary decisions within his or her jurisdic-tion. In short, Individual Problem Solving is founded on the philosophy that quality is everyone’s responsibility.
Individual Problem Solving may be appropriate when some or all of the following circumstances surround the need for improvement:
◆ The problem is not interdependent
◆ The problem is apparent
◆ The problem necessitates a rapid response
◆ Improvements can be achieved by one person
5.1 Step One: Identify The Individual Problem Solving approach is appropriate when an individual recognizes and makes small changes to correct a problem that is apparent and/or must be fixed immediately. Once it is noted that a discrepancy exists between the real situation and the ideal situation, the
Figure 5.1 The Spectrum of Quality Improvement Approaches
Individual Rapid Team Problem
Increasing Complexity
Problem Systematic Solving
Solving Team Process Problem Improvement Solving
problem solver investigates further to confirm that the problem exists. Because the problem and solution are apparent, problem identification tools generally are not necessary, but may be used as needed. The person who perceives the problem would proceed to fix it.
5.2 Step Two: Analyze The analysis stage of Individual Problem Solving may rely on intuition, observation, the past experience of the deci-sion maker, and/or analysis of existing data. Based on this knowledge, the individual considers what he or she needs to know in order to change the problem. Although the problem is apparent, occasionally some brief investigation or consultation with others may be necessary. The follow-ing activities are completed to analyze the problem:
◆ Consider the possible causes
◆ Confirm information through dialogue (if necessary) or readily available data
5.3 Step Three: Develop The decision maker at this point has identified something that needs to be fixed and has analyzed possible causes of the problem. The development stage of Individual Problem Solving generates possible solutions in order to resolve the
A Modern Paradigm for Improving Healthcare Quality ◆ 23
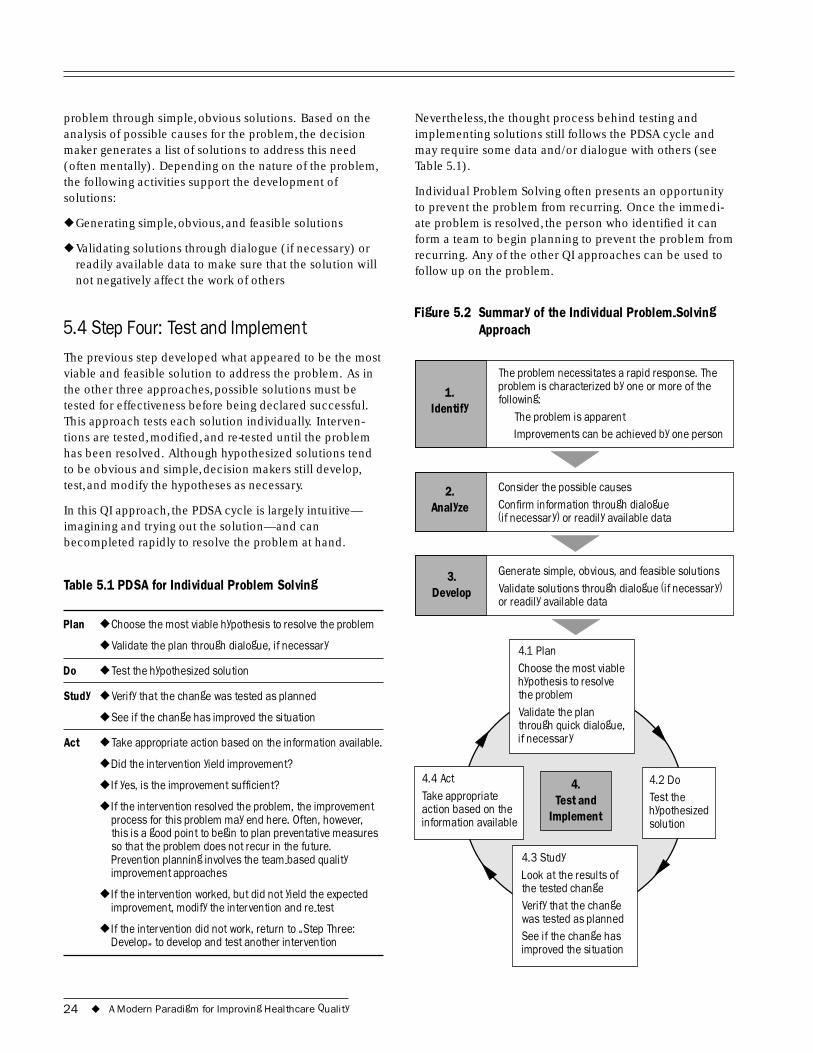
problem through simple, obvious solutions. Based on the analysis of possible causes for the problem, the decision maker generates a list of solutions to address this need (often mentally). Depending on the nature of the problem, the following activities support the development of solutions:
◆ Generating simple, obvious, and feasible solutions
◆ Validating solutions through dialogue (if necessary) or readily available data to make sure that the solution will not negatively affect the work of others
5.4 Step Four: Test and Implement The previous step developed what appeared to be the most viable and feasible solution to address the problem. As in the other three approaches, possible solutions must be tested for effectiveness before being declared successful. This approach tests each solution individually. Interven-tions are tested, modified, and re-tested until the problem has been resolved. Although hypothesized solutions tend to be obvious and simple, decision makers still develop, test, and modify the hypotheses as necessary.
In this QI approach, the PDSA cycle is largely intuitive— imagining and trying out the solution—and can becompleted rapidly to resolve the problem at hand.
Table 5.1 PDSA for Individual Problem Solving
Plan ◆ Choose the most viable hypothesis to resolve the problem
◆ Validate the plan through dialogue, if necessary
Do ◆ Test the hypothesized solution
Study ◆ Verify that the change was tested as planned
◆ See if the change has improved the situation
Act ◆ Take appropriate action based on the information available.
◆ Did the intervention yield improvement?
◆ If yes, is the improvement sufficient?
◆ If the intervention resolved the problem, the improvement process for this problem may end here. Often, however, this is a good point to begin to plan preventative measures so that the problem does not recur in the future. Prevention planning involves the team-based quality improvement approaches
◆ If the intervention worked, but did not yield the expected improvement, modify the intervention and re-test
◆ If the intervention did not work, return to �Step Three: Develop� to develop and test another intervention
Nevertheless, the thought process behind testing and implementing solutions still follows the PDSA cycle and may require some data and/or dialogue with others (see Table 5.1).
Individual Problem Solving often presents an opportunity to prevent the problem from recurring. Once the immedi-ate problem is resolved, the person who identified it can form a team to begin planning to prevent the problem from recurring. Any of the other QI approaches can be used to follow up on the problem.
Figure 5.2 Summary of the Individual Problem-Solving Approach
i :
I
Consider the possible causes
1. Identify
2. Analyze
3.
4.
Implement
4.2 Do
solution
Choose the most viable
4.3 Study Look at the results of
See if the change has
action based on the i
The problem necessitates a rapid response. The problem is characterized by one or more of the follow ng
The problem is apparent mprovements can be achieved by one person
Confirm information through dialogue (if necessary) or readily available data
Generate simple, obvious, and feasible solutions Validate solutions through dialogue (if necessary) or readily available data
Develop
Test and Test the hypothesized
4.1 Plan
hypothesis to resolve the problem Validate the plan through quick dialogue, if necessary
the tested change Verify that the change was tested as planned
improved the situation
4.4 Act Take appropriate
nformation available
24 ◆ A Modern Paradigm for Improving Healthcare Quality
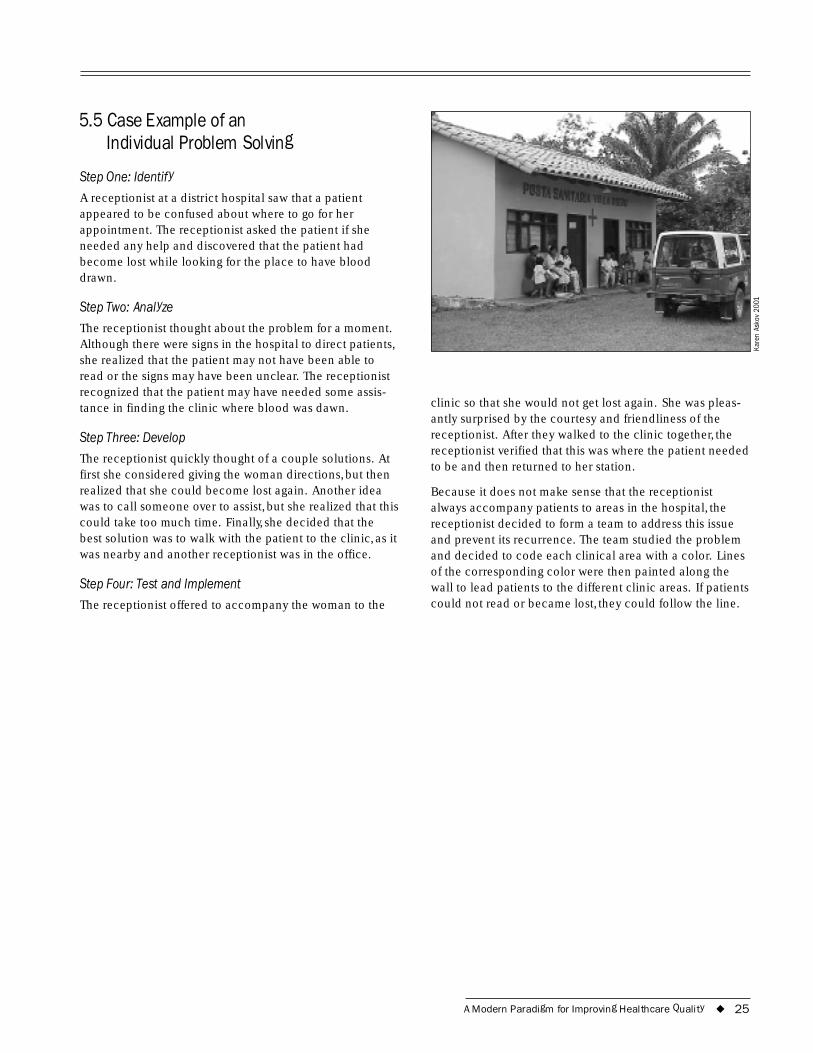
5.5 Case Example of an Individual Problem Solving
Step One: Identify
A receptionist at a district hospital saw that a patient appeared to be confused about where to go for her appointment. The receptionist asked the patient if she needed any help and discovered that the patient had become lost while looking for the place to have blood drawn.
Step Two: Analyze
The receptionist thought about the problem for a moment. Although there were signs in the hospital to direct patients, she realized that the patient may not have been able to read or the signs may have been unclear. The receptionist recognized that the patient may have needed some assis-tance in finding the clinic where blood was dawn.
Step Three: Develop
The receptionist quickly thought of a couple solutions. At first she considered giving the woman directions, but then realized that she could become lost again. Another idea was to call someone over to assist, but she realized that this could take too much time. Finally, she decided that the best solution was to walk with the patient to the clinic, as it was nearby and another receptionist was in the office.
Step Four: Test and Implement
The receptionist offered to accompany the woman to the
Kare
n As
kov
2001
clinic so that she would not get lost again. She was pleas-antly surprised by the courtesy and friendliness of the receptionist. After they walked to the clinic together, the receptionist verified that this was where the patient needed to be and then returned to her station.
Because it does not make sense that the receptionist always accompany patients to areas in the hospital, the receptionist decided to form a team to address this issue and prevent its recurrence. The team studied the problem and decided to code each clinical area with a color. Lines of the corresponding color were then painted along the wall to lead patients to the different clinic areas. If patients could not read or became lost, they could follow the line.
A Modern Paradigm for Improving Healthcare Quality ◆ 25

26 ◆ A Modern Paradigm for Improving Healthcare Quality
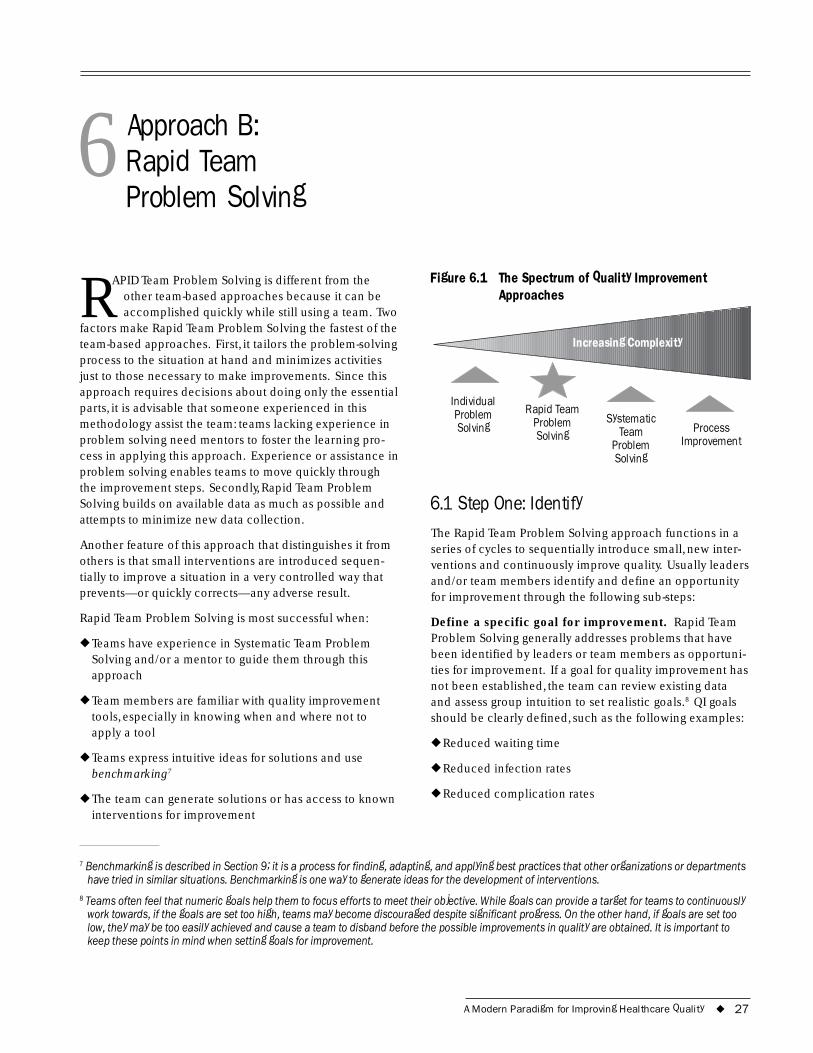
6 Approach B:Rapid TeamProblem Solving
RAPID Team Problem Solving is different from the other team-based approaches because it can be accomplished quickly while still using a team. Two
factors make Rapid Team Problem Solving the fastest of the team-based approaches. First, it tailors the problem-solving process to the situation at hand and minimizes activities just to those necessary to make improvements. Since this approach requires decisions about doing only the essential parts, it is advisable that someone experienced in this methodology assist the team: teams lacking experience in problem solving need mentors to foster the learning pro-cess in applying this approach. Experience or assistance in problem solving enables teams to move quickly through the improvement steps. Secondly, Rapid Team Problem Solving builds on available data as much as possible and attempts to minimize new data collection.
Another feature of this approach that distinguishes it from others is that small interventions are introduced sequen-tially to improve a situation in a very controlled way that prevents—or quickly corrects—any adverse result.
Rapid Team Problem Solving is most successful when:
◆ Teams have experience in Systematic Team Problem Solving and/or a mentor to guide them through this approach
◆ Team members are familiar with quality improvement tools, especially in knowing when and where not to apply a tool
◆ Teams express intuitive ideas for solutions and use benchmarking7
◆ The team can generate solutions or has access to known interventions for improvement
Figure 6.1
Individual Problem Rapid Team
Solving
Increasing Complexity
The Spectrum of Quality Improvement Approaches
Problem Systematic Solving Team Process
Problem Improvement Solving
6.1 Step One: Identify The Rapid Team Problem Solving approach functions in a series of cycles to sequentially introduce small, new inter-ventions and continuously improve quality. Usually leaders and/or team members identify and define an opportunity for improvement through the following sub-steps:
Define a specific goal for improvement. Rapid Team Problem Solving generally addresses problems that have been identified by leaders or team members as opportuni-ties for improvement. If a goal for quality improvement has not been established, the team can review existing data and assess group intuition to set realistic goals.8 QI goals should be clearly defined, such as the following examples:
◆ Reduced waiting time
◆ Reduced infection rates
◆ Reduced complication rates
7 Benchmarking is described in Section 9; it is a process for finding, adapting, and applying best practices that other organizations or departments have tried in similar situations. Benchmarking is one way to generate ideas for the development of interventions.
8 Teams often feel that numeric goals help them to focus efforts to meet their objective. While goals can provide a target for teams to continuously work towards, if the goals are set too high, teams may become discouraged despite significant progress. On the other hand, if goals are set too low, they may be too easily achieved and cause a team to disband before the possible improvements in quality are obtained. It is important to keep these points in mind when setting goals for improvement.
A Modern Paradigm for Improving Healthcare Quality ◆ 27
Once a specific aim for improvement has been defined, the identification process proceeds to define teams and achieve consensus for the aim.
Decide who needs to be on the problem-solving team. The team must be chosen carefully to ensure that key players who can provide insight into the problem are represented. For example, a hospital QI team that wants to address medicine shortages should recognize the need to include pharmacists so that their knowledge of the pro-cesses of ordering supplies and prescribing medication is represented.
Achieve consensus for the aim. It is crucial that a team re-clarify the problem that they wish to address and goals for improvement so that all members understand what they are working toward. Problem-solving teams should con-sider constraints in time, money, and feasibility in address-ing aims for improvement. If an improvement need does not seem self-evident, teams may use tools such as the priority matrix to prioritize improvement needs. Agree-ment regarding which improvement need to address can be achieved by voting. Section 9 provides a detailed description of these tools and activities.
6.2 Step Two: Analyze Activities in the analysis stage allow the team to explore what it needs to know or understand in order to make an improvement. To reach this understanding, teams:
Analyze available and readily accessible data and information. Rapid Team Problem Solving attempts to achieve rapid improvement and therefore minimizes the use of data. Only what a team needs to know about an area of improvement is studied, so data analysis mostly relies on existing data and the intuition of the group. Process description tools, such as flowcharts and cause-and-effect diagrams, aid teams in drawing out group experi-ence and analyzing the information available; however, these tools are used only if they are critical to the problem-solving process.
Identify indicators to measure achievements. Indica-tors are variables or characteristics that can be measured and monitored to test the achievement of quality improve-ment goals. Indicators are critical in understanding the impact of an intervention or solution and in determining whether implementation should continue. Teams need to know how to determine if a change results in improvement. Therefore, teams must tie the aim to an indicator to be able to test for the change’s impact.
When using limited data, run charts help to track trends or patterns in the indicators. This tool improves a team’s
ability to monitor and predict the performance of processes (Please see Section 9 for more information). Possible indicators for improvement goals mentioned previously are in Table 6.1.
Table 6.1 Sample Indicators for Improvement Goals
Aim for Improvement Sample Indicators
Reduced waiting time Average number of minutes a patient waits for a procedure
Reduced infection rates Percentage of patients with a post-operative infection
Reduced complication rates Percentage of patients who experience complications
Collect data prior to an intervention if available data are not sufficient. Baseline data (data collected before implementing an intervention) are needed for comparison with post-intervention data to assess the intervention’s effectiveness. If this information is not readily available, some data collection may be necessary. Rapid Team Problem Solving uses only the data necessary to understand the area of improvement and therefore limits data collection to critical information only. Teams collect a minimal set of data that provides enough informa-tion about the area of improvement and does not require large amounts of time or money.
For example, a team may collect data on a sample (a repre-sentative subgroup) of patients, such as five to ten per day for two weeks. Although the sample size is small, if the data are collected correctly, they will provide basic infor-mation to understand the opportunity for improvement and to make decisions. Section 9 provides additional infor-mation on how to collect and analyze data.
6.3 Step Three: Develop Once the improvement goal has been set and the relevant data have been analyzed to clarify the current process, teams begin to consider what changes could yield improvement. These ideas are based on the information provided through the data and group intuition. The devel-opment of interventions has three main stages:
Generate possible changes/interventions. Team mem-bers are a valuable resource in the generation of possible changes or interventions. Rapid Team Problem Solving largely relies on group intuition to develop ideas for changes to address the identified area of improvement.
28 ◆ A Modern Paradigm for Improving Healthcare Quality
Group activities such as brainstorming, affinity analyses, and creative thinking tap the knowledge of group members and generate lists of possible changes. Benchmarking also provides ideas for the development of interventions by studying the changes that other organizations or depart-ments have tried in similar situations. These ideas are then adapted for the specific situation and improvement needs.
Rank the order of possible changes according to criteria. When a team has generated a list of possible interventions, the ideas must then be ranked according to criteria, such as urgency or feasibility, so that the team can choose one intervention to develop and test. Tools such as the prioritization matrix help groups to rank interventions and decide which one to develop.
Select one intervention to test. Interventions are devel-oped together and tested separately. Teams use judgement to select and prioritize the interventions to continue to the next step of testing and implementation. Interventions are then implemented into the system either together or sepa-rately, creating a sequence of small changes over time. This process helps to prevent unexpected consequences if the intervention should fail or need to be modified consider-ably. Interventions may be studied, adapted, and re-tested individually and then eventually implemented into the system once they have proven to be successful.
6.4 Step Four: Test and Implement The first three steps identified the aim for improvement, analyzed the situation, and developed and ranked possible interventions. The final stage, testing and implementation, reveals whether the intervention is effective. In the Rapid Team Problem Solving approach, the testing and implemen-tation of interventions are generally conducted on a small scale with only a few people. These small changes usually meet little resistance because they are introduced incre-mentally. Interventions can also be tested in parallel (e.g., in different departments or units) and, with judgement, implemented together once each has proven to be effec-tive. This approach uses the PDSA cycle in the following way:
Plan: In planning for a test, one should also prepare for the possibility that the intervention may fail or produce adverse effects. Teams should try to foresee unexpected impact or results that may occur. Communication and pre-planning are critical to the successful testing of an intervention or change.
◆ Verify that all baseline data are complete
◆ Make a plan of action for the test
◆ Communicate the intervention to others: make sure all involved parties understand the change clearly
Do: The team tests each change separately. The individual testing of each intervention allows the team to modify them separately before integrating effective changes.
◆ Test the intervention
◆ Document modifications made to the intervention or solution
◆ Check that the data are complete and accurate
Study: As mentioned previously, data collection and analy-sis are limited to information that is necessary to deter-mine whether an intervention is effective. Teams compare the baseline data and the follow-up data (data collected after implementing an intervention) to assess the effective-ness of an intervention.
◆ Verify that the intervention was tested according to the original plan
◆ Compare baseline and follow-up data to measure the impact of the intervention
◆ Compare results with the expected or desired results
Act: Once the intervention has been planned, tested, and studied, the team summarizes and communicates what was learned from the previous steps. This summary helps the team decide whether to implement, modify, or discard the intervention. This decision is based on the data that mea-sure the impact of the intervention. Two questions help to determine a route of action: (a) Did the intervention yield improvement, and if so, (b) Was the improvement suffi-cient? Improvements are deemed sufficient when they achieve a benchmark level or the level of performance is satisfactory to the team or leadership.....
If the intervention leads to improvement and the improve-ment is sufficient, implement the intervention as a perma-nent part of the system and return to Step Three to develop another intervention. (The Rapid Team Problem Solving approach functions in a series of cycles to sequentially introduce small, new interventions and continuously improve quality.)
If the intervention leads to improvement but the improve-ment is not sufficient, adapt the intervention and repeat Step Four to test the revised intervention.
If the intervention does not lead to improvement, return to Step Three to select a different intervention to develop and implement.
A Modern Paradigm for Improving Healthcare Quality ◆ 29
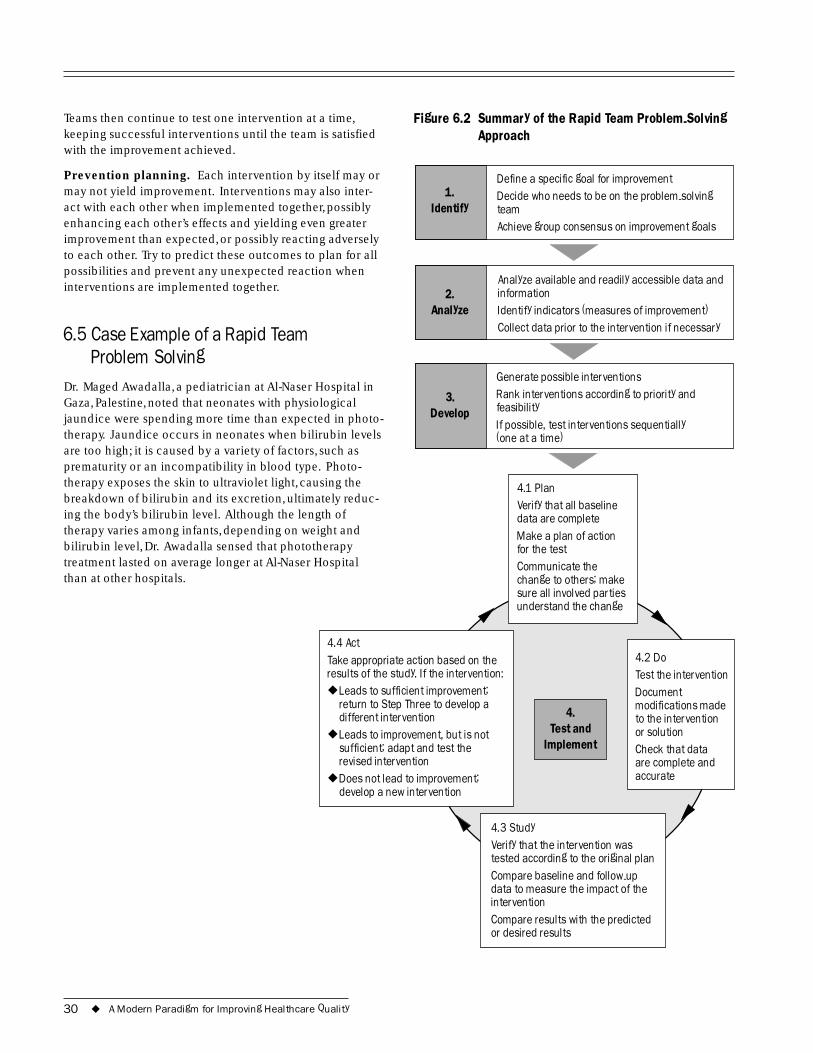
Teams then continue to test one intervention at a time, Figure 6.2 Summary of the Rapid Team Problem-Solving keeping successful interventions until the team is satisfied Approach with the improvement achieved.
Prevention planning. Each intervention by itself may or may not yield improvement. Interventions may also inter-act with each other when implemented together, possibly enhancing each other’s effects and yielding even greater improvement than expected, or possibly reacting adversely to each other. Try to predict these outcomes to plan for all possibilities and prevent any unexpected reaction when interventions are implemented together.
6.5 Case Example of a Rapid Team Problem Solving
Dr. Maged Awadalla, a pediatrician at Al-Naser Hospital in Gaza, Palestine, noted that neonates with physiological jaundice were spending more time than expected in photo-therapy. Jaundice occurs in neonates when bilirubin levels are too high; it is caused by a variety of factors, such as prematurity or an incompatibility in blood type. Photo-
1. Identify
2. Analyze
3.
Defi
(one at a time)
Develop
ne a specific goal for improvement Decide who needs to be on the problem-solving team Achieve group consensus on improvement goals
Analyze available and readily accessible data and information Identify indicators (measures of improvement) Collect data prior to the intervention if necessary
Generate possible interventions Rank interventions according to priority and feasibility If possible, test interventions sequentially
than at other hospitals.
4.
Implement
l ies
4.2 Do
Document modifications made
or solution Check that data
4.3 Study
-up
or desired results
◆
◆
◆
therapy exposes the skin to ultraviolet light, causing the breakdown of bilirubin and its excretion, ultimately reduc-ing the body’s bilirubin level. Although the length of therapy varies among infants, depending on weight and bilirubin level, Dr. Awadalla sensed that phototherapy treatment lasted on average longer at Al-Naser Hospital
Test and
4.1 Plan Verify that all baseline data are complete Make a plan of action for the test Communicate the change to others; make sure all invo ved partunderstand the change
Test the intervention
to the intervention
are complete and accurate
Verify that the intervention was tested according to the original plan Compare baseline and followdata to measure the impact of the intervention Compare results with the predicted
4.4 Act Take appropriate action based on the results of the study. If the intervention:
Leads to sufficient improvement; return to Step Three to develop a different intervention Leads to improvement, but is not sufficient; adapt and test the revised intervention Does not lead to improvement; develop a new intervention
30 ◆ A Modern Paradigm for Improving Healthcare Quality
Trained in quality improvement by the Ministry of Health Quality Improvement Project, Dr. Awadalla recognized that this long treatment presented a possible opportunity for improvement. Through the development, testing, and implementation of three simple changes, he and his team developed an intervention to reduce treatment time and achieved dramatic results within one month. Ms. Nihaya El-Telbani, the quality improvement project coordinator for Gaza, provided technical assistance to the team. This case study shows the improvement process and demonstrates the powerful applications of the Rapid Team Problem Solving approach.
Step One: Identify
1. Identify a specific aim. Dr. Awadalla noted that neonates with jaundice received longer phototherapy treatment than he would have expected; this resulted in long hospital stays for the neonates. Long treatment times not only affected the neonates and burdened their families, but also created a chronic shortage of phototherapy incubators country-wide and increased the workload of intensive care staff. The shortage of incubators led to overcrowding in the intensive care unit, increasing the risk of cross-infection among neonates.
The following goals for improvement associated with the long phototherapy treatment were identified:
◆ Primary aim for improvement: reduce the amount of time in phototherapy for neonates with jaundice.
Additional goals for improvement included:
◆ Reduce the overcrowding in the intensive care unit
◆ Reduce the workload of staff
◆ Reduce cross-infection of neonates
◆ Reduce the risk of possible adverse effects due to phototherapy
◆ Reduce the burden on families from the lengthy hospitalization
2. Decide who should be on the problem-solving team. After identifying the aim for improvement, Dr. Awadalla and his colleagues thought carefully about who should participate in the problem-solving team. They wanted to form a team of people involved in providing neonatal phototherapy to incorporate their knowledge in the prob-lem-solving process and to prevent feelings of resistance or resentment in introducing any interventions. Two nurses and two doctors from the neonatal intensive care unit were asked to form a problem-solving team to work towards this
aim for improvement under the guidance of Dr. Awadalla. Team members included: Dr. Awadalla, Zeinab Shzeim, Abdel Mutaleb Al-Kahlut, and Rashad Al-Khalidi.
3. Achieve consensus for the goals for improvement. Based on their experience working in the neonatal intensive care unit, the team agreed that reduction of time in photo-therapy treatment would benefit both internal and external customers. The possible implications for reducing the time in phototherapy convinced the group members to proceed to the analysis of the issue.
Step Two: Analyze
1. Analyze available and readily accessible data and information. The team of experienced nurses and physi-cians knew that phototherapy functions by exposing the neonate’s skin surface to light. With this in mind, they began to question how care was provided and made obser-vations. First, they discussed the fact that the diapers were often too large, covering a lot of skin. Secondly, the neo-nates were not on a schedule to be turned to ensure that the entire body received light. Finally, the team considered that some of the neonates were not on a regular breast-feeding schedule, affecting their nutrition and health.
2. Identify indicators. The team identified the length of treatment as the indicator for the amount of phototherapy treatment needed. The length of phototherapy treatment was measured as the number of hours necessary to reduce the bilirubin level enough to allow for a neonate’s dis-charge (6.5 milligrams percent).
3. Collect data prior to an intervention if none exists. The problem-solving team recognized a lack of data on the length of treatment for neonates receiving phototherapy, so they collected a small sample of data from eight neonates prior to the intervention. They checked the neonates biliru-bin levels daily as part of standard procedure to determine if any could be discharged. The sample required an aver-age of 49 phototherapy hours each to achieve the bilirubin discharge level.
Step Three: Develop
1. Generate possible changes/interventions. Based on the analysis of the phototherapy treatment procedure, the team generated a possible intervention to reduce the number of hours of treatment needed. Team members agreed to test the effect of completing the following regimen every three hours:
◆ Make sure that the diaper fits properly; for example, check that the diaper is not oversized
A Modern Paradigm for Improving Healthcare Quality ◆ 31
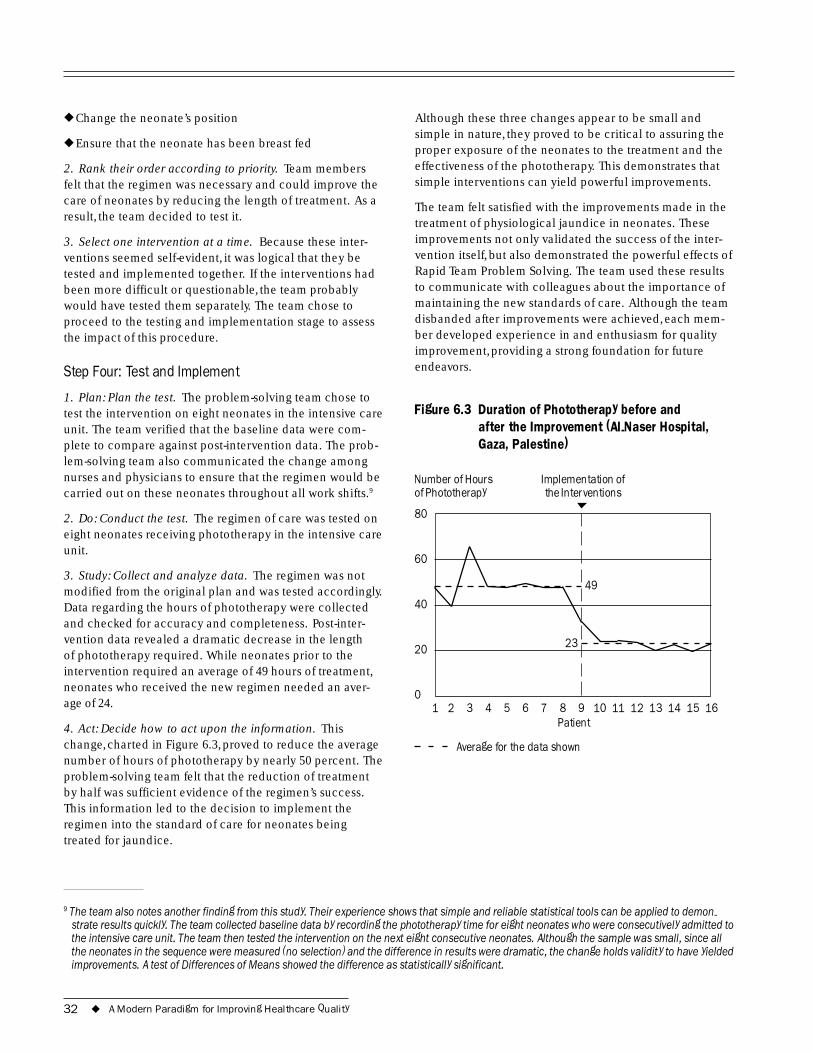
80
60
40
20
0
◆ Change the neonate’s position
◆ Ensure that the neonate has been breast fed
2. Rank their order according to priority. Team members felt that the regimen was necessary and could improve the care of neonates by reducing the length of treatment. As a result, the team decided to test it.
3. Select one intervention at a time. Because these inter-ventions seemed self-evident, it was logical that they be tested and implemented together. If the interventions had been more difficult or questionable, the team probably would have tested them separately. The team chose to proceed to the testing and implementation stage to assess the impact of this procedure.
Step Four: Test and Implement
1. Plan: Plan the test. The problem-solving team chose to test the intervention on eight neonates in the intensive care unit. The team verified that the baseline data were com-plete to compare against post-intervention data. The prob-lem-solving team also communicated the change among nurses and physicians to ensure that the regimen would be carried out on these neonates throughout all work shifts.9
2. Do: Conduct the test. The regimen of care was tested on eight neonates receiving phototherapy in the intensive care unit.
3. Study: Collect and analyze data. The regimen was not modified from the original plan and was tested accordingly. Data regarding the hours of phototherapy were collected and checked for accuracy and completeness. Post-inter-vention data revealed a dramatic decrease in the length of phototherapy required. While neonates prior to the intervention required an average of 49 hours of treatment, neonates who received the new regimen needed an aver-age of 24.
4. Act: Decide how to act upon the information. This change, charted in Figure 6.3, proved to reduce the average number of hours of phototherapy by nearly 50 percent. The problem-solving team felt that the reduction of treatment by half was sufficient evidence of the regimen’s success. This information led to the decision to implement the regimen into the standard of care for neonates being treated for jaundice.
Although these three changes appear to be small and simple in nature, they proved to be critical to assuring the proper exposure of the neonates to the treatment and the effectiveness of the phototherapy. This demonstrates that simple interventions can yield powerful improvements.
The team felt satisfied with the improvements made in the treatment of physiological jaundice in neonates. These improvements not only validated the success of the inter-vention itself, but also demonstrated the powerful effects of Rapid Team Problem Solving. The team used these results to communicate with colleagues about the importance of maintaining the new standards of care. Although the team disbanded after improvements were achieved, each mem-ber developed experience in and enthusiasm for quality improvement, providing a strong foundation for future endeavors.
Figure 6.3 Duration of Phototherapy before and after the Improvement (Al-Naser Hospital, Gaza, Palestine)
Number of Hours Implementation of of Phototherapy the Interventions
1 2 3 4 5 6 7 8 9 10 11 12 13 14 15 16 Patient
49
23
Average for the data shown
9 The team also notes another finding from this study. Their experience shows that simple and reliable statistical tools can be applied to demon- strate results quickly. The team collected baseline data by recording the phototherapy time for eight neonates who were consecutively admitted to the intensive care unit. The team then tested the intervention on the next eight consecutive neonates. Although the sample was small, since all the neonates in the sequence were measured (no selection) and the difference in results were dramatic, the change holds validity to have yielded improvements. A test of Differences of Means showed the difference as statistically significant.
32 ◆ A Modern Paradigm for Improving Healthcare Quality
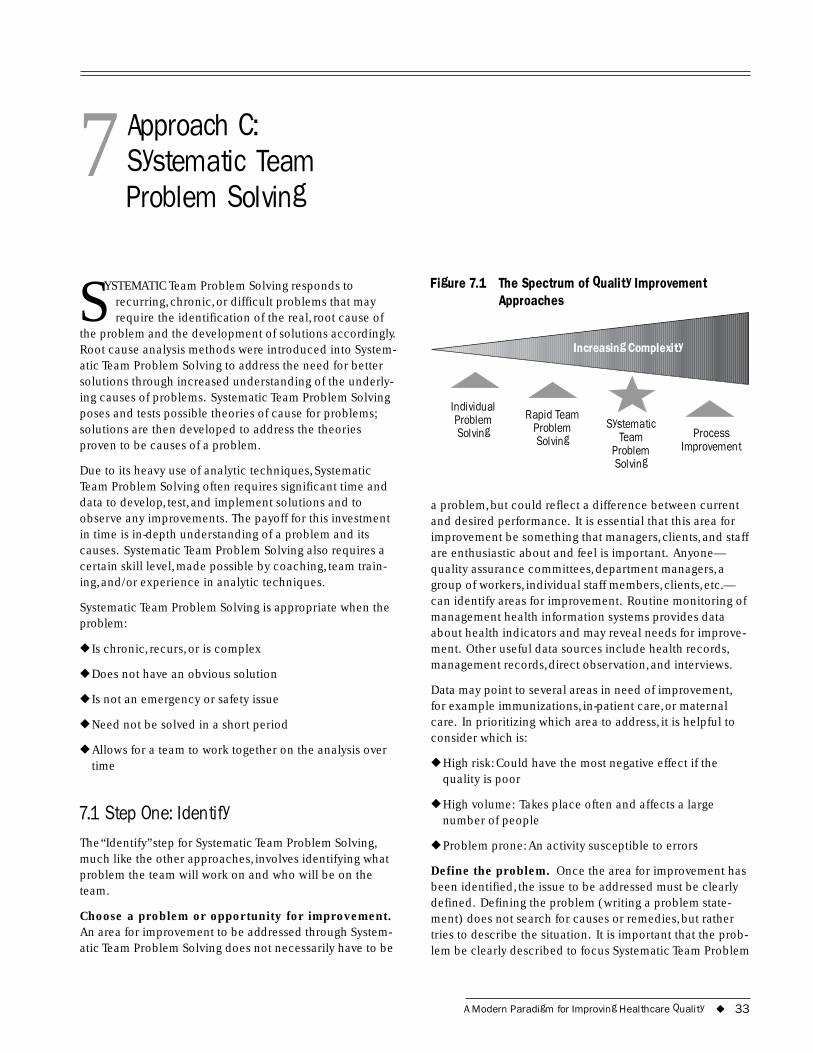
7 Approach C: Systematic Team Problem Solving
SYSTEMATIC Team Problem Solving responds to recurring, chronic, or difficult problems that may require the identification of the real, root cause of
the problem and the development of solutions accordingly. Root cause analysis methods were introduced into System-atic Team Problem Solving to address the need for better solutions through increased understanding of the underly-ing causes of problems. Systematic Team Problem Solving poses and tests possible theories of cause for problems; solutions are then developed to address the theories proven to be causes of a problem.
Due to its heavy use of analytic techniques, Systematic Team Problem Solving often requires significant time and data to develop, test, and implement solutions and to observe any improvements. The payoff for this investment in time is in-depth understanding of a problem and its causes. Systematic Team Problem Solving also requires a certain skill level, made possible by coaching, team train-ing, and/or experience in analytic techniques.
Systematic Team Problem Solving is appropriate when the problem:
◆ Is chronic, recurs, or is complex
◆ Does not have an obvious solution
◆ Is not an emergency or safety issue
◆ Need not be solved in a short period
◆ Allows for a team to work together on the analysis over time
7.1 Step One: Identify The“Identify” step for Systematic Team Problem Solving, much like the other approaches, involves identifying what problem the team will work on and who will be on the team.
Choose a problem or opportunity for improvement. An area for improvement to be addressed through System-atic Team Problem Solving does not necessarily have to be
Figure 7.1 The Spectrum of Quality Improvement Approaches
Individual Rapid Team Problem
Increasing Complexity
Problem Systematic Solving
Solving Team Process Problem Improvement Solving
a problem, but could reflect a difference between current and desired performance. It is essential that this area for improvement be something that managers, clients, and staff are enthusiastic about and feel is important. Anyone— quality assurance committees, department managers, a group of workers, individual staff members, clients, etc.— can identify areas for improvement. Routine monitoring of management health information systems provides data about health indicators and may reveal needs for improve-ment. Other useful data sources include health records, management records, direct observation, and interviews.
Data may point to several areas in need of improvement, for example immunizations, in-patient care, or maternal care. In prioritizing which area to address, it is helpful to consider which is:
◆ High risk: Could have the most negative effect if the quality is poor
◆ High volume: Takes place often and affects a large number of people
◆ Problem prone: An activity susceptible to errors
Define the problem. Once the area for improvement has been identified, the issue to be addressed must be clearly defined. Defining the problem (writing a problem state-ment) does not search for causes or remedies, but rather tries to describe the situation. It is important that the prob-lem be clearly described to focus Systematic Team Problem
A Modern Paradigm for Improving Healthcare Quality ◆ 33
Solving efforts in the “analyze,”“develop,” and “test and implement” stages. Clearly defining a problem articulates what the problem is and how it affects the quality of care.
In addition to measuring the problem, boundaries also must be established so that problem-solving activities do not escalate to address a larger issue or wander into related issues. It is advisable to set boundaries limiting problem-solving activities to specific processes or activi-ties, facilities or services, or measures of quality (such as timeliness or effectiveness). A problem statement is one way to clearly synthesize, establish, and record boundaries and goals.
Identify who should work on the problem. Once the problem is clearly defined, key people should be identified to work on the team. Answers to questions like the follow-ing can help in determining who should take part:Where (what departments/sections) is the problem occurring? What tasks are involved? Who carries out these tasks? Who determines how the tasks should be done? Who provides inputs to these tasks? Who uses the outputs of these tasks?
The people chosen provide special knowledge, insights, and services during the problem-solving journey. It is important to note that each person selected should have direct, detailed, personal knowledge of some part of the problem. They also must have time for meetings and assignments between meetings. As needed, the team may call upon others outside the team who have specialized knowledge or experience about the problem. These “part-time” members can be external consultants or others within the organization. When all those who will work on the problem agree to the problem statement, the team may proceed to the analysis step.
7.2 Step Two: Analyze This is the step where the team will attempt to understand more about the problem or quality deficiency: Why does it happen? People often identify a problem, decide they al-ready know everything about it (including the cause), and jump to a solution already in mind. When they do this, they often find that the problem does not go away after the solution has been implemented. Why? They did not broaden their thinking and verify their assumptions with data. The causes of a problem are not always obvious. Good problem solving means resisting the temptation to jump to conclusions.
The objective of this step in Systematic Team Problem Solving is to identify the problem’s major causes in order to choose an appropriate solution. This can be done very quickly if the problem is simple and the cause obvious; it
takes longer when the problem is more complex and there are several possible causes.
Problem analysis can be like peeling an onion: there are many layers to be removed before reaching the core, i.e., the major cause. It can also be thought of as a series of investigations to dig down to the cause of the problem. By exposing the problem’s components, it is possible to reach the root or underlying cause. Given the diverse nature of problems, there is no single method for analyzing them.
Describe and understand the process in which the problem exists. Most problems or quality deficiencies relate to the way work is conducted (the process). Yet people do not always have a clear picture of the process, especially the links between their work and the work of others. Thus, one important step in the analysis of the problem is to gain an understanding of the process itself and to develop consensus among the team members about how the process actually operates. The latter is distinct from how it is “supposed” to operate. This is where “peeling of the onion” starts: with identifying where the problem is located within the process.
Team members must have a common understanding of the process to save time and energy while working through the remaining steps. One way to do this is to visualize the actual flow of the process where the problem occurs. There are two tools that can be applied: system modeling and flowcharting (please refer to Section 9 for more infor-mation). While examining the process, the team may dis-cover that it is missing facts needed to understand what is happening: data collection may be necessary.
It is possible that the cause(s) will be revealed while flowcharting the actual process as it currently operates. Flowcharting the actual process, as opposed to the ideal process, may reveal where a step in the process is missing, a part where there is confusion about what to do, or the presence of unnecessary steps. It may be that in drawing a flowchart the team will discover that no single, clear pro-cess exists. In this case, the solution may lie in designing a standardized process.
Conduct cause-and-effect analysis. In medicine diseases are cured in so far as possible by treating their causes, not their symptoms. This principle applies to prob-lem solving as well if a chronic problem recurs because its causes have not been addressed. Once the problem has been located more specifically, it is time to develop hypoth-eses about the causes. The term “hypotheses” is used because it is unknown whether the true causes, the core of the problem, have been uncovered. The validity of the cause will be verified later by data.
34 ◆ A Modern Paradigm for Improving Healthcare Quality
Because the root cause is often not obvious, it is best to start by generating a list of as many possible causes as possible. A cause-and-effect analysis helps to look beyond the symptoms of the problem. It pushes one to ask,“What causes that?” and “What is behind that?” This broadens thinking about causes and explores other areas that might be contributing to the problem. Alternatively, other meth-ods, such as asking the “five why’s,” using a tree diagram, or conducting a force-field analysis, can be used. A fishbone diagram may be used to document this thinking (see Section 9).
Reduce the possible root causes. When all possible causes have been suggested, it is common to have more causes than could possibly be investigated. The expertise of the team helps to narrow down the possible causes to the most probable. Several decision-making methods (such as expert opinion and voting) can lead to some hypotheses about the root cause(s). The point is to pro-duce a few possibilities from the many possible causes identified. It is advisable to start testing hypotheses about those possible causes that are easiest to collect data on: doing so may eliminate certain hypotheses quickly. When collecting data to verify cause, try using information sources that are different from the ones used to identify the problem.
Define data needed to test theories of cause. Again, the causes at this point are hypotheses. Now it is time to collect and interpret data to prove or disprove the hypoth-eses. Determining causes should be based on facts, not opinions or assumptions. A few key points about data collection are reviewed here. It is easy to fall into the trap of collecting more data than needed or data that do not provide any real information. The key message here is that data collection should be designed to provide the informa-tion needed to answer the question:What is (are) the major cause(s)?
Some questions that help teams to verify possible root causes include:
◆ Does this hypothesized cause really exist? (Do we experi-ence it?)
◆ Is this hypothesized cause frequent and/or widespread enough to explain the extent of the problem?
◆ How many times does the hypothesized cause occur?
◆ Is the hypothesized cause associated with the problem? (For example, do the causes and problem happen at the same time or to the same client?)
The answers to these questions must be based on facts (data), but the data in and of themselves do not necessarily
Case Example: Hypothesis and Questions to Investigate Root Causes
Hypothesis: Pharmaceutical supplies are not in stock.
Questions: How many days a month are pharmaceutical supplies out of stock? How many patients do not receive medication as a result? What is the reason that pharmaceuticals are not in stock?
provide answers. Data must be analyzed and the results presented in a way that translates them from mere facts into information.
Collect and analyze data; identify root cause. A good place to start in collecting data is making a plan; it should address the following questions:
◆ What data would answer the question?
◆ How should the data be collected? By whom and how often? With what tools?
◆ How will the data be analyzed? With what tools? By whom and how often?
Determine efficient ways to collect the data. When pos-sible, use existing data sources. If needed, collect data as needed to investigate root causes and to determine the actual root cause; this data collection should not become a long-term monitoring system.
After data are collected, they need to be displayed and analyzed to draw conclusions about root causes and key improvements. Data analysis tools (e.g., bar charts, run charts, pareto diagrams) can identify and display informa-tion. First, the team should be prepared to display data in many ways to gain the most knowledge possible. For example, data originally displayed in a histogram can be plotted by each data point on a run chart to show patterns of variation over time. Secondly, data may also be divided into sub-groups or strata based on individual characteris-tics. For instance, data about whether mothers understood instructions about giving medicine to their children can be stratified by the mother’s language. This would help to determine if mothers do not understand instructions due to language differences.
A Modern Paradigm for Improving Healthcare Quality ◆ 35
7.3 Step Three: Develop The objective of this step in Systematic Team Problem Solving is to develop a solution that solves the problem by eliminating its cause(s). Developing solutions is not always a straightforward task, and many solutions fail because they were not carefully thought through before implemen-tation. This is not the time to rush to a solution, given all the effort that has been invested in selecting and analyzing the problem. The best approach is to be open and think creatively, first to develop a list of potential solutions, then to review each carefully before selecting one. These solutions must address the root causes identified.
Choosing sound solutions requires a good list of options. This is where creativity is important. All too often, groups become stuck in their thinking (“This is how we have always done it”), or they let themselves be swayed by one person’s ideas without exploring other options. Consider inviting others to join with the team in suggesting possible solutions. The additional members should be those who have been working on similar problems within the organi-zation. Begin by reviewing previous successes and, more importantly, previous failures. Why did these occur? What lessons can be learned from these?
It can also be useful to examine the experience of others. Benchmarking combined with brainstorming (see Section 9) can stimulate creativity. Benchmarking involves explor-ing a similar process that works well, or considering solu-tions others have tried when they had similar problems or situations with a similar root cause and examining closely what succeeded. However, it is essential to have a thor-ough understanding of one’s own process before attempt-ing any benchmarking and to understand fully the other process before using it as a benchmark. If this is not done, it may create more problems than are solved.
Clearly stated criteria can help teams to choose a solution from a list of several. Examples of criteria include:
◆ Affordable to implement
◆ Free from negative affect on other processes or activities
◆ Feasible to implement
◆ Management support
◆ Community support
◆ Efficient
◆ Timely
Try to limit the number of criteria to three or four, since too many would make this step unwieldy. Identify which crite-
ria any solution must meet to be considered seriously, as this will quickly eliminate certain choices.
7.4 Step Four: Test and Implement Like the other quality improvement approaches, Systematic Team Problem Solving depends on effectively testing and implementing the appropriate solution. Even a well-cho-sen solution will not resolve the problem if it is poorly planned, implemented, and/or monitored. The PDSA ap-plies to Systematic Team Problem Solving as follows:
Plan (to test the solution): Planning for any activity, including quality improvement, involves determining who, what, where, when, and how. Planning for solution imple-mentation should include the following tasks:
◆ Review the objective of the solution. What are we trying to achieve? What is “success”?
◆ Review the solution’s design. What are the steps in the proposed process? Who will be doing what, where, and when? Review or develop a simple flowchart of the process. The flowchart can help the team to determine if what it has in mind will work. Can the solution be simplified?
◆ Identify potential resistance. The team must think about who may be affected by each step or change in the pro-cess. Such individuals may be sources of potential resis-tance. Could resistance be reduced by including these individuals in the planning process? How else can resistance be avoided?
◆ Determine the prerequisites to implementation. What needs to be done or prepared before this process can be carried out? Think about what kind of training might be required, what kind of communication is necessary, and what kind of support (material, supervisory, managerial) needs to be organized. The team members should think about everything that could go wrong and, after brain-storming, use an affinity analysis (see Section 9) to group these for preventive action.
◆ Develop a step-by-step list to lay the groundwork. What must be done first? How long will it take? How will we know when that activity is completed? What is the prod-uct? A Gantt chart (see Section 9) can help to plan the order of activities.
◆ Assign responsibility for each activity. Who will see that each activity is carried out? He/she/they may not have to carry out the activity, but will be responsible for seeing that it happens. Who will be testing it? Who will be supervising it?
36 ◆ A Modern Paradigm for Improving Healthcare Quality
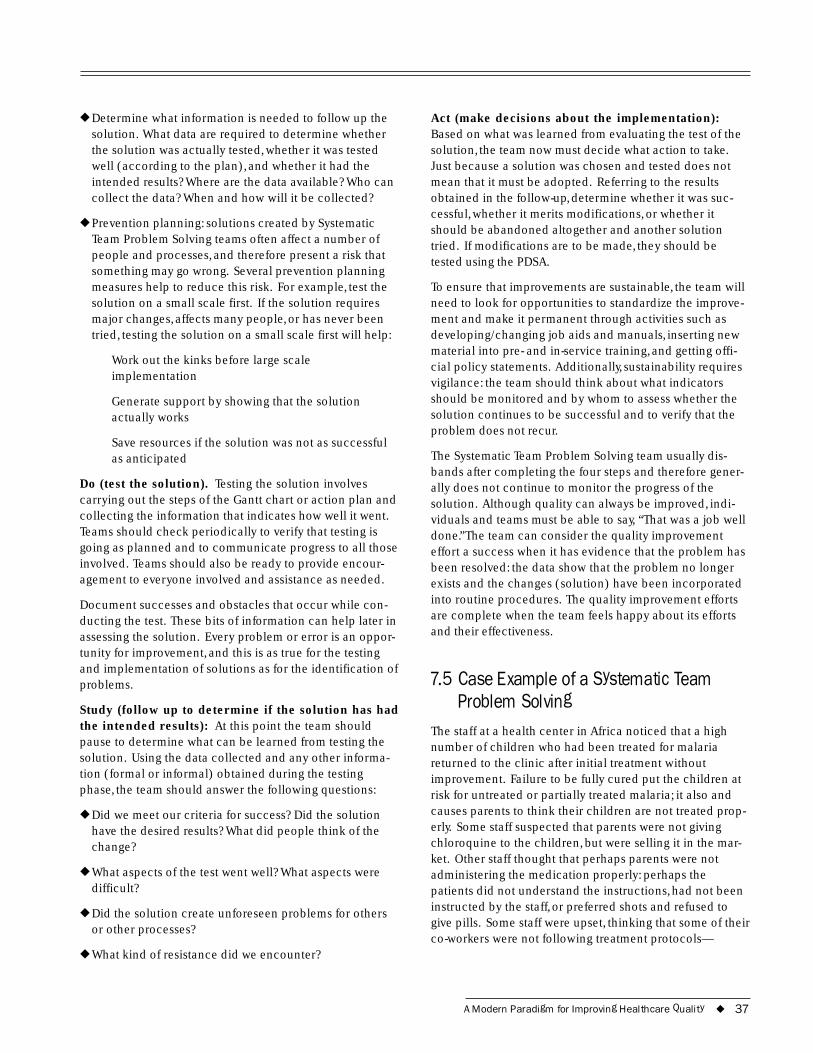
◆ Determine what information is needed to follow up the solution. What data are required to determine whether the solution was actually tested, whether it was tested well (according to the plan), and whether it had the intended results? Where are the data available? Who can collect the data? When and how will it be collected?
◆ Prevention planning: solutions created by Systematic Team Problem Solving teams often affect a number of people and processes, and therefore present a risk that something may go wrong. Several prevention planning measures help to reduce this risk. For example, test the solution on a small scale first. If the solution requires major changes, affects many people, or has never been tried, testing the solution on a small scale first will help:
Work out the kinks before large scale implementation
Generate support by showing that the solution actually works
Save resources if the solution was not as successful as anticipated
Do (test the solution). Testing the solution involves carrying out the steps of the Gantt chart or action plan and collecting the information that indicates how well it went. Teams should check periodically to verify that testing is going as planned and to communicate progress to all those involved. Teams should also be ready to provide encour-agement to everyone involved and assistance as needed.
Document successes and obstacles that occur while con-ducting the test. These bits of information can help later in assessing the solution. Every problem or error is an oppor-tunity for improvement, and this is as true for the testing and implementation of solutions as for the identification of problems.
Study (follow up to determine if the solution has had the intended results): At this point the team should pause to determine what can be learned from testing the solution. Using the data collected and any other informa-tion (formal or informal) obtained during the testing phase, the team should answer the following questions:
◆ Did we meet our criteria for success? Did the solution have the desired results? What did people think of the change?
◆ What aspects of the test went well? What aspects were difficult?
◆ Did the solution create unforeseen problems for others or other processes?
◆ What kind of resistance did we encounter?
Act (make decisions about the implementation): Based on what was learned from evaluating the test of the solution, the team now must decide what action to take. Just because a solution was chosen and tested does not mean that it must be adopted. Referring to the results obtained in the follow-up, determine whether it was suc-cessful, whether it merits modifications, or whether it should be abandoned altogether and another solution tried. If modifications are to be made, they should be tested using the PDSA.
To ensure that improvements are sustainable, the team will need to look for opportunities to standardize the improve-ment and make it permanent through activities such as developing/changing job aids and manuals, inserting new material into pre- and in-service training, and getting offi-cial policy statements. Additionally, sustainability requires vigilance: the team should think about what indicators should be monitored and by whom to assess whether the solution continues to be successful and to verify that the problem does not recur.
The Systematic Team Problem Solving team usually dis-bands after completing the four steps and therefore gener-ally does not continue to monitor the progress of the solution. Although quality can always be improved, indi-viduals and teams must be able to say, “That was a job well done.”The team can consider the quality improvement effort a success when it has evidence that the problem has been resolved: the data show that the problem no longer exists and the changes (solution) have been incorporated into routine procedures. The quality improvement efforts are complete when the team feels happy about its efforts and their effectiveness.
7.5 Case Example of a Systematic Team Problem Solving
The staff at a health center in Africa noticed that a high number of children who had been treated for malaria returned to the clinic after initial treatment without improvement. Failure to be fully cured put the children at risk for untreated or partially treated malaria; it also and causes parents to think their children are not treated prop-erly. Some staff suspected that parents were not giving chloroquine to the children, but were selling it in the mar-ket. Other staff thought that perhaps parents were not administering the medication properly: perhaps the patients did not understand the instructions, had not been instructed by the staff, or preferred shots and refused to give pills. Some staff were upset, thinking that some of their co-workers were not following treatment protocols—
A Modern Paradigm for Improving Healthcare Quality ◆ 37
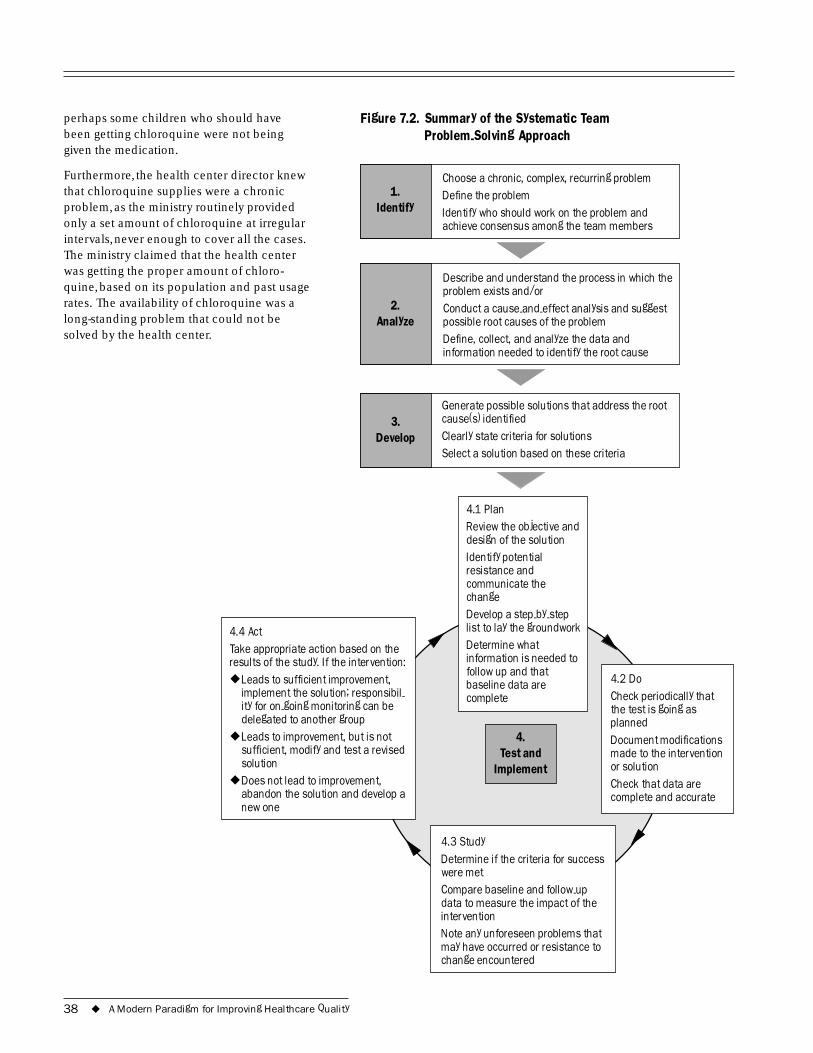
1. Identify
2. Analyze
3.
.2. Problem-Solving Approach
Defi
Define, collect, and analyze the data and
perhaps some children who should have been getting chloroquine were not being given the medication.
Furthermore, the health center director knew that chloroquine supplies were a chronic problem, as the ministry routinely provided only a set amount of chloroquine at irregular intervals, never enough to cover all the cases. The ministry claimed that the health center was getting the proper amount of chloro-quine, based on its population and past usage rates. The availability of chloroquine was a long-standing problem that could not be solved by the health center.
Develop
Figure 7 Summary of the Systematic Team
Choose a chronic, complex, recurring problem ne the problem
Identify who should work on the problem and achieve consensus among the team members
Describe and understand the process in which the problem exists and/or Conduct a cause-and-effect analysis and suggest possible root causes of the problem
information needed to identify the root cause
Generate possible solutions that address the root cause(s) identified Clearly state criteria for solutions Select a solution based on these criteria
4.
Implement
4.3 Study
-up
◆
◆
solution ◆
design of the solution
resistance and
change -
baseline data are 4.2 Do Check periodically that
planned Document modifications
or solution Check that data are
Test and
Determine if the criteria for success were met Compare baseline and followdata to measure the impact of the intervention Note any unforeseen problems that may have occurred or resistance to change encountered
4.4 Act Take appropriate action based on the results of the study. If the intervention:
Leads to sufficient improvement, implement the solution; responsibil- ity for on-going monitoring can be delegated to another group Leads to improvement, but is not sufficient, modify and test a revised
Does not lead to improvement, abandon the solution and develop a new one
4.1 Plan Review the objective and
Identify potential
communicate the
Develop a step-by step list to lay the groundwork Determine what information is needed to follow up and that
complete the test is going as
made to the intervention
complete and accurate
38 ◆ A Modern Paradigm for Improving Healthcare Quality
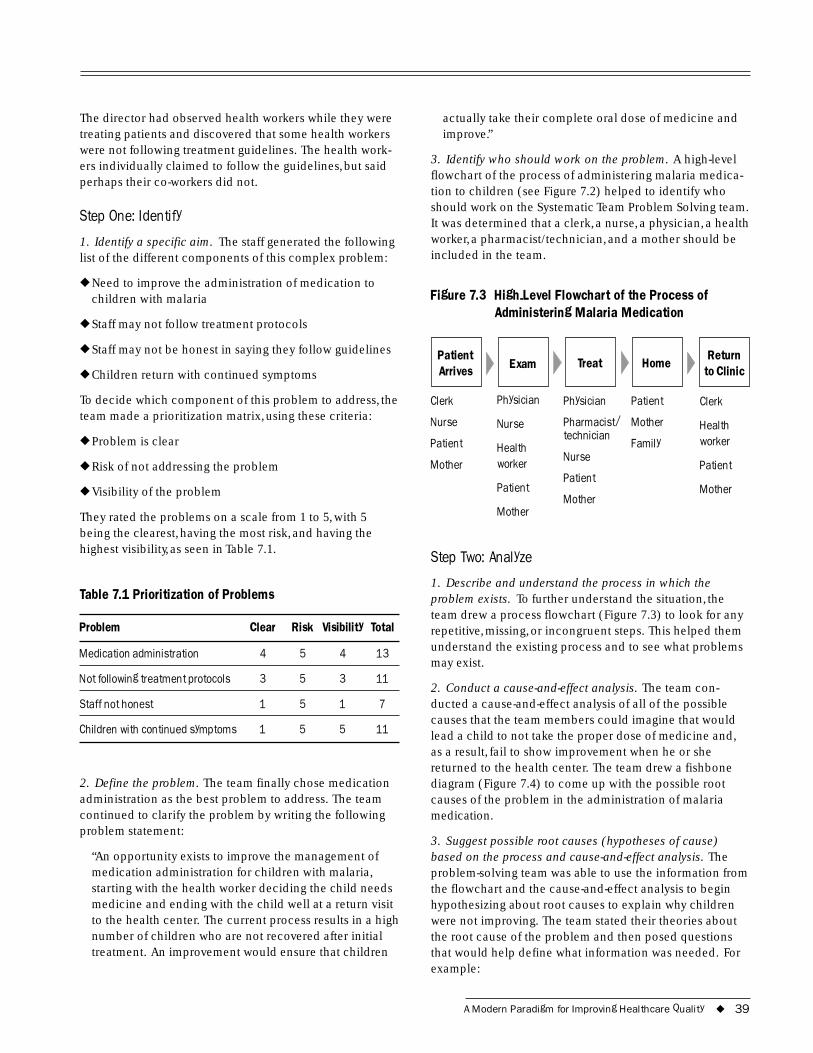
The director had observed health workers while they were treating patients and discovered that some health workers were not following treatment guidelines. The health work-ers individually claimed to follow the guidelines, but said perhaps their co-workers did not.
Step One: Identify
1. Identify a specific aim. The staff generated the following list of the different components of this complex problem:
◆ Need to improve the administration of medication to children with malaria
◆ Staff may not follow treatment protocols
◆ Staff may not be honest in saying they follow guidelines
◆ Children return with continued symptoms
To decide which component of this problem to address, the team made a prioritization matrix, using these criteria:
◆ Problem is clear
◆ Risk of not addressing the problem
◆ Visibility of the problem
They rated the problems on a scale from 1 to 5, with 5 being the clearest, having the most risk, and having the highest visibility, as seen in Table 7.1.
Table 7.1 Prioritization of Problems
Problem Clear Risk Visibility Total
Medication administration 4 5 4 13
Not following treatment protocols 3 5 3 11
Staff not honest 1 5 1 7
Children with continued symptoms 1 5 5 11
2. Define the problem. The team finally chose medication administration as the best problem to address. The team continued to clarify the problem by writing the following problem statement:
“An opportunity exists to improve the management of medication administration for children with malaria, starting with the health worker deciding the child needs medicine and ending with the child well at a return visit to the health center. The current process results in a high number of children who are not recovered after initial treatment. An improvement would ensure that children
actually take their complete oral dose of medicine and improve.”
3. Identify who should work on the problem. A high-level flowchart of the process of administering malaria medica-tion to children (see Figure 7.2) helped to identify who should work on the Systematic Team Problem Solving team. It was determined that a clerk, a nurse, a physician, a health worker, a pharmacist/technician, and a mother should be included in the team.
Figure 7.3 High-Level Flowchart of the Process of Administering Malaria Medication
Patient Arrives Exam Treat Home
Return to Clinic
Clerk Physician Physician Patient Clerk
Nurse Nurse Pharmacist/ Mother Health
Patient
Mother Health worker
technician
Nurse Family worker
Patient Patient
Patient Mother Mother
Mother
Step Two: Analyze
1. Describe and understand the process in which the problem exists. To further understand the situation, the team drew a process flowchart (Figure 7.3) to look for any repetitive, missing, or incongruent steps. This helped them understand the existing process and to see what problems may exist.
2. Conduct a cause-and-effect analysis. The team con-ducted a cause-and-effect analysis of all of the possible causes that the team members could imagine that would lead a child to not take the proper dose of medicine and, as a result, fail to show improvement when he or she returned to the health center. The team drew a fishbone diagram (Figure 7.4) to come up with the possible root causes of the problem in the administration of malaria medication.
3. Suggest possible root causes (hypotheses of cause) based on the process and cause-and-effect analysis. The problem-solving team was able to use the information from the flowchart and the cause-and-effect analysis to begin hypothesizing about root causes to explain why children were not improving. The team stated their theories about the root cause of the problem and then posed questions that would help define what information was needed. For example:
A Modern Paradigm for Improving Healthcare Quality ◆ 39
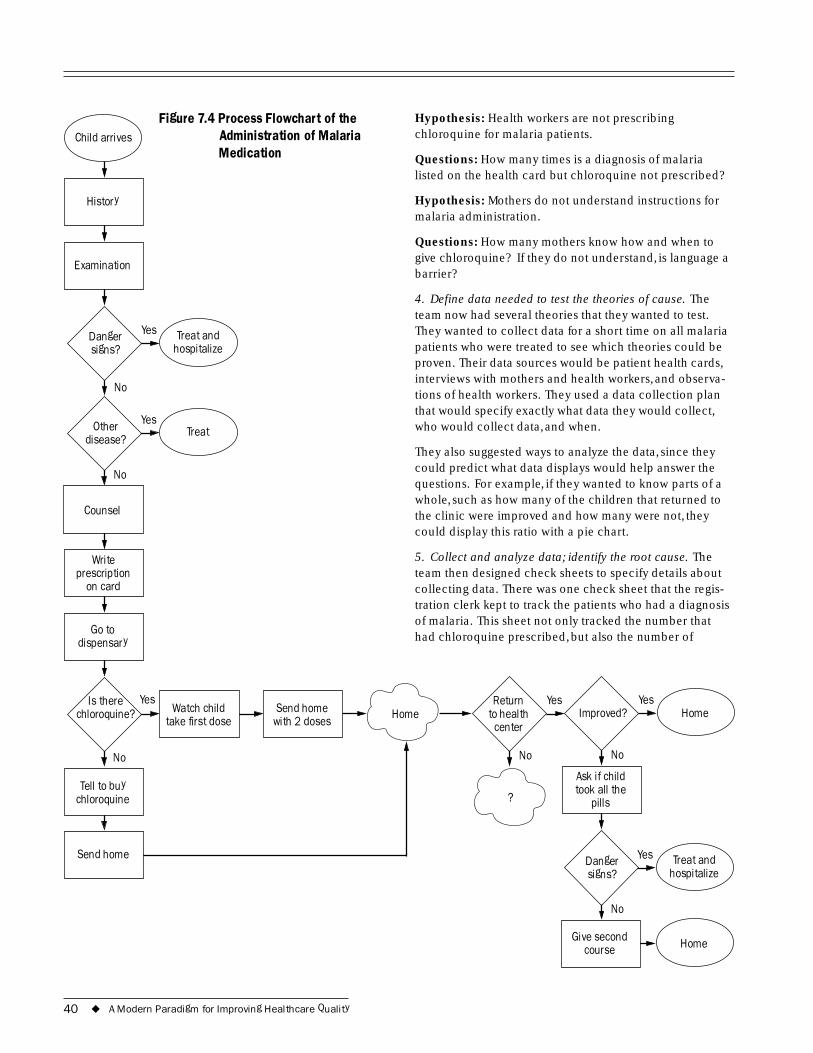
Examination
Child arrives
History
Figure 7.4 Process Flowchart of the Administration of Malaria Medication
Danger signs? hospitalize
No
Treat and Yes
Other disease?
Counsel
Wriprescription
No
te
on card
Go to dispensary
Yes Treat
Hypothesis: Health workers are not prescribing chloroquine for malaria patients.
Questions: How many times is a diagnosis of malaria listed on the health card but chloroquine not prescribed?
Hypothesis: Mothers do not understand instructions for malaria administration.
Questions: How many mothers know how and when to give chloroquine? If they do not understand, is language a barrier?
4. Define data needed to test the theories of cause. The team now had several theories that they wanted to test. They wanted to collect data for a short time on all malaria patients who were treated to see which theories could be proven. Their data sources would be patient health cards, interviews with mothers and health workers, and observa-tions of health workers. They used a data collection plan that would specify exactly what data they would collect, who would collect data, and when.
They also suggested ways to analyze the data, since they could predict what data displays would help answer the questions. For example, if they wanted to know parts of a whole, such as how many of the children that returned to the clinic were improved and how many were not, they could display this ratio with a pie chart.
5. Collect and analyze data; identify the root cause. The team then designed check sheets to specify details about collecting data. There was one check sheet that the regis-tration clerk kept to track the patients who had a diagnosis of malaria. This sheet not only tracked the number that had chloroquine prescribed, but also the number of
Is there
Send home
Homeirst dose
Send home with 2 doses
No
I Home
No
?
No
Ask if child
pills
Danger signs?
No
Home
hospitalize
Tell to buy chloroquine
chloroquine? Yes
Watch child take f
Yes mproved?
Yes Return to health
center
took all the
Give second course
Treat and Yes
40 ◆ A Modern Paradigm for Improving Healthcare Quality
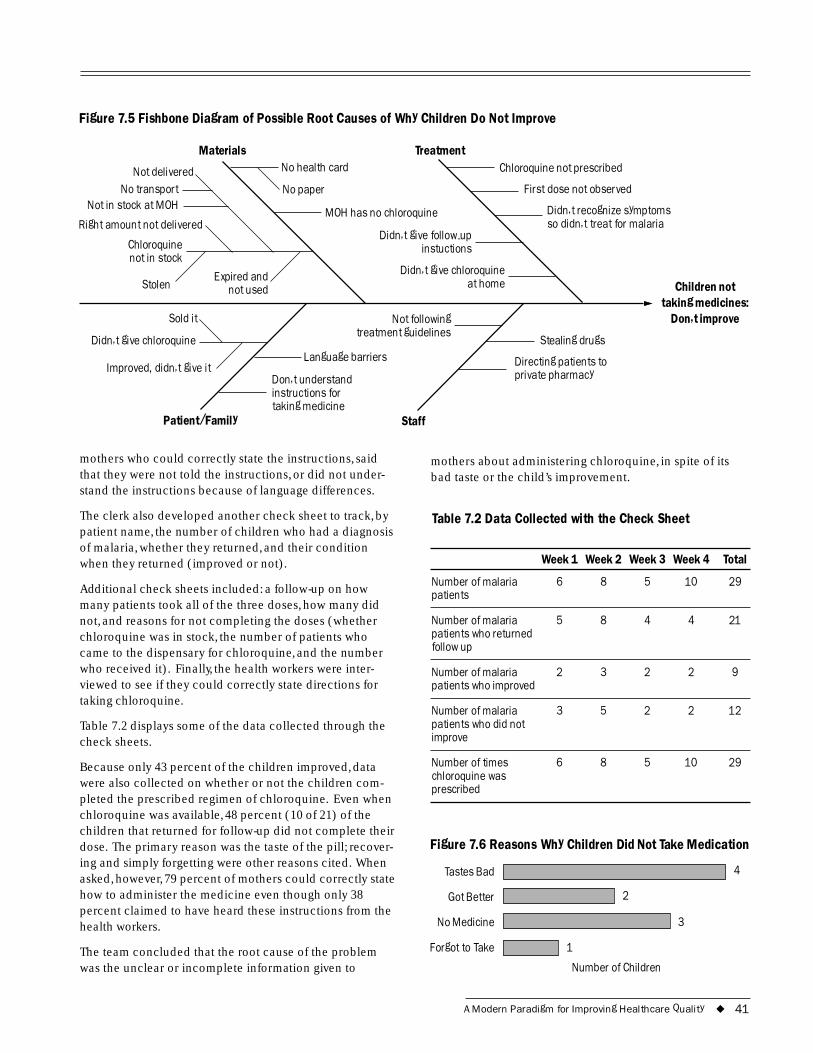
Figure 7.5 Fishbone Diagram of Possible Root Causes of Why Children Do Not Improve
Materials Treatment
-up instuctions
at home
No paper
Expired and
treatment guidelines Sold it
I
taking medicine
Chloroquine not prescribed
First dose not observed
Didn�t recognize symptoms so didn�t treat for malaria
Didn�t give follow
Didn�t give chloroquine
No health card
MOH has no chloroquine
Chloroquine not in stock
Stolen not used
Right amount not delivered
Not delivered No transport
Not in stock at MOH
Not following
Stealing drugs
Directing patients to private pharmacy
Didn�t give chloroquine
mproved, didn�t give it Don�t understand instructions for
Language barriers
Patient/Family
mothers who could correctly state the instructions, said that they were not told the instructions, or did not under-stand the instructions because of language differences.
The clerk also developed another check sheet to track, by patient name, the number of children who had a diagnosis of malaria, whether they returned, and their condition when they returned (improved or not).
Additional check sheets included: a follow-up on how many patients took all of the three doses, how many did not, and reasons for not completing the doses (whether chloroquine was in stock, the number of patients who came to the dispensary for chloroquine, and the number who received it). Finally, the health workers were inter-viewed to see if they could correctly state directions for taking chloroquine.
Table 7.2 displays some of the data collected through the check sheets.
Because only 43 percent of the children improved, data were also collected on whether or not the children com-pleted the prescribed regimen of chloroquine. Even when chloroquine was available, 48 percent (10 of 21) of the children that returned for follow-up did not complete their dose. The primary reason was the taste of the pill; recover-ing and simply forgetting were other reasons cited. When asked, however, 79 percent of mothers could correctly state how to administer the medicine even though only 38 percent claimed to have heard these instructions from the health workers.
The team concluded that the root cause of the problem was the unclear or incomplete information given to
Children nottaking medicines:
Don�t improve
Staff
mothers about administering chloroquine, in spite of its bad taste or the child’s improvement.
Table 7.2 Data Collected with the Check Sheet
Week 1 Week 2 Week 3 Week 4 Total
Number of malaria 6 8 5 10 29 patients
Number of malaria 5 8 4 4 21 patients who returned follow up
Number of malaria 2 3 2 2 9 patients who improved
Number of malaria 3 5 2 2 12 patients who did not improve
Number of times 6 8 5 10 29 chloroquine was prescribed
Figure 7.6 Reasons Why Children Did Not Take Medication
Tastes Bad 4
Got Better 2
No Medicine 3
Forgot to Take 1
Number of Children
A Modern Paradigm for Improving Healthcare Quality ◆ 41
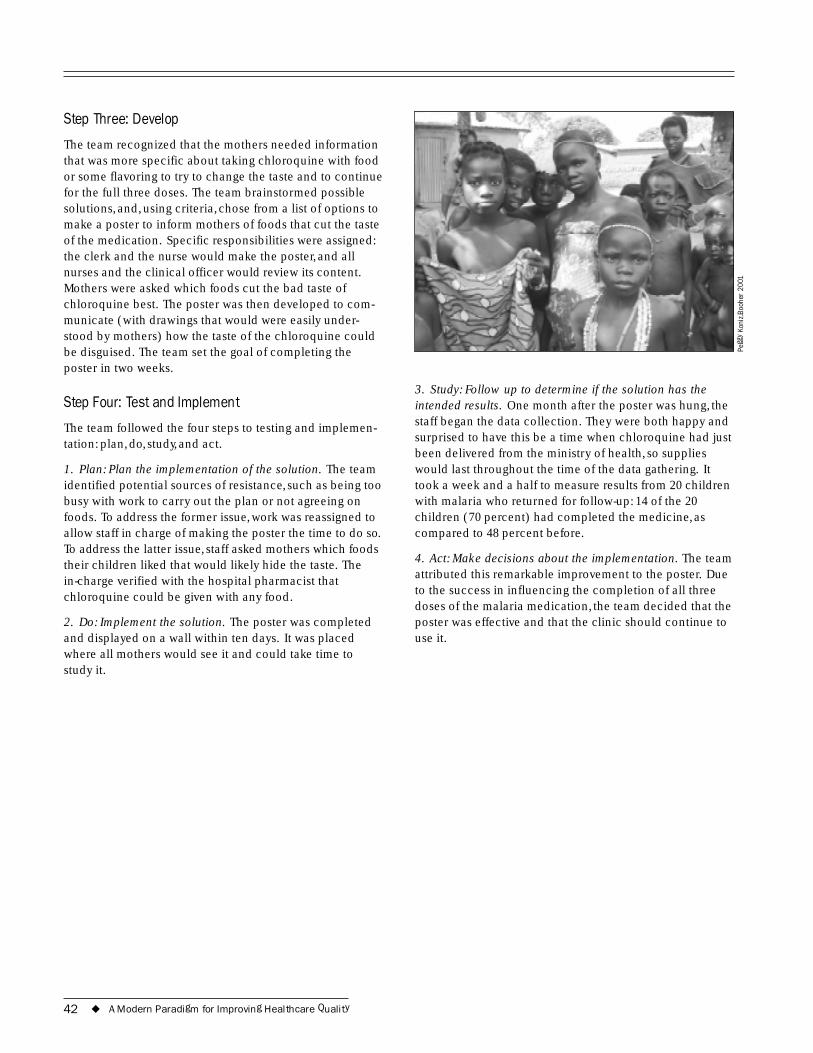
Step Three: Develop
The team recognized that the mothers needed information that was more specific about taking chloroquine with food or some flavoring to try to change the taste and to continue for the full three doses. The team brainstormed possible solutions, and, using criteria, chose from a list of options to make a poster to inform mothers of foods that cut the taste of the medication. Specific responsibilities were assigned: the clerk and the nurse would make the poster, and all nurses and the clinical officer would review its content. Mothers were asked which foods cut the bad taste of chloroquine best. The poster was then developed to com-municate (with drawings that would were easily under-stood by mothers) how the taste of the chloroquine could be disguised. The team set the goal of completing the poster in two weeks.
Step Four: Test and Implement
The team followed the four steps to testing and implemen-tation: plan, do, study, and act.
1. Plan: Plan the implementation of the solution. The team identified potential sources of resistance, such as being too busy with work to carry out the plan or not agreeing on foods. To address the former issue, work was reassigned to allow staff in charge of making the poster the time to do so. To address the latter issue, staff asked mothers which foods their children liked that would likely hide the taste. The in-charge verified with the hospital pharmacist that chloroquine could be given with any food.
2. Do: Implement the solution. The poster was completed and displayed on a wall within ten days. It was placed where all mothers would see it and could take time to study it.
Pegg
y Ko
niz-
Booh
er 2
001
3. Study: Follow up to determine if the solution has the intended results. One month after the poster was hung, the staff began the data collection. They were both happy and surprised to have this be a time when chloroquine had just been delivered from the ministry of health, so supplies would last throughout the time of the data gathering. It took a week and a half to measure results from 20 children with malaria who returned for follow-up: 14 of the 20 children (70 percent) had completed the medicine, as compared to 48 percent before.
4. Act: Make decisions about the implementation. The team attributed this remarkable improvement to the poster. Due to the success in influencing the completion of all three doses of the malaria medication, the team decided that the poster was effective and that the clinic should continue to use it.
42 ◆ A Modern Paradigm for Improving Healthcare Quality
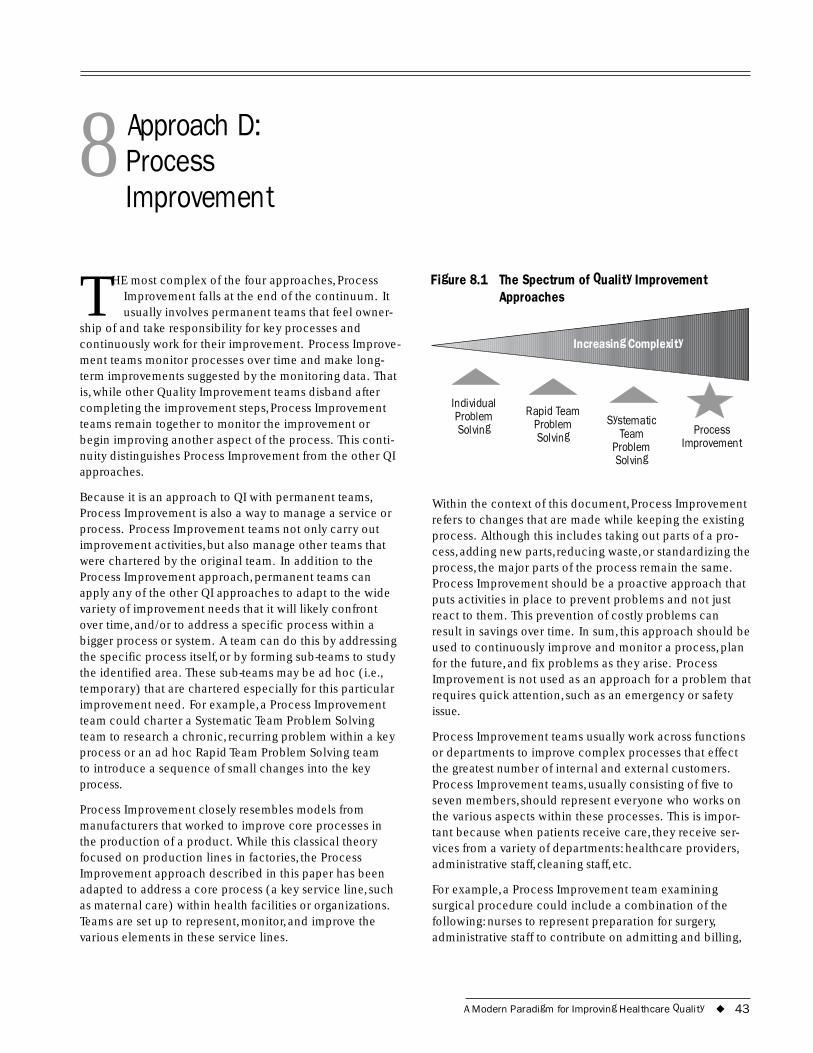
8 Approach D: Process Improvement
THE most complex of the four approaches, Process Improvement falls at the end of the continuum. It usually involves permanent teams that feel owner-
ship of and take responsibility for key processes and continuously work for their improvement. Process Improve-ment teams monitor processes over time and make long-term improvements suggested by the monitoring data. That is, while other Quality Improvement teams disband after completing the improvement steps, Process Improvement teams remain together to monitor the improvement or begin improving another aspect of the process. This conti-nuity distinguishes Process Improvement from the other QI approaches.
Because it is an approach to QI with permanent teams, Process Improvement is also a way to manage a service or process. Process Improvement teams not only carry out improvement activities, but also manage other teams that were chartered by the original team. In addition to the Process Improvement approach, permanent teams can apply any of the other QI approaches to adapt to the wide variety of improvement needs that it will likely confront over time, and/or to address a specific process within a bigger process or system. A team can do this by addressing the specific process itself, or by forming sub-teams to study the identified area. These sub-teams may be ad hoc (i.e., temporary) that are chartered especially for this particular improvement need. For example, a Process Improvement team could charter a Systematic Team Problem Solving team to research a chronic, recurring problem within a key process or an ad hoc Rapid Team Problem Solving team to introduce a sequence of small changes into the key process.
Process Improvement closely resembles models from manufacturers that worked to improve core processes in the production of a product. While this classical theory focused on production lines in factories, the Process Improvement approach described in this paper has been adapted to address a core process (a key service line, such as maternal care) within health facilities or organizations. Teams are set up to represent, monitor, and improve the various elements in these service lines.
Figure 8.1 The Spectrum of Quality Improvement Approaches
Individual Systematic
Rapid Team Problem
Increasing Complexity
Problem Solving Solving Team Process
Problem Improvement Solving
Within the context of this document, Process Improvement refers to changes that are made while keeping the existing process. Although this includes taking out parts of a pro-cess, adding new parts, reducing waste, or standardizing the process, the major parts of the process remain the same. Process Improvement should be a proactive approach that puts activities in place to prevent problems and not just react to them. This prevention of costly problems can result in savings over time. In sum, this approach should be used to continuously improve and monitor a process, plan for the future, and fix problems as they arise. Process Improvement is not used as an approach for a problem that requires quick attention, such as an emergency or safety issue.
Process Improvement teams usually work across functions or departments to improve complex processes that effect the greatest number of internal and external customers. Process Improvement teams, usually consisting of five to seven members, should represent everyone who works on the various aspects within these processes. This is impor-tant because when patients receive care, they receive ser-vices from a variety of departments: healthcare providers, administrative staff, cleaning staff, etc.
For example, a Process Improvement team examining surgical procedure could include a combination of the following: nurses to represent preparation for surgery, administrative staff to contribute on admitting and billing,
A Modern Paradigm for Improving Healthcare Quality ◆ 43

surgeons who carry out the procedures, and cleaning staff who sterilize the surgical room. The most important point is that a team should reflect the various elements of a process through its members. Process Improvement can also address a process within a single department as long as outside departments are consulted in developing and implementing any changes.
Process Improvement also emphasizes the need to under-stand the expectations of external customers. The partici-pation of external customers in Process Improvement teams contributes to an understanding of how the process can be improved to meet their needs. This and other aspects of the nature of the Process Improvement approach mean that it is not appropriate when quick attention is required, for instance, when an emergency or safety is involved.
In summary, use Process Improvement when:
◆ Teams can be permanent
◆ There is a monitoring system or the capacity to establish one
◆ A proactive, preventive approach is needed
◆ The key process does not require quick attention (e.g., not an emergency or safety issue)
8.1 Step One: Identify Process Improvement focuses its improvement efforts based on the requirements of customers. Often the first step in identifying a process for Process Improvement is to examine the organizational mission or vision to assess the extent to which services support the mission or vision. Processes that are not achieving the organizational mission are candidates for Process Improvement.
A management team usually identifies and decides which core process will be the focus of Process Improvement efforts. Criteria for selecting a process are whether it: (a) is key to the delivery of care, (b) effects a high volume of internal and external customers, (c) presents potential to be of high-risk if neglected, (d) is problem prone, and (e) is apparent to the customer and management (see summary on criteria).
The Process Improvement approach to quality improve-ment emphasizes the importance of monitoring the pro-cess over time. Just a couple of indicators that measure outcome, effect, and impact can indicate whether the pro-cess is functioning correctly. In order to determine which indicators are most useful, teams must have a thorough understanding of the process. For example, a Process
Summary: Criteria for a Process to Be Addressed through Process Improvement
◆ A key process (service line) in the delivery of care
◆ High risk
◆ High volume
◆ Problem prone
◆ Apparent to customers and management
◆ Important to customers and management
Improvement team addressing immunization would need team members or sub-teams that understand the various elements of this process, such as the refrigeration of the vaccines, the transportation of vaccines, and the commu-nity outreach program. Representatives of each of the areas then help to establish and track indicators (such as refrig-erator temperature checks, stock outs of vaccines, and coverage rates) to monitor the quality of the overall vacci-nation process (see Table 8.1). When possible, indicators should be designed to use existing data to avoid setting up data collection systems.
Table 8.1 Sample Indicators for Key Processes in a Vaccination Program
Process Indicator
Refrigeration of vaccines Refrigerator temperature checks
Vaccine supply Stock-out rates
Community outreach program Coverage rate
If a data system does not exist or is insufficient, a monitor-ing system must be set up to measure relevant indicators over time. This system does not necessarily have to collect data throughout the entire institution or facility, but can focus on the areas pertinent to the Process Improvement target. Once a monitoring system has been established, it is critical that the initial data be analyzed to determine a baseline of information. The baseline data help Process Improvement teams to understand the current status of the process; consider what the process is capable of perform-ing; and, later, compare post-intervention data to detect any change.
In summary, the “identify” step for Process Improvement establishes: (a) What to work on based on the require-
44 ◆ A Modern Paradigm for Improving Healthcare Quality
ments of customers, (b) Who is on the team and the crite-ria for being on the team, and (c) What the indicators should be. It also requires that a monitoring system be set up if data are not sufficient.
8.2 Step Two: Analyze The Process Improvement approach is different from the other QI approaches because it involves the regular moni-toring of key indicators over time. Data routinely analyzed include information about the performance of key pro-cesses and about customers. Run charts (described in Section 9) are commonly used to illustrate this information and observe performance over time.
The routine analysis of this information stems not only from Process Improvement, but also from a management philosophy that concerns itself with performance and values the opinion of customers. Therefore, the data are actively sought out and not exclusively drawn from existing data. For example, data about customers would not be derived exclusively from their feedback, but also would be actively sought through the inclusion of customers in Process Improvement teams.
In addition to analyzing the data, Process Improvement teams also measure the outputs of a system and assess the progress of chartered ad hoc teams.
Process Improvement teams then use data to determine where the problems exist within the identified process. The established monitoring system may provide enough infor-mation for decision making. Sometimes, however, even an elaborate monitoring system may not provide all of the necessary information. For example, if a weak spot in the system is targeted for further analysis, it may be necessary to create a sub-set of data to study this area further. In this instance a new indicator may be established either tempo-rarily or permanently to monitor improvements in the area under study.
If a weak spot within the process is identified and ana-lyzed, the Process Improvement team may chose to con-tinue to work on it as a team or charter another team to do so. This decision is based on two issues: whether the weak area should be monitored permanently (Process Improve-ment team) or temporarily (ad hoc team) and whether the key people for the particular area are represented on the Process Improvement team. If the second criterion is not met and temporary monitoring is sufficient, a separate sub-team must be created to provide information for the Process Improvement team to use in decision making.
Case Example: Process Improvement Team(Tver Oblast, Russia)
A Process Improvement team formed to improve the quality of care for neonates suffering from Respiratory Distress Syndrome (RDS). In reviewing existing data, the team discovered that care delivered in the 42 hospitals of the Oblast was not adequate�demonstrated by the fact that 67 percent of early neonatal deaths were attributed to RDS.
The Process Improvement team reviewed evidenced-based literature to develop guidelines for care and discovered that it would probably be impossible to provide the interventions necessary to ensure adequate care in all 42 centers. Even if it were possible, there were not enough neonates for providers to practice and maintain their skills.
The team agreed to develop one system of care, redesign- ing the existing system of care into one system with three levels: resuscitation of newborns, transportation, and then care at the center. The same team continued to work on the redesign and, having improved the system, it continues to monitor the progress on an on-going basis and makes necessary changes.
This experience exemplifies how Process Improvement endeavors can evolve into the re-design of a system, intro- ducing radical changes.
The “Analyze” step of Process Improvement emphasizes the need to understand the current process. As mentioned previously, a number of tools exist that allow teams to fur-ther analyze areas that have been identified through the on-going monitoring system or an adverse event. First, the flowchart lays out each step in a process to see where delays or redundancy may exist. This knowledge is impor-tant in understanding how the process can be improved to better meet the needs of customers.
Another tool that helps in analyzing processes is the cause-and-effect analysis. This analysis helps teams to gen-erate possible causes for the identified problem; although the causes listed are hypotheses and may later prove to be incorrect, at this point the cause-and-effect is useful to illustrate a broader picture of the problem.
A Modern Paradigm for Improving Healthcare Quality ◆ 45
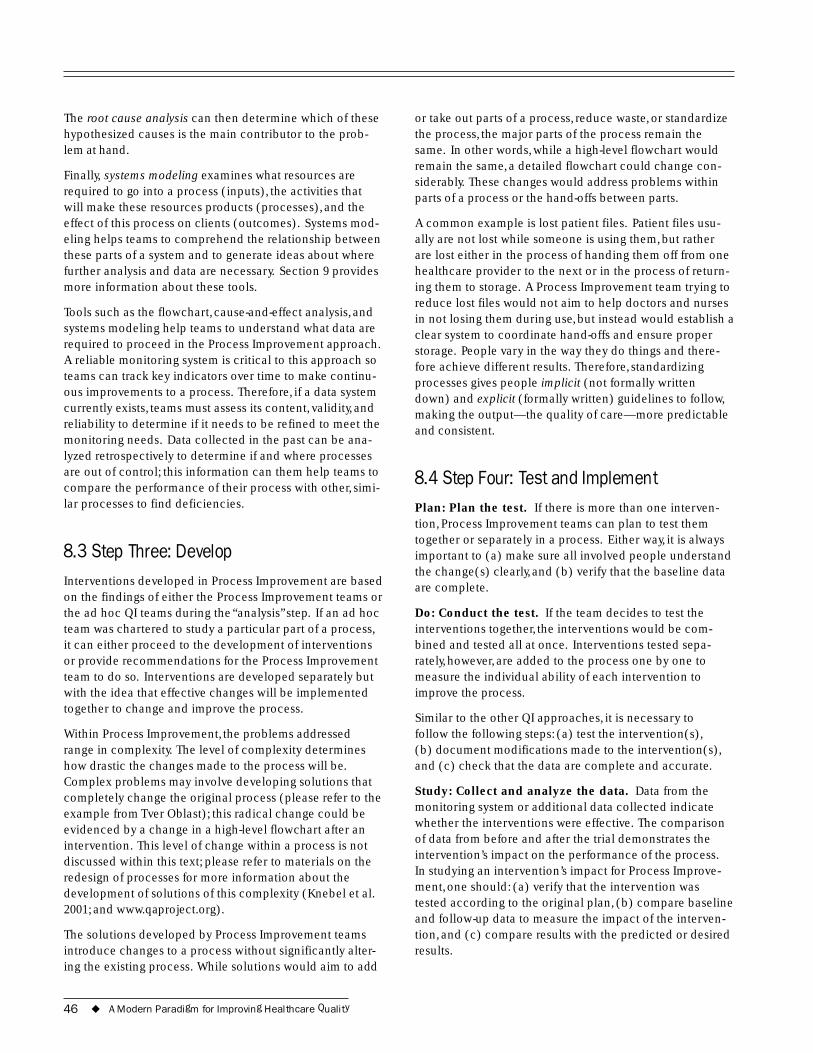
The root cause analysis can then determine which of these hypothesized causes is the main contributor to the prob-lem at hand.
Finally, systems modeling examines what resources are required to go into a process (inputs), the activities that will make these resources products (processes), and the effect of this process on clients (outcomes). Systems mod-eling helps teams to comprehend the relationship between these parts of a system and to generate ideas about where further analysis and data are necessary. Section 9 provides more information about these tools.
Tools such as the flowchart, cause-and-effect analysis, and systems modeling help teams to understand what data are required to proceed in the Process Improvement approach. A reliable monitoring system is critical to this approach so teams can track key indicators over time to make continu-ous improvements to a process. Therefore, if a data system currently exists, teams must assess its content, validity, and reliability to determine if it needs to be refined to meet the monitoring needs. Data collected in the past can be ana-lyzed retrospectively to determine if and where processes are out of control; this information can them help teams to compare the performance of their process with other, simi-lar processes to find deficiencies.
8.3 Step Three: Develop Interventions developed in Process Improvement are based on the findings of either the Process Improvement teams or the ad hoc QI teams during the “analysis” step. If an ad hoc team was chartered to study a particular part of a process, it can either proceed to the development of interventions or provide recommendations for the Process Improvement team to do so. Interventions are developed separately but with the idea that effective changes will be implemented together to change and improve the process.
Within Process Improvement, the problems addressed range in complexity. The level of complexity determines how drastic the changes made to the process will be. Complex problems may involve developing solutions that completely change the original process (please refer to the example from Tver Oblast); this radical change could be evidenced by a change in a high-level flowchart after an intervention. This level of change within a process is not discussed within this text; please refer to materials on the redesign of processes for more information about the development of solutions of this complexity (Knebel et al. 2001; and www.qaproject.org).
The solutions developed by Process Improvement teams introduce changes to a process without significantly alter-ing the existing process. While solutions would aim to add
or take out parts of a process, reduce waste, or standardize the process, the major parts of the process remain the same. In other words, while a high-level flowchart would remain the same, a detailed flowchart could change con-siderably. These changes would address problems within parts of a process or the hand-offs between parts.
A common example is lost patient files. Patient files usu-ally are not lost while someone is using them, but rather are lost either in the process of handing them off from one healthcare provider to the next or in the process of return-ing them to storage. A Process Improvement team trying to reduce lost files would not aim to help doctors and nurses in not losing them during use, but instead would establish a clear system to coordinate hand-offs and ensure proper storage. People vary in the way they do things and there-fore achieve different results. Therefore, standardizing processes gives people implicit (not formally written down) and explicit (formally written) guidelines to follow, making the output—the quality of care—more predictable and consistent.
8.4 Step Four: Test and Implement Plan: Plan the test. If there is more than one interven-tion, Process Improvement teams can plan to test them together or separately in a process. Either way, it is always important to (a) make sure all involved people understand the change(s) clearly, and (b) verify that the baseline data are complete.
Do: Conduct the test. If the team decides to test the interventions together, the interventions would be com-bined and tested all at once. Interventions tested sepa-rately, however, are added to the process one by one to measure the individual ability of each intervention to improve the process.
Similar to the other QI approaches, it is necessary to follow the following steps: (a) test the intervention(s), (b) document modifications made to the intervention(s), and (c) check that the data are complete and accurate.
Study: Collect and analyze the data. Data from the monitoring system or additional data collected indicate whether the interventions were effective. The comparison of data from before and after the trial demonstrates the intervention’s impact on the performance of the process. In studying an intervention’s impact for Process Improve-ment, one should: (a) verify that the intervention was tested according to the original plan, (b) compare baseline and follow-up data to measure the impact of the interven-tion, and (c) compare results with the predicted or desired results.
46 ◆ A Modern Paradigm for Improving Healthcare Quality
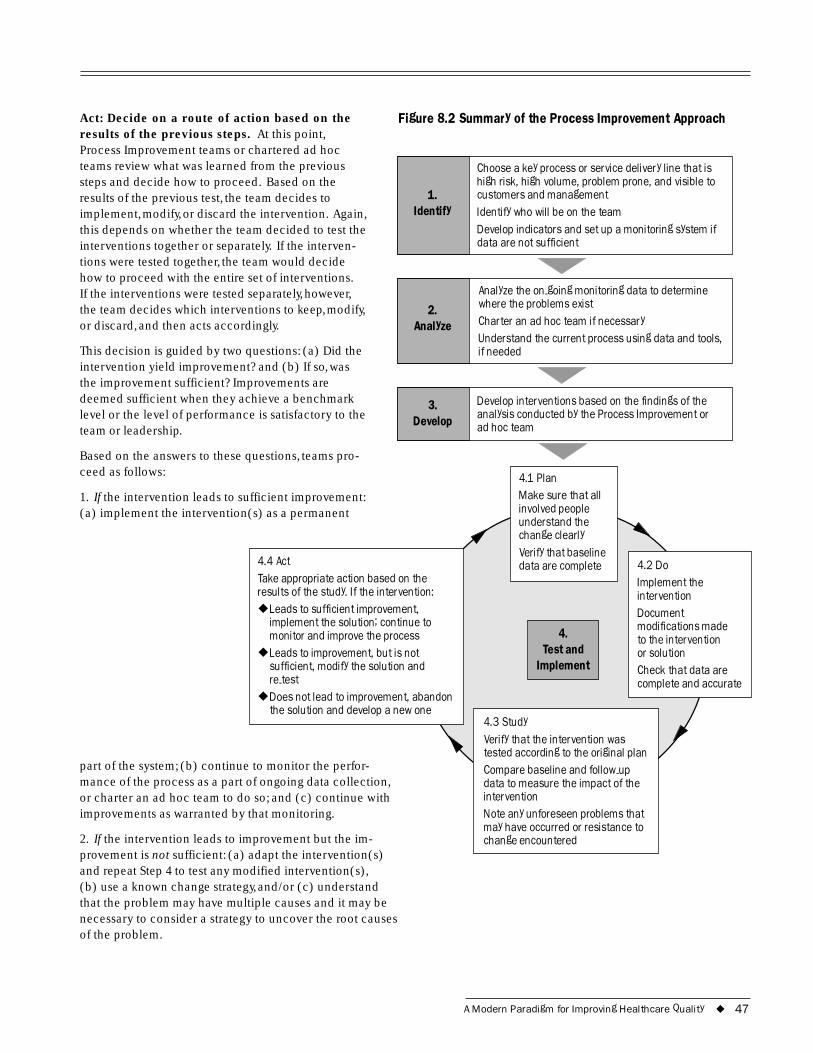
Act: Decide on a route of action based on the results of the previous steps. At this point, Process Improvement teams or chartered ad hoc teams review what was learned from the previous steps and decide how to proceed. Based on the results of the previous test, the team decides to implement, modify, or discard the intervention. Again, this depends on whether the team decided to test the interventions together or separately. If the interven-tions were tested together, the team would decide how to proceed with the entire set of interventions. If the interventions were tested separately, however, the team decides which interventions to keep, modify, or discard, and then acts accordingly.
This decision is guided by two questions: (a) Did the intervention yield improvement? and (b) If so, was the improvement sufficient? Improvements are deemed sufficient when they achieve a benchmark level or the level of performance is satisfactory to the team or leadership.
Based on the answers to these questions, teams pro-ceed as follows:
Figure 8.2 Summary of the Process Improvement Approach
1. Identify
2. Analyze
3.
if needed
indings of the
Develop
Choose a key process or service delivery line that is high risk, high volume, problem prone, and visible to customers and management Identify who will be on the team Develop indicators and set up a monitoring system if data are not sufficient
Analyze the on-going monitoring data to determine where the problems exist Charter an ad hoc team if necessary Understand the current process using data and tools,
Develop interventions based on the fanalysis conducted by the Process Improvement or ad hoc team
1. If
4.
Implement
lunderstand the change clearly
4.2 Do I
Document modifications made
or solution Check that data are
4.3 Study
-up
◆
◆
◆
2. Ifnot
the intervention leads to sufficient improvement: (a) implement the intervention(s) as a permanent
Test and
4.1 Plan Make sure that all invo ved people
Verify that baseline data are complete
mplement the intervention
to the intervention
complete and accurate
Verify that the intervention was tested according to the original plan Compare baseline and followdata to measure the impact of the intervention Note any unforeseen problems that may have occurred or resistance to change encountered
4.4 Act Take appropriate action based on the results of the study. If the intervention:
Leads to sufficient improvement, implement the solution; continue to monitor and improve the process Leads to improvement, but is not sufficient, modify the solution and re-test Does not lead to improvement, abandon the solution and develop a new one
part of the system; (b) continue to monitor the perfor-mance of the process as a part of ongoing data collection, or charter an ad hoc team to do so; and (c) continue with improvements as warranted by that monitoring.
the intervention leads to improvement but the im-provement is sufficient: (a) adapt the intervention(s) and repeat Step 4 to test any modified intervention(s), (b) use a known change strategy, and/or (c) understand that the problem may have multiple causes and it may be necessary to consider a strategy to uncover the root causes of the problem.
A Modern Paradigm for Improving Healthcare Quality ◆ 47
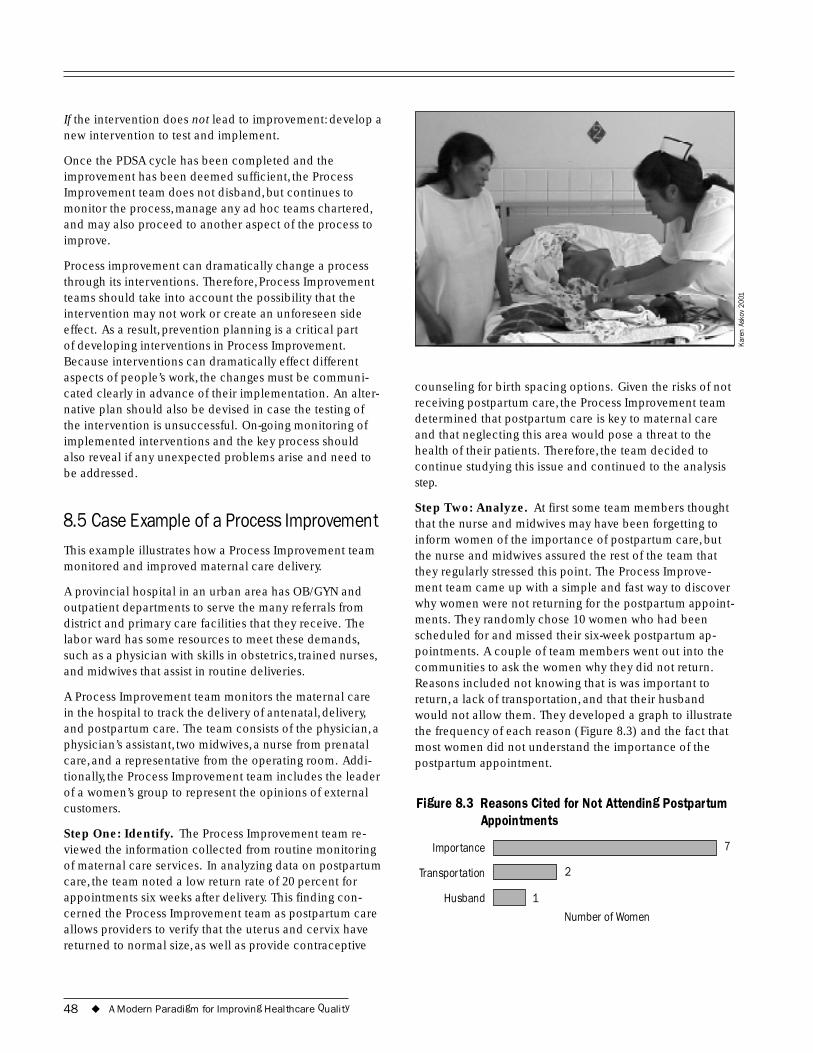
If the intervention does not lead to improvement: develop a new intervention to test and implement.
Once the PDSA cycle has been completed and the improvement has been deemed sufficient, the Process Improvement team does not disband, but continues to monitor the process, manage any ad hoc teams chartered, and may also proceed to another aspect of the process to improve.
Process improvement can dramatically change a process through its interventions. Therefore, Process Improvement teams should take into account the possibility that the intervention may not work or create an unforeseen side effect. As a result, prevention planning is a critical part of developing interventions in Process Improvement. Because interventions can dramatically effect different aspects of people’s work, the changes must be communi-cated clearly in advance of their implementation. An alter-native plan should also be devised in case the testing of the intervention is unsuccessful. On-going monitoring of implemented interventions and the key process should also reveal if any unexpected problems arise and need to be addressed.
8.5 Case Example of a Process Improvement This example illustrates how a Process Improvement team monitored and improved maternal care delivery.
A provincial hospital in an urban area has OB/GYN and outpatient departments to serve the many referrals from district and primary care facilities that they receive. The labor ward has some resources to meet these demands, such as a physician with skills in obstetrics, trained nurses, and midwives that assist in routine deliveries.
A Process Improvement team monitors the maternal care in the hospital to track the delivery of antenatal, delivery, and postpartum care. The team consists of the physician, a physician’s assistant, two midwives, a nurse from prenatal care, and a representative from the operating room. Addi-tionally, the Process Improvement team includes the leader of a women’s group to represent the opinions of external customers.
Step One: Identify. The Process Improvement team re-viewed the information collected from routine monitoring of maternal care services. In analyzing data on postpartum care, the team noted a low return rate of 20 percent for appointments six weeks after delivery. This finding con-cerned the Process Improvement team as postpartum care allows providers to verify that the uterus and cervix have returned to normal size, as well as provide contraceptive
Kare
n As
kov
2001
counseling for birth spacing options. Given the risks of not receiving postpartum care, the Process Improvement team determined that postpartum care is key to maternal care and that neglecting this area would pose a threat to the health of their patients. Therefore, the team decided to continue studying this issue and continued to the analysis step.
Step Two: Analyze. At first some team members thought that the nurse and midwives may have been forgetting to inform women of the importance of postpartum care, but the nurse and midwives assured the rest of the team that they regularly stressed this point. The Process Improve-ment team came up with a simple and fast way to discover why women were not returning for the postpartum appoint-ments. They randomly chose 10 women who had been scheduled for and missed their six-week postpartum ap-pointments. A couple of team members went out into the communities to ask the women why they did not return. Reasons included not knowing that is was important to return, a lack of transportation, and that their husband would not allow them. They developed a graph to illustrate the frequency of each reason (Figure 8.3) and the fact that most women did not understand the importance of the postpartum appointment.
Figure 8.3 Reasons Cited for Not Attending Postpartum Appointments
Importance 7
Transportation 2
Husband 1
Number of Women
48 ◆ A Modern Paradigm for Improving Healthcare Quality
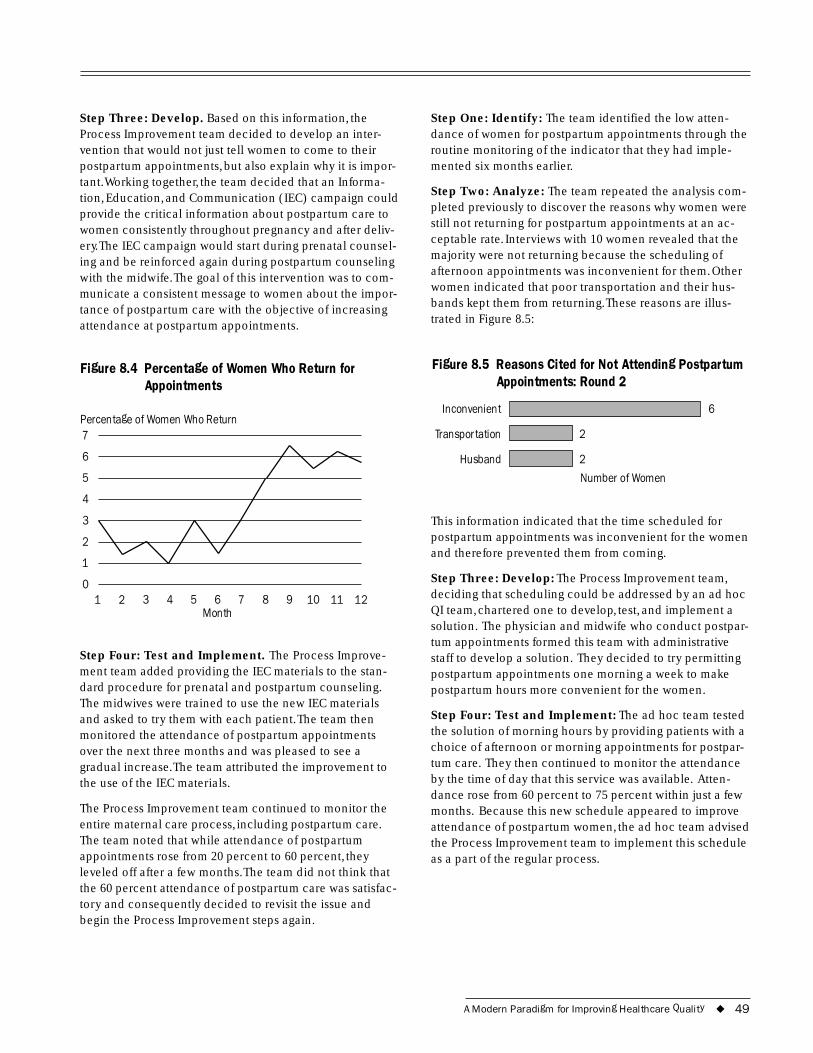
6
7
6
5
4
3
2
1
0
Step Three: Develop. Based on this information, the Process Improvement team decided to develop an inter-vention that would not just tell women to come to their postpartum appointments, but also explain why it is impor-tant.Working together, the team decided that an Informa-tion, Education, and Communication (IEC) campaign could provide the critical information about postpartum care to women consistently throughout pregnancy and after deliv-ery.The IEC campaign would start during prenatal counsel-ing and be reinforced again during postpartum counseling with the midwife.The goal of this intervention was to com-municate a consistent message to women about the impor-tance of postpartum care with the objective of increasing attendance at postpartum appointments.
Figure 8.4 Percentage of Women Who Return for Appointments
Percentage of Women Who Return
1 2 3 4 5 6 7 8 9 10 11 12 Month
Step Four: Test and Implement. The Process Improve-ment team added providing the IEC materials to the stan-dard procedure for prenatal and postpartum counseling. The midwives were trained to use the new IEC materials and asked to try them with each patient.The team then monitored the attendance of postpartum appointments over the next three months and was pleased to see a gradual increase.The team attributed the improvement to the use of the IEC materials.
The Process Improvement team continued to monitor the entire maternal care process, including postpartum care. The team noted that while attendance of postpartum appointments rose from 20 percent to 60 percent, they leveled off after a few months.The team did not think that the 60 percent attendance of postpartum care was satisfac-tory and consequently decided to revisit the issue and begin the Process Improvement steps again.
Step One: Identify: The team identified the low atten-dance of women for postpartum appointments through the routine monitoring of the indicator that they had imple-mented six months earlier.
Step Two: Analyze: The team repeated the analysis com-pleted previously to discover the reasons why women were still not returning for postpartum appointments at an ac-ceptable rate. Interviews with 10 women revealed that the majority were not returning because the scheduling of afternoon appointments was inconvenient for them. Other women indicated that poor transportation and their hus-bands kept them from returning.These reasons are illus-trated in Figure 8.5:
Figure 8.5 Reasons Cited for Not Attending Postpartum Appointments: Round 2
Inconvenient
Transportation 2
Husband 2
Number of Women
This information indicated that the time scheduled for postpartum appointments was inconvenient for the women and therefore prevented them from coming.
Step Three: Develop: The Process Improvement team, deciding that scheduling could be addressed by an ad hoc QI team, chartered one to develop, test, and implement a solution. The physician and midwife who conduct postpar-tum appointments formed this team with administrative staff to develop a solution. They decided to try permitting postpartum appointments one morning a week to make postpartum hours more convenient for the women.
Step Four: Test and Implement: The ad hoc team tested the solution of morning hours by providing patients with a choice of afternoon or morning appointments for postpar-tum care. They then continued to monitor the attendance by the time of day that this service was available. Atten-dance rose from 60 percent to 75 percent within just a few months. Because this new schedule appeared to improve attendance of postpartum women, the ad hoc team advised the Process Improvement team to implement this schedule as a part of the regular process.
A Modern Paradigm for Improving Healthcare Quality ◆ 49

50 ◆ A Modern Paradigm for Improving Healthcare Quality
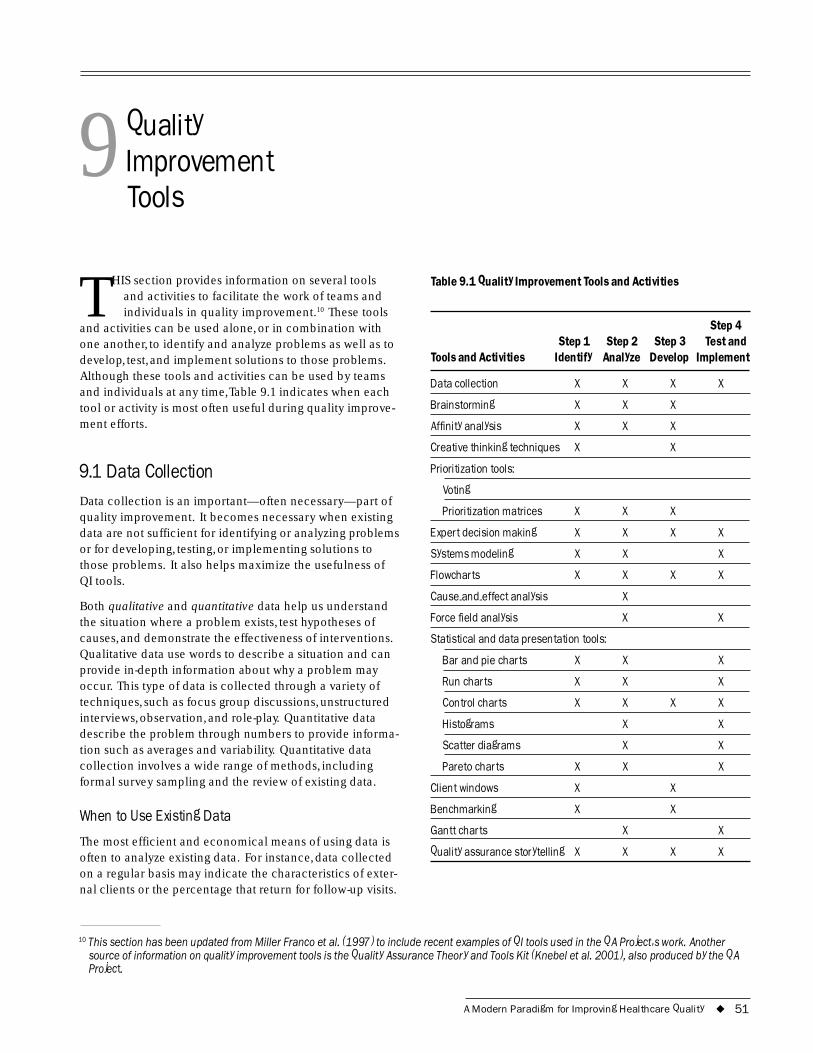
9 Quality Improvement Tools
THIS section provides information on several tools and activities to facilitate the work of teams and individuals in quality improvement.10 These tools
and activities can be used alone, or in combination with one another, to identify and analyze problems as well as to develop, test, and implement solutions to those problems. Although these tools and activities can be used by teams and individuals at any time,Table 9.1 indicates when each tool or activity is most often useful during quality improve-ment efforts.
9.1 Data Collection Data collection is an important—often necessary—part of quality improvement. It becomes necessary when existing data are not sufficient for identifying or analyzing problems or for developing, testing, or implementing solutions to those problems. It also helps maximize the usefulness of QI tools.
Both qualitative and quantitative data help us understand the situation where a problem exists, test hypotheses of causes, and demonstrate the effectiveness of interventions. Qualitative data use words to describe a situation and can provide in-depth information about why a problem may occur. This type of data is collected through a variety of techniques, such as focus group discussions, unstructured interviews, observation, and role-play. Quantitative data describe the problem through numbers to provide informa-tion such as averages and variability. Quantitative data collection involves a wide range of methods, including formal survey sampling and the review of existing data.
When to Use Existing Data
The most efficient and economical means of using data is often to analyze existing data. For instance, data collected on a regular basis may indicate the characteristics of exter-nal clients or the percentage that return for follow-up visits.
Table 9.1 Quality Improvement Tools and Activities
Step 4 Step 1 Step 2 Step 3 Test and
Tools and Activities Identify Analyze Develop Implement
Data collection X X X X
Brainstorming X X X
Affinity analysis X X X
Creative thinking techniques X X
Prioritization tools:
Voting
Prioritization matrices X X X
Expert decision making X X X X
Systems modeling X X X
Flowcharts X X X X
Cause-and-effect analysis X
Force field analysis X X
Statistical and data presentation tools:
Bar and pie charts X X X
Run charts X X X
Control charts X X X X
Histograms X X
Scatter diagrams X X
Pareto charts X X X
Client windows X X
Benchmarking X X
Gantt charts X X
Quality assurance storytelling X X X X
10 This section has been updated from Miller Franco et al. (1997) to include recent examples of QI tools used in the QA Project�s work. Another source of information on quality improvement tools is the Quality Assurance Theory and Tools Kit (Knebel et al. 2001), also produced by the QA Project.
A Modern Paradigm for Improving Healthcare Quality ◆ 51
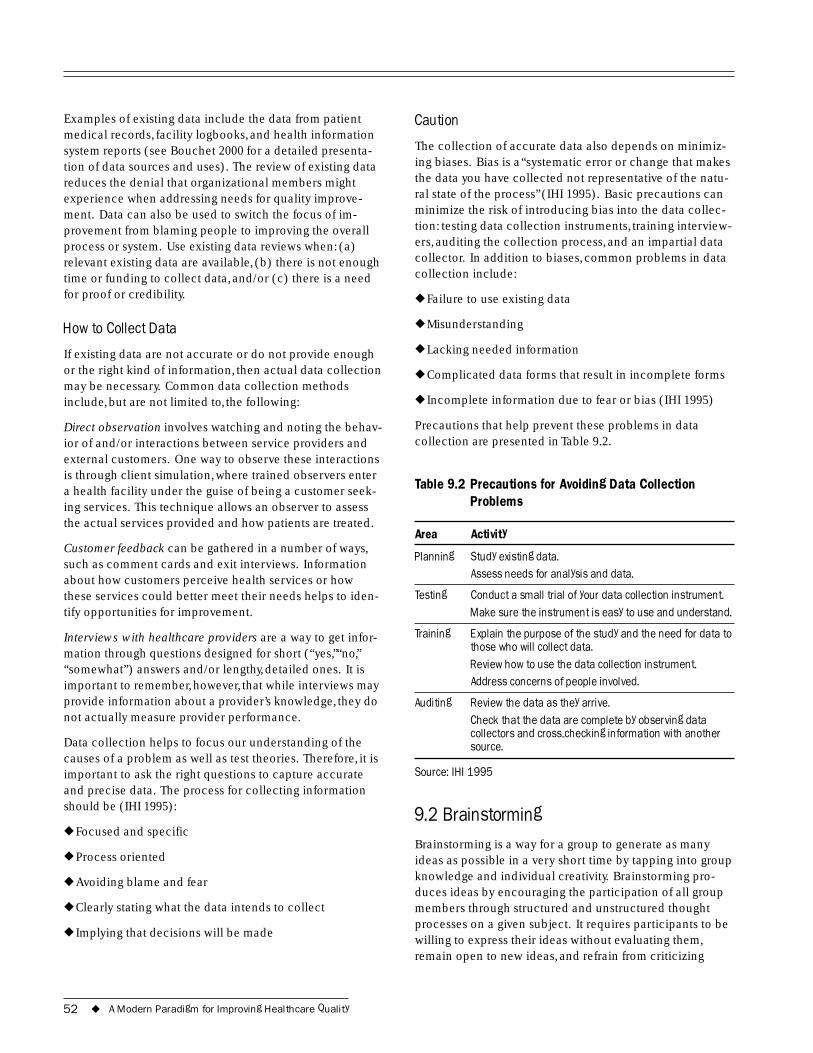
Examples of existing data include the data from patient medical records, facility logbooks, and health information system reports (see Bouchet 2000 for a detailed presenta-tion of data sources and uses). The review of existing data reduces the denial that organizational members might experience when addressing needs for quality improve-ment. Data can also be used to switch the focus of im-provement from blaming people to improving the overall process or system. Use existing data reviews when: (a) relevant existing data are available, (b) there is not enough time or funding to collect data, and/or (c) there is a need for proof or credibility.
How to Collect Data
If existing data are not accurate or do not provide enough or the right kind of information, then actual data collection may be necessary. Common data collection methods include, but are not limited to, the following:
Direct observation involves watching and noting the behav-ior of and/or interactions between service providers and external customers. One way to observe these interactions is through client simulation, where trained observers enter a health facility under the guise of being a customer seek-ing services. This technique allows an observer to assess the actual services provided and how patients are treated.
Customer feedback can be gathered in a number of ways, such as comment cards and exit interviews. Information about how customers perceive health services or how these services could better meet their needs helps to iden-tify opportunities for improvement.
Interviews with healthcare providers are a way to get infor-mation through questions designed for short (“yes,”“no,” “somewhat”) answers and/or lengthy, detailed ones. It is important to remember, however, that while interviews may provide information about a provider’s knowledge, they do not actually measure provider performance.
Data collection helps to focus our understanding of the causes of a problem as well as test theories. Therefore, it is important to ask the right questions to capture accurate and precise data. The process for collecting information should be (IHI 1995):
◆ Focused and specific
◆ Process oriented
◆ Avoiding blame and fear
◆ Clearly stating what the data intends to collect
◆ Implying that decisions will be made
Caution
The collection of accurate data also depends on minimiz-ing biases. Bias is a “systematic error or change that makes the data you have collected not representative of the natu-ral state of the process” (IHI 1995). Basic precautions can minimize the risk of introducing bias into the data collec-tion: testing data collection instruments, training interview-ers, auditing the collection process, and an impartial data collector. In addition to biases, common problems in data collection include:
◆ Failure to use existing data
◆ Misunderstanding
◆ Lacking needed information
◆ Complicated data forms that result in incomplete forms
◆ Incomplete information due to fear or bias (IHI 1995)
Precautions that help prevent these problems in data collection are presented in Table 9.2.
Table 9.2 Precautions for Avoiding Data Collection Problems
Area Activity
Planning Study existing data. Assess needs for analysis and data.
Testing Conduct a small trial of your data collection instrument. Make sure the instrument is easy to use and understand.
Training Explain the purpose of the study and the need for data to those who will collect data. Review how to use the data collection instrument. Address concerns of people involved.
Auditing Review the data as they arrive. Check that the data are complete by observing data collectors and cross-checking information with another source.
Source: IHI 1995
9.2 Brainstorming Brainstorming is a way for a group to generate as many ideas as possible in a very short time by tapping into group knowledge and individual creativity. Brainstorming pro-duces ideas by encouraging the participation of all group members through structured and unstructured thought processes on a given subject. It requires participants to be willing to express their ideas without evaluating them, remain open to new ideas, and refrain from criticizing
52 ◆ A Modern Paradigm for Improving Healthcare Quality
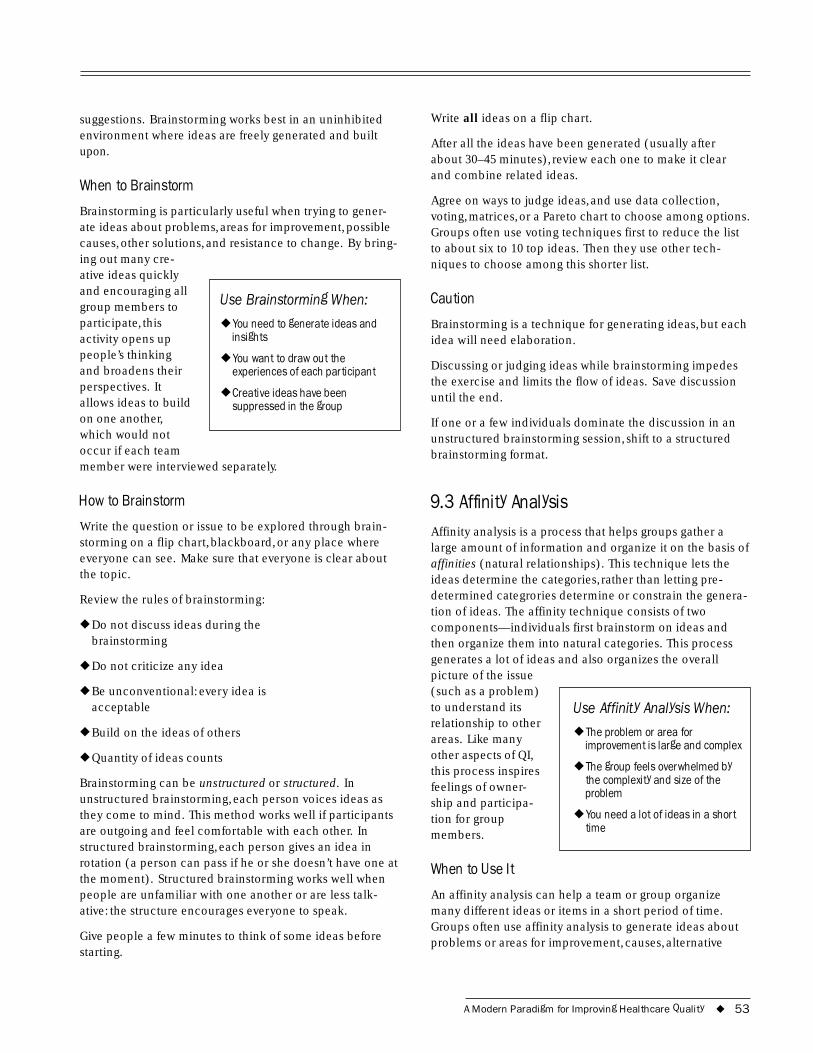
time
suggestions. Brainstorming works best in an uninhibited environment where ideas are freely generated and built upon.
When to Brainstorm
Brainstorming is particularly useful when trying to gener-ate ideas about problems, areas for improvement, possible causes, other solutions, and resistance to change. By bring-ing out many cre-ative ideas quickly and encouraging all
Use Brainstorming When: group members to participate, this ◆ You need to generate ideas and activity opens up insights
people’s thinking ◆ You want to draw out the and broadens their experiences of each participant perspectives. It
◆ Creative ideas have been allows ideas to build suppressed in the group on one another, which would not occur if each team member were interviewed separately.
How to Brainstorm
Write the question or issue to be explored through brain-storming on a flip chart, blackboard, or any place where everyone can see. Make sure that everyone is clear about the topic.
Review the rules of brainstorming:
◆ Do not discuss ideas during the brainstorming
◆ Do not criticize any idea
◆ Be unconventional: every idea is acceptable
◆ Build on the ideas of others
◆ Quantity of ideas counts
Brainstorming can be unstructured or structured. In unstructured brainstorming, each person voices ideas as they come to mind. This method works well if participants are outgoing and feel comfortable with each other. In structured brainstorming, each person gives an idea in rotation (a person can pass if he or she doesn’t have one at the moment). Structured brainstorming works well when people are unfamiliar with one another or are less talk-ative: the structure encourages everyone to speak.
Give people a few minutes to think of some ideas before starting.
Write all ideas on a flip chart.
After all the ideas have been generated (usually after about 30–45 minutes), review each one to make it clear and combine related ideas.
Agree on ways to judge ideas, and use data collection, voting, matrices, or a Pareto chart to choose among options. Groups often use voting techniques first to reduce the list to about six to 10 top ideas. Then they use other tech-niques to choose among this shorter list.
Caution
Brainstorming is a technique for generating ideas, but each idea will need elaboration.
Discussing or judging ideas while brainstorming impedes the exercise and limits the flow of ideas. Save discussion until the end.
If one or a few individuals dominate the discussion in an unstructured brainstorming session, shift to a structured brainstorming format.
9.3 Affinity Analysis Affinity analysis is a process that helps groups gather a large amount of information and organize it on the basis of affinities (natural relationships). This technique lets the ideas determine the categories, rather than letting pre-determined categrories determine or constrain the genera-tion of ideas. The affinity technique consists of two components—individuals first brainstorm on ideas and then organize them into natural categories. This process generates a lot of ideas and also organizes the overall picture of the issue (such as a problem) to understand its Use Affinity Analysis When: relationship to other
◆ The problem or area for areas. Like many improvement is large and complex other aspects of QI, this process inspires ◆ The group feels overwhelmed by
the complexity and size of the feelings of owner- problem ship and participa-tion for group ◆ You need a lot of ideas in a short
members.
When to Use It
An affinity analysis can help a team or group organize many different ideas or items in a short period of time. Groups often use affinity analysis to generate ideas about problems or areas for improvement, causes, alternative
A Modern Paradigm for Improving Healthcare Quality ◆ 53
solutions, and resistance to change. It is chiefly useful when issues appear too large or complex, when consensus is desired, or when creative ideas are needed. Because everyone’s idea is included and groupings of ideas are done by the team, it helps develop consensus. It is also useful for making sure that no ideas are lost.
How to Use It
State the issue or question to be considered and assure that all participants are clear on what is being asked.
Generate and record ideas on slips of paper. Each idea or item should be recorded on its own slip. Post-it Notes® or notecards, if available, make this exercise easier.
Generate ideas through group brainstorming. Have one person take charge of writing down each idea, or have each person record his or her own ideas. Having each person record his or her own ideas works best when it is important to capture everyone’s individual contribution or to draw on everyone’s expertise.
Place the slips of paper in any order in a manner that allows everyone to see them (e.g., on a table or wall).
Ask team members to sort the ideas on the slips of paper into categories by moving the slips of paper around; mem-bers should keep the discussion brief. After a while, the team members will stop moving items around.
If the group is large, have the members work in groups of three or four to arrange the slips. Allow each group to work for a few minutes then call the next group of three or four. Let the groups continue in turns until they are no longer moving items around.
Do not force an item into a category; it is fine to have categories with only a single item.
If an item is constantly being moved back and forth between two categories, either clarify its meaning or make a copy and put it in both categories.
Develop a name for each category that captures the essen-tial meaning of all the items in the category. When doing this, look first among the items in the category. If no single item captures the idea clearly, create one that does. Write it on a slip of paper.
Transfer the category titles and lists from all the slips of paper onto a sheet of paper; use lines to separate the categories.
Use prioritization tools to select from among categories.
Caution
Sorting should be done as silently as possible. Discuss the items on the slips of paper only for clarification.
9.4 Creative Thinking Techniques Tools and methods like brainstorming and affinity analysis allow us to collect our thoughts; creative thinking tech-niques provide new ideas and ways to look at things, including needs for improvement. We tend to think in terms of our individual belief systems and the context in which we operate. Creative thinking techniques help us to break out of our own ideas and see things, such as prob-lems, from a different perspective. Creativity is a means to “connecting, rearranging, and transforming knowledge to generate new, surprising, and useful ideas” (Plesk, 1997).
There are many methods to encourage creative thinking, including element modification and random word provocation.
When to Use Element Modification and Random Word Provocation
Element modification lists elements in a common scene and varies them one by one. This method helps us to examine our daily reality in a different way to see which elements can be improved. Random word provocation records free-flow thought associated with the area of improvement. Some of the ideas generated seem outra-geous or impractical but may be adapted to show prob-lems in a new way. The application of concepts foreign to your organization can also create new ideas for quality improvement. For example, a group could think about the attributes of a library and how they could be applied to improve a hospital. By listing library services such as reference materials, library cards, or database systems, groups generate new ideas for improvements in health organizations.
9.5 Prioritization Tools: Making Decisions among Options
Group methods for narrowing down and ranking a list of ideas include voting and prioritization matrices. Both methods allow individuals to express their opinions or choices in reaching a group decision. Voting is a relatively unstructured technique where group members make a choice, using either implicit or explicit criteria. Prioritization matrices allow the team to review the options against a standard set of explicit criteria.
54 ◆ A Modern Paradigm for Improving Healthcare Quality
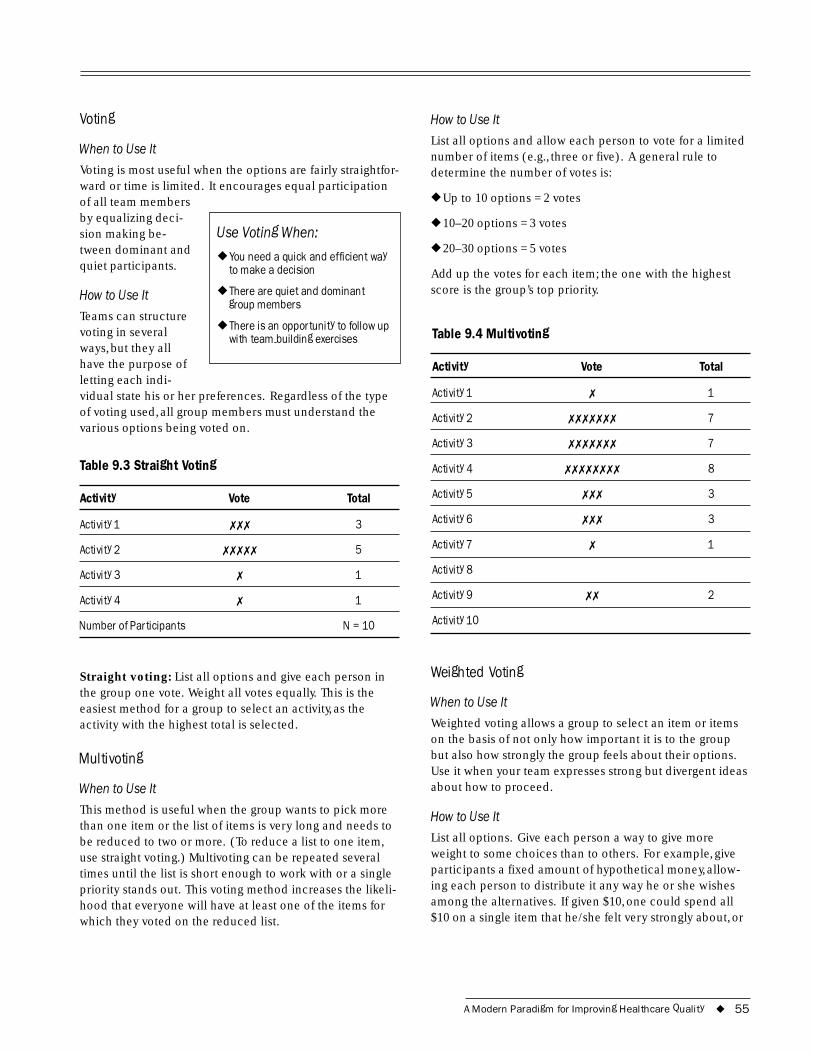
Voting
When to Use It
Voting is most useful when the options are fairly straightfor-ward or time is limited. It encourages equal participation of all team members by equalizing deci-sion making be- Use Voting When: tween dominant and
◆ You need a quick and efficient way quiet participants. to make a decision
How to Use It ◆ There are quiet and dominant group members
Teams can structure voting in several
◆ There is an opportunity to follow up with team-building exercises
ways, but they all have the purpose of letting each indi-vidual state his or her preferences. Regardless of the type of voting used, all group members must understand the various options being voted on.
Table 9.3 Straight Voting
Activity Vote Total
Activity 1 ✗✗✗ 3
Activity 2 ✗✗✗✗✗ 5
Activity 3 ✗ 1
Activity 4 ✗ 1
Number of Participants N = 10
Straight voting: List all options and give each person in the group one vote. Weight all votes equally. This is the easiest method for a group to select an activity, as the activity with the highest total is selected.
Multivoting
When to Use It
This method is useful when the group wants to pick more than one item or the list of items is very long and needs to be reduced to two or more. (To reduce a list to one item, use straight voting.) Multivoting can be repeated several times until the list is short enough to work with or a single priority stands out. This voting method increases the likeli-hood that everyone will have at least one of the items for which they voted on the reduced list.
How to Use It
List all options and allow each person to vote for a limited number of items (e.g., three or five). A general rule to determine the number of votes is:
◆ Up to 10 options = 2 votes
◆ 10–20 options = 3 votes
◆ 20–30 options = 5 votes
Add up the votes for each item; the one with the highest score is the group’s top priority.
Table 9.4 Multivoting
Activity Vote Total
Activity 1 ✗ 1
Activity 2 ✗✗✗✗✗✗✗ 7
Activity 3 ✗✗✗✗✗✗✗ 7
Activity 4 ✗✗✗✗✗✗✗✗ 8
Activity 5 ✗✗✗ 3
Activity 6 ✗✗✗ 3
Activity 7 ✗ 1
Activity 8
Activity 9 ✗✗ 2
Activity 10
Weighted Voting
When to Use It
Weighted voting allows a group to select an item or items on the basis of not only how important it is to the group but also how strongly the group feels about their options. Use it when your team expresses strong but divergent ideas about how to proceed.
How to Use It
List all options. Give each person a way to give more weight to some choices than to others. For example, give participants a fixed amount of hypothetical money, allow-ing each person to distribute it any way he or she wishes among the alternatives. If given $10, one could spend all $10 on a single item that he/she felt very strongly about, or
A Modern Paradigm for Improving Healthcare Quality ◆ 55
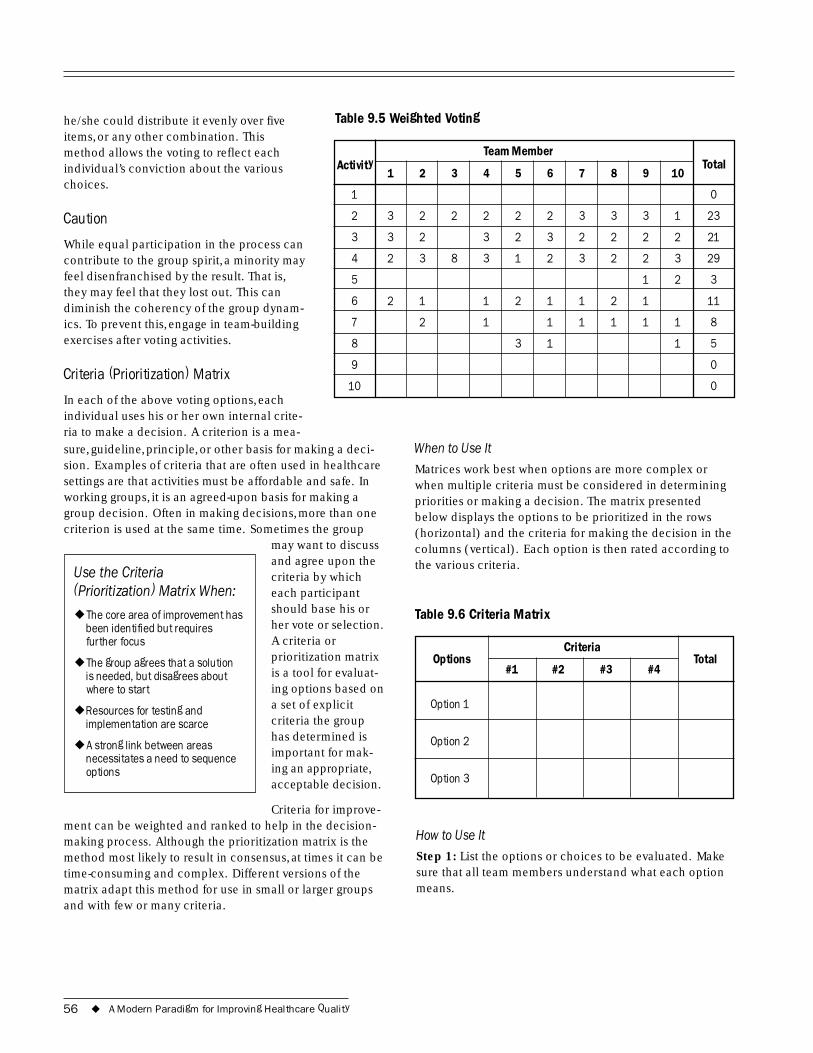
he/she could distribute it evenly over five Table 9.5 Weighted Voting items, or any other combination. This method allows the voting to reflect each individual’s conviction about the various choices.
Caution
While equal participation in the process can contribute to the group spirit, a minority may feel disenfranchised by the result. That is, they may feel that they lost out. This can diminish the coherency of the group dynam-ics. To prevent this, engage in team-building exercises after voting activities.
Criteria (Prioritization) Matrix
In each of the above voting options, each individual uses his or her own internal crite-ria to make a decision. A criterion is a mea-sure, guideline, principle, or other basis for making a deci-sion. Examples of criteria that are often used in healthcare settings are that activities must be affordable and safe. In working groups, it is an agreed-upon basis for making a group decision. Often in making decisions, more than one criterion is used at the same time. Sometimes the group
may want to discuss and agree upon the
Use the Criteria criteria by which (Prioritization) Matrix When: each participant
should base his or ◆ The core area of improvement has
been identified but requires her vote or selection. further focus A criteria or
◆ The group agrees that a solution prioritization matrix
is needed, but disagrees about is a tool for evaluat-where to start ing options based on
◆ Resources for testing and a set of explicit
implementation are scarce criteria the group has determined is
◆ A strong link between areas necessitates a need to sequence important for mak-
options ing an appropriate, acceptable decision.
Criteria for improve-ment can be weighted and ranked to help in the decision-making process. Although the prioritization matrix is the method most likely to result in consensus, at times it can be time-consuming and complex. Different versions of the matrix adapt this method for use in small or larger groups and with few or many criteria.
Activity Team Member
Total 1 2 3 4 5 6 7 8 9 10
1 0
2 3 2 2 2 2 2 3 3 3 1 23
3 3 2 3 2 3 2 2 2 2 21
4 2 3 8 3 1 2 3 2 2 3 29
5 1 2 3
6 2 1 1 2 1 1 2 1 11
7 2 1 1 1 1 1 1 8
8 3 1 1 5
9 0
10 0
When to Use It
Matrices work best when options are more complex or when multiple criteria must be considered in determining priorities or making a decision. The matrix presented below displays the options to be prioritized in the rows (horizontal) and the criteria for making the decision in the columns (vertical). Each option is then rated according to the various criteria.
Table 9.6 Criteria Matrix
Options Criteria
Total #1 #2 #3 #4
Option 1
Option 2
Option 3
How to Use It
Step 1: List the options or choices to be evaluated. Make sure that all team members understand what each option means.
56 ◆ A Modern Paradigm for Improving Healthcare Quality
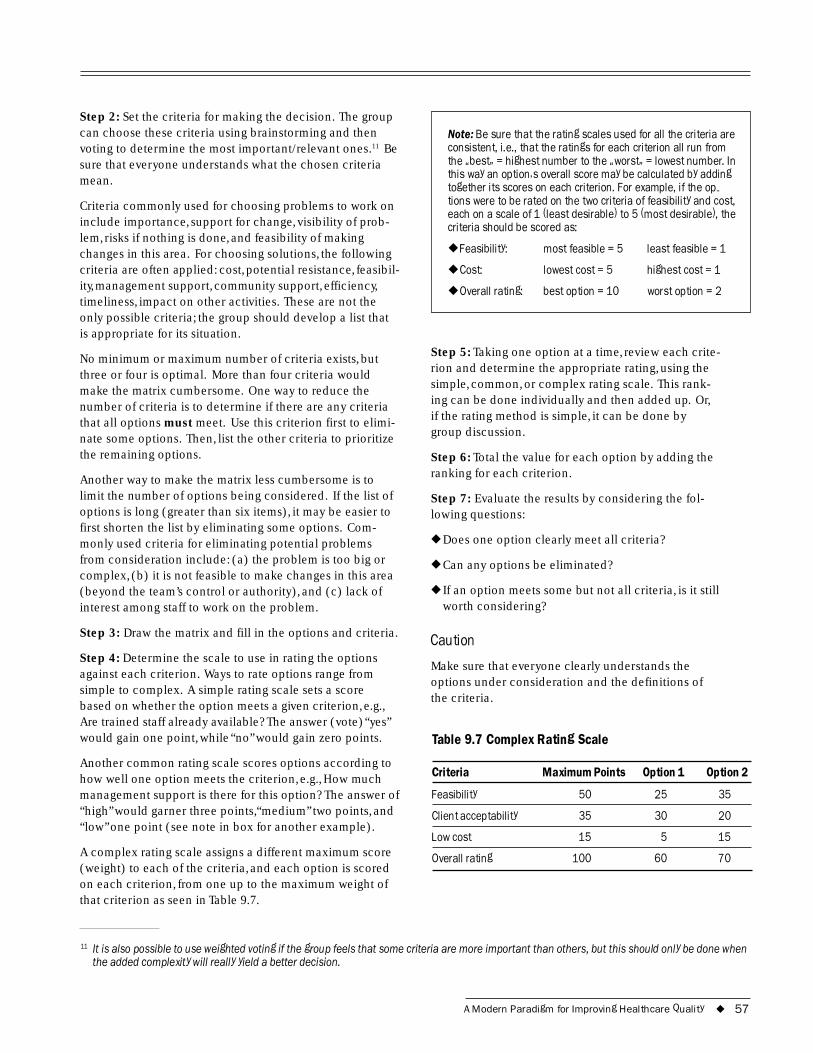
Step 2: Set the criteria for making the decision. The group can choose these criteria using brainstorming and then voting to determine the most important/relevant ones.11 Be sure that everyone understands what the chosen criteria mean.
Criteria commonly used for choosing problems to work on include importance, support for change, visibility of prob-lem, risks if nothing is done, and feasibility of making changes in this area. For choosing solutions, the following criteria are often applied: cost, potential resistance, feasibil-ity, management support, community support, efficiency, timeliness, impact on other activities. These are not the only possible criteria; the group should develop a list that is appropriate for its situation.
No minimum or maximum number of criteria exists, but three or four is optimal. More than four criteria would make the matrix cumbersome. One way to reduce the number of criteria is to determine if there are any criteria that all options must meet. Use this criterion first to elimi-nate some options. Then, list the other criteria to prioritize the remaining options.
Another way to make the matrix less cumbersome is to limit the number of options being considered. If the list of options is long (greater than six items), it may be easier to first shorten the list by eliminating some options. Com-monly used criteria for eliminating potential problems from consideration include: (a) the problem is too big or complex, (b) it is not feasible to make changes in this area (beyond the team’s control or authority), and (c) lack of interest among staff to work on the problem.
Step 3: Draw the matrix and fill in the options and criteria.
Step 4: Determine the scale to use in rating the options against each criterion. Ways to rate options range from simple to complex. A simple rating scale sets a score based on whether the option meets a given criterion, e.g., Are trained staff already available? The answer (vote) “yes” would gain one point, while “no” would gain zero points.
Another common rating scale scores options according to how well one option meets the criterion, e.g., How much management support is there for this option? The answer of “high” would garner three points,“medium” two points, and “low” one point (see note in box for another example).
A complex rating scale assigns a different maximum score (weight) to each of the criteria, and each option is scored on each criterion, from one up to the maximum weight of that criterion as seen in Table 9.7.
Note: Be sure that the rating scales used for all the criteria are consistent, i.e., that the ratings for each criterion all run from the �best� = highest number to the �worst� = lowest number. In this way an option�s overall score may be calculated by adding together its scores on each criterion. For example, if the op- tions were to be rated on the two criteria of feasibility and cost, each on a scale of 1 (least desirable) to 5 (most desirable), the criteria should be scored as:
◆ Feasibility: most feasible = 5 least feasible = 1
◆ Cost: lowest cost = 5 highest cost = 1
◆ Overall rating: best option = 10 worst option = 2
Step 5: Taking one option at a time, review each crite-rion and determine the appropriate rating, using the simple, common, or complex rating scale. This rank-ing can be done individually and then added up. Or, if the rating method is simple, it can be done by group discussion.
Step 6: Total the value for each option by adding the ranking for each criterion.
Step 7: Evaluate the results by considering the fol-lowing questions:
◆ Does one option clearly meet all criteria?
◆ Can any options be eliminated?
◆ If an option meets some but not all criteria, is it still worth considering?
Caution
Make sure that everyone clearly understands the options under consideration and the definitions of the criteria.
Table 9.7 Complex Rating Scale
Criteria Maximum Points Option 1 Option 2
Feasibility 50 25 35
Client acceptability 35 30 20
Low cost 15 5 15
Overall rating 100 60 70
11 It is also possible to use weighted voting if the group feels that some criteria are more important than others, but this should only be done when the added complexity will really yield a better decision.
A Modern Paradigm for Improving Healthcare Quality ◆ 57
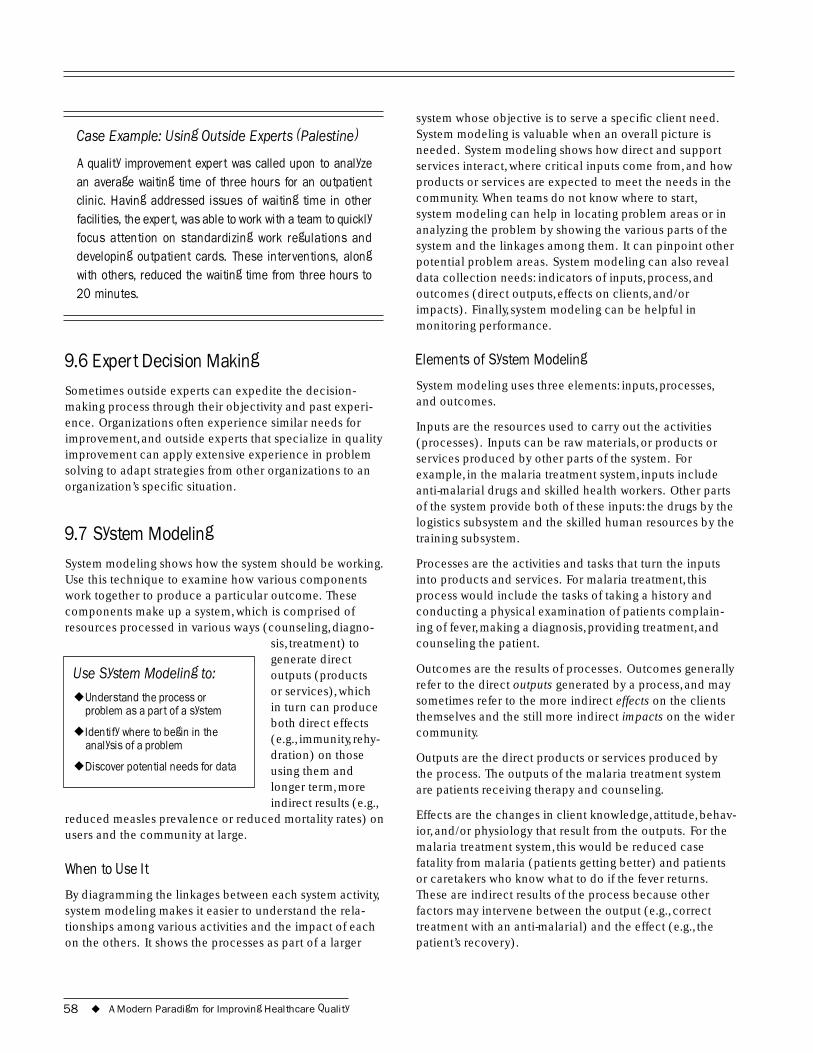
Case Example: Using Outside Experts (Palestine)
A quality improvement expert was called upon to analyze an average waiting time of three hours for an outpatient clinic. Having addressed issues of waiting time in other facilities, the expert, was able to work with a team to quickly focus attention on standardizing work regulations and developing outpatient cards. These interventions, along with others, reduced the waiting time from three hours to 20 minutes.
9.6 Expert Decision Making Sometimes outside experts can expedite the decision-making process through their objectivity and past experi-ence. Organizations often experience similar needs for improvement, and outside experts that specialize in quality improvement can apply extensive experience in problem solving to adapt strategies from other organizations to an organization’s specific situation.
9.7 System Modeling System modeling shows how the system should be working. Use this technique to examine how various components work together to produce a particular outcome. These components make up a system, which is comprised of resources processed in various ways (counseling, diagno-
sis, treatment) to generate direct
Use System Modeling to: outputs (products or services), which
◆ Understand the process or problem as a part of a system in turn can produce
both direct effects ◆ Identify where to begin in the (e.g., immunity, rehy-analysis of a problem
dration) on those ◆ Discover potential needs for data using them and
longer term, more indirect results (e.g.,
reduced measles prevalence or reduced mortality rates) on users and the community at large.
When to Use It
By diagramming the linkages between each system activity, system modeling makes it easier to understand the rela-tionships among various activities and the impact of each on the others. It shows the processes as part of a larger
system whose objective is to serve a specific client need. System modeling is valuable when an overall picture is needed. System modeling shows how direct and support services interact, where critical inputs come from, and how products or services are expected to meet the needs in the community. When teams do not know where to start, system modeling can help in locating problem areas or in analyzing the problem by showing the various parts of the system and the linkages among them. It can pinpoint other potential problem areas. System modeling can also reveal data collection needs: indicators of inputs, process, and outcomes (direct outputs, effects on clients, and/or impacts). Finally, system modeling can be helpful in monitoring performance.
Elements of System Modeling
System modeling uses three elements: inputs, processes, and outcomes.
Inputs are the resources used to carry out the activities (processes). Inputs can be raw materials, or products or services produced by other parts of the system. For example, in the malaria treatment system, inputs include anti-malarial drugs and skilled health workers. Other parts of the system provide both of these inputs: the drugs by the logistics subsystem and the skilled human resources by the training subsystem.
Processes are the activities and tasks that turn the inputs into products and services. For malaria treatment, this process would include the tasks of taking a history and conducting a physical examination of patients complain-ing of fever, making a diagnosis, providing treatment, and counseling the patient.
Outcomes are the results of processes. Outcomes generally refer to the direct outputs generated by a process, and may sometimes refer to the more indirect effects on the clients themselves and the still more indirect impacts on the wider community.
Outputs are the direct products or services produced by the process. The outputs of the malaria treatment system are patients receiving therapy and counseling.
Effects are the changes in client knowledge, attitude, behav-ior, and/or physiology that result from the outputs. For the malaria treatment system, this would be reduced case fatality from malaria (patients getting better) and patients or caretakers who know what to do if the fever returns. These are indirect results of the process because other factors may intervene between the output (e.g., correct treatment with an anti-malarial) and the effect (e.g., the patient’s recovery).
58 ◆ A Modern Paradigm for Improving Healthcare Quality
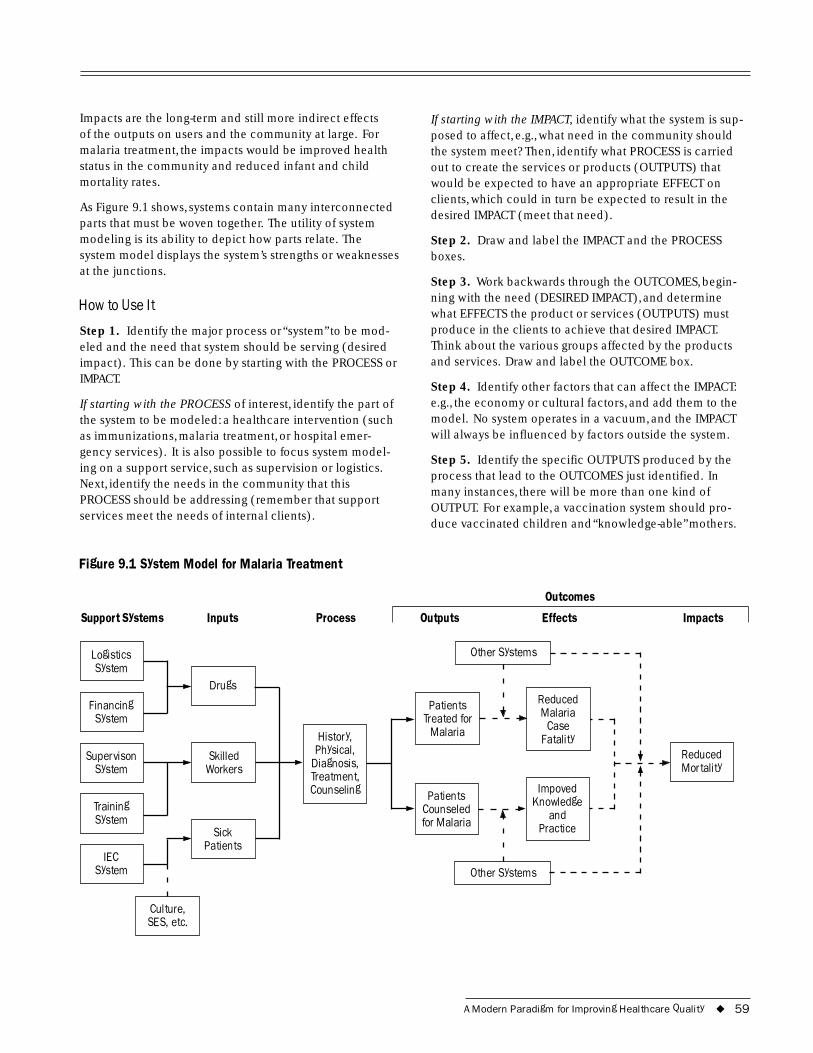
Impacts are the long-term and still more indirect effects of the outputs on users and the community at large. For malaria treatment, the impacts would be improved health status in the community and reduced infant and child mortality rates.
As Figure 9.1 shows, systems contain many interconnected parts that must be woven together. The utility of system modeling is its ability to depict how parts relate. The system model displays the system’s strengths or weaknesses at the junctions.
How to Use It
Step 1. Identify the major process or “system” to be mod-eled and the need that system should be serving (desired impact). This can be done by starting with the PROCESS or IMPACT.
If starting with the PROCESS of interest, identify the part of the system to be modeled: a healthcare intervention (such as immunizations, malaria treatment, or hospital emer-gency services). It is also possible to focus system model-ing on a support service, such as supervision or logistics. Next, identify the needs in the community that this PROCESS should be addressing (remember that support services meet the needs of internal clients).
Figure 9.1 System Model for Malaria Treatment
If starting with the IMPACT, identify what the system is sup-posed to affect, e.g., what need in the community should the system meet? Then, identify what PROCESS is carried out to create the services or products (OUTPUTS) that would be expected to have an appropriate EFFECT on clients, which could in turn be expected to result in the desired IMPACT (meet that need).
Step 2. Draw and label the IMPACT and the PROCESS boxes.
Step 3. Work backwards through the OUTCOMES, begin-ning with the need (DESIRED IMPACT), and determine what EFFECTS the product or services (OUTPUTS) must produce in the clients to achieve that desired IMPACT. Think about the various groups affected by the products and services. Draw and label the OUTCOME box.
Step 4. Identify other factors that can affect the IMPACT: e.g., the economy or cultural factors, and add them to the model. No system operates in a vacuum, and the IMPACT will always be influenced by factors outside the system.
Step 5. Identify the specific OUTPUTS produced by the process that lead to the OUTCOMES just identified. In many instances, there will be more than one kind of OUTPUT. For example, a vaccination system should pro-duce vaccinated children and “knowledge-able” mothers.
Outcomes
Support Systems Inputs Process Outputs Effects Impacts
Other Systems Logistics
Financing
IEC
Drugs
,
Diagnosis,
Counseling
Sick
Skilled
System
System
Supervison System
Training System
System
HistoryPhysical,
Treatment,
Patients
Workers
Case
Counseled and Practice
Patients Treated for
Malaria
Reduced Malaria
Fatality
Patients
for Malaria
Impoved Knowledge
Reduced Mortality
Other Systems
Culture, SES, etc.
A Modern Paradigm for Improving Healthcare Quality ◆ 59
Step 6. Identify the major task categories in the PROCESS: e.g., taking the history, giving the physical, making a diagno-sis, giving a treatment, and counseling. Write these in the PROCESS box. Review the OUTPUTS (e.g., patient history recorded, patient diagnosed, patient treated) and make sure that there is an OUTPUT identified for each benefi-ciary of the major tasks.
Step 7. Identify the various INPUTS needed to carry out the process. These INPUTS should include manpower, material, information, and financial resources. Draw boxes for the various INPUTS and label them. Determine which support systems (such as logistics, training, supervision) produce each of these INPUTS and write the sources in the boxes.
Using the System Model for Problem Analysis
Review the various elements of the system. Determine what data are needed to know whether the system is suffi-ciently productive or adequately functioning to achieve the outcome and impact desired. Use these data to assess whether the system is performing the way it should be according to the system model you have drawn. Identify weak or missing components of the system by seeing where in the process quality falls short.
Caution
Involve people who know the system being modeled, either while developing the model or as reviewers after it has been drafted.
Be sure that the system model really addresses the identi-fied problem.
9.8 Flowchart A flowchart is a graphic representation of how a process works, showing, at a minimum, the sequence of steps. Sev-eral types of flowcharts exist: the most simple (high level), a detailed version (detailed), and one that also indicates the people involved in the steps (deployment or matrix).
When to Use It
A flowchart helps to clarify how things are currently work-ing and how they could be improved. It also assists in finding the key elements of a process, while drawing clear lines between where one process ends and the next one starts. Developing a flowchart stimulates communication among participants and establishes a common under-standing about the process. Flowcharts also uncover steps that are redundant or misplaced. In addition, flowcharts
are used to identify appropriate team Use Flowcharts To: members, to identify ◆ Understand processes who provides inputs
◆ Consider ways to simplify or resources to processes whom, to establish important areas for ◆ Recognize unnecessary steps in
a process monitoring or data collection, to iden- ◆ Determine areas for monitoring
tify areas for im- or data collection
provement or ◆ Identify who will be involved in increased efficiency, or effected by the improvement
and to generate process
hypotheses about ◆ Formulate questions for further causes. Flowcharts research
can be used to ex-amine processes for the flow of patients, information, materials, clinical care, or combinations of these processes. It is recommended that flowcharts be created through group discussion, as indi-viduals rarely know the entire process and the communica-tion contributes to improvement.
Types of Flowcharts
High-Level Flowchart
A high-level (also called first-level or top-down) flowchart shows the major steps in a process. It illustrates a “birds-eye view” of a process, such as the example in Figure 9.2. It can also include the intermediate outputs of each step (the product or service produced), and the sub-steps involved. Such a flowchart offers a basic picture of the process and identifies the changes taking place within the process. It is significantly useful for identifying appropriate team members (those who are involved in the process) and for developing indicators for monitoring the process because of its focus on intermediate outputs.
Most processes can be adequately portrayed in four or five boxes that represent the major steps or activities of the process. In fact, it is a good idea to use only a few boxes, because doing so forces one to consider the most impor-tant steps. Other steps are usually sub-steps of the more important ones.
Detailed Flowchart
The detailed flowchart provides a detailed picture of a process by mapping all of the steps and activities that occur in the process. This type of flowchart indicates the steps or activities of a process and includes such things as decision points, waiting periods, tasks that frequently must be redone (rework), and feedback loops. This type of flow-chart is useful for examining areas of the process in detail
60 ◆ A Modern Paradigm for Improving Healthcare Quality
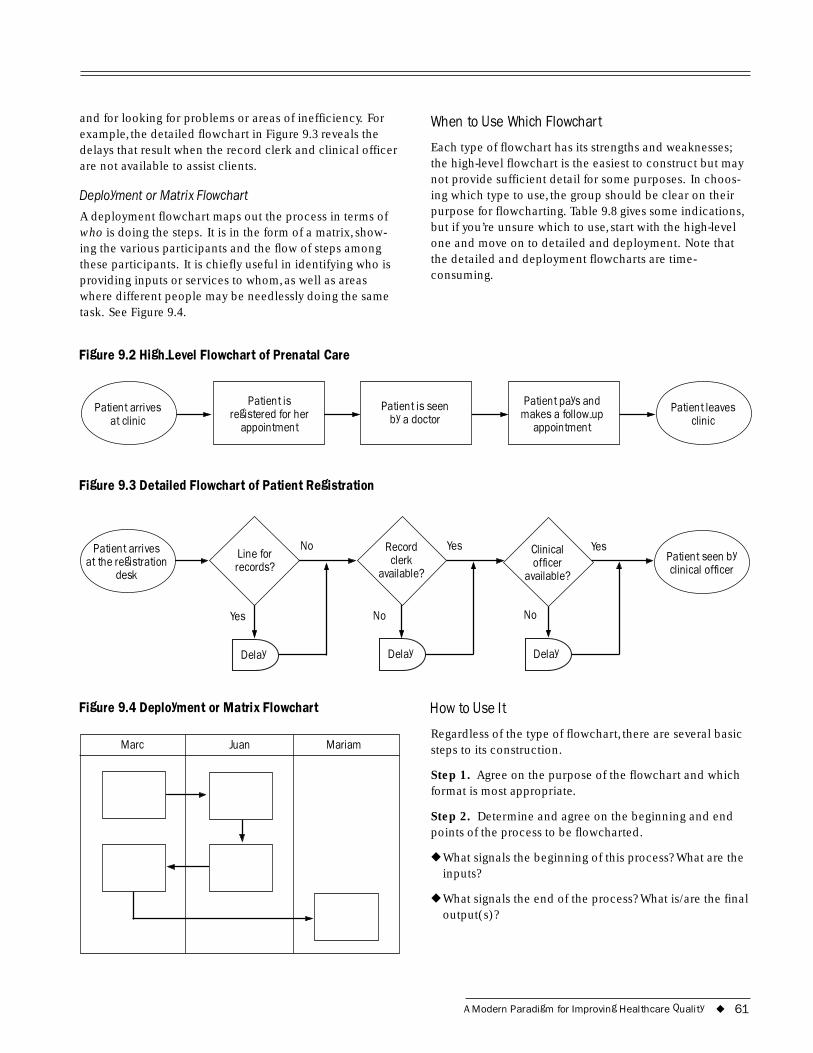
and for looking for problems or areas of inefficiency. For example, the detailed flowchart in Figure 9.3 reveals the delays that result when the record clerk and clinical officer are not available to assist clients.
Deployment or Matrix Flowchart
A deployment flowchart maps out the process in terms of who is doing the steps. It is in the form of a matrix, show-ing the various participants and the flow of steps among these participants. It is chiefly useful in identifying who is providing inputs or services to whom, as well as areas where different people may be needlessly doing the same task. See Figure 9.4.
Figure 9.2 High-Level Flowchart of Prenatal Care
at clinic
Patient is
appointment -up
appointment
Patient arrives registered for her Patient is seen
by a doctor
Patient pays and makes a follow
Figure 9.3 Detailed Flowchart of Patient Registration
When to Use Which Flowchart
Each type of flowchart has its strengths and weaknesses; the high-level flowchart is the easiest to construct but may not provide sufficient detail for some purposes. In choos-ing which type to use, the group should be clear on their purpose for flowcharting. Table 9.8 gives some indications, but if you’re unsure which to use, start with the high-level one and move on to detailed and deployment. Note that the detailed and deployment flowcharts are time-consuming.
clinic Patient leaves
at the registration desk
clerk Clinical
icer No
No No
Patient arrives Line for records?
Record
available? off
available?
Yes
Yes Yes
Delay Delay Delay
Figure 9.4 Deployment or Matrix Flowchart
Juan MariamMarc
Patient seen by clinical officer
How to Use It
Regardless of the type of flowchart, there are several basic steps to its construction.
Step 1. Agree on the purpose of the flowchart and which format is most appropriate.
Step 2. Determine and agree on the beginning and end points of the process to be flowcharted.
◆ What signals the beginning of this process? What are the inputs?
◆ What signals the end of the process? What is/are the final output(s)?
A Modern Paradigm for Improving Healthcare Quality ◆ 61
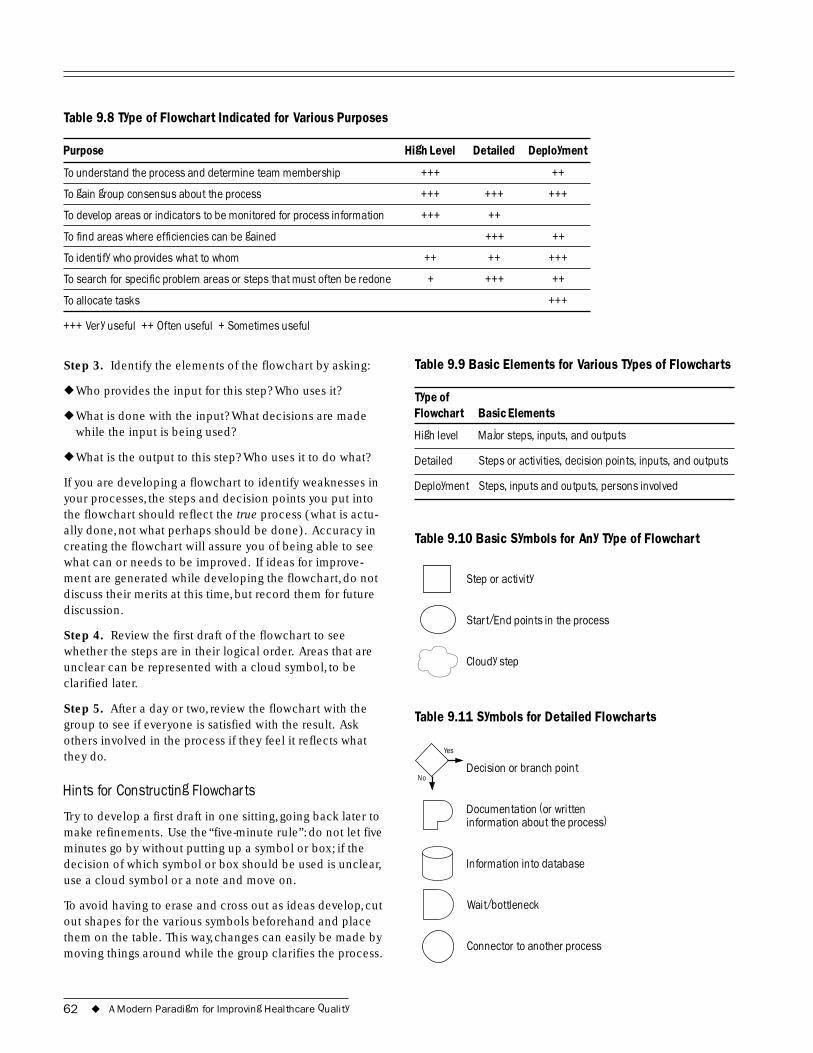
Table 9.8 Type of Flowchart Indicated for Various Purposes
Purpose High Level Detailed Deployment
To understand the process and determine team membership +++ ++
To gain group consensus about the process +++ +++ +++
To develop areas or indicators to be monitored for process information +++ ++
To find areas where efficiencies can be gained +++ ++
To identify who provides what to whom ++ ++ +++
To search for specific problem areas or steps that must often be redone + +++ ++
To allocate tasks +++
+++ Very useful ++ Often useful + Sometimes useful
Step 3. Identify the elements of the flowchart by asking:
◆ Who provides the input for this step? Who uses it?
◆ What is done with the input? What decisions are made while the input is being used?
◆ What is the output to this step? Who uses it to do what?
If you are developing a flowchart to identify weaknesses in your processes, the steps and decision points you put into the flowchart should reflect the true process (what is actu-ally done, not what perhaps should be done). Accuracy in creating the flowchart will assure you of being able to see what can or needs to be improved. If ideas for improve-ment are generated while developing the flowchart, do not discuss their merits at this time, but record them for future discussion.
Step 4. Review the first draft of the flowchart to see whether the steps are in their logical order. Areas that are unclear can be represented with a cloud symbol, to be clarified later.
Step 5. After a day or two, review the flowchart with the group to see if everyone is satisfied with the result. Ask others involved in the process if they feel it reflects what they do.
Hints for Constructing Flowcharts
Try to develop a first draft in one sitting, going back later to make refinements. Use the “five-minute rule”: do not let five minutes go by without putting up a symbol or box; if the decision of which symbol or box should be used is unclear, use a cloud symbol or a note and move on.
To avoid having to erase and cross out as ideas develop, cut out shapes for the various symbols beforehand and place them on the table. This way, changes can easily be made by moving things around while the group clarifies the process.
Table 9.9 Basic Elements for Various Types of Flowcharts
Type of Flowchart Basic Elements
High level Major steps, inputs, and outputs
Detailed Steps or activities, decision points, inputs, and outputs
Deployment Steps, inputs and outputs, persons involved
Table 9.10 Basic Symbols for Any Type of Flowchart
Step or activity
Start/End points in the process
Cloudy step
Table 9.11 Symbols for Detailed Flowcharts
No
Yes
Decision or branch point
Documentation (or written information about the process)
Information into database
Wait/bottleneck
Connector to another process
62 ◆ A Modern Paradigm for Improving Healthcare Quality
Decision symbols are appropriate when those working in the process make a decision that will affect how the pro-cess will proceed. For example, when the outcome of the decision or question is YES, the person would follow one set of steps, and if the outcome is NO, the person would do another set of steps. Be sure the text in the decision sym-bol would generate a YES or NO response, so that the flow of the diagram is logical.
In deciding how much detail to put in the flowchart (i.e., how much to break down each general step), remember the purpose of the flowchart. For example, a flowchart to better understand the problem of long waiting times would need to break down in detail only those steps that could have an effect on waiting times. Steps that do not affect waiting times can be left without much detail.
Keep in mind that a flowchart may not need to include all the possible symbols. For example, the wait symbol ( ) may not be needed if the flowchart is not related to waiting times.
Analyzing the Detailed Flowchart to Identify Problem Areas
Once the flowchart has been constructed to represent how the process actually works, examine potential problem areas or areas for improvement using one or more of the following techniques.
Examine each decision symbol: Does it represent an activ-ity to see if everything is going well? Is it effective? Is it redundant?
Examine each loop that indicates work being redone (rework): Does this rework loop prevent the problem from recurring? Are repairs being made long after the step where the errors originally occurred?
Examine each activity symbol: Is this step redundant? Does it add value to the product or service? Is it problematic? Could errors be prevented in this activity?
Examine each document or database symbol: Is this neces-sary? Is it up to date? Is there a single source for the infor-mation? Could this information be used for monitoring and improving the process?
Examine each wait symbol:What complexities or addi-tional problems does this wait cause? How long is the wait? Could it be reduced?
Examine each transition where one person finishes his or her part of the process and another person picks it up: Who is involved? What could go wrong? Is the intermediate product or service meeting the needs of the next person in the process?
Examine the overall process: Is the flow logical? Are there fuzzy areas or places where the process leads off to nowhere? Are there parallel tracks? Is there a rationale for those?
Caution
Flowcharts for quality improvement should always reflect the actual process, not the ideal process. A flowchart must reflect what really happens.
Involve people who know the process, either while devel-oping the flowchart or as reviewers when the chart has been completed.
Be sure that the flowchart really focuses on the identified problem.
9.9 Cause-and-Effect Analysis A cause-and-effect analysis generates and sorts hypotheses about possible causes of problems within a process by asking participants to list all of the possible causes and effects for the identified problem. This analysis tool orga-nizes a large amount of information by showing links between events and their potential or actual causes and provides a means of generating ideas about why the prob-lem is occurring and possible effects of that cause. Cause-and-effect analyses allow problem solvers to broaden their thinking and look at the overall picture of a problem. Cause-and-effect diagrams can reflect either causes that block the way to the desired state or helpful factors needed to reach the desired state.
When to Use It
A graphic presentation, with major branches reflecting categories of causes, a cause-and-effect analysis stimulates and broadens thinking about potential or real causes and facilitates further examination of individual causes. Because everyone’s ideas can find a place on the diagram, a cause-and-effect analysis helps to generate consensus about causes. It can help to focus attention on the process where a problem is occurring and to allow for constructive use of facts revealed by reported events. However, it is important to remember that a cause-and-effect diagram is a structured way of expressing hypotheses about the causes of a problem or about why something is not happening as desired. It cannot replace empirical testing of these hypotheses: it does not tell which is the root cause, but rather possible causes.
A Modern Paradigm for Improving Healthcare Quality ◆ 63
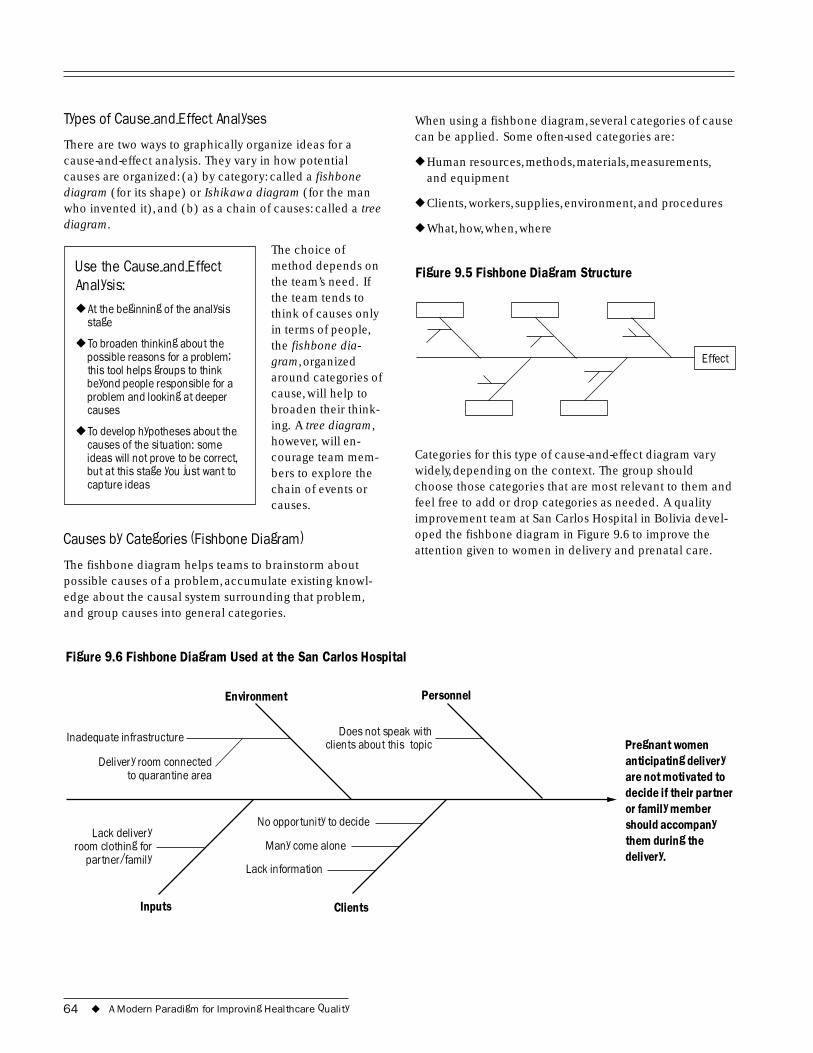
Types of Cause-and-Effect Analyses When using a fishbone diagram, several categories of cause can be applied. Some often-used categories are:
There are two ways to graphically organize ideas for a cause-and-effect analysis. They vary in how potential ◆ Human resources, methods, materials, measurements, causes are organized: (a) by category: called a fishbone and equipment diagram (for its shape) or Ishikawa diagram (for the man who invented it), and (b) as a chain of causes: called a tree ◆ Clients, workers, supplies, environment, and procedures
diagram. ◆ What, how, when, where
The choice of Use the Cause-and-Effect method depends on Figure 9.5 Fishbone Diagram Structure Analysis: the team’s need. If
the team tends to ◆ At the beginning of the analysis think of causes only
stage in terms of people, ◆ To broaden thinking about the
possible reasons for a problem;this tool helps groups to thinkbeyond people responsible for aproblem and looking at deepercauses
the fishbone dia-gram, organized around categories of cause, will help to broaden their think-
Effect
◆ To develop hypotheses about the ing. A tree diagram,
causes of the situation: some however, will en- ideas will not prove to be correct, courage team mem- Categories for this type of cause-and-effect diagram vary but at this stage you just want to bers to explore the widely, depending on the context. The group should capture ideas chain of events or choose those categories that are most relevant to them and
causes. feel free to add or drop categories as needed. A quality improvement team at San Carlos Hospital in Bolivia devel-
Causes by Categories (Fishbone Diagram) oped the fishbone diagram in Figure 9.6 to improve the attention given to women in delivery and prenatal care.
The fishbone diagram helps teams to brainstorm about possible causes of a problem, accumulate existing knowl-edge about the causal system surrounding that problem, and group causes into general categories.
Figure 9.6 Fishbone Diagram Used at the San Carlos Hospital
Environment Personnel
them during the .
Does not speak with Pregnant women anticipating delivery are not motivated to decide if their partner or family member should accompany
delivery
clients about this topic Inadequate infrastructure
Delivery room connected to quarantine area
No opportunity to decide
Many come alone Lack delivery
room clothing for partner/family
Lack information
Inputs Clients
64 ◆ A Modern Paradigm for Improving Healthcare Quality
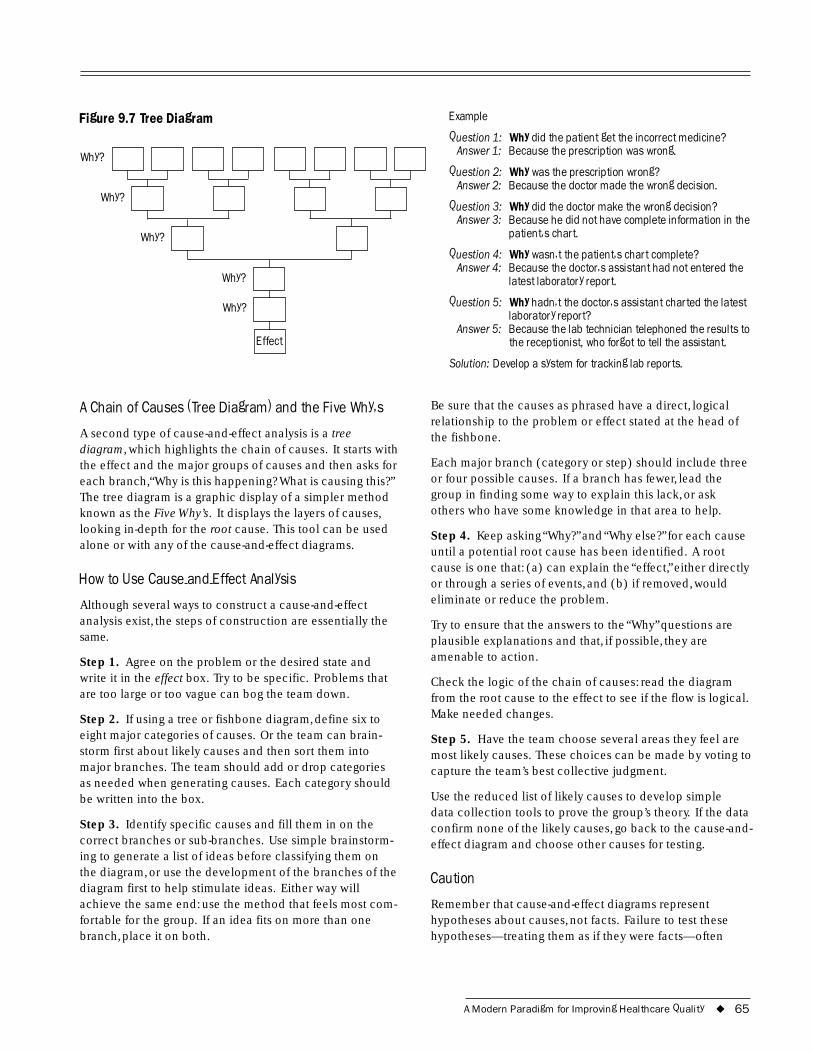
Why?
Figure 9.7 Tree Diagram
Why?
Why?
Why?
Why?
Effect
A Chain of Causes (Tree Diagram) and the Five Why�s
A second type of cause-and-effect analysis is a tree diagram, which highlights the chain of causes. It starts with the effect and the major groups of causes and then asks for each branch,“Why is this happening? What is causing this?” The tree diagram is a graphic display of a simpler method known as the Five Why’s. It displays the layers of causes, looking in-depth for the root cause. This tool can be used alone or with any of the cause-and-effect diagrams.
How to Use Cause-and-Effect Analysis
Although several ways to construct a cause-and-effect analysis exist, the steps of construction are essentially the same.
Step 1. Agree on the problem or the desired state and write it in the effect box. Try to be specific. Problems that are too large or too vague can bog the team down.
Step 2. If using a tree or fishbone diagram, define six to eight major categories of causes. Or the team can brain-storm first about likely causes and then sort them into major branches. The team should add or drop categories as needed when generating causes. Each category should be written into the box.
Step 3. Identify specific causes and fill them in on the correct branches or sub-branches. Use simple brainstorm-ing to generate a list of ideas before classifying them on the diagram, or use the development of the branches of the diagram first to help stimulate ideas. Either way will achieve the same end: use the method that feels most com-fortable for the group. If an idea fits on more than one branch, place it on both.
Example
Question 1: Answer 1:
Why did the patient get the incorrect medicine? Because the prescription was wrong.
Question 2: Answer 2:
Why was the prescription wrong? Because the doctor made the wrong decision.
Question 3: Answer 3:
Why did the doctor make the wrong decision? Because he did not have complete information in the patient�s chart.
Question 4: Answer 4:
Why wasn�t the patient�s chart complete? Because the doctor�s assistant had not entered the latest laboratory report.
Question 5:
Answer 5:
Why hadn�t the doctor�s assistant charted the latest laboratory report? Because the lab technician telephoned the results to the receptionist, who forgot to tell the assistant.
Solution: Develop a system for tracking lab reports.
Be sure that the causes as phrased have a direct, logical relationship to the problem or effect stated at the head of the fishbone.
Each major branch (category or step) should include three or four possible causes. If a branch has fewer, lead the group in finding some way to explain this lack, or ask others who have some knowledge in that area to help.
Step 4. Keep asking “Why?” and “Why else?” for each cause until a potential root cause has been identified. A root cause is one that: (a) can explain the “effect,” either directly or through a series of events, and (b) if removed, would eliminate or reduce the problem.
Try to ensure that the answers to the “Why” questions are plausible explanations and that, if possible, they are amenable to action.
Check the logic of the chain of causes: read the diagram from the root cause to the effect to see if the flow is logical. Make needed changes.
Step 5. Have the team choose several areas they feel are most likely causes. These choices can be made by voting to capture the team’s best collective judgment.
Use the reduced list of likely causes to develop simple data collection tools to prove the group’s theory. If the data confirm none of the likely causes, go back to the cause-and-effect diagram and choose other causes for testing.
Caution
Remember that cause-and-effect diagrams represent hypotheses about causes, not facts. Failure to test these hypotheses—treating them as if they were facts—often
A Modern Paradigm for Improving Healthcare Quality ◆ 65
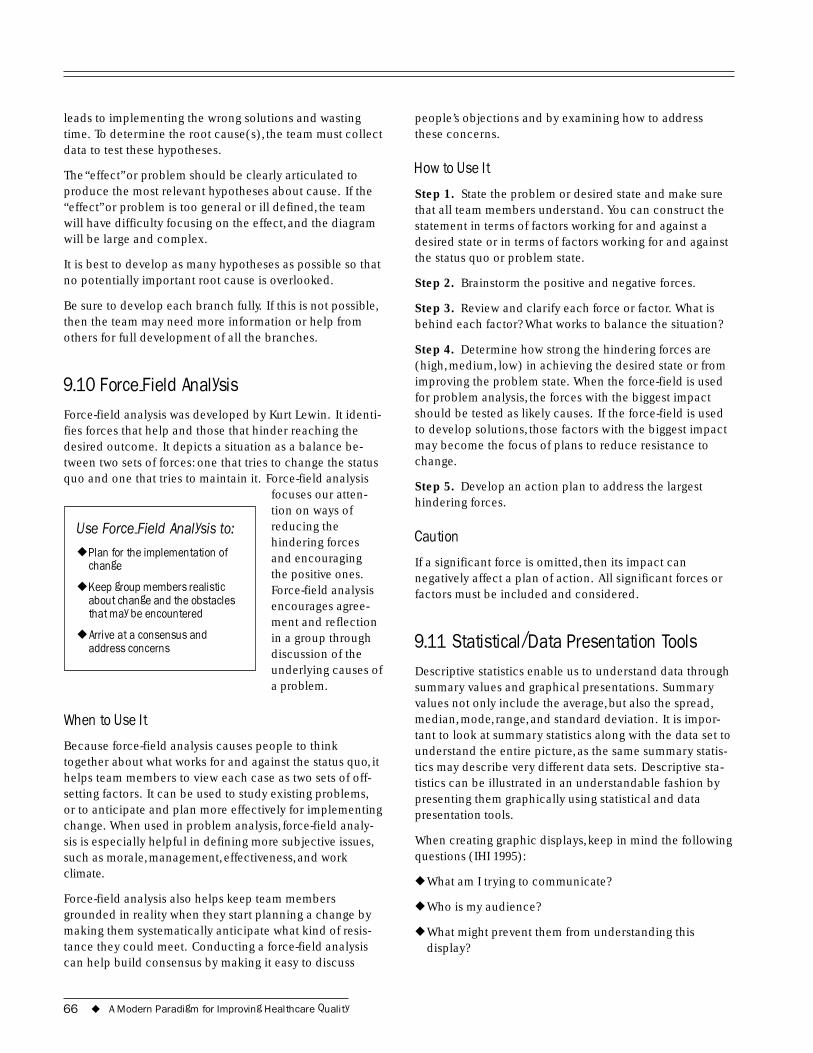
leads to implementing the wrong solutions and wasting time. To determine the root cause(s), the team must collect data to test these hypotheses.
The “effect” or problem should be clearly articulated to produce the most relevant hypotheses about cause. If the “effect” or problem is too general or ill defined, the team will have difficulty focusing on the effect, and the diagram will be large and complex.
It is best to develop as many hypotheses as possible so that no potentially important root cause is overlooked.
Be sure to develop each branch fully. If this is not possible, then the team may need more information or help from others for full development of all the branches.
9.10 Force-Field Analysis Force-field analysis was developed by Kurt Lewin. It identi-fies forces that help and those that hinder reaching the desired outcome. It depicts a situation as a balance be-tween two sets of forces: one that tries to change the status quo and one that tries to maintain it. Force-field analysis
focuses our atten-tion on ways of reducing the Use Force-Field Analysis to: hindering forces
◆ Plan for the implementation of and encouraging change
the positive ones. ◆ Keep group members realistic Force-field analysis
about change and the obstacles that may be encountered
encourages agree-ment and reflection
◆ Arrive at a consensus and in a group through address concerns discussion of the
underlying causes of a problem.
When to Use It
Because force-field analysis causes people to think together about what works for and against the status quo, it helps team members to view each case as two sets of off-setting factors. It can be used to study existing problems, or to anticipate and plan more effectively for implementing change. When used in problem analysis, force-field analy-sis is especially helpful in defining more subjective issues, such as morale, management, effectiveness, and work climate.
Force-field analysis also helps keep team members grounded in reality when they start planning a change by making them systematically anticipate what kind of resis-tance they could meet. Conducting a force-field analysis can help build consensus by making it easy to discuss
people’s objections and by examining how to address these concerns.
How to Use It
Step 1. State the problem or desired state and make sure that all team members understand. You can construct the statement in terms of factors working for and against a desired state or in terms of factors working for and against the status quo or problem state.
Step 2. Brainstorm the positive and negative forces.
Step 3. Review and clarify each force or factor. What is behind each factor? What works to balance the situation?
Step 4. Determine how strong the hindering forces are (high, medium, low) in achieving the desired state or from improving the problem state. When the force-field is used for problem analysis, the forces with the biggest impact should be tested as likely causes. If the force-field is used to develop solutions, those factors with the biggest impact may become the focus of plans to reduce resistance to change.
Step 5. Develop an action plan to address the largest hindering forces.
Caution
If a significant force is omitted, then its impact can negatively affect a plan of action. All significant forces or factors must be included and considered.
9.11 Statistical/Data Presentation Tools Descriptive statistics enable us to understand data through summary values and graphical presentations. Summary values not only include the average, but also the spread, median, mode, range, and standard deviation. It is impor-tant to look at summary statistics along with the data set to understand the entire picture, as the same summary statis-tics may describe very different data sets. Descriptive sta-tistics can be illustrated in an understandable fashion by presenting them graphically using statistical and data presentation tools.
When creating graphic displays, keep in mind the following questions (IHI 1995):
◆ What am I trying to communicate?
◆ Who is my audience?
◆ What might prevent them from understanding this display?
66 ◆ A Modern Paradigm for Improving Healthcare Quality
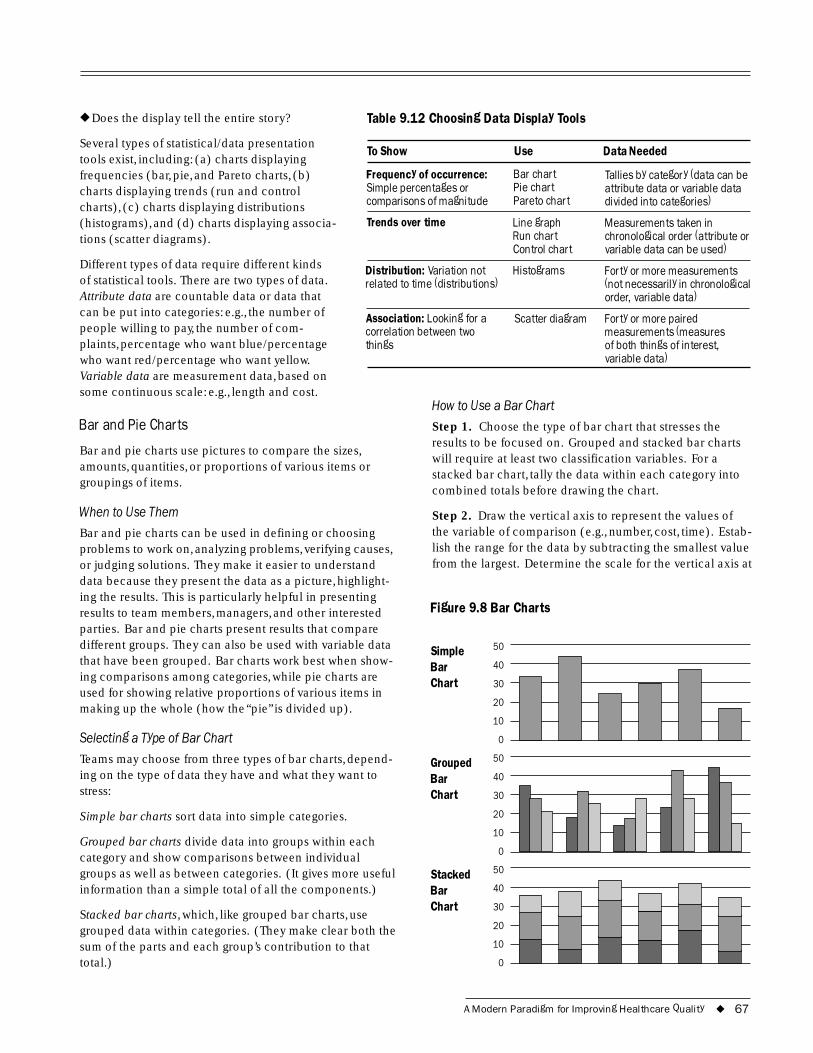
Bar 40
20
10
0
Table 9.12 Choosing Data Display Tools◆ Does the display tell the entire story?
Several types of statistical/data presentation tools exist, including: (a) charts displaying frequencies (bar, pie, and Pareto charts, (b) charts displaying trends (run and control charts), (c) charts displaying distributions (histograms), and (d) charts displaying associa-tions (scatter diagrams).
Different types of data require different kinds of statistical tools. There are two types of data. Attribute data are countable data or data that can be put into categories: e.g., the number of people willing to pay, the number of com-plaints, percentage who want blue/percentage who want red/percentage who want yellow.
To Show Use Data Needed
Frequency of occurrence: Bar chart Tallies by category (data can be Simple percentages or Pie chart attribute data or variable data comparisons of magnitude Pareto chart divided into categories)
Trends over time
Distribution: Variation not related to time (distributions)
Association: Looking for a correlation between two things
Line graph Run chart Control chart
Histograms
Scatter diagram
Measurements taken in chronological order (attribute or variable data can be used)
Forty or more measurements (not necessarily in chronological order, variable data)
Forty or more paired measurements (measures of both things of interest, variable data)
Variable data are measurement data, based on some continuous scale: e.g., length and cost.
Bar and Pie Charts
Bar and pie charts use pictures to compare the sizes, amounts, quantities, or proportions of various items or groupings of items.
When to Use Them
Bar and pie charts can be used in defining or choosing problems to work on, analyzing problems, verifying causes, or judging solutions. They make it easier to understand data because they present the data as a picture, highlight-ing the results. This is particularly helpful in presenting results to team members, managers, and other interested parties. Bar and pie charts present results that compare different groups. They can also be used with variable data that have been grouped. Bar charts work best when show-ing comparisons among categories, while pie charts are used for showing relative proportions of various items in making up the whole (how the “pie” is divided up).
Selecting a Type of Bar Chart
How to Use a Bar Chart
Step 1. Choose the type of bar chart that stresses the results to be focused on. Grouped and stacked bar charts will require at least two classification variables. For a stacked bar chart, tally the data within each category into combined totals before drawing the chart.
Step 2. Draw the vertical axis to represent the values of the variable of comparison (e.g., number, cost, time). Estab-lish the range for the data by subtracting the smallest value from the largest. Determine the scale for the vertical axis at
Figure 9.8 Bar Charts
Simple 50
Chart 30
Teams may choose from three types of bar charts, depend-ing on the type of data they have and what they want to stress:
Simple bar charts sort data into simple categories.
Grouped bar charts divide data into groups within each category and show comparisons between individual
Grouped 50
Bar 40
Chart 30
20
10
0
groups as well as between categories. (It gives more useful Stacked 50
information than a simple total of all the components.) Bar 40
Stacked bar charts, which, like grouped bar charts, use Chart 30
grouped data within categories. (They make clear both the 20
sum of the parts and each group’s contribution to that 10
total.) 0
A Modern Paradigm for Improving Healthcare Quality ◆ 67
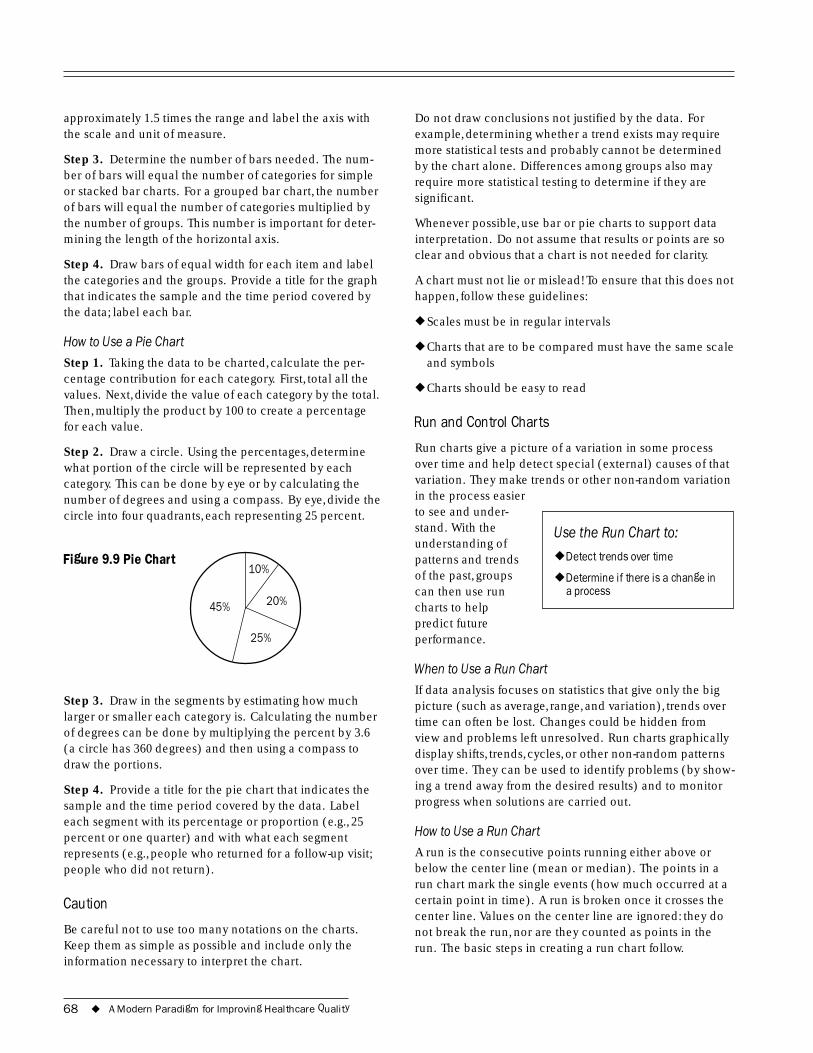
approximately 1.5 times the range and label the axis with the scale and unit of measure.
Step 3. Determine the number of bars needed. The num-ber of bars will equal the number of categories for simple or stacked bar charts. For a grouped bar chart, the number of bars will equal the number of categories multiplied by the number of groups. This number is important for deter-mining the length of the horizontal axis.
Step 4. Draw bars of equal width for each item and label the categories and the groups. Provide a title for the graph that indicates the sample and the time period covered by the data; label each bar.
How to Use a Pie Chart
Step 1. Taking the data to be charted, calculate the per-centage contribution for each category. First, total all the values. Next, divide the value of each category by the total. Then, multiply the product by 100 to create a percentage for each value.
Step 2. Draw a circle. Using the percentages, determine what portion of the circle will be represented by each category. This can be done by eye or by calculating the number of degrees and using a compass. By eye, divide the circle into four quadrants, each representing 25 percent.
Figure 9.9 Pie Chart
45%
25%
20%
10%
Step 3. Draw in the segments by estimating how much larger or smaller each category is. Calculating the number of degrees can be done by multiplying the percent by 3.6 (a circle has 360 degrees) and then using a compass to draw the portions.
Step 4. Provide a title for the pie chart that indicates the sample and the time period covered by the data. Label each segment with its percentage or proportion (e.g., 25 percent or one quarter) and with what each segment represents (e.g., people who returned for a follow-up visit; people who did not return).
Caution
Be careful not to use too many notations on the charts. Keep them as simple as possible and include only the information necessary to interpret the chart.
Do not draw conclusions not justified by the data. For example, determining whether a trend exists may require more statistical tests and probably cannot be determined by the chart alone. Differences among groups also may require more statistical testing to determine if they are significant.
Whenever possible, use bar or pie charts to support data interpretation. Do not assume that results or points are so clear and obvious that a chart is not needed for clarity.
A chart must not lie or mislead! To ensure that this does not happen, follow these guidelines:
◆ Scales must be in regular intervals
◆ Charts that are to be compared must have the same scale and symbols
◆ Charts should be easy to read
Run and Control Charts
Run charts give a picture of a variation in some process over time and help detect special (external) causes of that variation. They make trends or other non-random variation in the process easier to see and under-stand. With the Use the Run Chart to: understanding of patterns and trends ◆ Detect trends over time
of the past, groups ◆ Determine if there is a change in can then use run a process charts to help predict future performance.
When to Use a Run Chart
If data analysis focuses on statistics that give only the big picture (such as average, range, and variation), trends over time can often be lost. Changes could be hidden from view and problems left unresolved. Run charts graphically display shifts, trends, cycles, or other non-random patterns over time. They can be used to identify problems (by show-ing a trend away from the desired results) and to monitor progress when solutions are carried out.
How to Use a Run Chart
A run is the consecutive points running either above or below the center line (mean or median). The points in a run chart mark the single events (how much occurred at a certain point in time). A run is broken once it crosses the center line. Values on the center line are ignored: they do not break the run, nor are they counted as points in the run. The basic steps in creating a run chart follow.
68 ◆ A Modern Paradigm for Improving Healthcare Quality
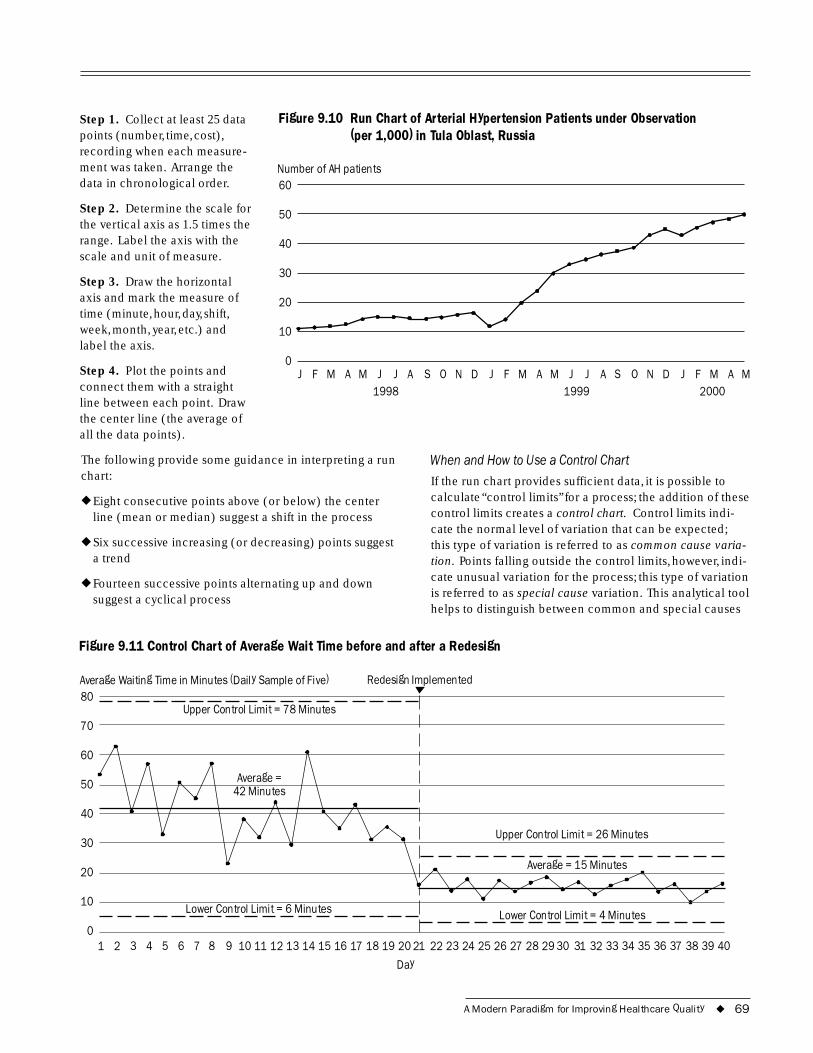
40
30
0
Day
80
70
60
50
40
30
20
10
0
Step 1. Collect at least 25 data Figure 9.10 Run Chart of Arterial Hypertension Patients under Observation points (number, time, cost), (per 1,000) in Tula Oblast, Russia recording when each measure-ment was taken. Arrange the Number of AH patients data in chronological order. 60
Step 2. Determine the scale for 50 the vertical axis as 1.5 times the range. Label the axis with the scale and unit of measure.
Step 3. Draw the horizontal axis and mark the measure of 20 time (minute, hour, day, shift, week, month, year, etc.) and 10 label the axis.
Step 4. Plot the points and J F M A M J J A S O N D J F M A M J J A S O N D J F M A M connect them with a straight 1998 1999 2000 line between each point. Draw the center line (the average of all the data points).
The following provide some guidance in interpreting a run When and How to Use a Control Chart chart: If the run chart provides sufficient data, it is possible to
◆ Eight consecutive points above (or below) the center calculate “control limits” for a process; the addition of these
line (mean or median) suggest a shift in the process control limits creates a control chart. Control limits indi-cate the normal level of variation that can be expected;
◆ Six successive increasing (or decreasing) points suggest this type of variation is referred to as common cause varia-a trend tion. Points falling outside the control limits, however, indi-
◆ Fourteen successive points alternating up and down cate unusual variation for the process; this type of variation
suggest a cyclical process is referred to as special cause variation. This analytical tool helps to distinguish between common and special causes
Figure 9.11 Control Chart of Average Wait Time before and after a Redesign
Average Waiting Time in Minutes (Daily Sample of Five) Redesign Implemented
Upper Control Limit = 78 Minutes
i i
Average = 42 Minutes
Average = 15 Minutes
Lower Control Lim t = 6 Minutes
Upper Control Limit = 26 Minutes
Lower Control Lim t = 4 Minutes
1 2 3 4 5 6 7 8 9 10 11 12 13 14 15 16 17 18 19 20 21 22 23 24 25 26 27 28 29 30 31 32 33 34 35 36 37 38 39 40
A Modern Paradigm for Improving Healthcare Quality ◆ 69
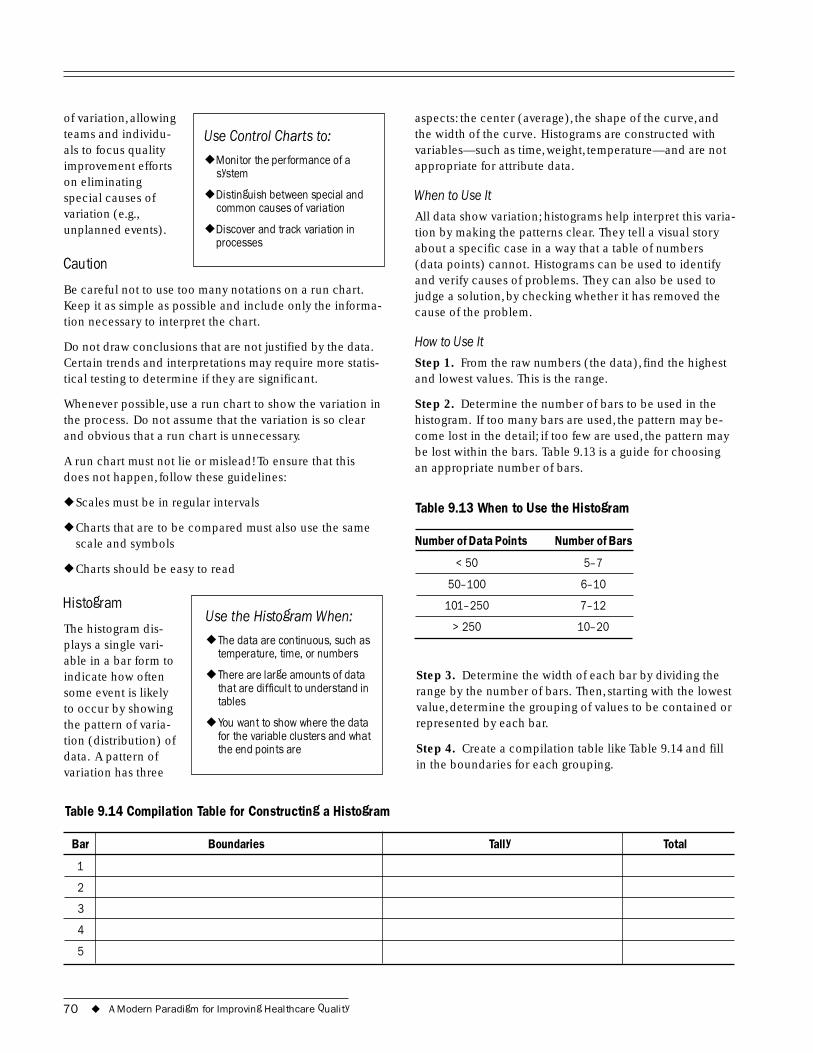
of variation, allowing teams and individu- Use Control Charts to: als to focus quality improvement efforts ◆ Monitor the performance of a
system on eliminating special causes of ◆ Distinguish between special and
variation (e.g., common causes of variation
unplanned events). ◆ Discover and track variation in processes
Caution
Be careful not to use too many notations on a run chart. Keep it as simple as possible and include only the informa-tion necessary to interpret the chart.
Do not draw conclusions that are not justified by the data. Certain trends and interpretations may require more statis-tical testing to determine if they are significant.
Whenever possible, use a run chart to show the variation in the process. Do not assume that the variation is so clear and obvious that a run chart is unnecessary.
A run chart must not lie or mislead! To ensure that this does not happen, follow these guidelines:
◆ Scales must be in regular intervals
◆ Charts that are to be compared must also use the same scale and symbols
◆ Charts should be easy to read
Histogram Use the Histogram When:
The histogram dis-plays a single vari- ◆ The data are continuous, such as
temperature, time, or numbers able in a bar form to indicate how often ◆ There are large amounts of data
some event is likely that are difficult to understand in tablesto occur by showing
the pattern of varia- ◆ You want to show where the data
tion (distribution) of for the variable clusters and what the end points aredata. A pattern of
variation has three
Table 9.14 Compilation Table for Constructing a Histogram
aspects: the center (average), the shape of the curve, and the width of the curve. Histograms are constructed with variables—such as time, weight, temperature—and are not appropriate for attribute data.
When to Use It
All data show variation; histograms help interpret this varia-tion by making the patterns clear. They tell a visual story about a specific case in a way that a table of numbers (data points) cannot. Histograms can be used to identify and verify causes of problems. They can also be used to judge a solution, by checking whether it has removed the cause of the problem.
How to Use It
Step 1. From the raw numbers (the data), find the highest and lowest values. This is the range.
Step 2. Determine the number of bars to be used in the histogram. If too many bars are used, the pattern may be-come lost in the detail; if too few are used, the pattern may be lost within the bars. Table 9.13 is a guide for choosing an appropriate number of bars.
Table 9.13 When to Use the Histogram
Number of Data Points Number of Bars
< 50 5�7
50�100 6�10
101�250 7�12
> 250 10�20
Step 3. Determine the width of each bar by dividing the range by the number of bars. Then, starting with the lowest value, determine the grouping of values to be contained or represented by each bar.
Step 4. Create a compilation table like Table 9.14 and fill in the boundaries for each grouping.
Bar Boundaries Tally Total
1
2
3
4
5
70 ◆ A Modern Paradigm for Improving Healthcare Quality
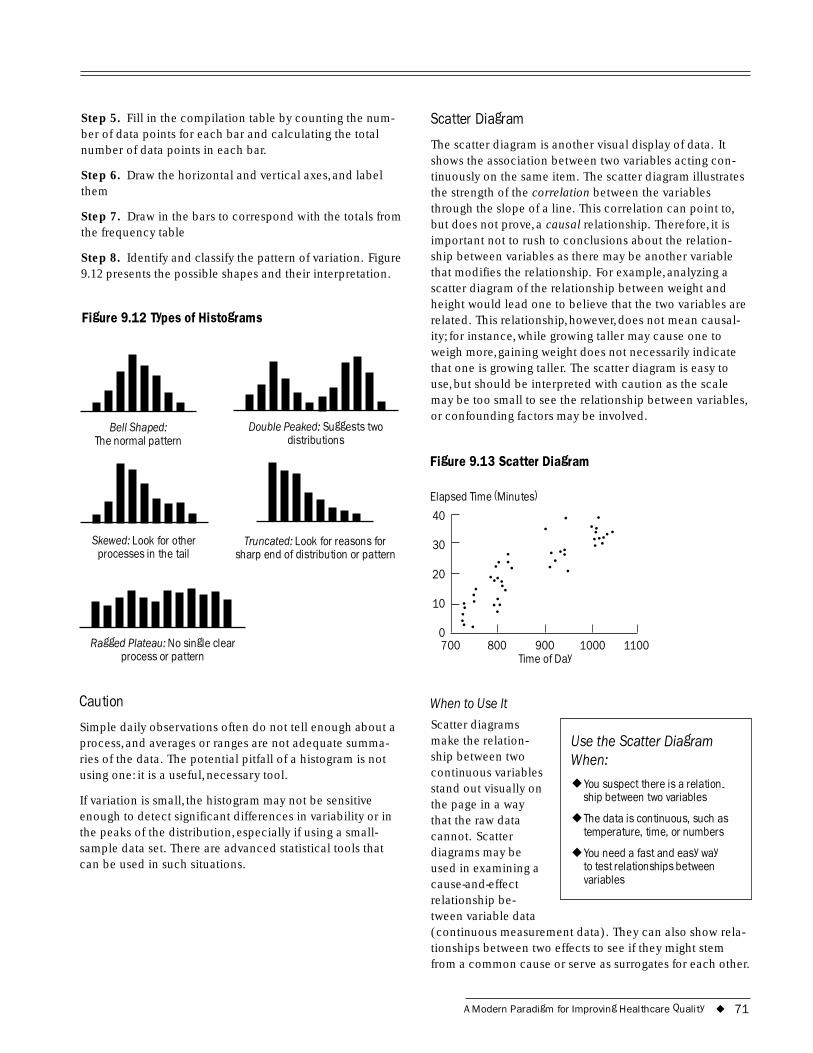
40
30
20
10
0
Step 5. Fill in the compilation table by counting the num-ber of data points for each bar and calculating the total number of data points in each bar.
Step 6. Draw the horizontal and vertical axes, and label them
Step 7. Draw in the bars to correspond with the totals from the frequency table
Step 8. Identify and classify the pattern of variation. Figure 9.12 presents the possible shapes and their interpretation.
Figure 9.12 Types of Histograms
Bell Shaped: Double Peaked: Suggests two The normal pattern distributions
Skewed: Look for other Truncated: Look for reasons for processes in the tail sharp end of distribution or pattern
Ragged Plateau: No single clearprocess or pattern
Caution
Simple daily observations often do not tell enough about a process, and averages or ranges are not adequate summa-ries of the data. The potential pitfall of a histogram is not using one: it is a useful, necessary tool.
If variation is small, the histogram may not be sensitive enough to detect significant differences in variability or in the peaks of the distribution, especially if using a small-sample data set. There are advanced statistical tools that can be used in such situations.
Scatter Diagram
The scatter diagram is another visual display of data. It shows the association between two variables acting con-tinuously on the same item. The scatter diagram illustrates the strength of the correlation between the variables through the slope of a line. This correlation can point to, but does not prove, a causal relationship. Therefore, it is important not to rush to conclusions about the relation-ship between variables as there may be another variable that modifies the relationship. For example, analyzing a scatter diagram of the relationship between weight and height would lead one to believe that the two variables are related. This relationship, however, does not mean causal-ity; for instance, while growing taller may cause one to weigh more, gaining weight does not necessarily indicate that one is growing taller. The scatter diagram is easy to use, but should be interpreted with caution as the scale may be too small to see the relationship between variables, or confounding factors may be involved.
Figure 9.13 Scatter Diagram
Elapsed Time (Minutes)
700 800 900 1000 1100Time of Day
When to Use It
Scatter diagrams make the relation- Use the Scatter Diagram ship between two When: continuous variables stand out visually on ◆ You suspect there is a relation-
ship between two variables the page in a way that the raw data ◆ The data is continuous, such as
cannot. Scatter temperature, time, or numbers
diagrams may be ◆ You need a fast and easy way used in examining a to test relationships between
cause-and-effect variables
relationship be-tween variable data (continuous measurement data). They can also show rela-tionships between two effects to see if they might stem from a common cause or serve as surrogates for each other.
A Modern Paradigm for Improving Healthcare Quality ◆ 71
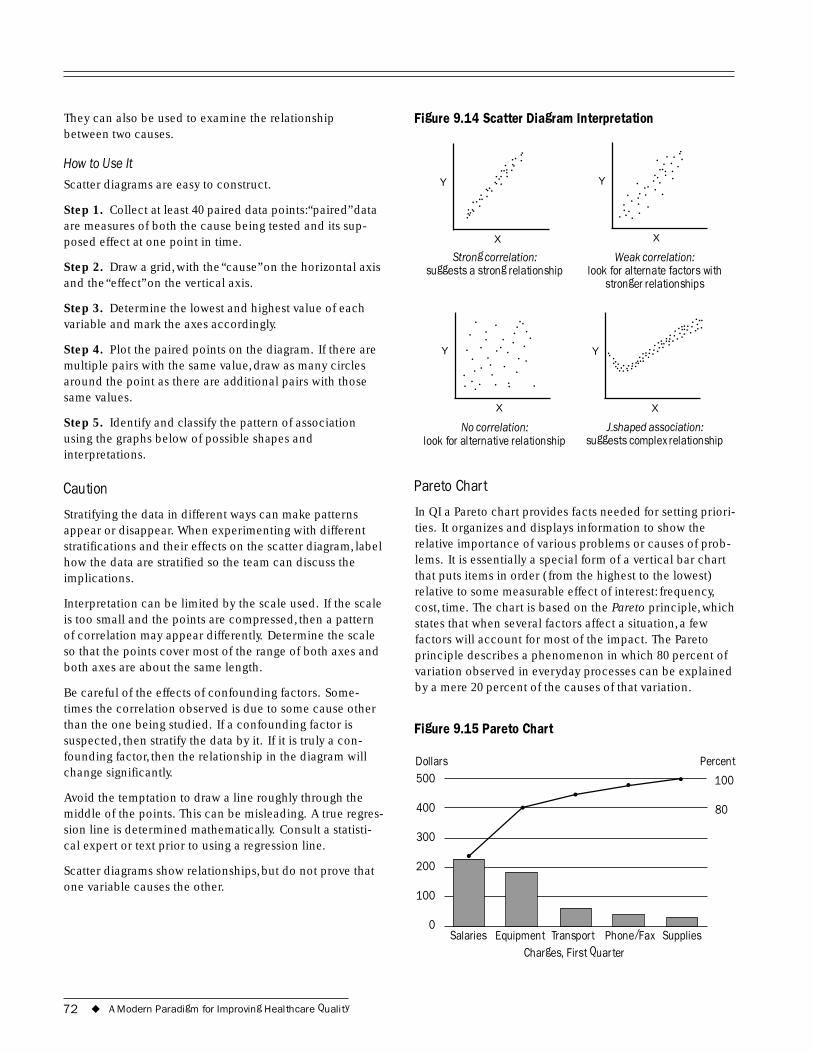
500
400
300
200
100
0
100
80
They can also be used to examine the relationship between two causes.
How to Use It
Scatter diagrams are easy to construct.
Step 1. Collect at least 40 paired data points:“paired” data are measures of both the cause being tested and its sup-posed effect at one point in time.
Step 2. Draw a grid, with the “cause” on the horizontal axis and the “effect” on the vertical axis.
Step 3. Determine the lowest and highest value of each variable and mark the axes accordingly.
Step 4. Plot the paired points on the diagram. If there are multiple pairs with the same value, draw as many circles around the point as there are additional pairs with those same values.
Step 5. Identify and classify the pattern of association using the graphs below of possible shapes and interpretations.
Caution
Stratifying the data in different ways can make patterns appear or disappear. When experimenting with different stratifications and their effects on the scatter diagram, label how the data are stratified so the team can discuss the implications.
Interpretation can be limited by the scale used. If the scale is too small and the points are compressed, then a pattern of correlation may appear differently. Determine the scale so that the points cover most of the range of both axes and both axes are about the same length.
Be careful of the effects of confounding factors. Some-times the correlation observed is due to some cause other than the one being studied. If a confounding factor is suspected, then stratify the data by it. If it is truly a con-founding factor, then the relationship in the diagram will change significantly.
Avoid the temptation to draw a line roughly through the middle of the points. This can be misleading. A true regres-sion line is determined mathematically. Consult a statisti-cal expert or text prior to using a regression line.
Scatter diagrams show relationships, but do not prove that one variable causes the other.
Figure 9.14 Scatter Diagram Interpretation
.... . . ... . . . .. .. ........ . . . ....
. .... . .. . YY .. ..... . . . .. ..... . . . . . . ..... . . . .. . . .
X X
Strong correlation: Weak correlation: suggests a strong relationship look for alternate factors with
stronger relationships
............
........ . . ...
. . . . ...... . . . . ....... .. . .. . .Y Y .......... . ................
. . . . . . . ........... . .. . . . . . .. ..
X X
No correlation: J-shaped association: look for alternative relationship suggests complex relationship
Pareto Chart
In QI a Pareto chart provides facts needed for setting priori-ties. It organizes and displays information to show the relative importance of various problems or causes of prob-lems. It is essentially a special form of a vertical bar chart that puts items in order (from the highest to the lowest) relative to some measurable effect of interest: frequency, cost, time. The chart is based on the Pareto principle, which states that when several factors affect a situation, a few factors will account for most of the impact. The Pareto principle describes a phenomenon in which 80 percent of variation observed in everyday processes can be explained by a mere 20 percent of the causes of that variation.
Figure 9.15 Pareto Chart
Dollars Percent
Salaries Equipment Transport Phone/Fax Supplies Charges, First Quarter
72 ◆ A Modern Paradigm for Improving Healthcare Quality
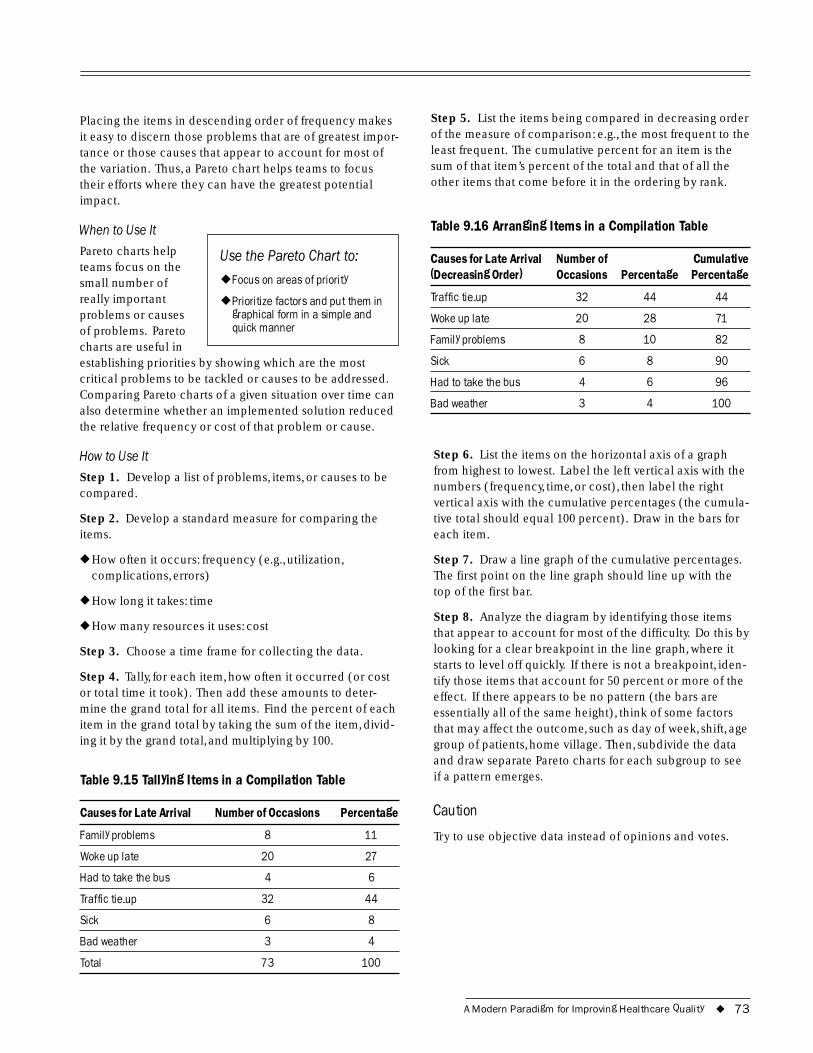
Placing the items in descending order of frequency makes it easy to discern those problems that are of greatest impor-tance or those causes that appear to account for most of the variation. Thus, a Pareto chart helps teams to focus their efforts where they can have the greatest potential impact.
When to Use It
Pareto charts help Use the Pareto Chart to: teams focus on the small number of ◆ Focus on areas of priority
really important ◆ Prioritize factors and put them in problems or causes graphical form in a simple and of problems. Pareto quick manner
charts are useful in establishing priorities by showing which are the most critical problems to be tackled or causes to be addressed. Comparing Pareto charts of a given situation over time can also determine whether an implemented solution reduced the relative frequency or cost of that problem or cause.
How to Use It
Step 1. Develop a list of problems, items, or causes to be compared.
Step 2. Develop a standard measure for comparing the items.
◆ How often it occurs: frequency (e.g., utilization, complications, errors)
◆ How long it takes: time
◆ How many resources it uses: cost
Step 3. Choose a time frame for collecting the data.
Step 4. Tally, for each item, how often it occurred (or cost or total time it took). Then add these amounts to deter-mine the grand total for all items. Find the percent of each item in the grand total by taking the sum of the item, divid-ing it by the grand total, and multiplying by 100.
Table 9.15 Tallying Items in a Compilation Table
Causes for Late Arrival Number of Occasions Percentage
Family problems 8 11
Woke up late 20 27
Had to take the bus 4 6
Traffic tie-up 32 44
Sick 6 8
Bad weather 3 4
Total 73 100
Step 5. List the items being compared in decreasing order of the measure of comparison: e.g., the most frequent to the least frequent. The cumulative percent for an item is the sum of that item’s percent of the total and that of all the other items that come before it in the ordering by rank.
Table 9.16 Arranging Items in a Compilation Table
Causes for Late Arrival Number of Cumulative (Decreasing Order) Occasions Percentage Percentage
Traffic tie-up 32 44 44
Woke up late 20 28 71
Family problems 8 10 82
Sick 6 8 90
Had to take the bus 4 6 96
Bad weather 3 4 100
Step 6. List the items on the horizontal axis of a graph from highest to lowest. Label the left vertical axis with the numbers (frequency, time, or cost), then label the right vertical axis with the cumulative percentages (the cumula-tive total should equal 100 percent). Draw in the bars for each item.
Step 7. Draw a line graph of the cumulative percentages. The first point on the line graph should line up with the top of the first bar.
Step 8. Analyze the diagram by identifying those items that appear to account for most of the difficulty. Do this by looking for a clear breakpoint in the line graph, where it starts to level off quickly. If there is not a breakpoint, iden-tify those items that account for 50 percent or more of the effect. If there appears to be no pattern (the bars are essentially all of the same height), think of some factors that may affect the outcome, such as day of week, shift, age group of patients, home village. Then, subdivide the data and draw separate Pareto charts for each subgroup to see if a pattern emerges.
Caution
Try to use objective data instead of opinions and votes.
A Modern Paradigm for Improving Healthcare Quality ◆ 73
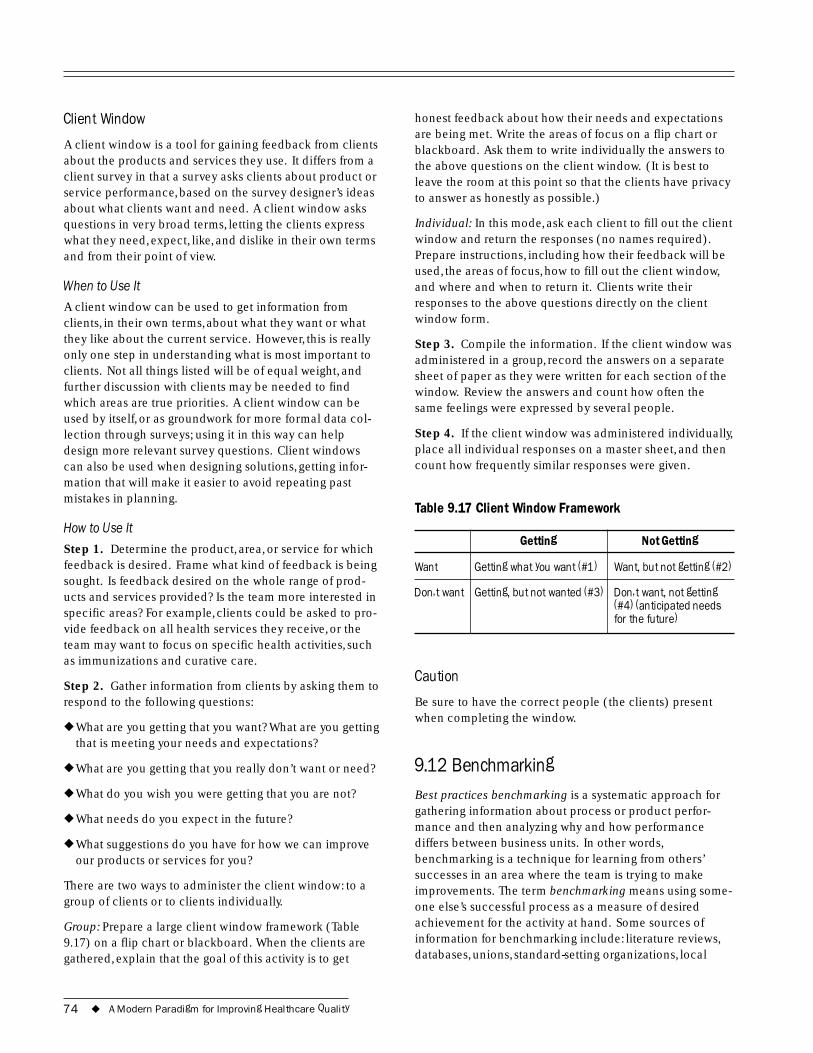
Client Window
A client window is a tool for gaining feedback from clients about the products and services they use. It differs from a client survey in that a survey asks clients about product or service performance, based on the survey designer’s ideas about what clients want and need. A client window asks questions in very broad terms, letting the clients express what they need, expect, like, and dislike in their own terms and from their point of view.
When to Use It
A client window can be used to get information from clients, in their own terms, about what they want or what they like about the current service. However, this is really only one step in understanding what is most important to clients. Not all things listed will be of equal weight, and further discussion with clients may be needed to find which areas are true priorities. A client window can be used by itself, or as groundwork for more formal data col-lection through surveys; using it in this way can help design more relevant survey questions. Client windows can also be used when designing solutions, getting infor-mation that will make it easier to avoid repeating past mistakes in planning.
How to Use It
Step 1. Determine the product, area, or service for which feedback is desired. Frame what kind of feedback is being sought. Is feedback desired on the whole range of prod-ucts and services provided? Is the team more interested in specific areas? For example, clients could be asked to pro-vide feedback on all health services they receive, or the team may want to focus on specific health activities, such as immunizations and curative care.
Step 2. Gather information from clients by asking them to respond to the following questions:
◆ What are you getting that you want? What are you getting that is meeting your needs and expectations?
◆ What are you getting that you really don’t want or need?
◆ What do you wish you were getting that you are not?
◆ What needs do you expect in the future?
◆ What suggestions do you have for how we can improve our products or services for you?
There are two ways to administer the client window: to a group of clients or to clients individually.
Group: Prepare a large client window framework (Table 9.17) on a flip chart or blackboard. When the clients are gathered, explain that the goal of this activity is to get
honest feedback about how their needs and expectations are being met. Write the areas of focus on a flip chart or blackboard. Ask them to write individually the answers to the above questions on the client window. (It is best to leave the room at this point so that the clients have privacy to answer as honestly as possible.)
Individual: In this mode, ask each client to fill out the client window and return the responses (no names required). Prepare instructions, including how their feedback will be used, the areas of focus, how to fill out the client window, and where and when to return it. Clients write their responses to the above questions directly on the client window form.
Step 3. Compile the information. If the client window was administered in a group, record the answers on a separate sheet of paper as they were written for each section of the window. Review the answers and count how often the same feelings were expressed by several people.
Step 4. If the client window was administered individually, place all individual responses on a master sheet, and then count how frequently similar responses were given.
Table 9.17 Client Window Framework
Getting Not Getting
Want Getting what you want (#1) Want, but not getting (#2)
Don�t want Getting, but not wanted (#3) Don�t want, not getting (#4) (anticipated needs for the future)
Caution
Be sure to have the correct people (the clients) present when completing the window.
9.12 Benchmarking Best practices benchmarking is a systematic approach for gathering information about process or product perfor-mance and then analyzing why and how performance differs between business units. In other words, benchmarking is a technique for learning from others’ successes in an area where the team is trying to make improvements. The term benchmarking means using some-one else’s successful process as a measure of desired achievement for the activity at hand. Some sources of information for benchmarking include: literature reviews, databases, unions, standard-setting organizations, local
74 ◆ A Modern Paradigm for Improving Healthcare Quality
organizations, universities, the Use Benchmarking to:government, staff or
◆ Develop plans to address needs customer interviews, for improvement and questionnaires.
◆ Borrow and adapt successful ideas from others
When to Use It ◆ Understand what has already
Benchmarking is been tried
most useful when trying to develop options for potential solutions. When trying to develop solutions, teams often have difficulty generating new ideas. People frequently do not know what others nearby are doing. Benchmarking helps stimulate creativity by gaining knowledge of what has been tried. It can also be used to identify areas for improvement by seeing what level of quality is possible.
How to Use It
Identify other groups, organizations, or health facilities that serve a similar purpose and that appear to work well. They do not need to be doing exactly what the team does, as long as it can be compared. For example, if the team is dealing with problems in hospital laundry services, the team could learn from hotels and dormitories that provide similar services, although they are not in the same field and/or do not provide exactly the same service.
Visit these sites and talk to managers and workers, asking them what they are doing, if they have similar problems, what they have done about it, and what levels of perfor-mance they have achieved. Ask as well what obstacles they have run into and how they have dealt with them.
Review how the situation and constraints for the process in question are similar to or different from theirs and deter-mine if changes are needed in carrying out their plan.
Caution
Be sure to understand fully how the process in question works before looking at others’ processes.
Be sure that the other facility’s process is fully understood before adapting or adopting it to the process in question.
9.13 Gantt Chart A Gantt chart aids planning by showing all activities that must take place and when they are scheduled to occur. This tool helps planners to visualize the work that needs to be completed, the activities that can be overlapped, and deadlines for completion.
When to Use It
Gantt charts provide a graphic guide for carrying out a series of activities, showing the start date, duration, and overlap of activities. Gantt charts are most useful in the Timelines and Gantt Charts planning stages, to Are Best to: mark when each activity should start
◆ Plan a quality improvement project according to activities and
and to draw the time linkages in timing
◆ Understand the overlap and between activities. sequence of activities Gantt charts are also useful for keeping ◆ Monitor progress and re-evaluate
track of progress and deadlines if the project is behind schedule
rescheduling activi-ties if progress is slowed.
How to Use It
Step 1. List all the activities that need to be carried out to implement a solution.
Step 2. Determine when each activity must start and list them in chronological order.
Step 3. Draw the framework for the Gantt chart by listing the months of implementation across the top of a sheet of paper. List the activities down the side.
Step 4. For each activity, mark its starting date. Determine the duration for each activity and, using a horizontal bar, mark the duration on the graph. Continue this process for each activity.
Step 5. Review the chart and determine if it is possible to carry out all the activities that are to be conducted simulta-neously.
9.14 Quality Assurance Storytelling Quality assurance storytelling is an organized way of docu-menting the quality improvement process of a team that is working systematically to resolve a specific problem and/ or improve a given process. QA “stories” are described in detail as they unfold in QA storybooks and presented pub-licly through QA storyboards. Initially developed as Quality Improvement Storytelling for industrial programs, the tech-nique has more recently been adapted and applied to quality improvement efforts in the health sector. Initially this was carried out by the Hospital Corporation of America (HCA). It is increasingly used by others in health
A Modern Paradigm for Improving Healthcare Quality ◆ 75
as an effective way of documenting the activities of QI teams in various of settings.
The QA storybook is a complete and permanent record of the improvement process, usually kept in notebook format. The QA storyboard is a large display area (section of a wall, or a board or poster) that allows a team to display its work publicly in an ongoing, structured, and visually understand-able way. It has been described by HCA’s Batalden and Gillem (1989) as the team’s “working minutes.”
When to Use It
By systematically documenting the quality improvement progress made by a team, QA storytelling helps to keep everyone focused on the task at hand and allows team members to describe their work to others in a clear and comprehensible way. It is normally begun as soon as a problem has been identified and continues throughout the QI process. When used routinely, QA storytelling can help make QA part of the ongoing life of the organization.
How to Use the QA Storybook
One team member is usually designated as recorder to maintain a complete and detailed record of the team’s activities. The record should include minutes of team meetings as well as such items as lists of persons con-tacted, presentations made, indicators monitored, sampling designs and analytical methods employed, data collected, etc. From time to time the recorder may use the informa-tion in this record to prepare brief summaries of the team’s progress in resolving the problem in question. Items are selected from this record for posting on the QA storyboard.
How to Use the QA Storyboard
The QA storyboard serves as an ongoing visual record of the team’s progress, helping to keep team members focused on the task while sharing their progress with others. Storyboards use simple, clear statements as well as pictures and graphs to describe a problem, summarize the analysis process while it is under way, describe the solution and its implementation, and display the results. Steps in creating and maintaining a QA storyboard follow.
Step 1. Reserve a section of the wall or secure a large board or poster board (measuring at least one and a half meters high by two meters in length) to serve as the QA storyboard.
Step 2. Mark off and label different areas of the storyboard for displaying the team’s progress during each of the quality improvement steps. Include areas for the problem statement, names of team members, the work plan, activities undertaken during problem analysis (e.g., root
cause analysis, graphs, etc.) and the results, solution(s) selected, solution implemented, the results, and any other information that seems interesting or relevant.
Step 3. Post a copy of the initial statement of the problem and the names of the team members. A picture of the team may be added.
Step 4. Keep these up-to-date as the problem statement is refined and/or as team membership changes.
Step 5. Post a copy of the team’s work plan and schedule, and modify it as changes are made during the problem-solving process.
Step 6. As work progresses, display the progress made in analyzing the problem. If analytical tools were used (e.g., flowcharts, cause-and-effect diagrams), include these items on the storyboard. It is also useful to include (if they were used) the list of indicators to be monitored, the data col-lection forms, and graphs displaying the results.
Step 7. Post the findings of the problem analysis and the solution(s) proposed and selected for implementation.
Step 8. Add any other aspects of the process of solution identification and selection (e.g., selection criteria or selection method) to be displayed for ready reference.
Step 9. Maintain an ongoing display of the progress of solution implementation. Show as much (or as little) detail as team members find helpful, either to focus their own work or to communicate their work to others.
Step 10. When the solution has been implemented and evaluated, post the results for all to see.
Caution
The storyboard is a helpful tool to show the progress of a quality improvement team; it will also stimulate other to initiate or participate in Quality Improvement efforts. Be sure to use it.
76 ◆ A Modern Paradigm for Improving Healthcare Quality
ReferencesAshton, J. 2001. Monitoring the quality of hospital care.
Health Manager’s Guide. Bethesda, MD: Published for the U.S. Agency for International Development (USAID) by the Quality Assurance Project.
Batalden, P., and P. Gillem. 1989. Hospital-wide quality improvement storytelling. Quality Resource Group. Nashville,TN: Hospital Corporation of American.
Batalden, P., and P. Stoltz. 1993. A framework for the continual improvement of healthcare. Joint Commission Journal 19(10):424–52.
Berwick, D.M. 1991. Keynote address at the third European forum for quality improvement in healthcare. Organized by the British Medical Journal and the Institute for Healthcare Improvement. Vienna.
Bouchet, B. 2000. Monitoring the quality of primary care. Health Manager’s Guide. Bethesda, MD: Published for the U.S. Agency for International Development (USAID) by the Quality Assurance Project.
Donabedian,A. 1980. Explorations in Quality Assessment and Monitoring. 3 vols. Ann Arbor, MI: Health Administration Press.
Francis, D., and D. Young. 1992. Improving Work Groups: A Practical Manual for Team Building. San Diego, CA: Pfeiffer & Company.
Gardner and Altman. 1986. Confidence intervals rather than P values: Estimation rather than hypothesis testing. British Medical Journal 292:746–50.
Gustafson, D., J. Taylor, S. Thompson, and P. Chesney. 1993. Assessing the needs of breast cancer patients and their families. Quality Management in Healthcare 2(1):6–17.
IHI (Institute for Healthcare Improvement). 1995. Methods and tools of quality improvement: Putting theory into action. Training materials. Boston, MA: IHI.
Kelly, E., J. Ashton, and T. Bornstein. 2000. Applying benchmarking in health. Project Report. Bethesda, MD: Published for the United States Agency for International Development (USAID) by the Quality Assurance Project.
Knebel, E., E. Kelley, and J. Kolodner. 2001. Quality Assurance Theory and Tools Kit (CD-ROM). Bethesda, MD: Published for the United States Agency for International Development (USAID) by the Quality Assurance Project.
Langley, G.L., K.M. Nolan,T.W. Nolan, C.L. Norman, and L.P. Provost. 1996. The Improvement Guide: A Practical Approach to Enhancing Organizational Performance. Jossey-Bass Publishers: San Francisco.
Massoud, R., and A.V. Korotkova. 2000. Руководство по управлению качеством. The USA-Russia Joint Commission on Economic and Technolgical Cooperation “Access to Quality Health Care” Priority Area. Bethesda, MD: Published for the United States Agency for International Development (USAID) by the Quality Assurance Project.
Massoud, R.,A. Korotkova, and V. Melnikov. 2001. Improving the System of Care for Patients Suffering from Arterial Hypertension. The USA-Russia Joint Commission on Economic and Technological Cooperation; The Health Committee “Access to Quality Health Care” Priority Area. Bethesda, MD: Published for the U.S.Agency for International Development (USAID) by the Quality Assurance Project.
Massoud, R., and K. Kuznetsova. 1998. Обеспечение качества учебное руководство. Bethesda, MD: Published for the United States Agency for International Development (USAID) by the Quality Assurance Project.
Miller Franco, L., J. Newman, G. Murphy, and E. Mariani. 1997. Achieving Quality through Problem-Solving and Process Improvement (Second Edition). Quality Assurance Methodology Refinement Series. Bethesda, MD: Published for the U.S. Agency for International Development (USAID) by the Quality Assurance Project.
NHS (National Health Services) Centre for Reviews and Dissemination (CRD). 1996. Undertaking systematic reviews of research on effectiveness: CRD guidelines for those carrying-out or commissioning reviews. CRD Report (4). York. U.K.: University of York.
Plesk, P. 1991. Principles of quality improvement. National Demonstration Project on Quality Improvement in Healthcare. Reprinted in Improving Healthcare Quality: A Comprehensive Curriculum for Healthcare Executives, Managers and Clinician Leaders. Boston, MA: Institute for Healthcare Improvement.
Plesk, P. 1997. Creativity, innovation and quality. Milwaukee,WI: ASQ Quality Press.
A Modern Paradigm for Improving Healthcare Quality ◆ 77
Population Information Program. 1998. Family planning programs: Improving quality. Population Reports, Series J, No. 47. Baltimore, MD: Center for Communication Programs,The Johns Hopkins University School of Hygiene and Public Health.
Quality Assurance Project. 1999. Improving the system of care for patients suffering from arterial hypertension in the Tula Oblast, Russian Federation. Bethesda, MD: Published for the United States Agency for International Development (USAID) by the Quality Assurance Project.
Quality Assurance Project. 1999. Malaria case study. Problem solving training materials used in Kenya. Bethesda, MD: Published for the United States Agency for International Development (USAID) by the Quality Assurance Project.
Quality Improvement Project. 1996. Ministry of Health of Palestine.
Reinke, J. 1998. Quality Improvement Activities. Managed Care Quality: A Practical Guide. Boca Raton: CRC Press LLC: 117–58.
Sackett, D.L.,W. Rosenberg, J.A. Gray, R.B. Haynes, and W.S. Richardson. 1996. Evidence-based medicine:What it is and what it isn’t. British Medical Journal 312:71–72.
Shewhart,W. 1931. The Economic Control of Quality of Manufactured Products. D. Van Nostrand Co: New York. Reprinted by the American Society of Quality Control in 1980.
78 ◆ A Modern Paradigm for Improving Healthcare Quality