Embed Size (px)
Citation preview
A MODELING INVESTIGATION OF OBESITY AND BALANCE
RECOVERY
SARA LOUISE MATRANGOLA
Thesis submitted to the Faculty of the
Virginia Polytechnic Institute and State University
In partial fulfillment of the requirements for the degree of
Master of Science
In
Biomedical Engineering
Michael L. Madigan, Ph.D., Chair
Maury A. Nussbaum, Ph.D.
Kevin P. Davy, Ph.D.
July 15, 2008
Blacksburg, Virginia
Keywords: obesity, balance recovery, modeling
A MODELING INVESTIGATION OF OBESITY AND BALANCE
RECOVERY
Sara Louise Matrangola
(ABSTRACT)
Obesity is associated with an increased risk of falls and subsequent injury. Previous studies have
shown weight loss and strength training to be beneficial to balance, but knowing which is more
beneficial will allow researchers to design interventions to maximize the benefits in terms of
balance and reducing risk of falls. Therefore, the purpose of the first study was to evaluate the
effects of weight loss and strength training on balance recovery using a combination of
laboratory experiments and mathematical modeling. Nine male subjects with BMI 30.1 to 36.9
kg/m2 were released from a forward lean and attempted to recover balance using an ankle
strategy. Lean angle was increased until subjects required a step or hip flexion to recover
balance. The maximum lean angle, θmax, was used as the measure of balance recovery capability.
Experimental data were used as inputs to an inverted pendulum model of balance recovery.
Multiple simulations were used to determine the effects of strength (maximum ankle torque and
ankle torque generation rate) and weight loss on θmax. Changes in weight and strength were
linearly related to changes in θmax. A 6.6 ± 0.4% decrease in weight or 6.9 ± 0.9% increase in
strength were estimated as required to improve (increase) θmax by 1 degree. Based on these
results, balance recovery using an ankle strategy can improve with either reductions in weight or
increases in strength. In addition, weight loss may be a more effective intervention than strength
gain at improving balance recovery capability. The purpose of the second study was to quantify
changes in body segment inertial parameters (BSIPs) with weight loss. These data were needed
to alter BSIPs in the first study to mimic changes with weight loss. Both before and after weight
loss, magnetic resonance imaging scans were acquired along the length of the body and were
used to calculate segment masses, COM positions, and radii of gyration. A number of significant
changes in BSIPs occurred with weight loss.
iii
ACKNOWLEDGMENTS
I would like to acknowledge my advisor, Dr. Madigan. You set such an extraordinary example for all of us and we cannot thank you enough. Your endless guidance and support have been pivotal for my academic and personal development. I would also like to dedicate this thesis in memory of Dr. Kevin P. Granata, who was tragically killed on April 16th, 2007. Your passion for research and life will always be remembered. I am honored to have known you. To my fellow lab mates: I could not have done it without you! Michael Whitley: Your hilarious jokes and commentaries got me through the undergraduate and graduate years. Brad Davidson, Jul Davis, and Dennis Anderson: Thank you for your always sunny disposition, cockroach pranks, and infinite knowledge about anything and everything. Katie Bieryla and Emily Miller: Thank you for the random distractions, making me take breaks to run or play sports, answering my endless questions, and putting up with me in general. To my undergraduate helpers, Scott Kramer and Melina Ciccarone: I would still be clicking away at MRI images if it weren’t for you. Thank you for all your help with collecting and processing data. Last, but certainly not least, I would like to thank my family. To Jay: Thank you for being patient with my stress and panic attacks, for bringing distractions whenever possible, and always believing in me. I love you, honey. To my parents and my sister Jessica: Thank you most of all. I could not have attained my accomplishments without your patience and support through all these years. I am making my dreams come true because of you. There are not enough words to describe all you have done for me. I love you. All images are property of the author, Sara L. Matrangola, unless otherwise noted.
iv
TABLE OF CONTENTS Abstract ii
Acknowledgements iii Table of Contents iv List of Figures v List of Tables vi
CHAPTER 1- INTRODUCTION 1
Overweight and Obesity: A Global Health Concern 1
Obesity, Falls, and the Musculoskeletal System 1
Effects of Obesity on Balance and Balance Recovery 4
Interventions to Improve Balance in the Obese 7
Inverted Pendulum Models of Balance Recovery 8
Summary and Purpose 11
References 13
CHAPTER 2- A MODELING INVESTIGATION OF OBESITY AND BALANCE RECOVERY 18
Introduction 18
Methods 19
Results 23
Discussion 25
References 28
CHAPTER 3-A PRELIMINARY STUDY OF CHANGES IN BODY SEGMENT INERTIAL
PARAMETERS OF OBESE INDIVIDUALS WITH WEIGHT LOSS 30
Introduction 30
Methods 31
Results 34
Discussion 35
Acknowledgements 36
References 37
v
LIST OF FIGURES
CHAPTER 1
Figure 1a. Anterior-posterior sway of a human subject during quiet standing. 8
Figure 1b. Inverted pendulum model 8
Figure 2. van den Bogert et al. (2002) inverted pendulum model of a tripping event
10
CHAPTER 2
Figure 1. Balance recovery experiment. 20
Figure 2. Inverted pendulum model of balance recovery. 21
Figure 3. Experimental values and linear approximation (Ta) of ankle torque history during recovery.
22
Figure 4. Initial ankle torque measured from subjects prior to release increased as lean angle increased.
22
Figure 5. Balance recovery model predicted values versus measured values of θmax
23
Figure 6. Contour plot balance recovery illustrating the effects of strength and weight on balance.
24
Figure 7. Average changes in weight and ankle torque parameters to improve θmax.
25
vi
LIST OF TABLES
CHAPTER 3
Table 1. Segment Origin Definitions 32
Table 2. Percent Changes in Body Segment Inertial Parameters 35
Table 3. Effect Sizes and p-Values for Changes in Body Segment Inertial Parameters
35
1
CHAPTER 1- INTRODUCTION
OVERWEIGHT AND OBESITY: A GLOBAL HEALTH CONCERN
Obesity is a major health concern in the United States and numerous countries across the world
[1]. Over 1 billion people worldwide are considered overweight and of those, 300 million are
considered obese [2]. In the United States and the United Kingdom, nearly two-thirds of adults
are considered overweight or obese [3, 4]. The high prevalence of obesity is continually
increasing. In the US between 1980 and 2002, obesity prevalence doubled among adults and
overweight prevalence tripled among children [5]. More recently, the prevalence of obesity
among US adult men increased from 27.5% in 1999 to 31.1% in 2004 [5].
Obesity is highly associated with numerous health conditions. For example, obesity is highly
associated with hypertension, type 2 diabetes mellitus, cardiovascular disease, osteoarthritis
(OA), and respiratory disease [1, 6]. In addition, the obese tend to have higher levels of
functional limitation than the non-obese [7]. Overall, approximately 6%, or $92 billion, of total
annual medical expenditures in the United States can be attributed to obesity [8].
OBESITY, FALLS, AND THE MUSCULOSKELETAL SYSTEM
In addition to its association with numerous health concerns, obesity is also associated with an
increased risk of falls. Fjeldstad et al. [9] reported obese subjects to have a higher prevalence of
falls (27% vs 15%) and ambulatory stumbling (32% vs 14%), or a loss of balance that was
restored without falling, than their non-obese counterparts. Additionally, the overweight and
obese are more likely to experience falls on the same level and falls to a lower level [10] as well
as multiple falls [11]. Falls by themselves are not problematic, but an increased risk of falls
increases the risk for injury. Falls were identified as the most common cause of injuries in the
obese (~36% of all injuries) and the cause of a higher proportion of injury-related hospitalization
in the obese compared to the non-obese [12]. Similarly, Finkelstein et al. [13] found the
overweight and obese to have greater odds of sustaining a medically treated injury and even
more likely to sustain a fall injury than the non-obese. Approximately 6% of falls result in a
major injury such as fracture or dislocation [14]. As such, fractures have been reported to be the
2
most common injury among the obese and obesity also increases the likeliness of sustaining a
sprain/strain or dislocation [12].
Although the mechanism by which obesity contributes to falls has not been determined, the
increased risk of falls in the obese is most likely caused by the negative impact of obesity on
musculoskeletal function. Obesity has been highly associated with impaired musculoskeletal
function, particularly in the lower limbs [15]. It is thought that excess weight increases the stress
within the bones, joints, and soft tissues, resulting in impaired musculoskeletal function such as
abnormal mechanics [16, 17] and posture [18, 19]. These impairments, such as impaired
balance, gait, strength, sensory function, and neuromuscular function, have been identified as
strong risk factors for falls [20].
Obesity causes alterations in gait that are associated with an increased risk of falls. Several
studies have found preferred walking speed, step length, and step frequency to be significantly
lower in the obese compared to the non-obese [21-23]. Additionally, the obese have a longer
stance phase [21, 22] and greater period of double support [22]. Reduced walking speed,
cadence, and step length as well as increased stance duration have been identified as strong risk
factors for falls [20]. Spyropoulos et al. [22] have suggested that obesity requires an individual
to walk slowly, take smaller strides, and remain in double support longer in order to maintain
balance. Deviations from the obese gait pattern would result in instability and loss of balance.
Spyropoulos et al. [22] also found the obese to have a larger step width during walking, which
provides a wider base of support for balance. DeVita and Hortobagyi [21] found that obese
adults tend to have a more erect posture while walking at a standard speed, compared to non-
obese adults, as a result of reduced knee and hip flexion. It is possible this posture provides
stability in the obese by counteracting an anterior displacement of the center of mass (COM)
from the longitudinal axis of the body associated with obesity, reducing the amount of corrective
torque needed to maintain balance.
The obese have also been shown to have impaired muscle strength, a strongly rated risk factor
for falls [20]. More specifically, knee and ankle weakness have been identified as factors in poor
balance and indicate a greater risk of falls [24, 25]. Although obese adults can generate higher
3
absolute strength and power with the lower extremity, strength and power are significantly lower
in obese adults when normalized to body weight. For example, Lafortuna et al. [26] investigated
the effects of obesity on strength and power of the lower limbs muscles involved with anti-
gravitational movements (quadriceps, gluteus, gastrocnemius, and soleus). Absolute lower limb
strength was significantly higher in the obese subjects. However, during the push phase of a
jump, the obese subjects had similar absolute lower limb power output and decreased lower limb
output per unit body weight compared to the non-obese subjects. Other studies have also shown
absolute knee strength to be higher and knee strength per body weight to be lower in the obese
compared to the non-obese [27, 28]. These findings imply that although a greater absolute force
is used by the obese to perform daily activities, their musculoskeletal system is impaired because
they cannot produce equivalent force per weight compared to the non-obese. As such, when the
obese are perturbed from a stable posture, they are unable to generate adequate force to recover
from the perturbation and are likely to fall.
Increased weight bearing forces with obesity have also been shown to impair foot structure and
function [29, 30], causing impaired balance and potentially increased risk of falls. In particular,
plantar heel pain, characterized by a pain involving the insertion of the plantar fascia into the
calcaneus, is five times more likely to develop in the obese than the non-obese [31]. Pain in the
feet has been shown to increase postural oscillations, indicating an unstable posture and a
decrease in balance [32]. Studies have considered the effects of obesity on foot structure to be a
pathological source for heel pain. For example, contact area has been found to be significantly
higher in the obese [33, 34], suggesting that obesity may inflict structural dysfunction such as a
collapse of the longitudinal arch of the foot. However, Messier and Pittala found that arch
structure was not able to discriminate between subjects with and without heel pain [35]. These
conflicting reports indicate that obesity influences other factors in the development of heel pain.
For instance, Ozdemir et al. [36] found obesity to be associated with a thinner heel fat pad,
indicating higher susceptibility to heel pain and higher potential for falls. In contrast, Nass et al.
[37] found that heel pad thickness increased as a function of BMI. It is also possible that
increases in foot pressure alter balance in the obese. Foot mechanoreceptors and cutaneous
sensation are contributors to balance control [38, 39]. Therefore, greater pressure and contact
area may lead to reduced sensitivity of the foot mechanoreceptors and, consequently, impaired
4
balance. Nass et al. [37] found plantar peak pressures to be significantly higher at the heel for
the overweight group. Hennig et al. [40] found static plantar pressures to be minimally
dependent on body weight in 111 non-obese adults, but concluded that changes in foot structure
to increase foot dimensions allowed a redistribution of plantar loads from areas of high pressure
to areas of low pressure. It was hypothesized that the obese will have higher plantar pressures
under select portions of the foot when compared to the non-obese. As such, the mid foot and
fore foot plantar pressures were found to be significantly higher with obesity [34, 41, 42] and
were reduced with weight loss [43]. Though the exact mechanism remains unclear, a
combination of reduced sensitivity and heel pain may compound to impair balance and increase
the risk of falls in the obese.
EFFECTS OF OBESITY ON BALANCE AND BALANCE RECOVERY
Epidemiological evidence linking obesity with an increased risk of falls suggests that obesity
negatively effects balance. In fact, numerous studies have investigated the effects of obesity on
postural sway during quiet standing.
Several studies have investigated the effects of obesity on balance in young populations [19, 44-
46]. Goulding et al. [45] used several clinical balance tests, including the Bruininks-Oseretsky
test, to observe static and dynamic balance in overweight and lean boys of age 10 to 21 years.
The Bruininks-Oseretsky test of balance consisted of three static balance tasks (standing on one
leg on the floor, standing on one leg on balance beam with and without eyes open) and five
dynamic balance tests (walking on a line and balance beam, walking heel-to-toe on a line and
balance beam, and stepping over a stick on the balance beam). Their results showed lower
Bruininks-Oseretsky test scores in overweight boys. Balance can also be quantified using the
center of pressure (COP) and can be defined as the neuromuscular response to the imbalances of
the body’s COM [47]. McGraw et al. [46] observed obese and non-obese boys of age 8 to 10
years during quiet standing with a normal (heels together) and tandum (dominant foot forward,
heel-to-toe) stance and several visual conditions (full vision, dark, and visual conflict). Obese
boys had greater maximum COP displacement, root mean square COP, and sway areas than non-
obese boys in the anterior-posterior and medial-lateral direction. These results suggest that obese
children have poorer balance than non-obese children, particularly in the medial-lateral direction.
5
In contrast, Bernard et al. [19] found obese adolescents of age 13 to 17 to have a greater COP
path length during quiet standing only when standing on a foam surface, a more challenging
balance task than standing on a hard surface. Similarly, Colne et al.[44] found no differences in
COP displacement in the anterior-posterior direction between obese and non-obese adolescents
(average age of 17 years) while standing on a hard surface. Balance was also assessed during a
forward leaning posture in which subjects were to rotate forward about the ankles as far as
possible without lifting the heels or toes from the ground. During a forward lean, obese
adolescents had decreased COP displacements and similar sway areas compared to non-obese
adolescents. These findings suggest that more challenging balance tasks are needed to observe
differences in balance during quiet standing between obese and non-obese adolescents.
However, measurements during a sustained forward lean were taken at each subject’s maximum
lean angle and these angles were not reported. It is possible that the smaller COP displacements
in obese adolescents compared to lean adolescents could be due to a smaller maximum lean
angle in the obese.
The effect of obesity on postural sway has also been investigated in adults. Some studies have
found an association of adult obesity and postural sway parameters such as mean COP peak, the
time instants in which the COP is relatively stable, and mean COP distance, the distance between
the peaks. For example, Hue et al. [48] found that as mass increased, mean COP distance
increased, corresponding to an increase in the distance between stable regions, and mean COP
peak decreased, corresponding to an increase in time spent in a stable region. Additionally,
mean COP speed increased as mass increased. These results suggest that an increase in body
weight causes an individual to be less sensitive in the regulation of body sway oscillations.
Other studies have reported similar results of increased mean COP speed with obesity [49, 50],
also indicating that the obese have decreased stability and increased risk of falling. In contrast to
younger populations, several studies have shown that obesity does not affect the anterior-
posterior displacement of the COP in adults [34, 51]. It is possible that obesity will affect
selection of motor strategies for balance [46, 52]. For example, obese individuals may lean
backwards to compensate for an anterior displacement of COM. It is also possible that falling in
obese subjects may be more related to dynamic measures of balance and require more
demanding balance recovery tasks to ascertain differences between the obese and non-obese.
6
Only a small number of studies have investigated the effects of obesity on balance recovery after
a postural perturbation. Miller et al. [53] investigated the effects of obesity on balance in
response to small postural perturbations. A ballistic pendulum was used to apply small
anteriorly-directed perturbations just inferior to the scapula. These perturbations were small
enough so that no step was required to maintain balance. Contrary to expectations, obese
subjects exhibited reduced peak COP displacement and velocity, suggesting that the obese
subjects had better balance than the non-obese subjects. However, when responses were
compared between groups at perturbations normalized to body weight, there were no differences
in sway parameters between the obese and non-obese subjects. Other studies have investigated
balance recovery using non-obese subjects wearing external weight to simulate obesity. Li and
Aruin [54] conducted a perturbation study in which subjects stood with their arms extended
forward and a 5-lb load place 10 cm above the subjects’ hands. Subjects were required to catch
the load while wearing external weight to simulate obesity. This study found that as mass
increased, COP displacement increased. Similarly, Ledin and Odkvist [55] applied perturbations
to non-obese subjects with external weight. Randomized perturbed posturography, or a
randomly moving support surface, was used to apply three levels of perturbations in the anterior-
posterior direction: no platform translation, low amplitude translation (2cm peak to peak, RMS
amplitude 1.3cm), and high amplitude translation (4cm peak to peak, RMS amplitude 2.6cm).
This study found that sway area increased with increased mass. However, it is possible that
adaptations occur if the increased mass was worn day to day as in the obese. Experiments using
non-obese subjects with external weight may not account for such adaptations. Berrigan et al.
[56] examined the effect of a goal-oriented movement on postural stability in obese and non-
obese subjects. Subjects, in a standing posture, were to point to a target as fast and as precisely
as possible after an auditory signal. This rapid acceleration of the arm can be considered a small
postural perturbation due to the momentum the movement exerts on the body. Obese subjects
were found to have greater COP speed and displacement than their non-obese counterparts.
During this study, the obese subjects moved their whole body forward while aiming at the target,
as can be seen in a greater COP displacement. The authors suggested that by moving their COM
closer to the target, the obese subjects were better positioned for correcting hand movements.
7
However, a forward displacement of the COM can result in an unstable posture due to a larger
corrective torque needed to maintain balance.
INTERVENTIONS TO IMPROVE BALANCE IN THE OBESE
Differences in postural sway between obese and non-obese individuals suggest that balance may
improve with weight loss. Teasdale et al. [50] imposed a hypocaloric diet and bariatric surgery
on obese and morbidly obese subjects, respectively. Mean COP speed decreased linearly with
weight-loss in both groups. Additionally, there were no differences in mean COP speed between
the non-obese, obese, and morbidly obese after weight loss. Decreases in COP displacement in
the anterior-posterior and medial-lateral directions were also seen with weight loss. These
results indicate that balance improves with weight loss, and that improvement is linearly related
to the magnitude of weight loss. Maffiuletti et al. [57] also investigated the effects of weight loss
on balance during single limb stance. Morbidly obese subjects participated in a body weight
reduction (BWR) program that included an energy-restricted diet, moderate exercise, and
nutritional education. A portion of the morbidly obese subjects also received balance training in
addition to the BWR program. Balance training consisted of repeated exposures to the balance
task, i.e. single limb stance. It was found that trunk sway decreased and time of balance
maintenance increased with weight-loss. However, these changes were found only with the
combination of BWR and balance training. These studies suggest that weight loss interventions
improve balance, but a combination of weight loss and balance training provides an even greater
improvement.
Balance recovery after a postural perturbation has been shown to improve with increased
strength [58, 59] and strength training has been commonly used as a fall-prevention intervention
[60]. Lower extremity strength, specifically at the ankle and knee, can make a significant
contribution to balance recovery [25]. However, lower limb function in the obese is impaired
and not sufficient for balance recovery due to reduced lower limb strength and power per body
weight compared to the non-obese. Therefore, improving lower limb strength should allow
adequate force production to recover balance from a perturbation and reduce risk of falls.
Although strength training has been encouraged as a fall prevention intervention in the obese
[61], no studies have investigated the effects of strength training on balance recovery in the
obese.
INVERTED PENDULUM MODELS OF
Mathematical modeling of a balance recovery task allows researchers to investigate multiple
variables associated with the task that could o
human subjects. Depending on the balance recovery task the
many different ways. An inverted pendulum model can be used if the body segments remain
closely aligned and movement occu
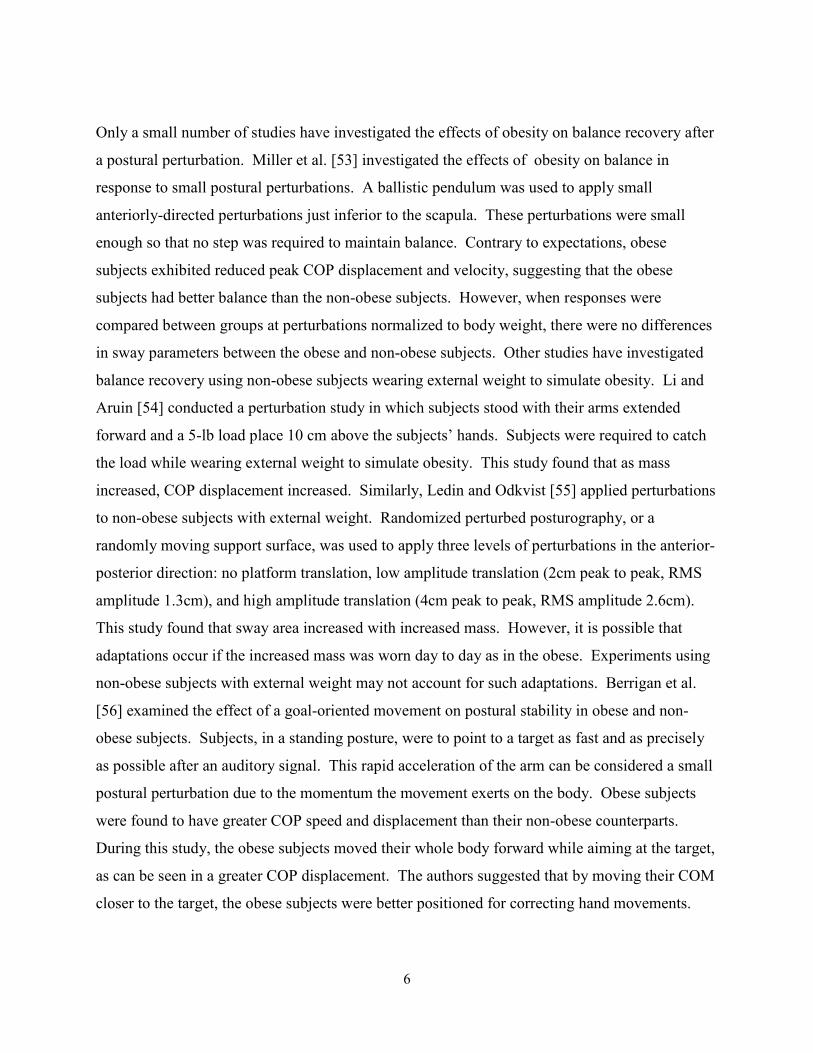
during quiet standing has been modeled as an inverted pendulum (Figure 1).
(a)
Figure 1a. Anterior-posterior sway of a hsubject during quiet standing.
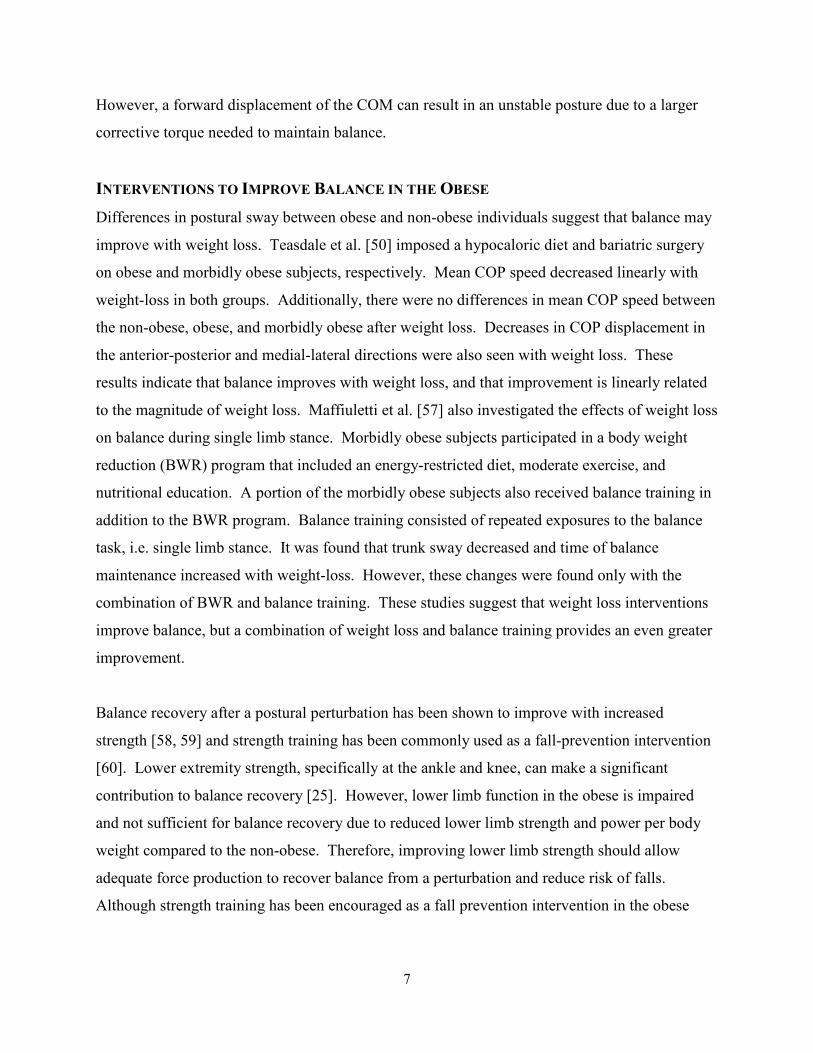
The equation of motion for the inverted pendulum is thus:
where I is the moment of inertia of the rod about the pivot point,
upright position to the centerline of the rod,
and mass of the subject, respectively. Consider a slightly more challenging task such as balance
recovery from a forward lean. One can restrict the subject to recover balance by only contracting
8
d the effects of strength training on balance recovery in the
ODELS OF BALANCE RECOVERY
Mathematical modeling of a balance recovery task allows researchers to investigate multiple
variables associated with the task that could otherwise not be manipulated independently in
human subjects. Depending on the balance recovery task the human body can be modeled in
. An inverted pendulum model can be used if the body segments remain
closely aligned and movement occurs mostly at the ankle. For example, anterior
during quiet standing has been modeled as an inverted pendulum (Figure 1).
(b)
posterior sway of a human Figure 1b. Inverted pendulum model
The equation of motion for the inverted pendulum is thus:
is the moment of inertia of the rod about the pivot point, θ is the angle measured from
upright position to the centerline of the rod, g is the gravity constant, and L and m
and mass of the subject, respectively. Consider a slightly more challenging task such as balance
. One can restrict the subject to recover balance by only contracting
d the effects of strength training on balance recovery in the
Mathematical modeling of a balance recovery task allows researchers to investigate multiple
therwise not be manipulated independently in
can be modeled in
. An inverted pendulum model can be used if the body segments remain
rs mostly at the ankle. For example, anterior-posterior sway
endulum model.
(1)
is the angle measured from
m are the height
and mass of the subject, respectively. Consider a slightly more challenging task such as balance
. One can restrict the subject to recover balance by only contracting
9
the muscles spanning the ankle, a technique called the “ankle strategy.” For such a task, a torque
applied about the pivot, or in this case, the ankle, can account for the muscle contraction across
the ankle. The inverted pendulum equation of motion then becomes:
������ � ��� �������� ������� (2)
where Ta is the torque generated about the ankle.
Inverted pendulum models have been used in previous balance recovery studies but there has
only been one study, to our knowledge, that utilized an inverted pendulum model to investigate
the effects of obesity on balance [58]. However, models used to investigate balance recovery in
other populations can provide valuable information to model development, analysis, and
validation.
As an example of a balance recovery study that used an inverted pendulum model, Robinovitch
et al. [59] investigated the effects of ankle strength and ankle torque development rate on balance
recovery. During the experiment, subjects were leaned forward and instructed to hold the body
straight and recover balance by using the ankle strategy. Subjects were then modeled as an
inverted pendulum (Figure 1). A torque actuator was used to simulate the torque generated by
the ankle muscles to recover balance. A linear approximation of the time history of torque
during the experiment was used to model the torque actuator. Model validation was completed
by comparing predicted maximum lean angle, θmax, to the experimental mean. The model
predicted θmax values within one standard deviation of the experimental mean, leading the
investigators to conclude that there was generally good agreement between the experimental and
mathematical predictions. Properties of the torque history were manipulated within the model to
determine the effects of isolated and combined variations of strength, such as maximum torque,
and torque generation rate. Such properties are difficult, if not impossible, to manipulate
independently in human subjects [62]. It was found that if ankle torque remains constant or
declines at a small rate after reaching the maximum torque, θmax always increases with increasing
torque generation rate. These results imply that recovery limits depend on the capacity to
quickly generate and maintain high magnitudes of ankle torque.
10
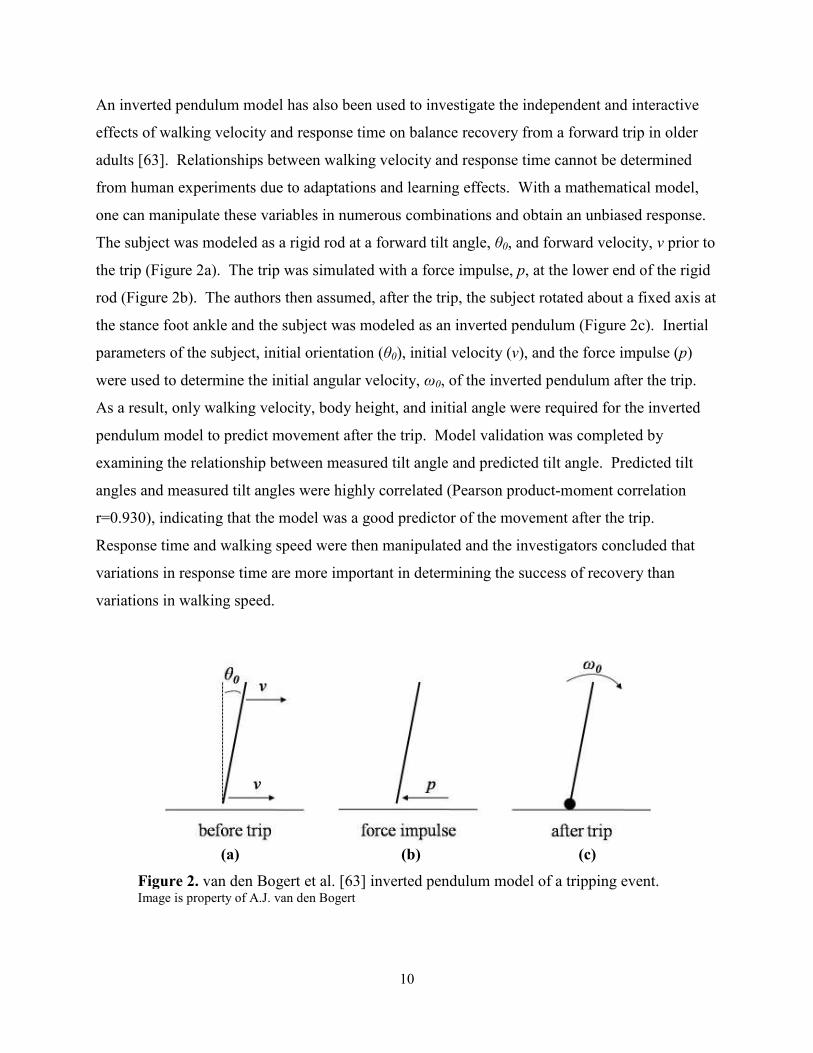
An inverted pendulum model has also been used to investigate the independent and interactive
effects of walking velocity and response time on balance recovery from a forward trip in older
adults [63]. Relationships between walking velocity and response time cannot be determined
from human experiments due to adaptations and learning effects. With a mathematical model,
one can manipulate these variables in numerous combinations and obtain an unbiased response.
The subject was modeled as a rigid rod at a forward tilt angle, θ0, and forward velocity, v prior to
the trip (Figure 2a). The trip was simulated with a force impulse, p, at the lower end of the rigid
rod (Figure 2b). The authors then assumed, after the trip, the subject rotated about a fixed axis at
the stance foot ankle and the subject was modeled as an inverted pendulum (Figure 2c). Inertial
parameters of the subject, initial orientation (θ0), initial velocity (v), and the force impulse (p)
were used to determine the initial angular velocity, ω0, of the inverted pendulum after the trip.
As a result, only walking velocity, body height, and initial angle were required for the inverted
pendulum model to predict movement after the trip. Model validation was completed by
examining the relationship between measured tilt angle and predicted tilt angle. Predicted tilt
angles and measured tilt angles were highly correlated (Pearson product-moment correlation
r=0.930), indicating that the model was a good predictor of the movement after the trip.
Response time and walking speed were then manipulated and the investigators concluded that
variations in response time are more important in determining the success of recovery than
variations in walking speed.
(a) (b) (c)
Figure 2. van den Bogert et al. [63] inverted pendulum model of a tripping event. Image is property of A.J. van den Bogert
11
Corbeil et al. [58] used an inverted pendulum model to investigate the effects of obesity on the
stabilizing torque at the ankle joints. In particular, the study examined the effects of increased
mass and an anterior displacement of the body COM on the stabilizing torque. An obese and
lean “humanoid”, or the inverted pendulum model of the subject, were developed using
Hanavan’s model [64]. Postural perturbations were simulated by imposing a sudden angular
velocity on the humanoid. To stabilize the humanoid, both passive (stiffness and viscosity of the
tissues) and active components (muscle contraction) of ankle torque were included in the model.
Three torque parameters (ankle torque onset time, time to peak torque, and peak muscular ankle
torque) were manipulated within the model. It was found that a nonlinear increase of torque was
needed to stabilize the obese humanoid when the motor response had delayed temporal
parameters. This effect was more pronounced with anterior displacements of the COM.
SUMMARY AND PURPOSE
Obesity is a growing health concern in the United States and around the world. Along with
numerous medical conditions, evidence suggests that obesity also increases the risk of falls and
subsequent injury.
Both weight loss and strength training can potentially improve balance and reduce the risk of
falls. Previous studies have suggested that obesity impairs balance during quiet standing and
balance recovery from a perturbation. Weight loss interventions can be used to improve balance
[50, 57]. It has also been implied that an increase in corrective torque, such as through strength
training, can improve balance [58, 59]. Though both appear to be beneficial, knowing which is
more beneficial will allow researchers to design interventions to maximize the benefits in terms
of balance and reducing risk of falls.
Inverted pendulum models such as those presented by Bogert et al.[63], Robinovitch et al.[59],
and Corbeil et al.[58] can be utilized to examine the effects of obesity interventions on balance
recovery. Mathematical modeling allows one to test the effects of various interventions on a
shorter time scale. Studies using human subjects to investigate the effects of weight-loss on
balance have used various programs that require several months [50, 65]. For example,
Teasdale et al. [50] imposed a caloric restriction until subjects maintained a stable body weight
12
for four consecutive weeks. Treatment duration ranged from 15 to 47 weeks. Mathematical
modeling also allows one to investigate the effects of several variables on a given task. From
these results, one can determine the most promising interventions to implement on human
subjects for a longitudinal study. Therefore, the goal of this study (Chapter 2) was to investigate
the effects of weight loss and strength training on balance recovery using an ankle strategy.
To accurately simulate a weight loss intervention, guidelines are needed to describe how body
segment inertial parameters (BSIPs) change with weight loss. To our knowledge, such
guidelines do not currently exist but are needed to realistically modify BSIPs within a
mathematical model. Therefore, the goal of the second study (Chapter 3) was to quantify
changes in BSIPs with weight loss.
13
REFERENCES
1. Obesity: Preventing and Managing the Global Epidemic, in WHO Consultation on
obesity. 1998, World Health Organization: Geneva.
2. Puska, P., C. Nishida, and D. Porter, Global Strategy on Diet, Physical Activity and
Health. 2003, World Health Organization (WHO).
3. Flegal, K.M., et al., Prevalence and trends in obesity among US adults, 1999-2000. Jama, 2002. 288(14): p. 1723-7.
4. Wannamethee, S., et al., Overweight and obesity and the burden of disease and disability
in elderly men. Int J Obes Relat Metab Disord, 2004. 28(11): p. 1374-1382.
5. Ogden, C.L., et al., Prevalence of overweight and obesity in the United States, 1999-
2004. Jama, 2006. 295(13): p. 1549-55.
6. Bray, G.A., Medical consequences of obesity. J Clin Endocrinol Metab, 2004. 89(6): p. 2583-9.
7. Wearing, S.C., et al., Musculoskeletal disorders associated with obesity: a biomechanical
perspective. Obes Rev, 2006. 7(3): p. 239-50.
8. Finkelstein, E.A., I.C. Fiebelkorn, and G. Wang, National medical spending attributable
to overweight and obesity: how much, and who's paying? Health Aff (Millwood), 2003. Suppl Web Exclusives: p. W3-219-26.
9. Fjeldstad, C., et al., The influence of obesity on falls and quality of life. Dyn Med, 2008. 7: p. 4.
10. Chau, N., et al., Relationships of job, age, and life conditions with the causes and severity
of occupational injuries in construction workers. Int Arch Occup Environ Health, 2004. 77(1): p. 60-6.
11. Wallace, C., et al., Incidence of falls, risk factors for falls, and fall-related fractures in individuals with diabetes and a prior foot ulcer. Diabetes Care, 2002. 25(11): p. 1983-6.
12. Matter, K.C., et al., A comparison of the characteristics of injuries between obese and
non-obese inpatients. Obesity (Silver Spring), 2007. 15(10): p. 2384-90.
13. Finkelstein, E.A., et al., The relationship between obesity and injuries among U.S. adults. Am J Health Promot, 2007. 21(5): p. 460-8.
14. Nevitt, M.C., S.R. Cummings, and E.S. Hudes, Risk factors for injurious falls: a prospective study. J Gerontol, 1991. 46(5): p. M164-70.
15. James, W.P., A public health approach to the problem of obesity. Int J Obes Relat Metab Disord, 1995. 19 Suppl 3: p. S37-45.
16. Wearing, S.C., et al., The biomechanics of restricted movement in adult obesity. Obes Rev, 2006. 7(1): p. 13-24.
14
17. Hills, A. and M. Wahlqvist, Exercise and Obesity, ed. S.G. Co. 1994, London.
18. Fabris de Souza, S.A., et al., Postural changes in morbidly obese patients. Obes Surg, 2005. 15(7): p. 1013-6.
19. Bernard, P.L., et al., [Influence of obesity on postural capacities of teenagers. Preliminary study]. Ann Readapt Med Phys, 2003. 46(4): p. 184-90.
20. Close, J.C., et al., What is the role of falls? Best Pract Res Clin Rheumatol, 2005. 19(6): p. 913-35.
21. DeVita, P. and T. Hortobagyi, Obesity is not associated with increased knee joint torque
and power during level walking. J Biomech, 2003. 36(9): p. 1355-62.
22. Spyropoulos, P., et al., Biomechanical gait analysis in obese men. Arch Phys Med Rehabil, 1991. 72(13): p. 1065-70.
23. Fabris de Souza, S.A., et al., Gait cinematic analysis in morbidly obese patients. Obes Surg, 2005. 15(9): p. 1238-42.
24. Takazawa, K., et al., Lower-extremity muscle forces measured by a hand-held
dynamometer and the risk of falls among day-care users in Japan: using multinomial
logistic regression analysis. Disabil Rehabil, 2003. 25(8): p. 399-404.
25. Whipple, R.H., L.I. Wolfson, and P.M. Amerman, The relationship of knee and ankle weakness to falls in nursing home residents: an isokinetic study. J Am Geriatr Soc, 1987. 35(1): p. 13-20.
26. Lafortuna, C.L., et al., Gender variations of body composition, muscle strength and
power output in morbid obesity. Int J Obes (Lond), 2005. 29(7): p. 833-41.
27. Hulens, M., et al., Study of differences in peripheral muscle strength of lean versus obese
women: an allometric approach. Int J Obes Relat Metab Disord, 2001. 25(5): p. 676-81.
28. Maffiuletti, N.A., et al., Differences in quadriceps muscle strength and fatigue between
lean and obese subjects. Eur J Appl Physiol, 2007. 101(1): p. 51-9.
29. Hills, A.P., et al., The biomechanics of adiposity--structural and functional limitations of
obesity and implications for movement. Obes Rev, 2002. 3(1): p. 35-43.
30. Prichasuk, S., The heel pad in plantar heel pain. J Bone Joint Surg Br, 1994. 76(1): p. 140-2.
31. Riddle, D.L., et al., Risk factors for Plantar fasciitis: a matched case-control study. J Bone Joint Surg Am, 2003. 85-A(5): p. 872-7.
32. Corbeil, P., J.S. Blouin, and N. Teasdale, Effects of intensity and locus of painful stimulation on postural stability. Pain, 2004. 108(1-2): p. 43-50.
33. Riddiford-Harland, D.L., J.R. Steele, and L.H. Storlien, Does obesity influence foot
structure in prepubescent children? Int J Obes Relat Metab Disord, 2000. 24(5): p.541-4.
15
34. Fabris, S.M., et al., Computerized baropodometry in obese patients. Obes Surg, 2006. 16(12): p. 1574-8.
35. Messier, S.P. and K.A. Pittala, Etiologic factors associated with selected running
injuries. Med Sci Sports Exerc, 1988. 20(5): p. 501-5.
36. Ozdemir, H., et al., Effects of changes in heel fat pad thickness and elasticity on heel pain. J Am Podiatr Med Assoc, 2004. 94(1): p. 47-52.
37. Nass, D., E. Hennig, and R. van Treek. The thickness of the heel pad loaded by body weight in obese and normal weight adults in Proceedings of the Fourth Symposium on
Footwear Biomechanics. 1999. Canada: University of Calgary: In: Hennig EM, Stephanyshin DJ (eds).
38. Kavounoudias, A., R. Roll, and J.P. Roll, Foot sole and ankle muscle inputs contribute
jointly to human erect posture regulation. J Physiol, 2001. 532(Pt 3): p. 869-78.
39. Meyer, P.F., L.I. Oddsson, and C.J. De Luca, The role of plantar cutaneous sensation in unperturbed stance. Exp Brain Res, 2004. 156(4): p. 505-12.
40. Hennig, E.M. and T.L. Milani, [The tripod support of the foot. An analysis of pressure distribution under static and dynamic loading]. Z Orthop Ihre Grenzgeb, 1993. 131(3): p. 279-84.
41. Dowling, A.M. and J. Steel. What are the effects of gender and obesity on foot structure
in children? in Fifth Symposium on Footwear Biomechanics. 2001. Zurich, Switzerland.
42. Messier, S.P., et al., Severe obesity: effects on foot mechanics during walking. Foot Ankle Int, 1994. 15(1): p. 29-34.
43. Bolte, C., et al., Pressure changes under the feet of obese adults after a weiht reduction. Archives Of Physiology And Biochemistry, 2000. 108(1): p. 70.
44. Colne, P., et al., Postural control in obese adolescents assessed by limits of stability and
gait initiation. Gait Posture, 2008.
45. Goulding, A., et al., Dynamic and static tests of balance and postural sway in boys:
effects of previous wrist bone fractures and high adiposity. Gait Posture, 2003. 17(2): p. 136-41.
46. McGraw, B., et al., Gait and postural stability in obese and nonobese prepubertal boys. Arch Phys Med Rehabil, 2000. 81(4): p. 484-9.
47. Winter, D.A., Biomechanics and motor control of human movement. 3rd ed. 2005, Hoboken, NJ: John Wiley & Sons Inc.
48. Hue, O., et al., Body weight is a strong predictor of postural stability. Gait Posture, 2007. 26(1): p. 32-8.
16
49. Chiari, L., L. Rocchi, and A. Cappello, Stabilometric parameters are affected by
anthropometry and foot placement. Clin Biomech (Bristol, Avon), 2002. 17(9-10): p. 666-77.
50. Teasdale, N., et al., Reducing weight increases postural stability in obese and morbid
obese men. Int J Obes (Lond), 2007. 31(1): p. 153-60.
51. Gravante, G., et al., Comparison of ground reaction forces between obese and control
young adults during quiet standing on a baropodometric platform. Clin Biomech (Bristol, Avon), 2003. 18(8): p. 780-2.
52. Kejonen, P., K. Kauranen, and H. Vanharanta, The relationship between anthropometric
factors and body-balancing movements in postural balance. Arch Phys Med Rehabil, 2003. 84(1): p. 17-22.
53. Miller, E.M., M.L. Madigan, and S.L. Matrangola. Effects of obesity on balance in response to small postural perturbations. in North American Congress on Biomechanics. 2008. Ann Arbor, MI.
54. Li, X. and A. Aruin, The effect of changes in body mass distribution on feed-forward
postural control: a pilot study. Conf Proc IEEE Eng Med Biol Soc, 2005. 7: p. 7444-7.
55. Ledin, T. and L.M. Odkvist, Effects of increased inertial load in dynamic and
randomized perturbed posturography. Acta Otolaryngol, 1993. 113(3): p. 249-52.
56. Berrigan, F., et al., Influence of obesity on accurate and rapid arm movement performed
from a standing posture. Int J Obes (Lond), 2006. 30(12): p. 1750-7.
57. Maffiuletti, N.A., et al., Postural instability of extremely obese individuals improves after
a body weight reduction program entailing specific balance training. J Endocrinol Invest, 2005. 28(1): p. 2-7.
58. Corbeil, P., et al., Increased risk for falling associated with obesity: mathematical
modeling of postural control. IEEE Trans Neural Syst Rehabil Eng, 2001. 9(2): p.126-36.
59. Robinovitch, S.N., et al., Effect of strength and speed of torque development on balance
recovery with the ankle strategy. J Neurophysiol, 2002. 88(2): p. 613-20.
60. Seguin, R. and M.E. Nelson, The benefits of strength training for older adults. Am J Prev Med, 2003. 25(3 Suppl 2): p. 141-9.
61. Clark, K., Balance and strength training for obese individuals. ACSM's Health and Fitness Journal, 2004. 8(1): p. 14-20.
62. Del Balso, C. and E. Cafarelli, Adaptations in the activation of human skeletal muscle
induced by short-term isometric resistance training. J Appl Physiol, 2007. 103(1): p. 402-11.
17
63. van den Bogert, A.J., M.J. Pavol, and M.D. Grabiner, Response time is more important
than walking speed for the ability of older adults to avoid a fall after a trip. J Biomech, 2002. 35(2): p. 199-205.
64. Hanavan, E.P., Jr., A Mathematical Model of the Human Body. Amrl-Tr-64-102. Amrl Tr, 1964: p. 1-149.
65. Paquette, C., et al., Weight reduction yields a more stable postural behavior in obese
men. Archives Of Physiology And Biochemistry, 2000. 108(1): p. 223.
18
CHAPTER 2 – A MODELING INVESTIGATION OF OBESITY AND
BALANCE RECOVERY
INTRODUCTION
Obesity is a major health concern in the United States and around the world [1]. Over 60% of
adult men in the US and over one billion people worldwide are considered overweight or obese
[2, 3]. Not only is the prevalence high, but it is continually increasing. Between 1980 and 2002,
the prevalence of obesity among US adults doubled [4]. One of the many concerns with this
high prevalence of obesity is its association with an increased risk of falls. Fjeldstad et al. [5]
reported obese subjects to have a higher prevalence of falls (27% vs 15%) and ambulatory
stumbling (32% vs 14%) than their non-obese counterparts. An increased risk of falls increases
the risk for injury. Falls were identified as the most common cause of injuries in the obese
(~36% of all injuries) and the cause of a higher proportion of injury-related hospitalization in the
obese compared to the non-obese [6].
Weight loss has the potential to improve balance and reduce the risk of falls in the obese. Hue et
al. [7] reported an increase in mean center of pressure (COP) speed, an index of the activity
required to maintain balance, as body weight increased. These results suggest that an increase in
body weight causes an individual to be less sensitive to body sway oscillations and require more
activity to maintain a stable posture. In an intervention study, Teasdale et al. [8] investigated the
effects of weight loss on balance in obese and morbidly obese subjects. Mean COP speed
decreased linearly with weight-loss in both groups. Additionally, there were no differences in
mean COP speed between the either group after weight loss and non-obese controls. In another
intervention study, Maffiuletti et al. [9] investigated the effects of weight loss on balance during
single limb stance. Morbidly obese subjects participated in a body weight reduction program
that included an energy-restricted diet, moderate exercise, and nutritional education. Trunk
sway, defined as the deviation of the trunk from the medial-lateral axis, decreased and time of
balance maintenance, defined as the longest period a subject could stand without help, increased
with weight-loss. These studies indicate that balance during quiet standing is influenced by
obesity and that balance can be improved with weight loss.
19
Strength training also has the potential to reduce risks of falls in the obese [10]. Lower extremity
strength, specifically at the ankle and knee, can make a significant contribution to balance
recovery [11]. Balance recovery after a postural perturbation has also been shown to improve
with increased strength [12, 13]. For example, Robinovitch et al. [13] found that recovery limits
depend on the capacity to quickly generate and maintain high magnitudes of ankle torque.
Although obese adults exhibit increased strength and power producing capability compared to
non-obese, strength and power are significantly lower in obese adults when normalized to body
weight [14-16]. As such, improving lower limb strength would increase strength relative to body
weight.
While evidence suggests both weight loss and strength training can improve balance and reduce
the risk of falls in the obese, knowing which is more beneficial will allow researchers to design
interventions to maximize the benefits in terms of balance and reducing risk of falls. Therefore,
the goal of this study was to investigate the effects of weight loss and strength training on
balance recovery using an ankle strategy. Manipulating weight loss and strength independently
in human subjects would be difficult and time-consuming. As such, we employed a combination
of experimental testing and forward dynamic simulations to achieve our goal. The selection of
balance recovery using an ankle strategy as our task of interest was guided by the desire to
investigate a dynamic task in the context of fall prevention that could be modeled relatively
easily.
METHODS
Nine male subjects aged 23.3 ± 4.5 years (mean ± standard deviation) were used in this study.
Subjects had height of 178.9 ± 6.2 cm, mass of 107.2 ± 10.0 kg, and BMI of 33.5 ± 2.3 kg/m2.
The study was approved by the Virginia Tech Institutional Review Board, and written consent
was obtained from all participants.
Experimental testing was performed to determine inputs to the mathematical model of balance
recovery using an ankle strategy. While harnessed at the waist, subjects were leaned forward
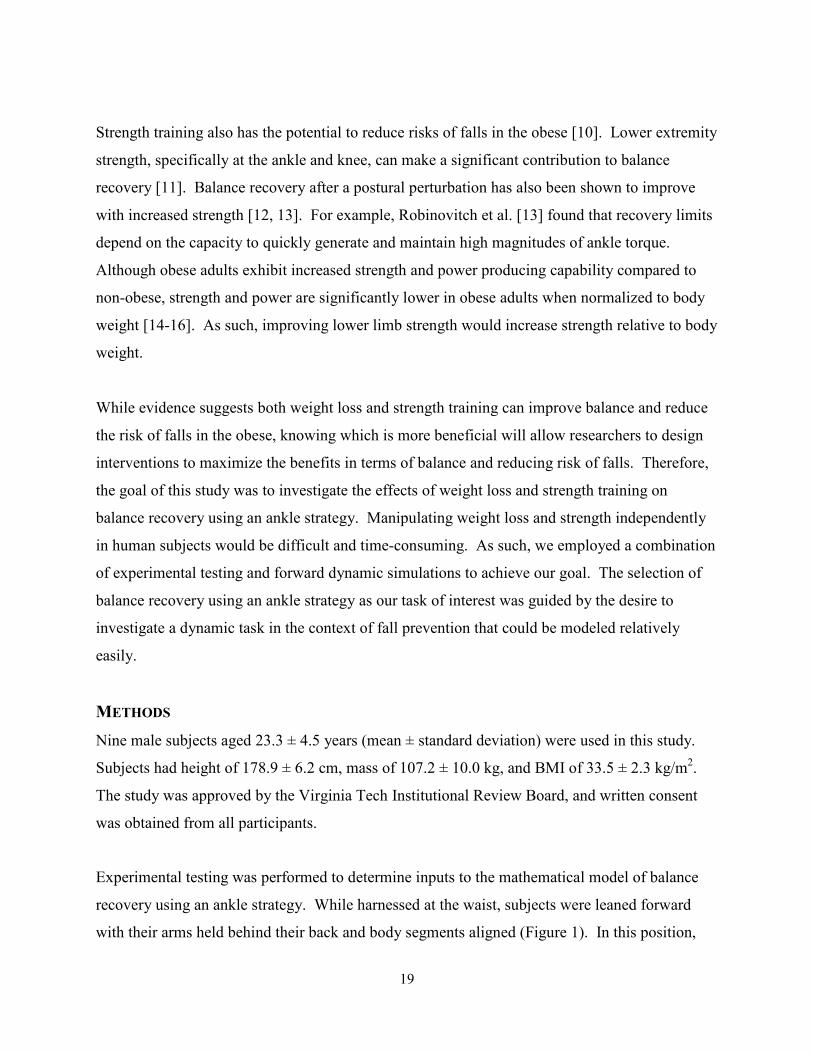
with their arms held behind their back and body segments aligned (Figure 1). In this position,
subjects were instructed to keep their ankles relaxed and
harness rope using an ankle strategy (defined as contraction of
ankle and returning to an upright posture
The body angle relative to vertical prior to release was de
release, the subjects’ heels were allowed to rise from the ground and only slight heel raise was
used during most trials. The lean angle was systematically increased
failed three times at a given angle
hip to recover balance. The maximum lean angle (
capability.
Figure 1.Photo taken by Sara L. Matrangola
Body position was sampled at 100 Hz using a
Forest, CA, USA). Data were collected from both sides of the body and averaged to determine
position in the sagittal plane. Ground reaction force
platform (Bertec Corporation, Columbus, OH). Voltage
held the harness rope was sampled at 1000 Hz and was used to determine the time of release.
Body position, ground reaction force
20
subjects were instructed to keep their ankles relaxed and recover balance upon release of
using an ankle strategy (defined as contraction of only the muscles spanning the
and returning to an upright posture while keeping the body straight and without stepping
The body angle relative to vertical prior to release was defined as the lean angle (
release, the subjects’ heels were allowed to rise from the ground and only slight heel raise was
lean angle was systematically increased by 0.5° until the subject
n angle. A failed recovery was defined as stepping or bending at the
The maximum lean angle (θmax) was used to quantify balance recovery
Figure 1. Balance recovery experiment. Photo taken by Sara L. Matrangola
Body position was sampled at 100 Hz using a Vicon 460 motion analysis system (Vicon, Lake
Forest, CA, USA). Data were collected from both sides of the body and averaged to determine
Ground reaction force was sampled at 1000 Hz using a force
platform (Bertec Corporation, Columbus, OH). Voltage applied to the electromagnetic clasp that
was sampled at 1000 Hz and was used to determine the time of release.
force, and clasp voltage data were low-pass filtered at 5, 7, and
recover balance upon release of the
spanning the
without stepping).
fined as the lean angle (θ). Upon
release, the subjects’ heels were allowed to rise from the ground and only slight heel raise was
until the subject
A failed recovery was defined as stepping or bending at the
to quantify balance recovery
m (Vicon, Lake
Forest, CA, USA). Data were collected from both sides of the body and averaged to determine
Hz using a force
applied to the electromagnetic clasp that
was sampled at 1000 Hz and was used to determine the time of release.
pass filtered at 5, 7, and
21
20 Hz, respectively (eighth order zero-phase-shift Butterworth filter). Body position data of the
lateral maleolus and greater trochanter were used to determine θmax. Additionally, body position
data of the lateral maleolus, ground reaction force data, and time of release data were used to
determine the torque generated about the ankle using an inverse dynamics analysis.
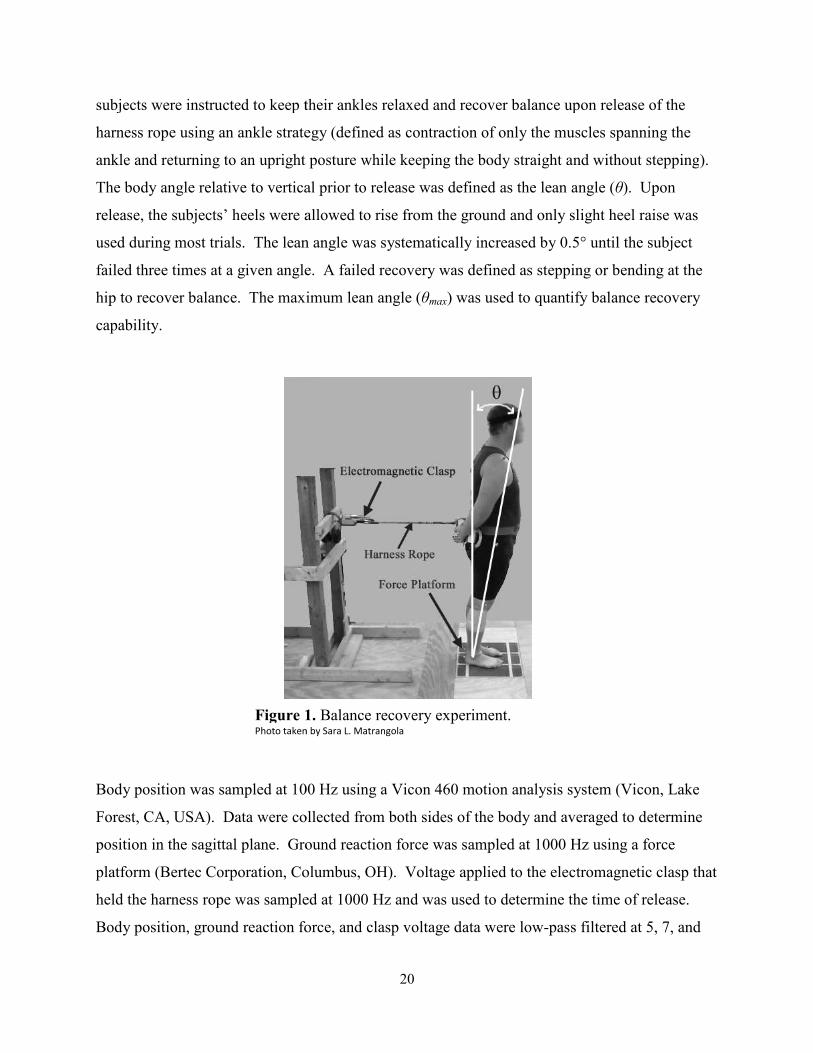
A mathematical model of the balance recovery task was used to evaluate the relative effects of
weight loss and strength training. The model included a slender rod rotating about a hinge joint
to represent the human body rotating about the ankle joint with a torque actuator at the ankle
(Figure 2). Consistent with an earlier study employing the same model [13], the center of mass
(COM) position was assumed to be located at 50% of the subject’s height from the ankles.
Figure 2. Inverted pendulum model of balance recovery where M, L, and I are the mass, height, and moment of inertia about the ankle of the subject, respectively, g is the gravitational constant (9.81 m/s2) and Ta is the torque generated about the ankle.
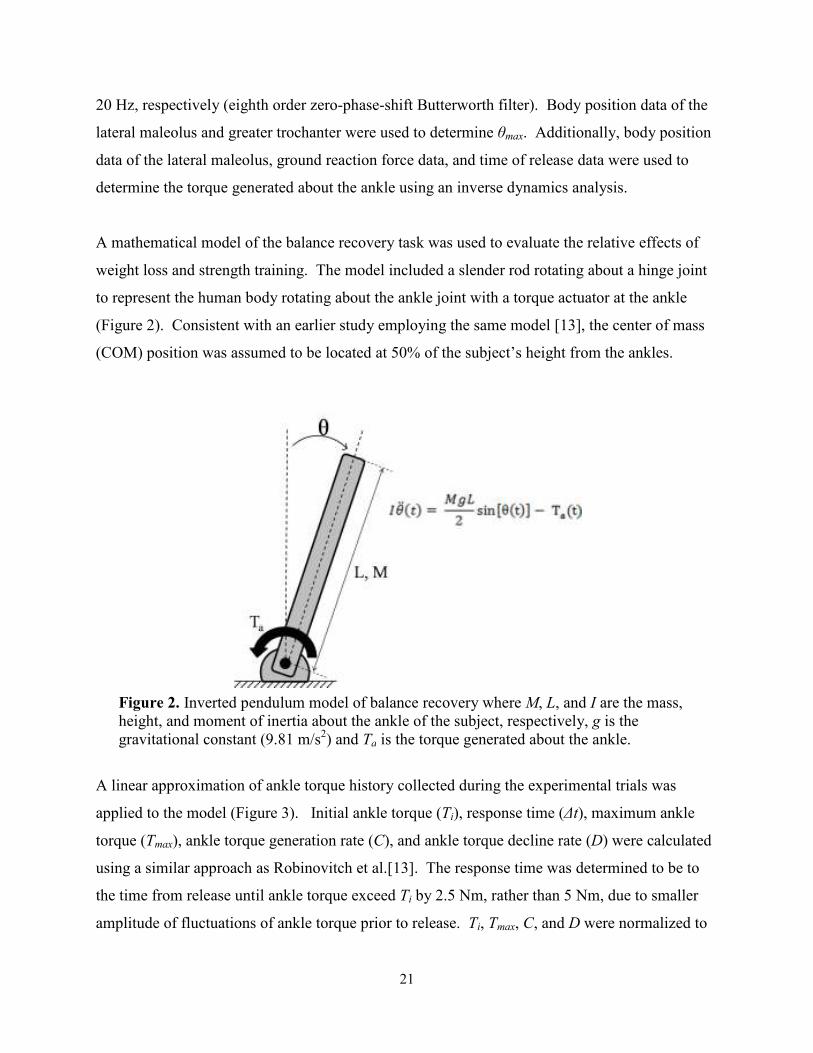
A linear approximation of ankle torque history collected during the experimental trials was
applied to the model (Figure 3). Initial ankle torque (Ti), response time (∆t), maximum ankle
torque (Tmax), ankle torque generation rate (C), and ankle torque decline rate (D) were calculated
using a similar approach as Robinovitch et al.[13]. The response time was determined to be to
the time from release until ankle torque exceed Ti by 2.5 Nm, rather than 5 Nm, due to smaller
amplitude of fluctuations of ankle torque prior to release. Ti, Tmax, C, and D were normalized to
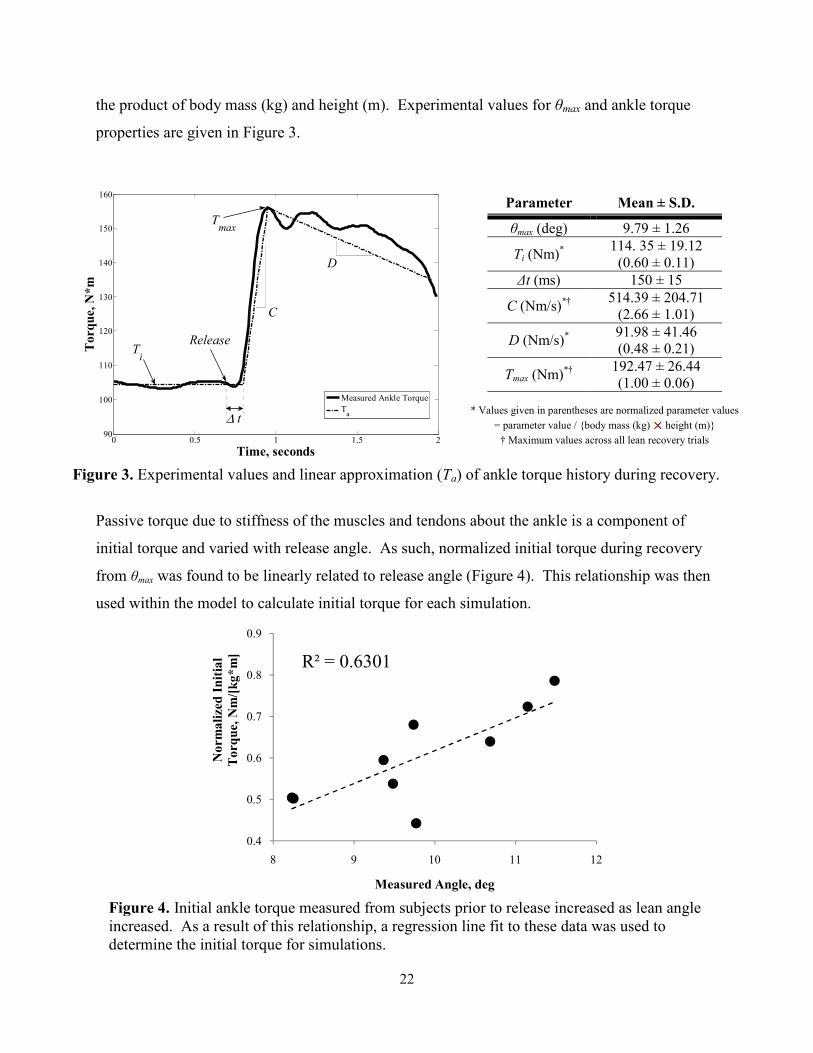
22
the product of body mass (kg) and height (m). Experimental values for θmax and ankle torque
properties are given in Figure 3.
Parameter Mean ± S.D.
θmax (deg) 9.79 ± 1.26
Ti (Nm)*
114. 35 ± 19.12 (0.60 ± 0.11)
∆t (ms) 150 ± 15
C (Nm/s)*† 514.39 ± 204.71 (2.66 ± 1.01)
D (Nm/s)* 91.98 ± 41.46 (0.48 ± 0.21)
Tmax (Nm)*†
192.47 ± 26.44 (1.00 ± 0.06)
* Values given in parentheses are normalized parameter values
= parameter value / {body mass (kg) height (m)}
† Maximum values across all lean recovery trials
Figure 3. Experimental values and linear approximation (Ta) of ankle torque history during recovery.
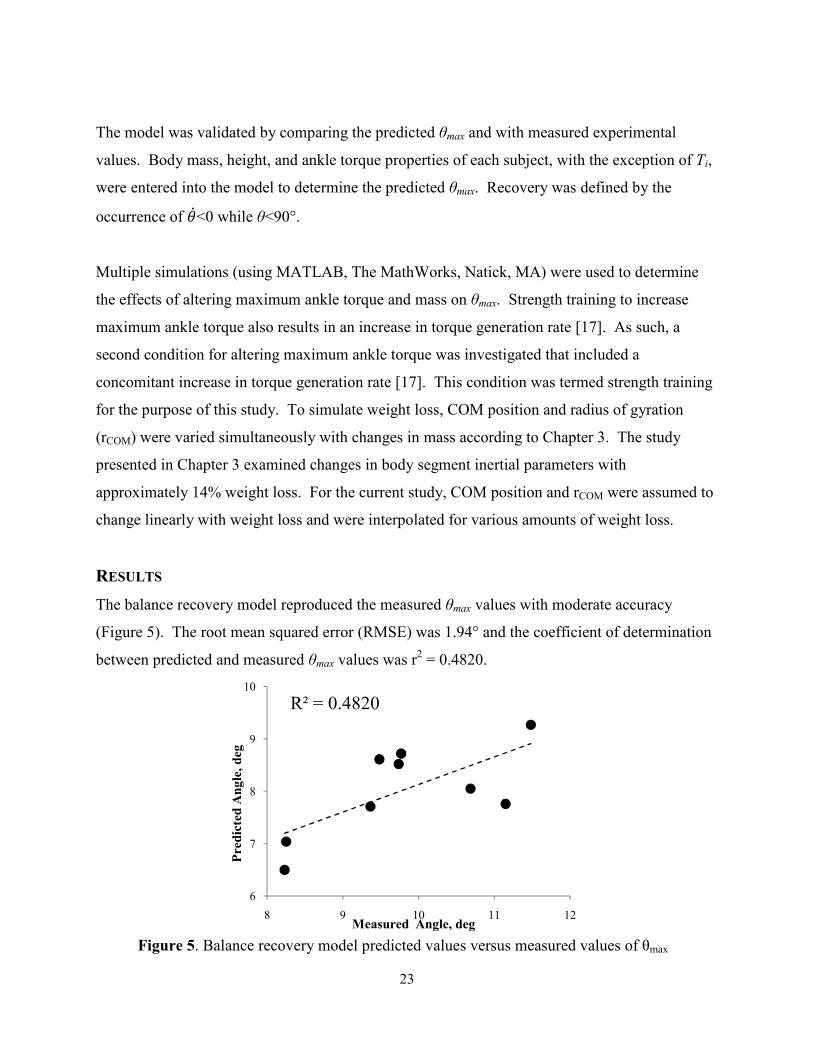
Passive torque due to stiffness of the muscles and tendons about the ankle is a component of
initial torque and varied with release angle. As such, normalized initial torque during recovery
from θmax was found to be linearly related to release angle (Figure 4). This relationship was then
used within the model to calculate initial torque for each simulation.
Figure 4. Initial ankle torque measured from subjects prior to release increased as lean angle increased. As a result of this relationship, a regression line fit to these data was used to determine the initial torque for simulations.
0 0.5 1 1.5 290
100
110
120
130
140
150
160
Torque, N*m
Time, seconds
Measured Ankle Torque
Ta
Release
∆ t
Ti
Tmax
C
D
R² = 0.6301
0.4
0.5
0.6
0.7
0.8
0.9
8 9 10 11 12
Norm
alized Initial
Torq
ue, Nm/[kg*m]
Measured Angle, deg
23
The model was validated by comparing the predicted θmax and with measured experimental
values. Body mass, height, and ankle torque properties of each subject, with the exception of Ti,
were entered into the model to determine the predicted θmax. Recovery was defined by the
occurrence of ��<0 while θ<90°.
Multiple simulations (using MATLAB, The MathWorks, Natick, MA) were used to determine
the effects of altering maximum ankle torque and mass on θmax. Strength training to increase
maximum ankle torque also results in an increase in torque generation rate [17]. As such, a
second condition for altering maximum ankle torque was investigated that included a
concomitant increase in torque generation rate [17]. This condition was termed strength training
for the purpose of this study. To simulate weight loss, COM position and radius of gyration
(rCOM) were varied simultaneously with changes in mass according to Chapter 3. The study
presented in Chapter 3 examined changes in body segment inertial parameters with
approximately 14% weight loss. For the current study, COM position and rCOM were assumed to
change linearly with weight loss and were interpolated for various amounts of weight loss.
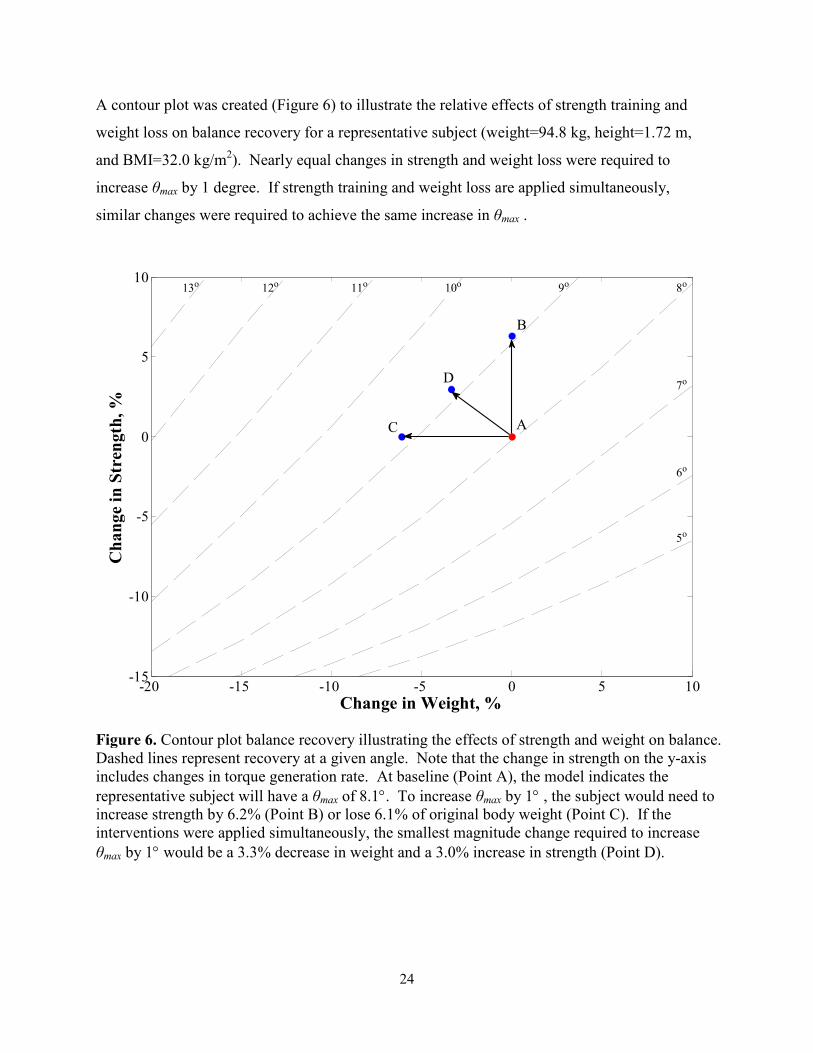
RESULTS
The balance recovery model reproduced the measured θmax values with moderate accuracy
(Figure 5). The root mean squared error (RMSE) was 1.94° and the coefficient of determination
between predicted and measured θmax values was r2 = 0.4820.
Figure 5. Balance recovery model predicted values versus measured values of θmax
R² = 0.4820
6
7
8
9
10
8 9 10 11 12
Predicted Angle, deg
Measured Angle, deg
24
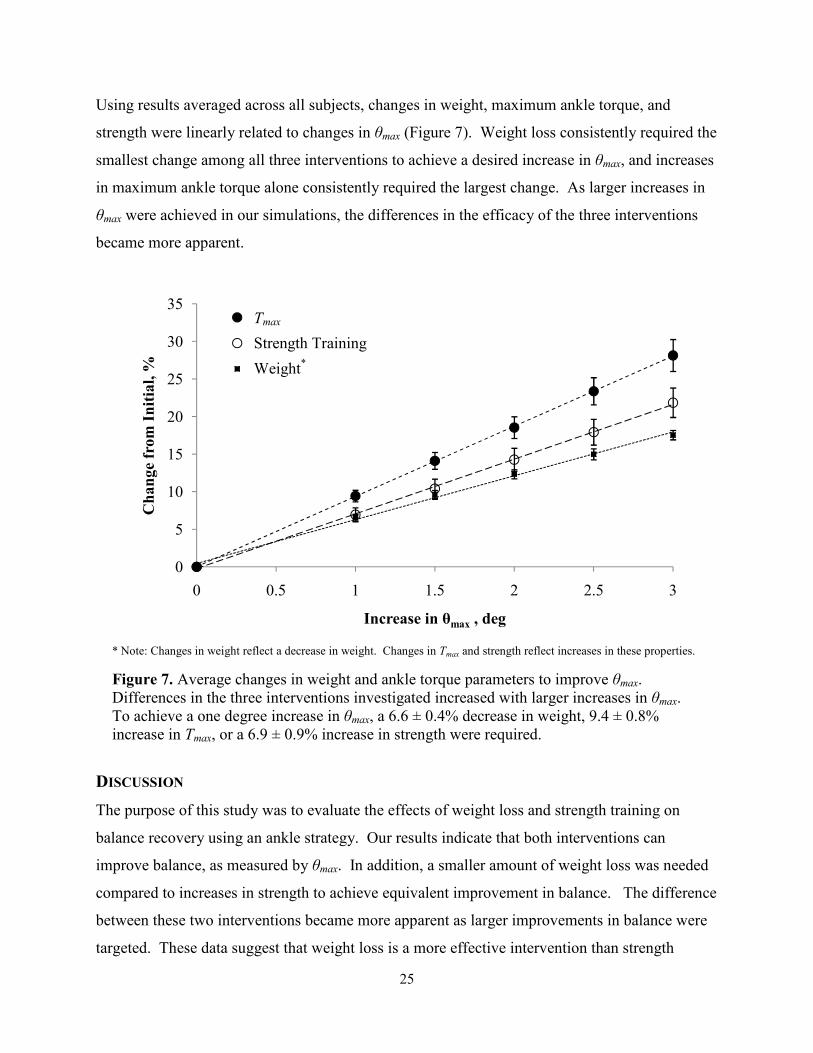
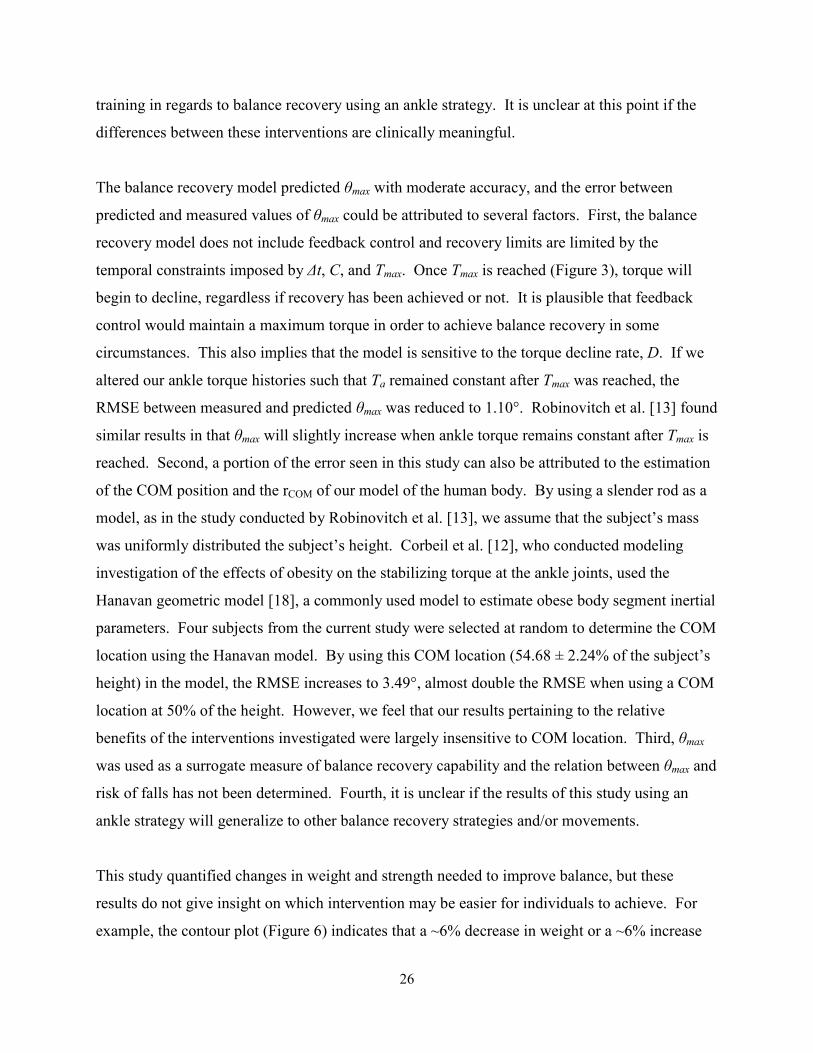
A contour plot was created (Figure 6) to illustrate the relative effects of strength training and
weight loss on balance recovery for a representative subject (weight=94.8 kg, height=1.72 m,
and BMI=32.0 kg/m2). Nearly equal changes in strength and weight loss were required to
increase θmax by 1 degree. If strength training and weight loss are applied simultaneously,
similar changes were required to achieve the same increase in θmax .
Figure 6. Contour plot balance recovery illustrating the effects of strength and weight on balance. Dashed lines represent recovery at a given angle. Note that the change in strength on the y-axis includes changes in torque generation rate. At baseline (Point A), the model indicates the
representative subject will have a θmax of 8.1°. To increase θmax by 1° , the subject would need to increase strength by 6.2% (Point B) or lose 6.1% of original body weight (Point C). If the interventions were applied simultaneously, the smallest magnitude change required to increase
θmax by 1° would be a 3.3% decrease in weight and a 3.0% increase in strength (Point D).
-20 -15 -10 -5 0 5 10-15
-10
-5
0
5
10
Change in Weight, %
Change in Stren
gth, %
5o
6o
7o
8o9o10o11o12o13o
C A
B
D
25
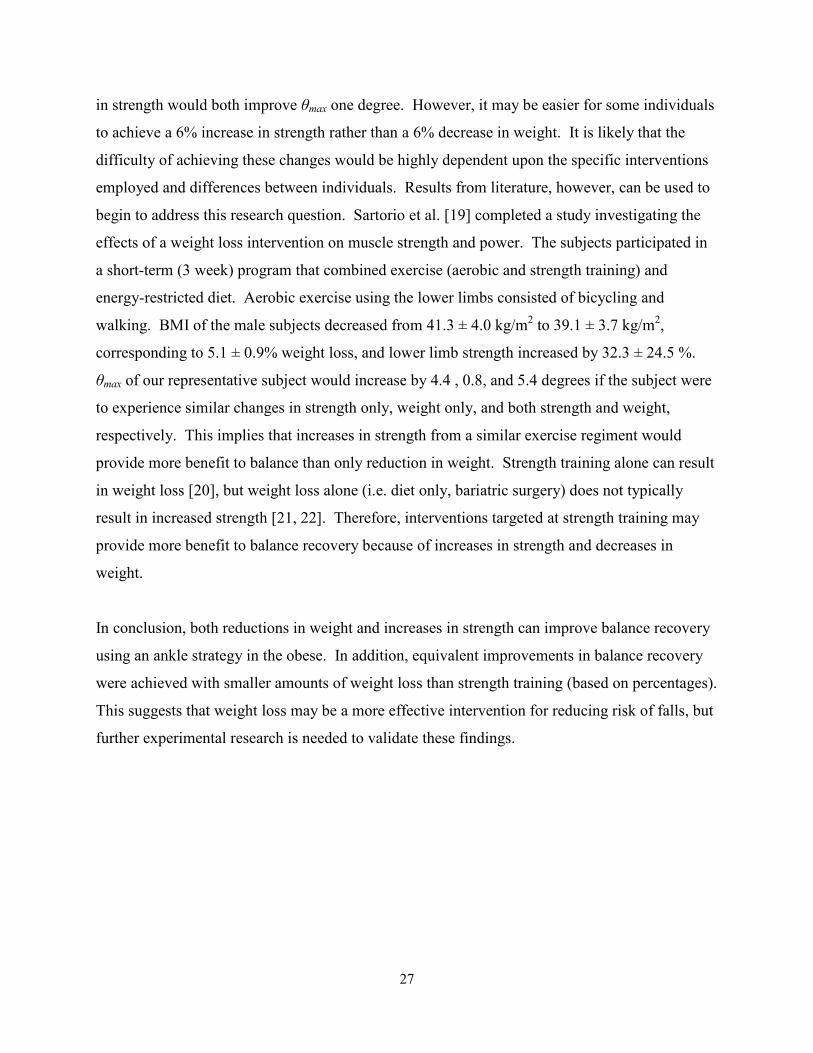
Using results averaged across all subjects, changes in weight, maximum ankle torque, and
strength were linearly related to changes in θmax (Figure 7). Weight loss consistently required the
smallest change among all three interventions to achieve a desired increase in θmax, and increases
in maximum ankle torque alone consistently required the largest change. As larger increases in
θmax were achieved in our simulations, the differences in the efficacy of the three interventions
became more apparent.
* Note: Changes in weight reflect a decrease in weight. Changes in Tmax and strength reflect increases in these properties.
Figure 7. Average changes in weight and ankle torque parameters to improve θmax. Differences in the three interventions investigated increased with larger increases in θmax. To achieve a one degree increase in θmax, a 6.6 ± 0.4% decrease in weight, 9.4 ± 0.8% increase in Tmax, or a 6.9 ± 0.9% increase in strength were required.
DISCUSSION
The purpose of this study was to evaluate the effects of weight loss and strength training on
balance recovery using an ankle strategy. Our results indicate that both interventions can
improve balance, as measured by θmax. In addition, a smaller amount of weight loss was needed
compared to increases in strength to achieve equivalent improvement in balance. The difference
between these two interventions became more apparent as larger improvements in balance were
targeted. These data suggest that weight loss is a more effective intervention than strength
0
5
10
15
20
25
30
35
0 0.5 1 1.5 2 2.5 3
Change from Initial, %
Increase in θmax , deg
T_max
Strength Training
Weight
Tmax
Strength Training
Weight*
26
training in regards to balance recovery using an ankle strategy. It is unclear at this point if the
differences between these interventions are clinically meaningful.
The balance recovery model predicted θmax with moderate accuracy, and the error between
predicted and measured values of θmax could be attributed to several factors. First, the balance
recovery model does not include feedback control and recovery limits are limited by the
temporal constraints imposed by ∆t, C, and Tmax. Once Tmax is reached (Figure 3), torque will
begin to decline, regardless if recovery has been achieved or not. It is plausible that feedback
control would maintain a maximum torque in order to achieve balance recovery in some
circumstances. This also implies that the model is sensitive to the torque decline rate, D. If we
altered our ankle torque histories such that Ta remained constant after Tmax was reached, the
RMSE between measured and predicted θmax was reduced to 1.10°. Robinovitch et al. [13] found
similar results in that θmax will slightly increase when ankle torque remains constant after Tmax is
reached. Second, a portion of the error seen in this study can also be attributed to the estimation
of the COM position and the rCOM of our model of the human body. By using a slender rod as a
model, as in the study conducted by Robinovitch et al. [13], we assume that the subject’s mass
was uniformly distributed the subject’s height. Corbeil et al. [12], who conducted modeling
investigation of the effects of obesity on the stabilizing torque at the ankle joints, used the
Hanavan geometric model [18], a commonly used model to estimate obese body segment inertial
parameters. Four subjects from the current study were selected at random to determine the COM
location using the Hanavan model. By using this COM location (54.68 ± 2.24% of the subject’s
height) in the model, the RMSE increases to 3.49°, almost double the RMSE when using a COM
location at 50% of the height. However, we feel that our results pertaining to the relative
benefits of the interventions investigated were largely insensitive to COM location. Third, θmax
was used as a surrogate measure of balance recovery capability and the relation between θmax and
risk of falls has not been determined. Fourth, it is unclear if the results of this study using an
ankle strategy will generalize to other balance recovery strategies and/or movements.
This study quantified changes in weight and strength needed to improve balance, but these
results do not give insight on which intervention may be easier for individuals to achieve. For
example, the contour plot (Figure 6) indicates that a ~6% decrease in weight or a ~6% increase
27
in strength would both improve θmax one degree. However, it may be easier for some individuals
to achieve a 6% increase in strength rather than a 6% decrease in weight. It is likely that the
difficulty of achieving these changes would be highly dependent upon the specific interventions
employed and differences between individuals. Results from literature, however, can be used to
begin to address this research question. Sartorio et al. [19] completed a study investigating the
effects of a weight loss intervention on muscle strength and power. The subjects participated in
a short-term (3 week) program that combined exercise (aerobic and strength training) and
energy-restricted diet. Aerobic exercise using the lower limbs consisted of bicycling and
walking. BMI of the male subjects decreased from 41.3 ± 4.0 kg/m2 to 39.1 ± 3.7 kg/m2,
corresponding to 5.1 ± 0.9% weight loss, and lower limb strength increased by 32.3 ± 24.5 %.
θmax of our representative subject would increase by 4.4 , 0.8, and 5.4 degrees if the subject were
to experience similar changes in strength only, weight only, and both strength and weight,
respectively. This implies that increases in strength from a similar exercise regiment would
provide more benefit to balance than only reduction in weight. Strength training alone can result
in weight loss [20], but weight loss alone (i.e. diet only, bariatric surgery) does not typically
result in increased strength [21, 22]. Therefore, interventions targeted at strength training may
provide more benefit to balance recovery because of increases in strength and decreases in
weight.
In conclusion, both reductions in weight and increases in strength can improve balance recovery
using an ankle strategy in the obese. In addition, equivalent improvements in balance recovery
were achieved with smaller amounts of weight loss than strength training (based on percentages).
This suggests that weight loss may be a more effective intervention for reducing risk of falls, but
further experimental research is needed to validate these findings.
28
REFERENCES
1. Obesity: Preventing and Managing the Global Epidemic, in WHO Consultation on
obesity. 1998, World Health Organization: Geneva.
2. Puska, P., C. Nishida, and D. Porter, Global Strategy on Diet, Physical Activity and
Health. 2003, World Health Organization (WHO).
3. Flegal, K.M., et al., Prevalence and trends in obesity among US adults, 1999-2000. Jama, 2002. 288(14): p. 1723-7.
4. Ogden, C.L., et al., Prevalence of overweight and obesity in the United States, 1999-
2004. Jama, 2006. 295(13): p. 1549-55.
5. Fjeldstad, C., et al., The influence of obesity on falls and quality of life. Dyn Med, 2008. 7: p. 4.
6. Matter, K.C., et al., A comparison of the characteristics of injuries between obese and
non-obese inpatients. Obesity (Silver Spring), 2007. 15(10): p. 2384-90.
7. Hue, O., et al., Body weight is a strong predictor of postural stability. Gait Posture, 2007. 26(1): p. 32-8.
8. Teasdale, N., et al., Reducing weight increases postural stability in obese and morbid
obese men. Int J Obes (Lond), 2007. 31(1): p. 153-60.
9. Maffiuletti, N.A., et al., Postural instability of extremely obese individuals improves after
a body weight reduction program entailing specific balance training. J Endocrinol Invest, 2005. 28(1): p. 2-7.
10. Clark, K., Balance and strength training for obese individuals. ACSM's Health and Fitness Journal, 2004. 8(1): p. 14-20.
11. Whipple, R.H., L.I. Wolfson, and P.M. Amerman, The relationship of knee and ankle weakness to falls in nursing home residents: an isokinetic study. J Am Geriatr Soc, 1987. 35(1): p. 13-20.
12. Corbeil, P., et al., Increased risk for falling associated with obesity: mathematical
modeling of postural control. IEEE Trans Neural Syst Rehabil Eng, 2001. 9(2): p. 126-36.
13. Robinovitch, S.N., et al., Effect of strength and speed of torque development on balance
recovery with the ankle strategy. J Neurophysiol, 2002. 88(2): p. 613-20.
14. Lafortuna, C.L., et al., Gender variations of body composition, muscle strength and
power output in morbid obesity. Int J Obes (Lond), 2005. 29(7): p. 833-41.
15. Hulens, M., et al., Study of differences in peripheral muscle strength of lean versus obese
women: an allometric approach. Int J Obes Relat Metab Disord, 2001. 25(5): p. 676-81.
29
16. Maffiuletti, N.A., et al., Differences in quadriceps muscle strength and fatigue between
lean and obese subjects. Eur J Appl Physiol, 2007. 101(1): p. 51-9.
17. Del Balso, C. and E. Cafarelli, Adaptations in the activation of human skeletal muscle
induced by short-term isometric resistance training. J Appl Physiol, 2007. 103(1): p. 402-11.
18. Hanavan, E.P., Jr., A Mathematical Model of the Human Body. Amrl-Tr-64-102. Amrl Tr, 1964: p. 1-149.
19. Sartorio, A., et al., Gender-related changes in body composition, muscle strength and
power output after a short-term multidisciplinary weight loss intervention in morbid
obesity. J Endocrinol Invest, 2005. 28(6): p. 494-501.
20. Pritchard, J.E., C.A. Nowson, and J.D. Wark, A Worksite Program for Overweight
Middle-Aged Men Achieves Lesser Weight Loss With Exercise Than With Dietary
Change. Journal of the American Dietetic Association, 1997. 97(1): p. 37-42.
21. Hue, O., et al., Muscle Force and Force Control After Weight Loss in Obese and
Morbidly Obese Men. Obesity Surgery, (published online ahead of print June 27, 2008).
22. Wadstrom, C., et al., The effect of excessive weight loss on skeletal muscle in man. A
study of obese patients following gastroplasty. Eur J Surg, 1991. 157(5): p. 347-54.
30
CHAPTER 3 - A PRELIMINARY STUDY OF CHANGES IN BODY SEGMENT
INERTIAL PARAMETERS OF OBESE INDIVIDUALS WITH WEIGHT LOSS
INTRODUCTION
Obesity is a major and growing health concern in the United States (US). In 2004, 31.1% of
adult men in the US were considered obese [1]. The prevalence of obesity (BMI > 30 kg/m2)
continues to rise and has doubled between 1980 and 2002 [1]. Approximately 6%, or $92
billion, of total annual medical expenditures in the US can be attributed to obesity [2]. Several
health conditions are also associated with being overweight or obese including type-2 diabetes
mellitus, high blood pressure, high cholesterol, asthma, and osteoarthritis [3, 4].
Perhaps the most direct intervention for avoiding or mitigating obesity-related health conditions
is weight loss. Several experimental studies have investigated the effects of weight loss on
musculoskeletal function and lower extremity kinetics [5-7]. These studies provide quantitative
evidence on the benefits of weight loss in terms of function and prevention of the development
and/or progression of obesity-related health conditions. For example, Messier et al. [5] reported
a 4-fold reduction in knee loads during gait with each pound of weight loss in the obese. An
alternative approach to these experimental studies investigating the effects of weight loss is to
conduct virtual experiments using forward dynamic simulations of human movement. While
they should ultimately be validated with experimental studies, forward dynamics simulations
provide a cost-effective initial approach that offers a greater level of experimental control
compared to human subject testing, and potentially greater understanding of the underlying
biomechanical relationships. Moreover, they can be used to evaluate a variety of different
interventions for efficacy prior to expensive and time-consuming clinical trials.
The biomechanical models used in forward dynamic simulations require accurate estimations of
body segment inertial parameters (BSIPs) including body segment mass, center of mass (COM)
position within each segment, and segment mass moment of inertia. To study weight loss,
guidelines describing how BSIPs change with weight loss are necessary so that BSIPs in the
biomechanical model can be modified realistically. However, no such guidelines are currently
available. Based on this need, the goal of this study was to quantify three-dimensional changes
31
in BSIPs with weight loss. Magnetic resonance imaging (MRI) was used since it is a non-
invasive method of determining BSIPs, and has been used previously to estimate BSIPs in
children [8] and adults [9-12].
METHODS
MRI images from 19 Caucasian males who participated in a separate study on weight loss [13]
were used for the present study. These subjects had a mean (± standard deviation) age of 43.6 ±
7.5 years, and height 177.3 ± 6.9 cm. Body mass and BMI prior to weight loss were 102.7 ±
13.6 kg and 32.6 ± 3.2 kg/m2, respectively (three of the subjects had a BMI below 30, but above
27.5, prior to weight loss). Subjects were assigned to one of three weight loss programs: seven
subjects were assigned to a diet only (DO) program, five to a diet and aerobic exercise (DA)
program, and seven to a diet and resistance exercise (DR) program. Details of the diet and
exercise programs are reported elsewhere [13]. The weight loss study was conducted in
accordance with the ethical guidelines of Queen’s University, and all subjects provided written
consent before participation.
MRI images both before and after weight loss were acquired using a Philips Gyroscan 1.5-T
whole body scanner with a spin-echo sequence, a 500-ms repetition time, and a 20-ms echo time
[14]. Subjects laid in a supine position with arms placed straight above the head. Transverse
images of 10mm thickness were acquired from the fourth (L4) and fifth (L5) lumbar vertebrae to
the ankle with a spacing of 50mm between image centers. Subjects were then required to exit
the magnet and re-enter head first to acquire images from L4-L5 to the wrist.
Tissue discrimination was performed using commercially available medical imaging software
(sliceOmatic v4.3, Montreal, Quebec, Canada). Optimal threshold values of pixel brightness for
adipose tissue, muscle, organs, and bone were determined using automated procedures with
manual correction of obvious artifacts. For each image, tissues were color-coded, and images
were exported for subsequent analysis using customized programs in MATLAB (Mathworks,
Natick, MA).
32
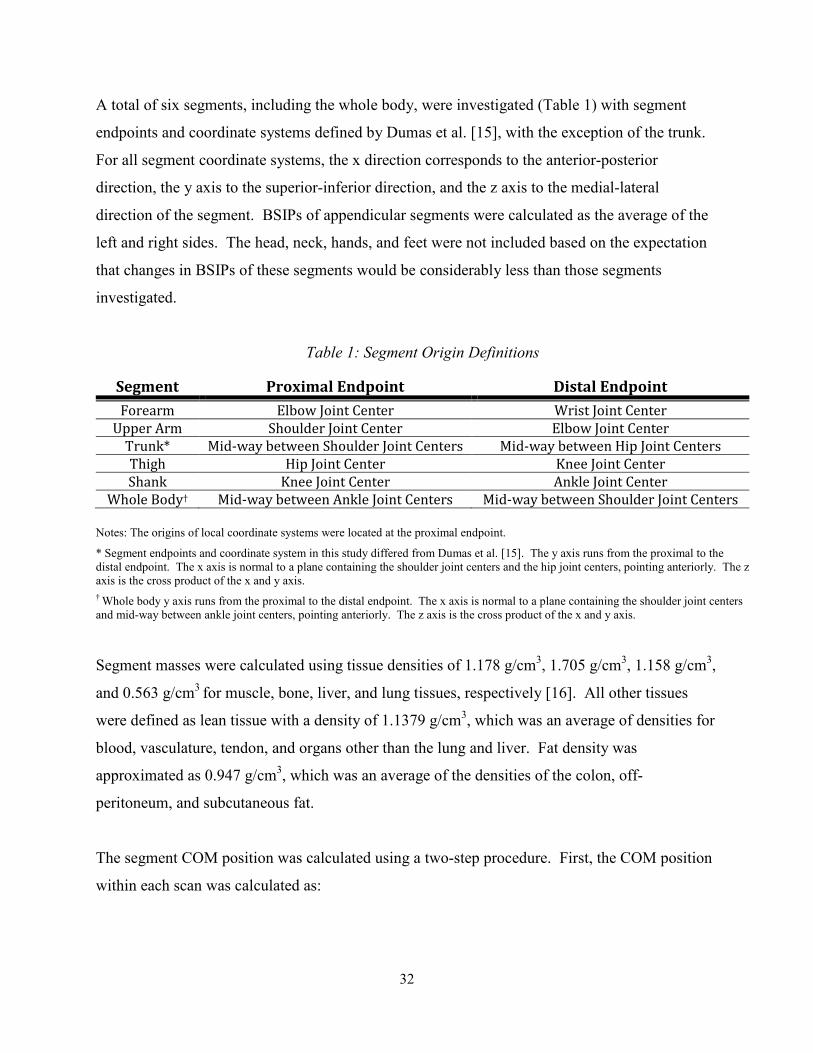
A total of six segments, including the whole body, were investigated (Table 1) with segment
endpoints and coordinate systems defined by Dumas et al. [15], with the exception of the trunk.
For all segment coordinate systems, the x direction corresponds to the anterior-posterior
direction, the y axis to the superior-inferior direction, and the z axis to the medial-lateral
direction of the segment. BSIPs of appendicular segments were calculated as the average of the
left and right sides. The head, neck, hands, and feet were not included based on the expectation
that changes in BSIPs of these segments would be considerably less than those segments
investigated.
Table 1: Segment Origin Definitions
Segment Proximal Endpoint Distal Endpoint
Forearm Elbow Joint Center Wrist Joint Center
Upper Arm Shoulder Joint Center Elbow Joint Center
Trunk* Mid-way between Shoulder Joint Centers Mid-way between Hip Joint Centers
Thigh Hip Joint Center Knee Joint Center
Shank Knee Joint Center Ankle Joint Center
Whole Body† Mid-way between Ankle Joint Centers Mid-way between Shoulder Joint Centers
Notes: The origins of local coordinate systems were located at the proximal endpoint.
* Segment endpoints and coordinate system in this study differed from Dumas et al. [15]. The y axis runs from the proximal to the distal endpoint. The x axis is normal to a plane containing the shoulder joint centers and the hip joint centers, pointing anteriorly. The z axis is the cross product of the x and y axis.
† Whole body y axis runs from the proximal to the distal endpoint. The x axis is normal to a plane containing the shoulder joint centers and mid-way between ankle joint centers, pointing anteriorly. The z axis is the cross product of the x and y axis.
Segment masses were calculated using tissue densities of 1.178 g/cm3, 1.705 g/cm3, 1.158 g/cm3,
and 0.563 g/cm3 for muscle, bone, liver, and lung tissues, respectively [16]. All other tissues
were defined as lean tissue with a density of 1.1379 g/cm3, which was an average of densities for
blood, vasculature, tendon, and organs other than the lung and liver. Fat density was
approximated as 0.947 g/cm3, which was an average of the densities of the colon, off-
peritoneum, and subcutaneous fat.
The segment COM position was calculated using a two-step procedure. First, the COM position
within each scan was calculated as:
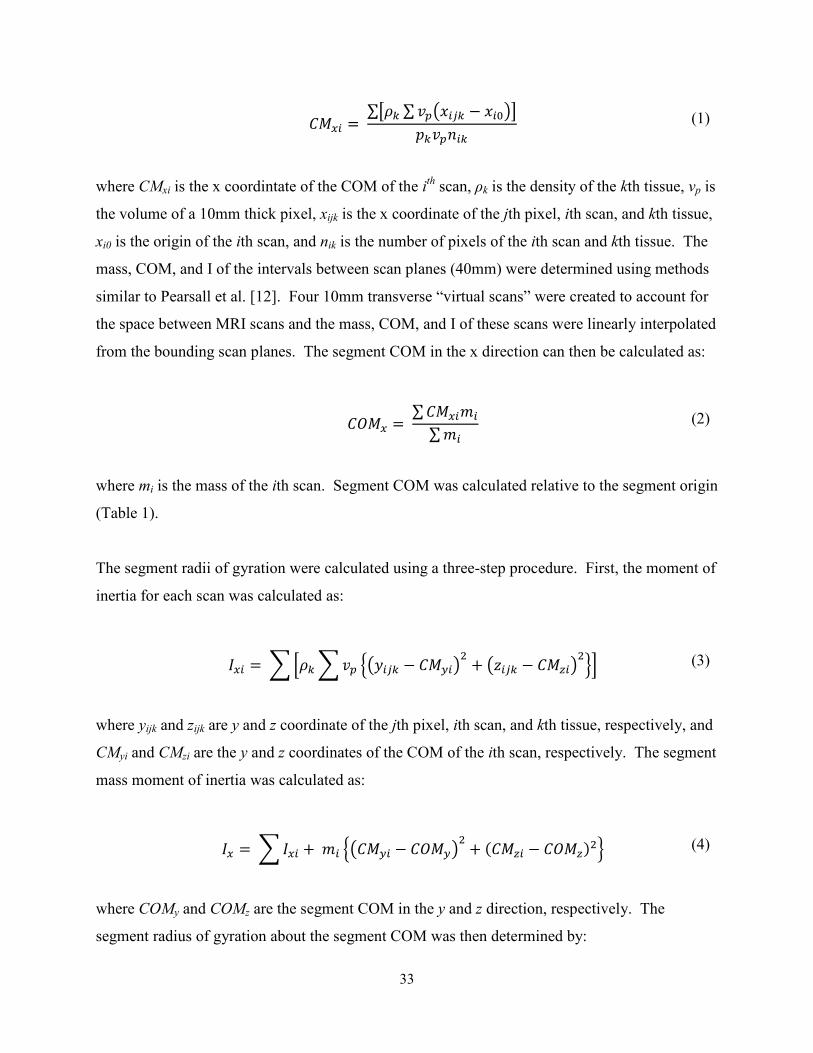
33
���� ������ ��� !�"� � !�#$%&���'�� (1)
where CMxi is the x coordintate of the COM of the ith scan, ρk is the density of the kth tissue, vp is
the volume of a 10mm thick pixel, xijk is the x coordinate of the jth pixel, ith scan, and kth tissue,
xi0 is the origin of the ith scan, and nik is the number of pixels of the ith scan and kth tissue. The
mass, COM, and I of the intervals between scan planes (40mm) were determined using methods
similar to Pearsall et al. [12]. Four 10mm transverse “virtual scans” were created to account for
the space between MRI scans and the mass, COM, and I of these scans were linearly interpolated
from the bounding scan planes. The segment COM in the x direction can then be calculated as:
�(�� ���������� (2)
where mi is the mass of the ith scan. Segment COM was calculated relative to the segment origin
(Table 1).
The segment radii of gyration were calculated using a three-step procedure. First, the moment of
inertia for each scan was calculated as:
��� ��)*�� )�� + ,�"� � ��-�$. / 0�"� � ��1�$.23 (3)
where yijk and zijk are y and z coordinate of the jth pixel, ith scan, and kth tissue, respectively, and
CMyi and CMzi are the y and z coordinates of the COM of the ith scan, respectively. The segment
mass moment of inertia was calculated as:
�� ��)��� /�� + ��-� � �(�-$. / ���1� � �(�1�.2 (4)
where COMy and COMz are the segment COM in the y and z direction, respectively. The
segment radius of gyration about the segment COM was then determined by:
34
4� � 5 ����� (5)
A Wilcoxon Signed-Rank test was used to analyze changes in BSIPs with weight loss. The
overall Type 1 error rate for the 42 tests performed (6 segments × 7 parameters) was controlled
using an approach termed false discovery rate control. This approach is an alternative to the
commonly used Bonferroni procedure and controls the proportion of significant results that are
in fact Type 1 errors [17]. Additionally, false discovery rate control does not suffer from the
undesirable lack of statistical power associated with the Bonferonni procedure with an increasing
number of tests [18, 19]. The trunk and whole body BSIPs of one subject were excluded from
the analysis due to unequal segment lengths before and after weight loss. Statistical analysis was
conducted using JMP v6 (Cary, North Carolina, USA).
RESULTS
Subjects lost 14.2 ± 3.4 kg or 13.8 ± 2.4 % of initial body weight with weight loss. This resulted
in a 4.5 ± 1.0 unit decrease in BMI (four subjects still had a BMI > 30 kg/m2 after weight loss).
The MRI method estimated that subjects lost 13.9 ± 3.0% body weight, yielding a root mean
squared error of 1.9% from actual weight loss.
Average changes in segment mass, COM position, and r with weight loss are given in Table 2.
Effect sizes and p-values are given in Table 3. Segment mass decreased significantly in all
segments. COM position moved distally for the thigh and upper arm, superiorly for the trunk,
and inferiorly for the whole body. In general, segment r decreased in all segments.
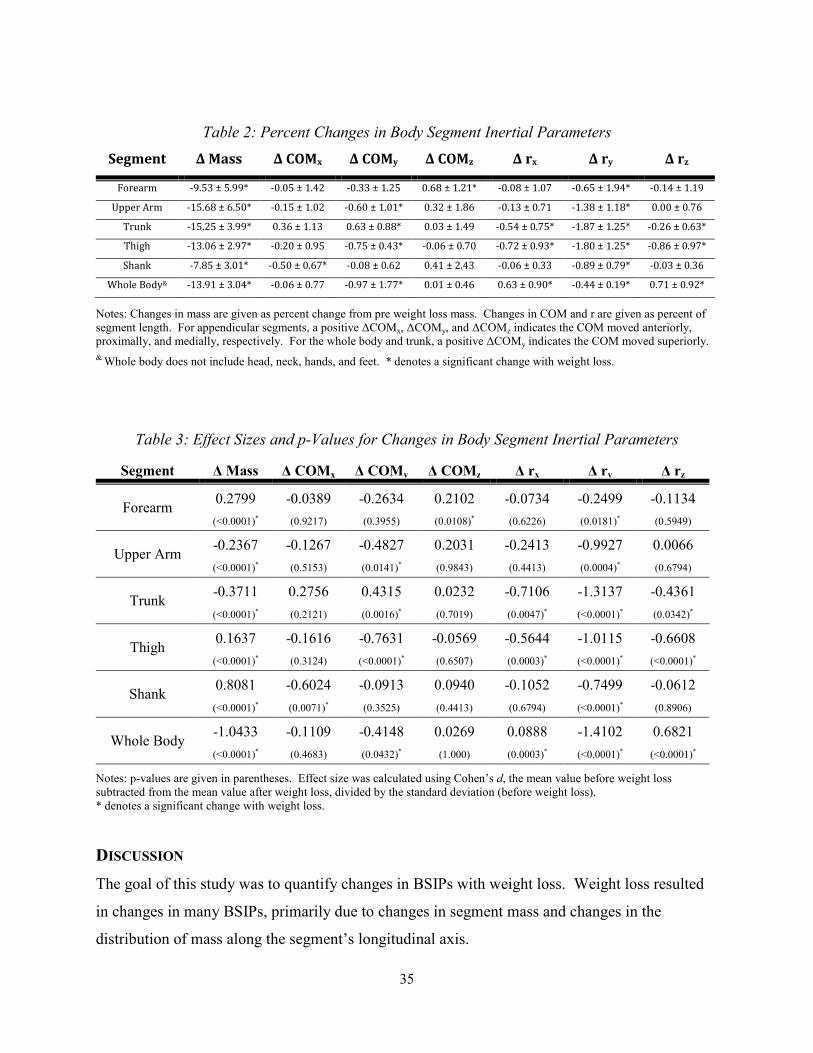
35
Table 2: Percent Changes in Body Segment Inertial Parameters
Segment Δ Mass Δ COMx Δ COMy Δ COMz Δ rx Δ ry Δ rz
Forearm -9.53 ± 5.99* -0.05 ± 1.42 -0.33 ± 1.25 0.68 ± 1.21* -0.08 ± 1.07 -0.65 ± 1.94* -0.14 ± 1.19
Upper Arm -15.68 ± 6.50* -0.15 ± 1.02 -0.60 ± 1.01* 0.32 ± 1.86 -0.13 ± 0.71 -1.38 ± 1.18* 0.00 ± 0.76
Trunk -15.25 ± 3.99* 0.36 ± 1.13 0.63 ± 0.88* 0.03 ± 1.49 -0.54 ± 0.75* -1.87 ± 1.25* -0.26 ± 0.63*
Thigh -13.06 ± 2.97* -0.20 ± 0.95 -0.75 ± 0.43* -0.06 ± 0.70 -0.72 ± 0.93* -1.80 ± 1.25* -0.86 ± 0.97*
Shank -7.85 ± 3.01* -0.50 ± 0.67* -0.08 ± 0.62 0.41 ± 2.43 -0.06 ± 0.33 -0.89 ± 0.79* -0.03 ± 0.36
Whole Body& -13.91 ± 3.04* -0.06 ± 0.77 -0.97 ± 1.77* 0.01 ± 0.46 0.63 ± 0.90* -0.44 ± 0.19* 0.71 ± 0.92*
Notes: Changes in mass are given as percent change from pre weight loss mass. Changes in COM and r are given as percent of segment length. For appendicular segments, a positive ∆COMx, ∆COMy, and ∆COMz indicates the COM moved anteriorly, proximally, and medially, respectively. For the whole body and trunk, a positive ∆COMy indicates the COM moved superiorly.
& Whole body does not include head, neck, hands, and feet. * denotes a significant change with weight loss.
Table 3: Effect Sizes and p-Values for Changes in Body Segment Inertial Parameters
Segment ∆ Mass ∆ COMx ∆ COMy ∆ COMz ∆ rx ∆ ry ∆ rz
Forearm 0.2799 -0.0389 -0.2634 0.2102 -0.0734 -0.2499 -0.1134
(<0.0001)* (0.9217) (0.3955) (0.0108)* (0.6226) (0.0181)* (0.5949)
Upper Arm -0.2367 -0.1267 -0.4827 0.2031 -0.2413 -0.9927 0.0066
(<0.0001)* (0.5153) (0.0141)* (0.9843) (0.4413) (0.0004)* (0.6794)
Trunk -0.3711 0.2756 0.4315 0.0232 -0.7106 -1.3137 -0.4361
(<0.0001)* (0.2121) (0.0016)* (0.7019) (0.0047)* (<0.0001)* (0.0342)*
Thigh 0.1637 -0.1616 -0.7631 -0.0569 -0.5644 -1.0115 -0.6608
(<0.0001)* (0.3124) (<0.0001)* (0.6507) (0.0003)* (<0.0001)* (<0.0001)*
Shank 0.8081 -0.6024 -0.0913 0.0940 -0.1052 -0.7499 -0.0612
(<0.0001)* (0.0071)* (0.3525) (0.4413) (0.6794) (<0.0001)* (0.8906)
Whole Body -1.0433 -0.1109 -0.4148 0.0269 0.0888 -1.4102 0.6821
(<0.0001)* (0.4683) (0.0432)* (1.000) (0.0003)* (<0.0001)* (<0.0001)*
Notes: p-values are given in parentheses. Effect size was calculated using Cohen’s d, the mean value before weight loss subtracted from the mean value after weight loss, divided by the standard deviation (before weight loss). * denotes a significant change with weight loss.
DISCUSSION
The goal of this study was to quantify changes in BSIPs with weight loss. Weight loss resulted
in changes in many BSIPs, primarily due to changes in segment mass and changes in the
distribution of mass along the segment’s longitudinal axis.
36
Several limitations to the current study warrant discussion. First, the spacing between adjacent
MRI image centers was 50mm, which was larger than the 8-25mm used in other studies that
derived BSIPs with MRI [8-11]. This spacing could contribute to systematic errors in BSIPs
primarily through inaccuracies in identification of segment endpoints. If a segment endpoint was
between images, for example, then the segment was extended to the next image and would
include mass from the adjacent segment. However, this study was interested in calculating
changes in BSIPs, and such error would be systematic. Additionally, we do not think that this
was a significant contribution to the overall error. A second limitation was that subjects laid in a
supine position during imaging. This position likely contributed to some soft tissue deformation
compared to the vertical position, which is likely the position of the body in most modeling
studies. A third limitation was that the head, neck, hands, and feet were not included in this
study. However, previous studies have shown that adipose tissue in the head and neck does not
significantly change with weight loss [20] or age [21]. In addition, the MRI method calculated
weight loss with a root mean squared error of 1.9% from actual weight loss. This indicates that
the excluded segments were not a significant source of weight loss compared to the segments
investigated in this study. Lastly, data were only collected from Caucasian male subjects, and
therefore results may not be generalizable to other populations.
In conclusion, changes in BSIPs with weight loss were quantified in obese Caucasian males
using MRI. These data can be used to investigate the biomechanical effects of weight loss using
a biomechanical model and forward dynamic simulations.
ACKNOWLEDGEMENTS
This work was partially supported by the Wake Forest University Claude D. Pepper Older
Americans Independence Center (P30-AG21332). The sponsor had no involvement in the study
or manuscript preparation and submission.
37
REFERENCES
1. Ogden, C.L., et al., Prevalence of overweight and obesity in the United States, 1999-
2004. Jama, 2006. 295(13): p. 1549-55.
2. Finkelstein, E.A., I.C. Fiebelkorn, and G. Wang, National medical spending attributable
to overweight and obesity: how much, and who's paying? Health Aff (Millwood), 2003. Suppl Web Exclusives: p. W3-219-26.
3. Sturmer, T., K.P. Gunther, and H. Brenner, Obesity, overweight and patterns of
osteoarthritis: the Ulm Osteoarthritis Study. J Clin Epidemiol, 2000. 53(3): p. 307-13.
4. Mokdad, A.H., et al., Prevalence of obesity, diabetes, and obesity-related health risk factors, 2001. Jama, 2003. 289(1): p. 76-9.
5. Messier, S.P., et al., Weight loss reduces knee-joint loads in overweight and obese older
adults with knee osteoarthritis. Arthritis Rheum, 2005. 52(7): p. 2026-32.
6. Miller, G.D., et al., Intensive weight loss program improves physical function in older
obese adults with knee osteoarthritis. Obesity (Silver Spring), 2006. 14(7): p. 1219-30.
7. Teasdale, N., et al., Reducing weight increases postural stability in obese and morbid
obese men. Int J Obes (Lond), 2007. 31(1): p. 153-60.
8. Bauer, J.J., et al., MRI-derived body segment parameters of children differ from age-
based estimates derived using photogrammetry. J Biomech, 2007. 40(13): p. 2904-10.
9. Cheng, C.K., et al., Segment inertial properties of Chinese adults determined from
magnetic resonance imaging. Clin Biomech (Bristol, Avon), 2000. 15(8): p. 559-66.
10. Martin, P.E., et al., The use of magnetic resonance imaging for measuring segment
inertial properties. J Biomech, 1989. 22(4): p. 367-76.
11. Mungiole, M. and P.E. Martin, Estimating segment inertial properties: comparison of
magnetic resonance imaging with existing methods. J Biomech, 1990. 23(10): p. 1039-46.
12. Pearsall, D.J., J.G. Reid, and R. Ross, Inertial properties of the human trunk of males
determined from magnetic resonance imaging. Ann Biomed Eng, 1994. 22(6): p. 692-706.
13. Ross, R., et al., Influence of diet and exercise on skeletal muscle and visceral adipose
tissue in men. J Appl Physiol, 1996. 81(6): p. 2445-55.
14. Ross, R., et al., Quantification of adipose tissue by MRI: relationship with
anthropometric variables. J Appl Physiol, 1992. 72(2): p. 787-95.
15. Dumas, R., L. Cheze, and J.P. Verriest, Adjustments to McConville et al. and Young et al.
body segment inertial parameters. J Biomech, 2007. 40(3): p. 543-53.
16. Erdmann, W.S. and T. Gos, Density of trunk tissues of young and medium age people. J Biomech, 1990. 23(9): p. 945-7.
38
17. Benjamini, Y. and Y. Hochberg, On the Adaptive Control of the False Discovery Rate in
Multiple Testing With Independent Statistics. Journal of Educational and Behavioral Statistics, 2000. 25(1): p. 60-83.
18. Nakagawa, S., A farewell to Bonferroni: the problems of low statistical power and
publication bias. Behav. Ecol., 2004. 15(6): p. 1044-1045.
19. Verhoeven, K.J.F., K.L. Simonsen, and L.M. McIntyre, Implementing false discovery
rate control: increasing your power. Oikos, 2005. 108(3): p. 643-647.
20. Chowdhury, B., et al., CT-determined changes in adipose tissue distribution during a
small weight reduction in obese males. Int J Obes Relat Metab Disord, 1993. 17(12): p. 685-91.
21. Kotani, K., et al., Sexual dimorphism of age-related changes in whole-body fat
distribution in the obese. Int J Obes Relat Metab Disord, 1994. 18(4): p. 207-2.