Embed Size (px)
Citation preview
1
A modeling approach to study the effect of cell
polarization on keratinocyte migration
Short title: Modeling of keratinocyte migration
Matthias Jörg Fuhr1*, Michael Meyer2*, Eric Fehr1, Gilles Ponzio3,
Sabine Werner2** and Hans Jürgen Herrmann1**
1ETH Zurich, Institute for Building Materials, Computational Physics for Engineering
Materials, Schafmattstrasse 6, HIF E12, CH-8093 Zurich, Switzerland
2ETH Zurich, Institute of Molecular Health Sciences, Otto-Stern-Weg 7, HPL F12, 8093
Zürich, Switzerland
3CNRS, UMR 7275, 660, Route des Lucioles, Sophia Antipolis, 06560 Valbonne, France,
and Université de Nice Sophia Antipolis, Nice, France
* Equal contribution
**Joint senior and corresponding authors
Address for correspondence:
Hans Jürgen Herrmann and Sabine Werner, Institute for Building Materials,
Computational Physics for Engineering Materials (HJH) and Institute of Molecular Health
Sciences (SW), ETH Zurich, 8093 Zurich, Switzerland. E-mail Hans Jürgen Herrmann:
[email protected]; E-mail Sabine Werner: [email protected]
2
Abstract
The skin forms an efficient barrier against the environment, and rapid cutaneous wound
healing after injury is therefore essential. Healing of the uppermost layer of the skin, the
epidermis, involves collective migration of keratinocytes, which requires coordinated
polarization of the cells. To study this process, we developed a model that allows
analysis of life-cell images of migrating keratinocytes in culture, based on a small
number of parameters, including the radius of the cells, their mass and their
polarization. This computational approach allows for the analysis of individual and
collective migration of cells at the front of the wound and a reliable identification and
quantification of the impaired polarization and migration of keratinocytes from mice
lacking fibroblast growth factors 1 and 2 – an established model of impaired healing.
Therefore, our modeling approach is suitable for large-scale analysis of migration
phenotypes of cells with specific genetic defects or upon treatment with different
pharmacological agents.
3
Introduction
In response to skin injury, a complex wound healing process is initiated that aims to
restore the injured body site. The repair process is divided into three partially
overlapping phases, namely blood clotting and inflammation, new tissue formation, and
finally tissue remodeling. Tissue formation includes the formation of a provisional
dermal tissue, called granulation tissue, as well as coverage of the wound with a new
epithelium (reepithelialization). The latter is initiated by migration of keratinocytes from
the epidermis at the wound edge and from injured hair follicles, followed by
proliferation of keratinocytes to replenish the missing tissue [1,2,3]. A defect in
reepithelialization is characteristic for chronic human wounds, a frequent and severe
pathology that mainly affects aged individuals as well as patients with diabetes, those
treated with immunosuppressive compounds, or cancer patients treated with
chemotherapy [4]. Interestingly, the reepithelialization defect in chronic ulcers is usually
not due to impaired keratinocyte proliferation, but rather to a severe deficiency in the
migratory response [5,6]. It is therefore highly relevant to characterize the effect of
overexpression or loss of different genes or of external stimuli on the migration process
of these cells.
We recently described a novel mouse model for impaired wound healing, which
– like the situation in chronic human wounds – is characterized by impaired keratinocyte
migration, but enhanced proliferation of these cells in vivo. These mice lack fibroblast
growth factor receptors (FGFR) 1 and 2 in keratinocytes [7], and therefore cannot
respond to FGFs, which are key regulators of wound repair [8]. The migratory defect of
4
FGFR1/2-deficient keratinocytes was also observed in cultured keratinocytes from these
mice using scratch and transwell migration assays [7]. A cellular and molecular
characterization of the migrating cells revealed defects in their polarization as reflected
by the abnormal localization of the Golgi apparatus and impaired adhesion due to
reduced expression of major focal adhesion components. To further characterize and
quantify the migration defect of FGFR-deficient cells and to analyze the migratory
capacity of other cells, it is important to develop appropriate computational methods
and models. Such a model should allow the analysis of individual cells and thus a
comparison of cells within the cell monolayer ('interior cells') with those at the front
('border cells'). The cell locomotion of the interior cells is dominated by a coordinated
'flocking' movement, which depends on the density of cells [9,10]. Simulations of self-
driven particles, such as keratinocytes, suggest that short-range attractive-repulsive
intercellular forces alone are sufficient to explain this coordinated movement [10].
Thereby, the cell motility undergoes a discontinuous kinetic phase transition from a
disordered to an ordered state [11,12]. On the other hand, cells in the front row (border
cells) can show both individual and collective behavior at the same time [13]. The
individual behavior is characterized by cells, which dissociate from the scratch and
individually explore the open space, while the collective one results in an explorative
motion of the cell front. Simulations and experiments of Madin-Darby canine kidney
cells showed that active 'leader' cells destabilize the scratch border by dragging their
neighbors into the scratch, thereby facilitating closure [14,15]. However, the behavior of
the border cells and their individual and collective motion, are still not completely
5
understood. Therefore, it is the goal of the present study to establish a model that
allows for the analysis of both the individual and the collective motion of border cells.
While we address the former by experiments with cells at low density and a
sophisticated model of single cell motion, we study the latter on a coarse-grained level
by the structure and evolution of the entire injured monolayer built by the collection of
all border cells. Rather than segmenting single cells [16]) or even signaling cascades [17],
we decided to choose a particle model. We will present a reliable and reproducible
model with few parameters that allows large-scale analysis of cells with different
genetic defects or upon pharmacological manipulation.
6
Materials and Methods
In vitro keratinocyte migration experiments
Spontaneously immortalized keratinocytes from mice lacking FGFR1 and 2 in
keratinocytes [7] were used for migration studies. The mutant mice had been obtained
by mating of mice with floxed Fgfr1 and Fgfr2 alleles with transgenic mice expressing
Cre recombinase under control of the keratin 5 promoter (K5-Cre mice). Control cells
were from mice with floxed Fgfr1 and Fgfr2 alleles, but lacking Cre recombinase.
Therefore, the control cells express normal levels of both receptors. Keratinocytes were
cultured in defined keratinocyte serum-free medium (dK-SFM) (Invitrogen, Carlsbad, CA)
supplemented with 10 ng/ml EGF and 10-10M cholera toxin and penicillin/streptomycin
(Sigma, Munich, Germany). For scratch wounding assays they were grown to confluency
in the same medium. A scratch was made within the cell layer with a sterile pipette tip.
For live cell imaging we used a Zeiss 200M microscope with a 10x 0.3NA Plan NeoFluar
objective with an incubator box and a motorized stage. Micrographs were taken every 5
minutes.
Simulation of cell migration
A molecular dynamic simulation was used to model the migration of keratinocytes. In
order to reduce the number of model parameters to a minimum, cells were modeled as
spheres of fixed radius and mass , having a short range repulsive interaction of
elastic type and a medium range attractive interaction with other cells. The cells move
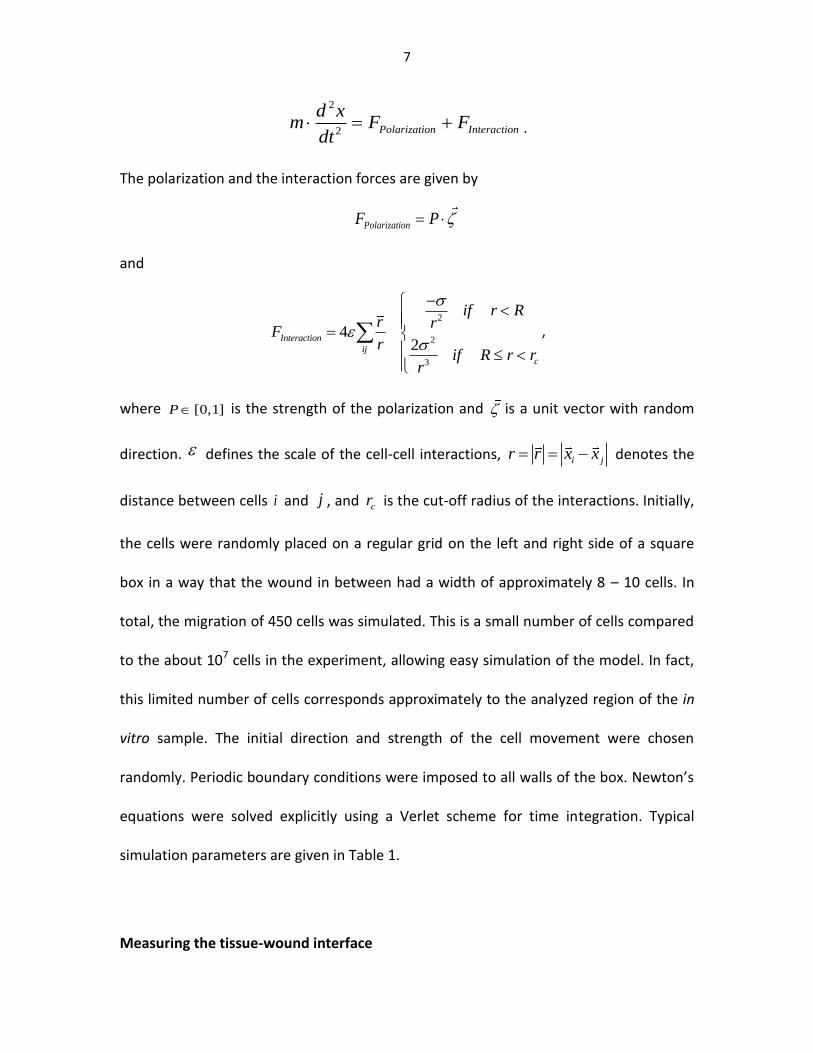
in continuous space following Newton’s equation of motion
7
2
2 Polarization Interaction
d xm F F
dt .
The polarization and the interaction forces are given by
PolarizationF P
and
2
2
3
42
Interaction
ij
c
if r Rr r
Fr
if R r rr
,
where [0,1]P is the strength of the polarization and is a unit vector with random
direction. defines the scale of the cell-cell interactions, i jr r x x denotes the
distance between cells i and j , and cr is the cut-off radius of the interactions. Initially,
the cells were randomly placed on a regular grid on the left and right side of a square
box in a way that the wound in between had a width of approximately 8 – 10 cells. In
total, the migration of 450 cells was simulated. This is a small number of cells compared
to the about 107 cells in the experiment, allowing easy simulation of the model. In fact,
this limited number of cells corresponds approximately to the analyzed region of the in
vitro sample. The initial direction and strength of the cell movement were chosen
randomly. Periodic boundary conditions were imposed to all walls of the box. Newton’s
equations were solved explicitly using a Verlet scheme for time integration. Typical
simulation parameters are given in Table 1.
Measuring the tissue-wound interface
8
Digital image processing
Cell imaging was performed over a time frame of 48 hours. Images with a size of 1024 x
1024 pixels were taken at regular time intervals. In order to measure the dynamics of
cell migration, we analyzed 60 time-lapse images, i.e. one image every 48 minutes, for
each sample. In a first step, each time-lapse image was transformed into binary images,
i.e. an image having only pixel values of “0” (air) and “1” (material), using a gray-level
thresholding. Thereby, we determined for each pixel whether its gray-value is below
(air) or above (cell tissue) a specific threshold. Typically, a threshold of 0.5 was used. In
the second step, the tissue-wound interface (indicated in black in Fig. 1) was
automatically determined by a morphological closing operation [18].
Fractal dimension and roughness
The yardstick method was used [19] to determine the scaling behavior of the tissue-
wound interface, i.e. its fractal dimension fd and roughness . The fractal dimension
is widely used in biology for the characterization of surfaces [20]. Here, the roughness is
defined as the exponent of the scaling law RMS S , where RMS is the normalized
root mean square deviation of the tissue-wound interface measured in a section of size
S.
Wound width
The wound width W is defined as the difference between lq and rq , which are the left-
and the right-hand position of the tissue-wound interface, respectively, the position q

9
of a tissue-wound interface being the average position of the tissue-wound interfaces
calculated from digital image processing.
10
Results
Analysis of tissue-wound interface
We analyzed the migratory behavior of three independent keratinocyte cell lines from
both control (ctr) and FGFR1/R2 knockout (ko) mice using in vitro scratch wounding
assays [7]. The time evolution of the effective fractal dimension of the left-hand and
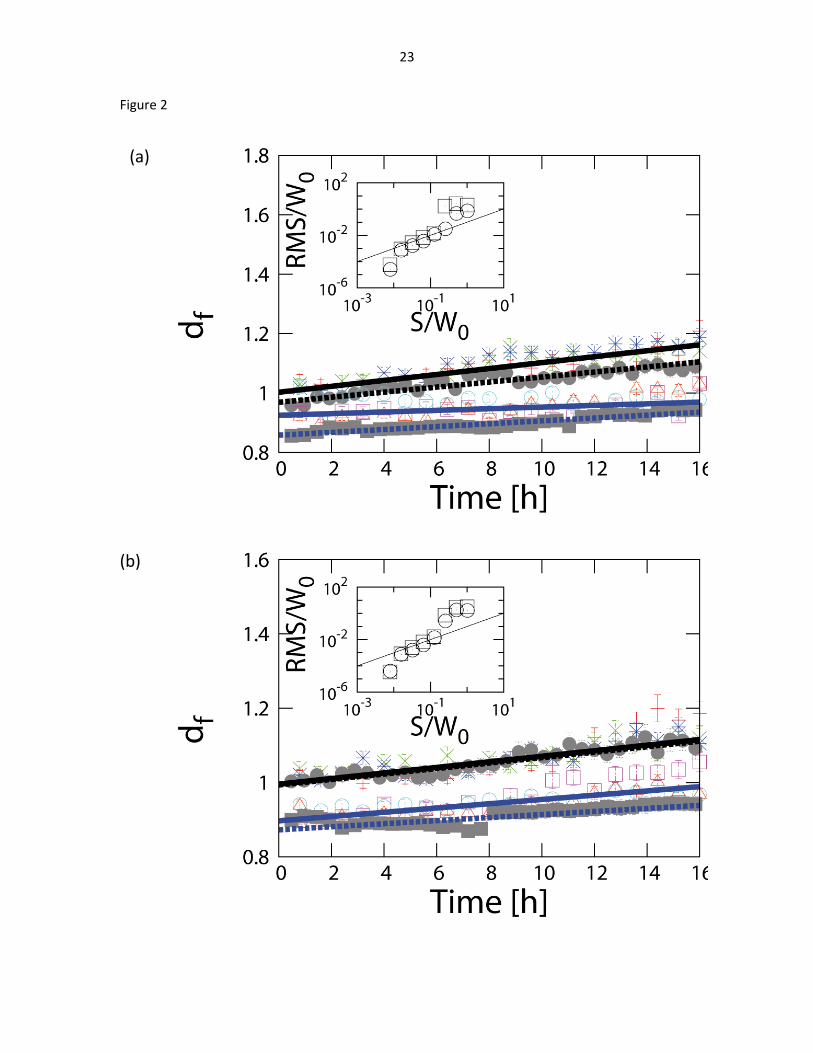
right-hand tissue-wound interface for various samples is shown in Fig. 2a and b,
respectively. We observe that the fractal dimension fd increases in time with all ctr cell
lines, whereas the increase is less pronounced with cells from ko mice. The right- and
left-hand interfaces behave slightly differently for the ko cell lines. The fractal
dimensions of the right-hand interfaces increase, whereas fd of the left-hand
interfaces seem to stay constant. We assume that this difference is random and due to
the limited number of samples that were analyzed. Nevertheless, we were able to
distinguish between ctr and ko cells by the slowed-down evolution of the effective
fractal dimension of the latter.
Analysis of wound closure
For every segmented interface we calculated its average position q in the direction
perpendicular to the initial wound. In a first step we derived from this average position
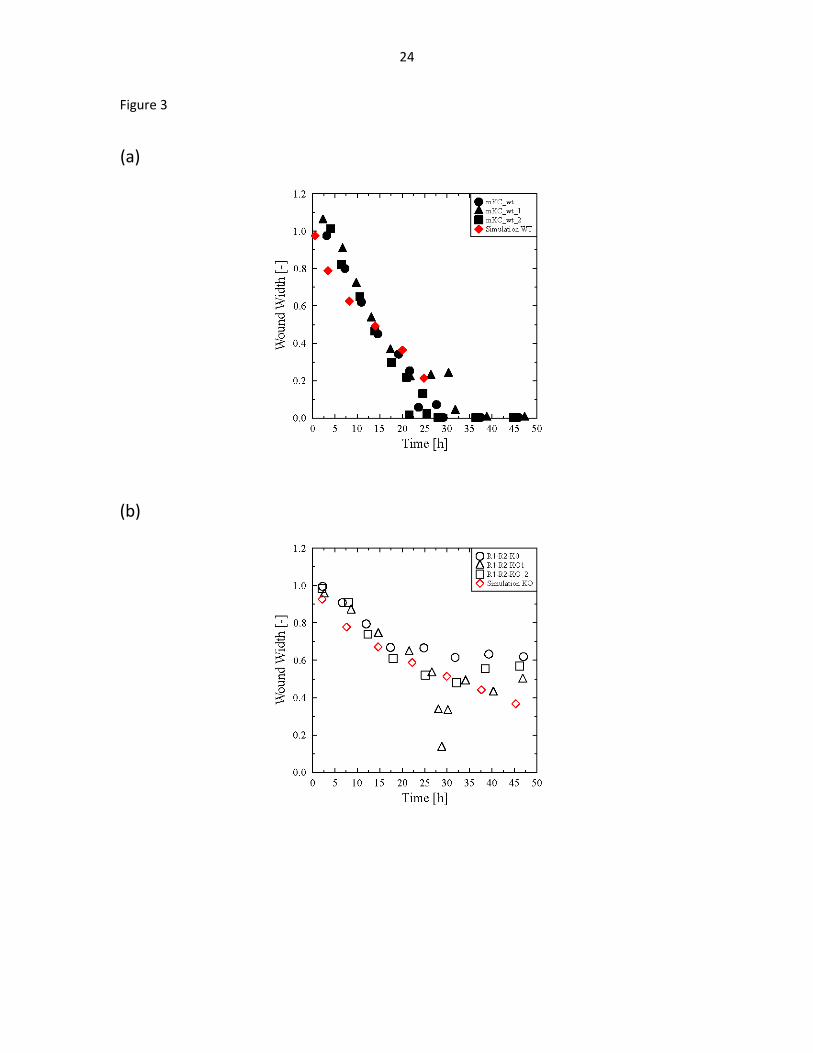
of right- and left-hand interface the wound width W , the time evolution of which is
presented for the various samples in Fig. 3. Again, as in the case of the effective fractal
dimension, we observed that the wound closure of the ko cell lines is delayed compared
11
to the ctr cell lines. While the wounds in the monolayer of ctr cells closed after about 20
hours, they stayed open during the entire experimental period (48 hours) in the
monolayers of the ko cells. We were then able to quantify the dynamics by interpreting
the movement of the tissue-wound interfaces as a diffusive motion. Hence, we defined
an effective diffusion constant ( ) (0) (2 )effD q t q t , where q is the position of the
tissue-wound interface. As shown in Table 2, we obtained effective diffusion constants
for the ko cells that were approximately a factor of ten smaller than for the ctr cells.
Simulation
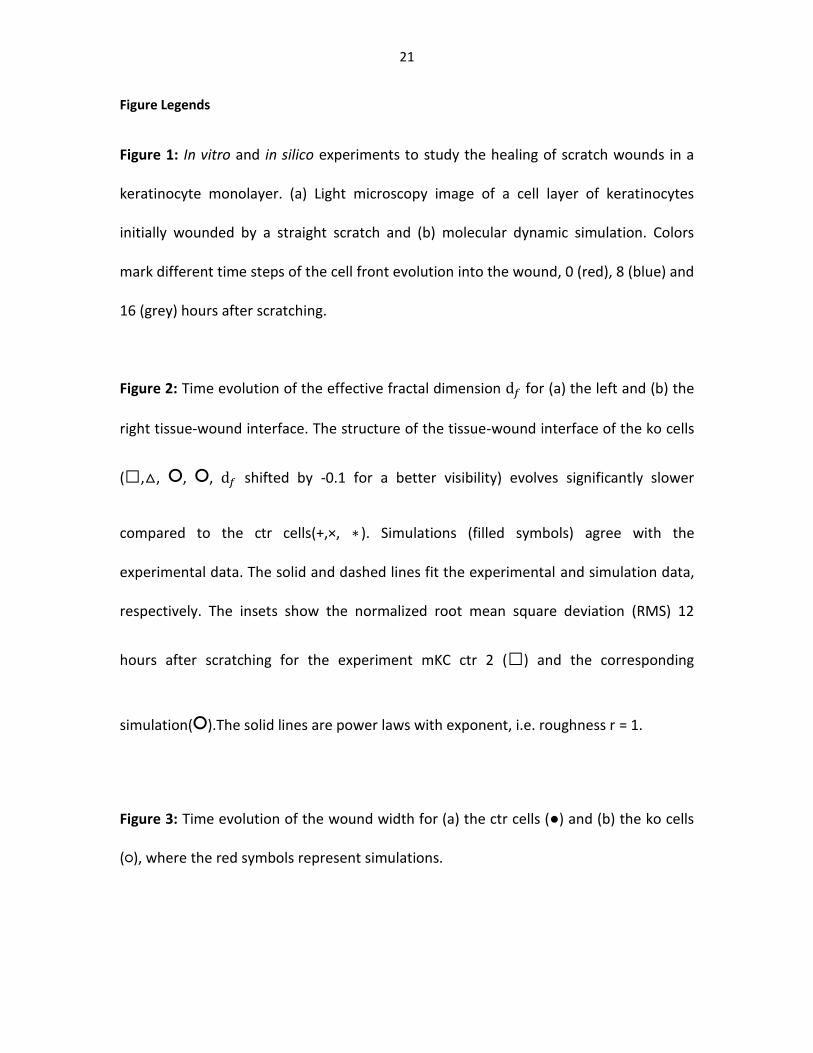
The time evolution of the cell simulation is shown in Fig. 1 for 0, 8 and 16 hours after
scratching. 450 cells were initially placed in the box. Typical simulation parameters for
the ctr cell lines are given in Table 1. The dynamics of the keratinocytes was simulated
by choosing a different polarization of 0.5P (0.18 s) and 0.25P (0.432 s) for the
ctr and ko cells, respectively.
We observed that the evolution of the tissue-wound interface of the simulations
is consistent with the experimental data obtained in cell culture experiments using time-
lapse microscopy. At the beginning of the experiments, the tissue-wound interface is
nearly straight and over time it forms a complex structure. This behavior is reflected in
Fig. 2 by an increase in the fractal dimension with time. The evolution of the
simulations’ fractal dimension is perfectly consistent with the experimental data
obtained by in vitro imaging. Moreover, the parameter P , i.e. the polarization,
12
influences the cells such that a higher polarization leads to a higher mobility of the cells
and a higher fractal dimension.
The time evolution of the wound closure is shown in Figs. 3a and b for the
simulation of ctr and the ko cells, respectively. Consistent with the experimental data,
the wound of the ctr cells was closed, after approximately 20 hours of simulation,
whereas the wound of the ko cells was still open. However, during the first 5 hours,
there was a quantitative difference between the simulation and the microscopy
analysis: In the cell simulation, the wound closure started immediately after injury,
whereas in vitro only little cell movement was observed directly after scratching. This
“reaction time”, which is required for the initiation of cellular and molecular alterations
required for migration, was not included in the cell simulation. Otherwise, all the
following steps were consistent between the experimental and the modeling approach.
13
Discussion
We developed a novel computer simulation model to study keratinocyte migration in
culture. Rather than mimicking all aspects of the system, the aim of our computer model
was to reduce the complex biological system [16]; [17] [21] into a simpler mathematical
model, in order to investigate the effects of factors that are not isolated and directly
adjustable in vitro. Here, we specifically analyzed the effect of cell polarization on
migration, since polarization is important for the onset of migration as well as for
completion of efficient wound healing. The polarization of the cell was modeled by a
single parameter, whereas the interaction between the cells was taken into account by
a potential with both an attractive and a repulsive part. This simple model allowed us to
study the isolated effect of polarization on the development of the wound-tissue
interface and the dynamics of the wound closure.
By comparing simulations with the experimental data, we obtained two major
results: (1) Cell polarization strongly affects both the structure of the wound-tissue
interface and the dynamics of wound closure in a keratinocyte monolayer and (2)
increasing the polarization enhances the roughness of the tissue-wound interface.
Considering the numerical data in detail, it is clear that ( 0) 1fd t as the interfaces are
created by straight scratches. Afterwards, the fractal dimension increases, because of
the observed fingering instabilities. The normalized RMS deviation of the tissue-wound
interface is expected to scale as RMS S as shown in the insets of Fig. 2. A roughness
14
1 and 1 would correspond to a self-similar and a self-affine behavior
respectively. In fact, we observed two regimes. Considering finite-size scaling, the lower
regime indicates 1 (solid lines in the inset). The upper regime and the location of the
crossover result directly from the initial wound width, which is the characteristic length
scale of the system and limits the fluctuations of both tissue-wound interfaces.
The diffusion constant suggests that the cells from ko mice are less motile than cells
from ctr mice. This is consistent with our previous data showing impaired migration of
these cells and a reduced migratory velocity [7]. As the underlying molecular mechanism
we discovered a reduction in the expression of major focal adhesion proteins, resulting
in impaired adhesion and migration [7]. Thus, our strategy allows for the evaluation of
effects of changes in parameters already in silico, thereby reducing the number of
required experiments. This will facilitate future studies that aim to address the
mechanisms underlying various wound healing phenotypes by matching the model to
the phenotype by adjusting the parameters so to fit the experimental findings. Given
the importance of keratinocyte migration for efficient wound healing, this has obvious
biomedical implications, since the consequences of alterations in gene function or of
various external stimuli can be efficiently studied.
Despite this success, our model also has obvious limitations. In particular, the
polarization itself cannot explain the dynamics of the cells directly after scratching. It is
most likely that additional factors affect these early events in culture. These may include
the remodeling of cell-cell and cell-matrix adhesions [22] and the secretion of
15
extracellular matrix molecules and proteinases by keratinocytes [23], which allow the
initiation of scratch wound healing [24]. Therefore, future studies will focus on the
development of a more realistic model, e.g. using a viscoelastic material for the whole
cell such as the Voigt model or the homogenous standard linear solid model [25].
Including parameters for cell-cell adhesion and a variable for the presence of freshly
secreted extracellular matrix would increase the quality of the model, but at the same
time increase its complexity. On the other hand, expanding both the experiments and
the model to the third dimension would significantly increase the relevance for in vivo
wound healing.
16
Acknowledgments
We thank Troy Shinbrot for helpful discussion about cell models. This work was
supported by grants from the Swiss National Foundation SNF (No. 205321-121701 to
H.J.H. and 310030_132884 to S.W.) and the European Research Council (ERC) Advanced
Grant 319968-FlowCCS (to H.J.H.).
17
References
1. Martin P (1997) Wound healing--aiming for perfect skin regeneration. Science 276: 75-81.
2. Werner S, Grose R (2003) Regulation of wound healing by growth factors and cytokines. Physiol Rev 83: 835-870.
3. Gurtner GC, Werner S, Barrandon Y, Longaker MT (2008) Wound repair and regeneration. Nature 453: 314-321.
4. Sen CK, Gordillo GM, Roy S, Kirsner R, Lambert L, et al. (2009) Human skin wounds: a major and snowballing threat to public health and the economy. Wound Repair Regen 17: 763-771.
5. Harsha A, Stojadinovic O, Brem H, Sehara-Fujisawa A, Wewer U, et al. (2008) ADAM12: a potential target for the treatment of chronic wounds. J Mol Med (Berl) 86: 961-969.
6. Usui ML, Mansbridge JN, Carter WG, Fujita M, Olerud JE (2008) Keratinocyte migration, proliferation, and differentiation in chronic ulcers from patients with diabetes and normal wounds. J Histochem Cytochem 56: 687-696.
7. Meyer M, Muller AK, Yang J, Moik D, Ponzio G, et al. (2012) FGF receptors 1 and 2 are key regulators of keratinocyte migration in vitro and in wounded skin. J Cell Sci 125: 5690-5701.
8. Muller AK, Meyer M, Werner S (2013) The roles of receptor tyrosine kinases and their ligands in the wound repair process. Semin Cell Dev Biol 23: 963-970.
9. Rosen P, Misfeldt DS (1980) Cell density determines epithelial migration in culture. Proceedings of the National Academy of Sciences of the United States of America 77: 4760-4763.
10. Szabó B, Szöllösi GJ, Gönci B, Zs, Selmeczi D, et al. (2006) Phase transition in the collective migration of tissue cells: Experiment and model. Physical Review E 74: 061908.
11. Grégoire G, Chaté H (2004) Onset of Collective and Cohesive Motion. Physical Review Letters 92: 025702.
12. Chaté H, Ginelli F, Grégoire G, Raynaud F (2008) Collective motion of self-propelled particles interacting without cohesion. Physical Review E 77: 046113.
13. Matsubayashi Y, Razzell W, Martin P (2010) 'White wave' analysis of epithelial scratch wound healing reveals how cells mobilise back from the leading edge in a myosin-II-dependent fashion. J Cell Sci 124: 1017-1021.
14. Poujade M, Grasland-Mongrain E, Hertzog A, Jouanneau J, Chavrier P, et al. (2007) Collective migration of an epithelial monolayer in response to a model wound. Proceedings of the National Academy of Sciences 104: 15988-15993.
15. Ouaknin GY, Bar-Yoseph PZ (2009) Stochastic collective movement of cells and fingering morphology: no maverick cells. Biophysical journal 97: 1811-1821.
16. Nuatro J, Kruse K, Ward R, O'Quinn E, Woerner M, et al. (2007) A Discrete Cell Migration Model. Summer Computer Simulation Conference 2007 (SCSC 2007)
17. Busch H, Camacho-Trullio D, Rogon Z, Breuhahn K, Angel P, et al. (2008) Gene network dynamics controlling keratinocyte migration. Mol Syst Biol 4: 199.
18
18. Gonzalez RC, Woods RE, Eddins SL (2009) Digital Image Processing Using MATLAB: Gatesmark Publishing.
19. Yuan CQ, Li J, Yan XP, Peng Z (2003) The use of the fractal description to characterize engineering surfaces and wear particles. Wear 255: 315-326.
20. Iannaccone PM, Khokha MK (1996) Fractal geometry in biological systems : an analytical approach. Boca Raton, FL: CRC Press. 360 p. p.
21. Arciero JC, Mi Q, Branca MF, Hackam DJ, Swigon D (2010) Continuum model of collective cell migration in wound healing and colony expansion. Biophys J 100: 535-543.
22. Roberts BJ, Pashaj A, Johnson KR, Wahl JK, 3rd (2011) Desmosome dynamics in migrating epithelial cells requires the actin cytoskeleton. Exp Cell Res 317: 2814-2822.
23. Margadant C, Raymond K, Kreft M, Sachs N, Janssen H, et al. (2009) Integrin alpha3beta1 inhibits directional migration and wound re-epithelialization in the skin. J Cell Sci 122: 278-288.
24. Petrie RJ, Doyle AD, Yamada KM (2009) Random versus directionally persistent cell migration. Nat Rev Mol Cell Biol 10: 538-549.
25. Lim CT, Zhou EH, Quek ST (2006) Mechanical models for living cells—a review. Journal of Biomechanics 39: 195-216.
19
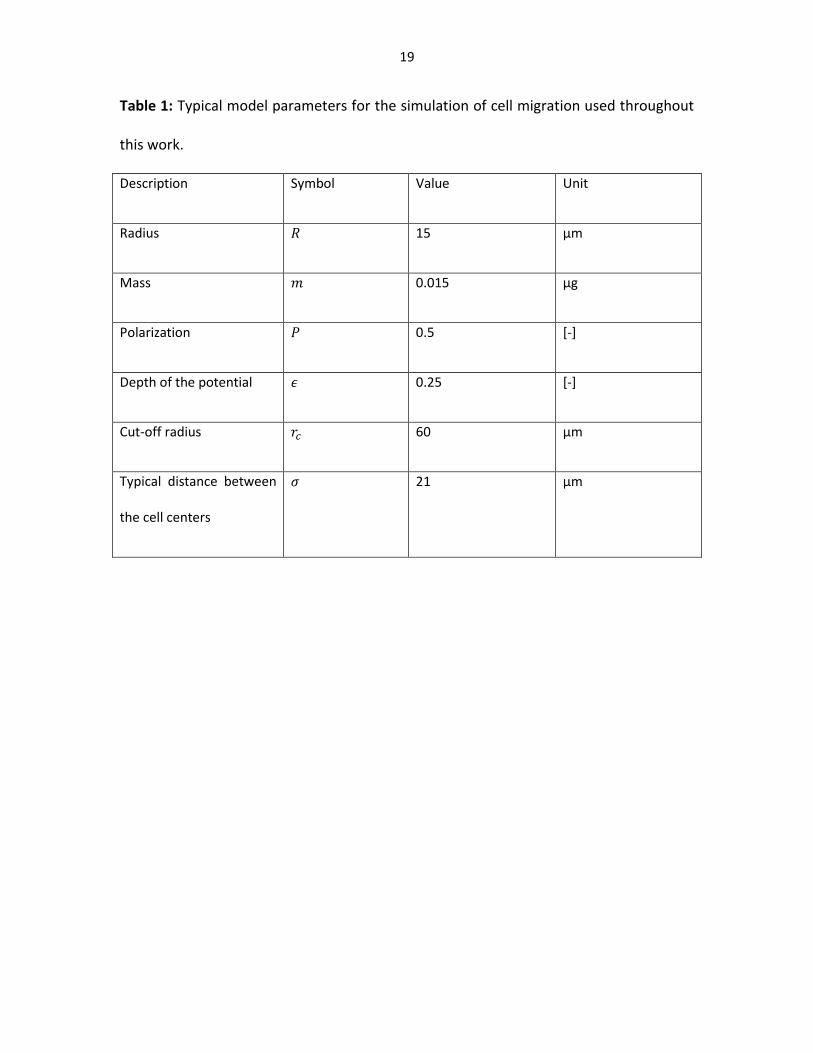
Table 1: Typical model parameters for the simulation of cell migration used throughout
this work.
Description Symbol Value Unit
Radius 15 µm
Mass 0.015 µg
Polarization 0.5 [-]
Depth of the potential 0.25 [-]
Cut-off radius 60 µm
Typical distance between
the cell centers
21 µm
20
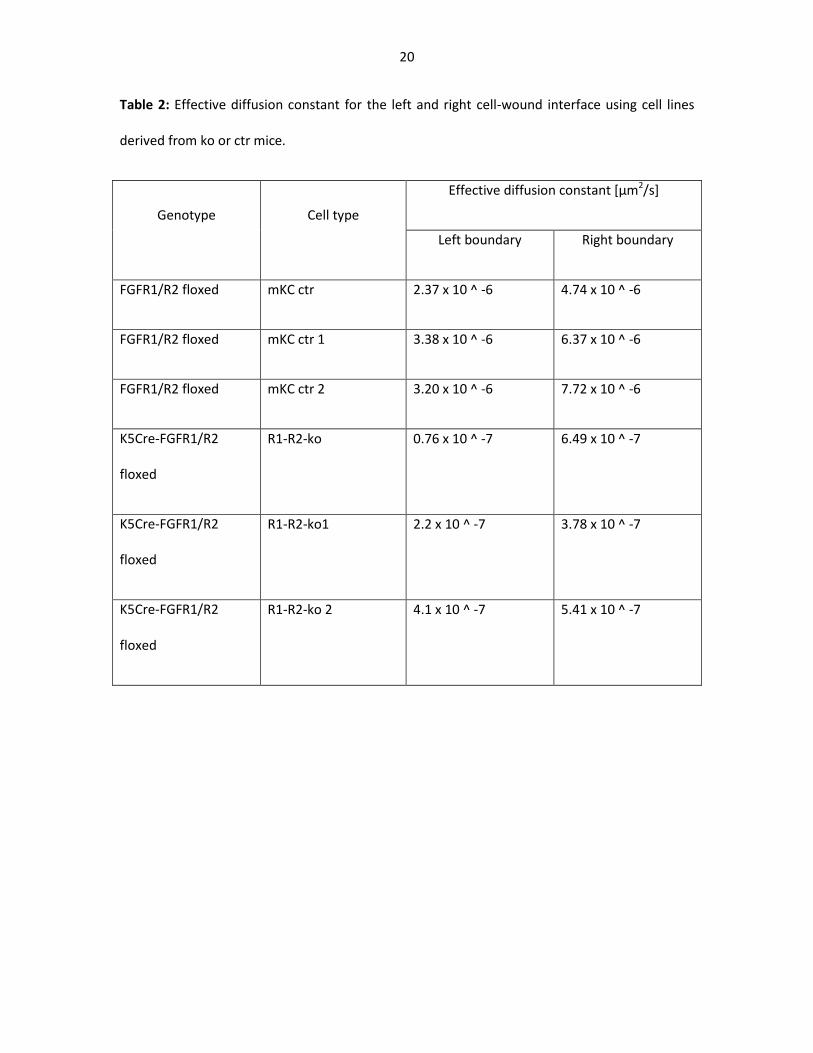
Table 2: Effective diffusion constant for the left and right cell-wound interface using cell lines
derived from ko or ctr mice.
Genotype Cell type
Effective diffusion constant [µm2/s]
Left boundary Right boundary
FGFR1/R2 floxed mKC ctr 2.37 x 10 ^ -6 4.74 x 10 ^ -6
FGFR1/R2 floxed mKC ctr 1 3.38 x 10 ^ -6 6.37 x 10 ^ -6
FGFR1/R2 floxed mKC ctr 2 3.20 x 10 ^ -6 7.72 x 10 ^ -6
K5Cre-FGFR1/R2
floxed
R1-R2-ko 0.76 x 10 ^ -7 6.49 x 10 ^ -7
K5Cre-FGFR1/R2
floxed
R1-R2-ko1 2.2 x 10 ^ -7 3.78 x 10 ^ -7
K5Cre-FGFR1/R2
floxed
R1-R2-ko 2 4.1 x 10 ^ -7 5.41 x 10 ^ -7
21
Figure Legends
Figure 1: In vitro and in silico experiments to study the healing of scratch wounds in a
keratinocyte monolayer. (a) Light microscopy image of a cell layer of keratinocytes
initially wounded by a straight scratch and (b) molecular dynamic simulation. Colors
mark different time steps of the cell front evolution into the wound, 0 (red), 8 (blue) and
16 (grey) hours after scratching.
Figure 2: Time evolution of the effective fractal dimension for (a) the left and (b) the
right tissue-wound interface. The structure of the tissue-wound interface of the ko cells
(□,△, ○, ○, shifted by -0.1 for a better visibility) evolves significantly slower
compared to the ctr cells(+,×, ∗ ). Simulations (filled symbols) agree with the
experimental data. The solid and dashed lines fit the experimental and simulation data,
respectively. The insets show the normalized root mean square deviation (RMS) 12
hours after scratching for the experiment mKC ctr 2 (□) and the corresponding
simulation(○).The solid lines are power laws with exponent, i.e. roughness r = 1.
Figure 3: Time evolution of the wound width for (a) the ctr cells (●) and (b) the ko cells
(○), where the red symbols represent simulations.
22
Figure 1
(a)
(b)
23
Figure 2
(a)
(b)
24
Figure 3
(a)
(b)