Embed Size (px)
Citation preview
6992 Phys. Chem. Chem. Phys., 2011, 13, 6992–7000 This journal is c the Owner Societies 2011
Cite this: Phys. Chem. Chem. Phys., 2011, 13, 6992–7000
A model for the Heyrovsky reaction as the second step
in hydrogen evolution
E. Santos,ab
P. Hindelang,bP. Quaino
bcand W. Schmickler*
b
Received 2nd December 2010, Accepted 22nd February 2011
DOI: 10.1039/c0cp02748k
On a number of electrodes the second step in hydrogen evolution is the reaction of a proton with
an adsorbed hydrogen intermediate to form a molecule, which is also known as the Heyrovsky
reaction. We have developed a model Hamiltonian for this reaction, which for concrete
applications requires extensive calculations on the basis of density-functional theory.
Explicit results are presented for a Ag(111) electrode. The rate-determining step is electron
transfer to the proton that approaches the electrode from the solution. At the saddle point for
this reaction the adsorbed hydrogen atom has moved a little away from the surface in order to
reduce the repulsion of the product molecule. Electron transfer to the proton occurs when the
distance between the two particles is close to the bond distance of the hydrogen molecule.
1. Introduction
Hydrogen evolution on metal electrodes from acid solutions
proceeds in two steps. The first is always the adsorption of an
intermediate hydrogen atom according to: H+ + e� - Had,
which is also known as the Volmer reaction. In recent years
this step has been the focus of a large number of theoretical
studies, e.g. ref. 1–9, many of them based on density-
functional theory (DFT). For the second step there are two
possibilities:
Had + Had - H2 chemical recombination or the
Tafel reaction
H+ + Had + e�-H2 electrochemical recombination
or the Heyrovsky reaction
The chemical recombination can be investigated by standard
DFT and thus poses no particular challenge, particularly since
Gohda et al.10 have recently shown that it is only little affected
by the presence of water on the surface. Therefore, its
energetics will be very similar to the corresponding reaction
in the vacuum, where it is well studied. In contrast, the
electrochemical recombination involves an electron transfer
and desolvatisation of the proton, and therefore cannot occur
in vacuum. Because of the strong solvation of the proton, a
direct simulation by DFT is difficult, if not impossible, and we
are only aware of two studies by the same group where it has
been included.1,2 This extensive numerical calculation was
performed for the Pt(111) surface, where the second step is
probably the chemical recombination.
By their very nature, DFT calculations can only be
performed for specific systems, and since they are wholly
numeric they do not give as much insight as proper theories.
Therefore, in our group we have developed our own approach
for the investigation of electrochemical processes: we set up
model Hamiltonians appropriate to the reaction under study;
these contain a certain number of interaction parameters,
which we obtain by DFT. During the last few years, we have
successfully applied our method to hydrogen evolution, focusing
on the Volmer step.11,12 Here, we will study the electrochemical
recombination; since this involves two hydrogen atoms, it
requires an extension of our model Hamiltonian and more
extended DFT calculations to obtain the interactions. We will
apply our model to hydrogen evolution on Ag(111), because
on this surface the reaction follows the Volmer–Heyrovsky
course.13,14
Before we present our own work, we would like to remind
our readers of the extensive work of the Soviet school15 on
hydrogen evolution of the 1960s and 70s. Of course, this was
too early to treat catalytic effects, but some of the concepts
developed at that time can help to understand qualitative
aspects, as we shall point out below.
2. The model Hamiltonian
The reverse of the Heyrovsky reaction has the nature of a
bond breaking electron transfer, for which Santos et al.16,17
have developed a formalism, the so-called SKS Hamiltonian.
The original formulation was for the case in which the
molecule separates into two equivalent atoms, but it has
recently been extended to the more general case.18 In the
a Faculdad de Matematica, Astronomıa y Fısica, IFEG-CONICET,Universidad Nacional de Cordoba, Cordoba, Argentina
b Institute of Theoretical Chemistry, Ulm University, D-89069 Ulm,Germany. E-mail: [email protected]
c PRELINE, Universidad Nacional del Litoral, Santa Fe, Argentina
PCCP Dynamic Article Links
www.rsc.org/pccp PAPER
Publ
ishe
d on
14
Mar
ch 2
011.
Dow
nloa
ded
by U
nive
rsity
of
Cal
ifor
nia
- D
avis
on
09/0
5/20
14 1
7:09
:09.
View Article Online / Journal Homepage / Table of Contents for this issue
This journal is c the Owner Societies 2011 Phys. Chem. Chem. Phys., 2011, 13, 6992–7000 6993
Heyrovsky reaction, the two hydrogen atoms are not equivalent,
but the situation is a little simpler than that discussed in the
latter article. Firstly, as we shall show below, the reaction
takes place so close to the electrode that spin polarization
plays no role. Therefore, we may neglect spin complications.
Secondly, the hydrogen atom that at first is in the adsorbed
state stays uncharged, so that its interaction with the solvent is
weak and can be neglected.10 These two facts simplify the
model Hamiltonian, which we present below in three parts.
We denote the two hydrogen atoms as Ha and Hb––Ha being
initially adsorbed and Hb approaching in the form of a
proton—and give their 1s orbitals the corresponding indices
a and b. The Hamiltonian for the two atoms interacting with
each other is then:
Hmol = eana + ebnb + bc+a cb + bc+b ca (1)
Here e denotes the energy of an atomic orbital, n is the
occupation operator, and c+ and c are creation and annihilation
operators. The interaction b between the two atoms has been
taken as real, which can be done without loss of generality.
Both atoms interact with the metal, whose electronic states we
label with an index k, which runs both over the sp and the
d band. We write the corresponding interaction terms as:
Hmet ¼Xk
feknk þ ðVa;kcþk ca þ Vb;kc
þk cb þ h:c:Þg ð2Þ
where h.c. stands for the hermitean conjugate.
Finally we specify the terms for the solvent and any
vibrational modes that interact with the electron exchange.
They are represented as a phonon bath that interacts linearly
with the charge on the atoms. Only the approaching proton Hb
interacts with the solvent. Therefore the corresponding
terms are:
Hsol ¼1
2
Xn
�honðq2n þ p2nÞ þ ð1� nbÞXn
�hongnqn ð3Þ
Here n labels the phonon modes, qn and pn are the dimension-
less coordinate and momentum operators, and in the last term
gn is the interaction constant of the charge with the mode n.The interaction of the solvent with the reactant is characterized
by the energy of reorganization l ¼P
n �hong2n=2.
As long as all interacting modes are classical, they can be
represented by a single, effective solvent coordinate q.20,21 It is
convenient to normalize this coordinate in the following way:
when the state of the solvent is represented by q, it would be in
equilibrium with an atom Hb which carries a charge of �q. We
shall use this one-dimensional representation in the following.
The sum of the three terms H = Hmol + Hmet + Hsol
constitutes our model Hamiltonian. The corresponding
Green’s function and the resulting density of states are given
in the Appendix. Here we summarize the important system
parameters. Generally the metal substrate contains both an sp
and a d band. We take the coupling constants to the d band as
independent of the energy and call them Va and Vb. They give
rise to chemisorption functions:
Da(e) = |Va|2prd(e) Db(e) = |Vb|
2prd(e) (4)
where rd(e) is the density of states of the metal d band.
These functions have the meaning of an energy-dependent
broadening of the orbitals. The corresponding level shifts are
obtained by a Hilbert transform:22
LiðeÞ ¼1
pP
ZDiðe0Þe� e0
de0 ð5Þ
where i = a, b, and P denotes the principal part. The sp band
will be represented by a semi-elliptical band of width 12.5 eV
centered at �2.5 eV with respect to the Fermi level EF; we set
EF = 0 throughout this article. Since this band is very wide, its
exact position has no effect on the results. The interaction with
the sp band will thus be represented by:
Disp = Di
0rsp(e) (6)
The explicit form for the semielliptical band is given in ref. 12.
Other important parameters are the energy levels ei of thetwo atoms, and the interaction b. Of the two atoms, the
adsorbed atom Ha never acquires charge, and therefore we
can neglect its interaction with the solvent. In contrast, atom
Hb is initially a proton, and thus interacts strongly with the
solvent. For the corresponding energy of reorganisation we
have assumed a value of l = 3 eV. As detailed in ref. 12, we
assume that its value right at the position of the adsorbed
atom is lower by a factor of two, and that the decay occurs
over a distance of 1.5 A. This decay of the reorganization
energy is also supported by calculations in a continuum
model.23
The technical details of the DFT calculations, which
complement our theory, are given in the Appendix. Here we
note that the calculations for the two hydrogen atoms were
performed with spin polarization to verify that indeed it does
not play a role in the reaction region.
3. Preparatory studies
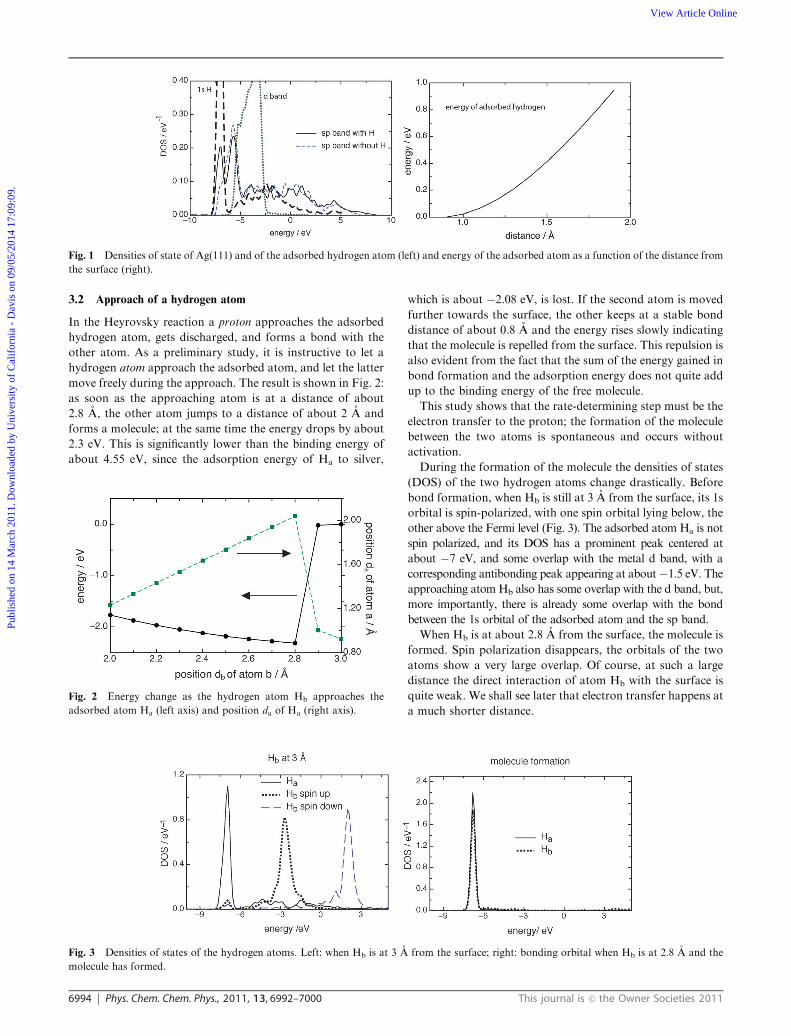
3.1 Bonding of the adsorbed hydrogen atom to Ag(111)
Since the adsorbed hydrogen atom is detached during the
reaction, its bonding to the surface plays an important role.
Therefore, in Fig. 1 we show the densities of states of the
adsorbed H atom and the bands at the surface of Ag(111). The
d band of silver lies well below the Fermi level; it forms a
bonding and an antibonding state with the hydrogen 1s
orbital. Both of them are filled, so that they play no role in
the bonding of the hydrogen atom, a fact that has been known
for some time (see e.g. ref. 24). The d band is practically not
affected by the adsorption, therefore we show its density only
for the free surface. The sp band, however, binds strongly to
the adsorbate; it forms a peak which overlaps with the 1s
orbital of hydrogen. Thus, the sp band does more than just
induce a broadening of the hydrogen orbital.
The equilibrium position of the adsorbed atom is in the fcc
hollow site at a distance of about 0.9 A from the surface.
When the adsorbed atom is pulled away from the surface,
letting it move freely in the direction parallel to the surface, its
energy at first rises slowly, because of the long range of the sp
orbitals (see Fig. 1). This fact will become important when we
consider the Heyrovsky reaction.
Publ
ishe
d on
14
Mar
ch 2
011.
Dow
nloa
ded
by U
nive
rsity
of
Cal
ifor
nia
- D
avis
on
09/0
5/20
14 1
7:09
:09.
View Article Online
6994 Phys. Chem. Chem. Phys., 2011, 13, 6992–7000 This journal is c the Owner Societies 2011
3.2 Approach of a hydrogen atom
In the Heyrovsky reaction a proton approaches the adsorbed
hydrogen atom, gets discharged, and forms a bond with the
other atom. As a preliminary study, it is instructive to let a
hydrogen atom approach the adsorbed atom, and let the latter
move freely during the approach. The result is shown in Fig. 2:
as soon as the approaching atom is at a distance of about
2.8 A, the other atom jumps to a distance of about 2 A and
forms a molecule; at the same time the energy drops by about
2.3 eV. This is significantly lower than the binding energy of
about 4.55 eV, since the adsorption energy of Ha to silver,
which is about �2.08 eV, is lost. If the second atom is moved
further towards the surface, the other keeps at a stable bond
distance of about 0.8 A and the energy rises slowly indicating
that the molecule is repelled from the surface. This repulsion is
also evident from the fact that the sum of the energy gained in
bond formation and the adsorption energy does not quite add
up to the binding energy of the free molecule.
This study shows that the rate-determining step must be the
electron transfer to the proton; the formation of the molecule
between the two atoms is spontaneous and occurs without
activation.
During the formation of the molecule the densities of states
(DOS) of the two hydrogen atoms change drastically. Before
bond formation, when Hb is still at 3 A from the surface, its 1s
orbital is spin-polarized, with one spin orbital lying below, the
other above the Fermi level (Fig. 3). The adsorbed atom Ha is not
spin polarized, and its DOS has a prominent peak centered at
about �7 eV, and some overlap with the metal d band, with a
corresponding antibonding peak appearing at about�1.5 eV. Theapproaching atom Hb also has some overlap with the d band, but,
more importantly, there is already some overlap with the bond
between the 1s orbital of the adsorbed atom and the sp band.
When Hb is at about 2.8 A from the surface, the molecule is
formed. Spin polarization disappears, the orbitals of the two
atoms show a very large overlap. Of course, at such a large
distance the direct interaction of atom Hb with the surface is
quite weak. We shall see later that electron transfer happens at
a much shorter distance.
Fig. 2 Energy change as the hydrogen atom Hb approaches the
adsorbed atom Ha (left axis) and position da of Ha (right axis).
Fig. 1 Densities of state of Ag(111) and of the adsorbed hydrogen atom (left) and energy of the adsorbed atom as a function of the distance from
the surface (right).
Fig. 3 Densities of states of the hydrogen atoms. Left: when Hb is at 3 A from the surface; right: bonding orbital when Hb is at 2.8 A and the
molecule has formed.
Publ
ishe
d on
14
Mar
ch 2
011.
Dow
nloa
ded
by U
nive
rsity
of
Cal
ifor
nia
- D
avis
on
09/0
5/20
14 1
7:09
:09.
View Article Online
This journal is c the Owner Societies 2011 Phys. Chem. Chem. Phys., 2011, 13, 6992–7000 6995
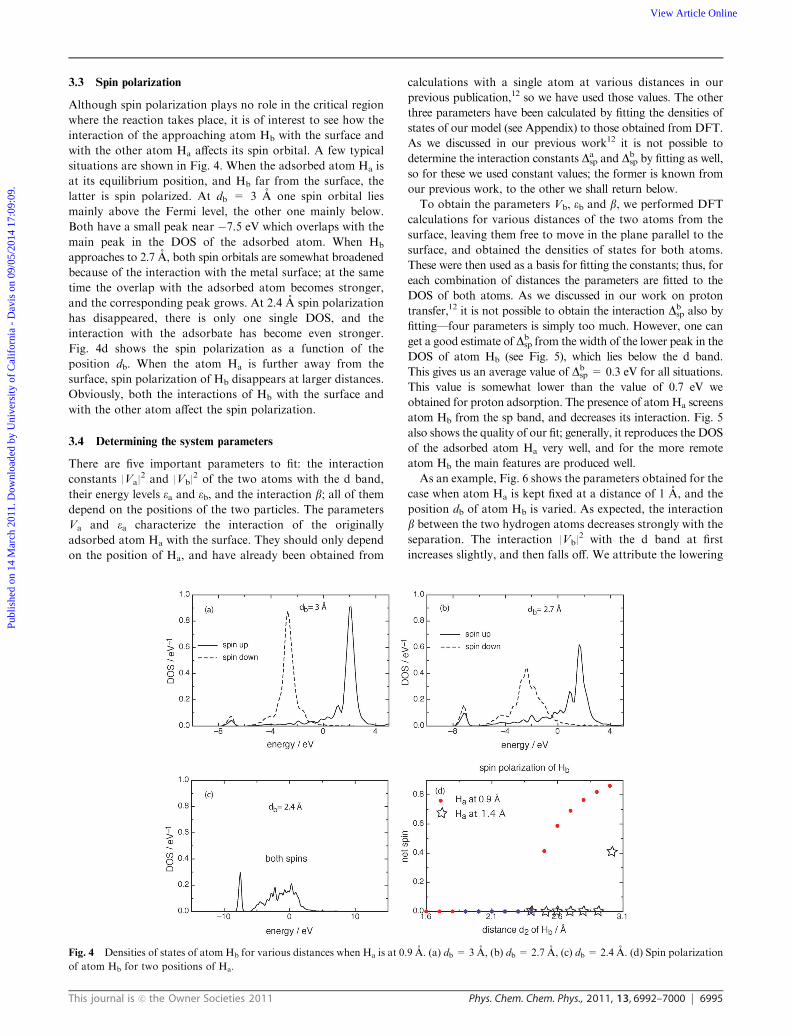
3.3 Spin polarization
Although spin polarization plays no role in the critical region
where the reaction takes place, it is of interest to see how the
interaction of the approaching atom Hb with the surface and
with the other atom Ha affects its spin orbital. A few typical
situations are shown in Fig. 4. When the adsorbed atom Ha is
at its equilibrium position, and Hb far from the surface, the
latter is spin polarized. At db = 3 A one spin orbital lies
mainly above the Fermi level, the other one mainly below.
Both have a small peak near �7.5 eV which overlaps with the
main peak in the DOS of the adsorbed atom. When Hb
approaches to 2.7 A, both spin orbitals are somewhat broadened
because of the interaction with the metal surface; at the same
time the overlap with the adsorbed atom becomes stronger,
and the corresponding peak grows. At 2.4 A spin polarization
has disappeared, there is only one single DOS, and the
interaction with the adsorbate has become even stronger.
Fig. 4d shows the spin polarization as a function of the
position db. When the atom Ha is further away from the
surface, spin polarization of Hb disappears at larger distances.
Obviously, both the interactions of Hb with the surface and
with the other atom affect the spin polarization.
3.4 Determining the system parameters
There are five important parameters to fit: the interaction
constants |Va|2 and |Vb|
2 of the two atoms with the d band,
their energy levels ea and eb, and the interaction b; all of themdepend on the positions of the two particles. The parameters
Va and ea characterize the interaction of the originally
adsorbed atom Ha with the surface. They should only depend
on the position of Ha, and have already been obtained from
calculations with a single atom at various distances in our
previous publication,12 so we have used those values. The other
three parameters have been calculated by fitting the densities of
states of our model (see Appendix) to those obtained from DFT.
As we discussed in our previous work12 it is not possible to
determine the interaction constants Dasp and Db
sp by fitting as well,
so for these we used constant values; the former is known from
our previous work, to the other we shall return below.
To obtain the parameters Vb, eb and b, we performed DFT
calculations for various distances of the two atoms from the
surface, leaving them free to move in the plane parallel to the
surface, and obtained the densities of states for both atoms.
These were then used as a basis for fitting the constants; thus, for
each combination of distances the parameters are fitted to the
DOS of both atoms. As we discussed in our work on proton
transfer,12 it is not possible to obtain the interaction Dbsp also by
fitting—four parameters is simply too much. However, one can
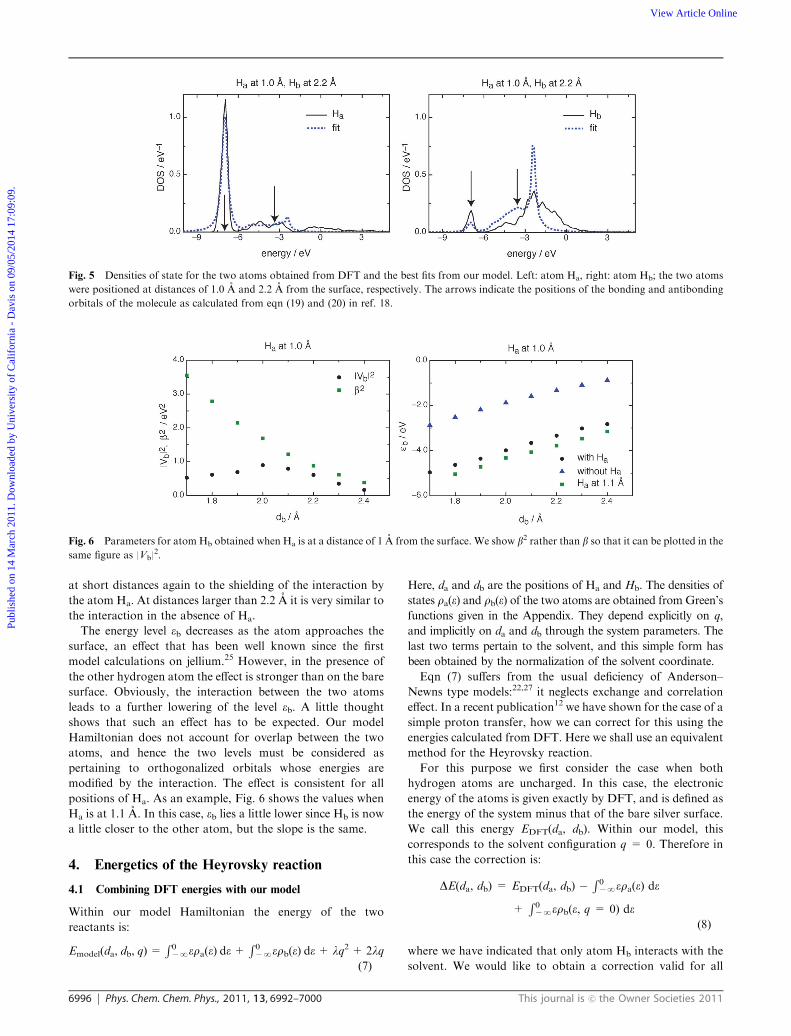
get a good estimate of Dbsp from the width of the lower peak in the
DOS of atom Hb (see Fig. 5), which lies below the d band.
This gives us an average value of Dbsp = 0.3 eV for all situations.
This value is somewhat lower than the value of 0.7 eV we
obtained for proton adsorption. The presence of atomHa screens
atom Hb from the sp band, and decreases its interaction. Fig. 5
also shows the quality of our fit; generally, it reproduces the DOS
of the adsorbed atom Ha very well, and for the more remote
atom Hb the main features are produced well.
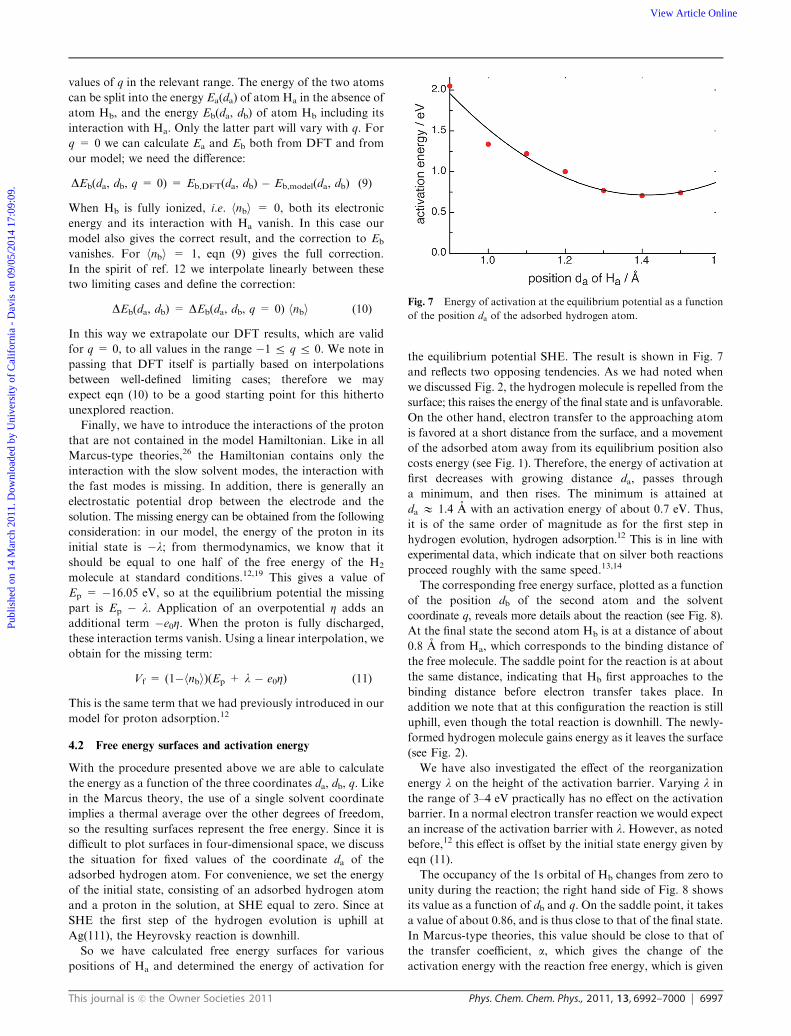
As an example, Fig. 6 shows the parameters obtained for the
case when atom Ha is kept fixed at a distance of 1 A, and the
position db of atom Hb is varied. As expected, the interaction
b between the two hydrogen atoms decreases strongly with the
separation. The interaction |Vb|2 with the d band at first
increases slightly, and then falls off. We attribute the lowering
Fig. 4 Densities of states of atom Hb for various distances when Ha is at 0.9 A. (a) db = 3 A, (b) db = 2.7 A, (c) db = 2.4 A. (d) Spin polarization
of atom Hb for two positions of Ha.
Publ
ishe
d on
14
Mar
ch 2
011.
Dow
nloa
ded
by U
nive
rsity
of
Cal
ifor
nia
- D
avis
on
09/0
5/20
14 1
7:09
:09.
View Article Online
6996 Phys. Chem. Chem. Phys., 2011, 13, 6992–7000 This journal is c the Owner Societies 2011
at short distances again to the shielding of the interaction by
the atom Ha. At distances larger than 2.2 A it is very similar to
the interaction in the absence of Ha.
The energy level eb decreases as the atom approaches the
surface, an effect that has been well known since the first
model calculations on jellium.25 However, in the presence of
the other hydrogen atom the effect is stronger than on the bare
surface. Obviously, the interaction between the two atoms
leads to a further lowering of the level eb. A little thought
shows that such an effect has to be expected. Our model
Hamiltonian does not account for overlap between the two
atoms, and hence the two levels must be considered as
pertaining to orthogonalized orbitals whose energies are
modified by the interaction. The effect is consistent for all
positions of Ha. As an example, Fig. 6 shows the values when
Ha is at 1.1 A. In this case, eb lies a little lower since Hb is now
a little closer to the other atom, but the slope is the same.
4. Energetics of the Heyrovsky reaction
4.1 Combining DFT energies with our model
Within our model Hamiltonian the energy of the two
reactants is:
Emodel(da, db, q) =R0�Nera(e) de+
R0�Nerb(e) de+ lq2 + 2lq
(7)
Here, da and db are the positions of Ha and Hb. The densities of
states ra(e) and rb(e) of the two atoms are obtained from Green’s
functions given in the Appendix. They depend explicitly on q,
and implicitly on da and db through the system parameters. The
last two terms pertain to the solvent, and this simple form has
been obtained by the normalization of the solvent coordinate.
Eqn (7) suffers from the usual deficiency of Anderson–
Newns type models:22,27 it neglects exchange and correlation
effect. In a recent publication12 we have shown for the case of a
simple proton transfer, how we can correct for this using the
energies calculated from DFT. Here we shall use an equivalent
method for the Heyrovsky reaction.
For this purpose we first consider the case when both
hydrogen atoms are uncharged. In this case, the electronic
energy of the atoms is given exactly by DFT, and is defined as
the energy of the system minus that of the bare silver surface.
We call this energy EDFT(da, db). Within our model, this
corresponds to the solvent configuration q = 0. Therefore in
this case the correction is:
DE(da, db) = EDFT(da, db) �R0�Nera(e) de
+R0�Nerb(e, q = 0) de
(8)
where we have indicated that only atom Hb interacts with the
solvent. We would like to obtain a correction valid for all
Fig. 6 Parameters for atom Hb obtained when Ha is at a distance of 1 A from the surface. We show b2 rather than b so that it can be plotted in the
same figure as |Vb|2.
Fig. 5 Densities of state for the two atoms obtained from DFT and the best fits from our model. Left: atom Ha, right: atom Hb; the two atoms
were positioned at distances of 1.0 A and 2.2 A from the surface, respectively. The arrows indicate the positions of the bonding and antibonding
orbitals of the molecule as calculated from eqn (19) and (20) in ref. 18.
Publ
ishe
d on
14
Mar
ch 2
011.
Dow
nloa
ded
by U
nive
rsity
of
Cal
ifor
nia
- D
avis
on
09/0
5/20
14 1
7:09
:09.
View Article Online
This journal is c the Owner Societies 2011 Phys. Chem. Chem. Phys., 2011, 13, 6992–7000 6997
values of q in the relevant range. The energy of the two atoms
can be split into the energy Ea(da) of atom Ha in the absence of
atom Hb, and the energy Eb(da, db) of atom Hb including its
interaction with Ha. Only the latter part will vary with q. For
q = 0 we can calculate Ea and Eb both from DFT and from
our model; we need the difference:
DEb(da, db, q = 0) = Eb,DFT(da, db) � Eb,model(da, db) (9)
When Hb is fully ionized, i.e. hnbi = 0, both its electronic
energy and its interaction with Ha vanish. In this case our
model also gives the correct result, and the correction to Eb
vanishes. For hnbi = 1, eqn (9) gives the full correction.
In the spirit of ref. 12 we interpolate linearly between these
two limiting cases and define the correction:
DEb(da, db) = DEb(da, db, q = 0) hnbi (10)
In this way we extrapolate our DFT results, which are valid
for q = 0, to all values in the range �1 r q r 0. We note in
passing that DFT itself is partially based on interpolations
between well-defined limiting cases; therefore we may
expect eqn (10) to be a good starting point for this hitherto
unexplored reaction.
Finally, we have to introduce the interactions of the proton
that are not contained in the model Hamiltonian. Like in all
Marcus-type theories,26 the Hamiltonian contains only the
interaction with the slow solvent modes, the interaction with
the fast modes is missing. In addition, there is generally an
electrostatic potential drop between the electrode and the
solution. The missing energy can be obtained from the following
consideration: in our model, the energy of the proton in its
initial state is �l; from thermodynamics, we know that it
should be equal to one half of the free energy of the H2
molecule at standard conditions.12,19 This gives a value of
Ep = �16.05 eV, so at the equilibrium potential the missing
part is Ep � l. Application of an overpotential Z adds an
additional term �e0Z. When the proton is fully discharged,
these interaction terms vanish. Using a linear interpolation, we
obtain for the missing term:
Vf = (1�hnbi)(Ep + l � e0Z) (11)
This is the same term that we had previously introduced in our
model for proton adsorption.12
4.2 Free energy surfaces and activation energy
With the procedure presented above we are able to calculate
the energy as a function of the three coordinates da, db, q. Like
in the Marcus theory, the use of a single solvent coordinate
implies a thermal average over the other degrees of freedom,
so the resulting surfaces represent the free energy. Since it is
difficult to plot surfaces in four-dimensional space, we discuss
the situation for fixed values of the coordinate da of the
adsorbed hydrogen atom. For convenience, we set the energy
of the initial state, consisting of an adsorbed hydrogen atom
and a proton in the solution, at SHE equal to zero. Since at
SHE the first step of the hydrogen evolution is uphill at
Ag(111), the Heyrovsky reaction is downhill.
So we have calculated free energy surfaces for various
positions of Ha and determined the energy of activation for
the equilibrium potential SHE. The result is shown in Fig. 7
and reflects two opposing tendencies. As we had noted when
we discussed Fig. 2, the hydrogen molecule is repelled from the
surface; this raises the energy of the final state and is unfavorable.
On the other hand, electron transfer to the approaching atom
is favored at a short distance from the surface, and a movement
of the adsorbed atom away from its equilibrium position also
costs energy (see Fig. 1). Therefore, the energy of activation at
first decreases with growing distance da, passes through
a minimum, and then rises. The minimum is attained at
da E 1.4 A with an activation energy of about 0.7 eV. Thus,
it is of the same order of magnitude as for the first step in
hydrogen evolution, hydrogen adsorption.12 This is in line with
experimental data, which indicate that on silver both reactions
proceed roughly with the same speed.13,14
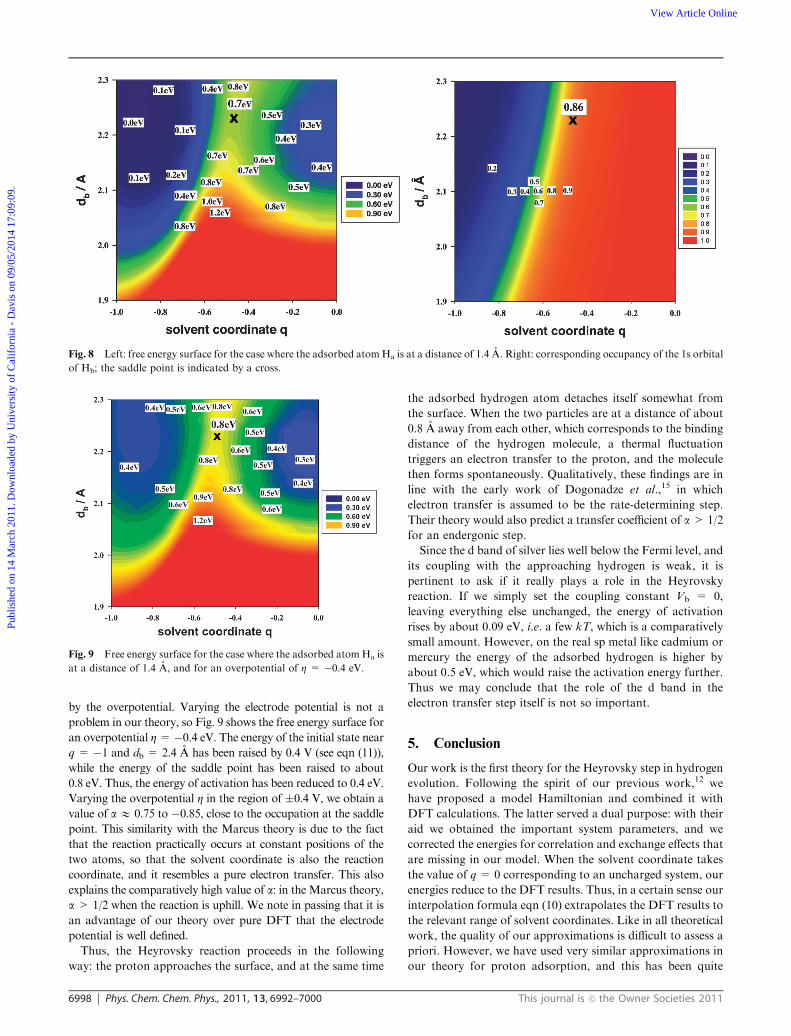
The corresponding free energy surface, plotted as a function
of the position db of the second atom and the solvent
coordinate q, reveals more details about the reaction (see Fig. 8).
At the final state the second atom Hb is at a distance of about
0.8 A from Ha, which corresponds to the binding distance of
the free molecule. The saddle point for the reaction is at about
the same distance, indicating that Hb first approaches to the
binding distance before electron transfer takes place. In
addition we note that at this configuration the reaction is still
uphill, even though the total reaction is downhill. The newly-
formed hydrogen molecule gains energy as it leaves the surface
(see Fig. 2).
We have also investigated the effect of the reorganization
energy l on the height of the activation barrier. Varying l in
the range of 3–4 eV practically has no effect on the activation
barrier. In a normal electron transfer reaction we would expect
an increase of the activation barrier with l. However, as noted
before,12 this effect is offset by the initial state energy given by
eqn (11).
The occupancy of the 1s orbital of Hb changes from zero to
unity during the reaction; the right hand side of Fig. 8 shows
its value as a function of db and q. On the saddle point, it takes
a value of about 0.86, and is thus close to that of the final state.
In Marcus-type theories, this value should be close to that of
the transfer coefficient, a, which gives the change of the
activation energy with the reaction free energy, which is given
Fig. 7 Energy of activation at the equilibrium potential as a function
of the position da of the adsorbed hydrogen atom.
Publ
ishe
d on
14
Mar
ch 2
011.
Dow
nloa
ded
by U
nive
rsity
of
Cal
ifor
nia
- D
avis
on
09/0
5/20
14 1
7:09
:09.
View Article Online
6998 Phys. Chem. Chem. Phys., 2011, 13, 6992–7000 This journal is c the Owner Societies 2011
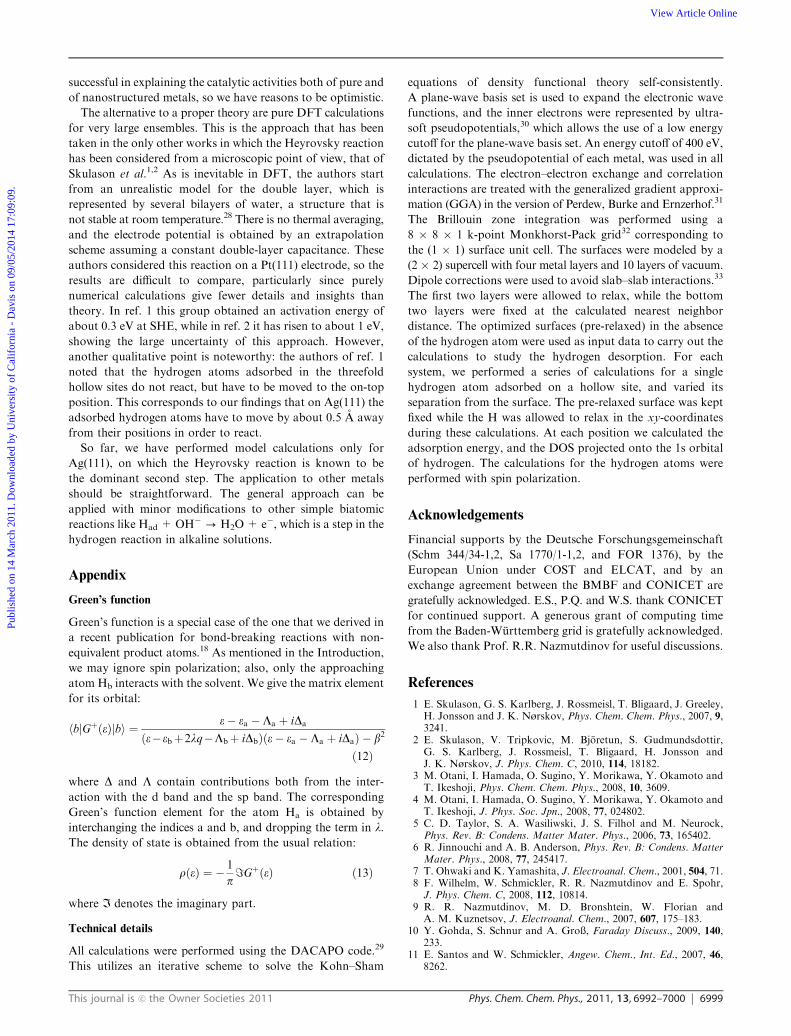
by the overpotential. Varying the electrode potential is not a
problem in our theory, so Fig. 9 shows the free energy surface for
an overpotential Z=�0.4 eV. The energy of the initial state nearq = �1 and db = 2.4 A has been raised by 0.4 V (see eqn (11)),
while the energy of the saddle point has been raised to about
0.8 eV. Thus, the energy of activation has been reduced to 0.4 eV.
Varying the overpotential Z in the region of �0.4 V, we obtain a
value of aE 0.75 to �0.85, close to the occupation at the saddle
point. This similarity with the Marcus theory is due to the fact
that the reaction practically occurs at constant positions of the
two atoms, so that the solvent coordinate is also the reaction
coordinate, and it resembles a pure electron transfer. This also
explains the comparatively high value of a: in the Marcus theory,
a > 1/2 when the reaction is uphill. We note in passing that it is
an advantage of our theory over pure DFT that the electrode
potential is well defined.
Thus, the Heyrovsky reaction proceeds in the following
way: the proton approaches the surface, and at the same time
the adsorbed hydrogen atom detaches itself somewhat from
the surface. When the two particles are at a distance of about
0.8 A away from each other, which corresponds to the binding
distance of the hydrogen molecule, a thermal fluctuation
triggers an electron transfer to the proton, and the molecule
then forms spontaneously. Qualitatively, these findings are in
line with the early work of Dogonadze et al.,15 in which
electron transfer is assumed to be the rate-determining step.
Their theory would also predict a transfer coefficient of a> 1/2
for an endergonic step.
Since the d band of silver lies well below the Fermi level, and
its coupling with the approaching hydrogen is weak, it is
pertinent to ask if it really plays a role in the Heyrovsky
reaction. If we simply set the coupling constant Vb = 0,
leaving everything else unchanged, the energy of activation
rises by about 0.09 eV, i.e. a few kT, which is a comparatively
small amount. However, on the real sp metal like cadmium or
mercury the energy of the adsorbed hydrogen is higher by
about 0.5 eV, which would raise the activation energy further.
Thus we may conclude that the role of the d band in the
electron transfer step itself is not so important.
5. Conclusion
Our work is the first theory for the Heyrovsky step in hydrogen
evolution. Following the spirit of our previous work,12 we
have proposed a model Hamiltonian and combined it with
DFT calculations. The latter served a dual purpose: with their
aid we obtained the important system parameters, and we
corrected the energies for correlation and exchange effects that
are missing in our model. When the solvent coordinate takes
the value of q = 0 corresponding to an uncharged system, our
energies reduce to the DFT results. Thus, in a certain sense our
interpolation formula eqn (10) extrapolates the DFT results to
the relevant range of solvent coordinates. Like in all theoretical
work, the quality of our approximations is difficult to assess a
priori. However, we have used very similar approximations in
our theory for proton adsorption, and this has been quite
Fig. 8 Left: free energy surface for the case where the adsorbed atomHa is at a distance of 1.4 A. Right: corresponding occupancy of the 1s orbital
of Hb; the saddle point is indicated by a cross.
Fig. 9 Free energy surface for the case where the adsorbed atomHa is
at a distance of 1.4 A, and for an overpotential of Z = �0.4 eV.
Publ
ishe
d on
14
Mar
ch 2
011.
Dow
nloa
ded
by U
nive
rsity
of
Cal
ifor
nia
- D
avis
on
09/0
5/20
14 1
7:09
:09.
View Article Online
This journal is c the Owner Societies 2011 Phys. Chem. Chem. Phys., 2011, 13, 6992–7000 6999
successful in explaining the catalytic activities both of pure and
of nanostructured metals, so we have reasons to be optimistic.
The alternative to a proper theory are pure DFT calculations
for very large ensembles. This is the approach that has been
taken in the only other works in which the Heyrovsky reaction
has been considered from a microscopic point of view, that of
Skulason et al.1,2 As is inevitable in DFT, the authors start
from an unrealistic model for the double layer, which is
represented by several bilayers of water, a structure that is
not stable at room temperature.28 There is no thermal averaging,
and the electrode potential is obtained by an extrapolation
scheme assuming a constant double-layer capacitance. These
authors considered this reaction on a Pt(111) electrode, so the
results are difficult to compare, particularly since purely
numerical calculations give fewer details and insights than
theory. In ref. 1 this group obtained an activation energy of
about 0.3 eV at SHE, while in ref. 2 it has risen to about 1 eV,
showing the large uncertainty of this approach. However,
another qualitative point is noteworthy: the authors of ref. 1
noted that the hydrogen atoms adsorbed in the threefold
hollow sites do not react, but have to be moved to the on-top
position. This corresponds to our findings that on Ag(111) the
adsorbed hydrogen atoms have to move by about 0.5 A away
from their positions in order to react.
So far, we have performed model calculations only for
Ag(111), on which the Heyrovsky reaction is known to be
the dominant second step. The application to other metals
should be straightforward. The general approach can be
applied with minor modifications to other simple biatomic
reactions like Had + OH�-H2O+ e�, which is a step in the
hydrogen reaction in alkaline solutions.
Appendix
Green’s function
Green’s function is a special case of the one that we derived in
a recent publication for bond-breaking reactions with non-
equivalent product atoms.18 As mentioned in the Introduction,
we may ignore spin polarization; also, only the approaching
atom Hb interacts with the solvent. We give the matrix element
for its orbital:
hbjGþðeÞjbi ¼ e� ea � La þ iDa
ðe� ebþ2lq�Lbþ iDbÞðe� ea � La þ iDaÞ � b2
ð12Þ
where D and L contain contributions both from the inter-
action with the d band and the sp band. The corresponding
Green’s function element for the atom Ha is obtained by
interchanging the indices a and b, and dropping the term in l.The density of state is obtained from the usual relation:
rðeÞ ¼ � 1
p=GþðeÞ ð13Þ
where I denotes the imaginary part.
Technical details
All calculations were performed using the DACAPO code.29
This utilizes an iterative scheme to solve the Kohn–Sham
equations of density functional theory self-consistently.
A plane-wave basis set is used to expand the electronic wave
functions, and the inner electrons were represented by ultra-
soft pseudopotentials,30 which allows the use of a low energy
cutoff for the plane-wave basis set. An energy cutoff of 400 eV,
dictated by the pseudopotential of each metal, was used in all
calculations. The electron–electron exchange and correlation
interactions are treated with the generalized gradient approxi-
mation (GGA) in the version of Perdew, Burke and Ernzerhof.31
The Brillouin zone integration was performed using a
8 � 8 � 1 k-point Monkhorst-Pack grid32 corresponding to
the (1 � 1) surface unit cell. The surfaces were modeled by a
(2 � 2) supercell with four metal layers and 10 layers of vacuum.
Dipole corrections were used to avoid slab–slab interactions.33
The first two layers were allowed to relax, while the bottom
two layers were fixed at the calculated nearest neighbor
distance. The optimized surfaces (pre-relaxed) in the absence
of the hydrogen atom were used as input data to carry out the
calculations to study the hydrogen desorption. For each
system, we performed a series of calculations for a single
hydrogen atom adsorbed on a hollow site, and varied its
separation from the surface. The pre-relaxed surface was kept
fixed while the H was allowed to relax in the xy-coordinates
during these calculations. At each position we calculated the
adsorption energy, and the DOS projected onto the 1s orbital
of hydrogen. The calculations for the hydrogen atoms were
performed with spin polarization.
Acknowledgements
Financial supports by the Deutsche Forschungsgemeinschaft
(Schm 344/34-1,2, Sa 1770/1-1,2, and FOR 1376), by the
European Union under COST and ELCAT, and by an
exchange agreement between the BMBF and CONICET are
gratefully acknowledged. E.S., P.Q. and W.S. thank CONICET
for continued support. A generous grant of computing time
from the Baden-Wurttemberg grid is gratefully acknowledged.
We also thank Prof. R.R. Nazmutdinov for useful discussions.
References
1 E. Skulason, G. S. Karlberg, J. Rossmeisl, T. Bligaard, J. Greeley,H. Jonsson and J. K. Nørskov, Phys. Chem. Chem. Phys., 2007, 9,3241.
2 E. Skulason, V. Tripkovic, M. Bjoretun, S. Gudmundsdottir,G. S. Karlberg, J. Rossmeisl, T. Bligaard, H. Jonsson andJ. K. Nørskov, J. Phys. Chem. C, 2010, 114, 18182.
3 M. Otani, I. Hamada, O. Sugino, Y. Morikawa, Y. Okamoto andT. Ikeshoji, Phys. Chem. Chem. Phys., 2008, 10, 3609.
4 M. Otani, I. Hamada, O. Sugino, Y. Morikawa, Y. Okamoto andT. Ikeshoji, J. Phys. Soc. Jpn., 2008, 77, 024802.
5 C. D. Taylor, S. A. Wasiliwski, J. S. Filhol and M. Neurock,Phys. Rev. B: Condens. Matter Mater. Phys., 2006, 73, 165402.
6 R. Jinnouchi and A. B. Anderson, Phys. Rev. B: Condens. MatterMater. Phys., 2008, 77, 245417.
7 T. Ohwaki and K. Yamashita, J. Electroanal. Chem., 2001, 504, 71.8 F. Wilhelm, W. Schmickler, R. R. Nazmutdinov and E. Spohr,J. Phys. Chem. C, 2008, 112, 10814.
9 R. R. Nazmutdinov, M. D. Bronshtein, W. Florian andA. M. Kuznetsov, J. Electroanal. Chem., 2007, 607, 175–183.
10 Y. Gohda, S. Schnur and A. Groß, Faraday Discuss., 2009, 140,233.
11 E. Santos and W. Schmickler, Angew. Chem., Int. Ed., 2007, 46,8262.
Publ
ishe
d on
14
Mar
ch 2
011.
Dow
nloa
ded
by U
nive
rsity
of
Cal
ifor
nia
- D
avis
on
09/0
5/20
14 1
7:09
:09.
View Article Online
7000 Phys. Chem. Chem. Phys., 2011, 13, 6992–7000 This journal is c the Owner Societies 2011
12 E. Santos, A. Lundin, K. Potting, P. Quaino and W. Schmickler,Phys. Rev. B: Condens. Matter Mater. Phys., 2009, 79, 235436.
13 H. Gerischer and W. Mehl, Ber. Bunsen-Ges. Phys. Chem., 1955,59, 1049.
14 D. Eberhardt, E. Santos and W. Schmickler, J. Electroanal. Chem.,1999, 461, 76; D. Eberhardt, PhD Thesis, Ulm University, 2001.
15 R. R. Dogonadze, A. M. Kuznetsov and V. G. Levich,Electrochim. Acta, 1968, 13, 1025.
16 E. Santos, M. T. M. Koper and W. Schmickler, Chem. Phys. Lett.,2006, 419, 421.
17 E. Santos, M. T. M. Koper and W. Schmickler, Chem. Phys., 2008,344, 195.
18 E. Santos, S. Bartenschlager and W. Schmickler, J. Electroanal.Chem., in press.
19 J. K. Norskøv, T. Bligaard, A. Logadottir, J. R. Kitchin, J. G. Chen,S. Pandelov and U. Stimming, J. Electrochem. Soc., 2005, 152, J23.
20 W. Schmickler, J. Electroanal. Chem., 1986, 204, 31.
21 W. Schmickler and E. Santos, Interfacial Electrochemistry,Springer, Heidelberg, 2nd edn, 2010.
22 D. M. Newns, Phys. Rev., 1969, 178, 1123.23 R. R. Nazmutdinov, private communication.24 B. Hammer and J. K. Nørskov, Nature, 1995, 376, 238.25 N. D. Lang and A. R. Williams, Phys. Rev. B, 1978, 18, 616.26 R. A. Marcus, J. Chem. Phys., 1956, 24, 966.27 P. W. Anderson, Phys. Rev., 1961, 124, 41.28 S. Schnur and A. Groß, New J. Phys., 2010, 409, 157.29 B. Hammer, L. B. Hansen and K. Nørskov, Phys. Rev. B: Condens.
Matter, 1999, 59, 7413; http://www.fysik.dtu.dk/campos.30 D. Vanderbilt, Phys. Rev. B: Condens. Matter, 1990, 41, 7892.31 J. P. Perdew, K. Burke and M. Ernzerhof, Phys. Rev. Lett., 1996,
77, 3865.32 H. J. Monkhorst and J. D. Pack, Phys. Rev. B: Solid State, 1976,
13, 5188.33 L. Bengtsson, Phys. Rev. B: Condens. Matter, 1999, 59, 12301.
Publ
ishe
d on
14
Mar
ch 2
011.
Dow
nloa
ded
by U
nive
rsity
of
Cal
ifor
nia
- D
avis
on
09/0
5/20
14 1
7:09
:09.
View Article Online