Embed Size (px)
Citation preview
By: Chris van de Goor
Supervisor: Dr. Z. Li
Commissioned by:
Prof. Dr. Guido Mul
THE PHOTOCATALYTIC SYNTHESIS (PCS) GROUP
UNIVERSITEIT TWENTE
Influence of temperature and pH on the hydrogen evolution reaction
(HER) on platinum

1
Summary
Hydrogen is an important feedstock for diverse chemical processes. The way it is produced nowadays
is mainly by methane reforming which results in high greenhouse gas emissions. By electrolysing
water with green energy, green hydrogen gas with high purity can be produced. Platinum has proven
to be a good electrocatalyst for the hydrogen evolution reaction (HER) in water electrolysis. However,
the influence of temperature and pH on this reaction and its kinetics on platinum electrodes is not
well defined yet. In this study the influence of temperature and pH on the HER is defined. The
overpotential of the HER decreases with temperature and seems to decrease by using stronger
alkaline solutions. The influence of the temperature can however only be noticed at higher
overpotentials. The reaction mechanism of the HER on platinum could not be identified in this work.

2
Contents Introduction..................................................................................................................................................... 3
Theory ............................................................................................................................................................. 4
The reaction ................................................................................................................................................ 4
Thermodynamics ......................................................................................................................................... 6
The overpotential ........................................................................................................................................ 8
Resistance in the set-up .......................................................................................................................... 8
Mass-transfer limitations ...................................................................................................................... 10
The Tafel plot............................................................................................................................................. 12
Experimental ................................................................................................................................................. 14
The set-up.................................................................................................................................................. 14
The method ............................................................................................................................................... 15
Preparing the solutions ......................................................................................................................... 16
The measurements ................................................................................................................................ 16
Results and Discussion .................................................................................................................................. 17
Results pH measurements ......................................................................................................................... 17
Alkaline solutions ...................................................................................................................................... 20
Acidic solutions .......................................................................................................................................... 22
Temperature dependency ......................................................................................................................... 25
Effect of stirring ......................................................................................................................................... 27
Recommendations ........................................................................................................................................ 28
Conclusion ..................................................................................................................................................... 29
Acknowledgements ....................................................................................................................................... 30
Symbol List .................................................................................................................................................... 31
References ..................................................................................................................................................... 32
Appendix ....................................................................................................................................................... 34
Researchplan ............................................................................................................................................. 34
3
Introduction Hydrogen gas is an important chemical feedstock in modern chemical industry. It is, among other things,
used in petroleum refining, ammonia production and metal refining. The production of hydrogen
nowadays is mainly performed by reforming of natural gas or gasification of coal to syn gas [1], with large
amounts of carbon dioxide as byproduct. Hydrogen gas can be produced cleaner, easier and with higher
purity by water electrolysis. This method of hydrogen refining however only covers 4% of the world
production [2]. The reason for this is the low price of natural gas, compared to the relatively high costs of
electrical energy [3]. As mature as water electrolysis is, much research has been performed to the subject
[4], as well as still is performed [5,6]. With water electrolysis a higher potential is needed to successfully
and efficiently split the stable water molecules into hydrogen and oxygen, this extra potential is called the
overpotential. The main focus nowadays lays in lowering the overpotential of water electrolysis, by
improving the electrolyte [7], the electrodes [6], or gaining more knowledge about the kinetics of the
electrode reactions [8]. Platinum is one of the materials which is a very good electro catalyst for the
hydrogen evolution reaction (HER) in water electrolysis [2]. Because of the high price however it is given
the cold shoulder as to be used as an electrocatalyst. This has resulted in the fact that few information is
available about the temperature and pH dependency of the HER on platinum. To facilitate future studies
to the use of platinum in water electrolyzers, the fundamentals of the HER on platinum will be discussed
in this work.

4
Theory
The reaction Water electrolysis is performed by passing a current between electrodes through an aqueous solution, to
produce hydrogen and oxygen at the electrode surfaces in the presence of an electrolyte. The overall
reaction is as follows;
𝐻2𝑂 ⇋ 𝐻2 + 12⁄ 𝑂2 (1)
This reaction consists of two half reactions, the hydrogen evolution reaction, or HER, where hydrogen is
formed at the cathode, and the oxygen evolution reaction, or OER where oxygen is formed at the anode.
These reactions are different, based on the pH of the solution. This is due to the nature of the active ions
in the reaction. In alkaline solutions the active ion is a hydroxide ion, in acidic solutions the active ion is a
proton. In acidic solutions reactions 2 and 3 occur [9].
4 𝐻+ + 4𝑒−⇋ 2 𝐻2 (2)
2 𝐻2𝑂 ⇋ 𝑂2 + 4 𝐻+ + 4 𝑒− (3)
In alkaline solutions these reactions are slightly different [10], depending on the ions in solution;
4 𝐻2𝑂 + 4 𝑒− ⇋ 2 𝐻2 + 4 𝑂𝐻− (4)
4 𝑂𝐻− ⇋ 2 𝐻2𝑂 + 𝑂2 + 4 𝑒− (5)
In alkaline solutions the proton source are water molecules, which react at the surface to a hydroxide ion,
leaving a hydrogen atom adsorbed to the electrode surface. In acidic solutions, water molecules are the
hydroxide ion source.
The mechanism of this reaction can be well observed from a cyclovoltammogram (CV). In the
cyclovoltammogram of water electrolysis there is a very obvious oxygen desorption peak, and the oxygen
adsorption peak is partly overlapping with the oxygen evolution peak.
Figure 1: This figure contains a cyclovoltammogram for pure water and H2SO4 on Pt micro-disk electrodes. The scanning rate is 80 mV/s. A DHE/PEM system is used as reference electrode. This figure is an edited version of a figure by Wang, Q. [11].

5
In Figure 1 a typical cyclovoltammogram with different reaction steps are given. The cyclic voltammogram
is produced by changing potential at a certain rate increasing up until the desired maximum potential is
reached. Then it will decrease at the same rate but negative until the preferred minimum potential is
reached. By using this technique, different reaction mechanisms can be observed. The different
mechanisms will be described below (reaction 6-11). A common pathway for a cyclovoltammogram for
water electrolysis starts with the adsorption of the oxygen on the electrode, which creates a Pt-O film.
Then through evolution the oxygen gas is released from the electrode. Then, while decreasing the
potential by backward scanning, the Pt-O formed is reduced (the oxygen desorbs). At lower potentials
hydrogen is adsorbed at the electrode (reaction 6, forward) and evolves while further decreasing the
potential. The potential then increases again, the hydrogen is oxidized (reaction 6, backward) and a full
scanning cycle is completed. With this technique the reaction steps of electrochemical reactions can be
well observed.
To achieve a better understanding about the influence of reactor conditions on the overpotential and
efficiency of the cell, one has to take a closer look at the mechanisms of both half reactions. The
mechanism of the hydrogen evolution has three potential reaction steps [12];
𝐻+ + 𝑒− ⇋ 𝐻𝑎𝑑𝑠 Volmer reaction (6)
𝐻+ + 𝐻𝑎𝑑𝑠 + 𝑒− ⇋ 𝐻2 Heyrovsky reaction (7)
2 𝐻𝑎𝑑𝑠 ⇋ 𝐻2 Tafel reaction (8)
These reactions can follow several different pathways on the cathode, most consisting of two reaction
steps, the Volmer-Tafel pathway, the Volmer-Heyrovsky pathway, and the Tafel-Heyrovsky pathway.
Another possibility, mentioned by S.A. Vilekar [8], is a three step pathway consisting of all three reaction
steps simultaneously. In the Tafel-Heyrovsky pathway, the hydrogen gas adsorbs (reaction 8, backward)
on the platinum metal, then it reacts again with protons (reaction 7). The reaction pathway that is
followed depends strongly on the parameters of the electrolysis cell.
Due to the complex nature of the oxygen evolution reaction many pathways for the oxygen evolution
reaction are developed [13]. One of the more generally accepted pathways consists of reactions 9 to 11
[2].
𝑂𝐻− ⇋ 𝑂𝐻𝑎𝑑𝑠 + 𝑒− (9)
𝑂𝐻− + 𝑂𝐻𝑎𝑑𝑠 ⇋ 𝐻2𝑂 + 𝑒− + 𝑂𝑎𝑑𝑠 (10)
2 𝑂𝑎𝑑𝑠 ⇋ 𝑂2 (11)
Due to the complex nature of this reaction, the oxygen evolution reaction rate is often a limiting factor in
water electrolysis. Therefore many research has been performed in the last years to enhance the reaction
rate of the oxygen evolution reaction. A problem with the oxygen evolution reaction is that the electrode
can be oxidized easily at higher currents with non-noble metals which can result in higher resistance and
thus lower efficiency. An excellent catalyst for the oxygen evolution reaction is IrO2 [14], it is proven to be
stable and catalytic at higher temperatures in both acidic and alkaline solutions. Iridium however is an

6
expensive metal, therefore research is performed to using less iridium in electrodes and research to other
metals [15]. Nickel and stainless steel show relatively high stability towards alkaline solutions and exhibit
a large exchange current density [2] and can therefore be used for electrolysis of alkaline solutions [13].
Thermodynamics
Water is only converted into hydrogen and oxygen by electric energy when a certain potential is applied.
The standard potential for this reaction can be derived from the equation 1.
∆𝐺 = −𝑣𝐹𝐸° (1)
∆𝐺 = 𝐺𝑖𝑏𝑏𝑠 𝐹𝑟𝑒𝑒 𝐸𝑛𝑒𝑟𝑔𝑦 (𝐽
𝑚𝑜𝑙)
𝑣 = 𝑁𝑢𝑚𝑏𝑒𝑟 𝑜𝑓 𝑒𝑙𝑒𝑐𝑡𝑟𝑜𝑛𝑠 𝑐𝑜𝑛𝑠𝑢𝑚𝑒𝑑 𝑖𝑛 𝑡ℎ𝑒 𝑟𝑒𝑎𝑐𝑡𝑖𝑜𝑛 (-)
𝐹 = 𝐹𝑎𝑟𝑎𝑑𝑎𝑦 𝑐𝑜𝑛𝑠𝑡𝑎𝑛𝑡 (96485𝐶
𝑚𝑜𝑙)
Using this equation the standard potential at standard conditions can be calculated, for water electrolysis
this is 1.229 V. This value is equal to the combination of the potential for the cathode and anode
reactions. The hydrogen evolution reaction (HER), at standard conditions, has a potential of 0 V. The
oxygen evolution reaction has a potential of -1.229 V. These can be combined with equation 2 into the
standard cell potential;
𝐸𝑐𝑒𝑙𝑙° = 𝐸𝑐𝑎𝑡ℎ𝑜𝑑𝑒
° − 𝐸𝑎𝑛𝑜𝑑𝑒° (2)
𝐸𝑐𝑒𝑙𝑙° = 𝑆𝑡𝑎𝑛𝑑𝑎𝑟𝑑 𝐶𝑒𝑙𝑙 𝑃𝑜𝑡𝑒𝑛𝑡𝑖𝑎𝑙 (𝑉)
𝐸𝑐𝑎𝑡ℎ𝑜𝑑𝑒° = 𝑆𝑡𝑎𝑛𝑑𝑎𝑟𝑑 𝑝𝑜𝑡𝑒𝑛𝑡𝑖𝑎𝑙 𝑜𝑓 𝑡ℎ𝑒 𝑐𝑎𝑡ℎ𝑜𝑑𝑖𝑐 ℎ𝑎𝑙𝑓 𝑟𝑒𝑎𝑐𝑡𝑖𝑜𝑛 (𝑉)
𝐸𝑎𝑛𝑜𝑑𝑒° = 𝑆𝑡𝑎𝑛𝑑𝑎𝑟𝑑 𝑝𝑜𝑡𝑒𝑛𝑡𝑖𝑎𝑙 𝑜𝑓 𝑡ℎ𝑒 𝑎𝑛𝑜𝑑𝑖𝑐 ℎ𝑎𝑙𝑓 𝑟𝑒𝑎𝑐𝑡𝑖𝑜𝑛 (𝑉)
The potential of the half reactions changes with temperature and pH according to the Nernst-Equation;
𝐸 = 𝐸° −
𝑅𝑇
𝑣𝐹∗ 2.3026 ∗ pH
(3)
𝐸 = 𝐻𝑎𝑙𝑓 𝑅𝑒𝑎𝑐𝑡𝑖𝑜𝑛 𝑃𝑜𝑡𝑒𝑛𝑡𝑖𝑎𝑙 (𝑉) 𝐸° = 𝑆𝑡𝑎𝑛𝑑𝑎𝑟𝑑 𝐻𝑎𝑙𝑓 𝑅𝑒𝑎𝑐𝑡𝑖𝑜𝑛 𝑝𝑜𝑡𝑒𝑛𝑡𝑖𝑎𝑙 (𝑉)
𝑅 = 𝐺𝑎𝑠 𝑐𝑜𝑛𝑠𝑡𝑎𝑛𝑡 (8.314𝐽
𝑚𝑜𝑙∗𝐾)
𝑇 = 𝑅𝑒𝑎𝑐𝑡𝑖𝑜𝑛 𝑡𝑒𝑚𝑒𝑝𝑟𝑎𝑡𝑢𝑟𝑒 (𝐾)
Thermodynamically seen, the reaction improves by increasing temperature and pH. Because of the
endothermic nature of the electrolysis reaction, heat is drawn from the environment. If the reaction is
performed at room temperature, with no external heat source, a higher potential should be applied to
compensate for the temperature factor in the enthalpy. The potential at which the external heat is
compensated by the potential which is applied is called the thermoneutral potential. To calculate this
potential the Gibbs free energy should be replaced by the reaction enthalpy in equation 1, to get equation
4;
𝐸𝑡𝑛 =
∆𝐻𝑟
−𝑣𝐹
(4)
𝐸𝑡𝑛 = 𝑇ℎ𝑒𝑟𝑚𝑜𝑛𝑒𝑢𝑡𝑟𝑎𝑙 𝑝𝑜𝑡𝑒𝑛𝑡𝑖𝑎𝑙 (𝑉)
∆𝐻𝑟 = 𝑅𝑒𝑎𝑐𝑡𝑖𝑜𝑛 𝐸𝑛𝑡ℎ𝑎𝑙𝑝𝑦 (𝐽
𝑚𝑜𝑙)
At standard conditions the thermoneutral potential is 1.481 V.

7
The efficiency of the electrochemical reaction can be expressed in the Faradaic efficiency. The faradaic
efficiency is the ratio between the electrons used in the reaction and the amount of electrons supplied to
the electrochemical cell in the same amount of time. This efficiency is calculated with equation 5.
𝐹𝐸 =
𝑄𝑟𝑒𝑎𝑐𝑡𝑖𝑜𝑛
𝑄𝑖𝑛
∗ 100% (5)
𝐹𝐸 = 𝐹𝑎𝑟𝑎𝑑𝑒𝑖𝑐 𝐸𝑓𝑓𝑖𝑐𝑖𝑒𝑛𝑐𝑦 (%) 𝑄𝑟𝑒𝑎𝑐𝑡𝑖𝑜𝑛 = 𝐶ℎ𝑎𝑟𝑔𝑒 𝑢𝑠𝑒𝑑 𝑖𝑛 𝑡ℎ𝑒 𝑟𝑒𝑎𝑐𝑡𝑖𝑜𝑛 (𝑚𝑜𝑙) 𝑄𝑖𝑛 = 𝐶ℎ𝑎𝑟𝑔𝑒 𝑠𝑢𝑝𝑝𝑙𝑖𝑒𝑑 𝑡𝑜 𝑡ℎ𝑒 𝑐𝑒𝑙𝑙 (𝑚𝑜𝑙)
The outgoing charge is determined with the amount of hydrogen formed. Each hydrogen molecule reacts
with 2 electrons, with this information the amount of electrons used for the production of the hydrogen
can be determined using equation 6.
𝑄𝑜𝑢𝑡 = 𝑛 ∗ 𝑣 ∗ 𝐹 ∗ [𝐻2] =
𝑃𝑉
𝑅𝑇∗ 2 ∗ 𝐹 ∗ [𝐻2]
(6)
𝑛 = 𝑇𝑜𝑡𝑎𝑙 𝑎𝑚𝑜𝑢𝑛𝑡 𝑜𝑓 𝑚𝑜𝑙𝑒𝑐𝑢𝑙𝑒𝑠 𝑖𝑛 𝑔𝑎𝑠 𝑓𝑙𝑜𝑤 (𝑚𝑜𝑙) [𝐻2] = 𝐻𝑦𝑑𝑟𝑜𝑔𝑒𝑛 𝑓𝑟𝑎𝑐𝑡𝑖𝑜𝑛 𝑖𝑛 𝑡ℎ𝑒 𝑔𝑎𝑠 𝑓𝑙𝑜𝑤 (%)
𝑃 = 𝑃𝑟𝑒𝑠𝑠𝑢𝑟𝑒 (𝑃𝑎)
The charge used in the electrochemical cell is equal to the applied current multiplied by the time;
𝑄𝑖𝑛 = 𝐼 ∗ 𝑡 (7)
𝐼 = 𝐴𝑝𝑝𝑙𝑖𝑒𝑑 𝑐𝑢𝑟𝑟𝑒𝑛𝑡 (𝐴) 𝑡 = 𝑡𝑖𝑚𝑒 (𝑠)
These equations can be combined to form equation 8, to create an equation in which efficiency can be
determined on reaction parameters and the hydrogen concentration in the gas flow.
𝐹𝐸 =
𝑃 ∗ 𝜙
𝑅𝑇 ∗ 𝐼∗ 2 ∗ 𝐹 ∗ [𝐻2]
(8)
𝜙 = 𝐺𝑎𝑠 𝑓𝑙𝑜𝑤 𝑟𝑎𝑡𝑒 (𝑚3
𝑠)
With this equation the Faradaic efficiency of an electrochemical cell can be calculated from the amount of
hydrogen gas that is evolved in the reaction.

8
The overpotential In practice, the potential applied in water electrolysis cells is higher than the theoretical cell potential. The
additional potential needed is called the overpotential. The definition of the overpotential is given by
equation 9.
𝜂 = 𝐸𝑎𝑝𝑝𝑙𝑖𝑒𝑑 − 𝐸𝑡 (9) 𝜂 = 𝑂𝑣𝑒𝑟𝑝𝑜𝑡𝑒𝑛𝑡𝑖𝑎𝑙 (𝑉) 𝐸𝑎𝑝𝑝𝑙𝑖𝑒𝑑 = 𝐴𝑝𝑝𝑙𝑖𝑒𝑑 𝑃𝑜𝑡𝑒𝑛𝑡𝑖𝑎𝑙 (𝑉)
𝐸𝑡 = 𝑇ℎ𝑒𝑜𝑟𝑒𝑡𝑖𝑐𝑎𝑙 𝑃𝑜𝑡𝑒𝑛𝑡𝑖𝑎𝑙 𝑓𝑟𝑜𝑚 𝑡ℎ𝑒𝑟𝑚𝑜𝑑𝑦𝑛𝑎𝑚𝑖𝑐𝑠 (𝑉)
In this equation 𝜂 is the overpotential and is the difference between the applied potential and the
potential that arises from the thermodynamics. This second potential is also called the reversible
potential, due to the electrochemical reaction which is reversible [16]. This potential arises from several
causes, these will now be explained in further detail.
Resistance in the set-up Resistance in the set-up consists of resistances in the electrical circuit and the resistance in the
electrolyte. The resistance in the electric circuit is usually very small because it is made of copper wires or
other strongly conducting materials. A stronger resistance comes from the electrolyte. A part of this
comes from the resistance caused by the ions in the solution. This resistance decreases by increasing the
concentration of the solution. This is highly dependent on the distance between the electrodes as can be
concluded from equation 10.
𝑅 =
𝜌 ∗ 𝑙
𝐴
(10)
𝑅 = 𝑅𝑒𝑠𝑖𝑠𝑡𝑎𝑛𝑐𝑒 (Ω
𝑚2)
𝜌 = 𝐸𝑙𝑒𝑐𝑡𝑟𝑖𝑐𝑎𝑙 𝑟𝑒𝑠𝑖𝑠𝑖𝑣𝑖𝑡𝑦 (Ω
𝑚)
𝑙 = 𝐿𝑒𝑛𝑔𝑡ℎ 𝑜𝑓 𝑡ℎ𝑒 𝑤𝑖𝑟𝑒 (𝑚) 𝐴 = 𝐶𝑟𝑜𝑠𝑠𝑠𝑒𝑐𝑡𝑖𝑜𝑛𝑎𝑙 𝑎𝑟𝑒𝑎 𝑜𝑓 𝑡ℎ𝑒 𝑤𝑖𝑟𝑒 (𝑚2)
As observed in electrical wires, increasing length of the conducting medium also increases the resistance
within the medium. The equation for the resistance in solutions might not be the same as equation 10,
but the dependency of the distance on the resistance is similar.

9
Figure 2: In this figure, created by Md S. Opu, the voltage is set-out versus the current density. Parameter ‘d’ gives the distance between the working and the counter electrode [9].
As can be seen in Figure 2, by decreasing the distance between the electrodes the potential can be
decreased. Especially for high current densities this difference can be significant. The distance however
should not be further minimized. The reason for this is the evolution of gas bubbles at the electrodes. At
high current densities gas evolution can strongly affect the efficiency of the electrode. The gas bubbles
are insulating and therefore a cause of resistance in the cell. When the amount of gas evolved is the same
but the distance between the electrodes is smaller, the fraction of insulating gas bubbles increases, which
results in a higher resistance. For this reason, for specific constant parameters, there is always an optimal
distance [17]. The resistance caused by the electrolyte, in typical electrolysis cells, is however very low.
The reason for this is the high conductivity of sodium or potassium hydroxide solutions which are often
used in alkaline water electrolysis. The shape of the electrode surface is also an important parameters in
the electrolysis cell design. When using electrodes with a large height to width ratio, the amount of
bubbles at the top of the electrode is higher due to the rising of the bubbles. This increases the resistance
of the electrolyte at that location and thus the total resistance in the cell. Not only evolving bubbles are
increasing the resistance of the electrolysis cell; the bubbles which are growing at the surface of the
electrodes are lowering conductivity and decreasing surface area. Both factors influence the working
potential of the electrolysis cell [18].
The temperature at which the reaction is performed has a high influence on the potential and the faradaic
efficiency [9]. From the definition of the Gibbs free energy, equation 11, one of the benefits of increasing
operating temperature can be derived.
∆𝐺 = ∆𝐻 − 𝑇∆𝑆 (11)
∆𝐻 = 𝑅𝑒𝑎𝑐𝑡𝑜𝑛 𝑒𝑛𝑡ℎ𝑎𝑙𝑝𝑦 (𝐽
𝑚𝑜𝑙)
∆𝑆 = 𝐶ℎ𝑎𝑛𝑔𝑒 𝑖𝑛 𝐸𝑛𝑡𝑟𝑜𝑝𝑦 (𝐽
𝐾)
With temperature increase, the Gibbs free energy decreases, which in turn decreases the potential of the
reaction, as described in equation 1. The change in cell potential by increasing temperature can be seen in
Figure 3.

10
Figure 3: Theoretical cell potential versus temperature. This plot shows the potential difference between the thermoneutral and the standard cell potential at different temperatures [2].
By operating at higher temperatures, the potential which has to be applied for the reaction to occur can
be lowered by the difference between the thermoneutral potential and the standard potential. This
change in potential is however purely a thermodynamic effect and causes no change in the overpotential.
A factor that does decrease the overpotential with temperature is the ionic conductivity and surface
reaction of an electrolyte [18]. By increasing the ionic conductivity of the cell the electrical efficiency
increases, resulting in a lower overpotential.
In electrochemistry books[16,19], the ohmic drop between the working electrode and the reference
electrode is subtracted from the overpotential value. By placing the reference electrode as close as
possible near the working electrode, this value is insignificantly small.
Mass-transfer limitations Mass-transfer limitations are studied by Md. S. Opu [9], who showed the dependence of the electrolyte
volume, electrode location, electrode distance, electrode concentration, effect of stirring and the
operating temperature on the efficiency of a water electrolysis reaction. His set-up consisted of two
platinum wires, submerged in potassium hydroxide. From his results can be derived that the volume of
the electrolyte and the electrode location do not affect the overpotential of the cell. The stirring speed
does affect the overpotential of the cell. With higher stirring speeds the potential drops, this is logical
because this way the water circulates faster past the electrodes which results in higher shear forces on
the bubbles. This way the bubbles will release faster and thus the bubbles formed on the electrodes
remain small, and this way smaller bubbles will evolve in the solution. The overall bubbles will remain
smaller which results in less resistance. It is also possible that the bubbles are also more circulated
through the solution which results in less insulating bubbles between the electrodes [18].
The electrolyte concentration is, according to Md S. Opu, a large contributor to the overpotential. This
parameter affects the conductivity of the solution, at lower concentrations the resistance of the solution
is higher [9]. Another benefit of using higher concentrations is the amount of reactants in the solution.
Whether using an acidic or alkaline solutions, the amount of protons or hydroxide ions in the solution is
higher, resulting in a higher reaction rate.
Secondly, the poisoning of the electrode. When using high catalytic metals as platinum, poisoning of the
electrode can happen very easily due to the catalytic nature of the electrode. Of course the effects of

11
poisoning are cumulative, decreasing the effective surface area in time. Due to this, the effective
electrode surface will decrease, resulting in a higher electrode potential. L. Birry et al demonstrated the
effect of poisoning on Raney nickel-Molybdenum electrodes. By adding 5*10-2 M of KCN, the Tafel slope
increased by 40 mV. [20] Platinum is known to be very susceptible for poisoning. In less than an hour Pt-
electrodes can lose a significant amount of their electrocatalytically surface area [21].
And last, the diffusion of the ions in the electrolyte. When a high current is applied, the gas evolution
might be so high, that the diffusion of the ions in the solution becomes a limiting factor. A reason for this
could be the low electrolyte concentration, lowering the reaction rate. It could also be the coverage of the
electrode by evolving bubbles which decreases active surface area, resulting in lower reaction rates. The
difference between these can be observed when the concentration of the electrolyte is not influencing
the hydrogen evolution. This phenomenon however, can also arise when the desorption step of the
reaction is very low, resulting is a high surface coverage (Θ 1) and a lower reaction rate [2].
12
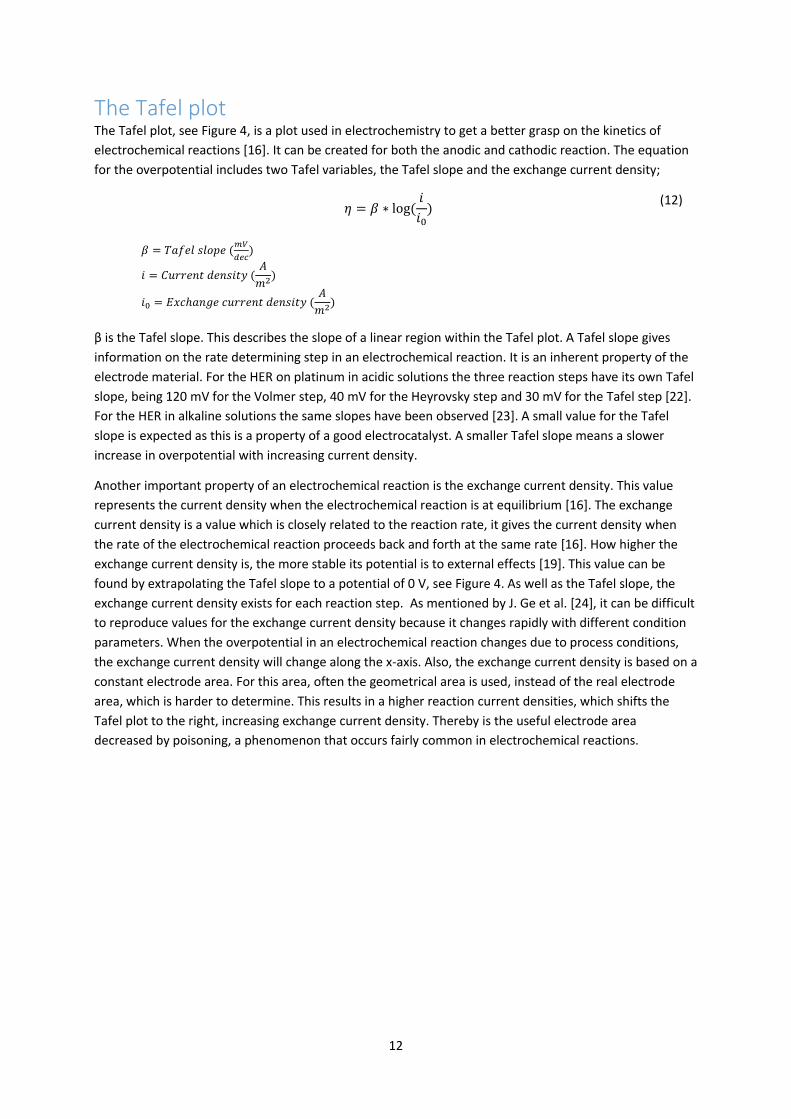
The Tafel plot The Tafel plot, see Figure 4, is a plot used in electrochemistry to get a better grasp on the kinetics of
electrochemical reactions [16]. It can be created for both the anodic and cathodic reaction. The equation
for the overpotential includes two Tafel variables, the Tafel slope and the exchange current density;
𝜂 = 𝛽 ∗ log (
𝑖
𝑖0)
(12)
𝛽 = 𝑇𝑎𝑓𝑒𝑙 𝑠𝑙𝑜𝑝𝑒 (𝑚𝑉
𝑑𝑒𝑐)
𝑖 = 𝐶𝑢𝑟𝑟𝑒𝑛𝑡 𝑑𝑒𝑛𝑠𝑖𝑡𝑦 (𝐴
𝑚2)
𝑖0 = 𝐸𝑥𝑐ℎ𝑎𝑛𝑔𝑒 𝑐𝑢𝑟𝑟𝑒𝑛𝑡 𝑑𝑒𝑛𝑠𝑖𝑡𝑦 (𝐴
𝑚2)
β is the Tafel slope. This describes the slope of a linear region within the Tafel plot. A Tafel slope gives
information on the rate determining step in an electrochemical reaction. It is an inherent property of the
electrode material. For the HER on platinum in acidic solutions the three reaction steps have its own Tafel
slope, being 120 mV for the Volmer step, 40 mV for the Heyrovsky step and 30 mV for the Tafel step [22].
For the HER in alkaline solutions the same slopes have been observed [23]. A small value for the Tafel
slope is expected as this is a property of a good electrocatalyst. A smaller Tafel slope means a slower
increase in overpotential with increasing current density.
Another important property of an electrochemical reaction is the exchange current density. This value
represents the current density when the electrochemical reaction is at equilibrium [16]. The exchange
current density is a value which is closely related to the reaction rate, it gives the current density when
the rate of the electrochemical reaction proceeds back and forth at the same rate [16]. How higher the
exchange current density is, the more stable its potential is to external effects [19]. This value can be
found by extrapolating the Tafel slope to a potential of 0 V, see Figure 4. As well as the Tafel slope, the
exchange current density exists for each reaction step. As mentioned by J. Ge et al. [24], it can be difficult
to reproduce values for the exchange current density because it changes rapidly with different condition
parameters. When the overpotential in an electrochemical reaction changes due to process conditions,
the exchange current density will change along the x-axis. Also, the exchange current density is based on a
constant electrode area. For this area, often the geometrical area is used, instead of the real electrode
area, which is harder to determine. This results in a higher reaction current densities, which shifts the
Tafel plot to the right, increasing exchange current density. Thereby is the useful electrode area
decreased by poisoning, a phenomenon that occurs fairly common in electrochemical reactions.

13
Figure 4: A theoretical Tafel plot for an electrochemical reaction. j0 is the exchange current density.
Figure 5: The Tafel plots in this figure are theoretical equations of the overpotential for different reaction mechanism, created by S.A. Vilekar et al. [8]. The equation are based on water electrolysis of a 0.5M NaOH solution.
Figure 5 contains curves calculated by S.A. Vilekar et al. These curves represent different reaction
pathways for the alkaline water electrolysis reactions. This approach is proven to be correct when
compared with the practical results of electrolysis of a 0.5M NaOH solution on platinum.

14
Experimental
The set-up The set up consists of a steel autoclave reactor-vessel. In the steel lid of the vessel, holes are drilled to
which three electrode connectors, two tubes and a thermocouple are attached. The electrode connectors
are stainless steel rods coated with Teflon. Outside the autoclave, three wires leading to a Bio-Logic SAS
potentiostat are connected to the stainless steel rods with crocodile clips. Inside the autoclave the
electrode connectors end in screw thread to which the electrode platinum wires are connected by being
tightened between two stainless steel bolts. This connection is then covered by a Teflon cap to prevent
the bolts from corroding when accidently brought in contact with the solution by, for example, stirring or
evaporation of the liquid. At the other end of the platinum wires the desired electrode is connected. The
working electrode is a 1cm2 small platinum plate, the counter electrode is a platinum mesh. One of the
tubes connected to the autoclave is submerged under liquid level. This tube is the inlet for argon which is
used as carrier gas to flush out the hydrogen and oxygen. The flow rate for the argon is set at 50 ml/min.
Argon is used because of the larger flow rate difference with hydrogen than for example helium, this
makes the gas chromatograph (GC) more sensitive towards hydrogen. The gases escape the autoclave
through the other tube which leads, via a condenser in which the evaporated water is condensed, to the
GC. The condenser can be seen in Figure 8. In the autoclave a beaker with 100ml electrolyte is placed.
With this volume all the electrodes and the gas inlet tube are submerged in the electrolyte, and stirring
can be applied without the liquid touching the electrode connectors. In Figure the set-up is schematically
illustrated. In Figure the set-up is shown as it is used while running the experiments.
Figure 6: The set-up as used in the experiments. 1) The autoclave reactor with lid. The lid is held airtight with six bolts. 2) The inlet tube for the argon gas. 3) Wires leading from the potentiostat to the electrode connectors. 4) The outlet tube for the gas mixture which is
directly connected to the GC. 5) The electrolyte solution in a glass beaker with magnetic stirring bar. 6) The counter electrode. The counter electrode is a platinum mesh. A mesh is chosen because of the large surface area so that the reaction occurring at this electrode
is not limiting for the total reaction. It is connected to the electrode connector with a platinum wire. 7) The working electrode. The working electrode is a platinum plate of 1 cm2. Using a certain geometrical area the current density can be easily calculated. As the
counter electrode, the working electrode is connected to the electrode connector with a platinum wire. 8) The reference electrode. The reference electrode is a BASi 3M Ag/AgCl electrode.

15
Figure 7: (Left) The set up as used while running the experiments. 1) The argon inlet tube. 2) The thermocouple. 3) The outlet tube which leads directly to the condenser, see Figure 8, and after condensing the water to the GC. 4) The autoclave. The largest part is now covered by the heating mantle (6) and not visible. 5) The wire bundle which leads to the potentiostat. 6) The heating mantle which is connected, as well as the thermocouple, to a thermostat. 7) A heating plate with magnetic stir option which is used to stir the electrolyte with the added stirring bar.
Figure 8: (Right) The condenser as used in the experiments. When performing 80°C measurements the condenser was filled with ice instead of tap water. At the bottom of the condenser a tap is installed to remove the condensed water from the tube after the experiment.
The reference electrode should be as close as possible to the reference electrode. This results in a lower
ohmic drops between the electrodes and increases the accuracy of the measurements. Therefore the wire
of the working electrode is bent to get the middle of the platinum plate at the same height as the bottom
of the reference electrode. The distance between the electrodes should be as close as possible. In these
measurements this distance was about 1-2 mm.
The method For this work, two series of measurements are performed. In each measurement the current is changed
density over the electrodes and measure potential with the potentiostat and hydrogen concentration in
the outlet gas with the GC. The first two series used the working electrode as cathode. In the first series
the temperature was changed. In the second series the pH was changed.
The electrode was first cleaned using 5M nitric acid solution. Then it was extensively rinsed with MilliQ
water. When the term water is used in this report, ultrapure MilliQ water is meant. Then the electrodes
were tightly connected at the electrode connectors. All the parts that are submerged in the solution are
once again rinsed with water before the autoclave is sealed.
16
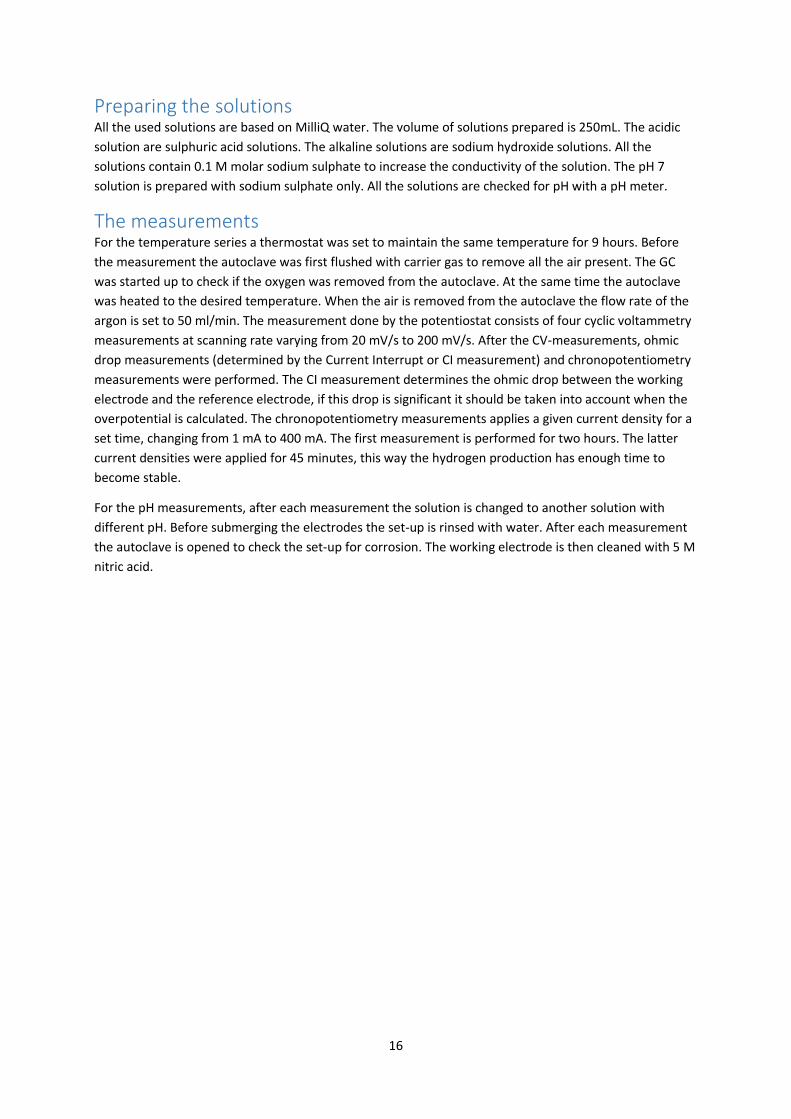
Preparing the solutions All the used solutions are based on MilliQ water. The volume of solutions prepared is 250mL. The acidic
solution are sulphuric acid solutions. The alkaline solutions are sodium hydroxide solutions. All the
solutions contain 0.1 M molar sodium sulphate to increase the conductivity of the solution. The pH 7
solution is prepared with sodium sulphate only. All the solutions are checked for pH with a pH meter.
The measurements For the temperature series a thermostat was set to maintain the same temperature for 9 hours. Before
the measurement the autoclave was first flushed with carrier gas to remove all the air present. The GC
was started up to check if the oxygen was removed from the autoclave. At the same time the autoclave
was heated to the desired temperature. When the air is removed from the autoclave the flow rate of the
argon is set to 50 ml/min. The measurement done by the potentiostat consists of four cyclic voltammetry
measurements at scanning rate varying from 20 mV/s to 200 mV/s. After the CV-measurements, ohmic
drop measurements (determined by the Current Interrupt or CI measurement) and chronopotentiometry
measurements were performed. The CI measurement determines the ohmic drop between the working
electrode and the reference electrode, if this drop is significant it should be taken into account when the
overpotential is calculated. The chronopotentiometry measurements applies a given current density for a
set time, changing from 1 mA to 400 mA. The first measurement is performed for two hours. The latter
current densities were applied for 45 minutes, this way the hydrogen production has enough time to
become stable.
For the pH measurements, after each measurement the solution is changed to another solution with
different pH. Before submerging the electrodes the set-up is rinsed with water. After each measurement
the autoclave is opened to check the set-up for corrosion. The working electrode is then cleaned with 5 M
nitric acid.

17
Results and Discussion In this part the results will be discussed. All the performed measurements will be compared with the base
measurements. This way the dependency of temperature and pH of the solution can be discussed
properly. For the pH measurement the pH 7 measurement is set as the base measurement, as this is
neutral pH. For the temperature dependency room temperature is used as base measurement.
The base measurements consist of 8 measurements. The 8 measurements are performed with these
current densities; 1 mA, 5 mA, 10 mA, 20 mA, 50 mA, 100 mA, 200 mA and 400 mA.
Results pH measurements In Figure the CV-diagram of the measurement at neutral pH is given. When compared with Figure 1, it is
noticeable that the potential shift is enormous. This is due to the reference electrode used. It can also be
noticed that the peaks, except for the gas evolution peaks, are very small. The reason for this is the low
amount of active ions in the nearly neutral solution, nevertheless all the expected peaks are still visible at
the expected locations.
Figure 9: CV-diagram of a water electrolysis cell at 293 K with a pH 7 solution. It is a double scan performed from -1 V to 1.2 V starting and ending at 0 V with a scanning rate of 200 mV/s.
To determine the overpotential at each current density, stepwise all the currents are applied for 45
minutes. After 45 minutes the amount of hydrogen measured by the GC is constant which is needed to
determine the efficiency of the reaction at each current density. The first current density applied (1 mA) is
measured for a longer time because the heating mantle fluctuated in the first hour of measuring.

18
Figure 10: Potential vs. time with stepwise changes in the applied current densities. The current densities applied, starting at the upper left step are; 1 mA/cm2, 5 mA/cm2, 10 mA/cm2, 20 mA/cm2, 50 mA/cm2, 100 mA/cm2, 200 mA/cm2 and 400 mA/cm2.
The red lines represent the values for the potential used in the calculations at each current density. The
working electrode for this measurement is the cathode. This results in negative potentials which decrease
with time. The -50 mA measurement (-1.4 V) goes down with time, at constant current density. A reason
for this might be poisoning of the electrode. The last measurements show large fluctuations. The reason
for this is presumably bubble formation, this is supported by the fact that the fluctuations are minimal at
lower current densities and continue to increase while applying higher current densities. Large growing
bubbles at the surface will increase potentials, while desorption of the bubbles decreases the potential by
lowering resistance. The last measurement (-2.05 V) shows an increase in potential with time. The reason
for this is an increase in temperature due to the resistance in the set up. A temperature increase up to 10
°C is observed in measurements at a current density of 400 mA.
The Nernst Equation is used to determine the theoretical potential, which is subtracted from the applied
potential to get the overpotential. The amount of electrons used for the HER is calculated from the
amount of moles of hydrogen evolved. The amount of electrons used by the reaction can be converted to
reaction current density with equation 8. The overpotential is set out vs. the reaction current density in
the Tafel plot, as seen in Figure 11.

19
Figure 11: (Left) Tafel plot of the HER at pH 8.21 and 293 K. The red line represents the overpotential plotted versus the reaction current density. The two blue lines indicate two different slopes in the Tafel plot.
Figure 12: (Right) Faradaic efficiencies set out versus reaction current density. Notice the similarity in efficiency of the last measurements compared to the first one.
In this Tafel plot two different slopes are observed. The Tafel slope in the lower current density region is
168 mV/dec, the slope in the higher current density region is 1098 mV/dec. The value for the Tafel slope
however should not be given too much attention as it changes easily with different cell configurations or
operating conditions, the fact that the mechanism changes is more interesting. Because the slope gets
steeper at higher current densities, the current density is probably the cause for the mechanism change.
The obtained values for the exchange current density are 0.2317 mA/cm2 for the lower current density
region, for the higher current density region it is 15 mA/cm2. Unfortunately no reference values are found
for these reaction conditions. To get a better understanding of the reaction mechanism the faradaic
efficiencies are calculated at each reaction current density, see Figure 14. As can be seen, the efficiency of
the reaction does not change strongly with the mechanism, a small drop can be observed for the higher
current densities, this however is very small.
Figure 13: (Left) The Tafel plot for the OER at pH 8 and 293 K.
Figure 14: (Right) The Faradaic efficiencies for the OER reaction at different current densities. For the OER reaction the efficiency is changing a lot along the current densities applied.

20
Figure 13 shows the Tafel plot of the OER reaction at pH 8 and 293 K. If compared with Figure 5, it can be
stated that the reaction mechanism is most certainly not the Volmer-Tafel mechanism. Which mechanism
it is however, cannot be derived from this plot. In Figure the efficiencies of the OER reaction can be seen.
It seems that the efficiency changes strongly with current density. Where it is almost equal at 400 mA/cm2
as applied current density, it is only 1/3 of the efficiency for the current densities ranging from 5 to 20
mA/cm2. It seems that the rate limiting factor is strongly dependent on the current density and increase
with higher current density. The reason for this is not clear. It might be the complex reaction mechanism
of the oxygen evolution reaction.
Alkaline solutions The Tafel plots obtained from pH 8.21, pH 10.23 and pH 13.35 are plotted together in Figure 15.
Figure 15: The Tafel plots of the measurements are room temperature (293 K) for pH 8.21, pH 10.23 and pH 13.35. The red line with squares represents pH 8.21, the blue line with stars represents pH 10.23 and the black line with crosses represents pH 13.35
In Figure 15 it is visible how the line shifts to the right with increasing pH. This shift means an increase in
the exchange current density which promotes the reaction. Further can be observed that all the lines
seem to behave similar at low current densities, meaning the mechanism is the same at lower current
densities. At higher current densities the same can be derived from pH 8.21 and pH 10.23. At pH 13.35 the
line probably has the same characteristics as at lower pH, this however cannot be derived from the results
with certainty. A significant change in the overpotential at different pH can be observed in Figure 15. The
pH 13.35 reaction has a significant lower overpotential than the other reactions.

21
Table 1: Exchange current densities and Tafel slopes at different pH.
pH Exchange current density1 mA/cm2
Tafel Slope2 mV/dec.
8.21 0.0027 -1097
10.23 0.085 -917
13.35 0.149 -566
From the results in Table 1 can be derived that the reaction rate increases with pH. There is an obvious
increase in the exchange current density which means that the overall reaction rate increases with pH.
Also there is a decrease observed in the Tafel slope, normally this also means that the reaction runs faster
with less increase in potential. It can however not be excluded that the slope will continue to increase
with even higher current densities because no obvious linear slope could be created. The reason for this is
that the potentiostat which was used could not deliver higher current densities.
The cyclic voltammogram measurements of each pH show a similar behaviour in shifts for the different
peaks. According to the Nernst equation (3), the potential of the half reactions should decrease with
increasing pH, this is visible in Figure 16. In addition, there is a large increase in the hydrogen desorption
and oxygen desorption peaks visible. The larger desorption of the electroactive ions means that the
desorption of both electroactive ions proceeds easier at higher pH.
Figure 16: Cyclic voltammograms of the alkaline measurements.
The efficiency of each measurement can be found in Figure 17. The efficiency at pH 13 lays around 10%
lower than the efficiency of pH 8 and pH 10. An explanation for this might be poisoning of the electrode,
this would explain the fact that the shift is equal at about each point. An explanation for the extraordinary
high efficiency at 1 mA/cm2 might be the fact that the gas chromatograph was not calibrated well enough
to measure such low gas evolution rates.
1 This value is calculated with the equation of a least squares fit of the current densities at 100, 200 and 400
mA/m2.
2 This value is based on the slope of a least squares fit of the current densities at 100, 200 and 400 mA/m
2.

22
Figure 17: Faradaic efficiencies at different current densities for different pH. The red line with squares = pH 8.21, the blue line with stars = pH 10.23 and the black line with crosses = pH 13.35.
Acidic solutions For acidic solutions, the same behaviour with decreasing pH for the Tafel plot should be observed.
Figure 18: Tafel plots for acidic electrolytes. The red curve with crosses is pH 8, the blue curve with stars is pH 4 and the black curve with crosses is pH 2.
The neutral pH curve runs parallel to the pH 4.55 curve, but with lower overpotential. This behaviour is
not expected, as the pH 4.55 solution contains more electroactive ions than the pH 8 solution, therefore it
should have a lower overpotential. The reason for this is probably poisoning or surface blocking of the
electrode, as it changed slightly in colour when the first (pH 4,55) acidic measurement was performed.
After the second acidic measurement (pH 2.43) there was even a slight blackish colour at the edges of the
23
electrode surface. This phenomenon only happened at the cathode, as far as the eye could see. Even
though the electrode was cleaned with 5 M nitric acid and rinsed thoroughly with MilliQ water after the
pH 4 measurement, the overpotential of the reaction was still not as low as expected. Still the graph
provides useful information. The overpotential at lower current densities is lower at pH 2.43 as at pH
4.55. The differences in the potential are up to 20 mA/cm2 reduces by an equal amount. At 50 mA/cm2
the overpotential rises to the same value as for pH 4.55 and continues to do so up to 400 mA/cm2. This
gives the impression that the concentration of the solution and the conductivity are no longer influencing
the rate of the reaction , which is from 50 mA/cm2 caused by another limiting factor, for example the
desorption step. This could be the reason if the desorption step would be the Tafel step as this step is not
concentration dependent. A theoretical analysis by X. Chen et al.[25] shows that the reaction potential at
potentials near neutral are independent of pH because its effect on the potential is insignificantly small.
The research showed that pH ranging from 3.38 up to 10.79 only changed the potential by 7.7% at
maximum at aluminium electrodes. The reason for this is probably the low amount of electroactive ions in
the diluted solutions.
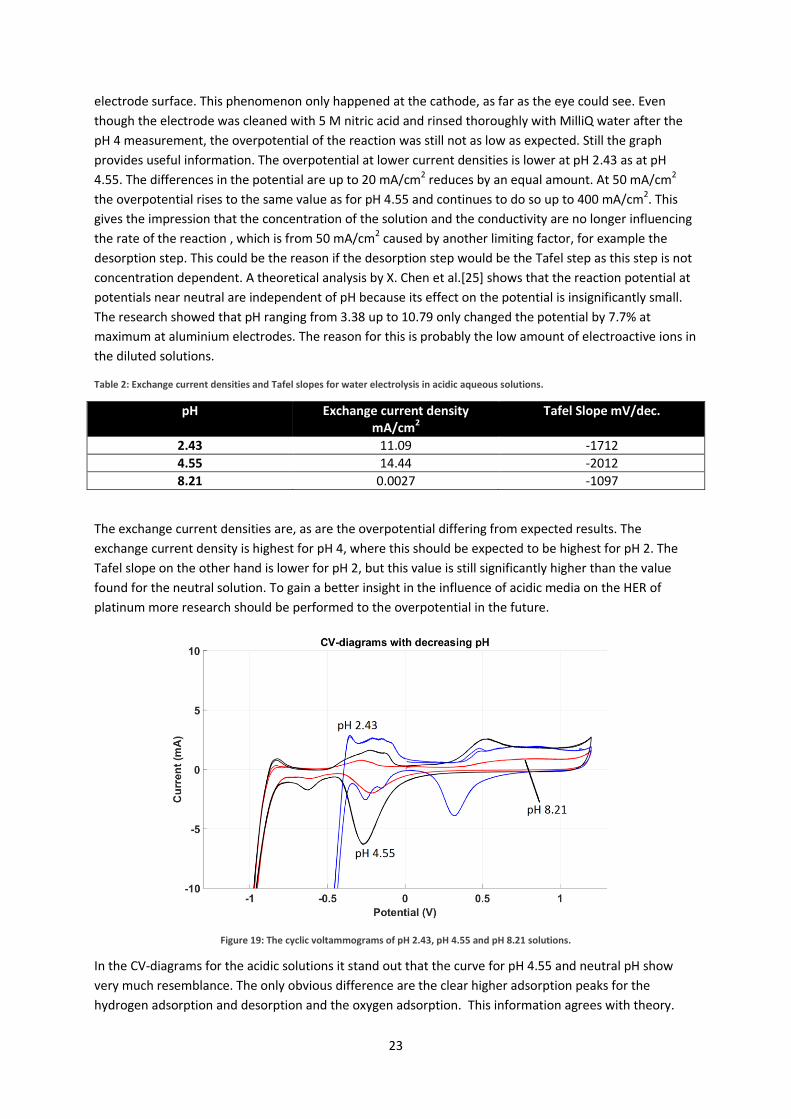
Table 2: Exchange current densities and Tafel slopes for water electrolysis in acidic aqueous solutions.
pH Exchange current density
mA/cm2 Tafel Slope mV/dec.
2.43 11.09 -1712
4.55 14.44 -2012
8.21 0.0027 -1097
The exchange current densities are, as are the overpotential differing from expected results. The
exchange current density is highest for pH 4, where this should be expected to be highest for pH 2. The
Tafel slope on the other hand is lower for pH 2, but this value is still significantly higher than the value
found for the neutral solution. To gain a better insight in the influence of acidic media on the HER of
platinum more research should be performed to the overpotential in the future.
Figure 19: The cyclic voltammograms of pH 2.43, pH 4.55 and pH 8.21 solutions.
In the CV-diagrams for the acidic solutions it stand out that the curve for pH 4.55 and neutral pH show
very much resemblance. The only obvious difference are the clear higher adsorption peaks for the
hydrogen adsorption and desorption and the oxygen adsorption. This information agrees with theory.

24
Also the pH 2 curve is shifted towards a more positive potential, which could be well understood from the
Nernst-equation (3). It is noticeable how the oxygen desorption peak from the pH 2 measurement is
smaller than the same peak from pH 4. This is probably due to the already proposed idea of surface
blocking. This would lower the amount of active sites for the hydroxide ions to bond at, which results in a
lower amount of adsorbed hydroxide ions and thus lower the oxygen desorption peak within the CV-
diagram.
Figure 20: In this plot the results for the faradaic efficiencies of the acidic reactions are plotted with the efficiencies for the neutral reaction. The red line with squares = pH 4.55, the blue line with stars = pH 2.43 and the black line with crosses is pH 8.21.
The faradaic efficiencies, calculated with equation (8), follow the same trend for the acidic solutions as
the faradaic efficiencies of the alkaline solutions (Figure 17). The efficiencies for the pH 4 measurement
have equal values along the current density range. The pH 2 solution however is parallel to the pH 4 and
pH 8 curve, but is about 10 % smaller for the lower current density region and 5 % for the higher current
density region. The most likely explanation for this is poisoning or surface blocking of the electrode as
mentioned before. The slightly smaller difference at higher current densities might be due to fluctuations
in the GC measurements or, more probably, higher efficiency at higher current densities due to a higher
reaction rate caused by a higher concentration of electroactive ions.

25
Temperature dependency The potential of electrolysis of water changes with temperature. A quick temperature scan has been
performed by heating the autoclave reactor from room temperature to 90 °C and then let cool down to
room temperature again (Figure 21).
Figure 21: A temperature scan in which the used reactor was heated to 90°C in a short period and then cooled down to room temperature while measuring the potential changes. The scan is performed at a current density of 200 mA/cm2.
A potential change of about -0.3 V along a temperature difference of 60 °C can be seen from Figure 21.
The difference between the potentials calculated from the Nernst-equation is only -0.11 V. This means the
temperature has a large effect on the overpotential, which is around -0.2 V. The Tafel plots, in Figure 22,
show that there is no large temperature effect at lower current densities, only above -100 mA/cm2 the
temperature effects become substantial. And a lower overpotential as expected could be observed at the
high current density region. The cause for this is probably electrolyte resistance. The influence of the
resistance becomes larger with current density. At higher temperatures the conductivity of the solution
increases due to increasing ion activity, which results in a lower overpotential at higher temperature.
Another reason might be that the temperature has a positive influence on the activation energy of the
electrode reactions.
Figure 22: Tafel plots at different operating temperatures. The red line with squares is measured at 313 K, the blue line with stars is measured at 333 K and the black line with crosses is measured at 353 K.
26
As these measurements were last performed the results will not be compared with the neutral
measurement results of pH 8 at 293 K. The reason for this is the possible poisoning and/or surface
blocking of the electrode which will influence the results.
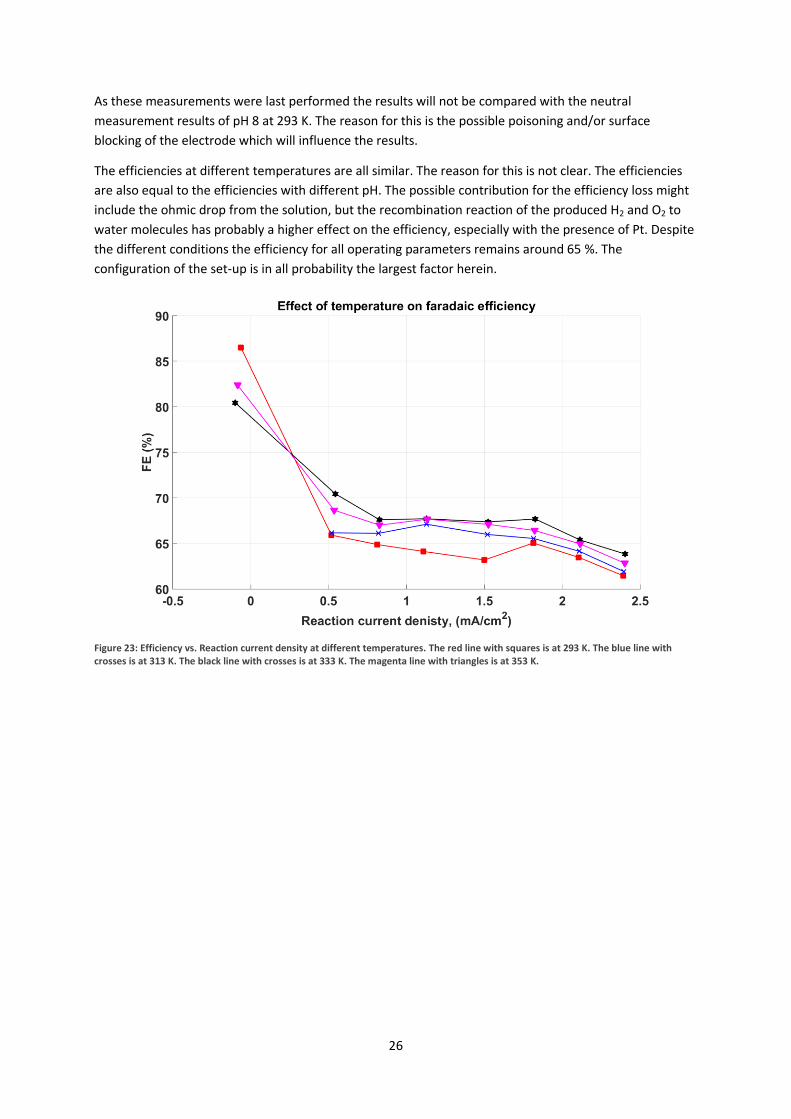
The efficiencies at different temperatures are all similar. The reason for this is not clear. The efficiencies
are also equal to the efficiencies with different pH. The possible contribution for the efficiency loss might
include the ohmic drop from the solution, but the recombination reaction of the produced H2 and O2 to
water molecules has probably a higher effect on the efficiency, especially with the presence of Pt. Despite
the different conditions the efficiency for all operating parameters remains around 65 %. The
configuration of the set-up is in all probability the largest factor herein.
Figure 23: Efficiency vs. Reaction current density at different temperatures. The red line with squares is at 293 K. The blue line with crosses is at 313 K. The black line with crosses is at 333 K. The magenta line with triangles is at 353 K.

27
Effect of stirring At the start of the experiments the effect of stirring in the autoclave reaction is observed. Stirring should
improve ion diffusion and gas bubble desorption from the electrode surface. However due to the highly
corrosive environment of the electrolyte, caution needed to be applied that stirring was not carried out to
aggressively. As can be seen in Figure , the current applied is lower when stirring was applied. This is
probably due to the fact that gas bubbles are desorbed faster from the electrode surface. This results in
easier adsorption of the protons and hydroxide ions on the electrodes. The reason being that there are
more favourable positions available at the electrode surface. Also the peaks of the oxygen adsorption are
shifted slightly to the left. The means that a lower potential was needed for the oxygen to adsorb.
Because the configuration and operating conditions were equal during the measurement the change in
potential is only a change in overpotential. Meaning a lower overpotential with stirring applied than
without stirring applied.
Figure 24: CV-diagrams in which the effect of stirring can clearly be seen. Two platinum electrodes are used. The electrolyte used is a sodium hydroxide solution of pH 10. The red and blue lines are created at a scanning rate of 50 mV/s. The black and magenta lines are
created at a scanning rate of 100 mV/s.
28
Recommendations
The main problems encountered during this study were set-up based. Therefore it is highly recommended
to create a reactor which is rigid with a configuration that is easy to understand to make the results
reproducible. The electrodes should be connected sturdy without possible movement due to stirring. The
reference electrode should remain in place as close as possible to the working electrode. Inside the
reactor no easily corroding material should be present. A Teflon cover for all metal parts, except the
electrodes is highly recommended. The volume of the electrolyte should be large enough to submerge the
electrodes, but to let the stirring bar rotate freely below the electrodes. If no corrosive materials are
present, the effect of stirring should be measured to observe the influence at the highest rate possible.
This will decrease the overpotential caused by mass-transfer limitations and increase the electrical
conductivity.
The electrolyte should be as pure as possible. Because the of high poisoning rate of platinum it is advised
to first use another platinum electrode to filter out poisonous compounds in the solution before
measuring with the electrode used in the experiments. This cleaning electrode should be treated with
strong acid to cleanse it from the poisoning and surface blocking compounds.
The pressure for the gas mixture into the gas chromatograph should be controlled at a constant value.
This is important to get good results for the efficiency of the reactor.
The pH at which the measurements are performed should be ranging from pH 11 to the pH at maximum
solubility of sodium hydroxide. In this highly alkaline region more obvious differences should be observed
for the potential and overpotential. The values returned should also be more comparable with
conventional electrolyzers.
The same applies to the acidic region. Measurements should be performed from pH 3 to pH -1. It should
however be noticed that platinum is dissolvable in aqua regia. It will not dissolve in sulphuric acid, but
other effects might be caused by the highly acidic environment. Research should be performed towards
the oxidation of platinum in highly acidic environments.
It might be interesting to perform measurements while slowly acid, or sodium hydroxide solution is added
to the reaction mixture. This way a plot as in Figure can be created for pH dependency.
Because of the positive effect of the higher temperatures on the overpotential it would be interesting to
increase temperatures to above 100 °C while increasing pressure.

29
Conclusion The overpotential of the HER on platinum in alkaline solutions decreases with increasing pH. The most
obvious reason for this is the increasing amount of conductivity at higher electrolyte concentrations and
possibly the increase in conductivity at higher concentrations.
For acidic solutions there was no change in overpotential visible at lower concentration. There was
however a lower efficiency measured for pH 2.43. This is contradictory to what would be expected
because the amount of electroactive ions in the solution should be larger, which should increase the
efficiency of the process. The reason for this is presumably surface blocking or poisoning of the electrode.
The efficiency for almost all conditions was similar. The reason for this is most likely due to the
configuration of the electrochemical reactor.
For the temperature a change in overpotential is observed for the higher current densities. At higher
temperatures the overpotential is lower than for lower temperatures at current densities ranging from
-100 mA/cm2 to -400 mA/cm2. This is probably due to the higher electrical conductivity at higher
temperatures. Another reason might be that the temperature has a positive influence on the activation
energy of the electrode reactions.
Also, stirring has a positive effect on the electrolysis of a pH 10 alkaline solutions. The overpotential
seems to drop slightly and also the current needed drops with stirring. This shows clearly the effect of
reducing the mass-transfer limitations within the set-up.

30
Acknowledgements At first I would like to thank Dr. Zheng Li for not only supervising me during the establishment of this
report, but also for helping me with problems in the set-up, analysing results and in general for the
realization of this study.
I would like to thank Prof. Dr. Guido Mul for the ability to use the laboratory equipment, personnel and
time that he made available to help me guide through the creation of this bachelor report. I would like to
thank Robert Meijer to help me and Dr. Li with the set-up when there were problems. Also I would like to
thank Recep Kas for the information he provided, helping me getting a better grasp on the subject.
Figure 25: Logo of the PhotoCatalytic Synthesis Group
31
Symbol List ∆𝐺 Gibbs free energy J/mol 𝑣 Stoichiometric factor for amount of electrons - 𝐹 Faraday constant 96485 C/mol
𝐸° Standard potential V
𝐸 Potential V 𝑅 Gas constant 8.314 J/mol/K 𝑇 Temperature K
𝐸𝑡𝑛 Thermoneutral potential V
∆𝐻𝑟 Reaction enthalpy J/mol 𝐹𝐸 Faradaic efficiency %
𝑄𝑜𝑢𝑡
Charge used for produced hydrogen C
𝑄𝑖𝑛
Charge entering the reactor C, A/s
𝑛 Mole of gas in gas chromatograph C, A/s
[𝐻2] Hydrogen concentration in carrier gas -
𝑃 Pressure Pa
𝑉 Volume m3
𝐼 Current A
𝑡 Time s
𝜙 Flow rate m3/s
𝑅 Resistance Ω 𝜌 Resistivity Ω/m 𝑙 Length m 𝐴 Cross sectional area m2
∆𝑆 Reaction entropy change J/K 𝜂 Overpotential V 𝛽 Tafel Slope mV/dec 𝑖 Current density mA/cm2
𝑖0 Exchange current density mA/cm2
32
References 1 Sherif, S. A., Barbir, F. & Veziroglu, T. N. Wind energy and the hydrogen economy—review of the
technology. Solar Energy 78, 647-660, doi:http://dx.doi.org/10.1016/j.solener.2005.01.002 (2005).
2 Zeng, K. & Zhang, D. Recent progress in alkaline water electrolysis for hydrogen production and
applications. Progress in Energy and Combustion Science 36, 307-326,
doi:http://dx.doi.org/10.1016/j.pecs.2009.11.002 (2010).
3 Grigoriev, S., Porembsky, V. & Fateev, V. Pure hydrogen production by PEM electrolysis for
hydrogen energy. International Journal of Hydrogen Energy 31, 171-175 (2006).
4 Bockris, J., Ammar, I. & Huq, A. The mechanism of the hydrogen evolution reaction on platinum,
silver and tungsten surfaces in acid solutions. The Journal of Physical Chemistry 61, 879-886 (1957).
5 Popczun, E. J., Read, C. G., Roske, C. W., Lewis, N. S. & Schaak, R. E. Highly active electrocatalysis
of the hydrogen evolution reaction by cobalt phosphide nanoparticles. Angewandte Chemie 126, 5531-
5534 (2014).
6 Bates, M. K., Jia, Q., Ramaswamy, N., Allen, R. J. & Mukerjee, S. Composite Ni/NiO-Cr2O3 Catalyst
for Alkaline Hydrogen Evolution Reaction. The Journal of Physical Chemistry C 119, 5467-5477,
doi:10.1021/jp512311c (2015).
7 de Souza, R. F., Padilha, J. C., Gonçalves, R. S., de Souza, M. O. & Rault-Berthelot, J.
Electrochemical hydrogen production from water electrolysis using ionic liquid as electrolytes: Towards
the best device. Journal of Power Sources 164, 792-798,
doi:http://dx.doi.org/10.1016/j.jpowsour.2006.11.049 (2007).
8 Vilekar, S. A., Fishtik, I. & Datta, R. Kinetics of the hydrogen electrode reaction. J. Electrochem.
Soc. 157, B1040-B1050 (2010).
9 Opu, M. S. Effect of Operating Parameters on Performance of Alkaline Water Electrolysis. Int. J. of
Thermal & Environmental Engineering 9, 53-60 (2015).
10 Kubisztal, J. & Budniok, A. Study of the oxygen evolution reaction on nickel-based composite
coatings in alkaline media. International Journal of Hydrogen Energy 33, 4488-4494,
doi:http://dx.doi.org/10.1016/j.ijhydene.2008.06.023 (2008).
11 Wang, Q., Cha, C.-S., Lu, J. & Zhuang, L. The electrochemistry of “solid/water” interfaces involved
in PEM-H 2 O reactors Part I. The “Pt/water” interfaces. Physical Chemistry Chemical Physics 11, 679-687
(2009).
12 Kelly, E. J. & Bronstein, H. R. Kinetics and Mechanism of the Hydrogen Evolution Reaction on
Titanium in Acidic Media. J. Electrochem. Soc. 131, 2232-2238, doi:10.1149/1.2115231 (1984).
13 Fabbri, E., Habereder, A., Waltar, K., Kotz, R. & Schmidt, T. J. Developments and perspectives of
oxide-based catalysts for the oxygen evolution reaction. Catalysis Science & Technology 4, 3800-3821,
doi:10.1039/C4CY00669K (2014).
14 Marshall, A. et al. Iridium oxide-based nanocrystalline particles as oxygen evolution
electrocatalysts. Russ J Electrochem 42, 1134-1140, doi:10.1134/S1023193506100223 (2006).

33
15 McCrory, C. C., Jung, S., Peters, J. C. & Jaramillo, T. F. Benchmarking heterogeneous
electrocatalysts for the oxygen evolution reaction. Journal of the American Chemical Society 135, 16977-
16987 (2013).
16 Gileadi, E. Electrode Kinetics, for Chemists, Chemical Engineers, and Materials Scientist. 4-6 (VCH
Publishers, Inc., 1993).
17 LeRoy, R. L., Janjua, M. B. I., Renaud, R. & Leuenberger, U. ANALYSIS OF TIME-VARIATION EFFECTS
IN WATER ELECTROLYZERS. J. Electrochem. Soc. 126, 1674-1682 (1979).
18 Mazloomi, S. K. & Sulaiman, N. Influencing factors of water electrolysis electrical efficiency.
Renewable and Sustainable Energy Reviews 16, 4257-4263,
doi:http://dx.doi.org/10.1016/j.rser.2012.03.052 (2012).
19 Bagotsky, V. S. Fundamentals of electrochemistry. 2 edn, (John Wiley & sons, 2006).
20 Birry, L. & Lasia, A. Studies of the Hydrogen Evolution Reaction on Raney Nickel—Molybdenum
Electrodes. J Appl Electrochem 34, 735-749, doi:10.1023/B:JACH.0000031161.26544.6a (2004).
21 Conway, B. E. & Bai, L. Determination of adsorption of OPD H species in the cathodic hydrogen
evolution reaction at Pt in relation to electrocatalysis. Journal of Electroanalytical Chemistry and
Interfacial Electrochemistry 198, 149-175, doi:http://dx.doi.org/10.1016/0022-0728(86)90033-1 (1986).
22 Li, Y. et al. MoS2 Nanoparticles Grown on Graphene: An Advanced Catalyst for the Hydrogen
Evolution Reaction. Journal of the American Chemical Society 133, 7296-7299, doi:10.1021/ja201269b
(2011).
23 Krstajić, N., Popović, M., Grgur, B., Vojnović, M. & Šepa, D. On the kinetics of the hydrogen
evolution reaction on nickel in alkaline solution: Part I. The mechanism. Journal of Electroanalytical
Chemistry 512, 16-26, doi:http://dx.doi.org/10.1016/S0022-0728(01)00590-3 (2001).
24 Ge, J. & Isgor, O. B. Effects of Tafel slope, exchange current density and electrode potential on the
corrosion of steel in concrete. Materials and Corrosion 58, 573-582, doi:10.1002/maco.200604043 (2007).
25 Chen, X., Chen, G. & Yue, P. L. Investigation on the electrolysis voltage of electrocoagulation.
Chemical Engineering Science 57, 2449-2455, doi:http://dx.doi.org/10.1016/S0009-2509(02)00147-1
(2002).
34
Appendix
Researchplan Bachelorassignment Scheikundige Technologie (191399259)
Researchplan
Name student Studentnumber
Title Assignment
Research group
Problem definition placed in context
Problem analysis
Methodological approach
Chris van de Goor s1251066
Influence of temperature and pH on the kinetics of water electrolysis on platinum electrodes
Photocatalytic Synthesis Group (PCS)
Hydrogen production nowadays is performed by steam reforming of natural gas, producing large
amounts of CO2. Water electrolysis with renewable electricity is a good alternative for this, but the
energy costs are too high to make it cost effective. Therefore methods to produce hydrogen more
efficiently and at lower production costs should be developed.
Platinum is an excellent material for electrodes in water electrolysis. Until now however, there is a lack
of research of the temperature- and pH-effects on the kinetics of water electrolysis by platinum
electrodes in alkaline solutions.
All the electrodes are made of platinum, this way only the kinetics of the water electrolysis will be
determined, because the thermodynamics will be the same at each electrode. By subtracting the
reference electrode potential from the working electrode potential, the overpotential due to the
kinetics can be found.
Tafel plots will be produced wherein the correlation between potential and current density can be
observed, this way the exchange current density and Tafel slope can be found. The current density and
faradaic efficiency as a function of temperature at constant potential, pH and pressure will be
measured. The current density and yield as a function of pH at constant potential, temperature and
pressure will be measured. All of these at platinum electrodes. The yield is measured to determine the
faradaic efficiency of the process. The faradaic efficiency is the cell potential divided by the total cell
voltage.
35
Experimental approach
________________________________ _____________________________
handtekening student handtekening verantwoordelijk docent (bij inlevering T+2)
_____________________________
handtekening gecommitteerde (bij beoordeling T+3)
An autoclave consisting of three platinum electrodes and a thermal couple will be partially submerged
in a heating mantle. The thermocouple will ensure a constant temperature. The Tafel plots will be
created by performing a potential sweep and measuring the currents. Chronopotentiometry will be
used to find the equilibrium potential at different temperatures. Chronoamperometry will be used to
find the equilibrium current density at different temperature. The same will be repeated, but with
changing pH and constant temperature. The pH will be lowered with sulphuric acid and increased with
sodium hydroxide. Conductivity is ensured with sodium sulphate.
![ACID – BASE BALANCE HOMEOSTASIS Relative [ ] of hydrogen ions pH – potential hydrogen Normal pH: 7.35 – 7.45 7.45 is alkalosis](https://img.pdfslide.us/doc/110x75/551516f755034673228b4c6b/acid-base-balance-homeostasis-relative-of-hydrogen-ions-ph-potential-hydrogen-normal-ph-735-745-745-is-alkalosis.jpg)
![PH regulation. Blood pH pH = measure of hydrogen ion concentration pH = -log [H + ] Blood pH = 7.35-7.45 pH imbalances are quickly lethal body needs](https://img.pdfslide.us/doc/110x75/56649d6b5503460f94a4a848/ph-regulation-blood-ph-ph-measure-of-hydrogen-ion-concentration-ph-log.jpg)


![PH calculations. What is pH? pH = - log 10 [H + (aq) ] where [H + ] is the concentration of hydrogen ions in mol dm -3 to convert pH into hydrogen ion](https://img.pdfslide.us/doc/110x75/56649e865503460f94b8936b/ph-calculations-what-is-ph-ph-log-10-h-aq-where-h-is-the.jpg)