Embed Size (px)
Citation preview
1
A Model for Development of Optimized Feeder Routes and Coordinated Schedules – A Genetic Algorithms Approach
Prabhat Shrivastava* and Margaret O’Mahony**
* Research Fellow, Centre for Transportation Research, Dept of Civil, Structural & Environmental Engineering, Trinity College, Dublin - 2, Ireland ** Director, Centre for Transportation Research, Dept of Civil, Structural & Environmental Engineering, Trinity College, Dublin - 2, Ireland (corresponding author)
Abstract
Many attempts have been made to solve bus route network design problems by splitting it in two stages,
one for routing and the other for scheduling. Some researchers have made attempts to solve network
design problems using non traditional optimization techniques also, but not much has been done on
modeling coordinated operations involving transfers from one mode to another. In this research, feeder
routes and frequencies leading to schedule coordination of feeder buses with main transit are developed
simultaneously using Genetic Algorithms. The coordinated schedules of feeder buses are determined for
the existing given schedules of main transit. Thus the developed feeder routes and schedules are
complementary to each other. As a case study the Dun Laoghaire DART (Dublin Area Rapid Transit)
(heavy rail suburban service) station of Dublin in Ireland is selected. Finally the outcome of the research
is a generated feeder route network for feeder buses and coordinated schedules of feeder buses for the
existing schedules of DART at the selected station. The results of the proposed model indicate improved
load factors on developed routes and also the overall load factor is also improved considerably as
compared to authors’ earlier model.
Key Words: Routing and scheduling, Genetic Algorithms, optimisation, coordinated operations, public
transportation, intermodal coordination.
1. Introduction
The efficiency of the public transport system in any city can be enhanced by integrating its components.
In metropolitan cities of developed and developing countries suburban railway and public buses are major
public transport facilities. In most of the cases each public transport facility is planned and designed
independently. The independent operations develop competition among public transport modes leading to

2
duplication of services and uneconomical operations. Lack of integration increases the transfer and
journey times. The higher journey and transfer times cause dissatisfaction to commuters and they lose
patronage towards public transport facility. Optimized feeder routes and coordinated schedules reduce the
overall journey time of commuters. The purpose of feeder routes is to connect all the destinations for
which demand generates from railway station. However the feeder buses can be made to stop on locations
also on the route if there are demands.
1.1 Literature review and objective of study
In most previous studies, routes and schedules are developed independently so as to avoid complications
and computational burden. Most of the researchers have developed routes from a given initial skeleton
using a heuristic approach. Lampkin and Saalmans (1967), Silman et al. (1974), Dubois et al. (1979), Hsu
and Surti (1976), Dhingra (1980), Mandl (1980), Baaj and Mahamassani (1990 and 1995), developed bus
routes using a heuristic approach by insertion of nodes in the base network. The heuristic approach may
not always guarantee an optimal route structure. So far, very limited studies are made for generation of
feeder routes and schedules for coordinated operations (Shrivastava and Dhingra, 2000). However,
Wirasinghe (1980), Geok and Perl (1988) attempted routing and scheduling problems for coordinated
operations using analytical models. They had considered a highway grid which is assumed to be
rectangular and parallel to a single railway line which may not always be true in practice. They had made
an attempt to describe a complex transit system by approximate analytical models. Thus most of the
studies on coordination of modes are limited to analytical modeling without considering a real life
network. Shrivastava and Dhingra (2001) developed feeder routes using a heuristic approach. These
routes were developed independently without considering the impact of the schedules of feeder buses.
Large numbers of studies are available for problems related to scheduling of public transport
modes. Optimization, simulation and expert system approaches are adopted for many scheduling problems
with single and multiple objectives (Shrivastava and Dhingra, 2000). Limited studies have been made to
obtain optimal schedules for transit networks with transfer time consideration which is a prime concern
for schedule coordination problems. Attempts have been made using computer simulation (Rapp and
Gehner, 1976) and using a combination of optimization and simulation procedures (Bookbinder and
3
Diesilets, 1992). However development of such an optimal schedule is an extremely difficult task even for
a small network (Kikuchi and Parmeswaran, 1993). The difficulty arises because of the large number of
variables and constraints, the discrete nature of variables, and the non-linearity involved in the objective
function and the constraints (Chakroborty et al., 1995). In view of this, techniques like fuzzy logic have
been tried for such problems (Kikuchi and Parmeswaran, 1993). Shrivastava and Dhingra (2002)
successfully attempted schedule coordination problem using Genetic Algorithms (GAs).
A combined routing and scheduling problem was attempted by Hasselstorm (1981) and Marwah
et al (1984). They used a complex two-level optimization model, which first reduces the network by
eliminating links and then assigning frequencies using a linear programming model which maximizes the
number of transfers saved by changing from a link network to a public transport network. Tom and
Mohan (2003) attempted transit route network design using frequency coded Genetic Algorithms for an
urban bus system. Shrivastava and O’Mahony (2005) developed a model for development of feeder
routes and schedule coordination. In this study, feeder routes and coordinated schedules for feeder buses
were developed in two stages using routing and scheduling sub models.
Thus, the literature review reveals that many studies are available for development of routes,
schedules, combined routing and scheduling leading to design of a network. Limited studies are available
for operational integration of public transport modes involving development of feeder routes and schedule
coordination with transfer time consideration between two modes.
The objective of this research is development of a model for generation of feeder routes and
coordinated schedules simultaneously. In actual practice routes and schedules go hand in hand. If routing
and scheduling go together the generated routes support the defined schedules. In view of this, in this
study optimised feeder routes and coordinated schedules are developed together using GAs. As a case
study, Dun Laoghaire DART (Dublin Area Rapid Transit) station in Dublin, Ireland is selected.
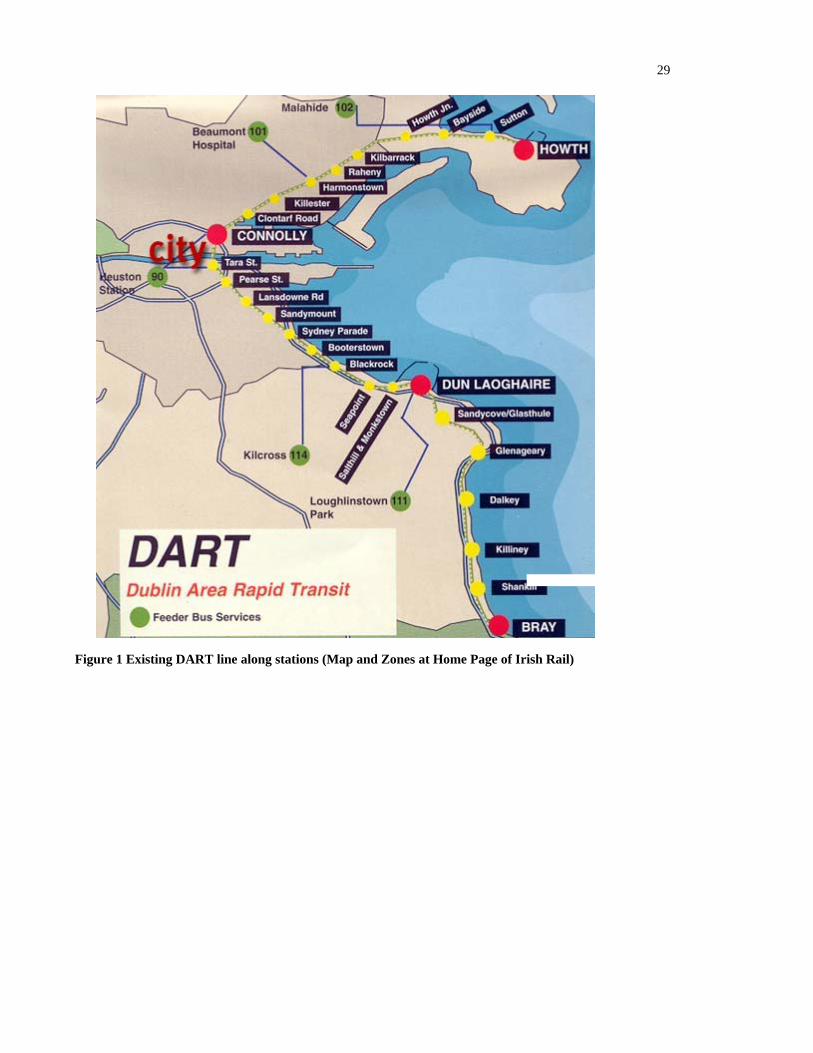
1.2 Details of study area
The Dublin Area Rapid Transit (DART) is a suburban railway system in Dublin, running basically along
the coastline of Dublin Bay from Greystones to Howth and Malahide. There are 32 stations on the existing
DART line. Figure 1 indicates the existing DART line along with various DART stations. Dun Laoghaire
is one of the prominent DART station where after arriving by DART large number of commuters travel
4
by different modes to local destinations. In the absence of an appropriate feeder route system and lack of
coordination between DART and the buses, commuters have to wait and travel longer to reach their
destinations.
Considerable movement of commuters takes place towards Sallynoggin, Monkstown, Deans
Grange, Stillorgan and Loughlinstown areas from the DART station. Currently route numbers 75, 111, 59,
45A, 46A and 46X originate from the station whereas route numbers 7 and 7A originate elsewhere and
pass through the station. Some of the existing routes that originate at a station pass through some of the
locations for which demand does not originate from the station as indicated in our typical traffic survey.
Bus route 75 passes through Stillorgan, Leopardstown, Sandyford, Ballinteer, Oldbawn and Tallaght. Our
survey shows that typically the demand for last three destinations is nil from the station. Moreover the
length of this route is very long at more than one hour. Generally, longer routes pose problems in
maintaining schedules. Similarly bus route 46A goes to the city centre thus duplicating the services of the
DART towards the city centre. Bus route 45A goes to Bray which is parallel to the DART line. Route 59
passes through Dalkey and Killiney. Route 111 also passes through Dalkey and goes to Loughlinstown.
Routes 59 and 111 could be clubbed together and a single feeder route would serve the purpose.
It can be concluded that the existing routes do not serve the purpose of feeder routes and they
also lead to duplication of services. Since the existing routes do not serve the purpose of feeder routes, the
waiting time of commuters at Dun Laoghaire DART station for these routes is found to be about 20
minutes and some times even more during the morning peak hour. Some commuters have to walk more
than 10 minutes to reach their destinations.
2. Data Collection and Analysis
Typical traffic surveys were conducted during the morning peak period i.e. 7 to 9 a.m. on April 28, 2004.
It was observed that the maximum number of commuters travel during 8 to 9 a.m. Therefore this time
period is identified as the peak hour. It has been confirmed during traffic surveys that after 9 a.m.
commuter traffic starts decreasing and becomes much less after 9.30 a.m. onwards.
During the traffic surveys, commuters exiting the DART station were counted manually. Typical
commuter counts revealed that between 8 and 9 a.m. 1293 commuters exit from the DART station.
5
Traffic surveyors conducted sample interviews of commuters leaving the DART station. Between 8 and 9
a.m. 300 commuters were interviewed thus making a sample size above 20%. Enquiries were made
regarding their destinations, mode of transport and travel time to their destinations from the DART
station.
The actual number of commuters using cars / taxis was counted. The expected improved integrated
scenario in terms of reduction in transfer time (less than 5 to 10 minutes) from DARTs to feeder buses
was presented to these commuters. The percentage of these commuters willing to shift to feeder buses was
determined based on their responses. Since a small percentage of DART commuters were using taxis /
cars for their onward journey from DART station, it was possible to get exact number of such commuters.
Similar methodology was successfully implemented by Shrivastava and Dhingra (2001) in the city of
Mumbai, India. The percentages of commuters shifting to public buses were added to those already using
public buses. Destination wise summation gave potential demand matrix.. It was found that 40% of
commuters have their working places very near to the DART station and they have to walk even less than
5 minutes. These commuters were not interested in shifting to public buses even if they are well
coordinated with DART services.
Fifteen potential destinations were identified for the analysis. Connectivity details and distances
between destinations were obtained from a Dublin Street map and a travel distance matrix of size 16×16
which includes the DART station and 15 other destinations as indicated in Table 1 was developed. The
potential demand matrix, travel time matrix and link details were used for analysis.
It was also observed during traffic surveys that in the morning peak period the trains towards city
centre (north bound trains or nth bound) contribute about 30% passengers; the remaining 70% were by
trains from city centre (south bound trains or sth bound). There were nine north bound and eight south
bound trains during the peak hour of 8 to 9 a.m. The schedule coordination for feeder buses is attempted
for theses trains during the indicated peak hour.
3. Model for Development of Optimized Feeder Routes and Coordinated Schedules
The modelling exercise mainly attempts to address the problem of the selection of feeder routes
and coordinated schedules simultaneously. This exercise helps in finding an optimal fleet size for an
optimally designed feeder route network. The feeder route network is to be developed for commuters
originating from the DART station and subjected to one transfer i.e. from DARTs to feeder buses. Since

6
the commuters are already subjected to one transfer, feeder route network is designed without additional
transfer which leads more discomfort to passengers.
The objective function is adopted as minimization of the user’s and operator’s costs. The user’s cost is the
summation of in-vehicle time cost and the transfer time cost between DARTs and buses. The operator’s
cost is associated with running cost (vehicle operation cost) of buses. Constraints are related to load
factor, fleet size and unsatisfied demand. The selected set of k – paths (length lj) for each potential
destination and set of frequencies on these paths are the decision variables. The objective function and
various constraints are given as below. It can be seen that vehicle operation cost and transfer time between
DARTs & coordinating buses depends on selected set of frequencies (fj) of buses on different paths.
Travel time cost will depend on selected set of lengths of k-paths. Similarly all the constraints are function
of frequencies of buses (fj). Fleet size constraint is a function of both decision variables.
3.1 Objective function, constraints and penalties
Objective Function:
Minimize Total cost, Z = (Transfer time cost between DARTs and Coordinating buses + travel time cost in buses on selected routes + Vehicle operation cost of Dublin buses) Mathematically it can be expressed as, Minimize Z =
Transfer Time between nth and sth bound DARTs and buses
C1 ∑∑∑j u l
passju (busj
l - dartu ) δju.l + ∑∑∑
j u l passj
v (busjl – dartv ) δj
v.l +
In vehicle time VOC in bus C2 ∑
j
passj × tinv_j + C3 ∑j
jjTlf
Constraints
1. maxmax.
L
CAPTfQ
j
j≤
×× (load factor should be less than its maximum value)
2. minmax. LCAPTf
Qj
j≥
×× (load factor should be more than its minimum value)

7
3. ∑∈SRj
NBj = ∑∈SRk TP
jRTTfj )(××≤W (for all j≤ SR) (Fleet size should be less than adopted value)
4. unsatj
d∑ = 0 (Unsatisfied demand should be as less as possible)
Where,
j = Number of routes available at each stations (as per number of potential selected destinations)
l = Number of buses available for uth north bound DART and vth south bound DART
VOC = Vehicle operating cost for Dublin buses
C1 = Cost of transfer time in Euro /minute, 11.32 cents/minute for the case study, (Steer Davies, 1994).
C2 = Cost of in vehicle time in Dublin buses, 0.076 cents/minute for the case study (Steer Davies, 1994)
C3 = Cost of operation of bus per Km., € 3.66 for Dublin buses for the case study, (Scott Wilson, 2000).
passju
= Passengers transferring from uth north bound DART to jth route.
passjv
= Passengers transferring from vth south bound DART to jth route.
passj = Total number of passengers transferring to jth route
busjl = Departure of lth bus on jth route
dartu = Arrival of uth north bound DART
dartv = Arrival of vth south bound DART
δju.l = is a term which shows whether the transfer of passengers is possible or not. It attains a value of one
if the transfer is from a uth north bound DART to lth bus on jth route at the DART station is
feasible; otherwise it attains a zero value.
δjv.l = is also a term which shows whether transfer of passengers is possible or not. It attains a value of one
if the transfer is from vth south bound DART to lth bus on jth route at DART station is feasible
otherwise it attains a zero value.
tinv_j = In-vehicle time in bus on jth route
fj = Frequency of buses on jth route in terms of number of bus trips per hour.
lj = length of jth route in kilometers
T = Time period, hours
Qj.max = Maximum number of passengers on jth route for the given time period.

8
CAP = Seating capacity of bus, for Dublin buses it is taken as 74 (Scott Wilson, 2000)
Lmax = Maximum load factor, it is adopted as 1.2 for the case study (Scott Wilson, 2000)
Lmin = Minimum load factor, adopted as 1 for the case study
dunsat = Unsatisfied demand
SR = Set of Routes
NBj = Number of buses required in any route ‘j’
jRT )( = Round trip time of the bus on jth route in minutes = 2 × tj (in minutes) + layover time (5
minutes for the case study)
tj = Total travel time on route in minutes including stopping times (Journey time)
TP = Time Period in minutes
Nj = Number of trips per hour multiplied by the time period in hours under consideration ( fj * T)
W = Maximum number of available buses
The first two terms of objective function indicate the user’s cost and the third term the operator’s cost.
The user’s cost is taken as the summation of costs associated with transferring from DART services (both
north and south bound) to coordinating buses (first term) and the cost of travel time while on buses
(second term). The operator cost is in terms of vehicle operating cost, which is proportional to the distance
traveled by buses (third term). Constants C1, C2 and C3 are used to convert each term of objective function
into monetary unit of Euro (€).As discussed above the vehicle operation cost is taken as cost of bus
operation per kilometer (C3). The value of C3 could be determined easily and accurately from the
literature (Scott Wilson, 2000). The effect of congestion cost is also indirectly incorporated in the
objective function by adopting an average speed of 15 km per hour (Scott Wilson, 2000). Thus the in-
vehicle time term depends on lengths and average speed on selected routes.
It was ascertained that only majority of DART commuters seek transfer at the selected bus stops at the
DART station. Thus transfer time is predominant in the case study. Waiting time will be an important
term if apart from DART commuters substantial numbers of commuters originate from bus stops (at
9
DART station). Since percentage of such commuters were very less as compared to DART commuters the
effect of waiting time is not considered.
The first and second constraints ensure that the load factor lies within a maximum and a minimum
value. If the load factor is less than a maximum value then the crowding level will be less and a better
level of service will prevail. The level of service should not be less than a minimum value so as to
ascertain availability of a certain minimum number of passengers for economical operations. The
maximum load factor is the ratio of crush capacity to normal capacity of Dublin buses. The crush capacity
is taken as 88 and normal capacity is 74; thus the maximum load factor which is the ratio of the two
capacities is taken as 1.2 (Scott Wilson, 2000). The value of minimum load factor is taken as 1.00. The
third constraint is associated with fleet size. This constraint puts the upper limit on the maximum number
of available buses for operation. The fleet size of ‘25’ is decided based on the existing requirement of
buses (on route numbers 75, 111,59,45A) which originate from DART station and pass through most of
the destinations as identified in our typical traffic survey. Later, after analysis, it was found that the
adopted value of 25 is more than the requirement on selected feeder routes. However the fleet size is a
constraint which depends on availability of buses. It was also observed in our typical traffic survey that
the demand for feeder buses gradually increases and reaches a maximum during the peak hour. During the
peak hour, the number of commuters transferring from DARTs to buses remains stable. After the peak
hour, the demand gradually decreases for feeder buses decreases. This assumption is nearly justified
because during the peak hour the demand for feeder buses remains stable, uniform and at a maximum.
However since the demand matrix is a variable, the appropriate demand can be taken for the analysis
during different periods of the day. The fourth constraint ensures that the maximum demand is satisfied
and that the maximum numbers of commuters get coordinating buses during the period of analysis
(Shrivastava et al, 2002).
The objective function and constraints in the study pose a constraint optimization problem;
therefore a penalty method is adopted for optimization (Deb, 1995). If any constraint is violated, an
appropriate penalty is calculated and added to the objective function and thus a penalized objective
function is found. Using the Genetic Algorithms the minimum value of the penalized objective function is
10
determined (best fitness). The routes and frequencies corresponding to this minimum value are optimal.
These optimal frequencies are used to determine coordinated schedules of feeder buses.
Fitness function = Minimize (Objective Function + Penalties 1 to 4)
Penalty 1: if load factor is more than a maximum value (1.2 for the case study)
Penalty 2: if load factor is less than minimum value (1 in this case study)
Penalty 3: if fleet size exceeds a minimum value (25 for the case study)
Penalty 4: if some demand remains unsatisfied
The set of penalties are decided so as to keep the load factors of buses within the prescribed ranges, to
keep the percentage of unsatisfied demand as low as possible and the fleet size less than the specified
value. These penalties are decided after several trials of GA using different sets of values. The GA
parameters are tuned for the objective function and constraints before deciding on the penalties. It is also
observed in our boarding/alighting surveys that it takes about five minutes for commuters to reach the bus
stops located outside the station after arriving on a DART. Thus the minimum desirable transfer time
required from DART to buses is taken as five minutes. Hence in the analysis transfer from a DART to a
bus is taken as feasible only if the bus departs after five minutes of scheduled arrival of the DART.
3.2 Steps involved for development of model
The proposed overall methodology is depicted in Figure 2 for developing feeder routes and coordinated
schedules simultaneously.
(1) The potential demand matrix is developed with the DART station as origin and the destinations as
identified in the surveys.
(2) The travel distance matrix and connectivity details among various nodes were obtained from the map
The travel distance matrix was converted into a travel time matrix in ‘minutes’ using an average
speed of 15 km / hr to address the existing congestion level and road geometrics of the influence area
(Scott Wilson, 2000).
(3) The other parameters like capacity of buses, minimum and maximum load factors, maximum fleet
size, minimum and maximum acceptable lengths of feeder routes, minimum frequency per hour,
multiplying constants to convert user and operator costs in to monetary value of ‘euro’ are selected.

11
(4) Keeping the DART station as the origin, the potential destination nodes are identified on the basis of
potential demand and their location. Thus the nodes which are very close to the DART station are not
selected as potential destinations in spite of having high demands. Selection of such nodes leads to
development of very small routes mushrooming near to the station (Shrivastava and Dhingra, 2001)
and a higher percentage of demand remains unsatisfied due to remote destinations. In view of this,
priority for selection of potential destinations is given to the nodes away from the origin and well
scattered in the influence area of the DART station with a preference to higher demand nodes (if they
are available). Generation of feeder routes and corresponding frequencies is repeated till selected set
of potential destinations satisfies entire demand of the influence area.
(5) Using the K-Path Algorithm, K- shortest paths were developed between DART station and identified
potential destinations (Eppstein, 1994). The genetic algorithm selects the best k – path out of a total
developed for a pair of origin and destination. Thus the k – paths are not predetermined. They are in
fact selected by the genetic algorithms along with a set of bus frequencies. The details of selection of
routes and frequencies by using genetic algorithms are discussed in the section on implementation of
genetic algorithms’ .The value of ‘K’ is adopted as five for the case study. In the influence area, five
nodes which were away from the DART station, well scattered and covering almost entire influence
area were selected as potential destinations. The number of destinations available was sixteen and
five potential destinatios were identified.’. The remaining nodes for development of the routes were
only 11, Therefore, five k – paths for each destination would be enough. However if the number of
nodes are more, then more than a number of k – paths can be developed
(6) The programme to calculate the penalised objective function (summation of objective function and
penalties due to violation of constraints) is developed in a ‘C++’ environment. The developed ‘k’
paths are used with the objective function program. The provision is made so that each alternative
path out of five ‘k’ paths for each potential destination is selected with random frequencies generated
by GA. The alternative paths and frequencies corresponding to the minimum penalized objective
function are selected as optimized feeder routes and frequencies. Assignment of trips is carried out by
exponential function of frequency and distance to make the model more universal (Gundaliya et al,
2000). The exponential function is used to distribute the trips, as per bus frequencies and length of
12
routes. This function has been adopted because choice of routes depends not only on frequencies of
buses but also on length of alternate routes.
(7) The developed objective function is used with LibGA software (Lance Chambers, 1995) in a Linux
environment. GA parameters are tuned and penalties for unsatisfied demand, minimum & maximum
load factors and maximum fleet size are decided. Results obtained by GA are very sensitive to
penalties. Slight changes in penalties show wide variation in results (Shrivastava and O’Mahony,
2005). In view of this, the final values are decided after several trials using different sets of values for
penalties. The minimum value of the penalised objective function is determined and feeder routes and
frequencies corresponding to this minimum value are the optimal feeder routes and frequencies.
Coordinated schedules of feeder buses are derived from these optimal frequencies.
(8) Required number of buses is calculated from optimal frequencies as obtained above ( for the case
study typical calculation for number of buses is made assuming same optimal frequencies after
selected peak hour, in fact requirement of buses will decrease in off peak hours and thus frequency
will get affected)
3.3 Application of GA for Model Development
The importance of this type of problem which is attempted in this research had been highlighted by
Chakroborthy et al (1995) previously. Even after linearizing the problem, complexity remains very large.
The benefit obtained through linearization is offset by the increase in number of variables and constraints.
In general, the number of variables and constraints required are of the order of O (r2n2), where ‘r’ is the
number of routes through the transfer station and ‘n’ is the number of buses/trains on any of the routes.
Chakroborthy et al (1995) attempted to solve the linearized formulation of similar problem, but the
algorithm failed to converge to any solution. Based on this experience and that reported for a similar
problem elsewhere (Kikuchi and Parmeswaran 1993), it was decided to use a robust optimization
technique like Genetic Algorithms rather than classical optimization methods.
3.3.1 Overview of GAs
Genetic Algorithms (GAs) proposed by Holland (1975) are based on exhaustive and random search
techniques, found to be robust for optimizing non-linear and non-convex functions. In the application of
13
Genetic Algorithm the decision variables are usually mapped and represented by a string (Chromosome)
of binary alphabets (genes). For problems with more than one decision variable, a sub-string usually
represents each variable. All sub-strings are then concatenated together to form a bigger string.
The operation of GAs begins with population of random strings representing design of decision
variables. Thereafter, each string is evaluated to find the fitness value. The population is then operated by
three main operators’: reproduction, crossover and mutation to create a new population of points.
‘Reproduction’ selects good string in population, ‘crossover’ operator exchanges the information among
strings of mating pool and ‘mutation’ makes the local search around current solution. The new population
is further evaluated and tested for termination. If the termination criterion is not met, the population is
iteratively operated by above three operators and evaluated. This procedure is continued until the
termination criterion is met. One cycle of these operations and subsequent evaluation procedure is known
as a ‘generation’. Since the research problem falls in the category of constrained optimization problem,
the penalty method which is well suited for such problems is used (Deb, 1995). The Genetic Algorithms
has following advantages over conventional optimization techniques.
(i) GAs work with a string coding of variables instead of the variables. The advantage of working
with a coding of variables is that coding descretizes the search spaces, even though the function
may be continuous. On the other hand, since GAs require only function values at various discrete
points, a discrete or discontinuous function can be handled with no extra burden.
(ii) Since no gradient information is needed in GAs, they can also be applied to non- differentiable
functions. This makes GAs robust in the sense that they can be applied to a wide variety of
problems. Moreover, GAs exploits coding similarities to make a faster and parallel search.
(iii) The greatest advantage of GAs over many traditional optimization methods is that GAs work
with a population of points instead of a single point. Because there are more than one string
being processed simultaneously, it increases the possibility of obtaining global optimum solution
even in ill-behaved functions (Goldberg 1989). Even though some traditional algorithms are
population based, like Box’s evolutionary optimization and complex search methods, those
methods do not use previously obtained information efficiently as GA does.
14
(iv) GAs use probabilistic transition rules instead of fixed rules. In early GA iterations, this
randomness in GA operators makes the search unbiased towards any particular region in the
search space. As a result of not making a hasty wrong decision, it also affects a directed search
later in the optimization process. Uses of stochastic transition rules also increase the chances of
recovering from a mistake.
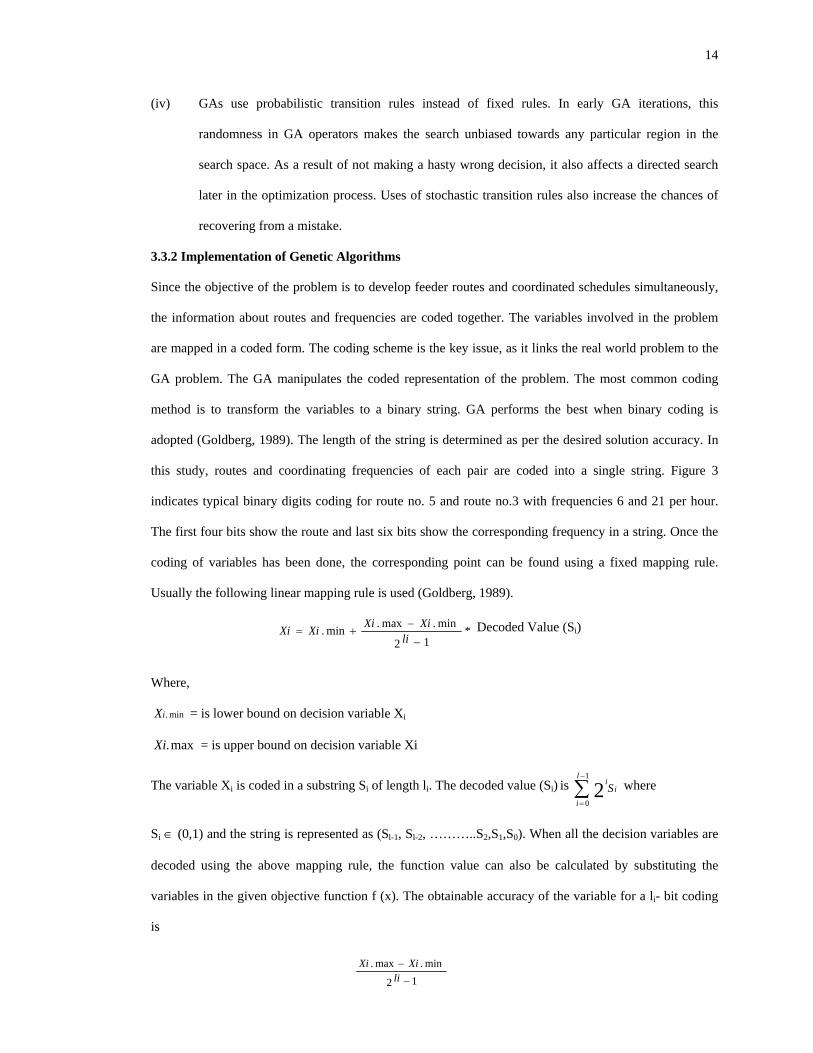
3.3.2 Implementation of Genetic Algorithms
Since the objective of the problem is to develop feeder routes and coordinated schedules simultaneously,
the information about routes and frequencies are coded together. The variables involved in the problem
are mapped in a coded form. The coding scheme is the key issue, as it links the real world problem to the
GA problem. The GA manipulates the coded representation of the problem. The most common coding
method is to transform the variables to a binary string. GA performs the best when binary coding is
adopted (Goldberg, 1989). The length of the string is determined as per the desired solution accuracy. In
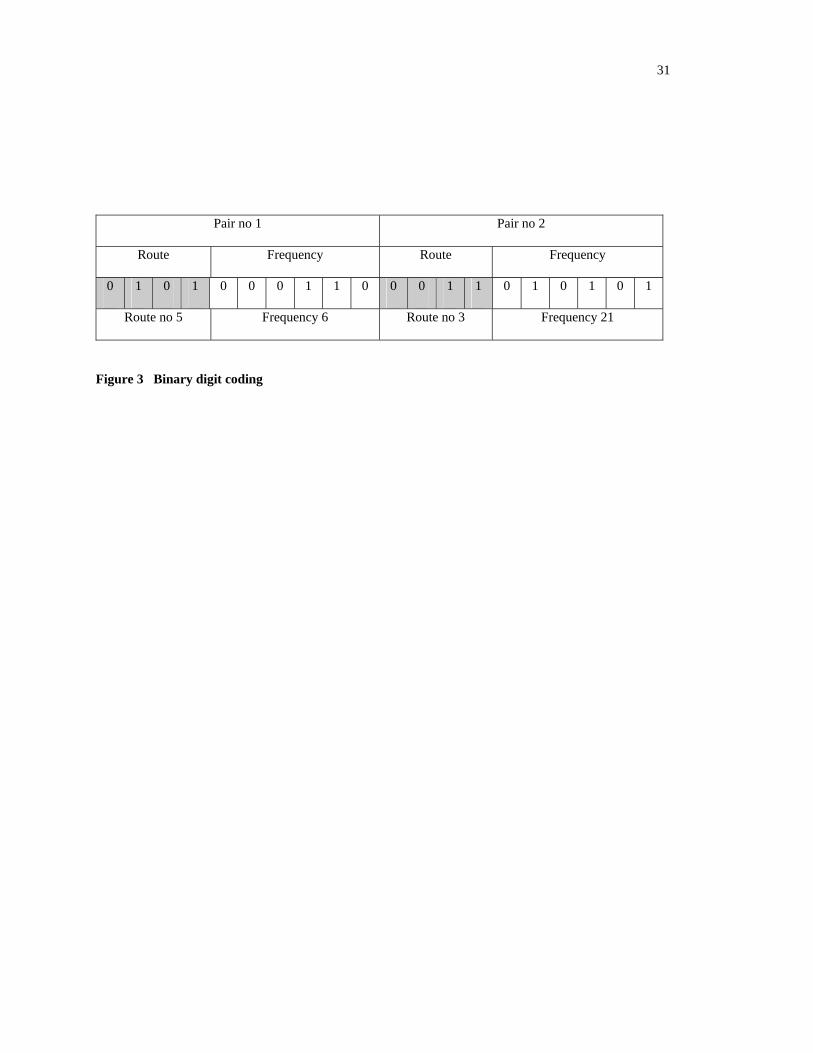
this study, routes and coordinating frequencies of each pair are coded into a single string. Figure 3
indicates typical binary digits coding for route no. 5 and route no.3 with frequencies 6 and 21 per hour.
The first four bits show the route and last six bits show the corresponding frequency in a string. Once the
coding of variables has been done, the corresponding point can be found using a fixed mapping rule.
Usually the following linear mapping rule is used (Goldberg, 1989).
*12
min.max.min.−
−+=
liXiXiXiXi Decoded Value (Si)
Where,
min.iX = is lower bound on decision variable Xi
max.Xi = is upper bound on decision variable Xi
The variable Xi is coded in a substring Si of length li. The decoded value (Si) is i
l
i
iS∑
−
=
1
02 where
Si ∈ (0,1) and the string is represented as (Sl-1, Sl-2, ………..S2,S1,S0). When all the decision variables are
decoded using the above mapping rule, the function value can also be calculated by substituting the
variables in the given objective function f (x). The obtainable accuracy of the variable for a li- bit coding
is
12
min.max.−
−li
XiXi

15
Having decided on the representation, the first step in the simple GA is to create an initial population or
initial parent pool of solutions. This is usually done by generating the number of individuals using a
random number generator. It is advantageous to have as large a parent-pool size as possible to increase the
number of schemata being processed per iteration. However there are obvious constraints of computer
memory space and processing time. An optimal parent-pool size has to be determined for a given problem
(Deb, 1995). Once the parent pool size is determined, the parent pool of solutions is generated by a
random process.
The GA parameters and associated processes were tuned for the proposed objective function.
Different values of crossover probabilities ranging from 0.1 to 1.0 were tested with mutation probabilities
varying from 0.01 to 0.15. The best combination of crossover and mutation probabilities were selected
based on value of penalized objective function (lowest), load factor (with in prescribed limits) and
unsatisfied demand (as minimum as possible). The pool size is also decided on the basis of number of
generations required for convergence. Least number of generations satisfying above criteria is selected
Thus tuning of parameters is done by several trials with different sets of values and following values were
adopted.
Size of each String: 10 (6 bits for frequencies and 4 for routes)
(For schedules: Say max frequency = 60 (1 bus per minute), Min. frequency = 1 (1 bus per hour)
Obtainable accuracy = 1 gives value of li = 5.9 i.e. ‘6’ bits
Similarly for routes: Say (for 15 nodes) if maximum number of routes = 15, min route = 1
Thus for obtainable accuracy of = 1, li = 3.9 i.e ‘4’)
Pool size: 60
Type of crossover: Uniform
Crossover Probability: 0.95
Type of Mutation: Random
Mutation Probability: 0.10
Type of selection: Roulette
Random Seed: 1
Number of Generations: Till Convergence

16
4. Results and Discussions
Well scattered destinations covering the entire influence area of the DART station were selected as
potential destinations and k-paths were developed (k = 5 for the case study) from DART station to these
potential destinations as per codes given in Table 1. The penalised objective function (addition of
objective function and penalties) and developed k-paths are used with Genetic Algorithms. Table 2 shows
the percentage unsatisfied demand with different groups of destinations. It can be seen in the table that a
higher percentage of demand is satisfied when nodes are dispersed and away from the DART station for
the typical network under consideration. The 100% demand is satisfied when potential destinations are
Cabinteely (11), Lough Linstown (12), Mount Merrion (13), Dundrum (14) and Sandyford (15). Thus
these nodes are selected as potential destinations and feeder routes are developed for them from the
DART station. Table 3 gives developed ‘k’ paths with their lengths in terms of travel time in ‘minutes’ for
the above potential destinations.
Figure 4 shows the developed feeder route structure of Dun Laoghaire after the application of
GA. It can be seen that there are five routes starting from Dun Laoghaire DART station (1), as follows:
Route no. 1: 1 – 3 – 11 (length 4.5 Km.)
Route no. 2: 1 – 2 – 3 – 16 – 12 (length 6.75 Km.)
Route no. 3: 1 – 4 – 6 – 7 – 13 (length 8.00 Km.)
Route no. 4: 1 – 6 – 7 – 8 – 14 (length 10.25 Km.)
Route no. 5: 1 – 2 – 5 – 10 – 9 – 15 (length 9.00 Km.)
The lengths of developed feeder routes are within the adopted range of the minimum (2.5 km) and
maximum (15 km). It can be seen that route numbers 3 and 4 overlap partially and that node 3 is common
to both routes 1 and 2. The overlapping aspect of the routes has been analysed successfully.
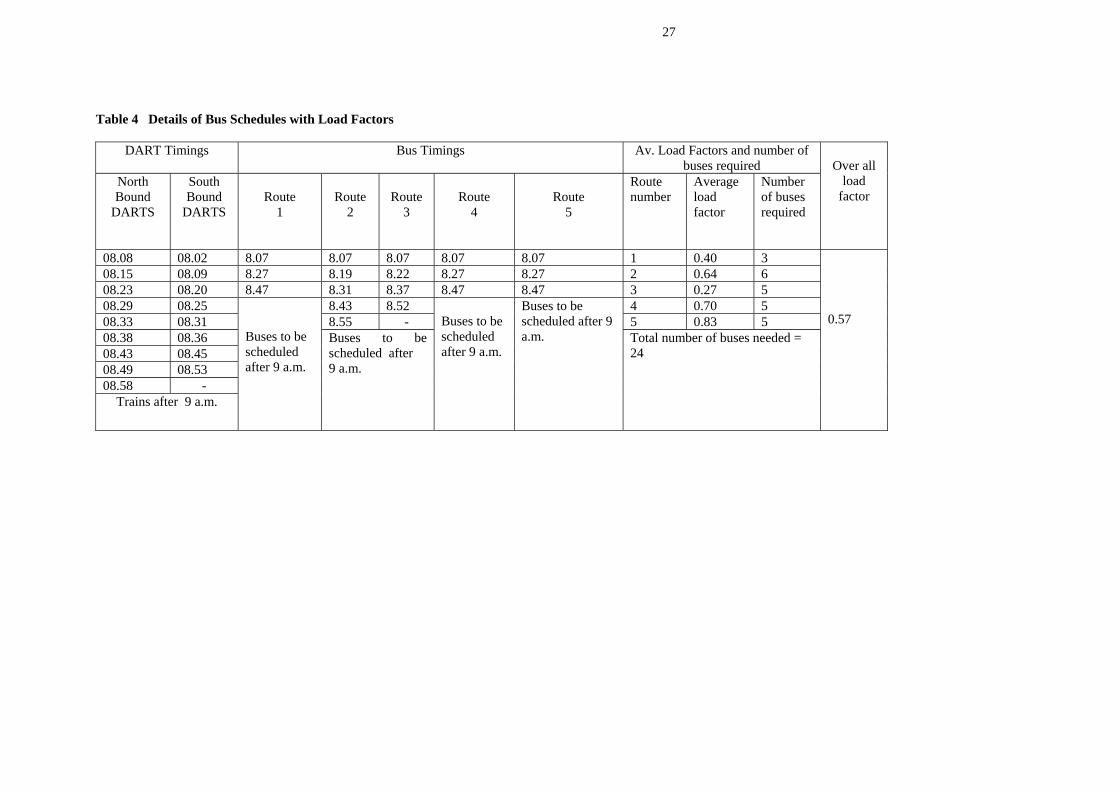
Table 4 indicates coordinated schedules of feeder buses for the existing schedules of DART and
the average load factors on each route. It can be seen in the table that the load factor varies in the range of
0.27 to 0.83. These load factors will further improve due to local demands at en-route stops. The local
demand is not considered because the routes are designed for feeder buses from the DART station. Hence
the satisfaction of the demand generated by the DART station is of prime concern. The overall load factor
attains a value of 0.57 which is a much improved value against the present scenario in which the load

17
factor remains in the range of 0.2 to 0.3 even during peak hours. In the case study, the capacity of feeder
buses is taken as 74 (Scott Wilson, 2000) which is higher than the number of DART commuters
transferring to buses. The load factor will be more (greater than 1) if coordinating buses are held for
longer time. Commuters from many DARTs will be able to seek transfer to a particular bus due to longer
holding periods. Longer holding increases the transfer time between DARTs and feeder buses which is
not desirable to users and will also increase the value of the objective function. Thus the two contradictory
conditions regarding higher load factors for operator and lower transfer time for users are satisfied by
striking a balance between the two. As the load factor decreases below 1, higher values of penalties are
imposed. Thus the load factors obtained in the study are less than 1 but transfer time is well within the
desirable limits which is evident in Table 5. Buses with lower seating capacity will improve the load
factor. Also the load factor will be higher if the model is implemented in places where higher numbers of
train commuters seek transfer to buses.
Shrivastava and O’Mahony (2005) have developed feeder routes and coordinated schedules for
the same study area by decomposing the problem in two stages: one for development of feeder routes and
another for schedule coordination. The load factors for different routes were in the range of 0.16 to 0.45
with an overall load factor of 0.36. Thus the load factors and overall load factor by the proposed model
have been improved compared with those in the earlier model (Shrivastava and O’Mahony, 2005). Total
number of buses required will be 24 with 3, 6, 5, 5 and 5 buses on routes 1, 2, 3, 4 and 5 respectively for
the peak period. However lesser buses will be required during off-peak hours.
Table 5 shows route wise details of the waiting time and by considering all the routes together. If
all the routes were viewed together then it can be seen that 42% of the demand is satisfied within 5
minutes of effective waiting and 29 % is satisfied between 6 to 10 minutes of waiting. Thus more than
70% of demand is satisfied within 10 minutes of effective waiting time and the entire demand is satisfied
within 20 minutes of effective waiting. In the present scenario, the majority of commuters have to wait 20
minutes or even more for buses and the load factor is also less than 0.3 most of the time even during the
peak hours. Looking at table 5 for route details, it can be seen that on route number 2, 62 % of demand is
satisfied within 5 minutes of effective waiting and the entire demand is satisfied with in 10 minutes of
effective waiting. Route number 2 carries about 31 % of the total trips thus making this route a maximum

18
trip carrier. For all the routes, more than 50 % of demand is satisfied within 10 minutes of effective
waiting time.
In the developed feeder route structure, the lengths of routes vary between 4.5 km to 10.25 km
and 100% demand is satisfied without any transfer. If a similar exercise was carried out by identifying the
influence area of all stations shorter feeder routes would be developed which would be better for
maintaining schedules (Shrivastava and Dhingra, 2001). This is due to the fact that a node may be
connected to more than one DART station and its connectivity will certainly be better with a shorter
connecting length from one particular station only. It can be seen in Figure 4 that destinations like
Stillorgan (8), Mount Merrion (13) and Dundrum (14) are closer to Blackrock DART station as compared
to Dun Laoghaire. Thus feeder routes for these destinations from Blackrock will be shorter.
In this research data collection is done during morning peak period for one day only. This has been done
in order to develop the methodology and to demonstrate the results. However to develop actual feeder
route network the influence area of each DART station should be identified and data collection should be
carried out on large scale. The traffic surveys should be conducted during peak and off peak periods of
day for at least a week at all the DART stations to collect more reliable and accurate data. The frequency
(coordinated schedules) of buses will vary as per demand in different periods.
5. Conclusions
In this study, feeder routes and frequencies of coordinating buses leading to coordinated schedules with
the existing schedules of DARTs are optimised using Genetic Algorithms. Thus instead of decomposing
the problem in two stages of development of feeder routes and coordinated schedules the two are
optimised together and are complementary to each other. Decomposition of the problem in two stages had
been the common practice for many network design problems in past. The adopted approach in this
research gave better results in terms of improved load factors as compared to an earlier approach adopted
by the authors (Shrivastava and O’Mahony, 2005) for the same study area and selected destinations. On
the policy side, it can be decided to adopt a fully integrated system with longer journeys by DARTs and
buses can feed the local areas with feeder route network and coordinated schedules as suggested in the
model. The following conclusions can be drawn from the modelling exercise attempted in this study.

19
1. The selection of nodes as potential destinations plays a very important role for successful
development of feeder routes for the type of network under consideration. The network which is
considered for analysis has nodes well scattered in the influence area and destinations having higher
demands are closer to origin (DART station). Some of the destinations away from DART station have
limited connectivity with other nodes. Selection of potential destinations away from the origin and
well dispersed in the influence area develops feeder route structure which satisfy the entire demand
without any transfer.
2. The Genetic Algorithms are found to be very effective in optimization of feeder routes and
coordinated schedules simultaneously. Routes and schedules (frequencies) can be coded into single
strings and GA parameters including population size can be tuned for the objective function. These
concatenated strings are found to be very efficient in simultaneous development of feeder routes and
frequencies leading to coordinated schedules.
3. As a policy decision, the influence area of each station can be identified and the modelling exercise
can be repeated, thus a fully integrated system can be developed in which DARTs can work as a main
line haul facility and buses can feed the local areas. The proposed methodology is able to design
feeder routes without any further transfers and the entire demand is satisfied directly from the DART
station. The model also takes into account the overlapping aspect of different routes successfully.
Another policy decision can be adopted for schedules of feeder buses. The synchronised
services of buses as developed by model can be adopted. The developed coordinated schedules and
feeder routes have following advantages.
a. The user cost (transfer time between DARTs & buses + in-vehicle time) and operator’s cost
(vehicle operating cost) is minimised. The model is also able to maintain a better level of
service (constraint for max load factor), economical operation (minimum level of service),
able to restrict the fleet size (fleet size constraint) and increases the probability of
availability of buses to the majority of commuters (unsatisfied demand constraint). Thus the
model incorporates real life objectives and constraints.
b. On average, the coordinated schedules and feeder routes are able to satisfy more than 50%
of demand within ten minutes waiting and the entire demand is satisfied within twenty
20
minutes of waiting with an overall load factor more than 50%. On some routes, 80 to 90
percent of demand is satisfied within ten minutes of waiting and many routes have load
factors even more than 0.7. In the present scenario (not optimised), the load factor hardly
attains a value more than 0.3 and also the average waiting time is in the range of 20 minutes
or more. Thus the proposed model judiciously balances waiting time and load factors for
feeder buses.
4. The load factors in this case study are less than 1 for most of the feeder routes. One of the reasons for
these low values of load factors is the higher capacity of buses as compared to the demand. Thus one
of the policy decisions can be to allow feeder buses with lower seating capacity. Operation of mini
buses would be quite effective and economical in such situations,
5. The proposed model optimises feeder routes along with coordinated schedules in contrast to earlier
modelling exercises in which feeder routes may remain at suboptimal level. In addition to this the
proposed model is able to provide higher load factors on various routes and also the overall load
factor is improved considerably as discussed above. Thus the proposed model is better than the
authors’ earlier model for the same study area in which problem is decomposed in two separate stages
of routing and scheduling (Shrivastava and O’Mahony, 2005).
It has been indicated in the literature review that studies towards modelling integrated public transport
system are very limited. Thus it can be claimed that the proposed modelling exercise is a specific
contribution towards realistic modelling of integrated public transport system which involves most of the
practical realities and constraints.
References
1. Baaj M.H. and Mahamassani H.S. (1990), “TRUST: A LISP Program for Analysis of Transit Route
Configurations” Transportation Research Record 1283, pp.125 – 135.
2. Baaj M.H. and Mahmassani H.S.(1995), “ Hybrid Route Generation Heuristic Algorithm for the
Design of Transit Networks”, Transpn. Res.C, Vol. 3, No 1, pp 31 – 50
3. Bookbinder James H. and Desilets Alain (1992), “Transfer Optimization in a Transit Network”,
Transportation Science, Vol. 26, No 2, May 1992, pp. 106 – 118

21
4. Chakroborthy Partha, Kalyanmoy Deb, and Subrahmanyam S (1995), “Optimal Scheduling of Transit
Systems Using Genetic Algorithms”. ASCE Journal of Transportation engineering, 121(6), 544 –552.
5. Deb Kalyanmoy (1995), “Optimization for engineering design – Algorithms and Examples” Prentice
Hall of India Pvt. Ltd. , New Delhi, India, pp. 290 – 320.
6. Dhingra S.L.,(1980), “Simulation of Routing and Scheduling of City bus Transit Network”, Ph.D.
thesis, IIT Kanpur, India.
7. Dubois D., Bel G. and Llibre M.(1979), “A set of methods in Transportation Network synthesis and
Analysis”. Journal of Operation Research Society, Vol.30, No. 9, pp. 797- 808.
8. Eppstein David (1994), “Finding the k shortest paths” Tech. Report 94-26, Department of
Information and Computer Science, University of California, USA.
http://www.ics.uci.edu/~eppstein/pubs/Epp-TR-94-26.pdf accessed on 25.09.2004
9. Geok K, and Perl Jossef, (1988), “ Optimization of feeder bus routes and bus stop spacing” Journal of
Transportation Engineering, Vol. 114, No 3, ASCE pp 341-354.
10. Goldberg, D.E. (1989), “Genetic Algorithm in search, optimization and machine learning”, Addison-
Wesley Publishing Co., Reading Mass, 412p.
11. Gundaliya P.J., Shrivastava Prabhat and Dhingra S.L. (2000), “Model for simultaneous routing and
scheduling using Genetic Algorithm” Transporti Europei, Quarterly Journal of Transport Law,
Economics and Engineering, Anno VI, n. 16, December 2000, pp. 10 – 19.
12. Hasselstorm D (1981), “Public Transportation Planning - A Mathematical Programming Approach”,
Ph.D. thesis, Department of Business Administration, University of Gothenburg, Sweden.
13. Holland, J.H. (1992), “Adoption in natural and artificial systems”, 2nd edition, MIT Press, Cambridge.
14. Hsu J. and Surti V.H. (1976), “Demand Model for bus network design” Transportation Engg, Journal
ASCE, Vol 102, TE3, Proc. Paper 12309,pp.451 – 460.
15. Kikuchi, S. and Parmeswaran J (1993). “Solving a Schedule Co-ordination Problem Using a Fuzzy
Control Technique”. In Proceeding of Intelligent Scheduling Systems, Symposium, ORSA- TIMS,
San Francisco, California.
16. Lampkin, W. and Saalmans, P.D.(1967). “The design of routes, service frequencies and schedules for
a Municipal Bus Undertaking: A Case Study”, Operation Res Quarterly Vol. 18, No 4, pp 375- 397.
17. Lance Chambers (1995). Practical Handbook of Genetic Algorithms Applications. Vol I, CRC Press,

22
18. Mandl, C. E. (1980), "Evaluation and Optimization of Urban Public Transport Networks", European
Journal of Operational Research, Vol. 6, pp. 31-56.
19. Maps and Zones at Home page of Irish rail for planning the journey by DART ,
http://www.irishrail.ie/dart/your_journey/maps_and_zones.asp . Accessed on March 22, 2004
20. Marwah, B.R., Umrigar, F.S., and Patnaik, S.B. (1984). “Optimal Design of Bus Routes and
Frequencies for Ahmedabad.” TRR 994 Transportation Research Board: Washington D.C., 12-25.
21. Pattnaik S.B., Mohan S. and Tom V.M. (1998), “Urban Bus Transit Route Network Design Using
Genetic Algorithm” Journal Of Transportation Engineering, ASCE, Vol. 124 No 4, pp. 368 – 375.
22. Rapp M.H. and Gehner C.D. (1976), “Transfer optimization in an interactive graphic system
for transit planning” Transportation Research Record 619, pp. 27 –33.
23. Scott Wilson (2000), Final Report on Bus Network Strategy Appraisal Report for Greater Dublin
Area. www.dublinbus.ie/about_us/pdf/swilson.pdf Accessed May 13, 2004.
24. Shrivastava Prabhat and Dhingra S.L (2000). An overview of bus routing and scheduling techniques.
Highway Research Bulletin, Number 62, pp. 65 – 90.
25. Shrivastava Prabhat and Dhingra S.L. (2001), “Development of feeder routes for suburban railway
stations using heuristic approach” ASCE journal of Transp Engg, USA, Vol. 127, No. 4, pp. 334-341.
26. Shrivastava Prabhat and Dhingra S.L. (2002), “Development of co-coordinated schedules using
Genetic Algorithms” ASCE journal of Transp Engg, USA, Jan/Feb, Vol. 128, No.1, pp. 89-96.
27. Shrivastava Prabhat, Dhingra S.L. and Gundaliya P.J. (2002), “Application of Genetic Algorithm for
Scheduling and Schedule co-ordination problems”, Journal of Advanced Transportation, Vol. 36, No.
1, winter 2002, pp. 23 – 41
28. Shrivastava Prabhat and O’Mahony Margaret (2005), “Modeling an integrated public transport
system-A case study in Dublin, Ireland”, Submitted to ‘Transportation Research - A’ international
journal published by Springer Science.
29. Silman L.A., Brazily Z. and Passy U.(1974), “Planning the rout system for Urban buses”. Computer
and Operation Research, Vol. 1, pp. 201-211.
30. Steer Davies Gleave (1994). Dublin Transportation Initiative, Final Report and Technical reports
(Ten), Stationery Office, Dublin.

23
31. Tom V.M. and Mohan S. (2003), Transit route network design using frequency coded Genetic
Algorithm”, Journal of Transportation Engineering, ASCE, Volume 129, No. 2, pp. 186-195.
32. Wirasinghe, S.C.(1980), “Nearly optimal parameters for a rail feeder bus system on a rectangular
grid.” Transp. Sci. 14A (1), pp33-40.

24
Table 1 Potential Demand to Various Destinations
Potential demand to various destinations Node No. (code)
Destinations 7 – 8 a.m. 8 – 9 a.m. 7-9 a.m.
1 Dun Laoghaire DART Station 00 00 00 2 Dun Laoghaire College 39 202 241 3 Sallynoggin 17 103 120 4 Monks town 10 63 73 5 Deans Grange 16 93 109 6 Temple Hill 02 06 08 7 Black Rock 08 46 54 8 Stillorgan 13 77 90 9 Leopards town 02 08 10 10 Foxrock 02 08 10 11 Maple Manor / Cabinteely 02 04 06 12 Lough Linstown 13 78 91 13 Mount Merrion 02 15 17 14 Dundrum 06 31 37 15 Sandyford 03 15 18 16 Rouches Town Avenue 02 04 06

25
Table 2 Selection of Potential Destinations
Potential Origin
Potential Destinations
Unsatisfied demand
%
Direct demand satisfied,
%
Total demand satisfied
% 1 2,3,4,5,8 26.98 73.02 73.02 1 2,3,4,5,12 26.47 73.53 73.53 1 2,3,4,5,8,12 09.89 90.11 90.11 1 2,3,5,8 29.04 70.96 70.96 1 2,3,5,8,12 09.89 90.11 90.11 1 2,5,8,12,14 05.90 94.10 94.10 1 11,12,13 64.00 36.00 36.00 1 11,12,13,14 15.93 84.04 84.04 1 11,12,13,15 14.00 86.00 86.00 1 11,12,13 16.96 83.04 83.04 1 11,12,13,15 03.98 96.02 96.02 1 11,12,13,14,15 00.00 100 100

26
Table 3 Developed ‘K’ paths between DART station and Potential Destinations Origin
Potential Destination
Nodes in ‘k’ paths
( k=5 ) Travel time
min 1 11 1, 3, 11
1,3,16,11 1,2,11 1,2,3,11 1,2,5,11
18 20 22 22 22
1 12 1,3,16,12 1,2,3,16,12 1,3,11,12 1,2,16,12 1,3,16,11,12
23 27 28 30 30
1 13 1,7,13 1,6,7,13 1,6,8,13 1,4,6,7,13 1,2,4,6,7,13
26 27 30 32 33
1 14 1,6,8,14 1,7,8,14 1,6,7,8,14 1,7,6,8,14 1,2,5,8,14
37 40 41 42 42
1 15 1,6,9,15 1,2,5,9,15 1,6,8,15 1,2,5,10,9,15 1,3,2,5,9,15
34 34 36 36 36
27
Table 4 Details of Bus Schedules with Load Factors
DART Timings Bus Timings Av. Load Factors and number of buses required
North Bound
DARTS
South Bound
DARTS
Route
1
Route
2
Route
3
Route
4
Route
5
Route number
Average load factor
Number of buses required
Over all
load factor
08.08 08.02 8.07 8.07 8.07 8.07 8.07 1 0.40 3 08.15 08.09 8.27 8.19 8.22 8.27 8.27 2 0.64 6 08.23 08.20 8.47 8.31 8.37 8.47 8.47 3 0.27 5 08.29 08.25 8.43 8.52 4 0.70 5 08.33 08.31 8.55 - 5 0.83 5 08.38 08.36 08.43 08.45 08.49 08.53 08.58 -
Trains after 9 a.m.
Buses to be scheduled after 9 a.m.
Buses to be scheduled after 9 a.m.
Buses to be scheduled after 9 a.m.
Buses to be scheduled after 9 a.m. Total number of buses needed =
24
0.57

28
Table 5 Waiting Time Details of Passengers
Percentage Demand Satisfied Duration of Delay in Minutes
Route No : 1
Route No : 2
Route No 3
Route No 4
Route No 5 Overall
0 - 5
31
62
41
31.5
32.5
42
6 - 10
24
38
43
22
20
29
11 - 15
27.5
nil
16
28
29
18.5
15 - 20
17.5
nil
nil
18.5
18.5
10.5
> 20
nil
nil
nil
nil
nil
nil
29
Figure 1 Existing DART line along stations (Map and Zones at Home Page of Irish Rail)

30
No
Yes
Yes No
Yes
Optimization of penalized objective function using Genetic Algorithms Objective function: Minimization (Transfer time between DARTs and Buses + in Vehicle time + Vehicle operating cost) Constraints: Related to Minimum and Maximum load factors, fleet size and unsatisfied demand
TRAFFIC SURVEYS
Surveys for assessing Assessment of potential existing distribution of demand to different DART Commuters on destinations from DART Different Modes station using willingness to shift surveys
Potential O - D MatrixExisting Road Network
Optimized Feeder routes and coordinated schedules
Details of existing bus and DART network - Coded bus and DART network - Link lengths & link travel time - Characteristics of Dublin buses
Existing DART timings
Development of K – paths between DART station and potential destinations
Is entire demand Satisfied?
Optimized feeder routes and coordinated schedules to be adopted
Are the lengths of feeder routes with in
acceptable limits?
Selection of Potential destinations as per demands and locations in the influence
area
Figure 2 Proposed methodologies for development of routes and schedules together
31
Pair no 1 Pair no 2
Route Frequency Route Frequency
0 1 0 1 0 0 0 1 1 0 0 0 1 1 0 1 0 1 0 1
Route no 5 Frequency 6 Route no 3 Frequency 21
Figure 3 Binary digit coding

32
FIGURE 4 Developed feeder route network for Dun Laoghaire DART station
16
1
2 3
4
5
6
7
8
10
9 15
11
13
Joins node 14 at DUNDRUM
Joins node 12 at LOUGH LINSTOWN
Dun Laoghaire DART Station
Route number 2
Route number 1
Route number 5
Route number 3
Blackcock DART station
Route number 4