Embed Size (px)
Citation preview

444 IEEE TRANSACTIONS ON INSTRUMENTATION AND MEASUREMENT, VOL. 37. NO. 3. SEPTEMBER 1988
A Meteorological Data- Acquisition System for Atmospheric Propagation Studies
JEFFREY J. SITTERLE, MEMBER, IEEE, MARK E. PODANY, JAMES M. GALM, MEMBER, IEEE, PAUL c. CLASPY, AND FRANCIS L. MERAT, MEMBER, IEEE
Abstract-Instrumentation for studying the propagation of near-mil- limeter waves has been designed and implemented at a 1 mile long test site in Sandusky, OH. Measurement of the atmospheric structure func- tions and the transverse wind velocity along the propagation path is accomplished with a custom-built meteorological data-acquisition net- work consisting of six towers linked together with fiber-optic data lines. Each tower is microprocessor controlled and includes a 3-axis ane- mometer, a Lyman-alpha hydrometer, and a differential temperature probe; with other meteorological parameters obtained at various 10- cations along the path. A modified ISO-OS1 reference model is used as the controlling protocol.
I. INTRODUCTION T IS WELL KNOWN [ 11, [2] that the spatial and tem- I poral inhomogeneities in the temperature, humidity, and
pressure fields of the atmosphere cause stochastic fluctua- tions in the complex-valued index of refraction which can result in serious degradation to the propagation of electro- magnetic radiation. The requirements for an atmospheric propagation experiment are, thus, a means of measuring the characteristics of the propagating beamwave while simultaneously measuring the relevant (micro)me- teorological parameters of the atmosphere. This paper will not address the measurement of the propagation charac- teristics, but will describe a system which has been im- plemented for measuring the necessary meteorological parameters.
The meteorological data-acquisition system (MDAS) is a distributed multimicroprocessor network operating in a mastedslave relationship with a host computer. MDAS utilizes the concept of minimum hardware implementa- tion with maximum software flexibility to accommodate experimental changes. For MDAS this resulted in the se- lection of microprocessors with integral data communi- cation features using minimal memory and user defined peripherals. A modified ISO-OS1 reference model is used as the controlling protocol [3] (this protocol does not nec- essarily apply to the applications and data-acquisition protocol). System flexibility is attained by using the host
Manuscript received August 27, 1987; revised February 13, 1988. This work was supported in part by the U.S. Army Research Office under Con- tract DAA-29-81-K-0172.
J . J . Sitterle is with the Georgia Tech Research Institute, Georgia Insti- tute of Technology, Atlanta, GA 30332.
M. E. Podany, J . M. Galm, P. C. Claspy, and F. L. Merat are with the Department of Electrical Engineering and Applied Physics, Case Western Reserve University, Cleveland, OH 44106.
IEEE Log Number 8821906.
computer to dynamically reprogram the distributed sys- tem; therefore, the logical architecture of the system can be quickly changed to meet new data-acquisition or con- trol requirements with no hardware changes.
The physical layout of MDAS described in this paper is based on a near-millimeter (NMM) wave propagation experiment [4], however, the basic elements of the net- work are the same for any type of experiment requiring characterization of the atmosphere over specified dis- tances. In the next section, a description of the atmo- sphere for NMM waves (wavelengths which extend from the millimeter region to the long-wave region of the in- frared; Le., 1 mm to 100 p ) is given. Here, we assume the atmosphere is a clear, nonionized medium character- ized by stochastic fluctuations in the complex index of refraction. Section I11 describes the hardware and soft- ware used in the multimicroprocessor network. Detailed schematics of the hardware and the software listings can be found in [5] . The meteorological instrumentation spe- cific to the NMM propagation experiment is discussed in Section IV. Finally, a summary of the main results of the paper appear in Section V.
11. RELATIONSHIP BETWEEN THE METEOROLOGICAL MEASUREMENTS AND ATMOSPHERIC PARAMETERS
In this paper, it is assumed that the atmosphere is char- acterized by a clear (nonparticle containing), nonionized medium, with a magnetic permeability p = 1 and a com- plex stochastic index of refraction n ( r , t ) . The index of refraction model can be written as
n ( r , t ) = noR + anR(r, t ) + i(nol + anI(r, t ) ) (1)
where nOR and nor are the mean values of the real and imaginary parts, and anR(r, t ) and anI ( r , t ) are the fluc- tuating real and imaginary parts. The real part of the com- plex index of refraction is related to the amount of scat- tering of the propagating beamwave by the atmosphere and the imaginary part indicates the amount of absorption of the beamwave. Also, by definition, ( n ( t , t ) ) = noR + inol and ( anR(r, t ) ) = ( dn,(r , t ) ) = 0. For clear- air turbulence, it is normally assumed that anR(r, t ) is small (Le., max (anR(r, t ) ) = 10-’noR; where noR = 1 ) and that its temporal dependence is given by Taylor’s frozen flow hypothesis as anR(r, t ) = &,(r - V ( r ) t ) where V ( r ) is the vector wind velocity [6].
0018-9456/88/0900-0444$01 .OO O 1988 IEEE
SITTERLE ef ai. : METEOROLOGICAL SYSTEM 445
The refractive index structure constants, Cf, which are a measure of the magnitude of the fluctuations in the com- plex index of refraction, are related to the fundamental atmospheric statistics by [7]
where the subscripts R and I denote the real imaginary parts, ( T ) is the absolute temperature, ( Q ) is the ab- solute humidity, and 7 gives the position dependence of the structure functions along the length of the propagation. path [8]. In (2), A T , AQ, BT, and BQ, are wavelength de- pendent quantities which are calculated from the atmo- spheric index of refraction and absorption spectra. C $ ( q ) , C i ( 7 ), and C , ( 7 ) can be experimentally determined
where the numerator represents an ensemble average of the difference between two temperature (or humidity) points separated by r and at a distance 7 from the trans- mitter. This definition assumes that the Kolmogorov 2/3- law holds true for the temperature (humidity) distribution.
From the above discussion, it can be seen that each me- teorological instrumentation tower in MDAS is required to measure the following quantities: differential temper- ature, differential humidity, absolute temperature, abso- lute humidity, and vector wind velocity. The temperature and humidity measurements are used with (2) and (3) to determine Cf, while the wind velocity is used to deter- mine the temporal dependence of the fluctuations. Other instrumentation which is available at various towers are rainfall rate measurement devices and particle size mea- surement devices. Measured values can either be summed to obtain a path average of the parameters or can be fit with a smooth curve to obtain the parameters as a function of path length.
111. METEOROLOGICAL NETWORK The requirements of a meteorological data-acquisition
system are that sampling rates must be fast enough to measure turbulence and samples of the atmospheric con-
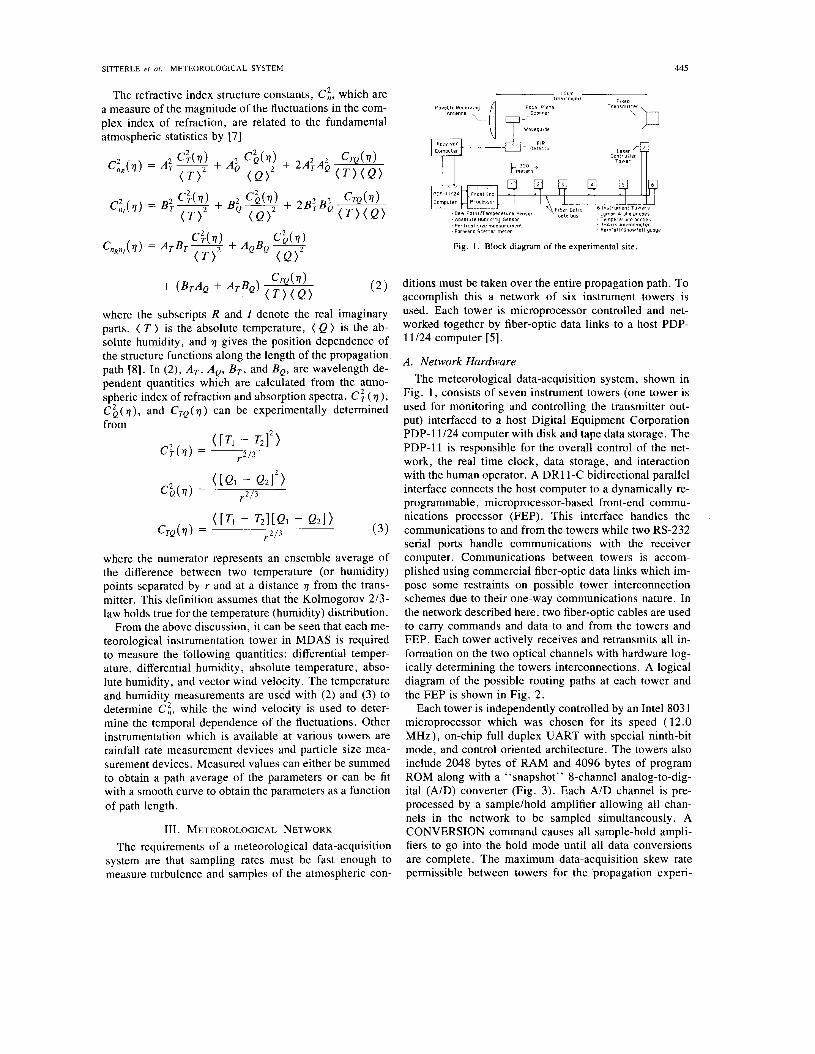
Fig. 1 . Block diagram of the experimental site.
ditions must be taken over the entire propagation path. To accomplish this a network of six instrument towers is used. Each tower is microprocessor controlled and net- worked together by fiber-optic data links to a host PDP- 11/24 computer [ 5 ] .
A . Network Hardware The meteorological data-acquisition system, shown in
Fig. 1, consists of seven instrument towers (one tower is used for monitoring and controlling the transmitter out- put) interfaced to a host Digital Equipment Corporation PDP-11/24 computer with disk and tape data storage. The PDP-11 is responsible for the overall control of the net- work, the real time clock, data storage, and interaction with the human operator. A DR1 I-C bidirectional parallel interface connects the host computer to a dynamically re- programmable, microprocessor-based front-end commu- nications processor (FEP). This interface handles the communications to and from the towers while two RS-232 serial ports handle communications with the receiver computer. Communications between towers is accom- plished using commercial fiber-optic data links which im- pose some restraints on possible tower interconnection schemes due to their one-way communications nature. In the network described here, two fiber-optic cables are used to carry commands and data to and from the towers and FEP. Each tower actively receives and retransmits all in- formation on the two optical channels with hardware log- ically determining the towers interconnections. A logical diagram of the possible routing paths at each tower and the FEP is shown in Fig. 2 .
Each tower is independently controlled by an Intel 803 1 microprocessor which was chosen for its speed (12.0 MHz), on-chip full duplex UART with special ninth-bit mode, and control oriented architecture. The towers also include 2048 bytes of RAM and 4096 bytes of program ROM along with a "snapshot" 8-channel analog-to-dig- ita1 (A/D) converter (Fig. 3). Each A/D channel is pre- processed by a sample/hold amplifier allowing all chan- nels in the network to be sampled simultaneously. A CONVERSION command causes all sample-hold ampli- fiers to go into the hold mode until all data conversions are complete. The maximum data-acquisition skew rate permissible between towers for the propagation experi-

446 IEEE TRANSACTIONS ON INSTRUMENTATION AND MEASUREMENT, VOL. 31, NO. 3, SEPTEMBER 1988
I I I T T T
S"."P Cbv
TTP 4-k (b)
Fig. 2. Possible routing paths at each tower. (a) Tower to tower. (b) FEP to tower.
I J Timing b Other
ini trumentit ion Sy"ctlrO"lZOtl0"
Fig. 3. Block diagram of tower hardware.
ment is approximately 0.1 ms [7]. In MDAS, a CON- VERSION command sent to all towers simultaneously yields an overall maximum latency (due to a combination of transmission delays and skewing of the individual mi- croprocessor clocks) between any two channels on any two towers that is well within the above maximum. The FEP is an 8031 system identical to those in the towers with the addition of extra memory and a parallel 16-bit interface to the host computer.
Maximum system data-acquisition rates are determined by the complexity of the data-acquisition software resid- ing in the individual towers. With the current NMM wave experiment system software, the system is capable of sampling all 48 (6 towers by 8 channeldtower) A/D chan- nels and transmitting the data to the host computer at a maximum sampling rate of 250 Hz. The maximum sam- pling speed for obtaining data from a single channel on one tower is 6 kHz.
B. Network Software The basic philosophy behind the data-acquisition net-
work was to design a very flexible system that would al- low a wide variety of experiments to be run over a period of many years. Therefore, the software is organized in a modular fashion that permits it to evolve as experiments
" I z 1 d,,,, W">" T T n i/ /)I
Fig 4 Data-acquisition system logical layer block diagram
grow and change. A protocol based on the ISO-OS1 model given by Tanenbaum [9] provides the modularity needed for tower communications. This model was slightly mod- ified to include the mastedslave relationship between the FEP (master) and towers (slaves). The ISO-OS1 model for the system contains seven layers of protocol given as (Fig. 4) :
1) Application Layer-Responsible for obtaining and transferring necessary files to run the network and collect real-time data via human interface. This layer uses the network protocol and subroutines developed at the net- work layer for data communications.
2 ) Presentation Layer-Contains the implementation of frequently used subroutines called by the application layer. These include tower diagnostics and sensor checks, logical reconfiguration of the link, downloading of pre- defined "user" software to individual towers, a RUN LINK command to cause downloaded tower programs to execute, and an ABORT LINK command to return all towers to the network.
3) Session Layer-The lowest user interface into the network. Software executes in the PDP-11 and controls the parallel data communications between the host and the FEP. This layer translates commands from the presenta- tion layer into a appropriate commands to the local net- work layer and keeps the host computer informed to sys- tem status.
4) Transport Layer-The FEP software responsible for control of the subnet, data acquisition and formatting, and encoding commands.
5 ) Network Layer-It is this layer that significant de- partures occur from Tanenbaum's model [9]. The local network layer is responsible for decoding network wide commands from the session layer into commands that can be sent to individual towers, as well as all system diag- nostics. The remote network layer is responsible for the execution of the received commands within the individual towers.
6) Data Link Layer-Uses the physical layer to provide an error free data path. The ninth bit is added to the data packet to signal a command. By setting this bit high, the FEP is able to interrupt the towers with a command or

SITTERLE et al . : METEOROLOGICAL SYSTEM 447
leave it low to communicate with a previously selected tower.
7) Physical Layer-This is the hardware level of the communication system, including the fiber-optic data links.
The application layer is the entry point to the software programs which define the actual experiment. The above described control protocol ensures that programs can be downloaded to the towers, started up, and control re-es- tablished to the control network at any time. A typical data collection session begins with the user selecting which instruments (A/D channels) are to be used on each tower. This information is encoded into a parameter block, along with the desired sampling rate and separately sent to each tower. A global start command is then transmitted to all towers simultaneously to initiate execution. Data are uploaded from each tower to the FEP and, when the FEP’s buffer is full, the PDP-11 is interrupted through the DRl l -C so that the host can display and store data on disk and magnetic tape.
IV. METEOROLOGICAL INSTRUMENTATION
The configuration of the meteorological instrumenta- tion for NMM wave propagation measurements is given in Fig. 1. Each tower (Fig. 5) is equipped with differential temperature and humidity probes, 3-axis anemometers and a rainfall/snowfall gauge. Other instrumentation placed at various locations on the site includes an EG&G model 220 ambient and dew point temperature sensor, a polymer humidity sensor (both are used to obtain absolute humid- ity values), PMS models GBPP-100 and CSASP-100 par- ticle size measurement systems, an EG&G model 207 for- ward scatter meter, and Lockheed model GO1 optical scintillometers. The forward scatter meter combined with the PMS probes provide measurements of particle size over a 0.5-6400-pm particle diameter range and are lo- cated at the receiver end of the site. Rainfall is measured with an electrooptic gauge that has a sensitivity of 0.0083 mm and snowfall is measured with a heated 0-500 mm/h gauge with a resistive sensor. The scintillometers are used to verify the assumption of turbulence homogeneity along and across the propagation path.
The differential temperature measurement system is based upon work done at the U.S. Army’s Atmospheric Sciences Laboratories with incandescent light bulb fila- ments [lo]. The tungsten filament wires of the light bulbs, when removed from the evacuated glass bulbs, respond to changes in the ambient temperature with a proportional change in resistivity. This change in resistance has a fairly large bandwidth and exhibits sufficient linearity to make these sensors usable for many atmospheric measurements. Differential temperature, equivalent to the ( T , - T2) term of (3) , is measured at each of the towers by placing two of the filament resistors in a bridge configuration. DC off- set in the electronics is avoided by pulsing the bridge to provide an ac signal. The ac bridge output is processed by a Precision Monolithics GAP-01 functioning as a phase
Fig. 5 . Photo of tower no. 1 of the meteorological network.
sensitive detector, followed by a two-pole 100-Hz filter for signaling conditioning before the A/D converter. The sensor configuration is located approximately 2 m off the ground with an adjustable spacing between filaments of 100 cm to 1 m [ l l ] .
Humidity is measured with a Lyman- Alpha hydrometer similar to that described by Buck [ 121. An ultraviolet (UV) source emits at the Lyman-Alpha absorption line of hy- drogen and an ionization-type detector measures the source power at a fixed distance from the source. The de- tected signal is directly related to the absorption of the UV radiation by the hydrogen atoms of water molecules between source and detector. This signal yields a very fast (sub-millisecond) measurement of the absolute water va- por density (humidity) between the source and detector when correctly calibrated.
From an electronic viewpoint the source tube is pro- vided a high-voltage constant current by a current mirror. Because the source tube operates by emission from hy- drogen liberated from uranium hydride in the tube by heating an internal filament, the source output is very sen- sitive to operating temperature changes. To maintain a constant source output, the tube temperature is regulated by a P-I controller. Tube temperature is measured with thermistor sensors embedded in a foam insulation layer surrounding the tube and the temperature is vaned by pulsewidth modulation of the tube’s filament current. The detector tube, an ionization type device, looks like a high impedance current source. An electrometer chip (Analog Devices AD5 15K) provides the necessary transconduc- tance gain. Differential humidity measurements are ob- tained by subtracting and filtering (along with special pro- cessing to remove the dc term) the outputs from individually matched Lyman-Alpha hydrometers.
The wind sensors are commercially available three-axis generator-type anemometers [ 131, employing permanent magnet proportional tachometers. An offset buffer ampli- fier provides signal conditioning to convert the bipolar voltages generated by the anemometers to a 0- to 5-V sig- nal for the A/D system with 2.5 V representing a zero wind velocity.

448 IEEE TRANSACTIONS ON INSTRUMENTATION AND MEASUREMENT. VOL. 37, NO. 3. SEPTEMBER 1988
T l m t ~ o l stmt o f pun fsecl
Fig. 6. Typical differential temperature fluctuations ( 16-in. sensor sepa- ration).
* 7
P
~ ~ + ~ - t + + - t t + - i - - H - i - - t -t-k--
Time f rom 5 t a p t O f run Imi”“teS1
Fig. 7. Typical humidity fluctuations.
++r+-wm o m ‘,-L:: T i m e i”t0 P Y ” lml””te51
Fig. 8. Typical transverse vector wind velocity fluctuations.
Typical differential temperature (40.6-cm probe sepa- ration), absolute humidity, and transverse wind velocity data are shown in Figs. 6-8. The value of C’, obtained from the data in Fig. 6 is 4.56 X lop6 0C2m-2/3. Typical values of the structure constants for NMM wavelengths that have been observed so far show that CiR is on the order of lo-” m-2/3, C:, is on the order of m-2/3,
and CnRn, is 0 to the current system computational accu- racy.
V. CONCLUSION A data-acquisition network has been developed to per-
form high-speed measurements of meteorological param- eters over a one mile test site. The network consists of six instrument towers which are capable of collecting differ- ential temperature, differential humidity, absolute tem- perature, absolute humidity, vector wind velocity, and rainfall rate at set locations along the site. The towers are interconnected via fiber-optic data links to a dynamically reprogrammable, microprocessor-based FEP which com- municates with the host PDP-11/24 computer through a bidirectional parallel interface. A protocol based on the ISO-OS1 model provides the flexibility required for tower communications and network control.
The meteorological instrumentation presented here and the propagation measurement system described elsewhere [4] form a complete experiment for investigating the ef- fects of atmospheric turbulence and turbidity on electro- magnetic propagation. The variance, temporal spectrum, and mutual coherence function of the propagation beam- wave are computed from both the received electromag- netic radiation and the meteorological parameters of the intervening atmosphere. Correlation of these results will provide a database for modeling near-millimeter wave propagation in terms of measurable meteorological con- ditions.
REFERENCES [ 11 J . C. Owens, “Optical refractive index of air: Dependence on pres-
sure, temperature, and composition,” Appl. Opt . , vol. 6, p. 51, 1967. [2] R. J . Hill, S . F. Clifford, and R. S . Lawrence, “Refractive index and
absorption fluctuations in the infrared caused by temperature, humid- ity, and pressure fluctuations,” J . Opt. Soc. Am., vol. 70, p. 1192, 1980.
[3] H. Zimmerman, “OS1 reference model-The IS0 model of architec- ture for open systems interconnection,” IEEE Trans. Comm., vol. COM-28, pp. 425-432, Apr. 1980.
[4] J. J. Sitterle, R. M. Manning, P. C. Claspy, and F. L. Merat, “In- strumentation for near-millimeter wave propagation studies,” Opt. Eng., vol. 25, no. 8, pp. 990-994, Aug. 1986.
IS] J. C. Gibbons, “A distributed multimicroprocessor data-acquisition system,” Master’s thesis, Case Western Reserve Univ., Cleveland, OH, 1983.
[6] R. Lawrence and J. Strohbehn, “A survey of clear-air propagation effects relevant to optical communications,” Proc. IEEE, vol. 58, p. 1523, 1970.
[7] R . W. McMillan, R. A. Bohlander, and G . R. Ochs, “Instrumenta- tion for millimeter wave turbulence measurements,” Proc. SPIE, vol. 305, p. 253, 1981.
(81 R. L. Fante, “Electromagnetic beam propagation in turbulent media: An update,” Proc. IEEE, vol. 68, no. 1 1 , p. 1424, Nov. 1980.
[9] A. S . Tanenbaum, Computer Networks. Englewood Cliffs, NJ: Prentice-Hall, 1981.
IO] D. Brown, U.S. Army Atmospheric Sciences Lab., White Sands, NM, personal communication, 1981-1982.
I l l F. L. Merat, P. C . Claspy, and R. M. Manning, “Characterization of millimeter wave propagation through a turbid atmosphere,” Opti- cal Engineering for Cold Environments, Proc. SPIE, vol. 414, p. 126, 1983.
121 A. Buck, “Notes on the fabrication of a fixed-path Lyman-Alpha hy- drometer,” RSF 040-032-004, Nat. Center for Atmospheric Res., Boulder, CO, Dec. 1979.
131 Gill UVW Anemometer/Propeller Anemometer, R . M . Young Co., Transverse City, MI 49684.

![Propagation of Bessel and Airy beams through atmospheric ... · modify the propagation of laser beams through atmosphere [1-7]. In weak atmospheric turbulence, the modifications can](https://img.pdfslide.us/doc/110x75/5f30f0d7fc73d56e2278b679/propagation-of-bessel-and-airy-beams-through-atmospheric-modify-the-propagation.jpg)