Embed Size (px)
Citation preview

India Meteorological Department
MONSOON ASIAN HYDRO ATMOSPHERIC SCIENTIFIC RESEARCH and PREDICTION
INITIATIVE&
ASIAN MONSOON YEAR 2008N.Y.APTE (Director)
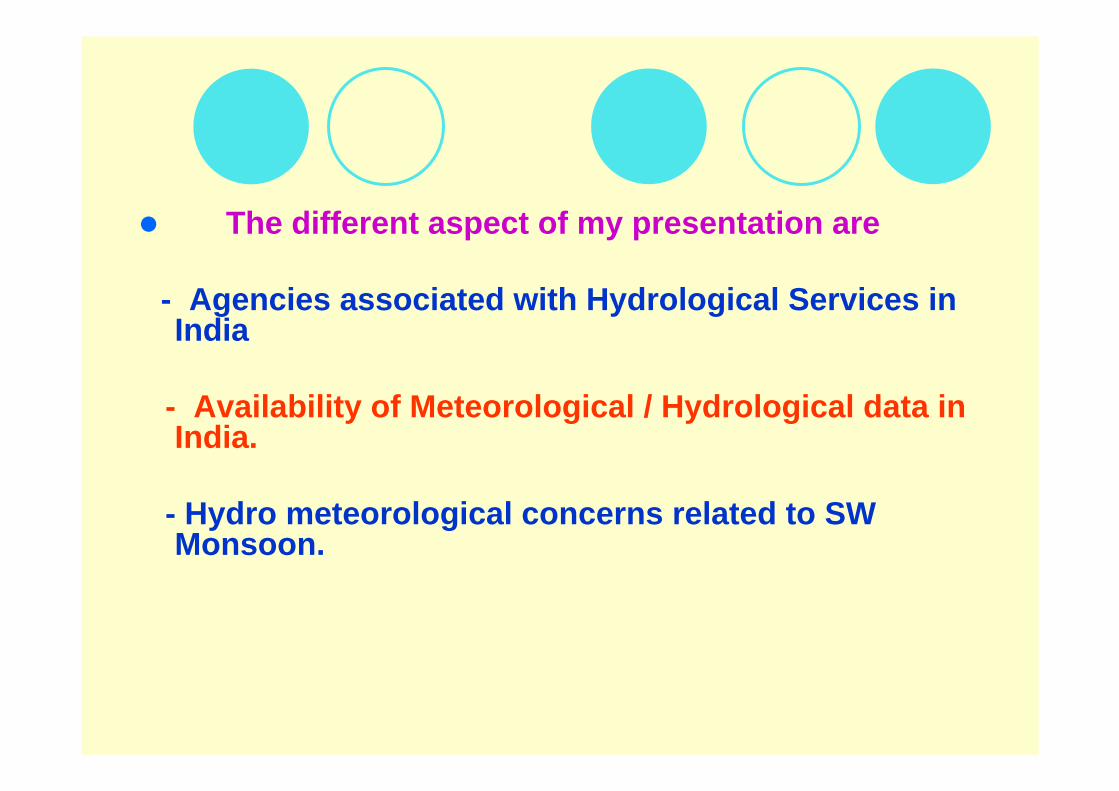
The different aspect of my presentation are
- Agencies associated with Hydrological Services in India
- Availability of Meteorological / Hydrological data in India.
- Hydro meteorological concerns related to SW Monsoon.
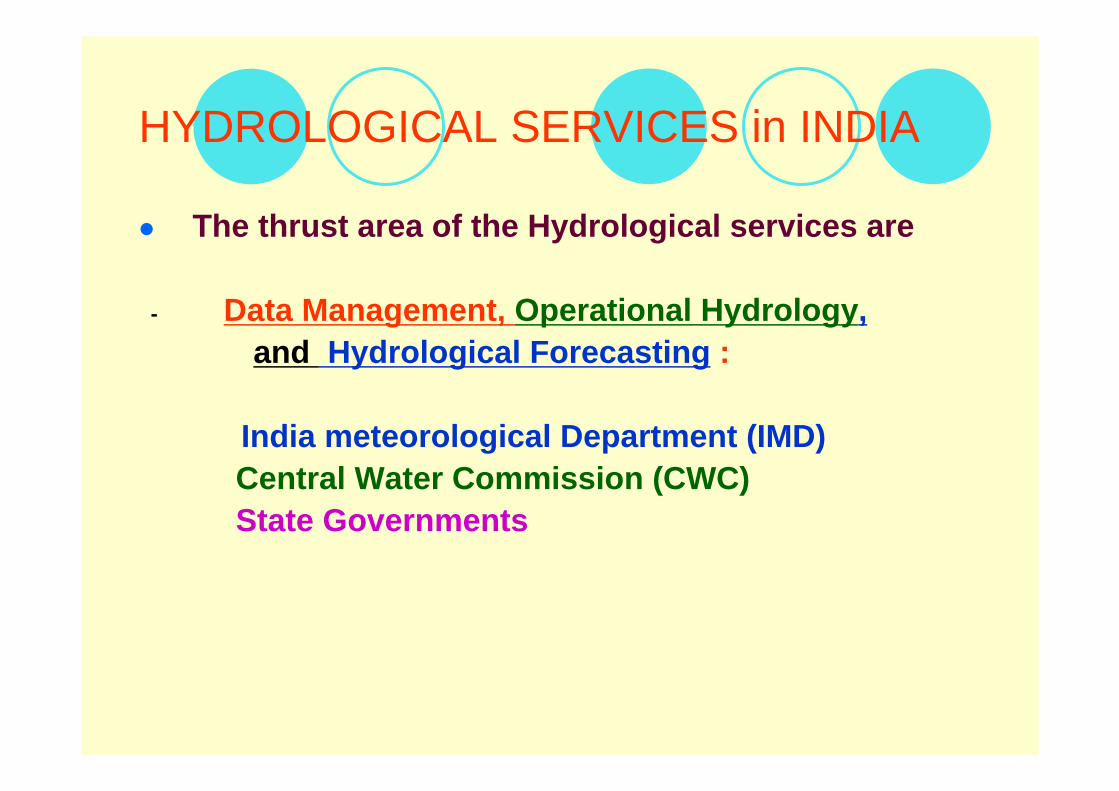
HYDROLOGICAL SERVICES in INDIA
The thrust area of the Hydrological services are
- Data Management, Operational Hydrology,and Hydrological Forecasting :
India meteorological Department (IMD)Central Water Commission (CWC) State Governments

Research, Model Development, Training in:
1 Meteorology / Hydro Meteorology
- India meteorological Department - Indian Institute of Tropical Meteorology - National Center for Medium Range
Forecasting - Indian institute of sciences
- Academic Institutions, Universities etc

Research, Model Development, Training in:
2 HYDROLOGYCentral water CommissionNational Institute of HydrologyIndian institute of Technology (s)Academic Institutes, Universities.

Meteorological Data Collection Network ofIndia Meteorological Department
SURFACE OBSERVATORIES NETWORKSurface Observatories 559Aviation Current Weather Observatories 71High Wind Speed Recording Stations 4INSAT-based Data Collection Platforms 100
Hydro meteorological Observatories Non-Departmental Raingauge Stations:-
Reporting – 3540Non-Reporting 5039
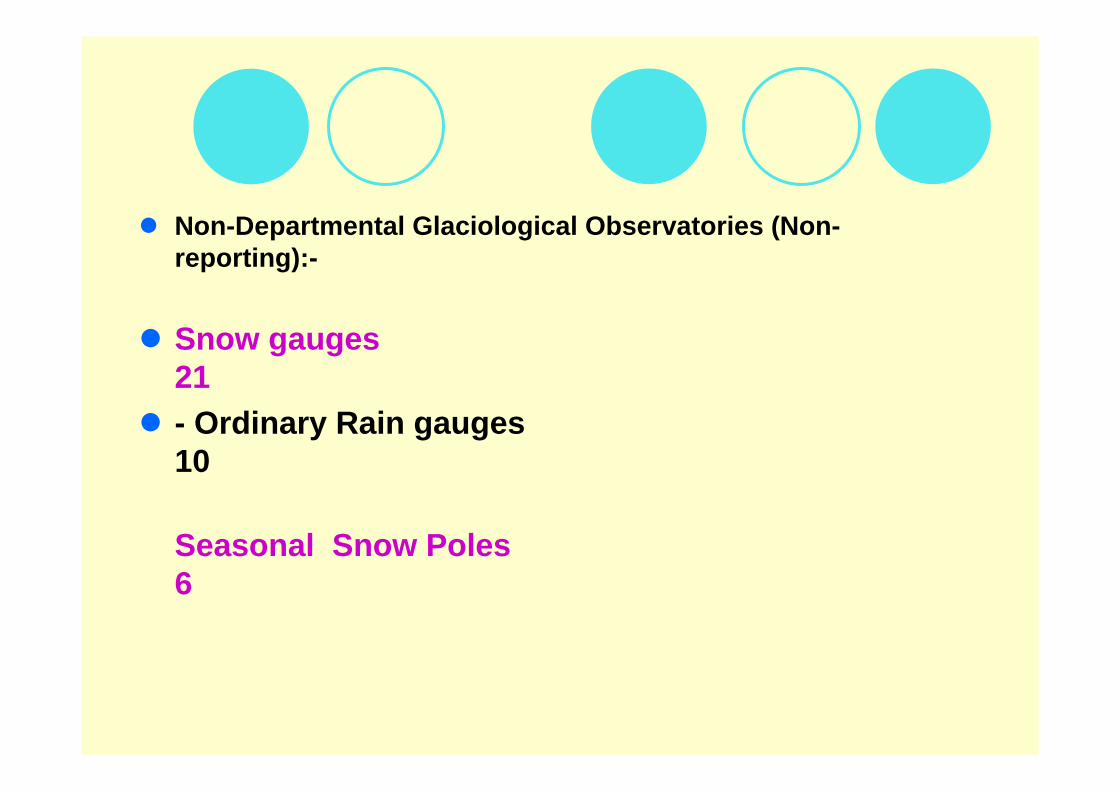
Non-Departmental Glaciological Observatories (Non-reporting):-
Snow gauges 21- Ordinary Rain gauges 10
Seasonal Snow Poles 6
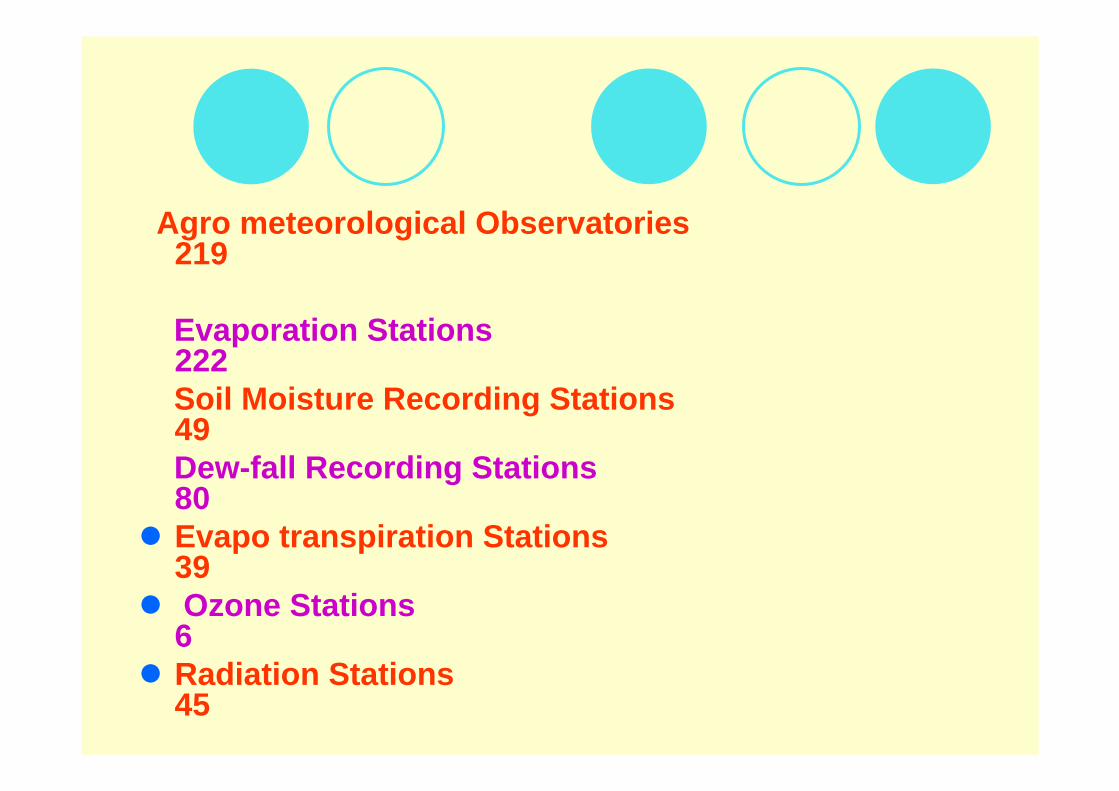
Agro meteorological Observatories 219
Evaporation Stations 222Soil Moisture Recording Stations 49Dew-fall Recording Stations 80Evapo transpiration Stations 39Ozone Stations 6Radiation Stations 45
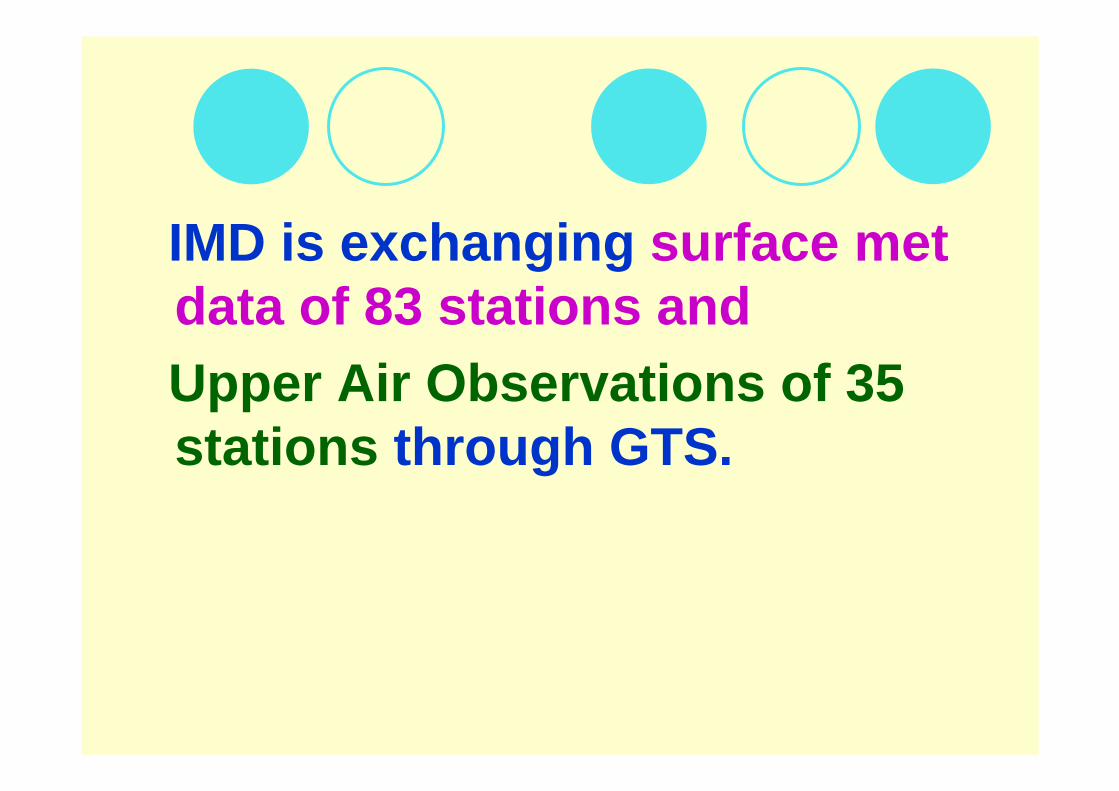
IMD is exchanging surface met data of 83 stations andUpper Air Observations of 35 stations through GTS.

RS /RW Observatories 35No.
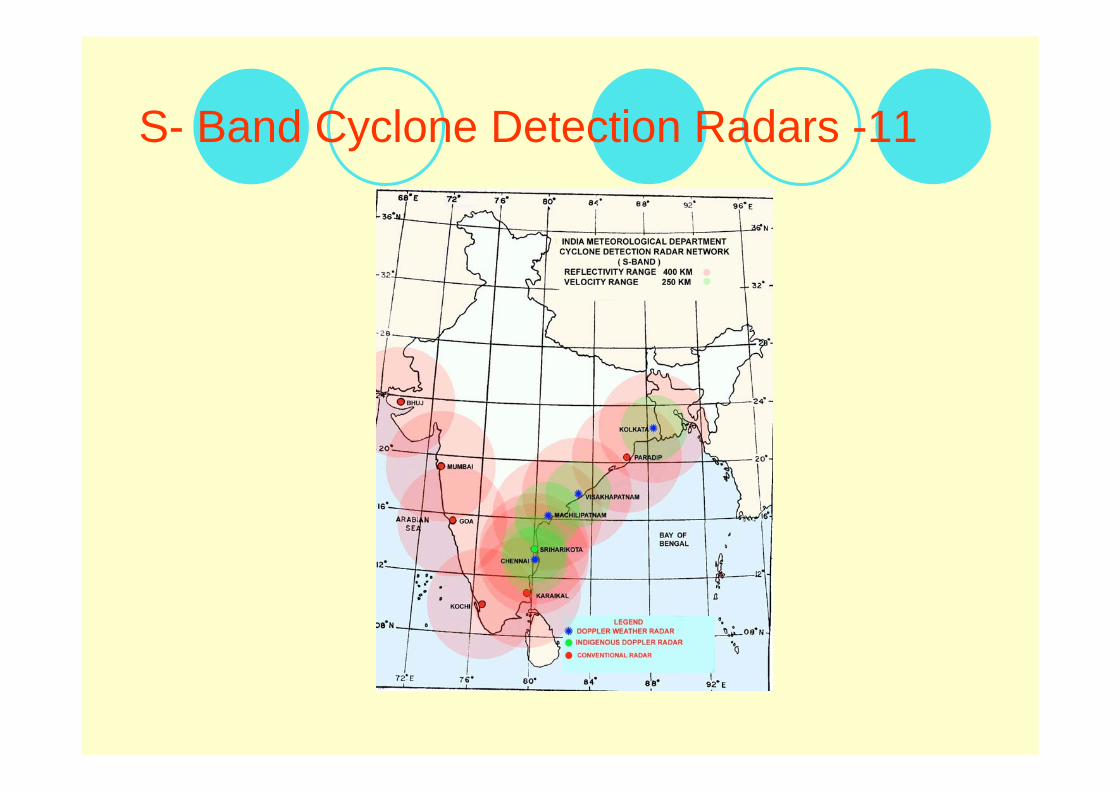
S- Band Cyclone Detection Radars -11

X-Band Weather Radar Network25 No

Future Plans
IMD has proposed to upgrade3500 ordinary rain gauges to Satellite
linked ARGs1000 surface observatories to Satellite linked AWS
and install 5 GPS8 Doppler Weather Radars5 Wind Profilers
in coming 5 years.However data from same may not be available for
AMY 08

Meteorological Information Available on IMD’ S Web Site ( www.imd.gov.in )
All India Daily Weather Report
Current Weather Observations
Main features of Today’s Weather
All India Weekly weather Report
Weather Charts
Cyclone page
Climate Normal

INSAT IMAGES AVAILABLE on IMD’S WEB SITE
Satellite images Animation
FULL DISC/ SECTOR /NORTH WEST SECTOR
Visible Channel , Infra red channel, Color Composite. Water vapor Channel
INSAT Products (cont.)
Cloud Motion Vectors (CMV)Low Level, Medium Level, High level
Outgoing Long wave Radiation (OLR)
Quantitative Precipitation estimation
Sea Surface Temperature

DOPPLER RADAR PRODUCT fromCHENNAI,/ KOLKATA,/ MACHILIPATNAM,/
VISAKHAPATNAM
MAX (Z) product
Plan Position Indicator (Z)Volume Velocity Processing (2)
Plan Position Indicator (V)Surface Rainfall Intensity
Precipitation Accumulation (PAC) 24 hrs at 0300UTC

HYDROLOGICAL DATA Central Water Commission
- Gauge only 246- Gauge, discharge 282- Gauge, discharge and silt 41- Gauge, discharge and water quality andsilt 261- Gauge, discharge and water quality 115
Out of these 945 sites data of 286 sites is available to general public/ research institutes.
web site www.cwc.nic.in

HYDRO-MET CONCERNS RELATED withSW MONSOON
The Indian economy is mainly Agro based.Hence SW Monsoon is mainly identified with rainfall quantum.The seasonal rainfall shows wide variationfrom year to year. As a result, there are two main disasters related with SW Monsoon rainfall.
Those are Drought and Floods.Every year one or other part of the country is
affected by either drought or floods
Even in worst Drought Year of 2002 about 7% area of the country was under Excess rainwhile during 1988 which was the Good Monsoon Year, about 8% area of the country was reeling under Drought.

DROUGHT PRONE AREAS OF INDIA

Drought Prediction
The droughts are generally realized after there occurrence and as such the commencement and conclusion of drought is not predicted / forecasted effectively and hence a challenge.
Suitable indicators for anticipation of drought over a small region / area at the early stage need to be established.

FLOOD PRONE AREAS in INDIA

FLOODS in INDIAFlood is an ANNUAL FEATURE of major rivers like GANGA ,BRAHAMPUTRA , MAHANADI , NARMADA , TAPTI , GODAVARI & KRISHNA . Maximum floods Occur in S-W MONSOON season.
It is estimated that about 400000 SQ. KM of area is FLOOD PRONE . Out of this about 25% is now FLOOD PROTECTED.
On an average 75000 SQ. KMS of area & 33million populationfaces FLOOD WRATH every year.
In past 50 years India had lost assets of more than RS 650000 million (@ US$ 14800 million) and loss of more than 75000 human lives due to floods alone
FLOOD FORECATING in INDIA
In India flood warning activity is entrusted to India meteorological Department andCentral Water Commission.
The flood warning is provided for 157 flood prone cities.
State Governments are taking administrative actions required for evacuation and flood relief.
TRENDS in MONSOON RAINFALL
- The INDIAN MONSOON rainfall as a whole does not show any significant change.
- However different parts of the country show changing trends.
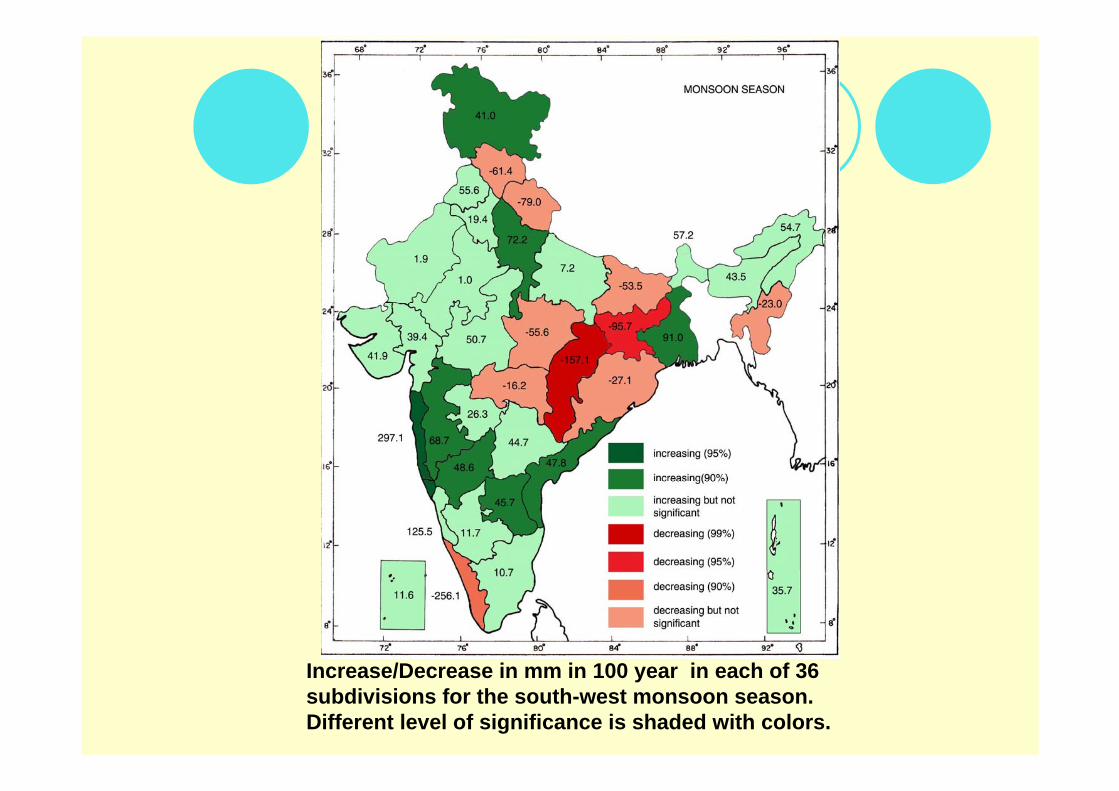
Increase/Decrease in mm in 100 year in each of 36 subdivisions for the south-west monsoon season. Different level of significance is shaded with colors.

About 7% area of the country show significant decreasing trends.
About 24% area of the country show significant increasing trends.
These trends will increase the occasions of droughts and floods in future and affect water resources development.

TRENDS in EXTREME RAINFALL
The following indices were considered for rainfall data of 100 stations having more than 90 years data
% No. of stations having significant ( +) (-)Trend
Heavy Precipitation (≥ 7.5 cm) Days 17 2Very Heavy Precipitation (≥ 12.5 cm) days 8 1 Highest 1 Day Precipitation 15 1Highest 5 Day Precipitation 9 3

The rising trends in extreme rainfall will alter the design parameters like Probable Maximum Precipitation / flood etc. warranting review of hydrological safety of existing structure.
The urban areas are now more vulnerable to flooding due to land use pressure , encroachment etc. The rising trends in extreme rainfall will enhance the threat as happened in Mumbai during 26th July 2005.

Scarcity of Water in near future
It is estimated that maximum utilizable water (both surface and ground water) is about 1080 cu km.While by 2050 AD water demand of various users will rise to 1180 cu. km.Thus major portion of India will be under permanent threat of water scarcity.
CONCLUSIONS
The hydro meteorological disasters like drought and floods require extensive downsizing at local level (catchment / sub basin) for effective forecast / warning system.The inferences of climate models are to be considered while planning and designing of Water Resources Development Projects.
The options from increasing storage capacity, River Linking water conservation , recycling techniques need to be judiciously adopted to minimize the gap between water demand and availability. All these aspects demand development and sharing of forecasting models and technology.