Embed Size (px)
Citation preview
Jussi Marjamaa
A measurement-based analysis of machine-to-
machine communications over a cellular
network
School of Electrical Engineering
Thesis submitted for examination for the degree of Master of
Science in Technology.
Helsinki 1.6.2012
Thesis supervisor:
Prof. Jyri Hämäläinen
Thesis instructor:
M.Sc. (Tech.) Edgar Ramos
ii
AALTO UNIVERSITY ABSTRACT OF THE
SCHOOL OF ELECTRICAL ENGINEERING MASTER‟S THESIS
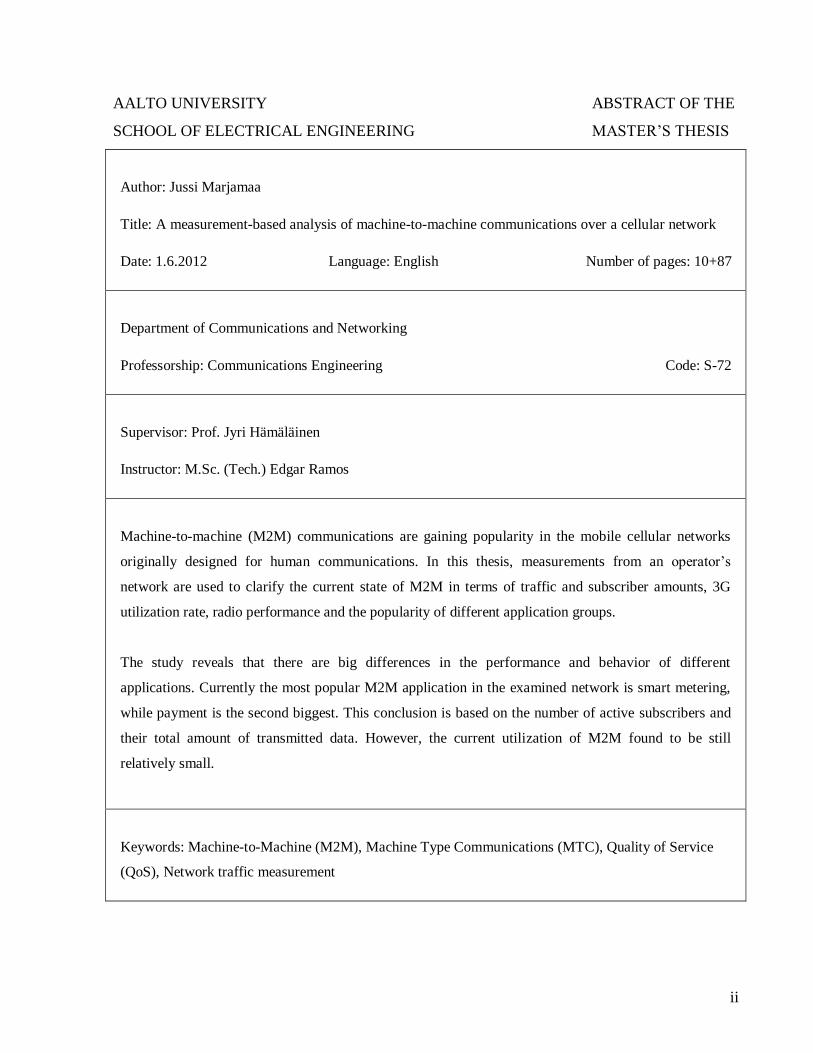
Author: Jussi Marjamaa
Title: A measurement-based analysis of machine-to-machine communications over a cellular network
Date: 1.6.2012 Language: English Number of pages: 10+87
Department of Communications and Networking
Professorship: Communications Engineering Code: S-72
Supervisor: Prof. Jyri Hämäläinen
Instructor: M.Sc. (Tech.) Edgar Ramos
Machine-to-machine (M2M) communications are gaining popularity in the mobile cellular networks
originally designed for human communications. In this thesis, measurements from an operator‟s
network are used to clarify the current state of M2M in terms of traffic and subscriber amounts, 3G
utilization rate, radio performance and the popularity of different application groups.
The study reveals that there are big differences in the performance and behavior of different
applications. Currently the most popular M2M application in the examined network is smart metering,
while payment is the second biggest. This conclusion is based on the number of active subscribers and
their total amount of transmitted data. However, the current utilization of M2M found to be still
relatively small.
Keywords: Machine-to-Machine (M2M), Machine Type Communications (MTC), Quality of Service
(QoS), Network traffic measurement
iii
AALTO-YLIOPISTO DIPLOMITYÖN
SÄHKÖTEKNIIKAN KORKEAKOULU TIIVISTELMÄ
Tekijä: Jussi Marjamaa
Työn nimi: Solukkoverkkopohjaisen machine-to-machine liikenteen nykytilan tutkiminen
Päivämäärä: 1.6.2012 Kieli: Englanti Sivumäärä: 10+87
Tietoliikenne-ja tietoverkkotekniikan laitos
Professuuri: Tietoliikennetekniikka Koodi: S-72
Valvoja: Prof. Jyri Hämäläinen
Ohjaaja: M.Sc. (Tech.) Edgar Ramos
Alkujaan ihmisten kommunikaatiotarpeita varten rakennettuja matkapuhelinverkkoja käytetään
kasvavissa määrin koneiden kommunikaatioon (Machine-to-machine, M2M). Tässä työssä tutkitaan
matkapuhelinverkosta tehtyjen mittausten avulla M2M-installaatioiden nykytilaa. Tutkimuksessa
tarkastellaan M2M:n kommunikaation liikenne- ja asiakasmääriä, sekä radiolinkin laatuparametrejä ja
pyritään ryhmittelemään keskenään samantyyppiset sovellukset.
Tutkimuksessa havaitaan eri M2M-käyttäjäryhmien välillä suuria eroja mm. radiotien laadussa ja
liikennemäärissä. Tämän hetken suosituimmaksi M2M-aplikaatioksi osoittautuvat etäluettavat älykkäät
mittarit, sekä toiseksi suosituimmaksi mobiilit maksupäätteet. M2M-liikenteen ja laitteden määrät
havaitaan kuitenkin vielä toistaiseksi pieniksi verkon muuhun käyttöön ja käyttäjien määrään
verrattuna.
Avainsanat: Machine-to-Machine (M2M), Machine Type Communications (MTC), Quality of Service
(QoS), Verkkoliikenteen mittaus

iv
Preface
This thesis work was carried out in NomadicLab, a part of Ericsson R&D Center Finland.
First of all, I would like to thank my manager Johan Torsner for the opportunity to work as a
part of his research team and have a change to follow the high-quality research work carried
out in the lab. I would like to express my deepest gratitude to all my colleagues, especially to
Edgar Ramos, the instructor of this thesis. Also, I would like to thank Professor Jyri
Hämäläinen for the thesis supervision and all the cooperation.
Finally but most importantly, I would like to thank my parents and family for all the support
that I have gotten throughout my whole life.
Helsinki, 1.6.2012
Jussi Marjamaa
v
Table of Contents
PREFACE .......................................................................................................................................................... IV
TABLE OF CONTENTS...................................................................................................................................... V
ACRONYMS ..................................................................................................................................................... VII
1 INTRODUCTION ........................................................................................................................................ 1
1.1 BACKGROUND ............................................................................................................................................ 1
1.2 THE STUDY................................................................................................................................................. 2
1.3 STRUCTURE OF THE THESIS ......................................................................................................................... 3
2 INTRODUCTION TO CELLULAR NETWORKS .................................................................................... 5
2.1 BACKGROUND ............................................................................................................................................ 5
2.2 FUNCTIONAL DOMAINS ............................................................................................................................... 8
2.3 DATA SESSION IN 3GPP MOBILE NETWORKS .............................................................................................. 15
3 MACHINE-TO-MACHINE COMMUNICATIONS ................................................................................. 22
3.1 DEFINITION .............................................................................................................................................. 22
3.2 TYPICAL CHARACTERISTICS ...................................................................................................................... 23
3.3 M2M CATEGORIES AND APPLICATIONS ..................................................................................................... 27
3.4 THE GROWTH OF M2M ............................................................................................................................. 35
3.5 OVERVIEW OF THE M2M ECOSYSTEM........................................................................................................ 36
3.6 CHALLENGES ........................................................................................................................................... 37
4 DESCRIPTION OF THE METHODS USED ........................................................................................... 41
4.1 DESCRIPTION OF DATA COLLECTION SYSTEM ............................................................................................. 41
4.2 M2M GROUPING ...................................................................................................................................... 46
4.3 SPECULATIONS OF WHAT IS ANALYZED AND WHY ...................................................................................... 48
4.4 CHALLENGES OF THE STUDY ..................................................................................................................... 49
5 RESULTS ................................................................................................................................................... 50
5.1 RAN USAGE ............................................................................................................................................. 50
5.2 M2M APPLICATION GROUPS ..................................................................................................................... 51
5.3 THE MOST POPULAR DEVICES ................................................................................................................... 63
6 CONCLUSIONS ........................................................................................................................................ 66
6.1 FUTURE DEVELOPMENT AND RESEARCH .................................................................................................... 67

vi
7 REFERENCES ........................................................................................................................................... 69
APPENDIX A: APPLICATION SPECIFIC KB/IMSI/DAY HISTOGRAMS .................................................. 73
APPENDIX B: APPLICATION SPECIFIC RADIO PERFORMANCE ........................................................... 76
APPENDIX C: CINTERION EU3-P AND EU3-E ............................................................................................. 84
vii
Acronyms
3GPP Third Generation Partnership Project
3GPP2 Third Generation Partnership Project 2
A-GNSS Assisted Global Navigation Satellite System
APN Access Point
ARPU Average Revenue Per User
BER Bit Error Rate
BLER Block Error Rate
BSC Base Station Controller
BSS Business Support System
CAPEX Capital Expenditure
CD Check Digit
CDF Cumulative Distribution Function
CDMA Code Division Multiple Access
CID Cell ID
CN Core Network
CPICH Common Pilot Channel
CQI Channel Quality Indicator
CRM Customer Relationship Management
CS Circuit Switched
DB Database
DL Downlink
DNS Domain Name System
Ec/No Received Energy Per Chip Divided by the Power Density in the Band
EIR Equipment Identity Register
eNode B Enhanced Node B
EPC Evolved Packet Core
E-SMLC Evolved Serving Mobile Location Centre
E-UTRAN Enhanced UTRAN
viii
FDM Frequency Division Multiplexing
GBR Guaranteed Bit Rate
GERAN GSM/EDGE Radio Access Network
GGSN Gateway GPRS Support Node
GPRS General Packet Radio Service
GPS Global Positioning System
GSM Global System for Mobile Communications
GSMA GSM Association
H2H Human-to-Human
HLR Home Location Service
HSS Home Subscriber Server
HTTP Hypertext Transfer Protocol
IAT Inter Arrival Time
IEEE Institute of Electrical and Electronics Engineers
ISHO Inter-system Handover
IMEI International Mobile Station Equipment Identity
IMEISV IMEI and Software Version Number
IoT Internet of Things
IP Internet Protocol
IPv4 Internet Protocol Version 4
IPv6 Internet Protocol Version 6
kB Kilobyte
KPI Key Performance Indicator
L1 Layer One
L2 Layer Two
LTE Long Term Evolution
M2M Machine-to-Machine
MAC Medium Access Control
MCC Mobile Country Code
MCS Modulation and Coding Scheme
mHealth Mobile Health
ix
MME Mobility Management Entity
MMS Multimedia Messaging Service
MNC Mobile Network Code
MNO Mobile Network Operator
MPP Massively Parallel Processing
MS Mobile Station
MSIN Mobile Subscriber Identification Number
MSISDN Mobile Station Integrated Services Digital Network Number
MTC Machine Type Communications
NAT Network Address Translator
OFDMA Orthogonal Frequency Division Multiple Access
OPEX Operational Expenditure
OSS Operations Support System
PDCP Packet Data Convergence Protocol
PDN Packet Data Network
PDP Packet Data Protocol
P-GW PDN Gateway
PLMN Public Land Mobile Network
PS Packet Switched
P-TMSI Packet TMSI
QCI QoS Class Identifier
QoS Quality of Service
QPSK Quadrature Phase Shift Keying
RACH Random Access Channel
RAN Radio Access Network
RLC Radio Link Control
RNC Radio Network Controller
RSCP Received Signal Code Power
RSRP Reference Signal Received Power
RSRQ Reference Signal Received Quality
RXLEV Received Signal Level
x
RXQUAL Received Signal Quality
SC-FDMA Single Carrier Frequency Division Multiple Access
SD Spare Digit
SGSN Serving GPRS Support Node
S-GW Serving Gateway
SMS Short Message Service
SMTP Simple Mail Transfer Protocol
SNR Serial Number
SOAP Simple Object Access Protocol
SVN Software Version Number
TAC Type Allocation Code
TCP Transmission Control Protocol
TDMA Time Division Multiple Access
TETRA Terrestrial Trunked Radio
TMSI Temporary Mobile Subscriber Identity
UDP User Datagram Protocol
UE User Equipment
UL Uplink
UMTS Universal Mobile Telecommunication Services
USB Universal Serial Bus
USIM Universal Subscriber Identity Module
UTRAN UMTS Radio Access Network
XML Extensible Markup Language
1
1 Introduction
1.1 Background
A fundamental change is happening in the way mobile networks are been used. Traditionally,
mobile networks have been used to serve communication needs of human-to-human
communications (H2H), which has been also the design basis for them. However, nowadays
machines are more and more using the same mobile networks to serve their communication
needs.
The application behind these machines can be used for various purposes and to serve different
needs of various industries, as well as helping to satisfy needs of consumer customers and
improving their quality of life. Typical examples of M2M are for example smart metering
(i.e. water, power and gas), tracking things and remote maintenance of assets. This mixture of
different use cases and the unique solutions realized on top of proprietary technologies and
applications are referred as verticals, in opposite to a one platform fits all kind of a horizontal
model. This kind of machine communication scenario, including at least one communicator
whose traffic is not directly generated by a human, the communication occurrence does not
necessarily need human interaction or the amount of needed human intervention is rather
small, is called machine-to-machine communication (M2M), or alternatively machine-type
communications (MTC) [1].
It has been discussed and predicted that, in the future most of the users in mobile networks
will be M2M type [2]. This ongoing growth of M2M usage is offering new opportunities and
sources of revenue, as the vertical market is opening to the telecommunications industry, but
it brings challenges as well. Enhanced packet technologies and their good availability are
enabling more and more devices and complicated applications to be connected. But at the
same time this means whole new considerations for developing and designing current and
future mobile networks and user equipment. For the telecommunications industry, it would be
2
beneficial to keep the number of connected devices and sources of revenue growing, and be
able to address the needs of the different verticals with a harmonized horizontal solution. The
new ways of using mobile networks and the new business opportunities are the top two
reasons why M2M is so important to be analyzed and why this study is done.
1.2 The study
The study is based on traffic and network measurements from a mobile operator‟s network.
The measurements are making it possible to get up-to-date information about current M2M
usage in a real mobile network, and it is also possible to study the general characteristics of
M2M traffic and different use cases from bottom-up perspective. As the M2M market is
highly fragmented and consisting of uniquely built solutions, centralized analysis is a way to
start harmonizing the diversity of different M2M solutions.
The network connection of M2M is not necessarily achieved only by using 3GPP mobile
networks, but instead for example technologies such as Ethernet or Wi-Fi can be used.
However, the scope of this thesis is only in the M2M using 3GPP (Third Generation
Partnership Project) mobile cellular networks as their access method. This is due to a huge
growth potentiality in the use of cellular access, nearly full coverage and the large
involvements of the standardization entities. Also, for example in a study “M2M Service
Enablement Services” by Beechman Research Ltd, cellular was the most popular connection
method according to their survey [3].
The thesis is limited to study only the part of M2M which uses packet switched (PS) type of
data connections, even though it is possible to build M2M application on top of voice or SMS
services, and in fact many M2M scenarios are still based on SMS [4]. This outlining is done
based on the assumption, that future implementations and deployments of M2M applications
will be done increasingly through PS services, as they are more suitable for many purposes
than CS (Circuit Switched), and as they are nowadays widely available and in the future even
more so. PS usage can be also justified in terms of cost reduction and simplicity [4]. Also, the
3
similar shift towards PS services can be seen in traditional human-to-human communications
as well, and so voice and SMS usage have been already started to be replaced by substitutive
PS based services.
The information gathered from the performed measurements is valuable for network
improvements, Quality of Service (QoS) prioritization and dimensioning, but in addition it
gives up-to-date information about M2M customers, and opens a possibility for M2M market
analysis and growth prospection. Also, as the data gathering system used, is not generally
built to serve purposes like the ones in this study, the thesis project is used for revealing its
unused potentiality and helping in its development process. However, the main scope of the
thesis is in identification and analysis of characteristics, requirements and performance of
different M2M devices and applications. To take full advantage of gathered information, it is
studied how to categorize and group different types of M2M communications based on their
behavior and use case. In general, categorization and grouping of M2M is needed to optimize
mobility management, call routing, security, charging [4] and basically for all the
optimizations aiming for more efficient usage of network resources, while maintaining
suitable service quality for all services and minimizing operator‟s OPEX (Operational
Expenditure) and CAPEX (Capital Expenditure).
In another words, the aim is to analyze and identify current M2M applications, their needs
and popularity, so that future network releases, current networks and interoperability between
M2M and the mobile network can be developed. When the characteristics of M2M are well
known, supporting network features can be build [5], customers can be served better,
economy will grow and the whole communications ecosystem will benefit.
1.3 Structure of the thesis
In a chapter two, an introduction to cellular networks is given. The idea is to give a short
description about the current cellular radio network systems, their structure, key elements and
the most important concepts from packet switched data point of view. The third chapter

4
focuses on M2M. It starts by defining the term M2M, and continues by breaking down to the
different applications of M2M and their special characteristics. Finally, the ecosystem,
growth, challenges etc. are discussed. In the fourth chapter the measurement techniques, data
collection system and challenges are discussed. The fifth chapter focuses on the achieved
results and findings and concludes the thesis by presenting the most important findings and
proposing ideas for future studies.
5
2 Introduction to cellular networks
The purpose of this chapter is to give a brief introduction to currently used mobile cellular
networks, their main architectural elements, functionality and the most important concepts
from data transmission point of view. The emphasis is on 3GPP‟s 2G and 3G technologies:
GSM and UMTS, as they are currently the access method for M2M. Nevertheless, as LTE
will play a big role in the future of M2M communications, the newer 3GPP standard releases
are also discussed briefly.
2.1 Background
The international standardization of mobile cellular communications technologies has been
carried out by three main organizations: 3rd Generation Partnership Project (3GPP), 3rd
Generation Partnership Project 2 (3GPP2) and Institute of Electrical and Electronics
Engineers (IEEE) [5]. The thesis is focusing only on 3GPP‟s standardized technologies.
The evolution of mobile networks has been driven by the increasing popularity of mobile
services. The services has been evolving from traditional telephony services towards always
on type of data services, and an ability to access Internet anywhere, anytime and while being
on the move [6]. As the new ubiquitous technologies have been adding more value to end
users, the data traffic has been facing a rapid growth. For ending up into the current situation
with almost ubiquitous wireless broadband access, evolvements have been needed in three
technical domains highly dependent on each other. From top to bottom these domains are
services, user hardware and networks.
As there has been a huge growth in the number of users and in the amount of delivered data,
improvements for the network technology have been needed, and so the systems has been
evolving a lot in past years. The different communication systems are usually being divided
into different generations, based on the used technologies and system capabilities. First and
6
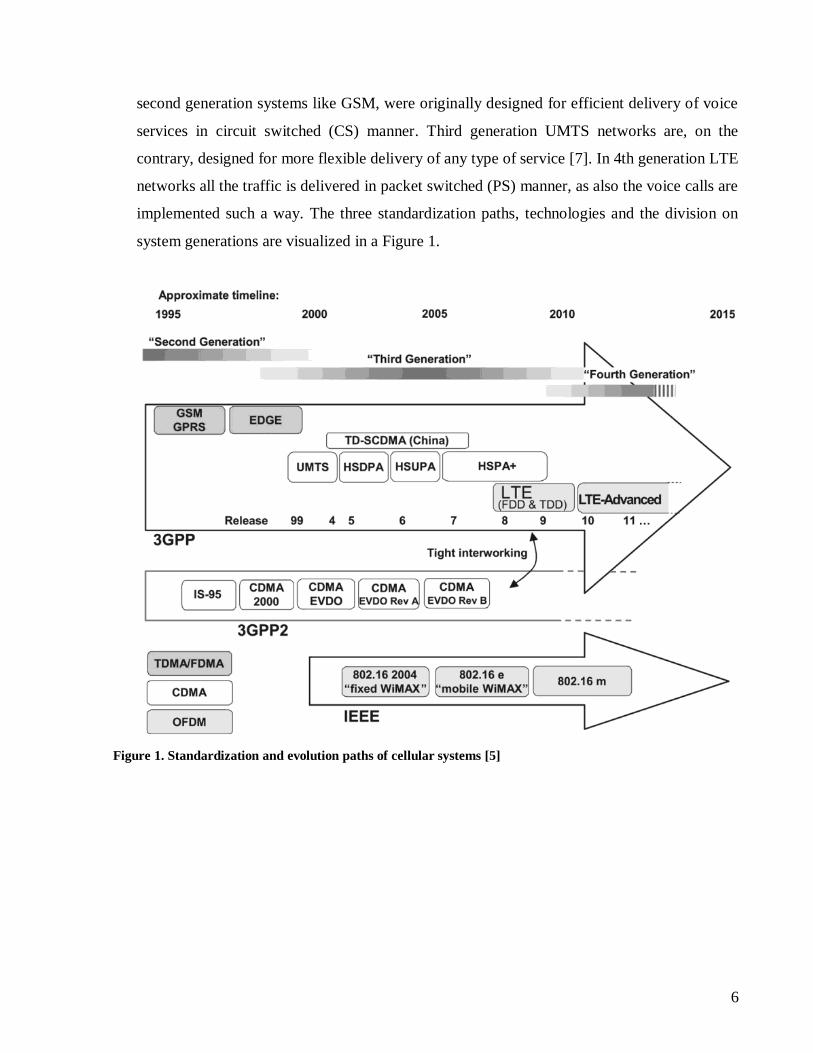
second generation systems like GSM, were originally designed for efficient delivery of voice
services in circuit switched (CS) manner. Third generation UMTS networks are, on the
contrary, designed for more flexible delivery of any type of service [7]. In 4th generation LTE
networks all the traffic is delivered in packet switched (PS) manner, as also the voice calls are
implemented such a way. The three standardization paths, technologies and the division on
system generations are visualized in a Figure 1.
Figure 1. Standardization and evolution paths of cellular systems [5]
7
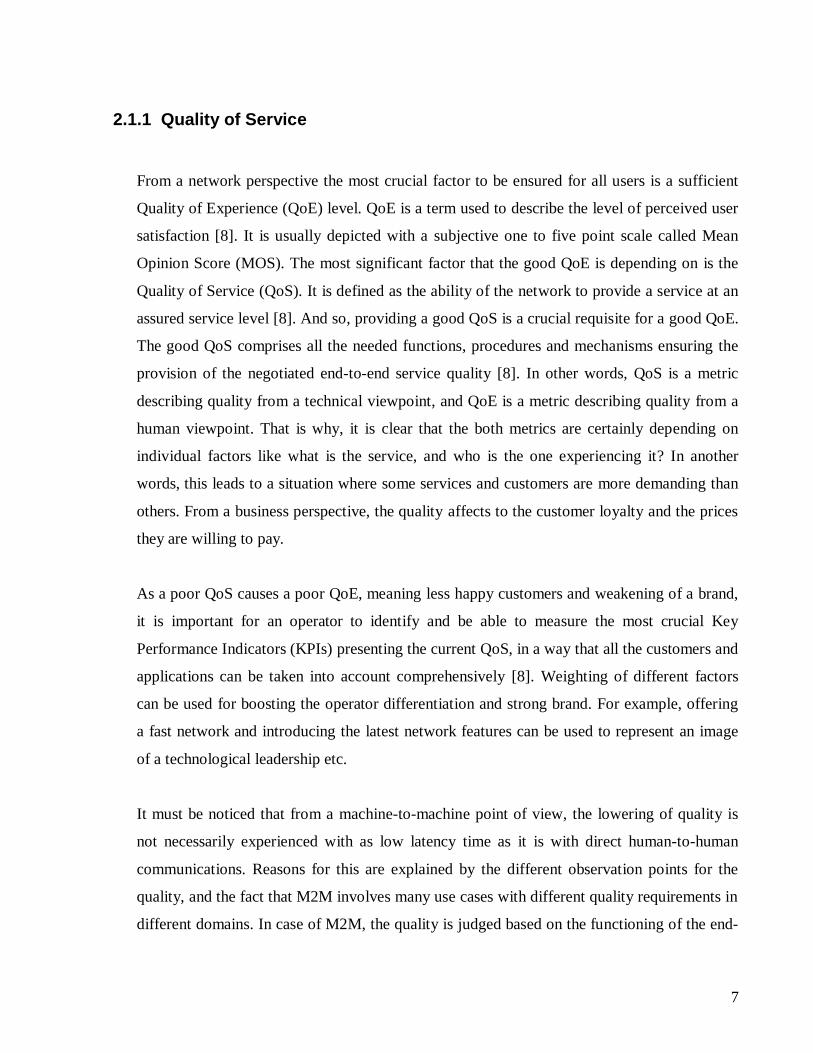
2.1.1 Quality of Service
From a network perspective the most crucial factor to be ensured for all users is a sufficient
Quality of Experience (QoE) level. QoE is a term used to describe the level of perceived user
satisfaction [8]. It is usually depicted with a subjective one to five point scale called Mean
Opinion Score (MOS). The most significant factor that the good QoE is depending on is the
Quality of Service (QoS). It is defined as the ability of the network to provide a service at an
assured service level [8]. And so, providing a good QoS is a crucial requisite for a good QoE.
The good QoS comprises all the needed functions, procedures and mechanisms ensuring the
provision of the negotiated end-to-end service quality [8]. In other words, QoS is a metric
describing quality from a technical viewpoint, and QoE is a metric describing quality from a
human viewpoint. That is why, it is clear that the both metrics are certainly depending on
individual factors like what is the service, and who is the one experiencing it? In another
words, this leads to a situation where some services and customers are more demanding than
others. From a business perspective, the quality affects to the customer loyalty and the prices
they are willing to pay.
As a poor QoS causes a poor QoE, meaning less happy customers and weakening of a brand,
it is important for an operator to identify and be able to measure the most crucial Key
Performance Indicators (KPIs) presenting the current QoS, in a way that all the customers and
applications can be taken into account comprehensively [8]. Weighting of different factors
can be used for boosting the operator differentiation and strong brand. For example, offering
a fast network and introducing the latest network features can be used to represent an image
of a technological leadership etc.
It must be noticed that from a machine-to-machine point of view, the lowering of quality is
not necessarily experienced with as low latency time as it is with direct human-to-human
communications. Reasons for this are explained by the different observation points for the
quality, and the fact that M2M involves many use cases with different quality requirements in
different domains. In case of M2M, the quality is judged based on the functioning of the end-
8
user service, and not on the communications at first-hand, like in the case of direct human
communications. Because humans are not necessarily directly using the M2M device and the
transmission intervals can be long, in the worst case it can take a long time before noticing a
malfunctioning of a device due to reasons, such as network unavailability or system crash.
The above mentioned reliability issues, and other key requirements should be taken into
account as in the early designing phase of the M2M application. For example in the case of
device status reporting, too frequent reporting can be problematic in terms of unnecessary
congestion and signaling effects for the network and higher energy consumption on the
terminal side. But usually a rapid noticing of nonworking terminals is crucial to ensure.
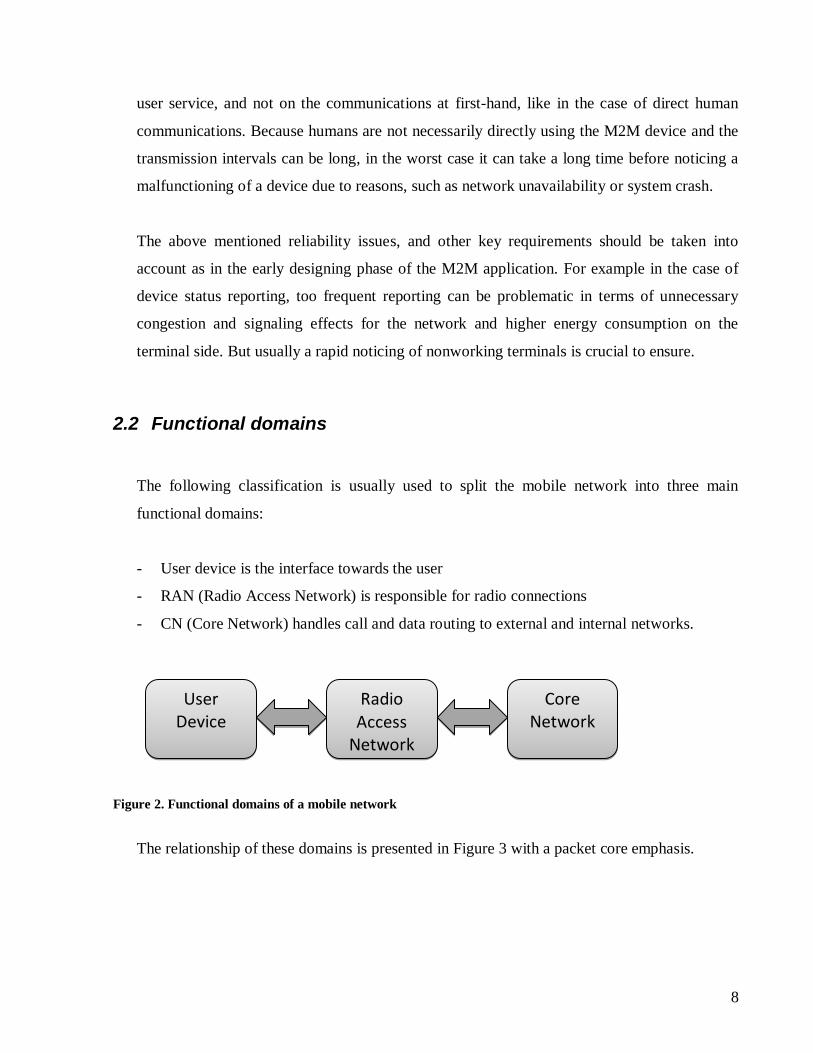
2.2 Functional domains
The following classification is usually used to split the mobile network into three main
functional domains:
- User device is the interface towards the user
- RAN (Radio Access Network) is responsible for radio connections
- CN (Core Network) handles call and data routing to external and internal networks.
Figure 2. Functional domains of a mobile network
The relationship of these domains is presented in Figure 3 with a packet core emphasis.
Radio Access
Network
User Device
Core Network
9
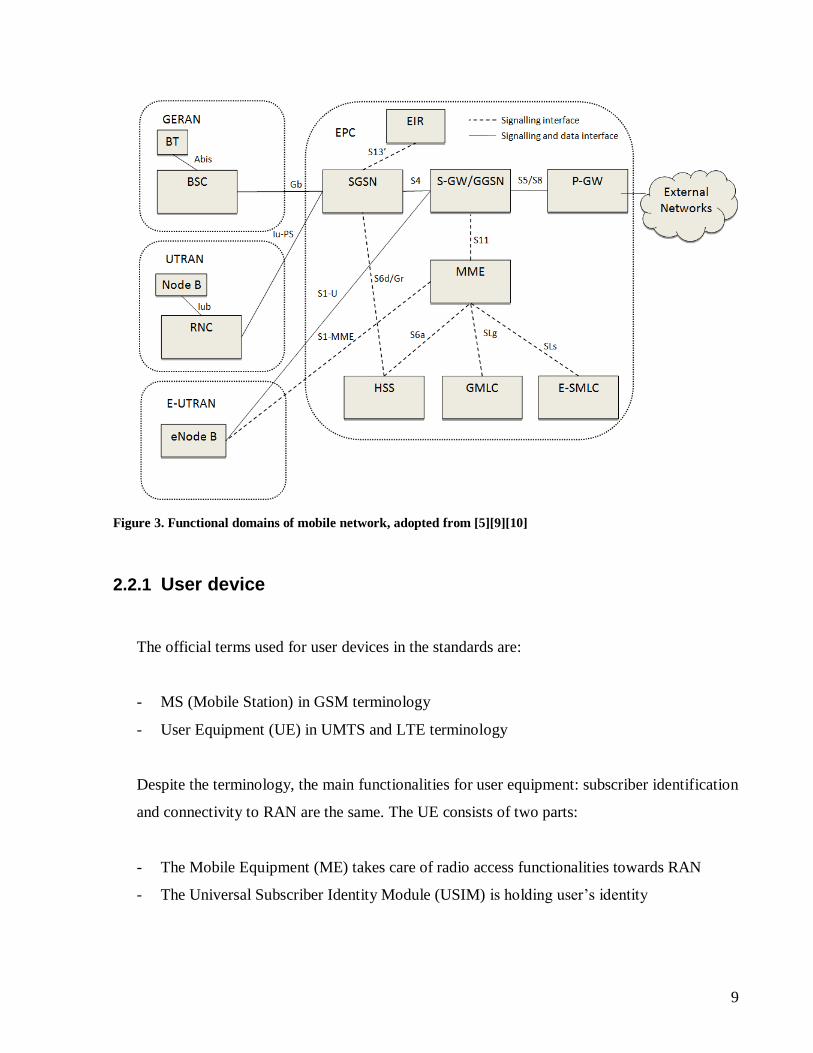
Figure 3. Functional domains of mobile network, adopted from [5][9][10]
2.2.1 User device
The official terms used for user devices in the standards are:
- MS (Mobile Station) in GSM terminology
- User Equipment (UE) in UMTS and LTE terminology
Despite the terminology, the main functionalities for user equipment: subscriber identification
and connectivity to RAN are the same. The UE consists of two parts:
- The Mobile Equipment (ME) takes care of radio access functionalities towards RAN
- The Universal Subscriber Identity Module (USIM) is holding user‟s identity
10
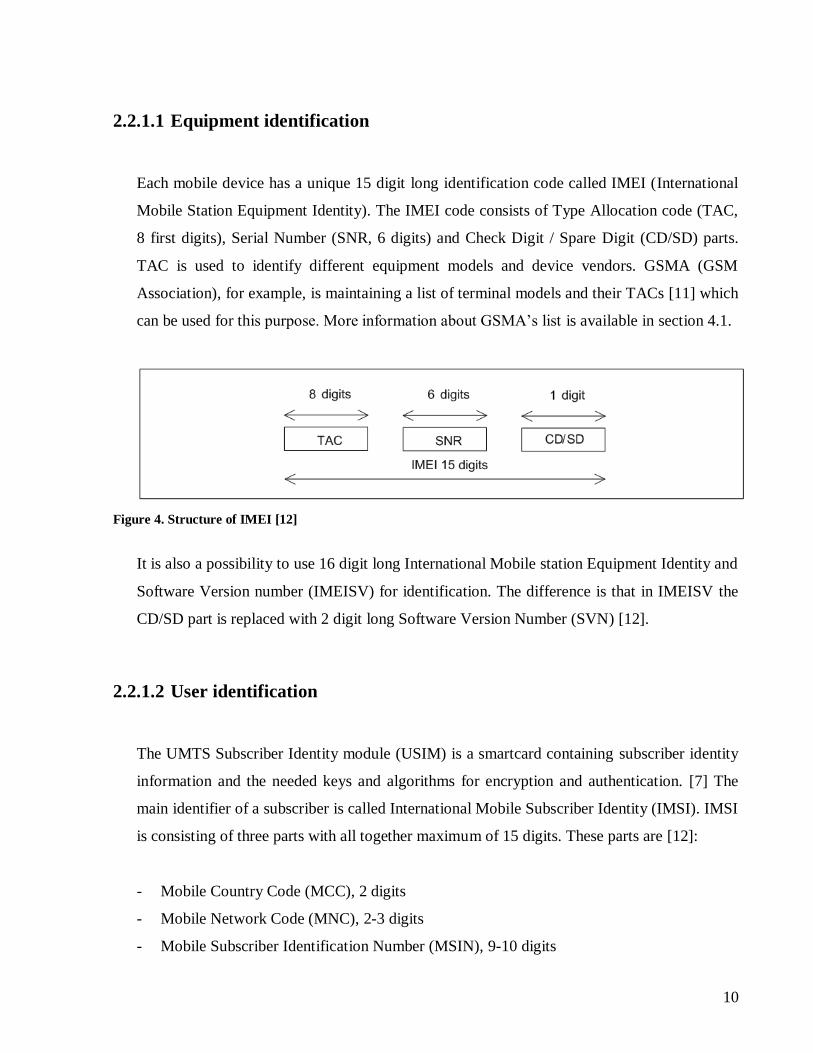
2.2.1.1 Equipment identification
Each mobile device has a unique 15 digit long identification code called IMEI (International
Mobile Station Equipment Identity). The IMEI code consists of Type Allocation code (TAC,
8 first digits), Serial Number (SNR, 6 digits) and Check Digit / Spare Digit (CD/SD) parts.
TAC is used to identify different equipment models and device vendors. GSMA (GSM
Association), for example, is maintaining a list of terminal models and their TACs [11] which
can be used for this purpose. More information about GSMA‟s list is available in section 4.1.
Figure 4. Structure of IMEI [12]
It is also a possibility to use 16 digit long International Mobile station Equipment Identity and
Software Version number (IMEISV) for identification. The difference is that in IMEISV the
CD/SD part is replaced with 2 digit long Software Version Number (SVN) [12].
2.2.1.2 User identification
The UMTS Subscriber Identity module (USIM) is a smartcard containing subscriber identity
information and the needed keys and algorithms for encryption and authentication. [7] The
main identifier of a subscriber is called International Mobile Subscriber Identity (IMSI). IMSI
is consisting of three parts with all together maximum of 15 digits. These parts are [12]:
- Mobile Country Code (MCC), 2 digits
- Mobile Network Code (MNC), 2-3 digits
- Mobile Subscriber Identification Number (MSIN), 9-10 digits
11
In addition to IMSI, temporary identifiers: Temporary Mobile Subscriber Identity (TMSI) and
packet TMSI (P-TMSI) are also used in a network for confidentiality purposes [13], and
Mobile Station Integrated Services Digital Network Number (MSISDN) [8] is used for call
establishment [4]. Separation of IMSI and MSISDN is made for protecting the confidentiality
of IMSI [14].
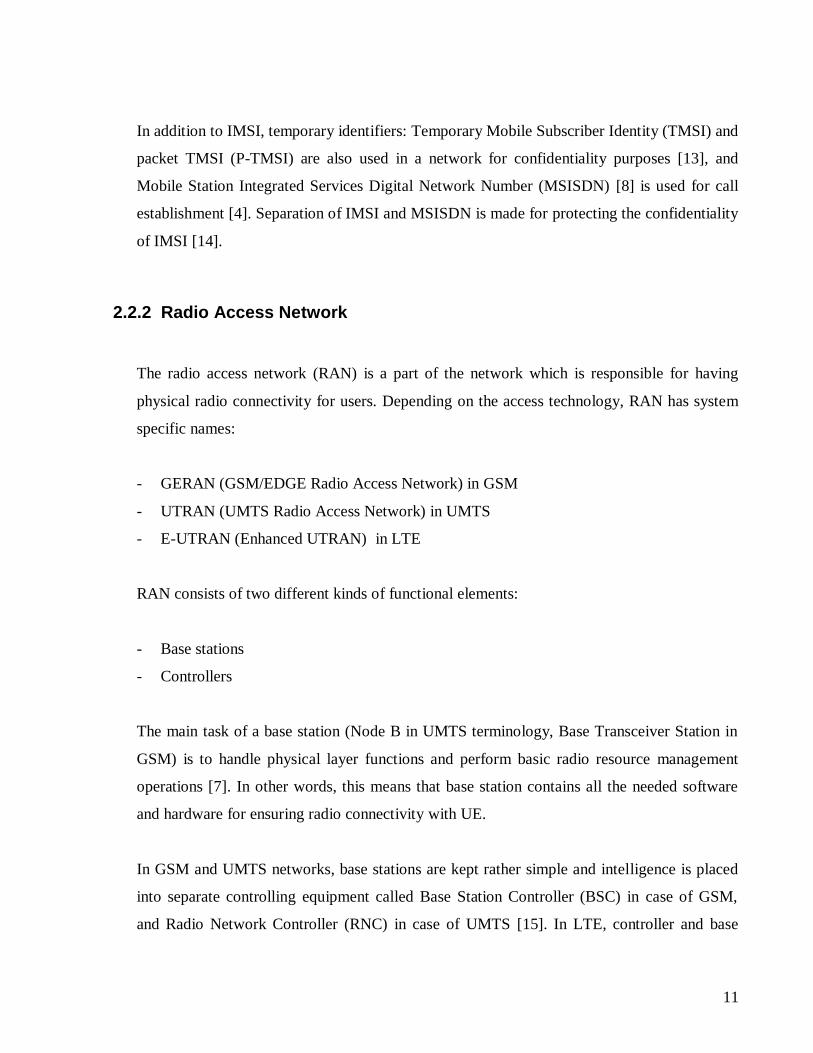
2.2.2 Radio Access Network
The radio access network (RAN) is a part of the network which is responsible for having
physical radio connectivity for users. Depending on the access technology, RAN has system
specific names:
- GERAN (GSM/EDGE Radio Access Network) in GSM
- UTRAN (UMTS Radio Access Network) in UMTS
- E-UTRAN (Enhanced UTRAN) in LTE
RAN consists of two different kinds of functional elements:
- Base stations
- Controllers
The main task of a base station (Node B in UMTS terminology, Base Transceiver Station in
GSM) is to handle physical layer functions and perform basic radio resource management
operations [7]. In other words, this means that base station contains all the needed software
and hardware for ensuring radio connectivity with UE.
In GSM and UMTS networks, base stations are kept rather simple and intelligence is placed
into separate controlling equipment called Base Station Controller (BSC) in case of GSM,
and Radio Network Controller (RNC) in case of UMTS [15]. In LTE, controller and base
12
station functions are combined in Enhanced Node B‟s (eNode B), which are then connected
with each other.
The most significantly differentiating parts between GSM, UMTS and LTE are the RAN
architecture and the radio access technologies; the differences are partly explaining why the
terminology of different physical and logical elements is also different. GSM uses frequency
division multiplexing (FDM) to divide radio resources for base stations and time division
multiple access (TDMA) to divide the base station‟s resources for the users. In UMTS, all the
resources are used by all the base stations and all the users, and the traffic flows are separated
with code division multiple access (CDMA). In LTE, all the radio resources are used in all
the cells, but the resources of the base station are then divided for the users in both frequency
and time domain. The frequency domain resource splitting in LTE is called Orthogonal
Frequency Division Multiple Access (OFDMA) for downlink and Single Carrier Frequency
Division Multiple Access (SC-FDMA) for uplink. Because of this, LTE has the best spectral
efficiency among the above mentioned technologies, and it is also the most flexible in radio
resource allocations. Physical access method mapping on to different standards is presented in
Figure 1. From M2M perspective, flexibility allows more tailored QoS offerings for serving
variety of applications, and high spectral efficiency is answering to the growth in the number
of users and in the amount of traffic. From these viewpoints LTE will overcome GSM and
UMTS in suitability for M2M. From UE‟s battery consumption point of view, the differences
should be however studied in more detail, as for example a study by University of Michigan
and AT&T Labs – Research [16] shows not so great results for LTE in terms of energy
efficiency.
In addition to the amount of allocated radio spectrum and the way they it is used, the network
in RAN domain is also limited by its radio emission power and quality. This means that on
the receivers, signal should be received well enough to be able to fight against noise, fading,
interference and to be able to decode modulated information symbols for the use of upper
layers. In practice, this is usually done so that UEs are performing measurements of their
radio conditions and reporting them to the network. Based on the measurement results, the
13
network then selects the serving system, cell, transport block size, modulation and coding
scheme (MCS), power etc. resource allocation parameters.
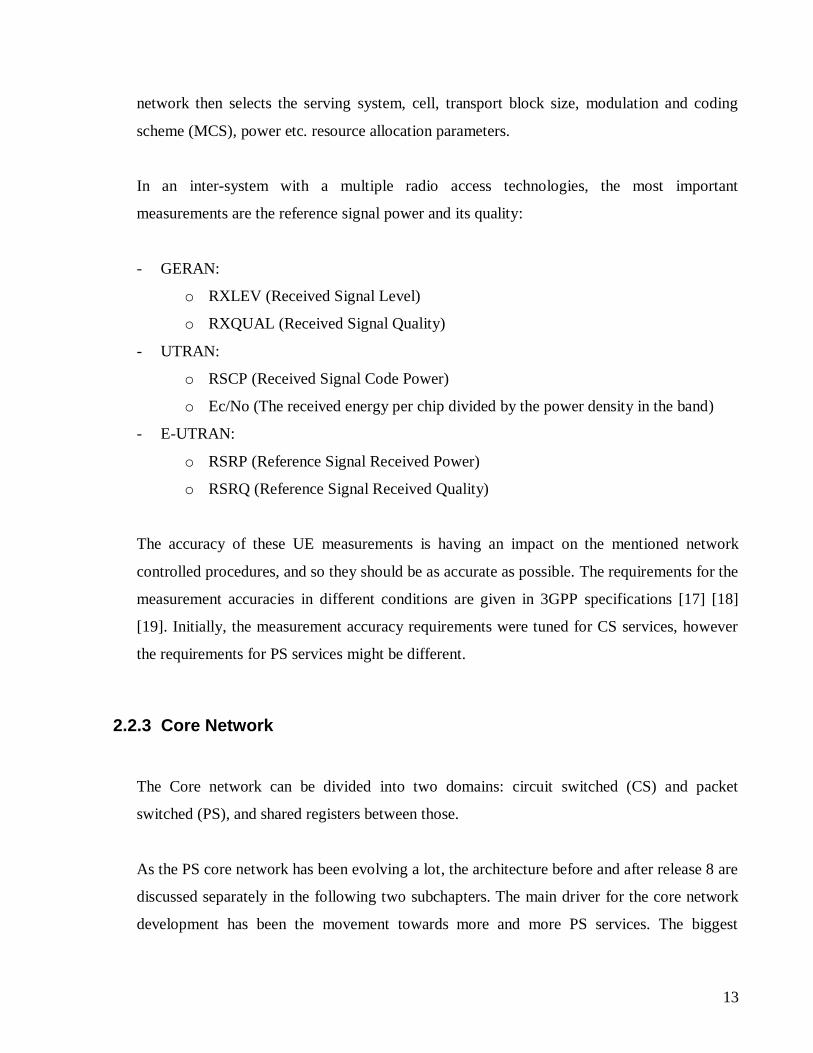
In an inter-system with a multiple radio access technologies, the most important
measurements are the reference signal power and its quality:
- GERAN:
o RXLEV (Received Signal Level)
o RXQUAL (Received Signal Quality)
- UTRAN:
o RSCP (Received Signal Code Power)
o Ec/No (The received energy per chip divided by the power density in the band)
- E-UTRAN:
o RSRP (Reference Signal Received Power)
o RSRQ (Reference Signal Received Quality)
The accuracy of these UE measurements is having an impact on the mentioned network
controlled procedures, and so they should be as accurate as possible. The requirements for the
measurement accuracies in different conditions are given in 3GPP specifications [17] [18]
[19]. Initially, the measurement accuracy requirements were tuned for CS services, however
the requirements for PS services might be different.
2.2.3 Core Network
The Core network can be divided into two domains: circuit switched (CS) and packet
switched (PS), and shared registers between those.
As the PS core network has been evolving a lot, the architecture before and after release 8 are
discussed separately in the following two subchapters. The main driver for the core network
development has been the movement towards more and more PS services. The biggest
14
difference between the core network before and after release 8 is that the latter one is fully
PS, although it is also supporting the old CS systems running parallel.
2.2.3.1 Core network pre-release 8
The PS core networks before release 8 are consisting two types of main nodes: GPRS support
nodes (SGSN) connected to UTRAN and GERAN, and Gateway GPRS Support Nodes
(GGSN). In addition, SGSN is connected to Home Location Register (HLR) for subscriber
information, and to Equipment identity Register (EIR) for information about the devices used
in the network [9]. The purpose of SGSN is to serve UEs for example in authentication,
registration, mobility management, routing establishment [8]. GGSN is the point entity
connecting operators PS domain network to external packet data networks (PDN) for example
Internet [8]. It is responsible for routing the traffic between external communication entities,
for example to web services or application server and UEs inside the PLMN (Public Land
Mobile Network) area. User is able to access GGSN resources via PDP activation [9]. For
location information request purposes it is possible to have an optional interface between
GGSN and HLR.
2.2.3.2 Core network release 8 onwards
In the LTE core (release 8 onwards), called as the Evolved Packet Core (EPC), logical nodes
corresponding to a SGSN and a GGSN are called a Serving Gateway (S-GW) and a Packet
Data Network Gateway (P-GW). These nodes are also backward compatible, so that they can
be applied to serve also 2G and 3G networks [20]. The interworking of an EPC with the
GERAN and the UTRAN is provided so that the S-GW and the P-GW are performing GGSN
functions and the SGSNs needs to be updated [5]. P-GW‟s main functionalities are IP
(Internet Protocol) address allocations for the UE, QoS enforcement and flow based charging
[5]. The S-GW is the gateway which passes all the IP packets through [5]. It is also
responsible for supporting eNodeBs for maintaining data bearers in a case of mobility. So that
15
IP traffic flow with a certain QoS is routed to the PDN or UE also in the case of mobility
[10]. The subscription data about the QoS profiles, allowed APNs and identity information is
kept in a Home Subscriber Server (HSS). The other main logical nodes of the EPC are a
Mobility Management Entity (MME), an Evolved Serving Mobile Location Centre (E-
SMLC) and a Gateway Mobile Location Centre (GMLC) [5]. The MME is considered to be
the main control node of the LTE network [21]. It is responsible for processing the signaling
between the UE and the CN [5]. E-SMLC and GMLC are used to support different location
services for UEs [5] [22]. EPC based core network architecture is presented in Figure 3.
2.3 Data session in 3GPP mobile networks
2.3.1 Session management
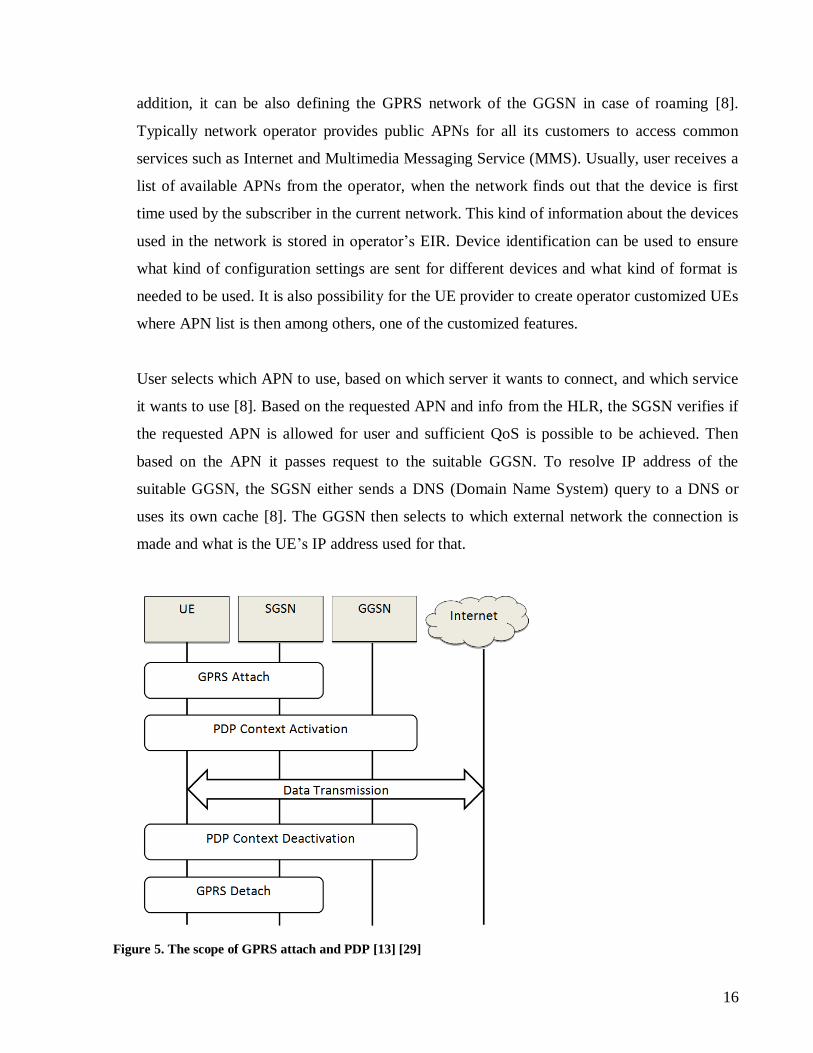
To be able to send and receive PS data in a GSM/UMTS network, UE has to do two initial
procedures: a GPRS attach and a PDP context activation. The first prerequisite to be able to
use PS services is to do a GPRS attach. The GPRS attach opens a logical signaling connection
between UE and SGSN [9]. After the GPRS attach, network is aware of the UE and the
location area where it is located. During the GPRS attach procedure, the UE will be provided
with a P-TMSI, if it is not having a valid P-TMSI already [9]. The subscriber data is copied
from the HLR to a SGSN [23] or from the HSS (Home Subscriber Server) to a MME in case
of a EPC [5].
The PDP context is a logical pipe established between the UE and the GGSN via the RAN
and the SGSN, and from the GGSN onwards to external IP networks and further towards the
entity that the user is communicating with [8]. The PDP context defines the used Access
Point name (APN), QoS profile and UE‟s IP address. The PDP context is initiated from the
UE using a PDP context activation request, which is sent through the RAN to the SGSN. This
request contains the proposed APN and QoS profile. The APN is basically a string type
identifier compounded of Network Identifier and Operator Identifier parts. It identifies the
external network and possibly also the service that user wants to be connected to [8]. In
16
addition, it can be also defining the GPRS network of the GGSN in case of roaming [8].
Typically network operator provides public APNs for all its customers to access common
services such as Internet and Multimedia Messaging Service (MMS). Usually, user receives a
list of available APNs from the operator, when the network finds out that the device is first
time used by the subscriber in the current network. This kind of information about the devices
used in the network is stored in operator‟s EIR. Device identification can be used to ensure
what kind of configuration settings are sent for different devices and what kind of format is
needed to be used. It is also possibility for the UE provider to create operator customized UEs
where APN list is then among others, one of the customized features.
User selects which APN to use, based on which server it wants to connect, and which service
it wants to use [8]. Based on the requested APN and info from the HLR, the SGSN verifies if
the requested APN is allowed for user and sufficient QoS is possible to be achieved. Then
based on the APN it passes request to the suitable GGSN. To resolve IP address of the
suitable GGSN, the SGSN either sends a DNS (Domain Name System) query to a DNS or
uses its own cache [8]. The GGSN then selects to which external network the connection is
made and what is the UE‟s IP address used for that.
Figure 5. The scope of GPRS attach and PDP [13] [29]
17
Different QoS options are making it possible to match data connection parameters based on
different application needs. QoS profiles can be used for this kind of purposes. In case of a
GSM, QoS options are quite limited, but in the UMTS they are already rather advanced, and
well taken in to account in the design phase. In Releases 97 and 98 QoS profile is consisting
of following attributes [8]: precedence class, delay class, reliability class and throughput
class.
In the newer releases (R99 onwards) more advanced options for QoS profiling are available
[8]: traffic class, maximum bit rate, guaranteed bit rate, delivery order, maximum service data
unit, service data unit (SDU) format information, SDU error ratio, residual bit error ratio,
delivery of erroneous SDUs, transfer delay, traffic handling priority, allocation/retention
priority and source statistics descriptor.
Typical approach for ensuring network wide QoS is to divide applications into different
groups. Basically these groups are just a collection of different QoS parameter values
assumed to fit for the applications with different needs. In the UMTS the divisions are [24]:
- conversational class
- streaming class
- interactive class and
- background class.
In [25] it has been proposed that this class grouping should be expanded with additional
classes to cover all the needs of M2M. When talking about the QoS in case of M2M, it is
important to understand there is a huge variance in the needs of different M2M applications.
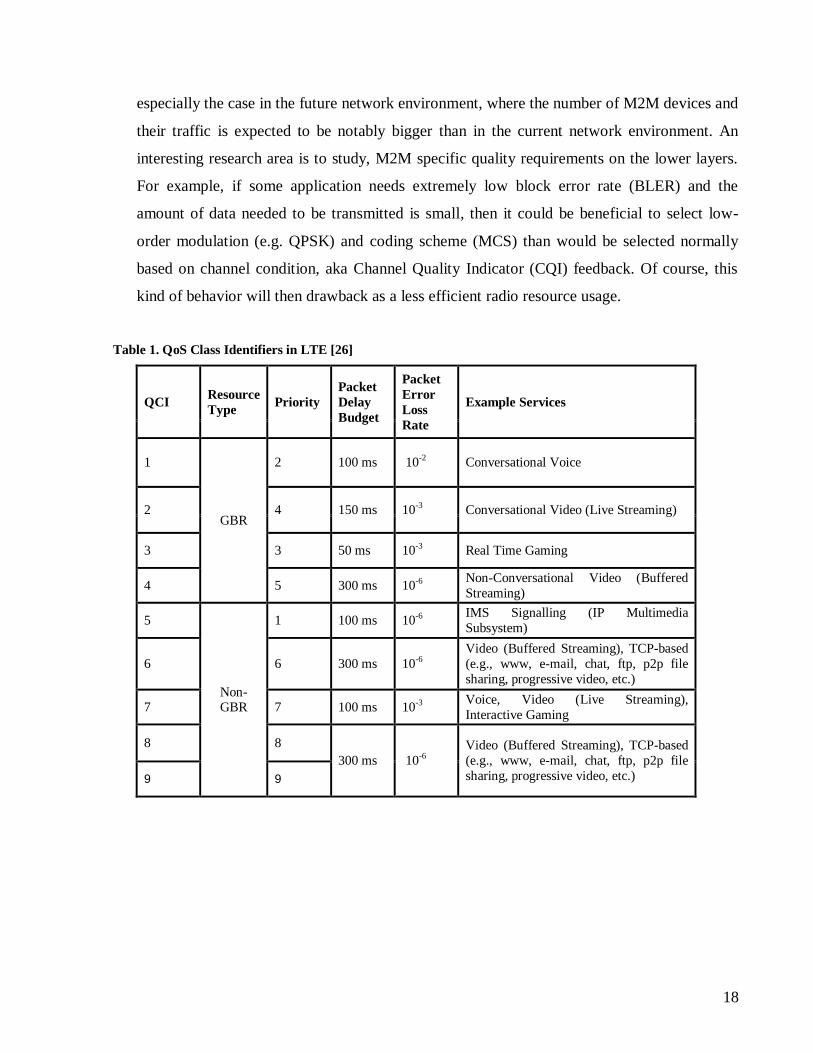
In LTE, the number of different QoS classes is raised to nine. These groups and the
corresponding QoS Class Identifier (QCI) are presented in Table 1. QCI is the parameter used
to access the different classes. However, it might be so that to ensure a sufficient QoE for all
the applications, M2M might need even more emphasis on the standardization. This is
18
especially the case in the future network environment, where the number of M2M devices and
their traffic is expected to be notably bigger than in the current network environment. An
interesting research area is to study, M2M specific quality requirements on the lower layers.
For example, if some application needs extremely low block error rate (BLER) and the
amount of data needed to be transmitted is small, then it could be beneficial to select low-
order modulation (e.g. QPSK) and coding scheme (MCS) than would be selected normally
based on channel condition, aka Channel Quality Indicator (CQI) feedback. Of course, this
kind of behavior will then drawback as a less efficient radio resource usage.
Table 1. QoS Class Identifiers in LTE [26]
QCI Resource
Type Priority
Packet
Delay
Budget
Packet
Error
Loss
Rate
Example Services
1
GBR
2 100 ms 10-2 Conversational Voice
2 4 150 ms 10-3 Conversational Video (Live Streaming)
3 3 50 ms 10-3 Real Time Gaming
4 5 300 ms 10-6 Non-Conversational Video (Buffered
Streaming)
5
Non-GBR
1 100 ms 10-6 IMS Signalling (IP Multimedia
Subsystem)
6 6 300 ms 10-6
Video (Buffered Streaming), TCP-based
(e.g., www, e-mail, chat, ftp, p2p file
sharing, progressive video, etc.)
7 7 100 ms 10-3 Voice, Video (Live Streaming),
Interactive Gaming
8 8
300 ms 10-6
Video (Buffered Streaming), TCP-based
(e.g., www, e-mail, chat, ftp, p2p file
sharing, progressive video, etc.) 9 9
19
2.3.2 Protocol suite
The basic idea of a protocol suite is that the protocols with specific tasks in the process of
providing connectivity [27] are forming a stack, where the protocols next to each other are
providing services to each other. Basically this means a simple two way collaboration. When
a protocol needs services from the lower layers, it passes a packet of its own form to a lower
layer protocol, which does not modify the received data but instead packs it to an envelope of
its own kind. And similarly vice versa, when a packet is received from the lower layer the
envelope is opened and passed to the upper layer. Packing is called encapsulation and
unpacking is called decapsulation.
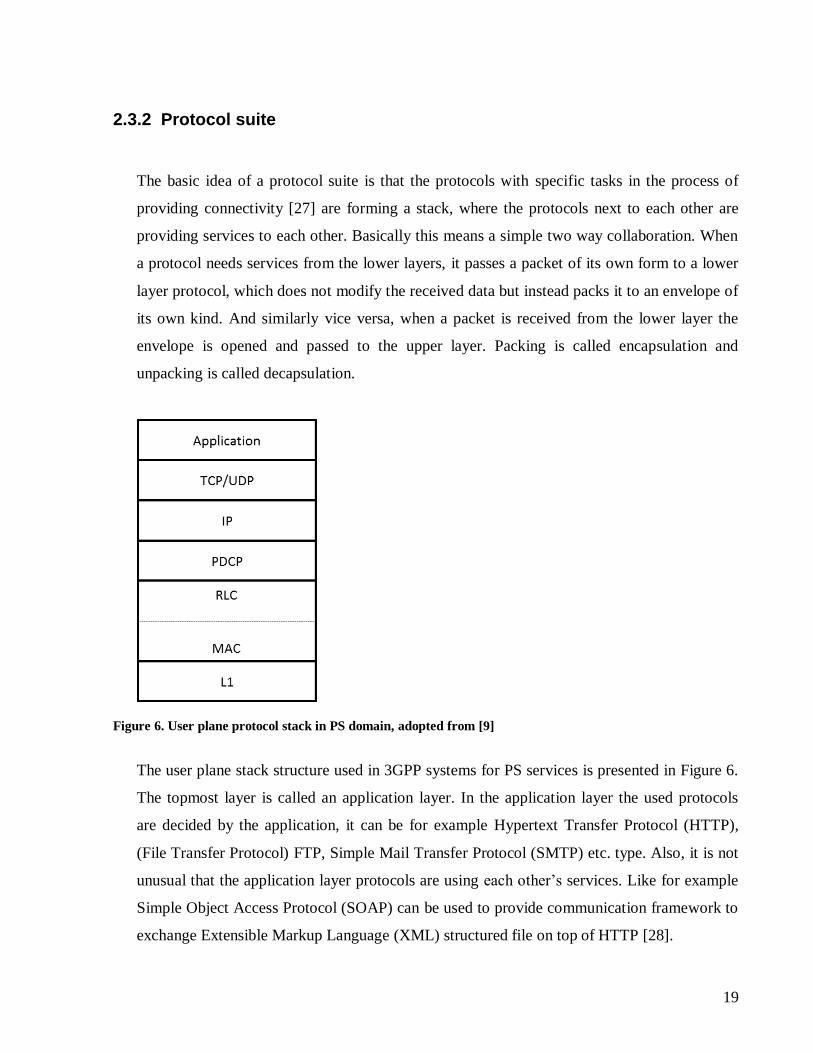
Figure 6. User plane protocol stack in PS domain, adopted from [9]
The user plane stack structure used in 3GPP systems for PS services is presented in Figure 6.
The topmost layer is called an application layer. In the application layer the used protocols
are decided by the application, it can be for example Hypertext Transfer Protocol (HTTP),
(File Transfer Protocol) FTP, Simple Mail Transfer Protocol (SMTP) etc. type. Also, it is not
unusual that the application layer protocols are using each other‟s services. Like for example
Simple Object Access Protocol (SOAP) can be used to provide communication framework to
exchange Extensible Markup Language (XML) structured file on top of HTTP [28].
20
Below the application layer is the transport layer. Protocols on this layer are providing
services like flow and congestion control, reliability, bit error detection, retransmission,
separation of upper layers by port numbering etc. The most common protocols of this type are
Transmission Control Protocol (TCP) and (User Datagram Protocol) UDP. The main
difference is that a basic implementation of UDP is lacking TCP‟s features like congestion
control, ordering of packets and retransmissions; it is faster but less reliable than TCP. This
difference basically means that the choice of using TCP or UDP depends on the application.
UDP is suitable for applications where high throughput is needed but reliability is not as
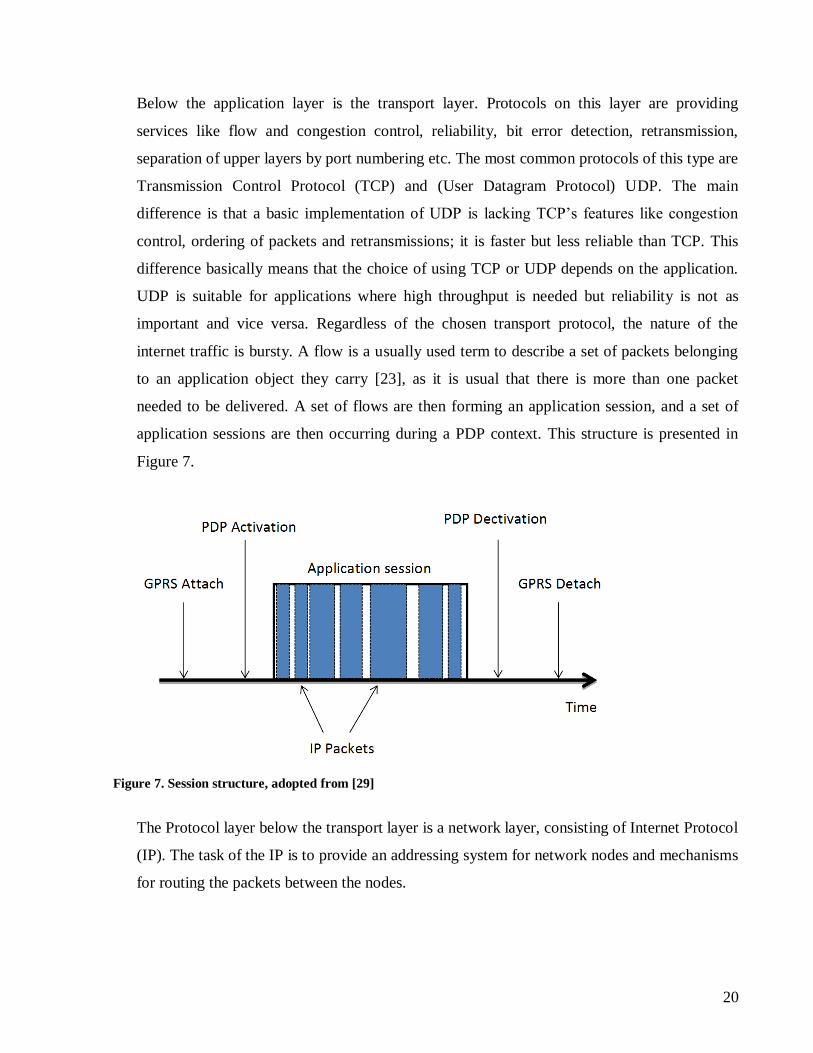
important and vice versa. Regardless of the chosen transport protocol, the nature of the
internet traffic is bursty. A flow is a usually used term to describe a set of packets belonging
to an application object they carry [23], as it is usual that there is more than one packet
needed to be delivered. A set of flows are then forming an application session, and a set of
application sessions are then occurring during a PDP context. This structure is presented in
Figure 7.
Figure 7. Session structure, adopted from [29]
The Protocol layer below the transport layer is a network layer, consisting of Internet Protocol
(IP). The task of the IP is to provide an addressing system for network nodes and mechanisms
for routing the packets between the nodes.

21
The three layers below the IP layer; Packet Data Convergence Protocol (PDCP), Radio Link
Control (RLC), Medium Access Control (MAC) are forming a so called Layer 2 (L2) [5]. The
main purpose of PDCP is to compress headers and give support for reordering and
retransmission during a handover [5] [10]. RLC layer‟s main purpose is the segmentation and
reassembly of upper layer packets in order to adapt them to the actual size that can be
transmitted over the radio interface. The MAC layer is in charge of mapping logical channels
into transport channels [10]. It is instructing the RLC layer about needed packet sizes and
trying to achieve negotiated QoS.
On the bottom of the layer stack is the physical layer aka Layer 1 (L1). It is responsible of the
actual physical transmission resource utilization in a means of uplink (UL) and downlink
(DL) separation and spectral efficiency. More about system specific L1 is discussed in section
2.2.2.
22
3 Machine-to-machine communications
This chapter gives an introduction to M2M communications. It starts by giving a definition of
M2M, and then discusses the typical characteristics in a general level, and later with an
application specific level. Finally the growth prospects, the ecosystem and challenges are
discussed.
3.1 Definition
According to 3GPP, e.g. [1] [4], M2M or actually MTC (Machine Type Communications)
which is the term used for M2M in 3GPP, is defined following way: “Machine Type
Communication is a form of data communication which involves one or more entities that do
not necessarily need human interaction”. The term machine-to-machine itself is not a new
one, but the applications and especially the ones used over mobile networks are being
evolving and gaining more and more popularity during the last years. Technical
improvements are also allowing implementations for more complex applications, with less
effort and cheaper prices than previously.
Depending on the context and the use case of M2M, other overlapping or similar terms are
being also used. The most widely used and the most important term of this kind is the Internet
of Things (IoT). IoT is however much more wide-ranging term than M2M. The idea of IoT is
that every object or thing benefitting from network connection, has its own connectivity and
intelligence to communicate with each other. IoT is more or less a vision, and M2M can be
considered as its sub concept. Or it can be also seen as a one step towards IoT [30]. Terms
telemetrics, telematics and sensor networks are instead sub concepts and examples of M2M
applications used in a certain specific field for remotely managing and monitoring machines
or a network of devices, which are used for collecting and forwarding data. Despite the fact,
all of these terms are used in a mixed manner, which is caused by the overlapping and the
23
difficulty to define exact meaning and domain for each term. Different terms for more or less
similar things are adopted by different industries, companies and standardization bodies.
It is hard for some use cases to examine if the application is really a machine based or a
human based. The outlining is getting blur, especially when the application is judged purely
from the network usage point of view (bottom-up). This is due to a fact that many of the
devices are built so that they can be used for serving the needs of both M2M and H2H. This is
especially the case for consumer targeted devices. For example, a normal computer can be
running a M2M type of an application, but if it is using a typical integrated or USB
(Universal Serial Bus) connected cellular modem, normal subscription and public APN, it can
be reliably recognized as M2M only after a detailed packet capture and analysis. As M2M is
basically just a new kind of an application or a service category running on top of a network,
it is the nature of the service which determines the classification (top-down). For example,
automatic software updates are in principle fulfilling the 3GPP requirements of a machine
type communication, but they are not in generally considered as M2M if the main application
is not M2M. However, even though M2M means a change in a network domain as a shift
towards more automated communication, and a change from a traditional towards a new in a
business domain, it is most of all a change happening in the whole communications
ecosystem and society.
3.2 Typical characteristics
The main reason why it is so important to consider and study M2M communications is the
difference in its characteristics compared to the traditional communication situations for
which the mobile networks were initially designed. Compared to H2H communications,
M2M communications involves [1]:
a) different market scenarios,
b) data communications,
c) lower costs and effort,
24
d) a potentially very large number of communicating terminals with,
e) to a large extent, little traffic per terminal
The communication event might be happening predominantly by the device itself. It can be
triggered by event e.g. earthquake or rain, time or by the user either remotely or locally. The
characteristics and requirements of M2M communications are highly dependent on the type
of the service. Above listed characteristics are the most typical differences between traditional
communication situations and M2M communication situations. For example, low energy
consumption is very important issue for some of the M2M devices, while for others it might
not really matter.
3.2.1 Communication Scenarios, APN and the location of a server
M2M communication scenarios can be divided in 3 different categories [4] where M2M
modules connected to Radio access network (RAN) are communicating with:
1. One central server
2. Many servers
3. With each other
The most typical communication scenario is the one having only one central server and the
M2M device or multiple M2M devices are communicating with that [4]. It can be that the end
user service is accessed from multiple client machines, but the M2M device is only
communicating with one server. These servers can be located in three different locations
behind operators GGSN [4]:
1. In the operator domain
Allows tight coupling to servers within the operator domain (can be used for
example for operators own M2M usage)
25
2. Through a dedicated APN
Dedicated connection point (APN) at GGSN allows possibility for access
control and routing
3. General Internet through public Internet APN
No dedicated connection to server
The most suitable location is depending on the use case of the application and for example the
security requirements. Another difference for a customer is that the more tailored solution, the
better is the expected QoS, but also higher the costs. For a small deployment, it might be
suitable to have a minimalistic investment, purchase regular consumer subscription and not
use any special arrangements. For current and future‟s broader deployments, with possibly
stricter QoS requirements and bigger number of users, it is reasonable to invest more and
ensure the quality and functioning of the service by a co-operation with the operator, either by
building the whole infrastructure with the operator or at least using dedicated APN. For an
operator, it is also possible to offer group tailored solutions based on the M2M use case. This
will then give the operator more visibility towards its different customer groups, but it will
also increase costs when new configurations to the network must be built.
However, for example the pricing decisions can be causing that subscribers prefer general
subscriptions and operators public APN, instead of M2M tailored ones. For a mobile network
operator (MNO), it is a choice if they want to introduce mechanisms to block up or reduce
this kind of usage in their network, by pricing decisions, device locking, or by network and
access restrictions etc. But more than restricting, MNO should be able to provide surplus for
its customers by offering the most suitable and tailored solutions as possible. From that
viewpoint, it should be possible to separate M2M subscriptions from other subscriptions. As
the QoS requirements are different, it is also operators concern to what extend invest in
setting up special arrangements or infrastructure, when returns from individual applications
may be low? [30]
26
3.2.2 M2M terminal connection possibilities
A traditional user device, like a cell phone, usually combines the application and network
connectivity under a same device. So, that the communicator has its own direct access to the
mobile network. In case of a M2M, it can be that multiple devices, for example sensors, are
using non 3GPP short range radio access technologies to communicate with a central gateway
device, which is then connected to the mobile network. The gateway collects the data from
the devices and takes care of forwarding it onwards.
This kind of a central gateway has some advantages over the option where every sensor and
M2M device has its own access to the mobile network. First of all, as there is only one device
connected to the mobile network, coverage is needed only in the place where the central
device is located. This can be lowering deployment costs, especially if the coverage must be
otherwise built and ensured in every location of devices. From a radio resource usage point of
view it is possible to save resources by introducing more efficient scheduling and for example
a centralized proxy server. From an addressing point of view, resources are saved because
there is only one IMSI, MSISDN and IP address needed for serving multiple nodes. For the
customer, this means less cost because the number of subscriptions can be reduced. This
makes it easier to upgrade the subscription or change the operator. The easiness of changing
the MNO is seen as a positive driver for the growth of M2M market [4]. For the core
network, one node compared to multiple nodes, means of course less signaling and less
resource usage and reservation. Drawbacks described in [4] are the fact that non-3GPP
entities are having access to the 3GPP network, and potential security risks if the
communication security between slave and master is lower than usual 3GPP security. If 3GPP
technologies are entirely preferred, the solution for this kind of scenario would be achieved
by introducing heterogeneous networks with small cells. It can be also that direct peer-to-peer
communication between devices is made possible in the upcoming network releases.
27
3.3 M2M Categories and Applications
As previously mentioned, the diversity in the M2M usage possibilities is wide ranging, and
the application requirements are also varying much. This chapter takes a glance in to the
application diversity by going into the different usage areas of M2M and listing the most
typical M2M applications over the cellular networks. The idea is to get a better understanding
about the diversity of different M2M applications, and an overview of the different
requirements from a top-down perspective. When the requirements and the use cases are well
known, it is then easier to understand what are the most crucial factors needed from the
network requirement point of view.
The grouping of M2M is a major part of this section, as finding an elegant way for grouping
M2M is serving all the players in the M2M ecosystem. The different grouping methods and
considerations from the data analysis point of view are discussed more in section 4.2. The
grouping that is used in this section is based on the grouping by 3GPP [1].
28
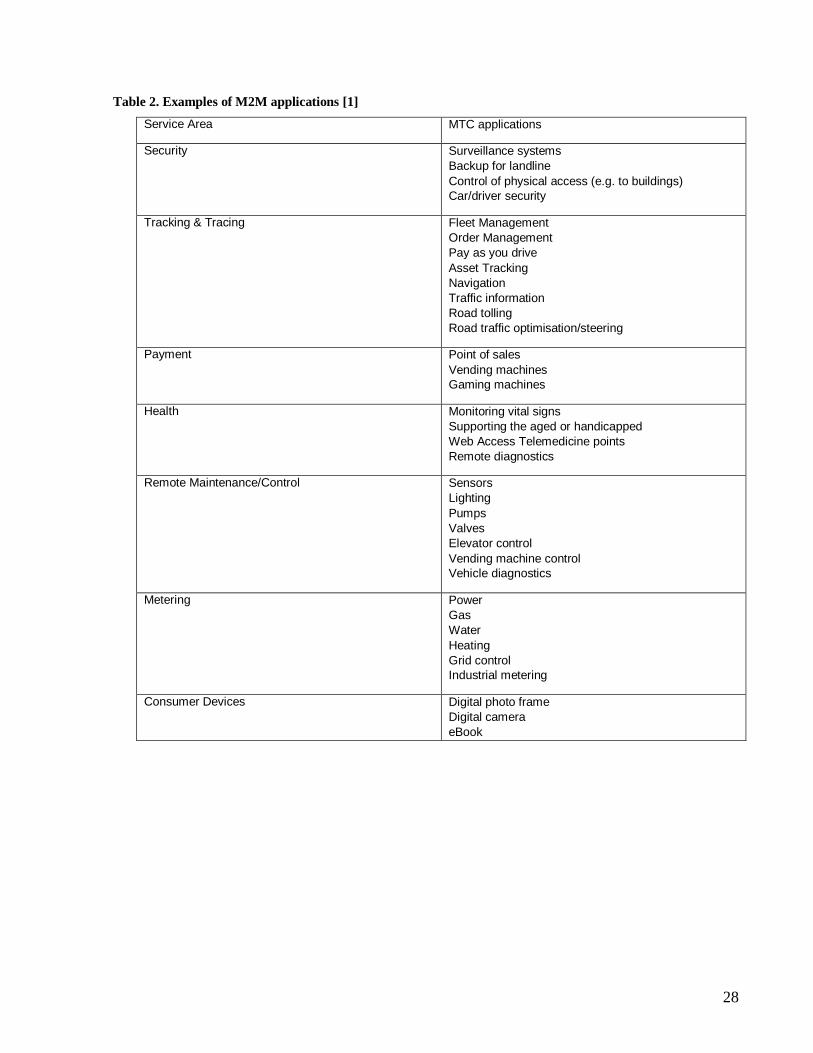
Table 2. Examples of M2M applications [1]
Service Area MTC applications
Security Surveillance systems
Backup for landline
Control of physical access (e.g. to buildings)
Car/driver security
Tracking & Tracing Fleet Management
Order Management
Pay as you drive
Asset Tracking
Navigation
Traffic information
Road tolling
Road traffic optimisation/steering
Payment Point of sales
Vending machines
Gaming machines
Health Monitoring vital signs
Supporting the aged or handicapped
Web Access Telemedicine points
Remote diagnostics
Remote Maintenance/Control Sensors
Lighting
Pumps
Valves
Elevator control
Vending machine control
Vehicle diagnostics
Metering Power
Gas
Water
Heating
Grid control
Industrial metering
Consumer Devices Digital photo frame
Digital camera
eBook
29
3.3.1 Smart metering
Smart metering of different commodities such as water, heat, gas and especially electricity are
currently one of the most visibly and widely adopted M2M application. High adaptation rate
is based on regulatory drivers and the benefits, e.g. in cost savings, it offers for the companies
and their customers. The biggest benefit of smart metering is to get faster information of the
usage and service breaks. For the customer smart metering opens a possibility to become
aware of own usage and aim for savings via real time usage and cost monitoring. For the
energy etc. companies this offers a possibility for striving supply optimization, to get rid of
estimate based billing and to introduce new tariffs and products [31]. If hourly based pricing
is applied, it is also possible to reduce usage during busy hours which will decrease the risk of
running out of resources and the need for usage limitations [32]. As a short term effect, the
installation projects will be employing people [32].
To take full advantage of all the new offerings, end user platform has a big role, as it must
provide accessible and easily perceivable reporting of a data. For the cellular network
operator, smart metering solution typically means large customers with relatively low
transmission requirements, because the meters are only sending a small amount of data.
Though, the transmission behavior varies as the devices can be more or less smart, and they
might be having for example remote management capabilities. Typical challenges for the
network come up with poor network coverage as the meters are usually placed in basements
for practical and security reasons. The higher the frequency, the bigger the problem is. One
typical solution to overcome the challenge is to use external antennas. Depending on the
deployment size and environment, it is also possible to provide indoor coverage by
introducing a repeater or a new base station into the premises nearby. Initial costs for this
kind of solution are higher but the increased coverage is then available for other than smart
metering users as well. However, the initial cost for connecting a single smart meter to the
cellular network should not be too expensive because the number of connected devices is
large.
30
3.3.2 Tracking and Tracing
Object tracking functionality can be based on either Global Positioning System (GPS), or the
location can be estimated from acquired cell information. GPS positioning is more accurate
but it requires additional GPS chipset, and can be only used in places where GPS signal can
be received. The problems are occurring especially in a dense urban environment and indoors
[5]. A GPS based positioning system with cellular network assistance is assumed to be the
primary positioning method in LTE [5]. The cellular network assistance in this case, is used
only for reducing the time to acquire GPS fix by giving initiation information from the
cellular network instead of using the GPS link [5]. This kind of a positioning method is called
Assisted Global Navigation Satellite System (A-GNSS) positioning.
Due to the above mentioned problems of GPS, the cell information based positioning has
been an attractive choice for a further development. The cell information is more complicated
to use accurately for positioning than GPS, and as the positioning is based on the network
topology, co-operation with a network operator is needed to map Cell IDs (CID) to actual site
locations. However, this is not the kind of information that all the operators are easily willing
to share, which is highly limiting the usage of CID information. Also, when the location is
wanted to be defined accurately, a calculation of user location within the serving cell area
must be done and it is not easily done especially in the areas where signal cannot be received
from multiple base stations at the same time.
Even though CID and radio condition based measurements can be used for estimating the
user location for all the 3GPP cellular systems with a fair precision, LTE has a few
positioning service options including CID, A-GNSS, arrival time difference based methods
[33] specified for release 9 and onwards. For older releases than that, and without building up
any special arrangements for positioning, operator is only limited to know UE‟s position in
the accuracy of received measurement reports of monitored and active set cells, and UE is
limited to know only the ID or scrambling code of the observed cells but cannot map them to
a physical location.
31
From a network improvement and planning perspective, accurate user position information is
highly valuable. For example, from a capacity perspective it would be good to deploy cells
based on the location of users, and especially based on the heavy users [34]. In this way, for
example M2M heavy users e.g. video surveillance, could be provided with an own small cell.
Even so, location information mapped to a specific customer is highly confidential
information, and without a proper permission the usage rights are limited. However without
asking permission from user it can be used for example in the case of criminal investigation
or emergency.
Right now, tracking services are mostly used for tracking vehicles and other assets with a
high monetary value, but there are, for example, already solutions on the commercial market
for tracking dogs and sport activities. The tracking of objects is an area of M2M which
particularly has a good probability for future growth in terms of diversity in usage
possibilities and number of devices.
Vehicle and asset tracking information can be used to develop new more advanced end-user
applications. Let us take a brief look into a few current and future M2M applications of this
area. One possibility, for example, is to improve navigation in terms of safety and
sophisticated guidance. This means informing drivers about congestion, accidents and
preferable routes. A simple solution is to have a remotely controllable info and traffic signs,
but that same information could be also sent directly to the drivers‟ handhelds or navigation
devices. This kind of a scenario however means a type of multicast situation which is not well
suitable for current mobile networks. Actual recorded route information could be used as a
basis of pattern recognition use for upcoming route recommendations in addition to other
parameters. Vehicle tracking can be also used to develop advanced public transport timetable
and route advisor services. Already now, it is possible for everyone to follow some public
transport vehicles in real time via a web interface, (e.g. the trams of Helsinki and the train
traffic in Finland) and get a positioning based arrival time estimates on some of the tram and
bus stops. The data of Helsinki public transport system is made publicly available to
encourage application developers for new innovative applications.
32
M2M applications can be also used for prioritizing public transport vehicles in traffic lights,
either by drivers‟ requests or directly based on location info. One of the current popular
vehicle tracking use cases is the location information sent by taxis. It can be done
periodically, typically 5-6 times in a minute or by request [35] [36]. It has been already
noticed that this kind of behavior has caused a Random Access Channel (RACH) overload, in
a places like airports, where many taxis are served by the same base station. Currently it
seems that the biggest industry to first deploy positioning based services in a big scale is the
transport and transportation industry. For the tracking type of M2M devices, the most
important requirement from the network side is to ensure reliability also in case of a heavy
mobility.
3.3.3 Wireless payment systems
As obvious, the biggest advantage of wireless terminals, compared to wired ones, is the fact
of being wireless, and making it possible to have verified card payments available in the
places where wired networks are not available. This is a very important requirement for
moving points of sale, like taxi companies and temporarily placed sales booths, but it is
adding an extra value for example for a restaurants because it allows customers to use the
payment terminal in a table. Yet again, a critical part for the M2M application to work is to
have a good enough network coverage, security and service availability, especially because
paying is so highly related to company‟s cash flow and customer experience. As the QoS
requirements are relatively tight, the functioning of these kinds of services can be challenging
for example in temporary mass public events, as the number of users is large and
parameterizations are already used for ensuring reasonable functionality of other important
services, especially voice. For the payment service, low enough latency and reliability of
working are fundamental requirements. Because the devices are mainly using batteries as
their power supply, and trying to save them as much as possible, they can be causing
relatively high amounts of signaling as in many cases they must be starting the transmission
procedures from the idle mode.
33
3.3.4 Security services and remote maintenance
In the area of security services and remote maintenance, the variety of different types of
applications for different use cases is wide, and so the diversity of needed network
requirements is high. The applications of this area can be used, for example, for video
surveillance, building maintenance, or detecting smoke [37] etc. From a network point of
view, common factor for all these types of services is that they are one of the most demanding
ones among the area of M2M over cellular networks. The high reliability and service
availability are crucial for these kinds of services, because they are complementing or
replacing the need for a physical human appearance. Due to the high requirements in
reliability and network capability, it can be really a challenge to meet the required level of
service without custom adjustments to the mobile network. For example, to provide the
coverage and a fast enough network or to ensure functioning during electricity cut offs. This
kind of special arrangements from the MNO side will however increase the costs of
deployment, which can then show up as an adaptation of alternative choices. Meeting the
necessary requirements can be also accessed from different directions, for example in the area
of video surveillance, it is possible to store the recorded footage to a server near the camera
for ensuring the confidence that the footage is not lost and high quality video can be stored.
The material can be then addressed remotely, or the live stream can be accessed real time
with a feasible quality for network connections, in the means of resolution and frames per
second (fps). In addition to the user requests, a transmission of the device can be started by
automatic triggers like motion sensors or signal processing techniques like invisible walls or
pattern recognition. If multiple devices are triggered during a short time, there is a possibility
for an overload scenario, which must be taken into account. Noteworthy thing about the
security services is that they are an application area of M2M, which is in quite an early phase
been adapted by consumer customers in addition to the corporate ones. The big increases in
the user amounts of streaming and multimedia type of security services are however relatively
costly for the network operator, in terms of growing capacity and hardware needs caused by
the high QoS requirements.
34
3.3.5 Personal health
The health services sector, also called as a mHealth (Mobile Health), consists of diverse type
of services and applications supporting healthcare and well-being. This type of services can
be for example remote monitoring and supporting patients, but also a kind of applications
used in a case of personal emergency. The M2M health services have started to be considered
more and more to be able to cut down the growing healthcare costs caused by the aging and
the growth of population. When considering the prioritization of different types of traffic, the
health applications should be among the top priority of use cases as they can be indicating
that human life is in danger. This means that service availability and latency are the most
important network requirements for the personal health services.
3.3.6 Emergency and public safety
The topmost prioritization among all the M2M traffic is definitely the traffic of emergency
applications and early warning systems. To ensure communication needs of public
authorities, many countries have been deploying whole new separated networks such as
TETRA (Terrestrial Trunked Radio) for this kind of usage. This means that the most critical
emergency and early warning systems are not built on top of public cellular networks.
Nevertheless, adaptation of M2M is allowing various enhancement possibilities in the area of
emergency applications by allowing advanced remote monitoring and tracking for critical
entities, and by innovating new ways for taking advantage of the mobile networks. For
example in Sweden there has been a pilot project where location information of first aid
skilled volunteers is used in case of cardiac arrests to call them out via SMS.
3.3.7 Consumer segment
M2M for consumer segment is consisting of all the above mentioned types of applications
with a consumer user emphasis. The growing popularity of connected consumer devices is
35
easy to consider as a step towards the Internet of Things, an ideal where everything
benefitting from connection is connected to Internet. Many consumer segment products
already exist, but the real breakthrough has not yet happened. The breakthrough is anyhow
very likely to happen, but it has still been waiting for user-friendly killer applications and
lowering of prices. Depending on the type of breakthrough applications and their popularity,
the network impact can be varying from moderate to high.
3.4 The growth of M2M
The reason why it is so important to analyze M2M traffic and especially the traffic in the
mobile cellular networks lies in the fact that mobile cellular networks are expected to have a
huge potential as a backbone of M2M communications. For example Ericsson has a vision
that there will be 50 billion connected devices in the year 2020. This idea is driven by the idea
that every device benefitting from the connection will be connected.
When the number of connected devices is growing such a radically, it is clear that there exists
a huge growth potential in the market for the companies making M2M possible. The revenue
potential is however not expected to be growing in a same scale as the number of users is
growing, because the average revenue per user (ARPU) is smaller for the connected machines
than for the connected human beings. It is anyhow considered as a potential growth sector
also for the already maturing markets [4] [38], as in addition to decreasing prices of terminal
chipsets, the already built ubiquitous coverage is one of the main enablers of the growth [4].
The growth is also opening new opportunities for the operators, in terms of choosing the
possible role in the future M2M market [39] [40] [41]. For the MNOs it is important to grow
in the M2M sector as the traditional revenue sources are saturating [38].
The main drivers of a M2M growth in general, taking into account other backbones than
mobile networks as well, are the needs and possibilities that M2M is offering for different
parties: people, business and society. Technology has made the cost of connectivity low.
Increased coverage, faster networks, embedded solutions, IT and decreased prices have
36
opened new opportunities and new market segments, at the same time as the knowledge of
the M2M potential for revenue generation and customer satisfaction has been increasing [4]
[42]. For example, telematics and telemetry are seen increasingly as sources of greater
operational efficiency and increased incremental revenue [40]. The economies of scale and
R&D investments by the mobile handset industry have been beneficial matters for the growth
of M2M.
One important driver for the increase of M2M, especially in the area of remote meter reading,
has been the regulation. For example in Finland, the remote reading of the electricity has been
highly driven by a regulation given by the Finnish Government. The regulation requires that
remote electricity metering should be offered to at least 80 percent of distribution network‟s
customers by the end of year 2013 [43].
Another important driver for the growth is the involvement of the standardization entities.
The more uniform the industry is, and the more standardized are the solutions, the easier it is
to get advantages of scale and develop new applications more cost effectively [4].
The growth of M2M is expected to happen especially in the area of PS services. Despite the
fact, CS services will remain important for some use cases for example in the area of
emergency applications where extreme service reliability is needed. Though, these kinds of
services can be enhanced if bundled with more advanced PS data based features, if sufficient
QoS for the CS services can be secured.
3.5 Overview of the M2M ecosystem
The M2M ecosystem consists of players doing business on different system layers, their
combination or system integration. The traditional division of the communications ecosystem,
which is used for example by Martin Fransman [44], is the divisioning into hardware vendors,
network operators and application providers. The hardware vendors are then split into user
equipment vendors and network equipment vendors.
37
Compared to the traditional telecommunications business, M2M ecosystem involves even
more different types of players, which can be rather small and specializing on a narrow niche
market. Equipment and application vendors, for instance, can be specialized to serve only the
needs of a specific industry or use case, like for example smart metering or paying equipment.
The application domain is also horizontally split into vendors of different type, e.g. vendors
of data management, middleware and user portals.
Because the M2M ecosystem is such a spread out, there is also room for companies
combining the products from different layers and acting as a system integrators or solution
providers, depending on the role they have chosen. This means that when comparing M2M
use case of mobile network into a traditional use case, M2M allows more room for players of
different type of role and business case, but there are also more challenges involved because
of the wide diversity of the relatively small niche applications. So even though the market
potential of M2M is huge, it is hard to address all the needs with a single solution. In the
M2M domain, the traditional roles of the players thus might be changing. For example, the
platform which integrates IT applications and infrastructure for M2M with mobile operator‟s
network can be done either by the operator itself [41] or by the network equipment provider.
3.6 Challenges
3.6.1 Challenges for the business
The growth of M2M will bring out new opportunities and challenges for all players in the
ecosystem. To a mobile network operator this means, a new attractive growing source of
revenue, but also challenges as it must be prepared for a multiplication in connected devices
and in the number of customers. Also these customers and devices are acting in a different
way than traditional customers and their devices. This means whole new considerations in
different areas, like for example in customer relationship management (CRM).

38
As the nature of M2M market is very fragmented, and it consists of a lot of different
applications and communication scenarios with different requirements and needs, it is not
possible for a mobile network operator to serve all the customers merely with a one size fits
all kind of a solution. Instead, it has to develop more tailored solutions to be able to serve
M2M customers individually, and also to ensure that it will get the most out of the customers
as a source of revenue. This is important especially in the areas of customer segmenting and
pricing. Because of the tailored solutions and the growth in the number of customers,
subscription management has to be done in a simple but efficient way. There must be also
flexible support for customer management in a core network side.
The growing popularity of M2M is a good thing for the whole communications ecosystem,
because it is driving forward new innovations, and at the same time attracting new companies
previously not familiar with M2M. In this way, consciousness of M2M and its opportunities
increases in vast industries, and initial threshold and costs will decrease. One of the reasons is
that there will be more and more already implemented solutions for addressing similar kind of
needs, and it is not necessary to build everything from scratch. For a company newly adopting
M2M, low enough initial costs (CAPEX) are needed especially during recession periods of a
time. Also if deployment costs for a mobile network based M2M solution are too high, then
the attractiveness of competing technologies will rise. This can be the situation for example if
indoor coverage extensions are needed, or mobile network is not available in the deployment
area. The more general and cheaper the solutions will come, the more will they be adopted by
smaller and smaller companies and consumer customers.
One of the biggest hurdles for wide adoption of M2M is currently the huge diversity in
different M2M applications and the lack of standardization on different entities. When
customized solutions are needed and solutions must be built from scratch, the initial costs will
easily be too high. The situation is however evolving all the time, as M2M is heavily involved
in the strategies of the different players in the telecommunications ecosystem and M2M
standardization is concerned in parties such as 3GPP, IEEE, and ETSI. This means that M2M
is more and more taken into account in upcoming network releases, deployments and
upgrades.
39
3.6.2 Challenges for the network
As the nature of traffic generated by M2M communications is differencing from human-
generated traffic, the special characteristics of M2M are being more and more considered in
the evolution of cellular networks. One of the primary considerations of 3GPP is to prepare
for possible overload scenarios caused by huge number of M2M devices [5]. The overload
can occur either in the core network or alternatively in the radio network and it can be caused
by the behavior of the devices or simply because of the huge number of devices. Possible
problematic situations can be for example caused by polling of huge amount of devices at the
same time, or multiple devices reporting or signaling during a relatively short period of time
like for example after electricity cut offs. The problem has been approached from two
directions: preventative solutions and solutions to handle already overloaded network [2]. In
another words, the network is tried to improve so that the probability for overload to happen
will be as low as possible, but if the overload situation happens, it can be solved by using
methods like access barring etc. The network improvements are also not necessarily only
targeted for overload situations as optimizations are at the same time increasing the general
mobile network performance. For example, techniques used for reducing power consumption
of M2M type of UEs can be at the same time benefitting other type of UEs as well.
Another challenge for the network is to handle the addressing of the huge amount of
terminals. The most limiting identifier is the IMSI, as there are only 9 to 10 digits available
for one network identified with MNC [4]. The IPv4 (Internet Protocol Version 4) address
base is also a limiting factor, but it can be handled with NATs (Network Address Translator)
and adopting IPv6 (Internet Protocol Version 6) which has a bigger address space. The
MSISDN address space is however not as problematic, as it could be extended to support 20
digits [4].
A short term challenge for some of the network operators is that they might want to be re-
allocating some parts of the GSM spectrum for LTE, but as many M2M applications are still
using GSM, refarming of the spectrum might not be possible, at least not in as wide scale as
40
they might be willing to. This means that UMTS and LTE chipsets must be cheap enough
before overcoming GSM in its attractiveness.
For the network planning, dimensioning and optimization, M2M will also introduce new
aspects as the behavior and localization of M2M devices is different than human users. This
means that in the future, the networks should be more and more planned from machine user‟s
requirements point of view, if the predictions of 50 billion connected devices will come true.
As a pre-requisite, the behavior, user distributions, customer base etc. should be known. This
raises the importance of OSS (Operations Support System), BSS (Business Support System)
and other supporting IT systems as tools for reporting, performance monitoring and decision
making, and also for example for helping to handle the increased complexity in
comprehensive customer relationship management, and taking the most out of the business
opportunities that the M2M is offering.
For the UE, the challenging aspects are depending much on the M2M application. For some
applications it can be for example very important to ensure a long battery life time, that can
be made better with different optimizations for the both UE and network. For example, one
solution for signaling improvements of this kind could be to offer a possibility to initiate a
paging procedure, which happens when the network wants to initiate communication with
terminal [7], less frequently for low activity terminals to keep them longer time in low energy
consumption state. Unnecessary paging requests can be also caused for example by the
queries of bot networks, and should be taken into account especially for the devices with
strict energy consumption requirements.

41
4 Description of the methods used
This chapter focuses on the data collection system and the methodology used in the data
analysis. Nearly the same data collection system is normally used for performance and usage
monitoring of the network but in this study it is used to get an understanding about the
characteristics of M2M communications. The different challenges faced during the study are
also discussed here.
4.1 Description of data collection system
The overview structure of the data collection system is shown in Figure 8. The used data
collection system is quite a unique entity with different pros and cons. One of the biggest
advantages of the system is that it is collecting data from different sources and combining it
coherently. It is also collecting and storing it real time. As the data is collected from multiple
sources, it is possible to analyze various things, but it also adds more challenges because the
data amounts are huge and must be combined together. One of the goals and a part of the
thesis work was to investigate also how well the measurement system can be used for
supporting R&D and MNOs purposes.
4.1.1 Data collection points
The main data source is a data collection application running on a data collection probes in
front of GGSN. This data is providing the basic framework about the traffic from the core
network point of view. The currently used data capture configuration is providing only the
most important thing from network performance monitoring point of view, which is
considered as the main use case of the system. In other words, the data collection system is
not specifically built for the purposes of this study and so it is not serving all its purposes as
well as possible. Implementation for collecting more detailed data is however available, it is
42
just a matter of configuration and hardware resources what is wanted to be collected. As the
system is in a production use and used by many users, and there is currently a limited amount
of hardware resources available, the configuration was kept unchanged. Even though, from
the study point of it was limiting the possibilities to analyze certain things. Limitations are
mainly arising because of the time resolution on traffic is sampled to be one minute, and
combining is done with a five minute resolution.
The second data source is the Operations Support System (OSS). The OSS data is coming
from two different network nodes RNC and SGSN. On Ericsson networks, there is a
possibility for recording various events on those nodes. This data is usually used to serve
various different OSS applications. The data collection configuration on RNCs and SGSNs
was also kept unchanged. For device identification and information purposes, a white list of
devices is fetched from GSMA. The device list can be also considered as a part of OSS data
or Equipment Identity Register (EIR) to be exact.
4.1.2 Source database
As the data is collected from various sources, an important part of the system is the data
combination and collection procedure. The data from different sources is combined with a
resolution of five minutes. This is done mainly for decreasing the amount of data which
would be otherwise very large. Downside of doing the sampling with a five minute sampling
frequency for the data which is already sampled once with a one minute resolution is that the
accuracy is getting worse. But the good side is that by doing this, the amount of data is
reduced which means more simplicity and smaller database. Even so, the whole database
system, including all the other tables as well, is relatively large and fast operations are being
ensured by introducing sophisticated database structures and massively parallel processing
(MPP) techniques. All in all, the data used in the analysis is consisting of the information
about PDP-context formations, GPRS attaches, IMEI data from GSMA, the five minute
resoluted probe events and RNC data about the radio performance.
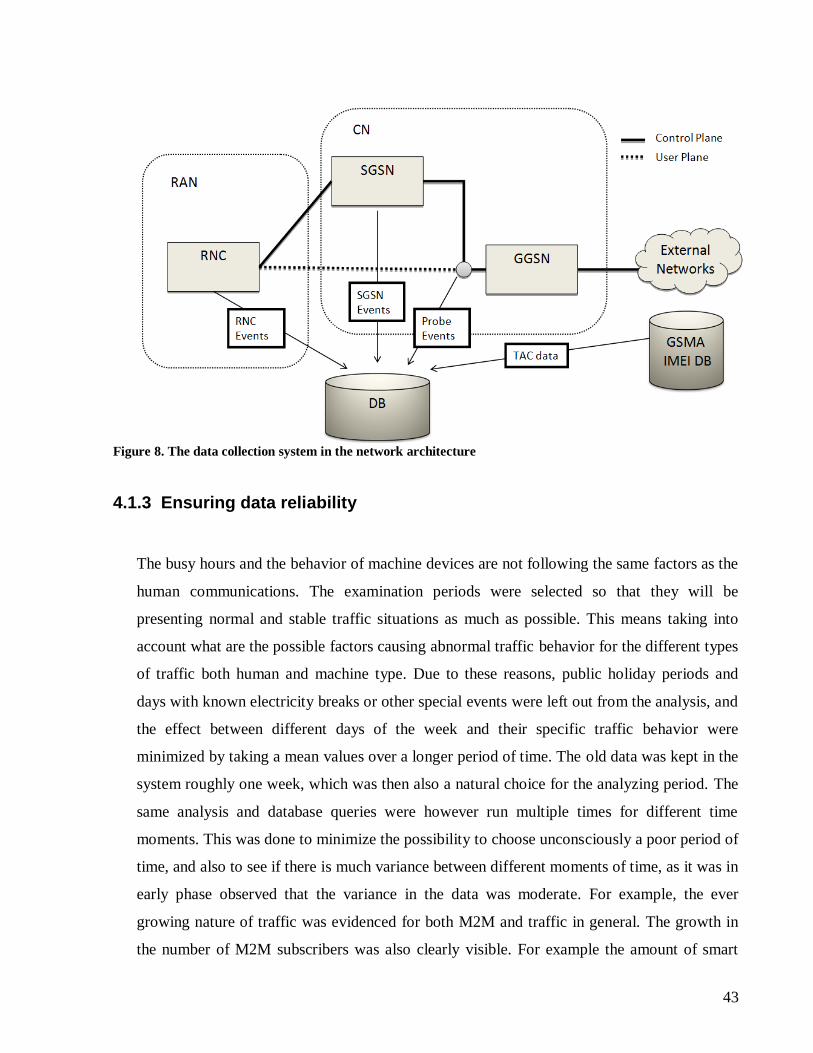
43
Figure 8. The data collection system in the network architecture
4.1.3 Ensuring data reliability
The busy hours and the behavior of machine devices are not following the same factors as the
human communications. The examination periods were selected so that they will be
presenting normal and stable traffic situations as much as possible. This means taking into
account what are the possible factors causing abnormal traffic behavior for the different types
of traffic both human and machine type. Due to these reasons, public holiday periods and
days with known electricity breaks or other special events were left out from the analysis, and
the effect between different days of the week and their specific traffic behavior were
minimized by taking a mean values over a longer period of time. The old data was kept in the
system roughly one week, which was then also a natural choice for the analyzing period. The
same analysis and database queries were however run multiple times for different time
moments. This was done to minimize the possibility to choose unconsciously a poor period of
time, and also to see if there is much variance between different moments of time, as it was in
early phase observed that the variance in the data was moderate. For example, the ever
growing nature of traffic was evidenced for both M2M and traffic in general. The growth in
the number of M2M subscribers was also clearly visible. For example the amount of smart
44
metering devices was almost doubled during four months period of time. The growth nature
in the number of subscribers and in the traffic amounts was not analyzed in a detail. It is
however rather easy to do if it is wanted to be done for example for a specific customer or
device population. However, for data reliability reasons, the values must be collected from
sufficient long period of time.
4.1.4 Ensuring data anonymity
As the collected data contains a lot of sensitive and private information about customers, it is
important to ensure privacy and anonymity and handle the collected data in harmony with the
law. The most important Finnish laws concerning the traffic measurement data handling are
Act on the protection of Privacy in Electronic Communications (516/2004) [45] and the
Personal Data Act (523/1999) [13] [46]. According to these laws, data handling is only
allowed to the extent necessary for the purpose of such handling, for example billing,
statistical analysis, research, marketing, technical development, detecting a technical fault etc.
After the data handling, the material should be deleted or anonymized.
4.1.5 How to filter out everything else than M2M
One of the most essential prerequisites for the analysis of M2M traffic is to be able to filter
out all the other traffic than M2M. In the data collection setup used, the filtering is done after
the data capturing. Meaning that, all the other than M2M traffic is also recorded and stored
into the database and raw files, and the filtering of M2M is then done afterwards. The
filtering can be divided into two different parts: filtering of M2M devices and filtering of
M2M traffic. As discussed in section 3.1, those are not necessarily always matching to the
same communication scenario. The best way of filtering is also depending on what is wanted
to be analyzed.
The M2M device identification method used in the study is mainly based on the device type
information in the terminal device list, which is maintained and provided by GSMA as a
45
“white list” of devices, permitted for use on mobile networks [11]. MNO can use this list of
devices and their TACs as a part of its EIR. The information in the GSMA‟s list is not
perfectly containing device type information for all the possible M2M devices, as it is on the
device manufacturer‟s responsibility to provide that data. Because of data blanks on the list, it
is enriched with information about M2M devices used through operators known M2M APNs.
Even though the operator has M2M dedicated APNs, it was quite early observed that the
dedicated APNs are also been used with non-M2M dedicated devices like USB dongle
modems and the use case cannot be easily determined. This makes it a bit challenging to
analyze all the possible aspects perfectly, as it is a matter of personal opinion if this kind of
communication scenario should be considered as M2M or not. For example, it can be clearly
said that a particular device (e.g. USB modem) should not be considered as a purely M2M
device, but judging the traffic is more complicated and nearly all the possible devices can be
used for M2M. As it is not possible to have a general modus operandi and apply it for all the
possible cases, every communication scenario should be analyzed case by case, which is of
course not relevant to do as a network wide operation, and so, some error margin must be
accepted. In the study, the device type information of GSMA‟s list is filtered so that M2M is
expected to be everything where device type information field is either „M2M‟ or device type
is unknown, but the device is used through known M2M dedicated APN. Although, one
exception is done for clearly remote maintenance type of usage through a known APN for
which the device type field is „PC‟.
A different approach for filtering M2M traffic would be to use subscriber data, e.g. IMSI or
MSISDN. As the MNOs want to be serving their customers with unique offerings aka
marketing mixes to get the most out of them, MNOs are more and more concerning the
customer segmenting already in the acquisition phase. In this way, customer data could be
already grouped by the type of a customer, e.g. consumer, M2M, corporate, or even more in
detail, if the M2M is split on smaller pieces. However, as the M2M is still quite a young
market, bigger M2M specific investments are only just coming up in the future. Because of
that reason, the easy ways to analyze M2M subscriptions or M2M KPIs with a simple
solution are still waiting for themselves. Although the procedures used in this study are a one
step towards. Customers can be identified from the traffic by their IMSI or MSISDN, and it is
46
possible to use customer data based information for either M2M traffic filtering, or just
enriching the data and the analysis, when the actual filtering is done for example device
based. Which is also the main approach used in this thesis.
The third way for filtering would be to do it based on IP addresses. The problem with IP
traffic based identification is that, as the network operators are widely using dynamic IP
address allocation, it cannot be fully relied on [13]. However, for a static IP addresses it can
be reliably used as an identification method.
As the implementation of EIR and OSS is left rather open in the standards, and the only
compulsory part of EIR, is the “white list” of devices, as specified in [47]. It is very much up
to the operator what data it wants to store, and what are the use cases and applications for the
actual utilization of the data. It is depending a lot on the operator‟s stored data and the EIR
system capabilities how easy and useful it is to match it with a specific user or equipment
filtering based M2M data. But if it is done, it can give extra value and new viewpoints for the
analysis.
4.2 M2M Grouping
One of the very first plans for this thesis was to investigate the characteristics and the use
cases of M2M, so that it would be possible to divide the M2M traffic into categories and form
groups having similarities in behavior or use case. The aim was to do this because the
information could be then used as an input for different improvements and optimizations on
the network side, for example for group based M2M handling mechanism [1], but another
goal was to give an insight about the current deployment and a market state of M2M.
Sophisticated grouping would also give a nice overview of the M2M market.
The selection between different alternative grouping methods is however not that self-
evident. The way how to form groups is very much dependent on what is wanted to be
achieved, and what is wanted to be analyzed. It can be done emphasizing on different criteria,
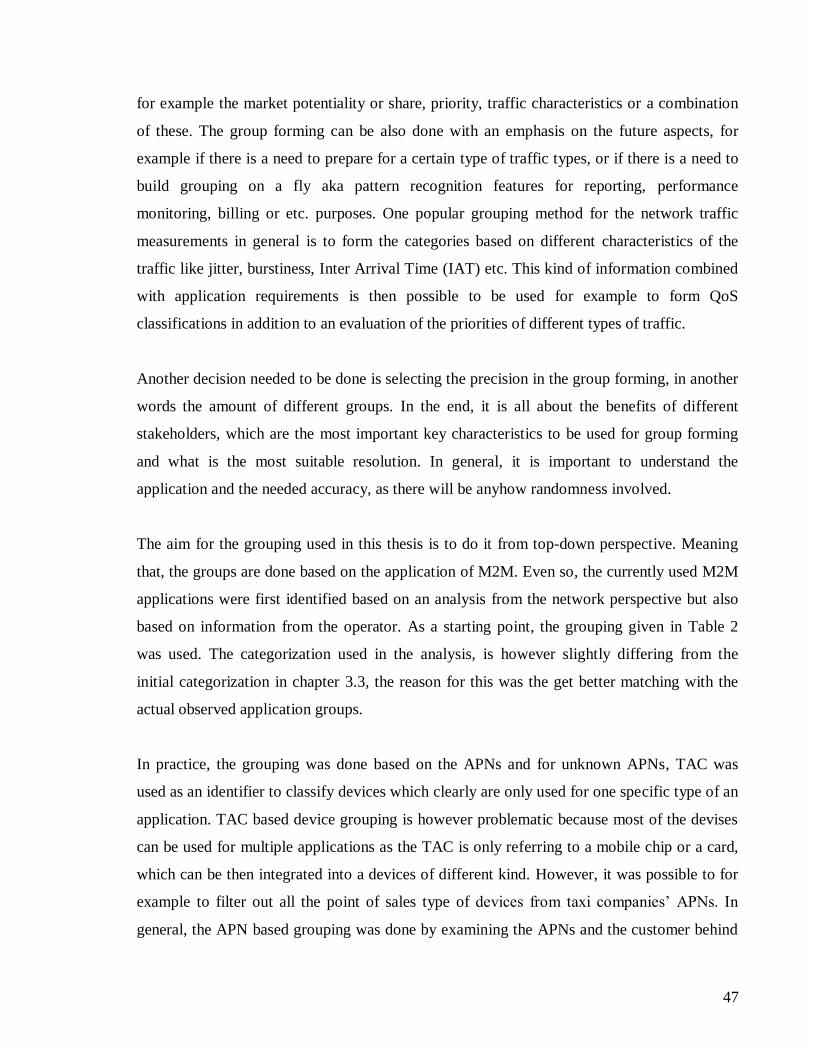
47
for example the market potentiality or share, priority, traffic characteristics or a combination
of these. The group forming can be also done with an emphasis on the future aspects, for
example if there is a need to prepare for a certain type of traffic types, or if there is a need to
build grouping on a fly aka pattern recognition features for reporting, performance
monitoring, billing or etc. purposes. One popular grouping method for the network traffic
measurements in general is to form the categories based on different characteristics of the
traffic like jitter, burstiness, Inter Arrival Time (IAT) etc. This kind of information combined
with application requirements is then possible to be used for example to form QoS
classifications in addition to an evaluation of the priorities of different types of traffic.
Another decision needed to be done is selecting the precision in the group forming, in another
words the amount of different groups. In the end, it is all about the benefits of different
stakeholders, which are the most important key characteristics to be used for group forming
and what is the most suitable resolution. In general, it is important to understand the
application and the needed accuracy, as there will be anyhow randomness involved.
The aim for the grouping used in this thesis is to do it from top-down perspective. Meaning
that, the groups are done based on the application of M2M. Even so, the currently used M2M
applications were first identified based on an analysis from the network perspective but also
based on information from the operator. As a starting point, the grouping given in Table 2
was used. The categorization used in the analysis, is however slightly differing from the
initial categorization in chapter 3.3, the reason for this was the get better matching with the
actual observed application groups.
In practice, the grouping was done based on the APNs and for unknown APNs, TAC was
used as an identifier to classify devices which clearly are only used for one specific type of an
application. TAC based device grouping is however problematic because most of the devises
can be used for multiple applications as the TAC is only referring to a mobile chip or a card,
which can be then integrated into a devices of different kind. However, it was possible to for
example to filter out all the point of sales type of devices from taxi companies‟ APNs. In
general, the APN based grouping was done by examining the APNs and the customer behind
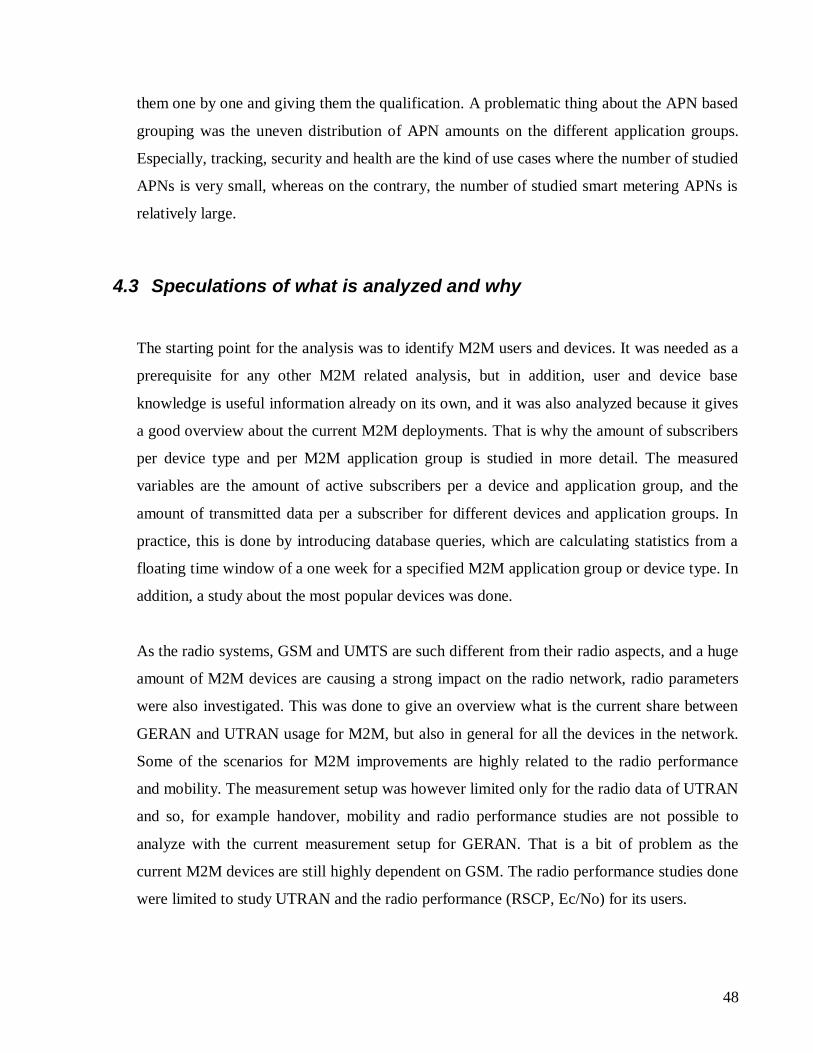
48
them one by one and giving them the qualification. A problematic thing about the APN based
grouping was the uneven distribution of APN amounts on the different application groups.
Especially, tracking, security and health are the kind of use cases where the number of studied
APNs is very small, whereas on the contrary, the number of studied smart metering APNs is
relatively large.
4.3 Speculations of what is analyzed and why
The starting point for the analysis was to identify M2M users and devices. It was needed as a
prerequisite for any other M2M related analysis, but in addition, user and device base
knowledge is useful information already on its own, and it was also analyzed because it gives
a good overview about the current M2M deployments. That is why the amount of subscribers
per device type and per M2M application group is studied in more detail. The measured
variables are the amount of active subscribers per a device and application group, and the
amount of transmitted data per a subscriber for different devices and application groups. In
practice, this is done by introducing database queries, which are calculating statistics from a
floating time window of a one week for a specified M2M application group or device type. In
addition, a study about the most popular devices was done.
As the radio systems, GSM and UMTS are such different from their radio aspects, and a huge
amount of M2M devices are causing a strong impact on the radio network, radio parameters
were also investigated. This was done to give an overview what is the current share between
GERAN and UTRAN usage for M2M, but also in general for all the devices in the network.
Some of the scenarios for M2M improvements are highly related to the radio performance
and mobility. The measurement setup was however limited only for the radio data of UTRAN
and so, for example handover, mobility and radio performance studies are not possible to
analyze with the current measurement setup for GERAN. That is a bit of problem as the
current M2M devices are still highly dependent on GSM. The radio performance studies done
were limited to study UTRAN and the radio performance (RSCP, Ec/No) for its users.
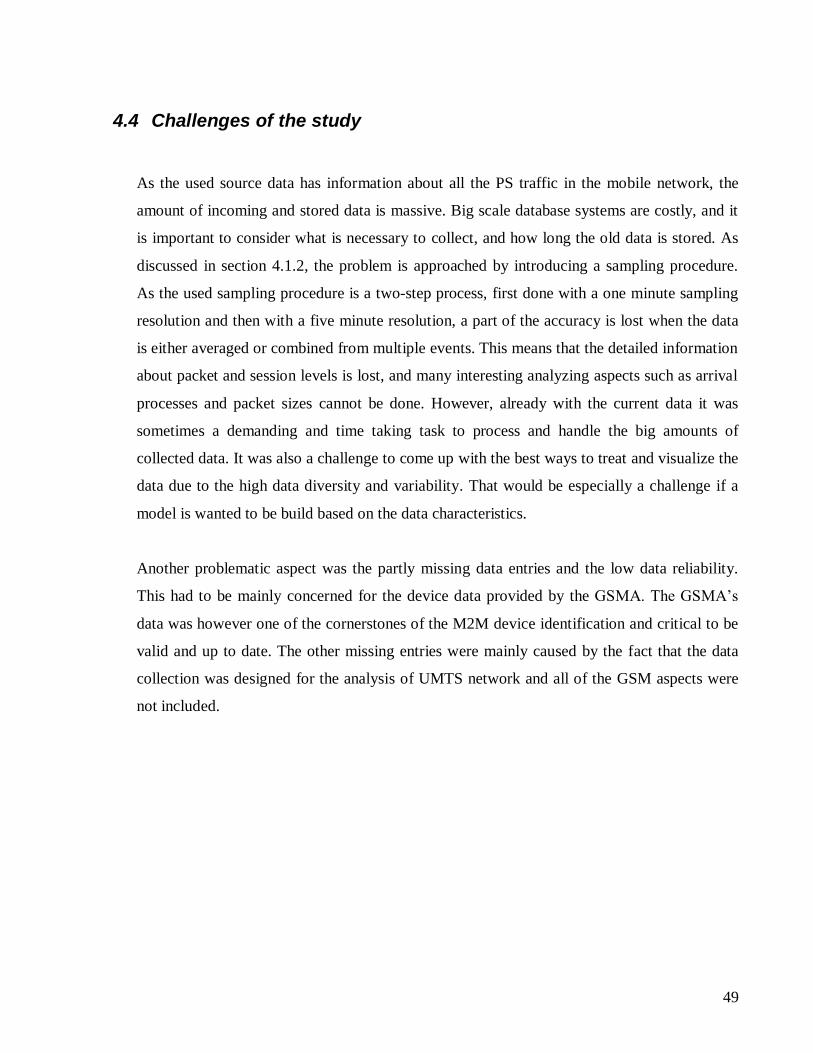
49
4.4 Challenges of the study
As the used source data has information about all the PS traffic in the mobile network, the
amount of incoming and stored data is massive. Big scale database systems are costly, and it
is important to consider what is necessary to collect, and how long the old data is stored. As
discussed in section 4.1.2, the problem is approached by introducing a sampling procedure.
As the used sampling procedure is a two-step process, first done with a one minute sampling
resolution and then with a five minute resolution, a part of the accuracy is lost when the data
is either averaged or combined from multiple events. This means that the detailed information
about packet and session levels is lost, and many interesting analyzing aspects such as arrival
processes and packet sizes cannot be done. However, already with the current data it was
sometimes a demanding and time taking task to process and handle the big amounts of
collected data. It was also a challenge to come up with the best ways to treat and visualize the
data due to the high data diversity and variability. That would be especially a challenge if a
model is wanted to be build based on the data characteristics.
Another problematic aspect was the partly missing data entries and the low data reliability.
This had to be mainly concerned for the device data provided by the GSMA. The GSMA‟s
data was however one of the cornerstones of the M2M device identification and critical to be
valid and up to date. The other missing entries were mainly caused by the fact that the data
collection was designed for the analysis of UMTS network and all of the GSM aspects were
not included.
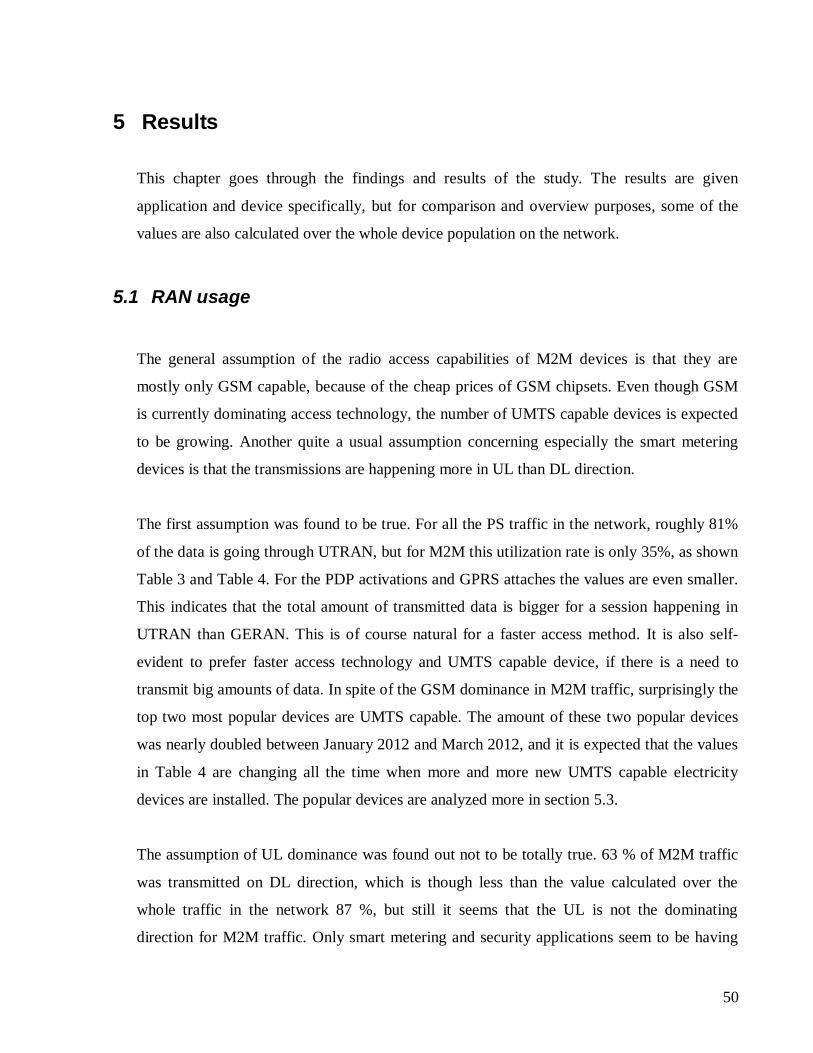
50
5 Results
This chapter goes through the findings and results of the study. The results are given
application and device specifically, but for comparison and overview purposes, some of the
values are also calculated over the whole device population on the network.
5.1 RAN usage
The general assumption of the radio access capabilities of M2M devices is that they are
mostly only GSM capable, because of the cheap prices of GSM chipsets. Even though GSM
is currently dominating access technology, the number of UMTS capable devices is expected
to be growing. Another quite a usual assumption concerning especially the smart metering
devices is that the transmissions are happening more in UL than DL direction.
The first assumption was found to be true. For all the PS traffic in the network, roughly 81%
of the data is going through UTRAN, but for M2M this utilization rate is only 35%, as shown
Table 3 and Table 4. For the PDP activations and GPRS attaches the values are even smaller.
This indicates that the total amount of transmitted data is bigger for a session happening in
UTRAN than GERAN. This is of course natural for a faster access method. It is also self-
evident to prefer faster access technology and UMTS capable device, if there is a need to
transmit big amounts of data. In spite of the GSM dominance in M2M traffic, surprisingly the
top two most popular devices are UMTS capable. The amount of these two popular devices
was nearly doubled between January 2012 and March 2012, and it is expected that the values
in Table 4 are changing all the time when more and more new UMTS capable electricity
devices are installed. The popular devices are analyzed more in section 5.3.
The assumption of UL dominance was found out not to be totally true. 63 % of M2M traffic
was transmitted on DL direction, which is though less than the value calculated over the
whole traffic in the network 87 %, but still it seems that the UL is not the dominating
direction for M2M traffic. Only smart metering and security applications seem to be having
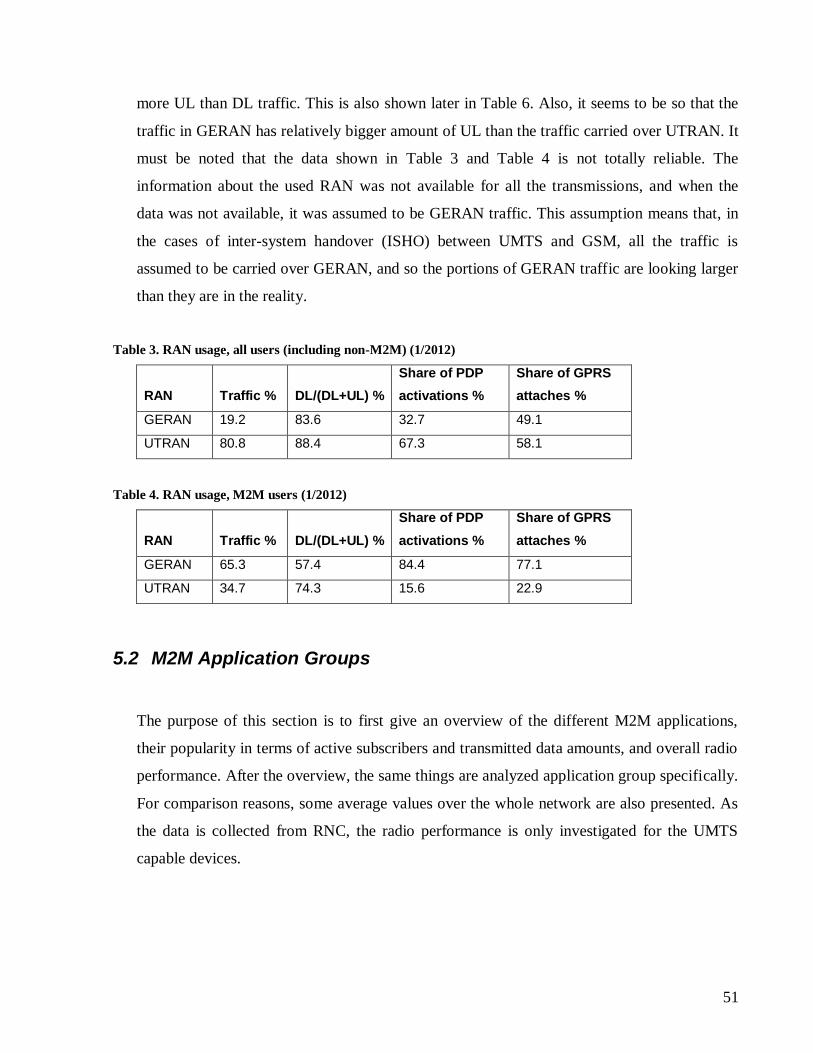
51
more UL than DL traffic. This is also shown later in Table 6. Also, it seems to be so that the
traffic in GERAN has relatively bigger amount of UL than the traffic carried over UTRAN. It
must be noted that the data shown in Table 3 and Table 4 is not totally reliable. The
information about the used RAN was not available for all the transmissions, and when the
data was not available, it was assumed to be GERAN traffic. This assumption means that, in
the cases of inter-system handover (ISHO) between UMTS and GSM, all the traffic is
assumed to be carried over GERAN, and so the portions of GERAN traffic are looking larger
than they are in the reality.
Table 3. RAN usage, all users (including non-M2M) (1/2012)
RAN Traffic % DL/(DL+UL) %
Share of PDP
activations %
Share of GPRS
attaches %
GERAN 19.2 83.6 32.7 49.1
UTRAN 80.8 88.4 67.3 58.1
Table 4. RAN usage, M2M users (1/2012)
RAN Traffic % DL/(DL+UL) %
Share of PDP
activations %
Share of GPRS
attaches %
GERAN 65.3 57.4 84.4 77.1
UTRAN 34.7 74.3 15.6 22.9
5.2 M2M Application Groups
The purpose of this section is to first give an overview of the different M2M applications,
their popularity in terms of active subscribers and transmitted data amounts, and overall radio
performance. After the overview, the same things are analyzed application group specifically.
For comparison reasons, some average values over the whole network are also presented. As
the data is collected from RNC, the radio performance is only investigated for the UMTS
capable devices.
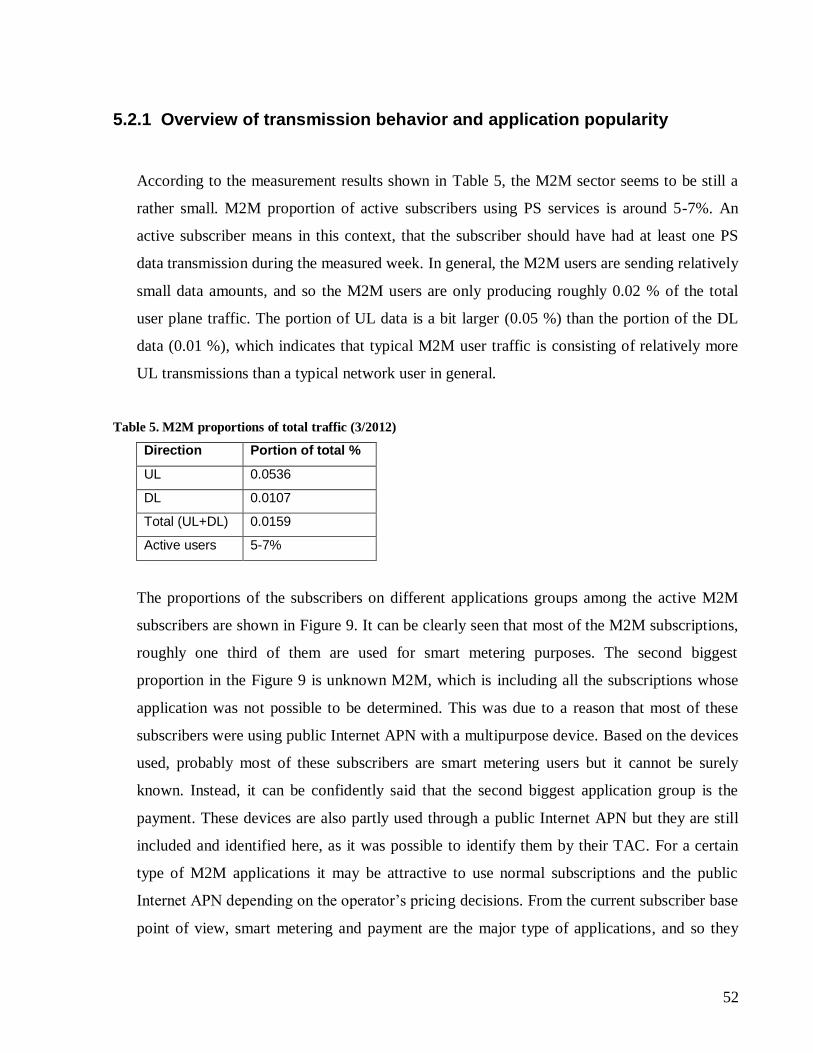
52
5.2.1 Overview of transmission behavior and application popularity
According to the measurement results shown in Table 5, the M2M sector seems to be still a
rather small. M2M proportion of active subscribers using PS services is around 5-7%. An
active subscriber means in this context, that the subscriber should have had at least one PS
data transmission during the measured week. In general, the M2M users are sending relatively
small data amounts, and so the M2M users are only producing roughly 0.02 % of the total
user plane traffic. The portion of UL data is a bit larger (0.05 %) than the portion of the DL
data (0.01 %), which indicates that typical M2M user traffic is consisting of relatively more
UL transmissions than a typical network user in general.
Table 5. M2M proportions of total traffic (3/2012)
Direction Portion of total %
UL 0.0536
DL 0.0107
Total (UL+DL) 0.0159
Active users 5-7%
The proportions of the subscribers on different applications groups among the active M2M
subscribers are shown in Figure 9. It can be clearly seen that most of the M2M subscriptions,
roughly one third of them are used for smart metering purposes. The second biggest
proportion in the Figure 9 is unknown M2M, which is including all the subscriptions whose
application was not possible to be determined. This was due to a reason that most of these
subscribers were using public Internet APN with a multipurpose device. Based on the devices
used, probably most of these subscribers are smart metering users but it cannot be surely
known. Instead, it can be confidently said that the second biggest application group is the
payment. These devices are also partly used through a public Internet APN but they are still
included and identified here, as it was possible to identify them by their TAC. For a certain
type of M2M applications it may be attractive to use normal subscriptions and the public
Internet APN depending on the operator‟s pricing decisions. From the current subscriber base
point of view, smart metering and payment are the major type of applications, and so they
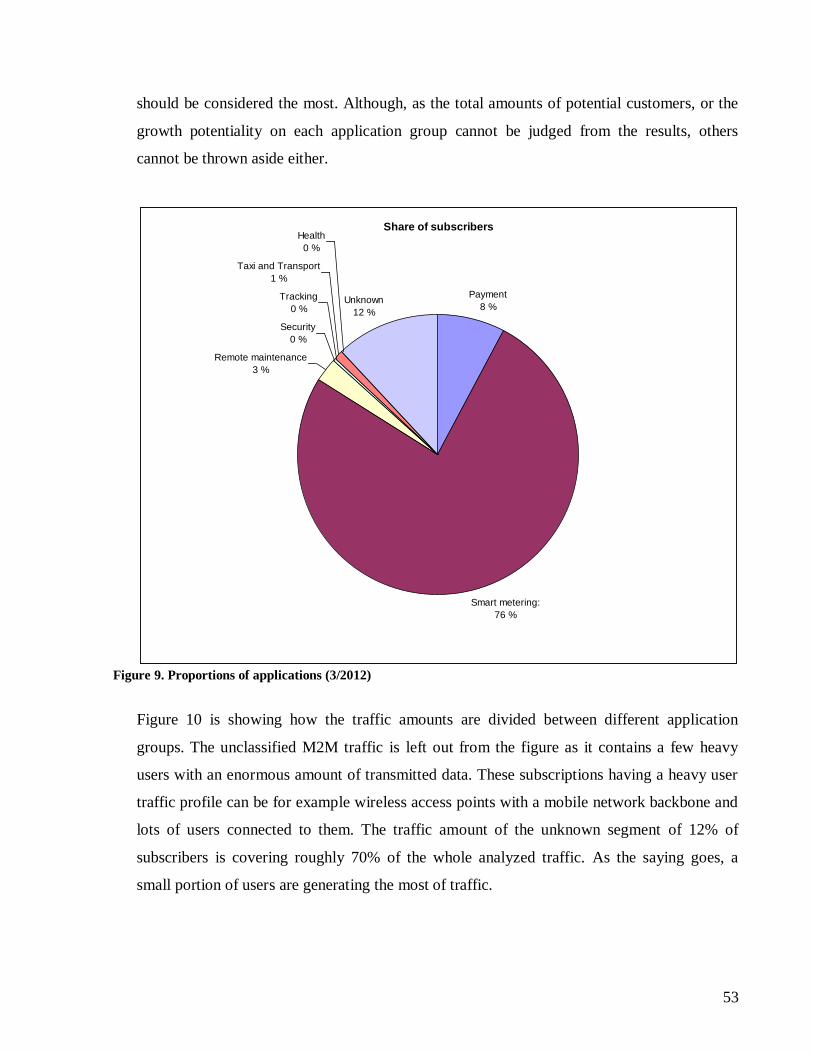
53
should be considered the most. Although, as the total amounts of potential customers, or the
growth potentiality on each application group cannot be judged from the results, others
cannot be thrown aside either.
Share of subscribers
Payment
8 %
Smart metering:
76 %
Remote maintenance
3 %
Security
0 %
Tracking
0 %
Taxi and Transport
1 %
Health
0 %
Unknown
12 %
Figure 9. Proportions of applications (3/2012)
Figure 10 is showing how the traffic amounts are divided between different application
groups. The unclassified M2M traffic is left out from the figure as it contains a few heavy
users with an enormous amount of transmitted data. These subscriptions having a heavy user
traffic profile can be for example wireless access points with a mobile network backbone and
lots of users connected to them. The traffic amount of the unknown segment of 12% of
subscribers is covering roughly 70% of the whole analyzed traffic. As the saying goes, a
small portion of users are generating the most of traffic.
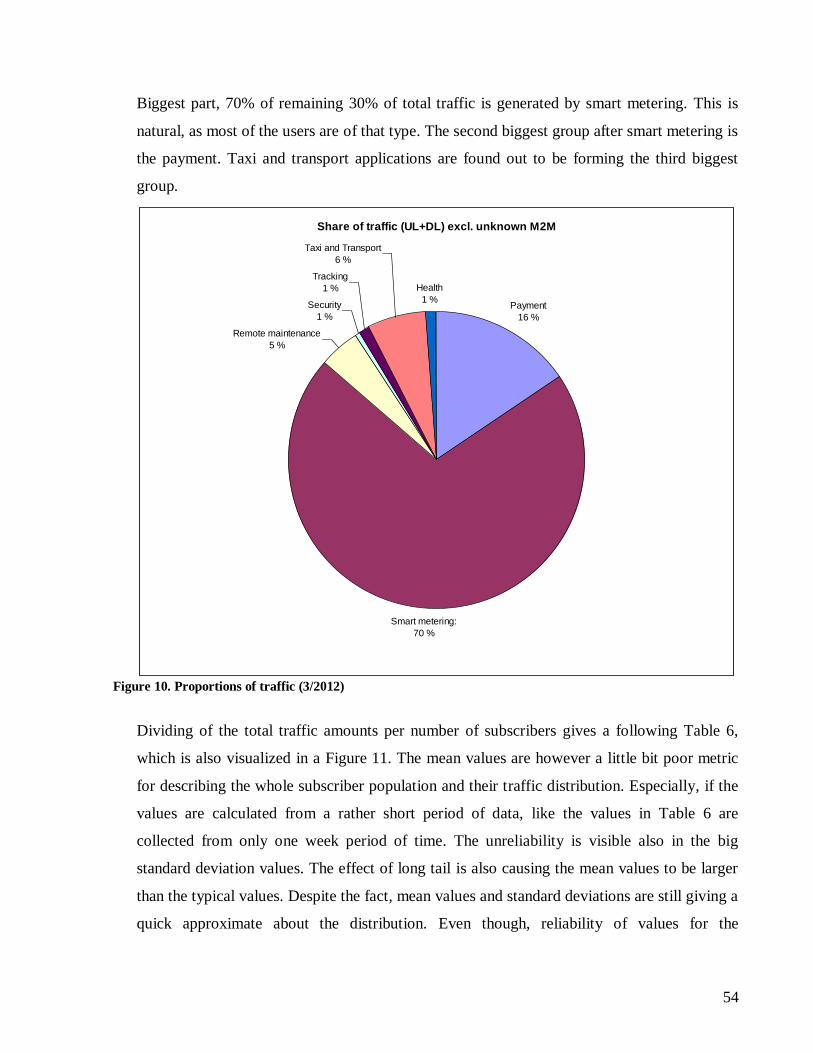
54
Biggest part, 70% of remaining 30% of total traffic is generated by smart metering. This is
natural, as most of the users are of that type. The second biggest group after smart metering is
the payment. Taxi and transport applications are found out to be forming the third biggest
group.
Share of traffic (UL+DL) excl. unknown M2M
Payment
16 %
Smart metering:
70 %
Remote maintenance
5 %
Security
1 %
Tracking
1 %
Taxi and Transport
6 %
Health
1 %
Figure 10. Proportions of traffic (3/2012)
Dividing of the total traffic amounts per number of subscribers gives a following Table 6,
which is also visualized in a Figure 11. The mean values are however a little bit poor metric
for describing the whole subscriber population and their traffic distribution. Especially, if the
values are calculated from a rather short period of data, like the values in Table 6 are
collected from only one week period of time. The unreliability is visible also in the big
standard deviation values. The effect of long tail is also causing the mean values to be larger
than the typical values. Despite the fact, mean values and standard deviations are still giving a
quick approximate about the distribution. Even though, reliability of values for the
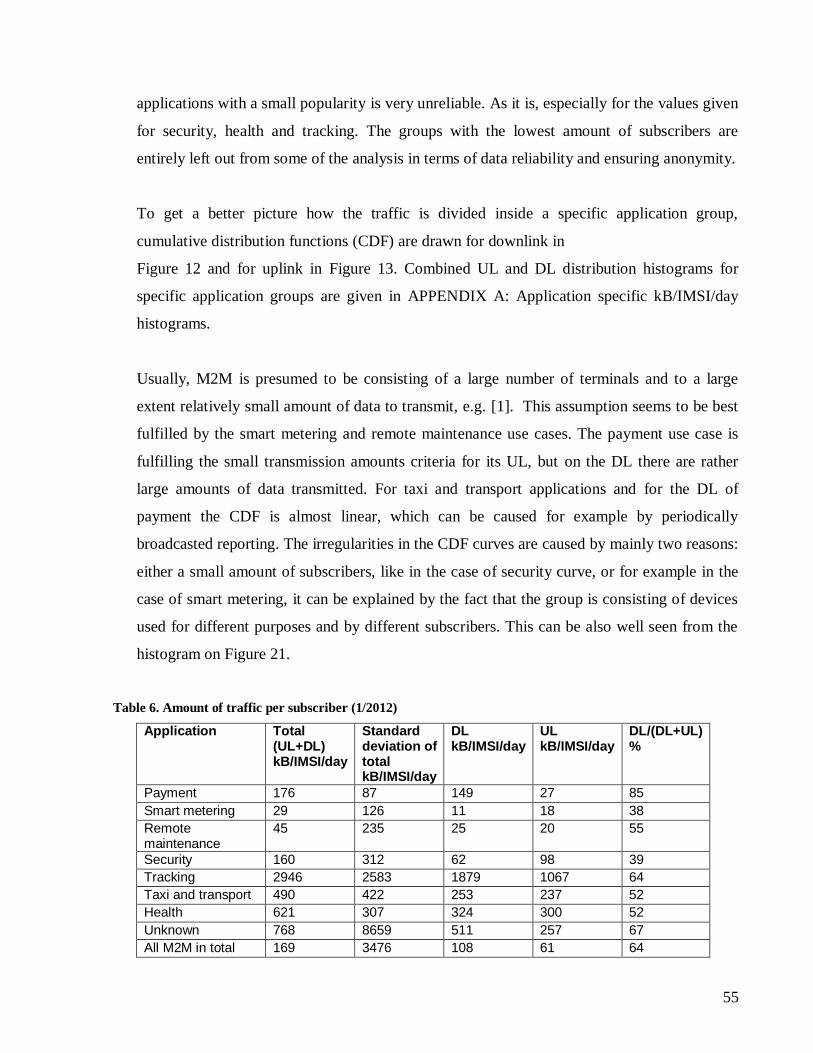
55
applications with a small popularity is very unreliable. As it is, especially for the values given
for security, health and tracking. The groups with the lowest amount of subscribers are
entirely left out from some of the analysis in terms of data reliability and ensuring anonymity.
To get a better picture how the traffic is divided inside a specific application group,
cumulative distribution functions (CDF) are drawn for downlink in
Figure 12 and for uplink in Figure 13. Combined UL and DL distribution histograms for
specific application groups are given in APPENDIX A: Application specific kB/IMSI/day
histograms.
Usually, M2M is presumed to be consisting of a large number of terminals and to a large
extent relatively small amount of data to transmit, e.g. [1]. This assumption seems to be best
fulfilled by the smart metering and remote maintenance use cases. The payment use case is
fulfilling the small transmission amounts criteria for its UL, but on the DL there are rather
large amounts of data transmitted. For taxi and transport applications and for the DL of
payment the CDF is almost linear, which can be caused for example by periodically
broadcasted reporting. The irregularities in the CDF curves are caused by mainly two reasons:
either a small amount of subscribers, like in the case of security curve, or for example in the
case of smart metering, it can be explained by the fact that the group is consisting of devices
used for different purposes and by different subscribers. This can be also well seen from the
histogram on Figure 21.
Table 6. Amount of traffic per subscriber (1/2012)
Application Total (UL+DL) kB/IMSI/day
Standard deviation of total kB/IMSI/day
DL kB/IMSI/day
UL kB/IMSI/day
DL/(DL+UL) %
Payment 176 87 149 27 85
Smart metering 29 126 11 18 38
Remote maintenance
45 235 25 20 55
Security 160 312 62 98 39
Tracking 2946 2583 1879 1067 64
Taxi and transport 490 422 253 237 52
Health 621 307 324 300 52
Unknown 768 8659 511 257 67
All M2M in total 169 3476 108 61 64
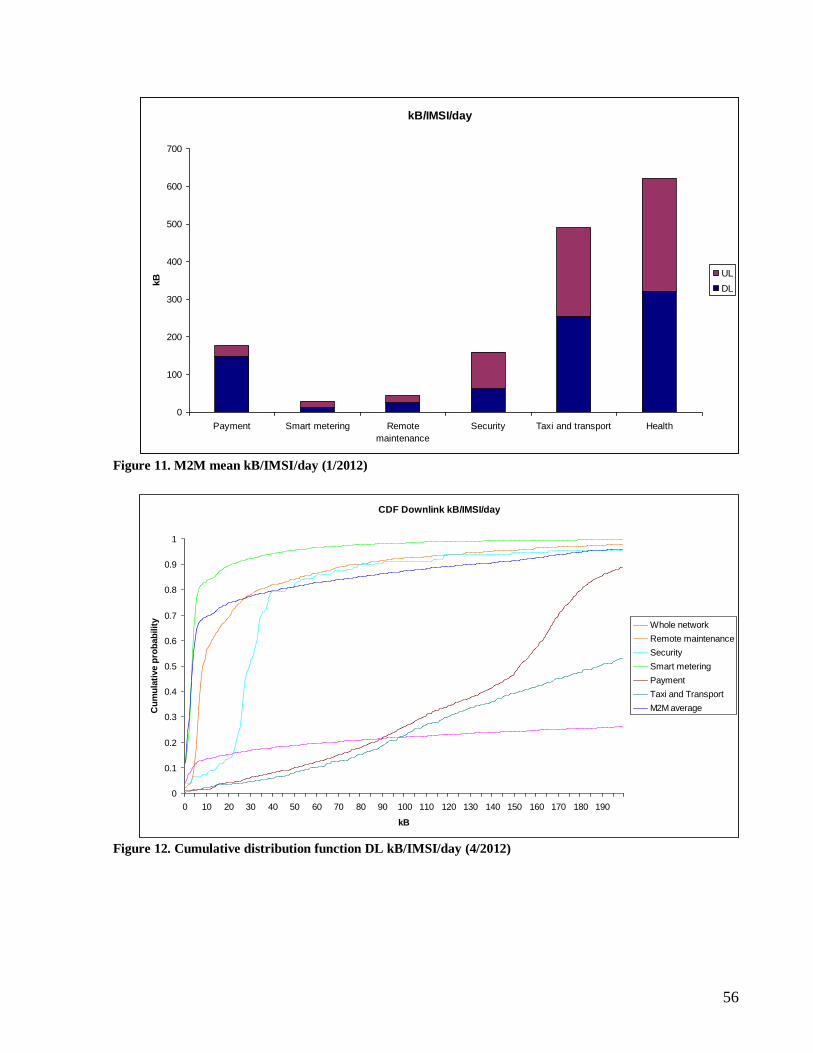
56
Figure 11. M2M mean kB/IMSI/day (1/2012)
CDF Downlink kB/IMSI/day
0
0.1
0.2
0.3
0.4
0.5
0.6
0.7
0.8
0.9
1
0 10 20 30 40 50 60 70 80 90 100 110 120 130 140 150 160 170 180 190
kB
Cu
mu
lati
ve p
rob
ab
ilit
y
Whole network
Remote maintenance
Security
Smart metering
Payment
Taxi and Transport
M2M average
Figure 12. Cumulative distribution function DL kB/IMSI/day (4/2012)
kB/IMSI/day
0
100
200
300
400
500
600
700
Payment Smart metering Remote
maintenance
Security Taxi and transport Health
kB UL
DL
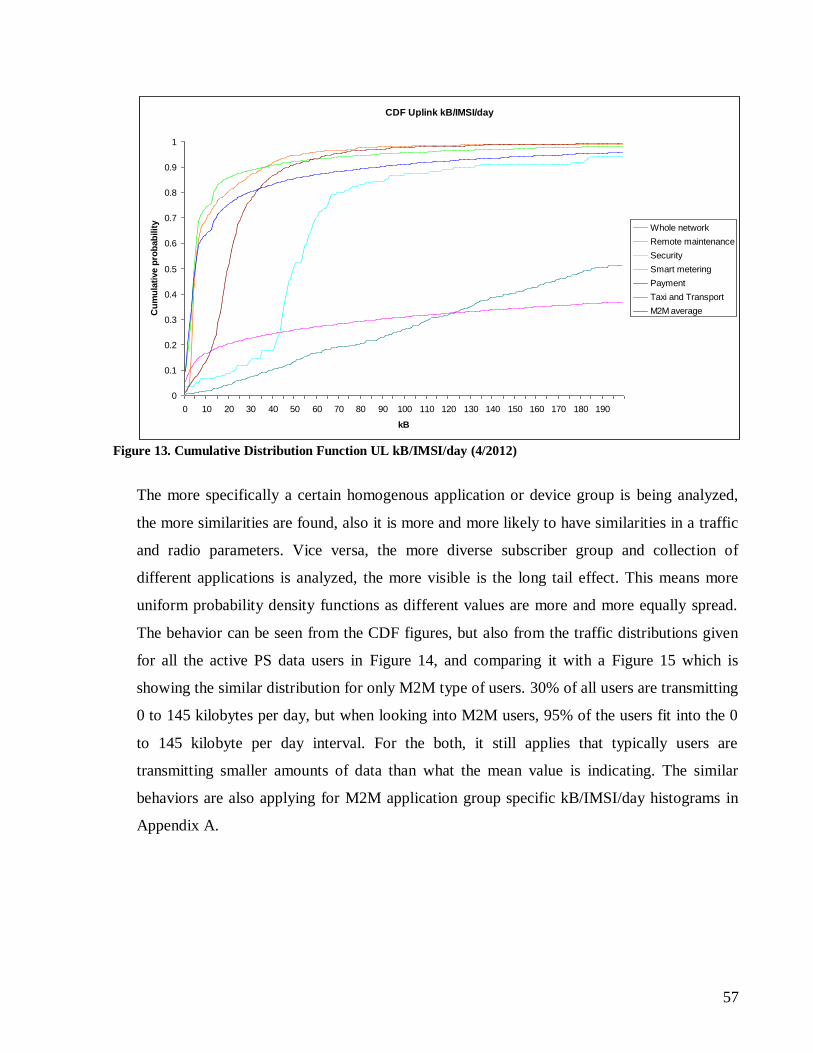
57
CDF Uplink kB/IMSI/day
0
0.1
0.2
0.3
0.4
0.5
0.6
0.7
0.8
0.9
1
0 10 20 30 40 50 60 70 80 90 100 110 120 130 140 150 160 170 180 190
kB
Cu
mu
lati
ve p
rob
ab
ilit
y
Whole network
Remote maintenance
Security
Smart metering
Payment
Taxi and Transport
M2M average
Figure 13. Cumulative Distribution Function UL kB/IMSI/day (4/2012)
The more specifically a certain homogenous application or device group is being analyzed,
the more similarities are found, also it is more and more likely to have similarities in a traffic
and radio parameters. Vice versa, the more diverse subscriber group and collection of
different applications is analyzed, the more visible is the long tail effect. This means more
uniform probability density functions as different values are more and more equally spread.
The behavior can be seen from the CDF figures, but also from the traffic distributions given
for all the active PS data users in Figure 14, and comparing it with a Figure 15 which is
showing the similar distribution for only M2M type of users. 30% of all users are transmitting
0 to 145 kilobytes per day, but when looking into M2M users, 95% of the users fit into the 0
to 145 kilobyte per day interval. For the both, it still applies that typically users are
transmitting smaller amounts of data than what the mean value is indicating. The similar
behaviors are also applying for M2M application group specific kB/IMSI/day histograms in
Appendix A.
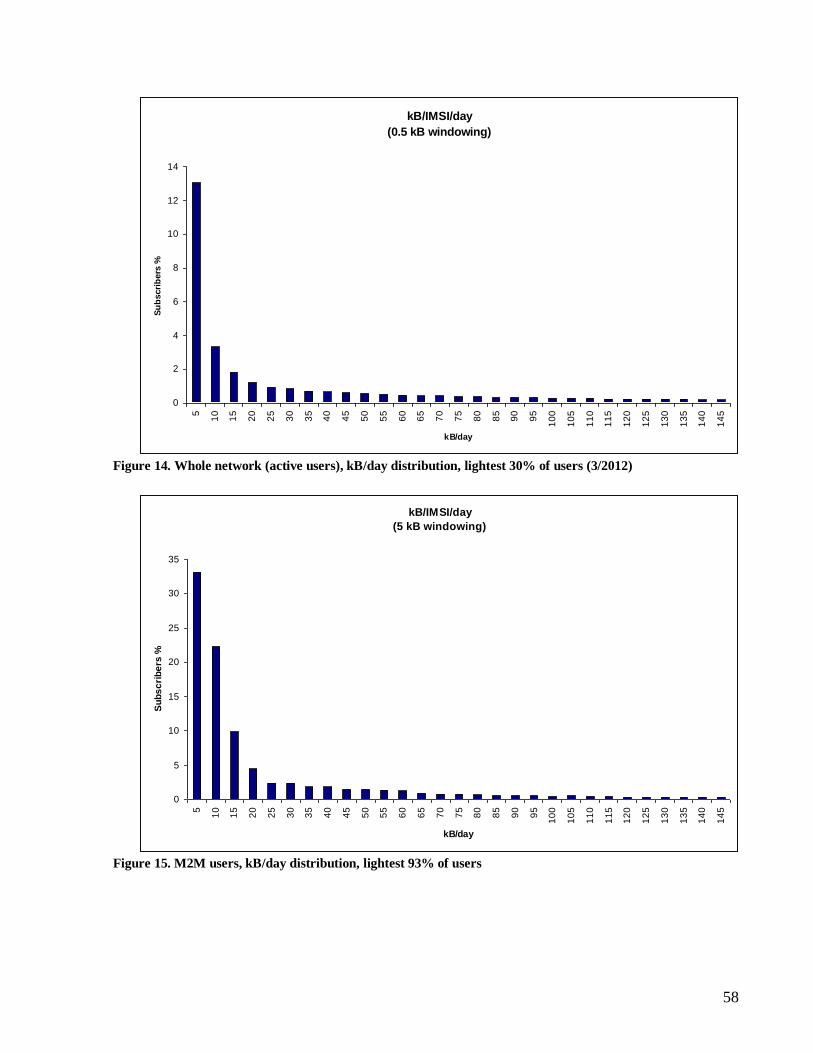
58
kB/IMSI/day
(0.5 kB windowing)
0
2
4
6
8
10
12
14
5
10
15
20
25
30
35
40
45
50
55
60
65
70
75
80
85
90
95
10
0
10
5
11
0
11
5
12
0
12
5
13
0
13
5
14
0
14
5
kB/day
Su
bscri
bers
%
Figure 14. Whole network (active users), kB/day distribution, lightest 30% of users (3/2012)
kB/IMSI/day
(5 kB windowing)
0
5
10
15
20
25
30
35
5
10
15
20
25
30
35
40
45
50
55
60
65
70
75
80
85
90
95
10
0
10
5
11
0
11
5
12
0
12
5
13
0
13
5
14
0
14
5
kB/day
Su
bs
cri
be
rs %
Figure 15. M2M users, kB/day distribution, lightest 93% of users
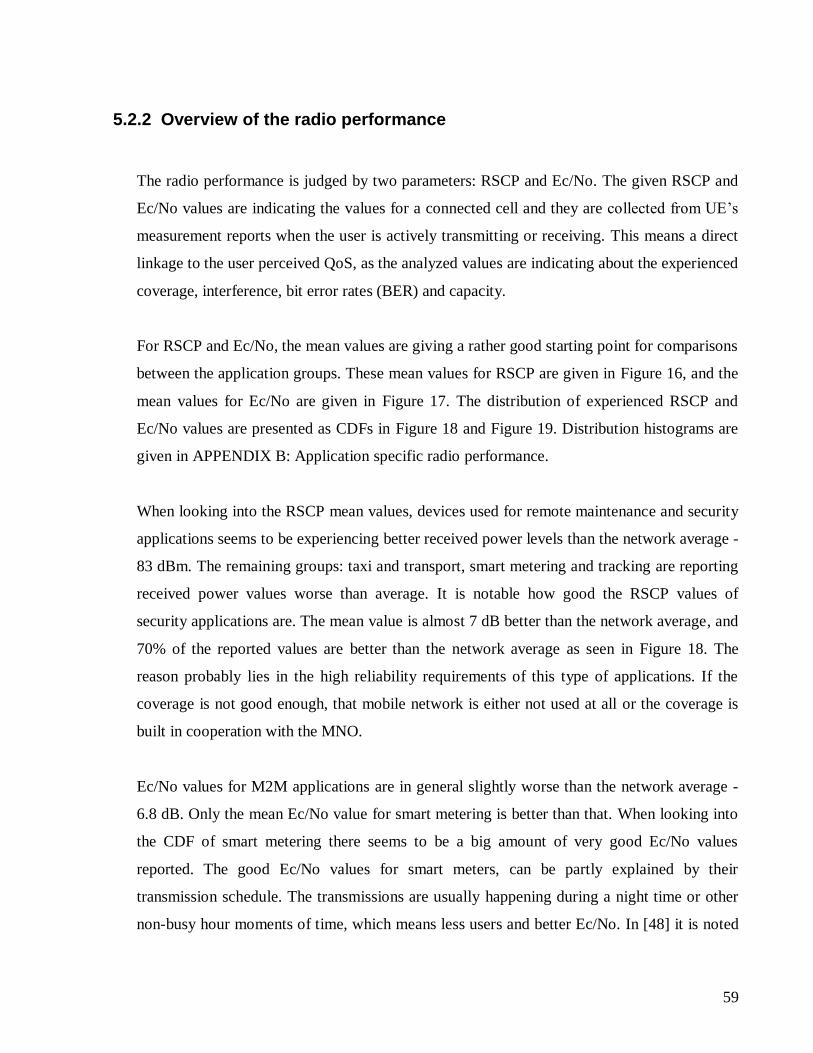
59
5.2.2 Overview of the radio performance
The radio performance is judged by two parameters: RSCP and Ec/No. The given RSCP and
Ec/No values are indicating the values for a connected cell and they are collected from UE‟s
measurement reports when the user is actively transmitting or receiving. This means a direct
linkage to the user perceived QoS, as the analyzed values are indicating about the experienced
coverage, interference, bit error rates (BER) and capacity.
For RSCP and Ec/No, the mean values are giving a rather good starting point for comparisons
between the application groups. These mean values for RSCP are given in Figure 16, and the
mean values for Ec/No are given in Figure 17. The distribution of experienced RSCP and
Ec/No values are presented as CDFs in Figure 18 and Figure 19. Distribution histograms are
given in APPENDIX B: Application specific radio performance.
When looking into the RSCP mean values, devices used for remote maintenance and security
applications seems to be experiencing better received power levels than the network average -
83 dBm. The remaining groups: taxi and transport, smart metering and tracking are reporting
received power values worse than average. It is notable how good the RSCP values of
security applications are. The mean value is almost 7 dB better than the network average, and
70% of the reported values are better than the network average as seen in Figure 18. The
reason probably lies in the high reliability requirements of this type of applications. If the
coverage is not good enough, that mobile network is either not used at all or the coverage is
built in cooperation with the MNO.
Ec/No values for M2M applications are in general slightly worse than the network average -
6.8 dB. Only the mean Ec/No value for smart metering is better than that. When looking into
the CDF of smart metering there seems to be a big amount of very good Ec/No values
reported. The good Ec/No values for smart meters, can be partly explained by their
transmission schedule. The transmissions are usually happening during a night time or other
non-busy hour moments of time, which means less users and better Ec/No. In [48] it is noted

60
that because of the limited power on CPICH (Common Pilot Channel), the maximum
achievable Ec/No would be close to -3 dB. The errors in Ec/No reports are having an impact
on cell selection and handover procedures. Interesting observation about taxi and transport
devices is that they seem to have clearly the worst Ec/No performance. This is probably
mainly caused by their mobility but it might be also indication of a situation described in
section 3.3.2, where lots of users are packed under a same cell, for example if the taxis are at
a taxi stop. In general, the movement of devices is decreasing the performance as it means
challenging mobility management and more handovers to occur, which is then affecting as a
worsen Ec/No because of the inter-cell interference. The worsen radio performance of the
devices used for taxi and transport can be also partly explained by the fact that the car body is
simply attenuating the signal. This kind of loss is typically between 3 dB and 10 dB,
depending on the car and location of the device [34]. However, the devices can be also
connected to an external antenna, which can have a better sensitivity than the one attached on
the device. It is likely that at least some of the smart metering devices are having external
antennas. This can be seen from Figure 18, so that 30 % of the smart metering devices are
having a better RSCP than in general. As the smart metering installation is static, it is also
very much likely that the good enough coverage is ensured on the installation phase, or
otherwise the device is not installed at all or the operator is changed.
All in all, it can be concluded that the moving devices and the ones that are likely to be used
in crowded areas or in the edges of coverage areas are experiencing the worst radio
performance.
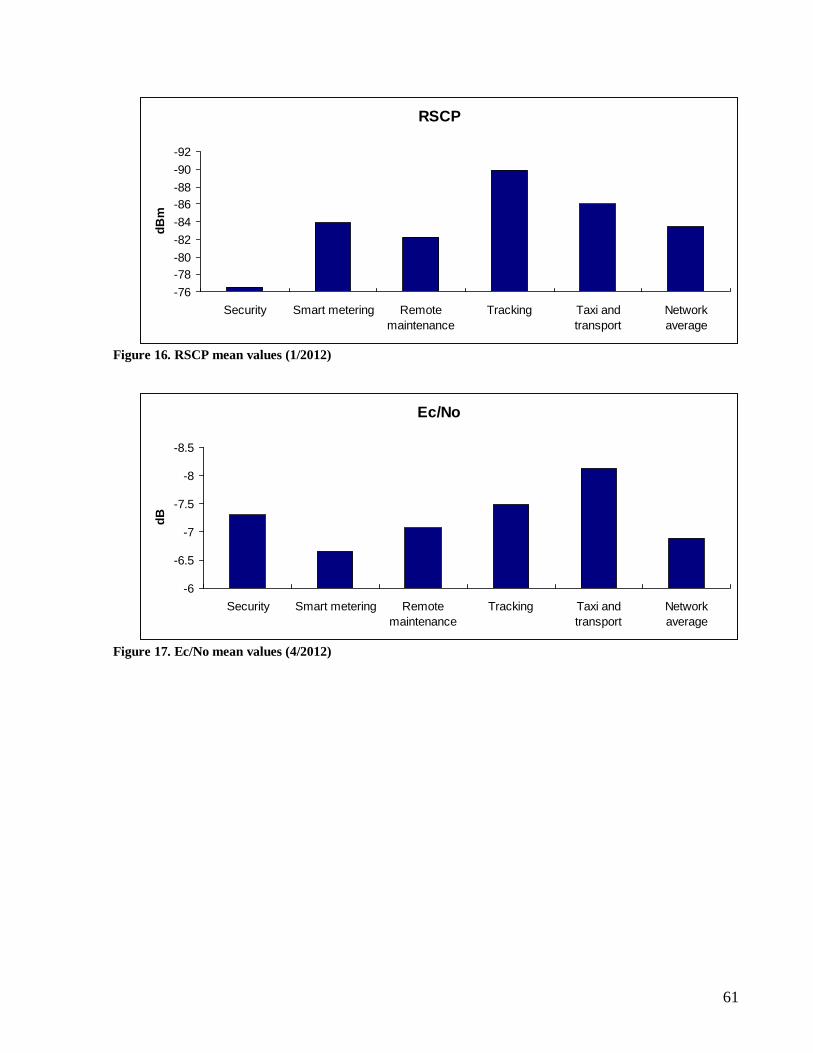
61
RSCP
-92
-90
-88
-86
-84
-82
-80
-78
-76
Security Smart metering Remote
maintenance
Tracking Taxi and
transport
Network
average
dB
m
Figure 16. RSCP mean values (1/2012)
Ec/No
-8.5
-8
-7.5
-7
-6.5
-6
Security Smart metering Remote
maintenance
Tracking Taxi and
transport
Network
average
dB
Figure 17. Ec/No mean values (4/2012)
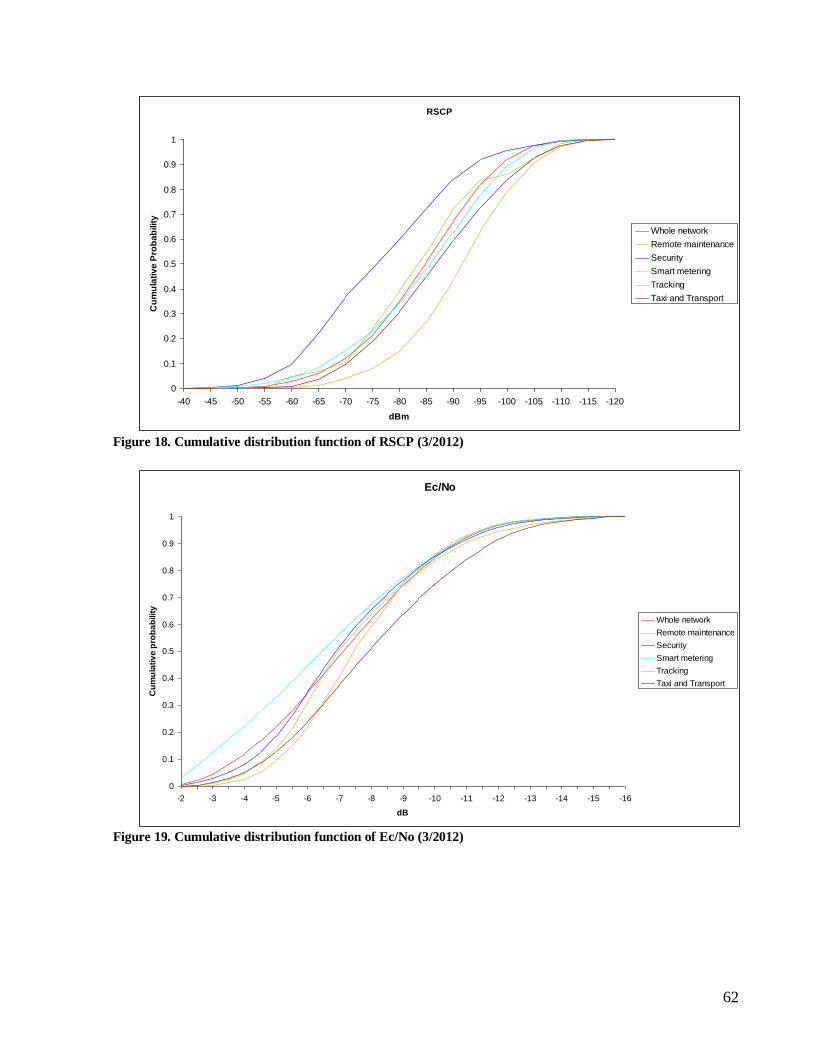
62
RSCP
0
0.1
0.2
0.3
0.4
0.5
0.6
0.7
0.8
0.9
1
-40 -45 -50 -55 -60 -65 -70 -75 -80 -85 -90 -95 -100 -105 -110 -115 -120
dBm
Cu
mu
lati
ve
Pro
ba
bilit
y
Whole network
Remote maintenance
Security
Smart metering
Tracking
Taxi and Transport
Figure 18. Cumulative distribution function of RSCP (3/2012)
Ec/No
0
0.1
0.2
0.3
0.4
0.5
0.6
0.7
0.8
0.9
1
-2 -3 -4 -5 -6 -7 -8 -9 -10 -11 -12 -13 -14 -15 -16
dB
Cu
mu
lati
ve
pro
ba
bilit
y
Whole network
Remote maintenance
Security
Smart metering
Tracking
Taxi and Transport
Figure 19. Cumulative distribution function of Ec/No (3/2012)
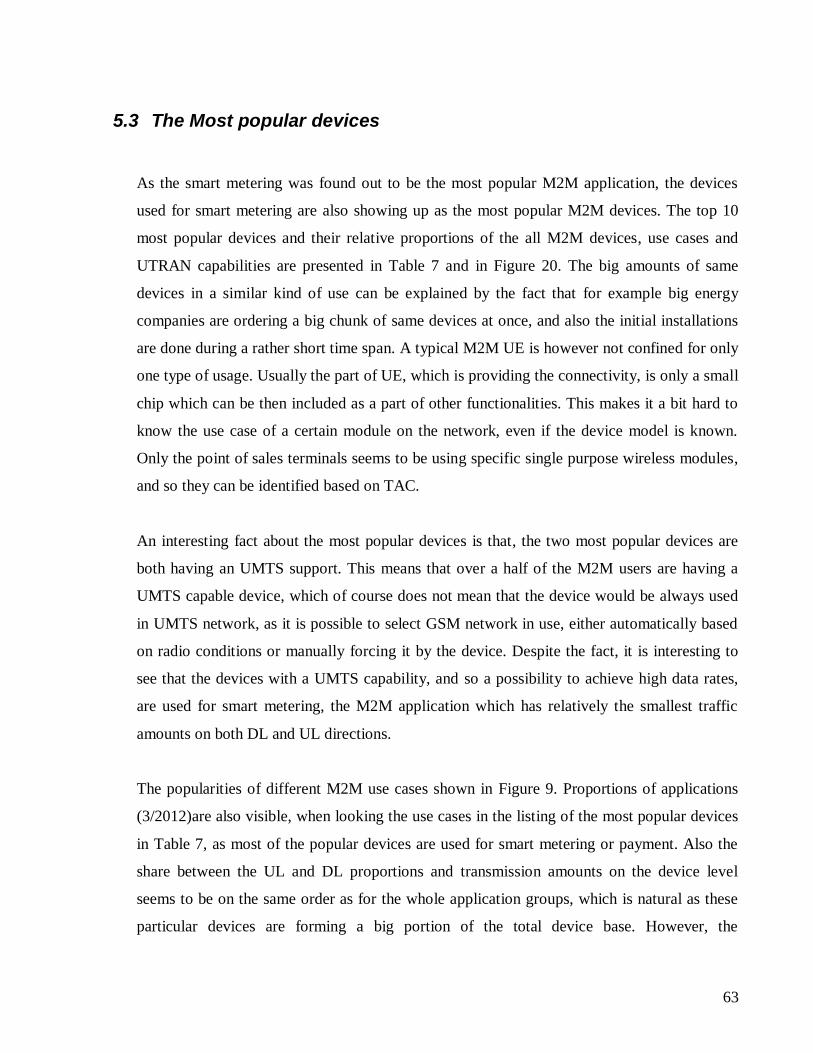
63
5.3 The Most popular devices
As the smart metering was found out to be the most popular M2M application, the devices
used for smart metering are also showing up as the most popular M2M devices. The top 10
most popular devices and their relative proportions of the all M2M devices, use cases and
UTRAN capabilities are presented in Table 7 and in Figure 20. The big amounts of same
devices in a similar kind of use can be explained by the fact that for example big energy
companies are ordering a big chunk of same devices at once, and also the initial installations
are done during a rather short time span. A typical M2M UE is however not confined for only
one type of usage. Usually the part of UE, which is providing the connectivity, is only a small
chip which can be then included as a part of other functionalities. This makes it a bit hard to
know the use case of a certain module on the network, even if the device model is known.
Only the point of sales terminals seems to be using specific single purpose wireless modules,
and so they can be identified based on TAC.
An interesting fact about the most popular devices is that, the two most popular devices are
both having an UMTS support. This means that over a half of the M2M users are having a
UMTS capable device, which of course does not mean that the device would be always used
in UMTS network, as it is possible to select GSM network in use, either automatically based
on radio conditions or manually forcing it by the device. Despite the fact, it is interesting to
see that the devices with a UMTS capability, and so a possibility to achieve high data rates,
are used for smart metering, the M2M application which has relatively the smallest traffic
amounts on both DL and UL directions.
The popularities of different M2M use cases shown in Figure 9. Proportions of applications
(3/2012)are also visible, when looking the use cases in the listing of the most popular devices
in Table 7, as most of the popular devices are used for smart metering or payment. Also the
share between the UL and DL proportions and transmission amounts on the device level
seems to be on the same order as for the whole application groups, which is natural as these
particular devices are forming a big portion of the total device base. However, the
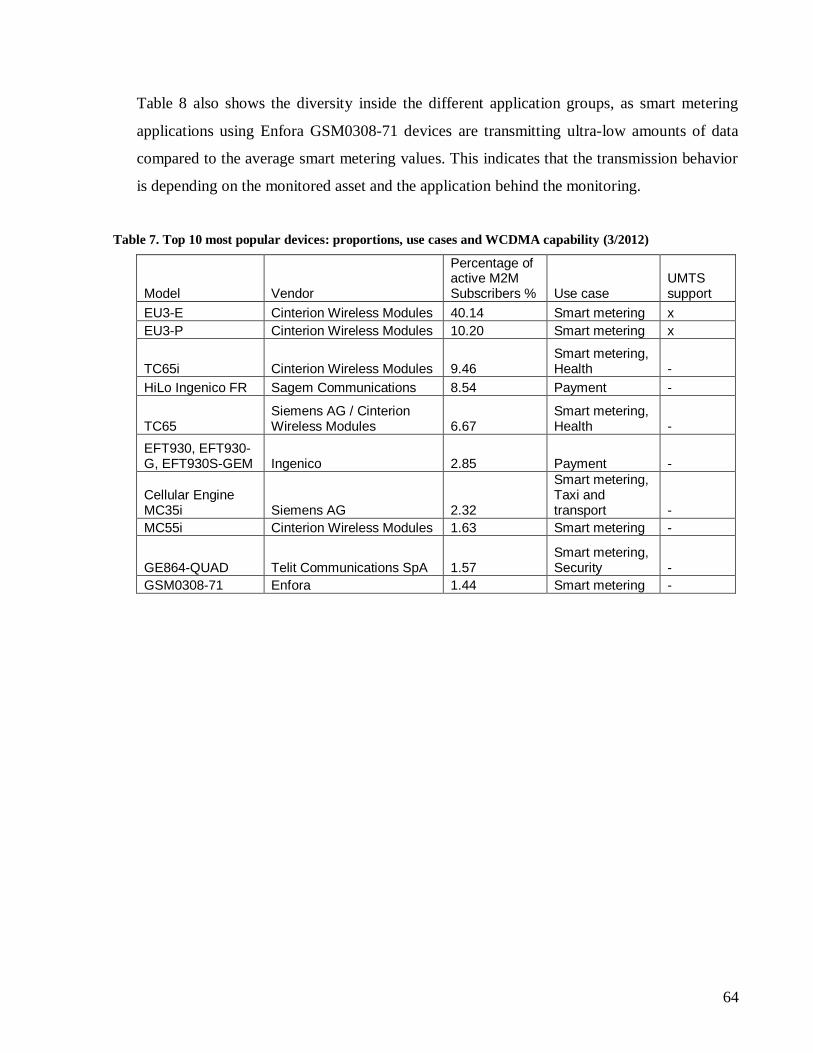
64
Table 8 also shows the diversity inside the different application groups, as smart metering
applications using Enfora GSM0308-71 devices are transmitting ultra-low amounts of data
compared to the average smart metering values. This indicates that the transmission behavior
is depending on the monitored asset and the application behind the monitoring.
Table 7. Top 10 most popular devices: proportions, use cases and WCDMA capability (3/2012)
Model Vendor
Percentage of active M2M Subscribers % Use case
UMTS support
EU3-E Cinterion Wireless Modules 40.14 Smart metering x
EU3-P Cinterion Wireless Modules 10.20 Smart metering x
TC65i Cinterion Wireless Modules 9.46 Smart metering, Health -
HiLo Ingenico FR Sagem Communications 8.54 Payment -
TC65 Siemens AG / Cinterion Wireless Modules 6.67
Smart metering, Health -
EFT930, EFT930-G, EFT930S-GEM Ingenico 2.85 Payment -
Cellular Engine MC35i Siemens AG 2.32
Smart metering, Taxi and transport -
MC55i Cinterion Wireless Modules 1.63 Smart metering -
GE864-QUAD Telit Communications SpA 1.57 Smart metering, Security -
GSM0308-71 Enfora 1.44 Smart metering -
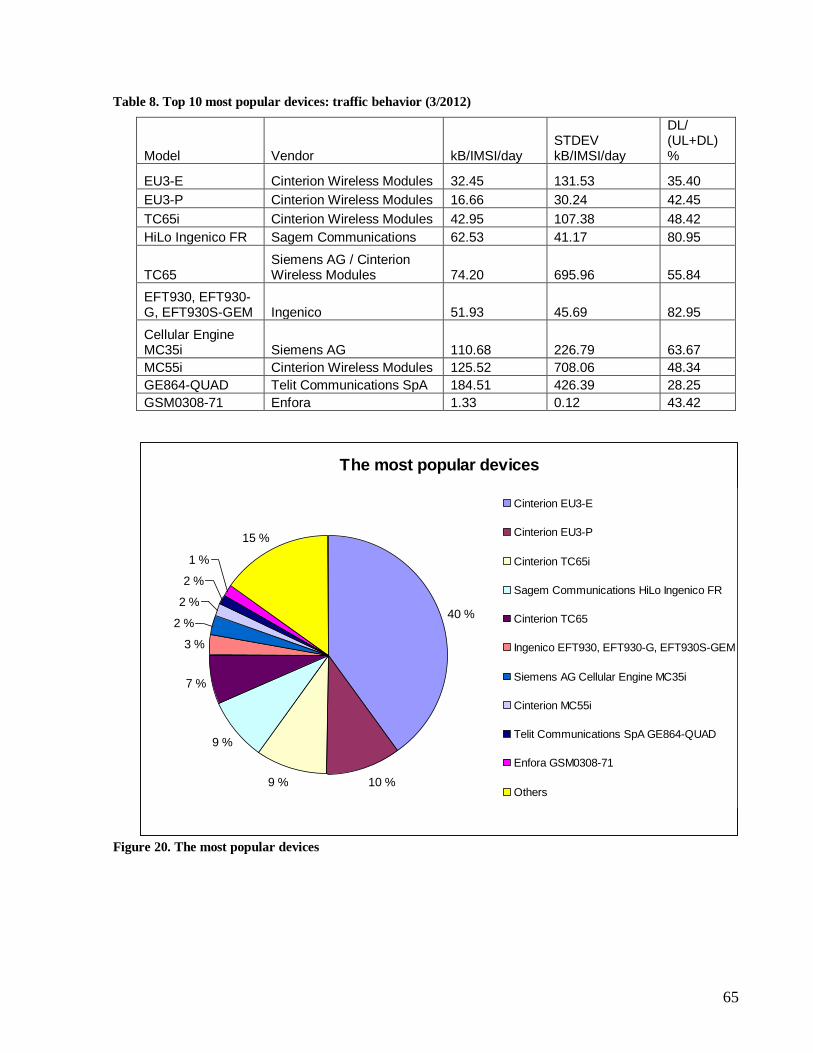
65
Table 8. Top 10 most popular devices: traffic behavior (3/2012)
Model Vendor kB/IMSI/day STDEV kB/IMSI/day
DL/ (UL+DL)%
EU3-E Cinterion Wireless Modules 32.45 131.53 35.40
EU3-P Cinterion Wireless Modules 16.66 30.24 42.45
TC65i Cinterion Wireless Modules 42.95 107.38 48.42
HiLo Ingenico FR Sagem Communications 62.53 41.17 80.95
TC65 Siemens AG / Cinterion Wireless Modules 74.20 695.96 55.84
EFT930, EFT930-G, EFT930S-GEM Ingenico 51.93 45.69 82.95
Cellular Engine MC35i Siemens AG 110.68 226.79 63.67
MC55i Cinterion Wireless Modules 125.52 708.06 48.34
GE864-QUAD Telit Communications SpA 184.51 426.39 28.25
GSM0308-71 Enfora 1.33 0.12 43.42
The most popular devices
40 %
10 %9 %
9 %
7 %
3 %
2 %
2 %
2 %
1 %
15 %
Cinterion EU3-E
Cinterion EU3-P
Cinterion TC65i
Sagem Communications HiLo Ingenico FR
Cinterion TC65
Ingenico EFT930, EFT930-G, EFT930S-GEM
Siemens AG Cellular Engine MC35i
Cinterion MC55i
Telit Communications SpA GE864-QUAD
Enfora GSM0308-71
Others
Figure 20. The most popular devices
66
6 Conclusions
The thesis started by introducing the 3GPP mobile network architecture, terminology and the
basic concepts for providing packet switched data services over them. All the currently used
3GPP mobile networking technologies from second generation systems to fourth generation
systems were considered as they are all important for providing the current and future
connectivity for M2M devices. To be able to understand what M2M is all about, Chapter 3
was giving an introduction about the background, concepts, ecosystem and challenges. Top-
down approach was used for considering the requirements of different M2M groups. M2M
application grouping given in [1] was used as a starting point. A major part of the study was
the performed measurements from an operators functioning mobile network. The data
collection system and the methodologies were described in Chapter 4. The results of the study
were finally revealed and discussed in Chapter 5.
The study revealed what is the current status of different kind of M2M deployments in the
examined cellular network, and how are they performing. After all, M2M was found out to be
currently still a small market segment consisting of many small niche applications. The
proportion of M2M in terms of total traffic and subscriber amounts was found out to be still
small compared to total amounts in the examined network. Despite the fact, especially the
number of M2M users is expected to be growing radically. The small traffic amounts are
explained by the nature of end-user applications and are in harmony with 3GPP‟s
presumptions [1]. The most popular application is currently smart metering and the second
most popular is payment. The popularity of smart metering is highly driven by regulations.
Even though the amount of smart metering users is large, a single device is transmitting low
amounts of data. Among all the studied M2M application groups, smart metering users are on
average transmitting the smallest amounts of data, whereas the heaviest application was found
out to be tracking.
The most of the M2M traffic is still carried in the GSM network, even though the majority of
M2M subscribers are equipped with UMTS capable devices. The two most popular devices
67
are both UMTS capable and only they alone are already covering roughly half of the active
M2M subscribers. Majority of M2M device models are however only having the GSM
capability. Surprisingly, the most of UMTS capable devices are used for smart metering
which is the lightest application among the ones studied. However, the advanced device
capabilities and improvements in the networks are enablers for introducing heavier
applications later on. M2M is currently greatly concerned in the standardizing phase of 3GPP
networks. However, as the ARPU for M2M is relatively small and operators need to invest a
lot for enabling the adequate connectivity and capacity, new business and pricing models
might be needed.
The radio performance was found to be highly differing between the studied M2M
applications. In general, the worst performance is experienced by the applications with a high
mobility, whereas the stabile devices are performing better. Also it was found that there exists
a rather big difference in the radio performance of different UE models, even if the M2M
application and device vendor are the same.
6.1 Future development and research
In the study, the daily transmission amounts were calculated as an average from a time period
of one week. It would be interesting to dig in a bit deeper and study the arrival processes,
transmitted data amounts and packet sizes in a flow or packet level. This kind of a study was
intended to be done as a part of this thesis but because of the current data collection system
and sampling resolution of the measurements it was not possible.
Another interesting thing to study would be to look what are the amounts of signaling versus
user plane data for different M2M applications. This way the possible optimization concerns
could be already targeted for a certain type of use cases, if such aspects are revealed.
Nice thing about the used always on kind of a data collection system is that, as the data is
collected and stored in real time, it gives an opportunity to build reporting services for real

68
time QoS, data amounts etc. monitoring. Meaning that in theory, it would be possible to
implement a solution for automatically monitoring and reporting the progression of different
aspects, like for example the ones analyzed in this study. Especially this gives a great
opportunity to follow the changes in market and different KPIs.
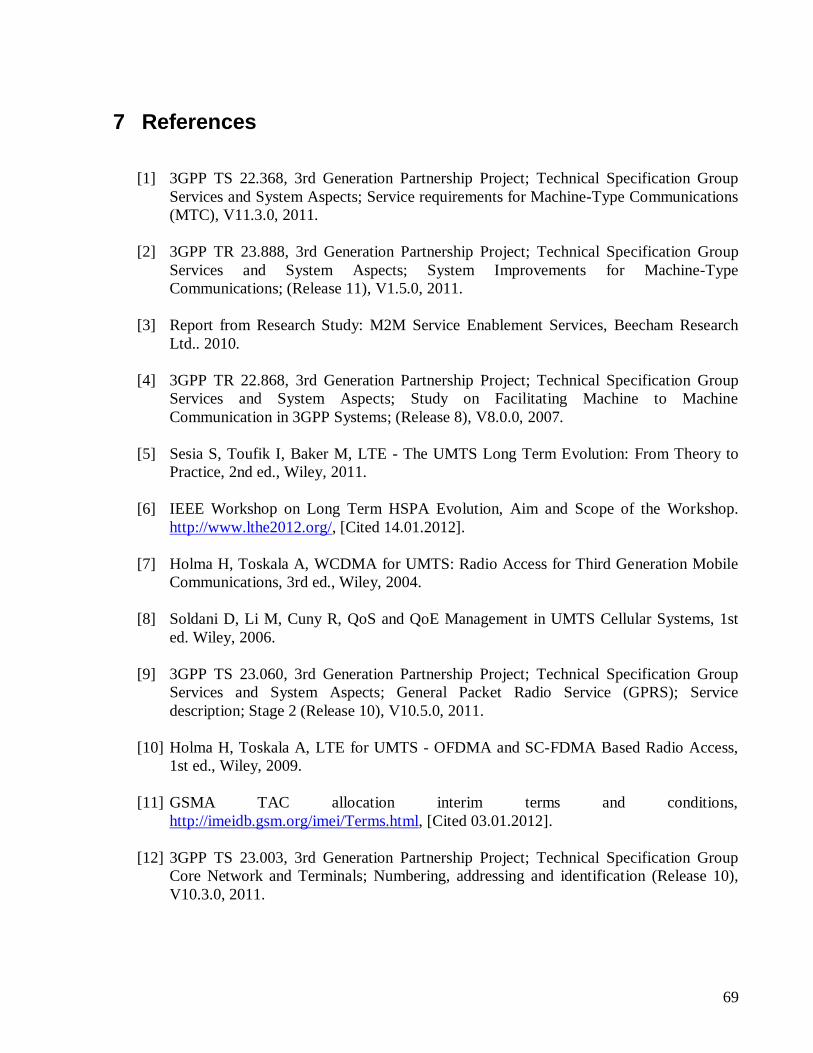
69
7 References
[1] 3GPP TS 22.368, 3rd Generation Partnership Project; Technical Specification Group
Services and System Aspects; Service requirements for Machine-Type Communications
(MTC), V11.3.0, 2011.
[2] 3GPP TR 23.888, 3rd Generation Partnership Project; Technical Specification Group
Services and System Aspects; System Improvements for Machine-Type
Communications; (Release 11), V1.5.0, 2011.
[3] Report from Research Study: M2M Service Enablement Services, Beecham Research
Ltd.. 2010.
[4] 3GPP TR 22.868, 3rd Generation Partnership Project; Technical Specification Group
Services and System Aspects; Study on Facilitating Machine to Machine
Communication in 3GPP Systems; (Release 8), V8.0.0, 2007.
[5] Sesia S, Toufik I, Baker M, LTE - The UMTS Long Term Evolution: From Theory to
Practice, 2nd ed., Wiley, 2011.
[6] IEEE Workshop on Long Term HSPA Evolution, Aim and Scope of the Workshop.
http://www.lthe2012.org/, [Cited 14.01.2012].
[7] Holma H, Toskala A, WCDMA for UMTS: Radio Access for Third Generation Mobile
Communications, 3rd ed., Wiley, 2004.
[8] Soldani D, Li M, Cuny R, QoS and QoE Management in UMTS Cellular Systems, 1st
ed. Wiley, 2006.
[9] 3GPP TS 23.060, 3rd Generation Partnership Project; Technical Specification Group
Services and System Aspects; General Packet Radio Service (GPRS); Service
description; Stage 2 (Release 10), V10.5.0, 2011.
[10] Holma H, Toskala A, LTE for UMTS - OFDMA and SC-FDMA Based Radio Access,
1st ed., Wiley, 2009.
[11] GSMA TAC allocation interim terms and conditions,
http://imeidb.gsm.org/imei/Terms.html, [Cited 03.01.2012].
[12] 3GPP TS 23.003, 3rd Generation Partnership Project; Technical Specification Group
Core Network and Terminals; Numbering, addressing and identification (Release 10),
V10.3.0, 2011.
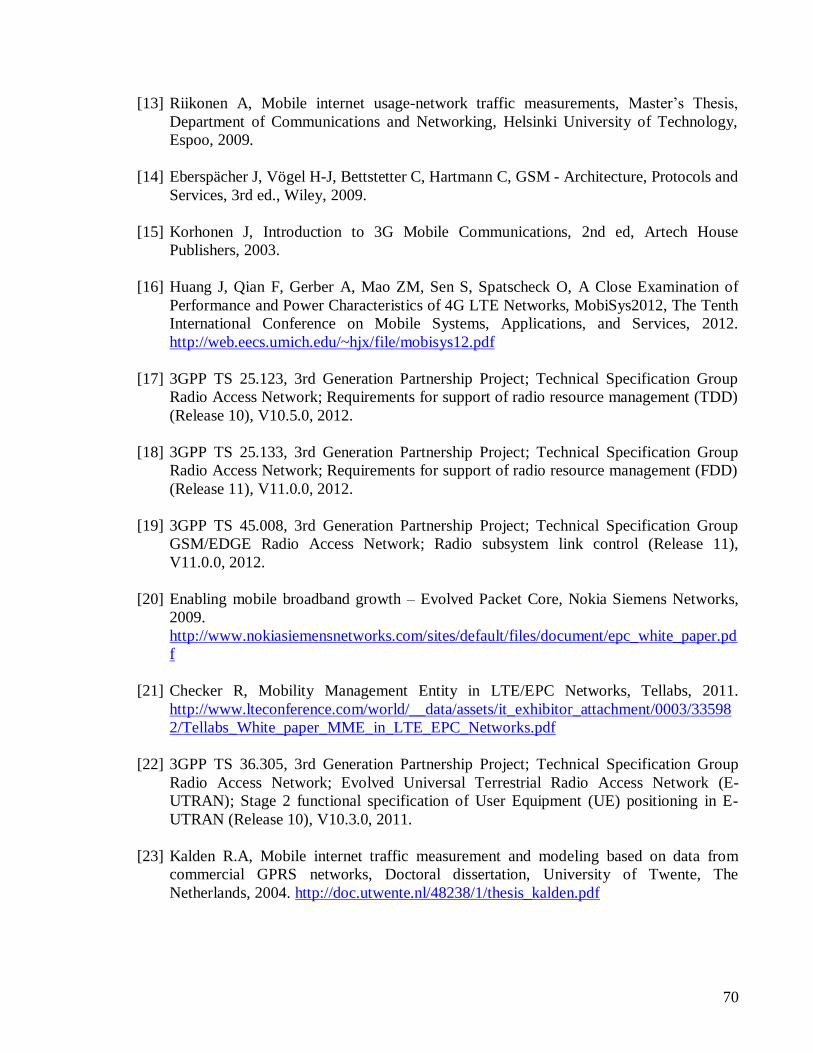
70
[13] Riikonen A, Mobile internet usage-network traffic measurements, Master‟s Thesis,
Department of Communications and Networking, Helsinki University of Technology,
Espoo, 2009.
[14] Eberspächer J, Vögel H-J, Bettstetter C, Hartmann C, GSM - Architecture, Protocols and
Services, 3rd ed., Wiley, 2009.
[15] Korhonen J, Introduction to 3G Mobile Communications, 2nd ed, Artech House
Publishers, 2003.
[16] Huang J, Qian F, Gerber A, Mao ZM, Sen S, Spatscheck O, A Close Examination of
Performance and Power Characteristics of 4G LTE Networks, MobiSys2012, The Tenth
International Conference on Mobile Systems, Applications, and Services, 2012.
http://web.eecs.umich.edu/~hjx/file/mobisys12.pdf
[17] 3GPP TS 25.123, 3rd Generation Partnership Project; Technical Specification Group
Radio Access Network; Requirements for support of radio resource management (TDD)
(Release 10), V10.5.0, 2012.
[18] 3GPP TS 25.133, 3rd Generation Partnership Project; Technical Specification Group
Radio Access Network; Requirements for support of radio resource management (FDD)
(Release 11), V11.0.0, 2012.
[19] 3GPP TS 45.008, 3rd Generation Partnership Project; Technical Specification Group
GSM/EDGE Radio Access Network; Radio subsystem link control (Release 11),
V11.0.0, 2012.
[20] Enabling mobile broadband growth – Evolved Packet Core, Nokia Siemens Networks,
2009.
http://www.nokiasiemensnetworks.com/sites/default/files/document/epc_white_paper.pd
f
[21] Checker R, Mobility Management Entity in LTE/EPC Networks, Tellabs, 2011.
http://www.lteconference.com/world/__data/assets/it_exhibitor_attachment/0003/33598
2/Tellabs_White_paper_MME_in_LTE_EPC_Networks.pdf
[22] 3GPP TS 36.305, 3rd Generation Partnership Project; Technical Specification Group
Radio Access Network; Evolved Universal Terrestrial Radio Access Network (E-
UTRAN); Stage 2 functional specification of User Equipment (UE) positioning in E-
UTRAN (Release 10), V10.3.0, 2011.
[23] Kalden R.A, Mobile internet traffic measurement and modeling based on data from
commercial GPRS networks, Doctoral dissertation, University of Twente, The
Netherlands, 2004. http://doc.utwente.nl/48238/1/thesis_kalden.pdf
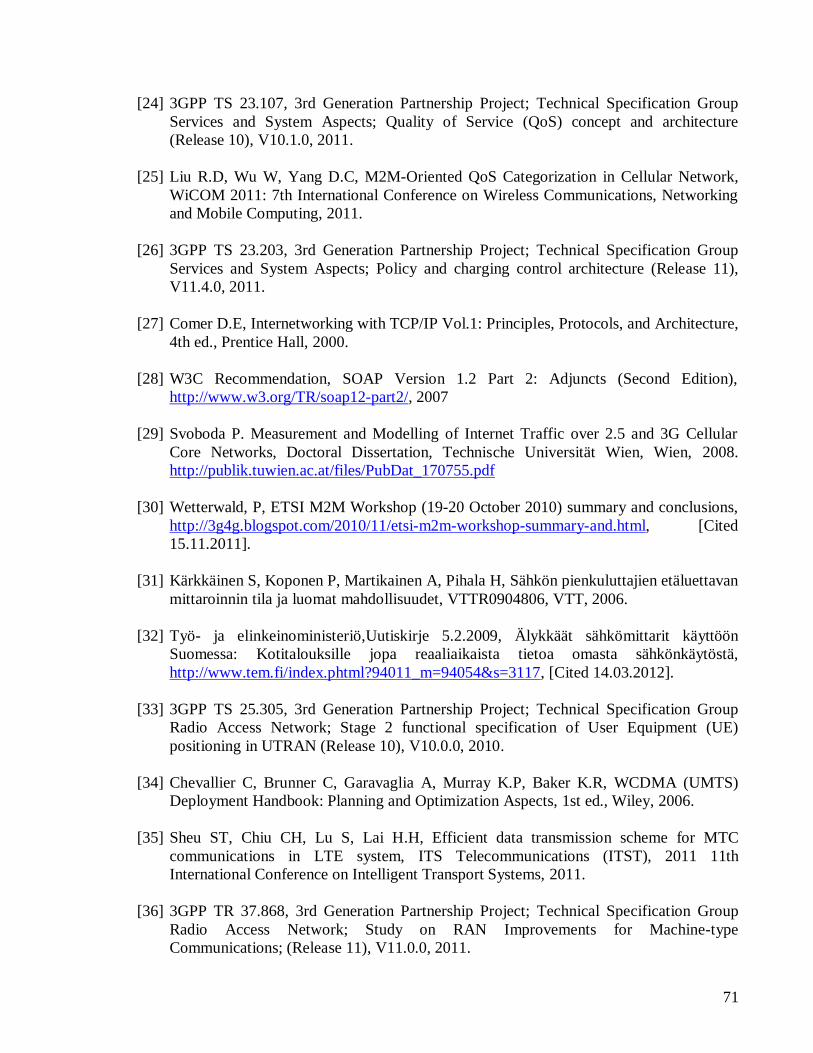
71
[24] 3GPP TS 23.107, 3rd Generation Partnership Project; Technical Specification Group
Services and System Aspects; Quality of Service (QoS) concept and architecture
(Release 10), V10.1.0, 2011.
[25] Liu R.D, Wu W, Yang D.C, M2M-Oriented QoS Categorization in Cellular Network,
WiCOM 2011: 7th International Conference on Wireless Communications, Networking
and Mobile Computing, 2011.
[26] 3GPP TS 23.203, 3rd Generation Partnership Project; Technical Specification Group
Services and System Aspects; Policy and charging control architecture (Release 11),
V11.4.0, 2011.
[27] Comer D.E, Internetworking with TCP/IP Vol.1: Principles, Protocols, and Architecture,
4th ed., Prentice Hall, 2000.
[28] W3C Recommendation, SOAP Version 1.2 Part 2: Adjuncts (Second Edition),
http://www.w3.org/TR/soap12-part2/, 2007
[29] Svoboda P. Measurement and Modelling of Internet Traffic over 2.5 and 3G Cellular
Core Networks, Doctoral Dissertation, Technische Universität Wien, Wien, 2008.
http://publik.tuwien.ac.at/files/PubDat_170755.pdf
[30] Wetterwald, P, ETSI M2M Workshop (19-20 October 2010) summary and conclusions,
http://3g4g.blogspot.com/2010/11/etsi-m2m-workshop-summary-and.html, [Cited
15.11.2011].
[31] Kärkkäinen S, Koponen P, Martikainen A, Pihala H, Sähkön pienkuluttajien etäluettavan
mittaroinnin tila ja luomat mahdollisuudet, VTTR0904806, VTT, 2006.
[32] Työ- ja elinkeinoministeriö,Uutiskirje 5.2.2009, Älykkäät sähkömittarit käyttöön
Suomessa: Kotitalouksille jopa reaaliaikaista tietoa omasta sähkönkäytöstä,
http://www.tem.fi/index.phtml?94011_m=94054&s=3117, [Cited 14.03.2012].
[33] 3GPP TS 25.305, 3rd Generation Partnership Project; Technical Specification Group
Radio Access Network; Stage 2 functional specification of User Equipment (UE)
positioning in UTRAN (Release 10), V10.0.0, 2010.
[34] Chevallier C, Brunner C, Garavaglia A, Murray K.P, Baker K.R, WCDMA (UMTS)
Deployment Handbook: Planning and Optimization Aspects, 1st ed., Wiley, 2006.
[35] Sheu ST, Chiu CH, Lu S, Lai H.H, Efficient data transmission scheme for MTC
communications in LTE system, ITS Telecommunications (ITST), 2011 11th
International Conference on Intelligent Transport Systems, 2011.
[36] 3GPP TR 37.868, 3rd Generation Partnership Project; Technical Specification Group
Radio Access Network; Study on RAN Improvements for Machine-type
Communications; (Release 11), V11.0.0, 2011.
72
[37] G4S Security Services Oy, Yritysturva™ (product description),
http://www.yritysturva.fi/index.php?option=com_yritysturva&view=sivu&id=16&Itemi
d=8, [Cited 14.12.2011].
[38] Kaleelazhicathu R, Machine-to-Machine Applications over Mobile Networks, Towards
the Next Wave of Mobile Communication, Helsinki University of Technology, Espoo
2005. http://www.tml.tkk.fi/Opinnot/T-109.551/2005/reports/M2M.pdf
[39] Walter-Krisch A, Heading towards 50 billion connections
http://www.ericsson.com/campaign/opportunitysupportsystems/newsfeed/posts/15/,
[Cited 3.1.2012].
[40] Lucero S, Maximizing Mobile Operator Opportunities in M2M, ABI Research, 2010.
http://www.cisco.com/en/US/solutions/collateral/ns341/ns523/ABI-
CISCO_M2M_Operator_Opportunity.pdf
[41] Gonçalves V, Dobbelaere P, Business Scenarios for Machine-to-Machine Mobile
Applications, 9th International Conference on Mobile Business and the 9th Global
Mobility Roundtable (ICMB/GMR 2010), 2010.
[42] Vodafone, The potential of M2M. http://m2m.vodafone.com/discover_m2m/potential/,
[Cited 9.1.2012].
[43] Pekkarinen M, Sähkönkulutuksen mittauksen uudistus, 2009
http://www.tem.fi/files/21782/sahkonkulutuksen_mittauksen_uudistus050209.pdf
[44] Fransman M, The New ICT Ecosystem: Implications for Policy and Regulation,
Cambridge University Press, 2010.
[45] Finlex, Act on the protection of Privacy in Electronic Communications (516/2004),
http://www.finlex.fi/fi/laki/ajantasa/2004/20040516, [Cited 15 March 2012].
[46] Finlex, Personal Data Act (523/1999),
http://www.finlex.fi/fi/laki/ajantasa/1999/19990523, [Cited 15 March 2012].
[47] 3GPP TS 23.002, 3rd Generation Partnership Project; Technical Specification Group
Services and System Aspects; Network architecture (Release 11), V11.0.0, 2011.
[48] Niemelä J, Borkowski J, Lempiäinen J, Using Idle Mode Ec/N0 Measurements for
Network Plan Verification, Proceedings of WPMC'05, International Symposium on
Wireless Personal Multimedia Communications, 2005.
[49] Cinterion EU3 datasheet, http://www.wmocean.com/cinterion-eu3-e-l30960-n1700-
a100/6056275/cinterion_datasheet_EU3_web.pdf, [Cited 19.4.2012].
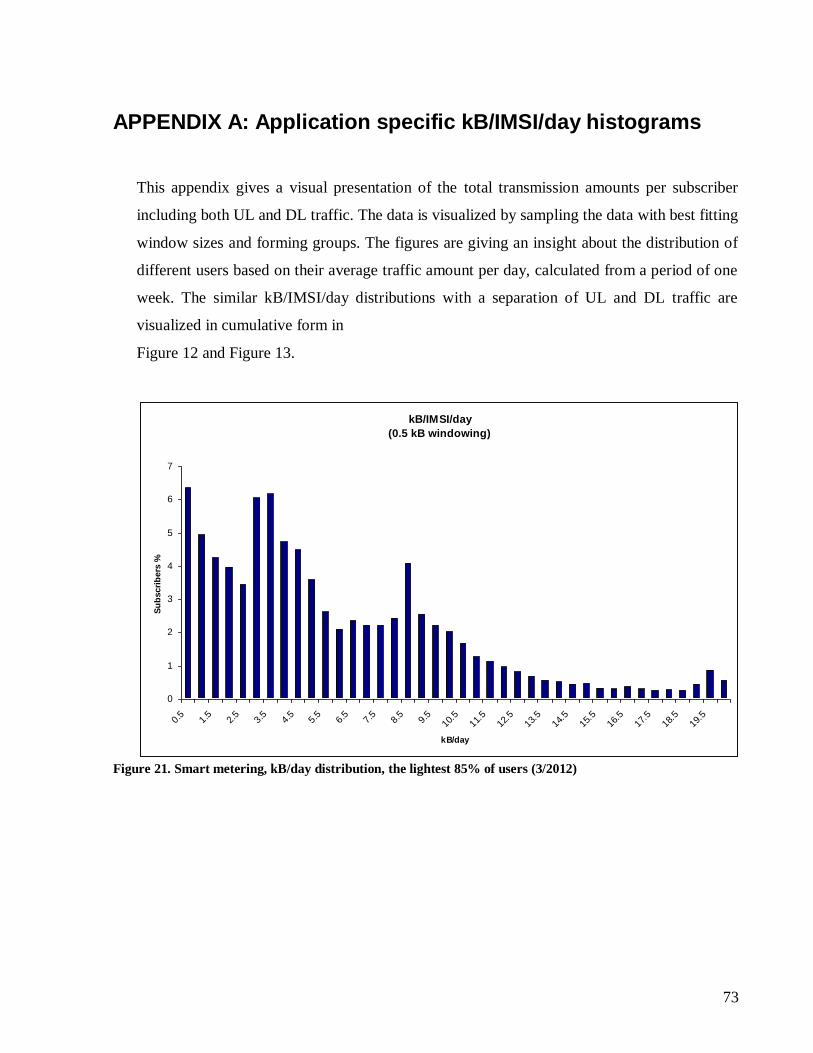
73
APPENDIX A: Application specific kB/IMSI/day histograms
This appendix gives a visual presentation of the total transmission amounts per subscriber
including both UL and DL traffic. The data is visualized by sampling the data with best fitting
window sizes and forming groups. The figures are giving an insight about the distribution of
different users based on their average traffic amount per day, calculated from a period of one
week. The similar kB/IMSI/day distributions with a separation of UL and DL traffic are
visualized in cumulative form in
Figure 12 and Figure 13.
kB/IMSI/day
(0.5 kB windowing)
0
1
2
3
4
5
6
7
0.5
1.5
2.5
3.5
4.5
5.5
6.5
7.5
8.5
9.5
10.5
11.5
12.5
13.5
14.5
15.5
16.5
17.5
18.5
19.5
kB/day
Su
bscri
bers
%
Figure 21. Smart metering, kB/day distribution, the lightest 85% of users (3/2012)
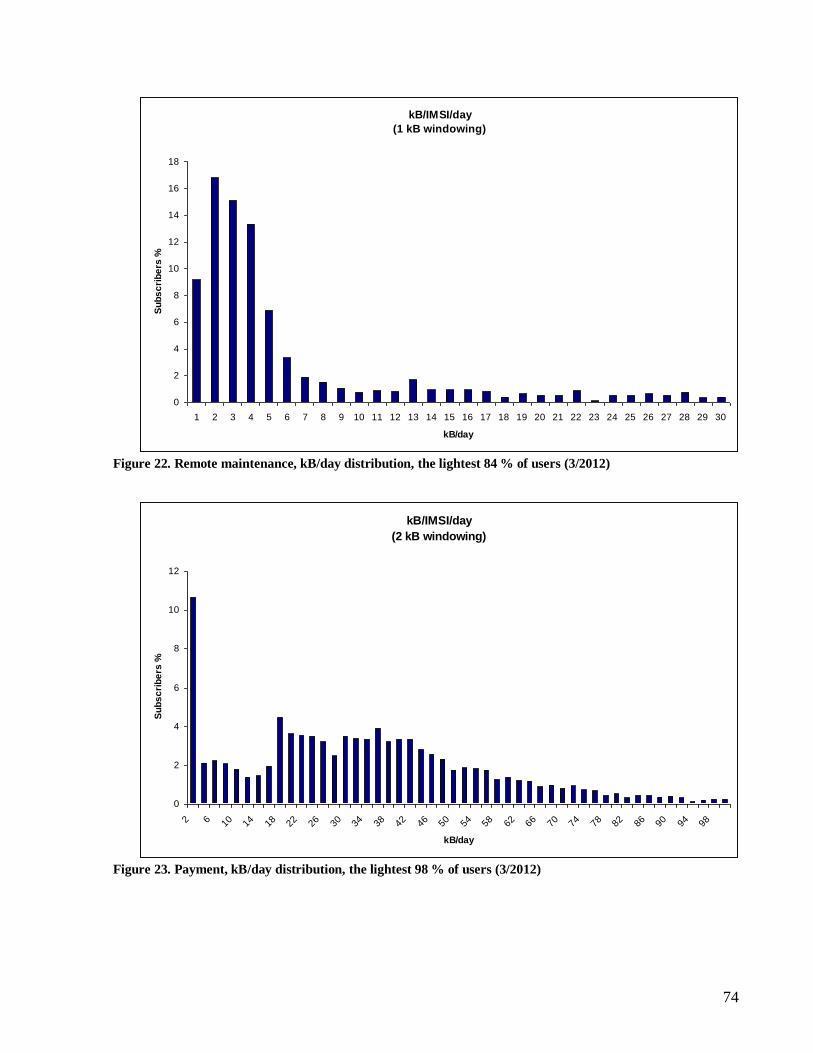
74
kB/IMSI/day
(1 kB windowing)
0
2
4
6
8
10
12
14
16
18
1 2 3 4 5 6 7 8 9 10 11 12 13 14 15 16 17 18 19 20 21 22 23 24 25 26 27 28 29 30
kB/day
Su
bs
cri
be
rs %
Figure 22. Remote maintenance, kB/day distribution, the lightest 84 % of users (3/2012)
kB/IMSI/day
(2 kB windowing)
0
2
4
6
8
10
12
2 6 10 14 18 22 26 30 34 38 42 46 50 54 58 62 66 70 74 78 82 86 90 94 98
kB/day
Su
bs
cri
be
rs %
Figure 23. Payment, kB/day distribution, the lightest 98 % of users (3/2012)
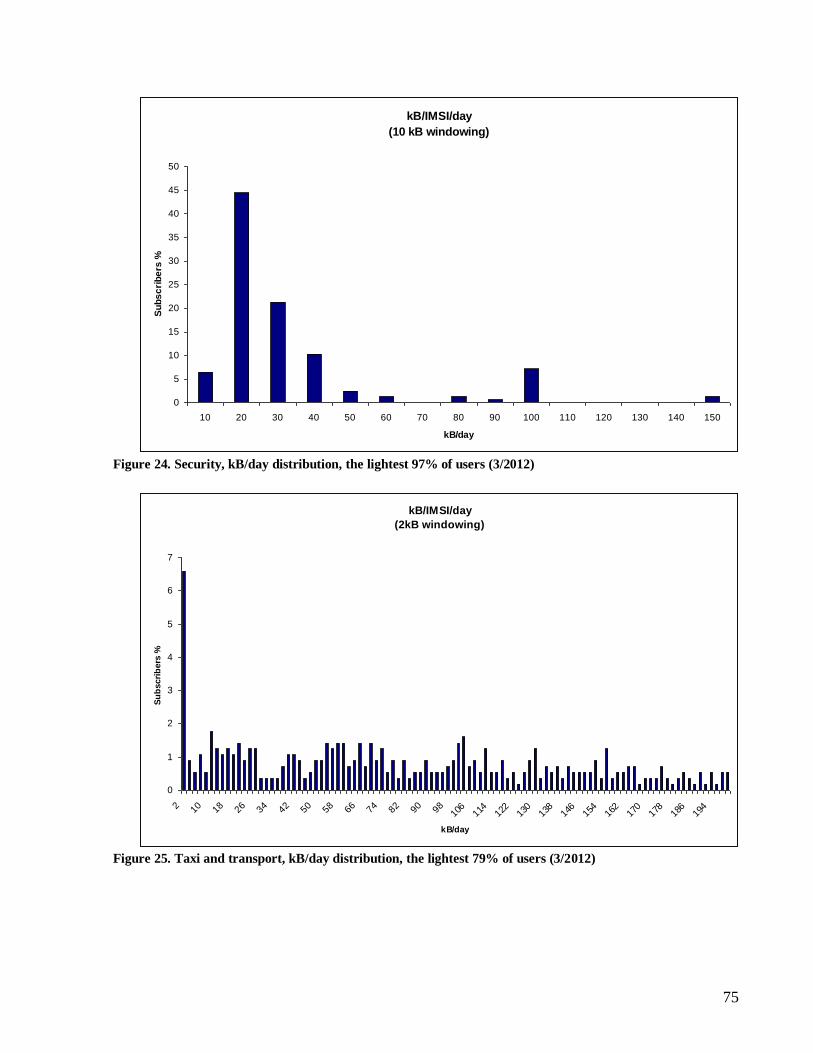
75
kB/IMSI/day
(10 kB windowing)
0
5
10
15
20
25
30
35
40
45
50
10 20 30 40 50 60 70 80 90 100 110 120 130 140 150
kB/day
Su
bs
cri
be
rs %
Figure 24. Security, kB/day distribution, the lightest 97% of users (3/2012)
kB/IMSI/day
(2kB windowing)
0
1
2
3
4
5
6
7
2 10 18 26 34 42 50 58 66 74 82 90 98 106
114
122
130
138
146
154
162
170
178
186
194
kB/day
Su
bscri
bers
%
Figure 25. Taxi and transport, kB/day distribution, the lightest 79% of users (3/2012)
76
APPENDIX B: Application specific radio performance
In this section, radio performances of the different M2M application groups are presented as
histograms of UEs experienced RSCP and Ec/No. The values used for the calculations are the
ones received from an active cell. Some of the values taken into the calculations are already
average values of multiple reported values during the five minutes sampling window. The
effect of the averaging is however assumed to be rather small. The histograms are calculated
from all the values available on the database from roughly one week period of time.
As all the observed payment devices are currently only GSM capable, radio performance
information for payment use case is not available. For making the comparisons easier, RSCP
and Ec/No histograms are first calculated over the whole network and over all the seen M2M,
in addition to the application group specific values.

77
RSCP
0
5000000
10000000
15000000
20000000
25000000
30000000
35000000
-40 -45 -50 -55 -60 -65 -70 -75 -80 -85 -90 -95 -100 -105 -110 -115 -120
dBm
Sa
mp
les
Figure 26. RSCP whole network, all devices (3/2012)
Ec/No
0
2000000
4000000
6000000
8000000
10000000
12000000
14000000
-2-2
.5 -3-3
.5 -4-4
.5 -5-5
.5 -6-6
.5 -7-7
.5 -8-8
.5 -9-9
.5-1
0
-10.5
-11
-11.5
-12
-12.5
-13
dB
Sa
mp
les
Figure 27. Ec/No whole network (all devices) (3/2012)
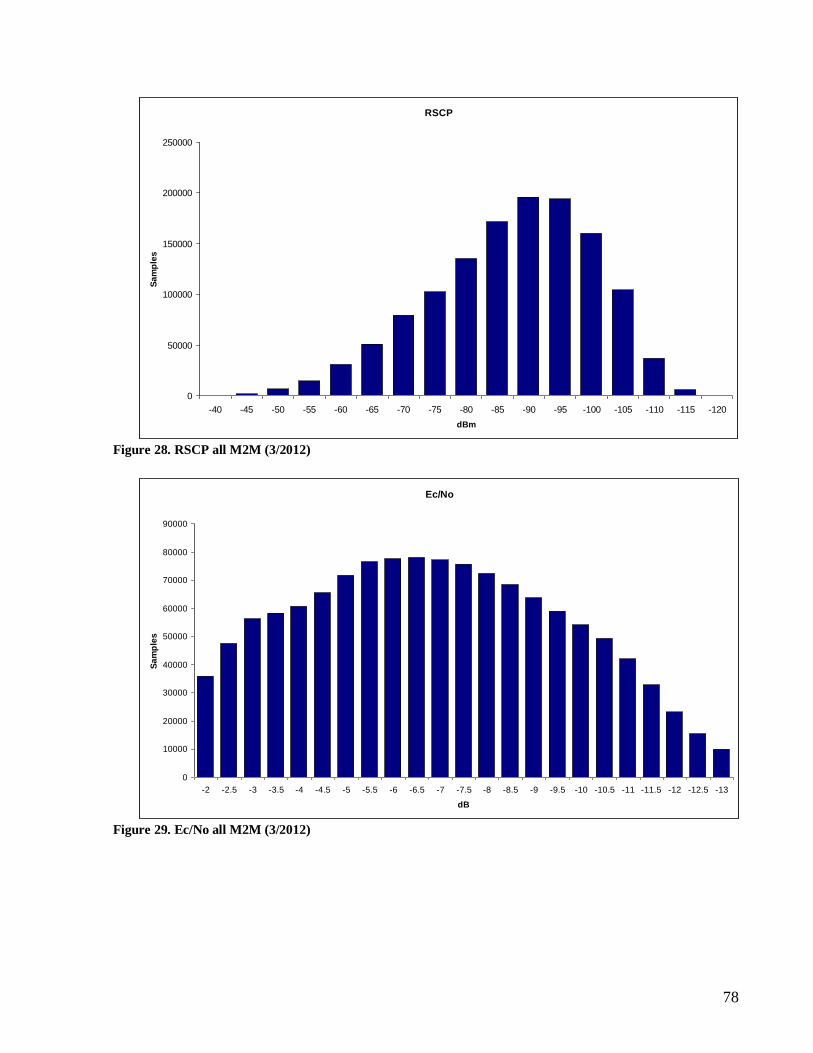
78
RSCP
0
50000
100000
150000
200000
250000
-40 -45 -50 -55 -60 -65 -70 -75 -80 -85 -90 -95 -100 -105 -110 -115 -120
dBm
Sa
mp
les
Figure 28. RSCP all M2M (3/2012)
Ec/No
0
10000
20000
30000
40000
50000
60000
70000
80000
90000
-2 -2.5 -3 -3.5 -4 -4.5 -5 -5.5 -6 -6.5 -7 -7.5 -8 -8.5 -9 -9.5 -10 -10.5 -11 -11.5 -12 -12.5 -13
dB
Sa
mp
les
Figure 29. Ec/No all M2M (3/2012)
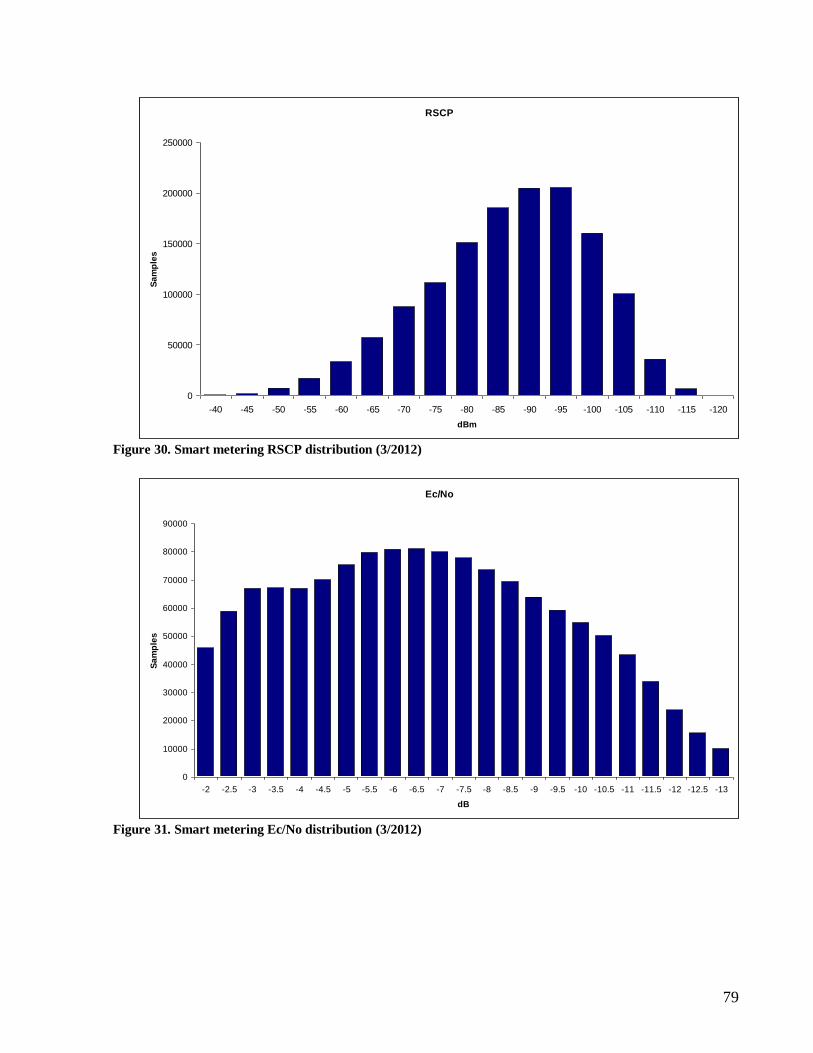
79
RSCP
0
50000
100000
150000
200000
250000
-40 -45 -50 -55 -60 -65 -70 -75 -80 -85 -90 -95 -100 -105 -110 -115 -120
dBm
Sa
mp
les
Figure 30. Smart metering RSCP distribution (3/2012)
Ec/No
0
10000
20000
30000
40000
50000
60000
70000
80000
90000
-2 -2.5 -3 -3.5 -4 -4.5 -5 -5.5 -6 -6.5 -7 -7.5 -8 -8.5 -9 -9.5 -10 -10.5 -11 -11.5 -12 -12.5 -13
dB
Sa
mp
les
Figure 31. Smart metering Ec/No distribution (3/2012)
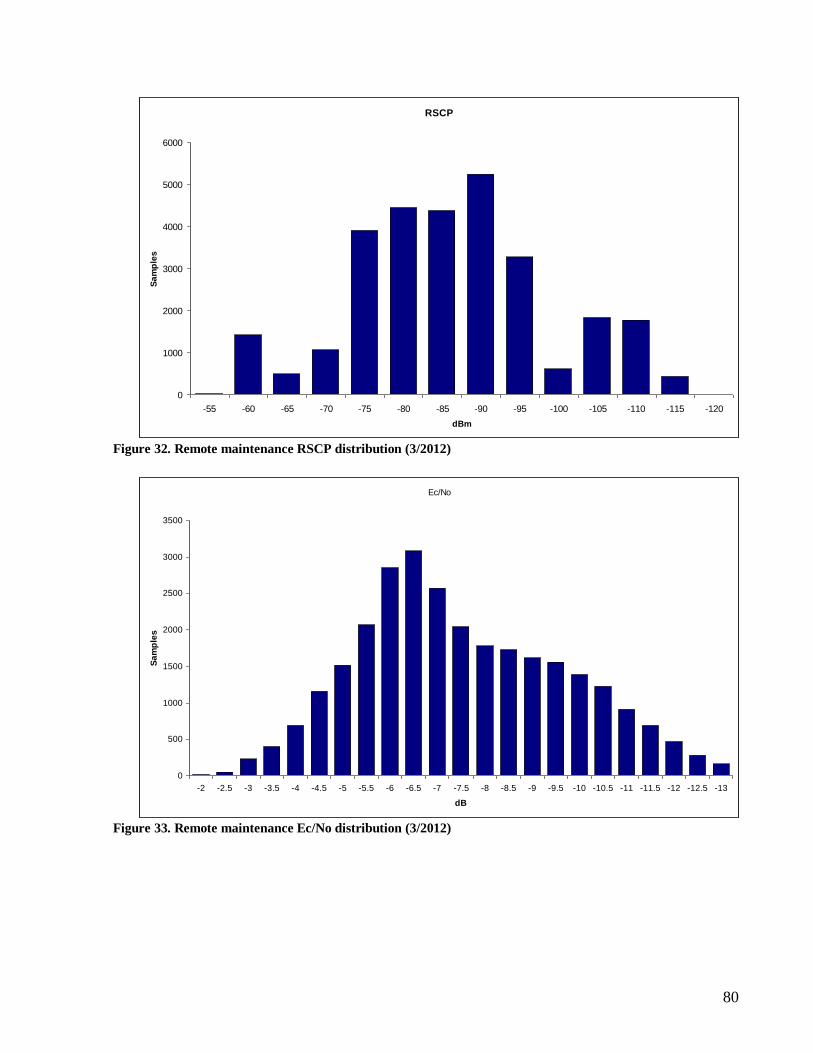
80
RSCP
0
1000
2000
3000
4000
5000
6000
-55 -60 -65 -70 -75 -80 -85 -90 -95 -100 -105 -110 -115 -120
dBm
Sa
mp
les
Figure 32. Remote maintenance RSCP distribution (3/2012)
Ec/No
0
500
1000
1500
2000
2500
3000
3500
-2 -2.5 -3 -3.5 -4 -4.5 -5 -5.5 -6 -6.5 -7 -7.5 -8 -8.5 -9 -9.5 -10 -10.5 -11 -11.5 -12 -12.5 -13
dB
Sa
mp
les
Figure 33. Remote maintenance Ec/No distribution (3/2012)
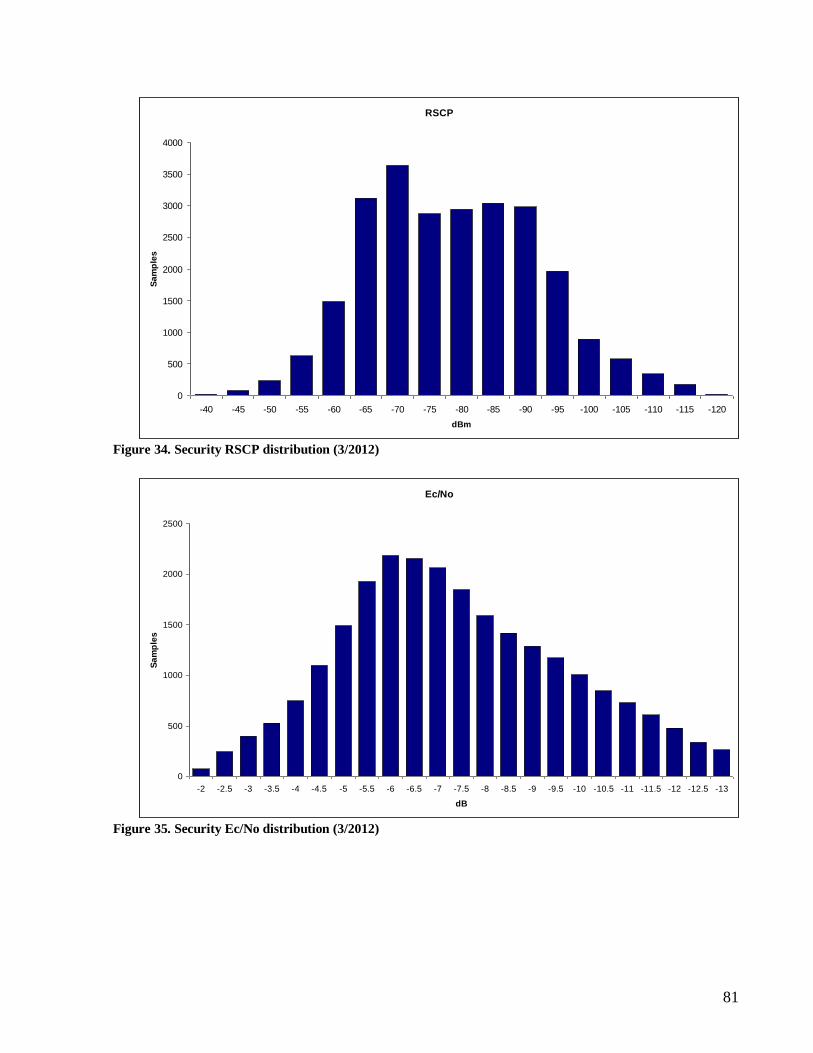
81
RSCP
0
500
1000
1500
2000
2500
3000
3500
4000
-40 -45 -50 -55 -60 -65 -70 -75 -80 -85 -90 -95 -100 -105 -110 -115 -120
dBm
Sa
mp
les
Figure 34. Security RSCP distribution (3/2012)
Ec/No
0
500
1000
1500
2000
2500
-2 -2.5 -3 -3.5 -4 -4.5 -5 -5.5 -6 -6.5 -7 -7.5 -8 -8.5 -9 -9.5 -10 -10.5 -11 -11.5 -12 -12.5 -13
dB
Sa
mp
les
Figure 35. Security Ec/No distribution (3/2012)
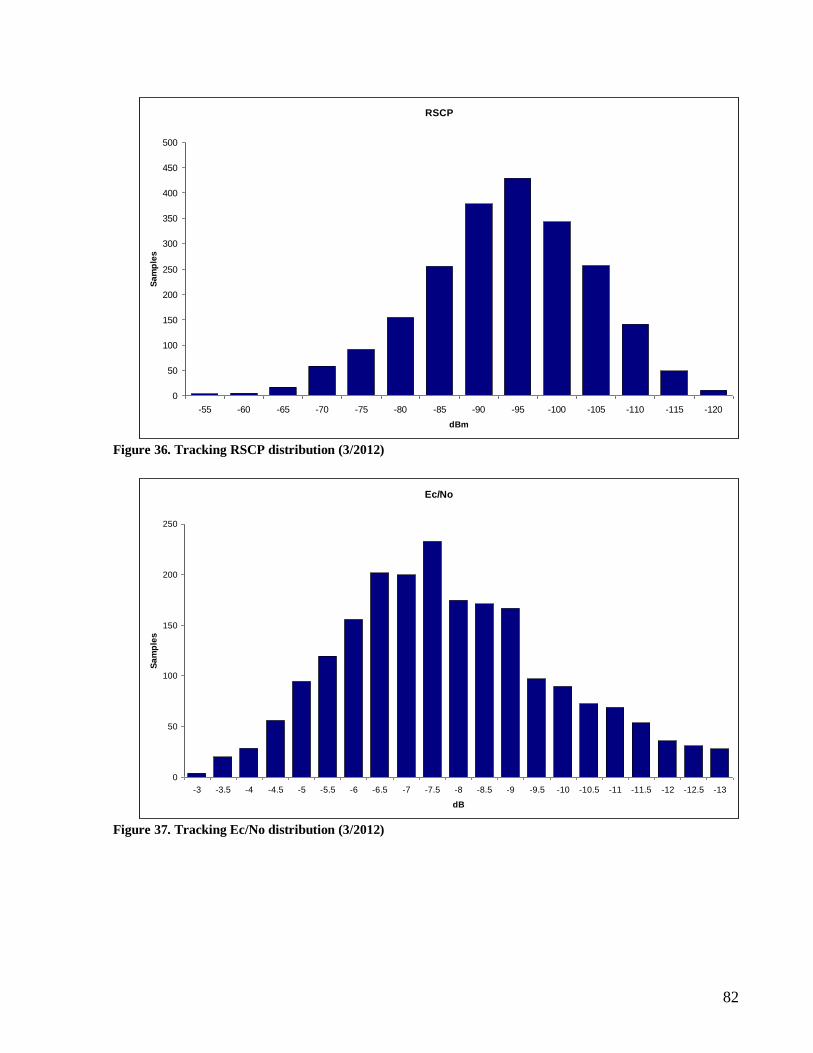
82
RSCP
0
50
100
150
200
250
300
350
400
450
500
-55 -60 -65 -70 -75 -80 -85 -90 -95 -100 -105 -110 -115 -120
dBm
Sa
mp
les
Figure 36. Tracking RSCP distribution (3/2012)
Ec/No
0
50
100
150
200
250
-3 -3.5 -4 -4.5 -5 -5.5 -6 -6.5 -7 -7.5 -8 -8.5 -9 -9.5 -10 -10.5 -11 -11.5 -12 -12.5 -13
dB
Sa
mp
les
Figure 37. Tracking Ec/No distribution (3/2012)
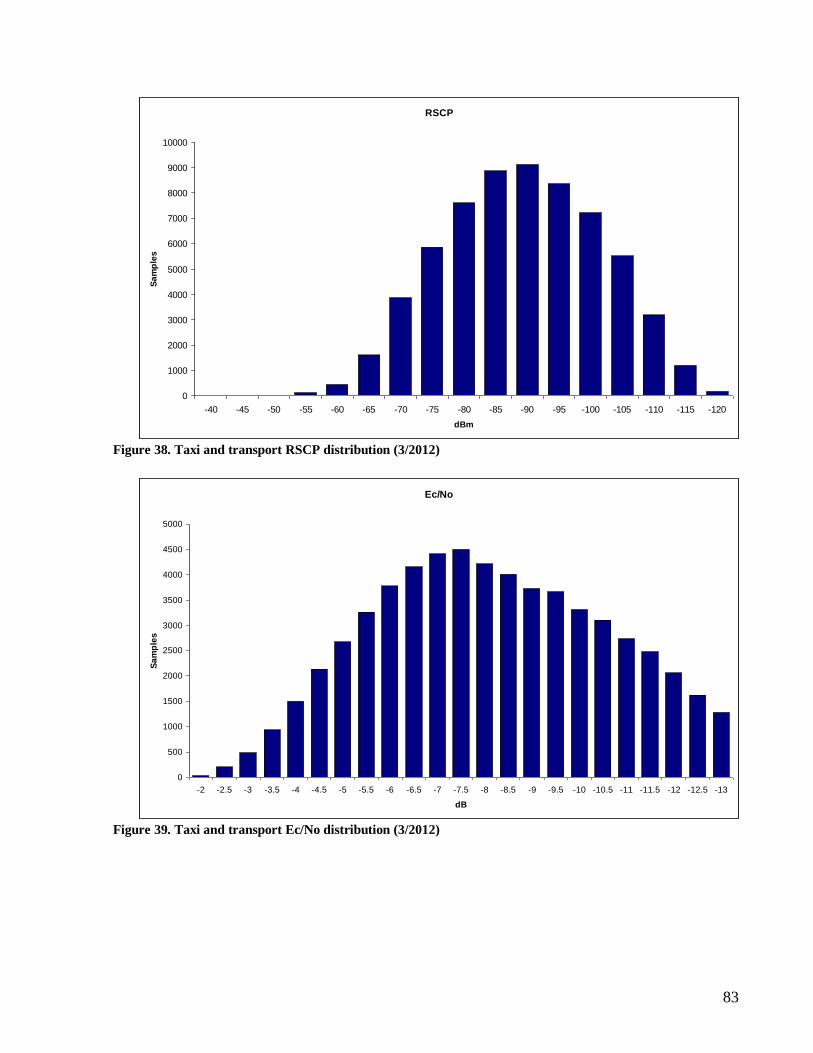
83
RSCP
0
1000
2000
3000
4000
5000
6000
7000
8000
9000
10000
-40 -45 -50 -55 -60 -65 -70 -75 -80 -85 -90 -95 -100 -105 -110 -115 -120
dBm
Sa
mp
les
Figure 38. Taxi and transport RSCP distribution (3/2012)
Ec/No
0
500
1000
1500
2000
2500
3000
3500
4000
4500
5000
-2 -2.5 -3 -3.5 -4 -4.5 -5 -5.5 -6 -6.5 -7 -7.5 -8 -8.5 -9 -9.5 -10 -10.5 -11 -11.5 -12 -12.5 -13
dB
Sa
mp
les
Figure 39. Taxi and transport Ec/No distribution (3/2012)
84
APPENDIX C: Cinterion EU3-P and EU3-E
This appendix takes a deeper look into the two most popular devices: Cinterion EU3-E and
EU3-P. On paper, the difference between Cinterion EU3-E and EU3-P is the number of
supported UMTS bands [49]. EU3-P supports 850, 900 and 2100 MHz UMTS bands while
EU3-E is capable for operating only on 900 and 2100 MHz UMTS bands [49]. The analyzed
network is however only built on 900 and 2100 MHz bands, meaning that EU3-P is not
gaining better performance in terms of supported bands. Despite the fact, EU3-P seems to be
reporting generally better RSCP than EU3-E. This can be seen from Figure 40, Figure 42 and
Figure 43. As the both devices are having an interface for external antenna, and the amount of
external antenna installations and locations are not known, it is hard to do reliable conclusions
about the observed RSCP values. As the hardware is almost the same, it can be expected that
the installation ways are playing a big role, and one way or another EU3-Ps are experiencing
better RSCP.
If RSCP values are a bit hard to judge because of the unknown installation ways, same
applies partly for Ec/No values as well, due to their relation and correlation properties. The
Ec/No values for EU3-E and EU3-P are visualized in Figure 41, Figure 44 and Figure 45. It is
interesting to see how EU3-E is performing better for the best 40% of measured values, but in
general EU3-P is performing better in terms of Ec/No. Both of these devices are in average
reporting better Ec/No values than what is the average in network, which also explains the so
good Ec/No values of smart metering as speculated in section 5.2.2.
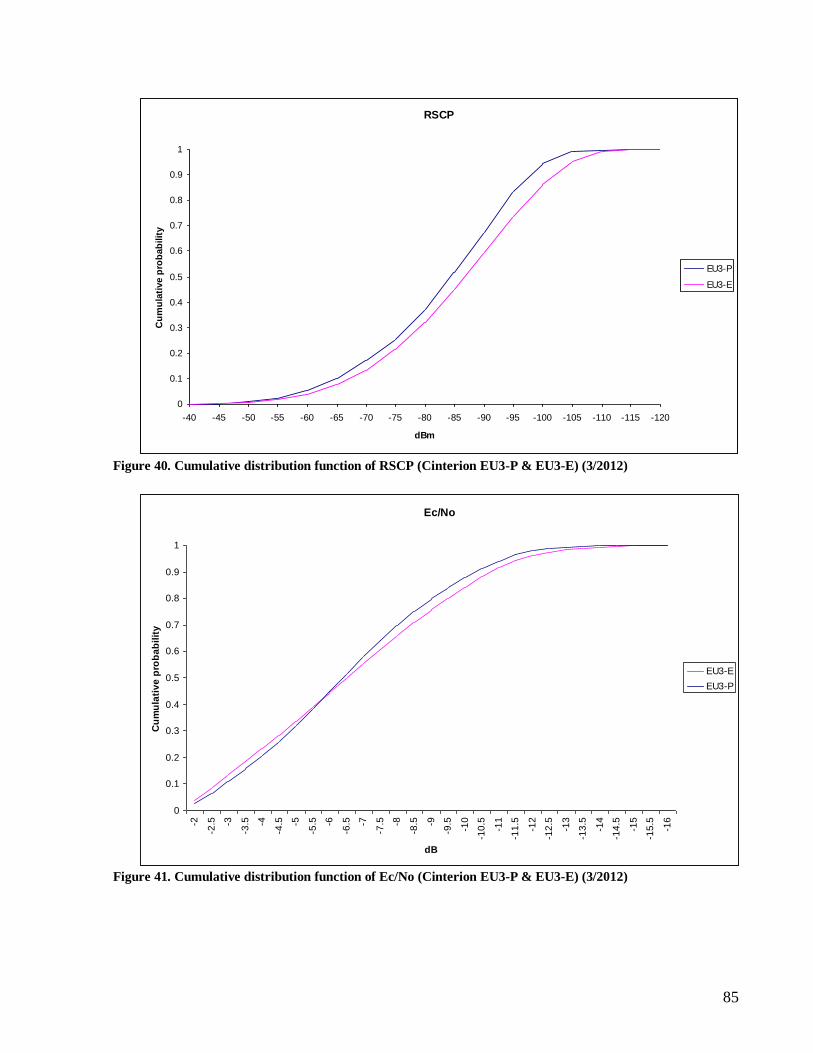
85
RSCP
0
0.1
0.2
0.3
0.4
0.5
0.6
0.7
0.8
0.9
1
-40 -45 -50 -55 -60 -65 -70 -75 -80 -85 -90 -95 -100 -105 -110 -115 -120
dBm
Cu
mu
lati
ve p
rob
ab
ilit
y
EU3-P
EU3-E
Figure 40. Cumulative distribution function of RSCP (Cinterion EU3-P & EU3-E) (3/2012)
Ec/No
0
0.1
0.2
0.3
0.4
0.5
0.6
0.7
0.8
0.9
1
-2
-2.5 -3
-3.5 -4
-4.5 -5
-5.5 -6
-6.5 -7
-7.5 -8
-8.5 -9
-9.5
-10
-10
.5
-11
-11
.5
-12
-12
.5
-13
-13
.5
-14
-14
.5
-15
-15
.5
-16
dB
Cu
mu
lati
ve
pro
ba
bil
ity
EU3-E
EU3-P
Figure 41. Cumulative distribution function of Ec/No (Cinterion EU3-P & EU3-E) (3/2012)
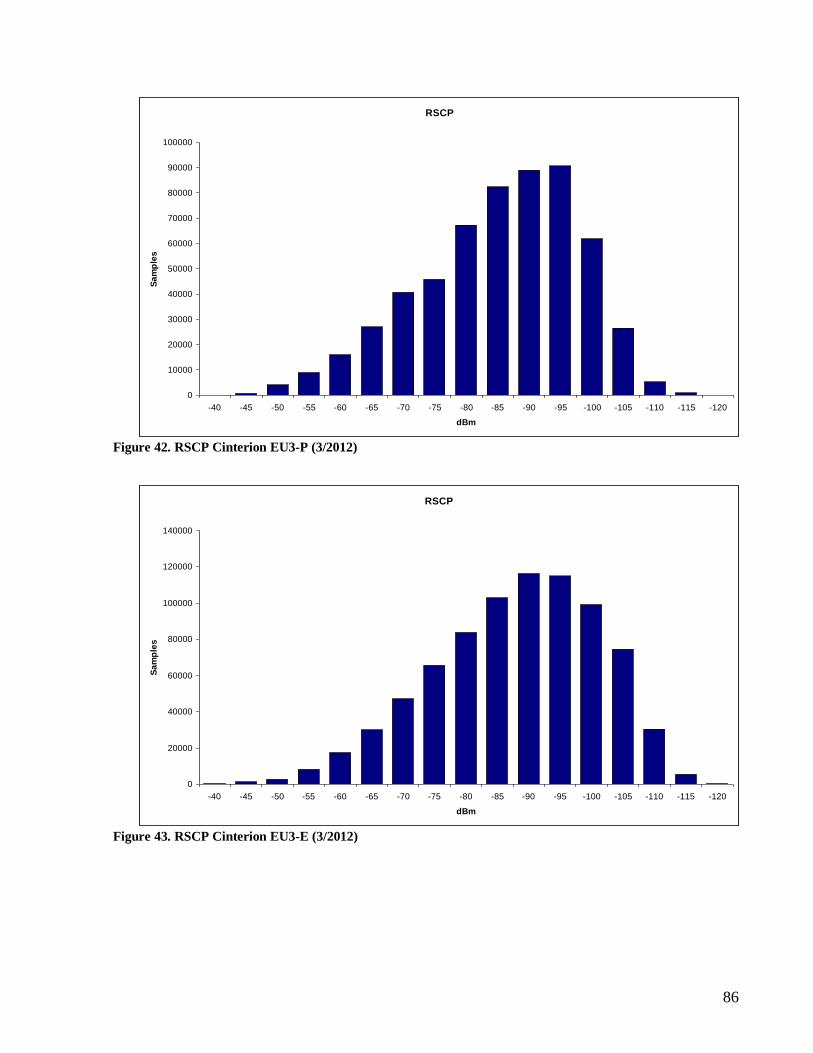
86
RSCP
0
10000
20000
30000
40000
50000
60000
70000
80000
90000
100000
-40 -45 -50 -55 -60 -65 -70 -75 -80 -85 -90 -95 -100 -105 -110 -115 -120
dBm
Sa
mp
les
Figure 42. RSCP Cinterion EU3-P (3/2012)
RSCP
0
20000
40000
60000
80000
100000
120000
140000
-40 -45 -50 -55 -60 -65 -70 -75 -80 -85 -90 -95 -100 -105 -110 -115 -120
dBm
Sa
mp
les
Figure 43. RSCP Cinterion EU3-E (3/2012)
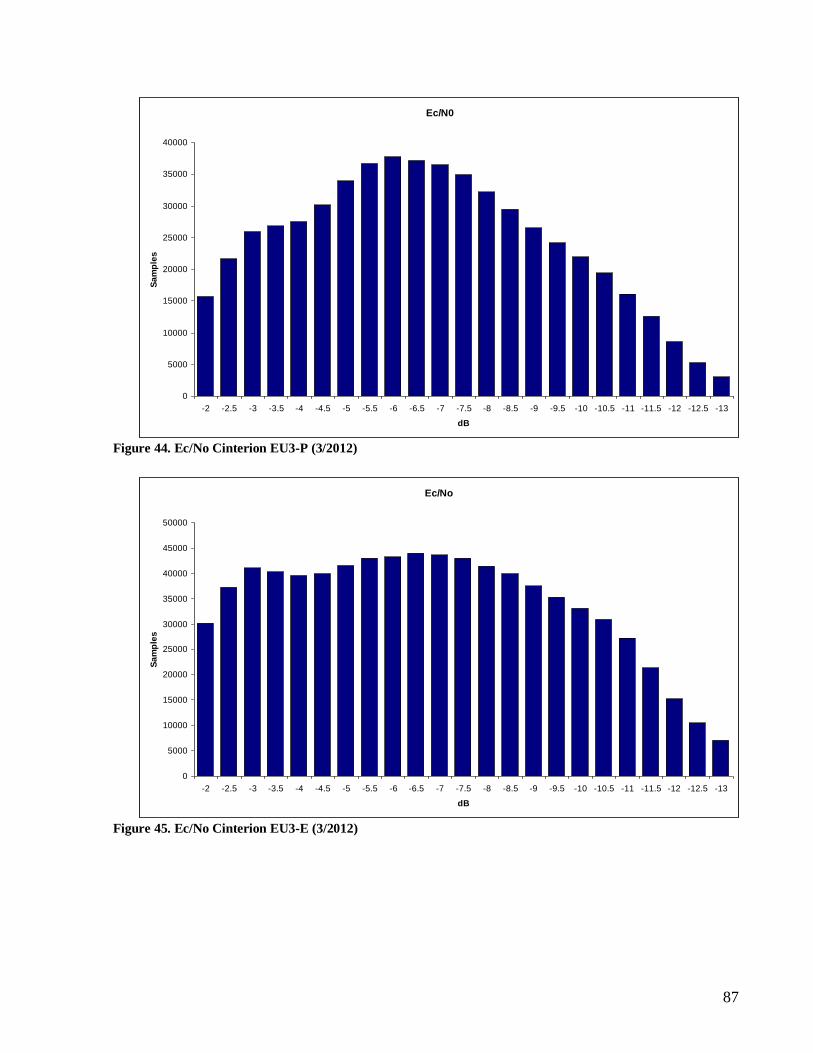
87
Ec/N0
0
5000
10000
15000
20000
25000
30000
35000
40000
-2 -2.5 -3 -3.5 -4 -4.5 -5 -5.5 -6 -6.5 -7 -7.5 -8 -8.5 -9 -9.5 -10 -10.5 -11 -11.5 -12 -12.5 -13
dB
Sa
mp
les
Figure 44. Ec/No Cinterion EU3-P (3/2012)
Ec/No
0
5000
10000
15000
20000
25000
30000
35000
40000
45000
50000
-2 -2.5 -3 -3.5 -4 -4.5 -5 -5.5 -6 -6.5 -7 -7.5 -8 -8.5 -9 -9.5 -10 -10.5 -11 -11.5 -12 -12.5 -13
dB
Sa
mp
les
Figure 45. Ec/No Cinterion EU3-E (3/2012)