Embed Size (px)
Citation preview

3
Measurement Systems for Electrical Machine Monitoring
Mario Vrazic, Ivan Gasparac and Marinko Kovacic University of Zagreb, Faculty of Electrical Engineering and Computing,
Croatia
1. Introduction
Monitoring systems on electrical machines, nowadays largely present on new electrical
rotating (synchronous generators) and non rotating machines (transformers) have to
endure harsh conditions such as vibrations and electromagnetic disturbances. Also,
especially for rotating machines, rotor physical quantities (temperature, strain, current…),
have to be transferred to the standstill part of the measurement system without galvanic
contact.
Therefore, monitoring systems should be, and usually are, designed for a specific purpose
and for a specific machine. Some essential parts are the same but most of the monitoring
system should be custom made especially if one takes into consideration that there is a small
serial production of large electrical machines in the world and that most of the large units
are unique.
Modern monitoring of big transformers covers permanent on-line monitoring of electrical,
magnetic and mechanic quantities. It is specific when compared to rotational electrical
machines because it also usually includes monitoring of dissolved gasses in transformer oil.
This information, with proper interpretation, represents an important element for
transformer state determination. However, transformer monitoring systems are not the
focus of this chapter.
This chapter deals with all problems, obstacles and solutions applied to two measurement
systems installed on a 35 MVA hydro-generator and a 250 MVA turbo-generator.
Large electric machines justify investment in measurement systems for several reasons.
Usually, measurement systems for bearings are installed. In such systems vibrations and oil
parameters (pressure and temperature) are monitored to help maintenance. Measurements
of stator and less often rotor currents are also present as parts of different systems. For
example, a differential stator current measurement is present for protection purposes and
enables detection of current leakage (short circuit between phase windings). Monitoring
systems that incorporate all necessary measurements and, of course, interpretations of those
measurements are almost non existing and very rare. This chapter will concentrate on
synchronous generators.
www.intechopen.com

Applied Measurement Systems
46
2. The monitoring system
The monitoring system is basically a data acquisition system with on line data processing and possible data interpretation. A standard data acquisition system consists of a sensor, signal transfer, A/D conversion, signal conditioning and data storage.
The sensor is usually analogue, like a Pt1000 probe for temperature measurement. The temperature is measured as a resistance over two, three or four wires. If resistance is measured over four wires, the current flows through two wires and the other two wires are used for voltage measurement. This system configuration is very sensitive to electromagnetic disturbances thus making measurement inherently inaccurate. In order to avoid that and to make measurement more accurate signal amplifiers and converters are designed. They enable steady current regardless temperature dependence of connecting wires. But still, voltage measurement is subjected to electromagnetic disturbances since the measured voltage has an mV range. Of course, all of these disturbances and most of their influence can be avoided by proper wiring. For example, bifilar wire configuration and shielded cables significantly reduce electromagnetic disturbances if the shield is properly grounded.
So, such configuration, for example the one installed in Plomin thermo power plant, has a sensor (a Pt1000 probe), a rather large amount of wire (15 m), a signal converter and amplifier (placed in the measurement cabinet), a ±10 VDC signal path (a 2 m cable), an acquisition system, communication (90 m Ethernet FTP cable) and finally a measurement computer.
The reasons for such configuration will be presented later in this chapter. Of course, if one has the opportunity and technical possibility, one should install a more advanced temperature measurement. For example, there are digital temperature probes on the market that are basically small chips with temperature probes and all the necessary signal conversion. All they need is power and communication. They obtain them both through a three wire system that is completely independent of electromagnetic disturbances. Such a system has a serial connection and can have up to 127 probes in one system.
This description shows one review of the acquisition system that, of course, can grow to an enormous size. For example, in CERN in Switzerland, there is a measurement system with over 175 000 channels.
The monitoring system incorporates data acquisition and enables instant data processing and interpretation. For instance, before information enters the PC, the analogue signal goes through the A/D conversion and scaling. With this, for example, a signal of 5.4 mV becomes 24.5 ºC. After that, the information about the exact temperature enters a PC application that operates with it. The temperature, maybe, does not represent the physical quantity, so vibrations will be used from now on.
Vibrations are measured with accelerometers. They measure vibration accelerations and such information enters the PC. But for a reasonable vibration analysis different quantities should be obtained from vibration acceleration such as vibration velocity and vibration displacement. Furthermore, for all the three quantities (acceleration, velocity and displacement) a base harmonic and some higher harmonics should be known. All of this can be done within data acquisition unit but then this unit will be very expensive. So, the
www.intechopen.com

Measurement Systems for Electrical Machine Monitoring
47
general idea is that such advance data processing is done within application in the monitoring PC.
The monitoring system can now have access to all the necessary data and can conclude upon the electrical machine condition. Of course, this conclusion can be based on simple or complex algorithms. Simple algorithms will include allowed limits, alarm limits and shutdown limits for some or most of the physical quantities. Complex algorithms include monitoring of some physical quantity trend lines and from that info concludes on further actions. Those conclusions can lead to a well-timed maintenance action that is more efficient and cheaper than waiting for a fault to occur and lead to an unplanned stopping of electrical machine and process for which this machine is necessary.
In the following text three measurement systems and one monitoring system will be presented.
The general idea of building a measurement system, and further on, a monitoring system on synchronous generators started with a desire to build a user P-Q diagram of a synchronous aggregate. In order to adapt FEM and analytical models to a real generator a lot of measurement of different physical quantities should be done. This demanded a measurement system to be made. Such a measurement system should be able to measure magnetic inductances B (T), temperatures T (°C), acceleration of vibrations a (m/s2), stator and rotor voltages U (V) and currents I (A).
So the whole idea was tested on synchronous hydro-generator and synchronous turbo-generator.
3. Measurements on the hydro-generator
When research for a user P-Q diagram started, the access was approved to Vinodol hydropower plant where three generators (Fig. 1) are installed. Their rated data is: Sn=35 MVA, Un=10.5 kV, f=50 Hz, n=500 rpm, cos=0.9.
Fig. 1. Hydro-generators in hydro power plant Vinodol - 35MVA each
A larger measurement system was installed on the first generator. This enables a reduction of measurement systems installed on the other two generators. This text will describe the larger measurement system.
www.intechopen.com

Applied Measurement Systems
48
The research demanded a magnetic induction measurement, so 22 Hall probes were
installed in winding end part and in the air gap. Since calibrated Hall probes are very
expensive it was decided to buy only three calibrated Hall probes with their calibration
certificates. The rest of hall probes were cheap sensors (their cost was approx. $5 per probe).
Hall probes have 4 connections. Two of them need a steady current flow and on the other
two voltage can be measured. The voltage corresponds to the magnetic induction. Both
current (1 mA or 5 mA) and voltage (range of mV) have rather small values. To satisfy those
conditions current sources were designed. The current range can be selected with a switch
within the current source. The Hall probe voltage is amplified with a signal amplifier to a
±10 VDC signal range and as such prepared for data acquisition. Of course, there are still
two problems: calibration and electromagnetic disturbances.
But before calibration, all Hall probes were placed on an electronic board (Fig. 2) that has
two possible connection places. If there is enough room for probe placement, then Fig. 2
option a can be used, but if there is not enough place (air gap, cooling channel) then a minor
board can be cut out from the bigger one (Fig. 2 option b) and wires can be connected to it.
(a) (b)
Fig. 2. Hall probe board
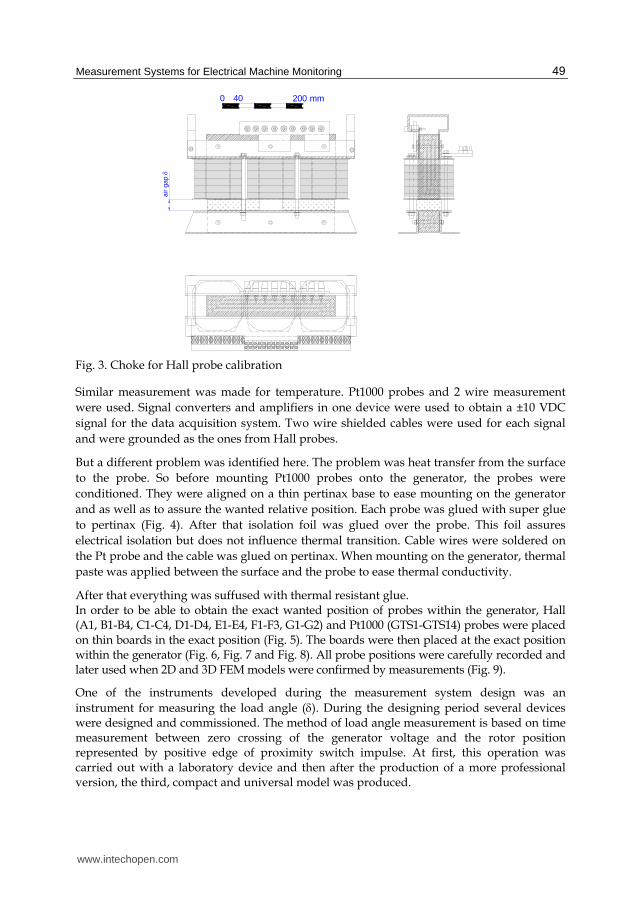
The calibration problem was resolved when it was done in the laboratory. A three phase choke was used (Fig. 3) for that purpose. The air gap on the choke can be changed from 0 to 32 mm.
The calibrated Hall probe (the expensive one) was used as a reference probe and all the
necessary calibrations (with AC and DC signals) for all the other Hall probes were made
with it: the calibration constant, the DC offset and the thermal dependence. Several Hall
probes were discarded because of their lack of linearity but most of the cheap hall probes
were successfully calibrated.
Still, there was a problem of electromagnetic disturbances since the voltage signal from Hall
probes is very small (range of mV). The distance from a probe to signal amplifiers is approx.
15 meters and that also contributes to the problem. This issue was minimized by using a 4
wire shielded cable. So there is one cable for each probe. Since those synchronous generators
are air cooled there was no problem with the cable entrance through generator housing.
Standard cable glands were used. All the cables were shielded on one side, near signal
amplifiers. Such configuration ensures electromagnetic disturbance discharge thus
minimizing their influence on the measured signal.
www.intechopen.com
Measurement Systems for Electrical Machine Monitoring
49
air
gap
0 40 200 mm
Fig. 3. Choke for Hall probe calibration
Similar measurement was made for temperature. Pt1000 probes and 2 wire measurement
were used. Signal converters and amplifiers in one device were used to obtain a ±10 VDC
signal for the data acquisition system. Two wire shielded cables were used for each signal
and were grounded as the ones from Hall probes.
But a different problem was identified here. The problem was heat transfer from the surface
to the probe. So before mounting Pt1000 probes onto the generator, the probes were
conditioned. They were aligned on a thin pertinax base to ease mounting on the generator
and as well as to assure the wanted relative position. Each probe was glued with super glue
to pertinax (Fig. 4). After that isolation foil was glued over the probe. This foil assures
electrical isolation but does not influence thermal transition. Cable wires were soldered on
the Pt probe and the cable was glued on pertinax. When mounting on the generator, thermal
paste was applied between the surface and the probe to ease thermal conductivity.
After that everything was suffused with thermal resistant glue. In order to be able to obtain the exact wanted position of probes within the generator, Hall (A1, B1-B4, C1-C4, D1-D4, E1-E4, F1-F3, G1-G2) and Pt1000 (GTS1-GTS14) probes were placed on thin boards in the exact position (Fig. 5). The boards were then placed at the exact position within the generator (Fig. 6, Fig. 7 and Fig. 8). All probe positions were carefully recorded and later used when 2D and 3D FEM models were confirmed by measurements (Fig. 9).
One of the instruments developed during the measurement system design was an instrument for measuring the load angle (). During the designing period several devices were designed and commissioned. The method of load angle measurement is based on time measurement between zero crossing of the generator voltage and the rotor position represented by positive edge of proximity switch impulse. At first, this operation was carried out with a laboratory device and then after the production of a more professional version, the third, compact and universal model was produced.
www.intechopen.com

Applied Measurement Systems
50
Fig. 4. Mounting scheme of Pt1000 probes
(a) (b)
Fig. 5. Prepared probes: a) Hall probes; b) Pt1000 probes
Fig. 6. Built-in Hall probes
Fig. 7. Placement of Hall probes in generator
www.intechopen.com

Measurement Systems for Electrical Machine Monitoring
51
Fig. 8. Placement of Hall and Pt1000 probes
Fig. 9. 2D and 3D FEM induction calculations for no load operation
Also, as previously mentioned, two vibration probes (accelerometers) were installed on the stator package (Fig. 10).
Fig. 10. Vibration accelerometer installed on the stator package
www.intechopen.com

Applied Measurement Systems
52
After all of that, the measurement system needed to be designed and built. Since, at the time, only 16 channel data acquisition systems were available to us, 4 different data acquisition systems (Iotech) were used for complex measurements. All together there were a total of 51 signals (22 Hall probes, 14 Pt1000 probes, 3 armature currents, 3 armature voltages, 1 excitation current, 1 excitation voltage, 1 impulse per rotation, 1 load angle, 3 grid voltages, 2 vibration accelerations). All data acquisition systems had trigger possibility on one channel so this was used for synchronous start of data acquisition. Since there were so many signals there are lots of cables present. Most measurements were made with a temporary measurement system (Fig. 11). In order to be sure that electromagnetic
Fig. 11. Temporary measurement system
ms
25 50 75 100 150 200 250 300 350 400 450
B1_HS16 [T] B2_HS15 [T] B3_HS14 [T]
B4_HS06 [T] C1_HS07 [T] C2_HS11 [T]
C3_HS12 [T] C4_HS13 [T]
0,00750,0000
-0,00750,0030,000
-0,0030,000200,00000
-0,000200,001000,00000
-0,001000,015
-0,0200,0200,000
-0,0200,01250,0000
-0,01250,0050,000
-0,005
Fig. 12. Hall probe measurements – signals of different probes
www.intechopen.com

Measurement Systems for Electrical Machine Monitoring
53
disturbances are not present, or at least are acceptable, each signal was checked several times and compared to the theory. For example, each magnetic induction signal was checked separately and together with the rest of them. If two signals are the same and their probes are not in the position that can give the same signals (for example the same radial position on the press plate) this is the indication that one signal is copied to the other channel. Also, most of signals must have some angular difference and this is the other way to check them (Fig. 12).
After several measurements with the temporary measurement system there was a 3 year delay with this power plant due to circumstances beyond our influence. So, the measurement and monitoring system development for this power plant was halted. But all designs have been done and the equipment has been bought and installed in the electrical cabinet (Fig. 13). This cabinet (measurement cabinet) will be installed in the power plant during the first half of next year. Data acquisition will be realised with National instruments Compact RIO product. The main interface will be touch panel. The plan is to place a PC near this cabinet and connect the system to the Internet.
Fig. 13. Measurement cabinet for measurement systems installed on all three generators in hydro power plant Vinodol
4. Measurements on the turbo-generator
A measurement system was also installed on one turbo-generator (Fig. 14). This generator is installed in Plomin 2 thermo power plant. Its rated data are 250 MVA, 3000 rpm.
A similar set of probes was installed in this generator as it was in the generator in HPP Vinodol. In total, 55 probes were installed in the generator: 30 Hall probes, 14 Pt1000 probes and 11 accelerometers. All armature and excitation voltages and currents are measured together with one grid voltage. All those currents and voltages are measured in such a way that a malfunction in the measurement system does not influence systems in the power plant. For instance, armature currents are measured with current transformers (5A/333mV)
www.intechopen.com

Applied Measurement Systems
54
Fig. 14. Turbo-generator 250 MVA in Plomin 2 thermo power plant
placed around the wires from the secondary windings of the major current measurement transformers (2000A/5A) of the generator. Voltages are also measured on the secondary windings of major voltage measurement transformers. This connection was made over 250mA fuses. Major voltage transformers have the ability to burn those fuses (in case of a measurement system malfunction) without jeopardizing their primary function.
This generator is cooled with hydrogen. Since this is a highly explosive coolant all signals were checked for energy level they import in the generator. The energy level must be lower than the energy that is high enough for sparking and that may ignite hydrogen. This is the first step to ensure that the measurement system can do no harm to the generator. The next step was to shut down all the measurements and cut off the power in the measurement cabinet in case of hydrogen leakage. So, if sensors detect hydrogen outside of generator, the main contactor used for powering the measurement cabinet switches off. The third step was installation of a hydrogen detection probe within the measurement cabinet since signal cables can lead hydrogen from the generator to the measurement cabinet in case of cable glands malfunction. The fourth step was to design special cable glands to ensure absence of hydrogen leakage. Cable glands (Fig. 15) were designed, tested, installed and they have been functioning flawlessly for two years.
Signals from the generator were conducted through a signal cable. This cable has 16 twisted pair wires. Each twisted pair is shielded and the whole cable is shielded, too. This double shielding ensures better protection from electromagnetic disturbances. The measurement system is similar to the one in HPP Vinodol. The difference occurs in the data acquisition system.
After conditioning all the signals go to one device (NIcDAQ9188) and not to four different data acquisition systems. The conditions and customer demanded that the PC should be positioned in the control room approximately 90m away from the measurement cabinet (Fig. 16) so Ethernet cable FTP cat.6 was used for that connection.
www.intechopen.com

Measurement Systems for Electrical Machine Monitoring
55
Fig. 15. Signal cable glands
Fig. 16. Measurement cabinet with NIcDAQ9188 data acquisition system
Unlike the measurement system in HPP Vinodol, where measurement and monitoring systems should be finished, everything is finished in TPP Plomin2. A lot of work was done in order to produce the application in LabVIEW for measurement, signal processing and data storage.
The front panel application was developed in LabVIEW and consists of several tabs. All of the measurements are divided between multiple tabs. The first three tabs are used for graphical view of the measured signals. It is possible to observe waveforms of all of the acquired signals (magnetic field flux density, vibration accelerations and electrical signals such as stator currents, voltages, field current, voltage etc.). The user is also able to read the exact value of the waveform using a cursor tool and move over the waveform using zoom in/out and drag tools (Fig. 17).
After successful acquisition of the all the signals the application computes all the necessary quantities such as rms, peak-to-peak, base harmonics of the acceleration, velocity and
www.intechopen.com

Applied Measurement Systems
56
Fig. 17. Front panel of the application, showing real time waveforms of the 3-phase system voltage
displacement for vibration signals; dc-offset, rms value, base harmonics for magnetic flux density signals; mean value for temperature signals; full 3 phase power analysis for electrical signals. The signals that can also be measured on the synchronous machine are field current, voltage and load angle of the machine. The computed quantities are also divided in four separate tabs (magnetic flux density, vibrations, temperature and electrical), (Fig. 18).
Fig. 18. Front panel of the application, showing real time electrical measurements and capability diagram
After a successful calculation, all of the calculated quantities are logged into the historical database (Fig. 19). A user can access the database from the application GUI, and observe variations or trends of the selected quantities over a desired time period. Trend analysis is especially valuable tool in vibration monitoring. Based on the trend of the calculated vibrations user can predict a maintenance of the machine.
www.intechopen.com

Measurement Systems for Electrical Machine Monitoring
57
Fig. 19. Historical data view of computed variables (red-active power, green- reactive, white- tangential end winding vibration, violet-axial end winding vibration)
The described method of monitoring incorporates measurement of the signal waveforms. All of the data logged into the database are just physical quantities calculated from those waveforms. There are cases when a user demands to log the waveform data for further, more detailed, analysis. A continuous waveform logging requires a large storage capacity as all of the waveforms are sampled at rather a high frequency (more than 10 kHz). To lower the demands on storage capacity the application must be able to decide which of the waveforms to store. The stationary waveforms are no of interest for most of the users so the application must detect only a change in the signal and based on that change it has to trigger storing of the waveform. When designing such an application one has to be careful that it records a certain amount of signal before the actual trigger event. Furthermore, in this type of measurement the acquisition system and the data processing have to be able to withstand the continuous sampling of the signal to ensure that none of the samples are lost due to the buffer overrun or the slow data processing. Fig. 20 shows an armature current transient properly recorded with pre-buffer time set to 5 s and total transient time set to 20 s.
5. Measurements on the rotor
Modern synchronous generator monitoring and controlling systems require measurement of various physical quantities. One of those is the temperature of the machine. It is relatively easy to measure temperature of the stationary part of the machine, but the difficulties arise with the measurement of the rotor temperature. Conventional temperature measurement requires slip-rings for each sensor. The measurement system which uses digital wireless data transfer and digital temperature sensors will be described in short.
The DS18B20 digital sensors were chosen for the temperature measurement. The accuracy of the temperature sensors is ±0.5 °C. Sensors use a 1-wire protocol for communication with the microcontroller. Bluetooth communication was selected because of the high operating frequency 2.4 GHz, low power requirement and wide usage in various IT equipments. A special embedded device was developed to convert data from temperature sensors. The measurement system consists of several specific parts:
www.intechopen.com

Applied Measurement Systems
58
Bluetooth communication module Microcontroller Battery charge management 14-bit ADC Li-ion battery
Fig. 20. TEP2 armature current transient caused by the short circuit on the power-line (5 s of pre-buffer time and 20 s of total signal time)
PIC18F468010 MIPS
mcrocontroller
F2M03GLABluetooth module
TLC357814bit 8ch
ADC+/-10Vin
REF30404,096V
MMA3201 accelerometer X,Y
axis
PSU input 9-15 Vdc 3,3V DC/
DC
5V DC/DC
Bluetooth connection active
+/-15VDC/DC
Li-ion battery7,4 V
2500 mAh
BQ2057WLi-ion
charger250 mA
1-Wireinterface
1-Wire conncector
Status LEDs
Fig. 21. Block diagram and PCB of the wireless measurement system
The heart of the measurement system is a microcontroller which routes data from the sensors to the Bluetooth interface. Each DS18B20 has a unique 64-bit serial code, which allows multiple DS18B20 to function on the same 1-Wire bus. A parallel connection of the sensors simplifies wire routing over the machine rotor. Routines for searching, addressing and reading 1-Wire temperature sensors are integrated in the embedded code of the microcontroller.
www.intechopen.com

Measurement Systems for Electrical Machine Monitoring
59
The Bluetooth module is connected with the microcontroller via a USART interface so the system acts as a virtual serial port on the host computer. It is advisable that the microcontroller has a pre-programmed bootloader, a part of software which enables updating of firmware in the rotation through the Bluetooth link.
Because the system operates on the rotating part of the machine it had to be battery supplied. An absence of the alternating magnetic field on the rotor side of the synchronous generator excluded the usage of coils for parasite battery charge. Instead, batteries can be charged via a DC/DC converter connected to the synchronous machine excitation. This procedure has to be performed with caution due to the high voltage spikes generated by the excitation system.
To save the battery, only the Bluetooth module has to be powered while the connection is inactive while all other circuits (microcontroller, sensor supply) should be powered after a successful Bluetooth connection to the host system is established.
The measurement system has additional features intended for future use, such as a 2-axsis accelerometer, an 8 channel 14-bit analogue to digital converter and a ±15V sensor power supply.
Data from all the sensors had to be monitored and logged on to the host computer. The GUI application sends commands to the measurement system via the Bluetooth and waits for its response. The time base of the measurement is generated by the host system. The application searches for sensors on the 1-Wire bus and monitors the temperature of each sensor. Temperatures of each sensor together with time base are logged in a textual file which is used for further analysis. The GUI application can also read the battery voltage and battery charge status via the analogue input of the microcontroller. After a successful sensor search, the application enters in the temperature polling mode. A small database which joins names to the unique 64-bit address of a specific sensor can be incorporated into the application. This way, it is easier to monitor temperature of each sensor during an experiment.
It can be useful if the application has an ability to render 3D temperature distribution over the surface. The 3D representation greatly improves visualization of temperature distribution, especially locations of the hot-spots. The 3D model of the salient, shown in Fig. 22 (right), has been drawn and imported in LABView using “3D Sensor Mapping Tool”. Sensors were positioned on the same coordinates as on the real salient pole. Temperature distribution over the surface between sensors is calculated using interpolation.
The measurement system was mounted on the 400 kVA, 1000 rpm synchronous generator, Fig. 23. Because of the Bluetooth transceiver it had to be placed in a non metal case. It was decided that the measurement system would be mounted on a shaft using a custom made holder. It was mounted in such a way that centrifugal force pushes the plastic case of the measurement system towards the metal holder and provides reliable fixation. Balancing weights were mounted on the opposite side of the shaft to reduce vibrations.
After a successful installation of the measurement system prototype on the laboratory synchronous generator, various experiments have been conducted. Fig. 24 shows an example of a measurement recorded by the measurement system. The excitation winding was first heated in standstill and afterwards in the rotation.
www.intechopen.com

Applied Measurement Systems
60
START BUTTON
COMMUNICATION INTERFACE NAME
STOP BUTTON
LOG FILE PATH
ADDRESS ARRAY
TEMPERATURE
ARRAY
TEMPERATURE OVER TIME
CHART
PROBE NAME ARRAY
BATTERY STATUS
Fig. 22. GUI application and 3D temperature field representation
Fig. 23. Mounting of the temperature probes (left); measurement system in rotation (right)
0 200 400 600 800 1000 1200 1400 1600 180015
20
25
30
35
40
45
50
55
60
Sample number
Tem
pera
ture
[°C
]
D1D2D3D4D5J1K1L1L2L3L4L5N1N10N2N3N4N5N6N7N8N9P1P2P3S1
Rotationstarted
Rotationstopped
Fig. 24. Temperatures from 27 sensors placed on synchronous generator rotor (2 s sampling time)
www.intechopen.com

Measurement Systems for Electrical Machine Monitoring
61
6. Conclusion
Measurement systems described in this chapter show measurement of most of necessary
physical quantities needed for proper rotating electric machine monitoring. Of course,
measurement is not everything. A good monitoring system should be based on expert
knowledge so that the monitoring system can give advice for maintenance. For large units
such as synchronous generators monitoring systems are different for each machine. During
the creation of such monitoring systems electric machine manufacturer should at least be
present, because he did, during the design process, lots of modelling (analytically, with FEM
etc.) and knows most of limitations of the produced electric machine. It would be the best if
the manufacturer also produces such a monitoring system and has a permanent access to
measurements. In such a way the manufacturer can improve his product, correct some flaws
and optimize it.
7. References
Mohan, N. Electric Drives: An Integrative Approach, Mnpere, ISBN 978-0971529250, Minneapolis, USA, 2003.
Tavner, P.; Ran, L.; Penman, J.; Sedding, H. Condition Monitoring of Rotating Electrical Machines, The Institute of Engineering and Technology, ISBN 978-0-86341-739-9, Stevenage Herts, United Kingdom, 2008.
Vas, P; Parameter estimation, condition monitoring, and diagnosis of electrical machines, Oxford science publication, ISBN 0-19-859375-9, Oxford University Press Inc., New York, USA, 2001
Babichev, S.A.; Zakharov, P.A.; Kryukov O.V. Automated monitoring system for drive motors of gas-compressor units, Automation and remote control, Vol.72, No.1, January 2011, pp. 175-180, ISSN: 0005-1179, DOI: 10.1134/S0005117911010176
Despalatovic M., Jadric M., Terzic B. Real-time power angle determination of salient-pole synchronous machine based on air gap measurements, Electric power systems research, Vol.78, No.11, pp. 1873-1880, November 2008, ISSN: 0378-7796, DOI: 10.1016/j.epsr.2008.03.013
Yang, W.; Tavner, P.J.; Wilkinson, M.R. Condition monitoring and fault diagnosis of a wind turbine synchronous generator drive train, Renewable Power Generation, IET, Vol.3, No.1, pp. 1-11, March 2009, ISSN: 1752-1416, DOI : 10.1049/iet-rpg:20080006
Yang W., Tavner P.J., Crabtree C.J., Wilkinson M. Cost-Effective Condition Monitoring for Wind Turbines, IEEE Transactions on industrial electronics, Vol.57, No.1, pp. 263-271, January 2010, ISSN: 0278-0046, DOI 10.1109/TIE.2009.2032202
Rangnekar, S.; Nema, R.K.; Raman, P.; PC based data acquisition and monitoring system for synchronous machines, Proceedings of IEEE/IAS International Conference on Industrial Automation and Control, 1995, pp. 195 – 197, DOI 10.1109/IACC.1995.465843
Rahimian, M.M.; Butler-Purry, K.; Modelling of synchronous machines with damper windings for condition monitoring, Proceedings of Electric Machines and Drives Conference, 2009., pp. 577 – 584, ISBN 978 – 1 – 4244 – 4252 - 2, DOI 10. 1109 / IEMDC. 2009. 5075264
Batzel, T.D. Observer-Based Monitoring of Synchronous Generator Winding Health, Proceedings of Power Systems Conference and Exposition, 2006., pp. 1150 – 1155, DOI 10.1109/PSCE.2006.296470
www.intechopen.com
Applied Measurement Systems
62
Hanic, Z.; Kovacic, M.; Vrazic, M. Influence of Mounting Temperature Probes on the Excitation Winding on its Temperature Field, Proceedings of the XIX International Conference on Electrical Machines (ICEM 2010), ISBN 978-1-4244-4175-4, pp 1-6, Roma, Italy, September 2010.,
Hanic, Z.; Vrazic, M.; Stipetic, S. Some problems related to surface temperature measurement of synchronous generator excitation winding in rotation, Proceedings of 14th International Power Electronics and Motion Control Conference (EPE-PEMC 2010), ISBN 978-1-4244-7854-5, pp T7-15 - T7-20, Skopje, Macedonia, September 2010.
Kovacic, M.; Vrazic, M.; Gasparac, I. Bluetooth wireless communication and 1-Wire digital temperature sensors in synchronous machine rotor temperature measurement, Proceedings of 14th International Power Electronics and Motion Control Conference (EPE-PEMC 2010), ISBN 978-1-4244-7854-5, pp T7-25 - T7-28, Skopje, Macedonia, September 2010.
Stipetic, S.; Hanic, Z.; Vrazic, M. Application of IR Thermography to Measurements on Synchronous Hydro-generator in Rotation, Proceedings of the 10th edition of the Quantitive Infrared Thermography (QIRT 10), ISBN 978-2-9809199-1-6, pp 1-8, Québec City, Canada, July 27-30, 2010
Vrazic, M.; Stipetic, S.; Kutija, M. Methodology of verifying IR temperature measurement on synchronous generator in rotation, Proceedings of EDPE 2009 - 15th international conference on electrical drives and power electronics, ISBN 978-953-6037-56-8, pp 1-5, Dubrovnik, Croatia, October 12-14, 2009
Vrazic, M.; Gasparac, I.; Pavlica, M. Ensuring synchronous generator special standstill tests, Proceedings of 2008 International Conference on Electrical Machines, pp. 1-5, Vilamoura, Portugal, 6-9 September, 2008.
Vrazic, M.; Gasparac, I.; Pavlica, M. Some Problems of Synchronous Hydro-Generator Temperature Measurement, Proceedings of 2008 International Conference on Electrical Machines, pp. 1-4, Vilamoura, Portugal, 6-9 September, 2008.
Maljkovic, Z.; Gasparac, I.; Vrazic, M. Electromechanical oscillations in bulb type hydropower unit, Proceedings of 13th International Conference on Electrical Drives and Power Electronics, ISBN 953-6037-43-2, pp. 7-15, Dubrovnik, Croatia, 26-28. September, 2005
Gasparac, I.; Maljkovic, Z.; Vrazic, M. Vibrations measurement during hydrogenerator testing, Proceedings of XVII IMEKO WORLD CONGRESS - Metrology in the 3rd Milenium, ISBM 953-7124-00-2, pp. 924-928, June 22-27, 2003, Dubrovnik, Croatia
www.intechopen.com

Applied Measurement SystemsEdited by Prof. Zahurul Haq
ISBN 978-953-51-0103-1Hard cover, 390 pagesPublisher InTechPublished online 24, February, 2012Published in print edition February, 2012
InTech EuropeUniversity Campus STeP Ri Slavka Krautzeka 83/A 51000 Rijeka, Croatia Phone: +385 (51) 770 447 Fax: +385 (51) 686 166www.intechopen.com
InTech ChinaUnit 405, Office Block, Hotel Equatorial Shanghai No.65, Yan An Road (West), Shanghai, 200040, China
Phone: +86-21-62489820 Fax: +86-21-62489821
Measurement is a multidisciplinary experimental science. Measurement systems synergistically blend science,engineering and statistical methods to provide fundamental data for research, design and development,control of processes and operations, and facilitate safe and economic performance of systems. In recentyears, measuring techniques have expanded rapidly and gained maturity, through extensive research activitiesand hardware advancements. With individual chapters authored by eminent professionals in their respectivetopics, Applied Measurement Systems attempts to provide a comprehensive presentation and in-depthguidance on some of the key applied and advanced topics in measurements for scientists, engineers andeducators.
How to referenceIn order to correctly reference this scholarly work, feel free to copy and paste the following:
Mario Vrazic, Ivan Gasparac and Marinko Kovacic (2012). Measurement Systems for Electrical MachineMonitoring, Applied Measurement Systems, Prof. Zahurul Haq (Ed.), ISBN: 978-953-51-0103-1, InTech,Available from: http://www.intechopen.com/books/applied-measurement-systems/measurement-systems-for-electrical-machine-monitoring

© 2012 The Author(s). Licensee IntechOpen. This is an open access articledistributed under the terms of the Creative Commons Attribution 3.0License, which permits unrestricted use, distribution, and reproduction inany medium, provided the original work is properly cited.