Embed Size (px)
Citation preview
International Journal of Science and Research (IJSR) ISSN (Online): 2319-7064
Index Copernicus Value (2013): 6.14 | Impact Factor (2013): 4.438
Volume 4 Issue 2, February 2015
www.ijsr.net Licensed Under Creative Commons Attribution CC BY
A Mathematical Model of Cervical Cancer in Kenya
Lucy W Kivuti-Bitok1, Ganesh P Pokhariyal
2, Geoff McDonnell
3, Roudsari Abdul
4
1School of Nursing Sciences, University of Nairobi, P.O BOX 19676-KNH-00202, Nairobi, Kenya
2 School of Mathematics, University of Nairobi, P.O Box 30196-GPO-00100, Nairobi, Kenya
3 Centre of Health Informatics, University of New South Wales, SYDNEY NSW 2052, Cliffbrook House, 45 Beach St,Coogee NSW 2034
Australia
4Health and Information Science, University of Victoria, PO Box 3050 STN CSC, Victoria BC V8W 3P5
Abstract: Background: In this paper dynamic models for cervical cancer among women with diagnosed and undiagnosed cervical
cancer have been constructed. Methods: Differential equations for the population of women in each stage of diagnosed and
undiagnosed cervical cancer were developed. The year 2010 was used as the base year. The equations were run through MatlabTM and
results are presented in graphs. Results and Discussion: The growth patterns for both diagnosed and undiagnosed status in the
population were identical. However, the only difference between the two has been observed as the initial values that are estimated from
the WHO/ICO report taking 2010 as the base year for the respective stages. This was with assumption of no change in detection process.
Keywords: Cervical cancer, mathematical modeling, Kenya, stages
1. Background and Literature Review
Models are representations or abstractions of actual objects,
processes, situations or any features a researcher wishes to
describe or whose behavioral pattern is being studied and
analyzed. Mathematical models describe the undertaken
aspect in a precise way and assist in arriving at reasonably
accurate estimates, by using various branches and
procedures of mathematics. Mathematical models help in
indicating what information should be collected and in what
amount. If the boundary of analysis is selected
appropriately, it is possible to deal with the undertaken
problem in its totality and allow consideration of all major
variables of the problem simultaneously.
In this paper mathematical models for cervical cancer
among women for diagnosed and undiagnosed stages are
developed and the impacts of vaccinations as well as
screening intervention strategies are analyzed. Cervical
cancer is estimated to account for 15% of all female cancers
and cause approximately 46,000 deaths each year in women
aged 15-49 years in developing countries (WHO/ICO 2010).
It is the second most frequent cancer after breast cancer in
Kenya among women between age of 15 to 44
years(WHO/ICO 2010). For the purposes of this model 2010
was considered the base year. According to United Nations
Development program (UNDP) the projection of female
population in Kenya regardless of age as at year 2010 was
20,492,000, while those females aged 10 to over 65years
comprised 14,260,000. The World Health
Organization(WHO) report documented the incidences of
Human papillomavirus(HPV) in intervals of 10 years from
age of less than 14 years, 15 to 44 years, 45 to 54 years, 55
to 64 years and over 65 years(WHO/ICO 2010). Baseline
data was derived from the WHO/ICO report (WHO/ICO
2010).
Different preventive and intervention approaches have been
proposed in the management of cervical cancer. These
include pre-exposure /primary vaccination of pre-pubertal
girls and secondary /catch up vaccination of women aged
between 10 and 45 years. Currently two main vaccines are
available. Gardasil is only given to females‟ aged 9 to
26(Elbasha, Dasbach, and Insinga 2007)(Lee and Tameru
2012). A complete cycle of HPV vaccine is given in three
equal doses over a period of six months. The second dose is
given 1 to 2 months after the first dose while the last dose is
given at six months after the first dose. Women who are
pregnant should not get the HPV vaccine until after the baby
is born. Cervarix is recommended for 10 to 45 year olds
(Baussano et al. 2013)(Situations 2010) (Markowitz et al.
2007).
Different screening methods have also been employed. The
methods have differing sensitivity and specificity levels.
These methods include Visual Inspection with Acetic Acid
(VIA), Visual Inspection with Lugol‟s Iodine (VILLI), DNA
Testing and Cytology (Duraisamy et al. 2011). Clinical
management of cervical cancer includes surgical
intervention, chemotherapy, radiotherapy or any
combination of these methods have been employed(Legge et
al. 2010; Mucheusi 2012).These management approaches
have different impacts on the number of patients undergoing
progression and regression at various stages of cervical
cancer.
Currently, the Kenyan Government has a mix of policies,
comprising advocating to abstinence, being faithful, use of
visual inspection with acetic acid (VIA) and visual
inspection with Lugol iodine (VILLI). This model analyses
the impact of vaccination and screening interventions in
Kenya. The models assume vaccination of pre-adolescent
girls at the age of after 9 years and before turning 10 years.
This period for vaccination has been chosen since the
conversion of dormant columnar epithelium of endo-cervical
canal into squamous epithelium has not yet occurred, hence
the cells are still not susceptible to Human Papillomavirus
(HPV) infection (Martens et al. 2009)(Di Bonito and
Bergeron 2012). The efficacy of the vaccine is assumed to
be lifelong and the girls who received primary vaccination
Paper ID: OCT14311 458
International Journal of Science and Research (IJSR) ISSN (Online): 2319-7064
Index Copernicus Value (2013): 6.14 | Impact Factor (2013): 4.438
Volume 4 Issue 2, February 2015
www.ijsr.net Licensed Under Creative Commons Attribution CC BY
permanently exit the model as the model follows the females
with HPV infection.
2. Problem Statement
Unless the impact of different interventions in cervical
cancer is mapped, it is unreasonable to expect the cervical
cancer managers to develop sound policies. In this paper
mathematical models for cervical cancer among women for
diagnosed and undiagnosed stages are developed and the
impacts of vaccinations, treatment as well as screening
intervention strategies are analyzed. If the boundary of
analysis is selected appropriately, it is possible to deal with
the undertaken problem in its totality and allow
consideration of all major variables of the problem
simultaneously.
3. Methods
The overall approach utilized in this paper is dynamical
modeling. In this model differential equations along with
boundary conditions were formulated. To describe the
number of girls and women in various stages of HPV
infection (Table 1), corresponding differential equations
showing the rates of change in the number of girls and
women in respective stages with relevant parameter
estimation were formulated.
Table 1: Distribution of HPV Infected Women Stage of
Diagnosed
Cervical
Cancer
Percentage Number
of
Women
Stage of
Undiagnosed
Cervical
Cancer
Percentage Number
of
Women
m0 5 1442 w0 5 43621
m1 5 1442 w1 5 43621
m2 10 2884
w2 10 87242
m3 40 11536
w3 40 348967
m4 40 11536
w4 40 348967
Total 100 M=
28840
100 W=
872418
Mathematical modeling has been done in line with
HIV/AIDS infection model, using differential equations by
Simwa and Pokhariyal(Simwa and Pokhariyal 2003). Simwa
and Pokaryal used dynamical, two systems of ordinary
differential equations to model the HIV/AIDS epidemic in
Sub-Saharan Africa, and generated curves which shown the
stage specific prevalence rates. The simulated results were
consistent with previously published epidemiological reports
in terms of non decreasing functions of time. Lee
&Tameru(Lee and Tameru 2012) used a compartmental
mathematical model of HPV and its impact in cervical
cancer among African American women. The model
included the choices individuals make once they become
infected; treatment versus no treatment. Lee and
Tameru(Lee and Tameru 2012)concluded that
„Mathematical models, from individual and population
perspectives, would help decision makers to evaluate
different prevention and mitigation scenarios of HPV‟ pg
268.
Adopting similar concepts, we developed compartmental
models of the population of females in different stages of
cervical cancer in Kenya. While the equations of Lee
&Tameru(2012) provided the general functional relationship
between the change in X(the susceptible, recovered and
other classes of non-infected individuals) and Y and Z with
time, our differential equations represent the rate of change
in the number of girls and women at the different stages and
diagnostic status of cervical cancer. The impact of primary
vaccination, secondary vaccination, screening and
treatments were incorporated and their impacts on the trends
of cervical cancer in Kenya were explored using several
scenarios. The model assumes that:
All the females seeking vaccination will complete the full
dose of vaccine.
The 38.8% of all the never vaccinated females will
acquire HPV infection based on the prevalence of HPV in
Kenya.
The females who missed both primary and secondary
vaccination are eligible for screening against HPV and
some women later may also miss this vital intervention.
However, screened women detected will be subjected to
appropriate treatment.
The HPV infection among the unscreened women will
progress naturally except those subjected to treatment.
The vaccinated women may die from other causes other
than cervical cancer as well as due to age, hence exit the
model.
This being a deterministic model using differential
equations, there was no need of accounting for confidence
intervals.
The girls and women were stratified according to the
following categories.
1 k number of infant girls aged less than year
g = infant mortality rate in Kenya
i = immunized girls (aged 1-9 years) due to physiologically
derived factors
v = girls who received primary vaccination at age
completing 9 years
s = susceptible (girls or women age > 9 years) who missed
primary
h = number of infected women in the population
f = the number of girls and women who missed the primary
vaccination and are given secondary (catch up) vaccination.
r = the women aged 15 years and over who are eligible for
screening
𝑀= 𝑡𝑒 𝑛𝑢𝑚𝑏𝑒𝑟 𝑜𝑓 𝑠𝑐𝑟𝑒𝑒𝑛𝑒𝑑 𝑔𝑖𝑟𝑙𝑠 𝑎𝑛𝑑 𝑤𝑜𝑚𝑒𝑛 𝑤𝑜 𝑎𝑣𝑒 𝑏𝑒𝑒𝑛 𝑐𝑜𝑛𝑓𝑖𝑟𝑚𝑒𝑑 𝑡𝑜 𝑎𝑣𝑒 𝐻𝑃𝑉 𝑖𝑛𝑓𝑒𝑐𝑡𝑖𝑜𝑛. W=the number of unscreened women who also have HPV
infection.
This number(M) is further stratified as:
Diagnosed dysplasia, denoted by 𝑚0
Diagnosed stage 1, denoted by 𝑚1
Diagnosed stage 2, denoted by𝑚2
Paper ID: OCT14311 459
International Journal of Science and Research (IJSR) ISSN (Online): 2319-7064
Index Copernicus Value (2013): 6.14 | Impact Factor (2013): 4.438
Volume 4 Issue 2, February 2015
www.ijsr.net Licensed Under Creative Commons Attribution CC BY
Diagnosed stage 3, denoted by 𝑚3
Diagnosed stage 4, denoted by 𝑚4
Such that 𝑀 = 𝑚0 + 𝑚1 + 𝑚2 + 𝑚3 + 𝑚4 (Eq 1)
The women who missed primary and secondary vaccination
as well as screening are denoted by W. It is assumed that this
population of women may be infected with HPV and
undergoes the similar stages of cervical cancer though
undiagnosed. This population is further stratified as:
undiagnosed dysplasia, denoted by w0
undiagnosed stage 1, denoted by w1
undiagnosed stage 2, denoted by w2
undiagnosed stage 3, denoted by w3
undiagnosed stage 4, denoted by w4
Such that 𝑊 = 𝑤0 + 𝑤1 + 𝑤2 + 𝑤3 + 𝑤4 (Eq 2)
It is assumed that 80% of the clients who may have detected
cancer at the time of infection have natural clearance of
HPV infections.
Let q = number of women who had HPV infection but clear
naturally.
The women exit from the model through three main ways;
through permanent immunity (𝑧1) via primary and
secondary vaccination, such that
𝑧1 = 𝑣 + 𝑓 (Eq 3)
Death as a result of undiagnosed cancer(𝑧2)
Death from diagnosed cancer (𝑧3)
Thus, the total number of women exiting the model at any
given time
= 𝑣 + 𝑓 + 𝑧2 + 𝑧3 = 𝑧1 + 𝑧2 + 𝑧3 (Eq4)
Representation of females at various stages and the rate of
change in these stages were done using differential
equations.
The boundary conditions for respective stages were derived
from data of WHO country report for Kenya(WHO/ICO
2010)
(i) 𝑑𝑘
𝑑𝑡 = 0 when0 ≤ 𝑡 ≤ 𝑡𝑠and𝑘0 >
600,000ando≤t≤tsand k0>600,000
and𝑑𝑘 𝑡
𝑑𝑡= 𝛼1 (𝑘 − 𝑔) (Eq 5)
(ii) 𝑑𝑖
𝑑𝑡 = 0 𝑤𝑒𝑛 𝑙 ≤ 𝑡 ≤ 9 and 𝑖(𝑡0) = 5,632,400 (Eq 6)
(iii) 𝑑𝑣
𝑑𝑡= 𝛼2 𝑧 𝑖 − 𝑣 , 𝑖 ≤ 𝑡 ≤ 9 𝑎𝑛𝑑 𝑣(𝑡0) =
16,896 (Eq 7)
(iv) 𝑑/𝑑𝑡 = 𝛼3 (𝑠 − ) (Eq 8)
(v) 𝑑𝑓 𝑡
𝑑𝑡= 𝛼4 𝑠 − 𝑓 , 𝑤𝑒𝑛 𝑡 > 10 𝑎𝑛𝑑 𝑡 <
𝑡𝑙 ; 𝑓 𝑡0 = 34,947 (Eq 9)
(vi) 𝑑𝑞(𝑡)/𝑑𝑡 = 𝑜, 𝑤𝑒𝑛 𝑡 < 15 𝑎𝑛𝑑 𝑡 > 80; 𝑞(𝑡0) = 11,614,157 (Eq 10)
(vii) 𝑑𝑟(𝑡)/𝑑𝑡 = 𝛼5(𝑞 − ), 𝑤𝑒𝑛 𝑡 < 15 𝑎𝑛𝑑 𝑡 >80; 𝑟(𝑡0) = 371653 (Eq 11)
(viii) 𝑑𝑀(𝑡)𝑑𝑡 = 𝛼6(𝑟 − 𝑀) 𝑤𝑒𝑛 15 < 𝑡 < 65, 𝑀(𝑡0) = 144,201. (Eq 12)
By using the various stages of M, we get the equations for
each stage, which can then be expressed graphically to show
the corresponding pattern. The pattern of change from one
stage to another is similar in both the diagnosed and
undiagnosed situations. However, the number of cases at
respective stages at the base year of 2010 is different.
4. Results
a) Diagnosed Dysplasia
Dysplasia stage is characterized by HPV presence however
there is no conversion of epithelial cells to cancerous stage.
Let the number of women in the dysplasia stage be denoted
bym0(t0) which is assumed to be at constant up to time ts.
then we have
𝑑𝑚0(𝑡)/𝑑𝑡 = 0, when 0 ≤ 𝑡 ≤ 𝑡𝑠and 𝑚0(𝑡0) ≤ 1442 ≤𝑚0(𝑡) (Eq 13)
The total number of women with diagnosed dysplasia is
proportional to the number of women susceptible to HPV
and who underwent screening and the number of women
who with medical intervention regress from stage 1 to
dysplasia minus the number of women who progress from
dysplasia to Stage 1. Therefore, the rate of change in the
population of women with diagnosed dysplasia can be
expressed as;
𝑑𝑚0 𝑡
𝑑𝑡∝ 𝑟 𝑚1 . (Eq 14)
Changing the proportionality this gives 𝑑𝑚0 𝑡
𝑑𝑡=
7𝑟 + 𝛽1𝑚1 −
8𝑚1 (Eq 15)
where7 =
0.2 which is the progression factor of HPV
from normal cells to 𝑚0. This constant depends on;
Virulence of HPV, General health status of the cervix and
healthy living behavior of the client.8
=5% depicts the
progression factor from m0 to m1;
β1=0.8represents regression factor (due to treatment
intervention/natural clearance)
𝑟 = 1 (Constant of proportionality r is taken as 1 for
simplicity)
𝑑 𝑚0(𝑡) /𝑑𝑡 = 0.2 + 0.8m1−m1− = 0.2 − 0.2𝑚1 = 𝑚1 = 1442 (Eq 16)
𝑚0 = ( 7𝑟 + 𝛽1𝑚1 −
8𝑚1)𝑡 + 𝑘 (Eq17)
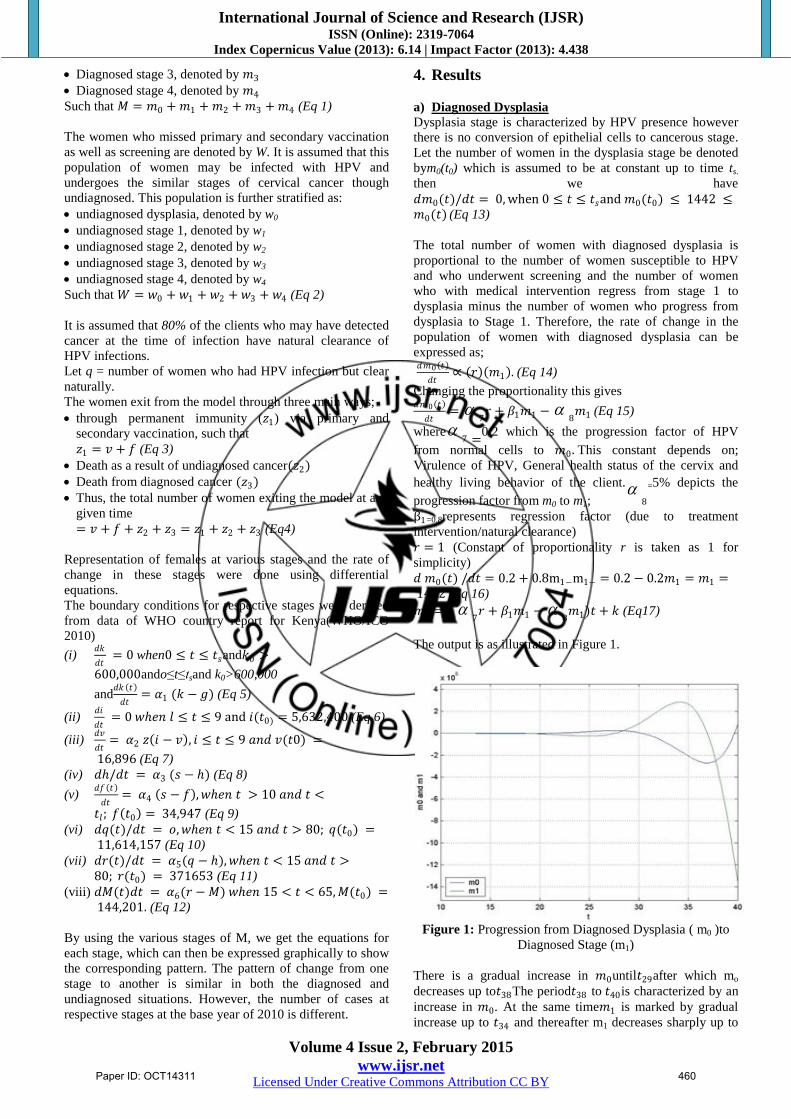
The output is as illustrated in Figure 1.
Figure 1: Progression from Diagnosed Dysplasia ( m0 )to
Diagnosed Stage (m1)
There is a gradual increase in 𝑚0until𝑡29after which mo
decreases up to𝑡38The period𝑡38 to 𝑡40is characterized by an
increase in 𝑚0. At the same time𝑚1 is marked by gradual
increase up to 𝑡34 and thereafter m1 decreases sharply up to
Paper ID: OCT14311 460
International Journal of Science and Research (IJSR) ISSN (Online): 2319-7064
Index Copernicus Value (2013): 6.14 | Impact Factor (2013): 4.438
Volume 4 Issue 2, February 2015
www.ijsr.net Licensed Under Creative Commons Attribution CC BY
𝑡40 . This sharp decline in the rate of change in 𝑚1 may be
explained by the regression of 𝑚1 to𝑚0 . Hence as the rate
of change in 𝑚1 declines, therate of change of 𝑚0increases
slightly.
b) Diagnosed Stage 1
The initial number of women at Diagnosed stage 1 be
denoted by𝑚1(𝑡0) which is assumed to be at constant up to
time𝑡𝑠 . Let 𝑚1(t) be the number of women at stage 1 at any
timet>𝑡𝑠. The rate of change and the boundary condition are
therefore;
𝑑𝑚𝑙(𝑡)/𝑑𝑡 = 0 , when0≤t≤𝑡𝑠, 𝑚1(𝑡0) )= 1442 and t >𝑡𝑙
The total number of women with stage 1 among the
diagnosed women is proportional to the number of women
with dysplasia and the number of women who regress from
stage 2 to stage 1.
Thus, the rate of change in the population of women at
diagnosed stage one is expressed as, 𝑑𝑚1 𝑡
𝑑𝑡=
9𝑚0 + 𝛽2𝑚2 −
10𝑚2. (Eq 18)
Where;
9
=1, is the progression factor from dysplasia to stage1,
β2 =0.5, is the regression factor from stage 2 to stage 1,
10
=2, is progression factor from stage 1 to stage 2.
Time of progress from dysplasia to stage 1 is approximately
15 years and the time taken to regress from stage 1 to
dysplasia is 1.4 years (Schlecht et al. 2003). 𝑑𝑚1 𝑡
𝑑𝑡= m0 + 0.5𝑚2 − 2𝑚2 = m0 + 1.5𝑚2 (Eq 19)
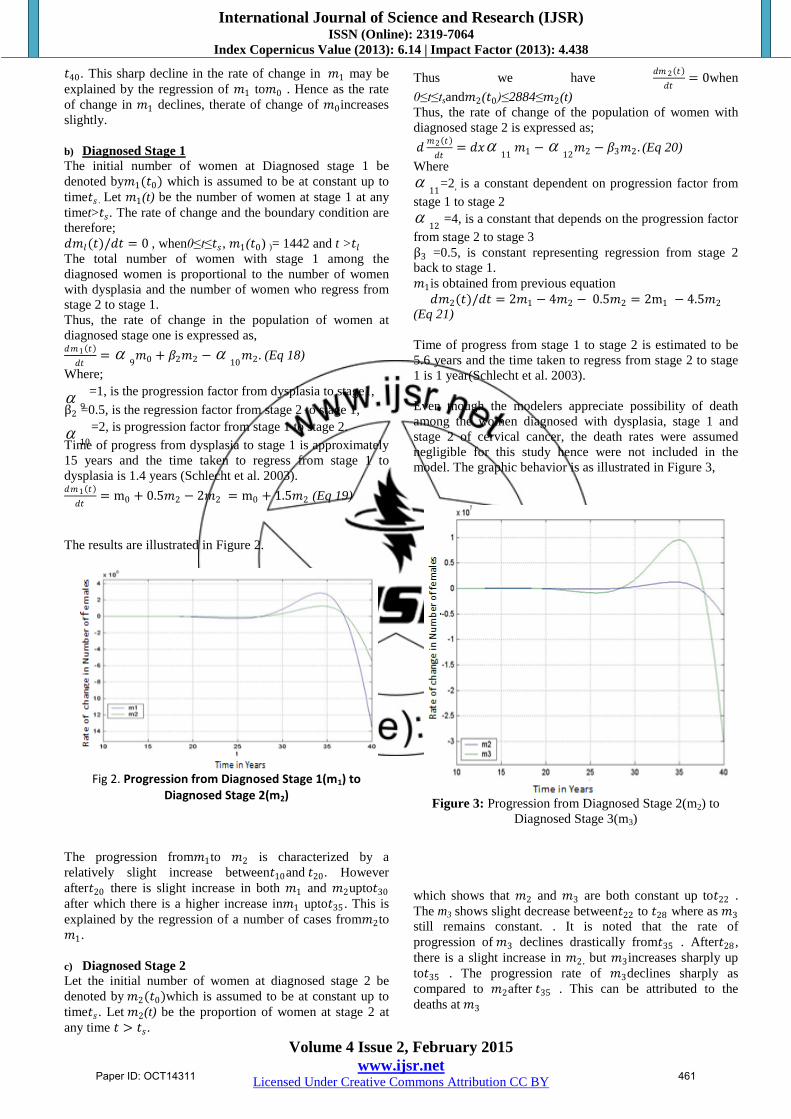
The results are illustrated in Figure 2.
Fig 2. Progression from Diagnosed Stage 1(m1) to
Diagnosed Stage 2(m2)
The progression from𝑚1to 𝑚2 is characterized by a
relatively slight increase between𝑡10and 𝑡20 . However
after𝑡20 there is slight increase in both 𝑚1 and 𝑚2upto𝑡30
after which there is a higher increase in𝑚1 upto𝑡35 . This is
explained by the regression of a number of cases from𝑚2to
𝑚1.
c) Diagnosed Stage 2
Let the initial number of women at diagnosed stage 2 be
denoted by 𝑚2(𝑡0)which is assumed to be at constant up to
time𝑡𝑠. Let 𝑚2(t) be the proportion of women at stage 2 at
any time 𝑡 > 𝑡𝑠.
Thus we have 𝑑𝑚 2 𝑡
𝑑𝑡= 0when
0≤t≤tsand𝑚2(𝑡0)≤2884≤𝑚2(t)
Thus, the rate of change of the population of women with
diagnosed stage 2 is expressed as;
𝑑𝑚2 𝑡
𝑑𝑡= 𝑑𝑥
11𝑚1 −
12𝑚2 − 𝛽3𝑚2. (Eq 20)
Where
11
=2, is a constant dependent on progression factor from
stage 1 to stage 2
12
=4, is a constant that depends on the progression factor
from stage 2 to stage 3
β3 =0.5, is constant representing regression from stage 2
back to stage 1.
𝑚1is obtained from previous equation
𝑑𝑚2(𝑡)/𝑑𝑡 = 2𝑚1 − 4𝑚2 − 0.5𝑚2 = 2m1 − 4.5𝑚2 (Eq 21)
Time of progress from stage 1 to stage 2 is estimated to be
5.6 years and the time taken to regress from stage 2 to stage
1 is 1 year(Schlecht et al. 2003).
Even though the modelers appreciate possibility of death
among the women diagnosed with dysplasia, stage 1 and
stage 2 of cervical cancer, the death rates were assumed
negligible for this study hence were not included in the
model. The graphic behavior is as illustrated in Figure 3,
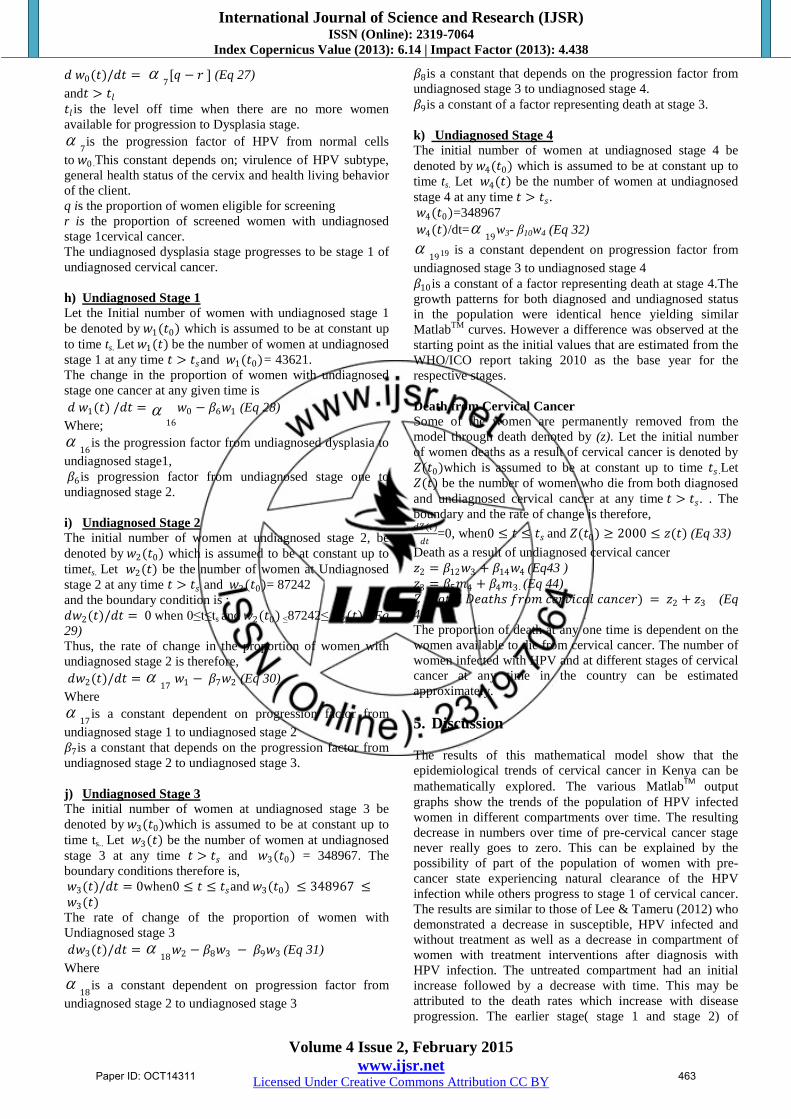
Figure 3: Progression from Diagnosed Stage 2(m2) to
Diagnosed Stage 3(m3)
which shows that 𝑚2 and 𝑚3 are both constant up to𝑡22 .
The m3 shows slight decrease between𝑡22 to 𝑡28 where as 𝑚3
still remains constant. . It is noted that the rate of
progression of 𝑚3 declines drastically from𝑡35 . After𝑡28 ,
there is a slight increase in 𝑚2 , but 𝑚3increases sharply up
to𝑡35 . The progression rate of 𝑚3declines sharply as
compared to 𝑚2after 𝑡35 . This can be attributed to the
deaths at 𝑚3
Paper ID: OCT14311 461

International Journal of Science and Research (IJSR) ISSN (Online): 2319-7064
Index Copernicus Value (2013): 6.14 | Impact Factor (2013): 4.438
Volume 4 Issue 2, February 2015
www.ijsr.net Licensed Under Creative Commons Attribution CC BY
d) Diagnosed Stage 3
Let the initial number of women at diagnosed stage 3, be
denoted by 𝑚3(𝑡0) which is assumed to be at constant up to
time𝑡𝑠 . Let 𝑚3(t) be the number of women at stage 3 at any
time t is >𝑡𝑠and 𝑚3(𝑡0)=11536.
Therefore the rate of change among the population of
women with diagnosed stage 3 is; 𝑑𝑚3 𝑡
𝑑𝑡=
13𝑚2 −
14𝑚4 − 𝛽4𝑚3 (Eq 22)
13
=4, is a constant dependent on progression factor from
stage 2 to stage 3
14
=1, is a constant that depends on the progression factor
from stage 3 to stage 4
β1 =1, is constant representing deaths at stage 3
𝑑𝑚3(𝑡) /𝑑𝑡 = 4𝑚2 − 𝑚4 − 𝑚3 (Eq 23)
Time of progress from stage 2 to stage 3 is estimated at 6.1
years (Schlecht et al. 2003). The model also assumes there is
no regression from stage 3 to stage 2. Figure 4 further
elaborates the trends of progression from stage 3 to stage 4.
Figure 4: Diagnosed Stage 3(m3) and Diagnosed Stage
4(m4).
e) Diagnosed Stage 4
Let the initial number of women at diagnosed stage 4 be
denoted by 𝑚4 (𝑡0) which is assumed to be at constant up to
time 𝑡𝑠 .Let 𝑚4 (t) be the proportion of women at stage 4 at
any time when t >𝑡𝑠and 𝑚4 (𝑡0)= 11536
The rate of change in the total number of women with stage
4 among the diagnosed women is
d𝑚4(t) /dt=15
𝑚3 −β5𝑚4 . (Eq 24)
15
=1, is a constant dependent on progression factor from
stage 3 to stage 4
β5=1, is constant representing deaths at stage 3
𝑑𝑚4(𝑡)/𝑑𝑡 = 𝑚3 − 𝑚4 (Eq 25)
Time taken for cancer to progress from stage 3 to stage 4 is
1 year(Schlecht et al. 2003)
Figure 4 shows that the progression of both 𝑚3 and 𝑚4is
constant up to time 𝑡20 and shows a slight decrease upto 𝑡27.
There after 𝑚3has relatively higher increase up to𝑡35as
compared to 𝑚4. This is followed by a sharp decrease in 𝑚3
as compared to 𝑚4up to 𝑡40. This can be attributed to the
fact that deaths at stage three, would leave relatively smaller
number to die at stage 4.
The coefficients of the model are estimated as the basis of
the HPV infected women data for diagnosed and
undiagnosed patients. Based on the proportionalities in
Table 1, the trends of the diagnosed and undiagnosed
patients are expected to be similar.
Unscreened and Undiagnosed Cervical Cancer Cases.
In this section the fate of the women who do not undergo
screening and the stages they undergo in relation to cervical
cancer are discussed. The women who missed screening and
have undiagnosed HPV infections develop cervical cancer
and advance to different stages. The change from one stage
to another are represented with the help of differential
equations and the proportionality constants are estimated
with the help of observed data from documented studies.
The changes in stages are illustrated graphically. Those who
never go for screening progress through the same stages of
cancer invasion but do not benefit from medical
interventions. However some of these women may be
screened at a later date and benefit from medical
interventions. While this model appreciates this
phenomenon, the number of women who undergo this late
/accidental screening has been assumed negligible and hence
are not included in this mathematical model. The total
number of women with undiagnosed HPV is denoted by W
where 𝑊 𝑡0 = 87241
f) Undiagnosed Dysplasia
The number of women with undetected/ undiagnosed
Dysplasia is denoted by 𝑤0(𝑡0) which is assumed to be at
constant up to time𝑡𝑠 . Let 𝑤0(𝑡) be the number of women at
Undiagnosed Dysplasia at any time 𝑡 > 𝑡𝑠 and 𝑤0(𝑡0) =43621
The rate of change in undiagnosed dysplasia is therefore; 𝑑𝑤0 𝑡
𝑑𝑡 = 7
𝑞 − 𝑟 (Eq 26)
and 𝑡 > 𝑡𝑙
𝑡𝑙 is the level off time when there are no more women
available for progression to dysplasia stage.
7is the progression factor of HPV from normal cells to
w0.This constant depends on; virulence of HPV subtype,
general health status of the cervix and health behavior of the
client.
qis the proportion of women eligible for screening
r is the proportion of screened women with undiagnosed
Stage 1cervical cancer.
The undiagnosed dysplasia stage progresses to be stage 1 of
undiagnosed cervical cancer
Undiagnosed cervical cases-In this case 𝑊(𝑡0) = 872418
and using the values from the observeddata:𝑤(𝑡0) =43621; 𝑤(𝑡1) = 43621;𝑤(𝑡2) = 87242 , 𝑤(𝑡3) =348967 w; 𝑤 𝑡4 = 348967. The pattern was analyzed and
found similar to the diagnosed stages.
g) Undiagnosed Dysplasia
The number of women with undetected/ undiagnosed
dysplasia is denoted by 𝑤0(𝑡0) which is assumed to be at
constant up to time𝑡𝑠 . Let 𝑤0(𝑡) be the number of women
with undiagnosed dysplasia at any time 𝑡 > 𝑡𝑠
and 𝑤0(𝑡0)=43621
The rate of change in undiagnosed dysplasia is therefore;
Paper ID: OCT14311 462
International Journal of Science and Research (IJSR) ISSN (Online): 2319-7064
Index Copernicus Value (2013): 6.14 | Impact Factor (2013): 4.438
Volume 4 Issue 2, February 2015
www.ijsr.net Licensed Under Creative Commons Attribution CC BY
𝑑 𝑤0(𝑡)/𝑑𝑡 = 7
[𝑞 − 𝑟 ] (Eq 27)
and𝑡 > 𝑡𝑙
𝑡𝑙 is the level off time when there are no more women
available for progression to Dysplasia stage.
7is the progression factor of HPV from normal cells
to 𝑤0 .This constant depends on; virulence of HPV subtype,
general health status of the cervix and health living behavior
of the client.
q is the proportion of women eligible for screening
r is the proportion of screened women with undiagnosed
stage 1cervical cancer.
The undiagnosed dysplasia stage progresses to be stage 1 of
undiagnosed cervical cancer.
h) Undiagnosed Stage 1
Let the Initial number of women with undiagnosed stage 1
be denoted by 𝑤1(𝑡0) which is assumed to be at constant up
to time ts. Let 𝑤1(𝑡) be the number of women at undiagnosed
stage 1 at any time 𝑡 > 𝑡𝑠and 𝑤1(𝑡0)= 43621.
The change in the proportion of women with undiagnosed
stage one cancer at any given time is
𝑑 𝑤1(𝑡) /𝑑𝑡 = 16
𝑤0 − 𝛽6𝑤1 (Eq 28)
Where;
16
is the progression factor from undiagnosed dysplasia to
undiagnosed stage1,
𝛽6is progression factor from undiagnosed stage one to
undiagnosed stage 2.
i) Undiagnosed Stage 2
The initial number of women at undiagnosed stage 2, be
denoted by 𝑤2(𝑡0) which is assumed to be at constant up to
timets. Let 𝑤2(𝑡) be the number of women at Undiagnosed
stage 2 at any time 𝑡 > 𝑡𝑠 and 𝑤2(𝑡0)= 87242
and the boundary condition is ;
𝑑𝑤2(𝑡)/𝑑𝑡 = 0 when 0≤t≤ts and 𝑤2(𝑡0) ≤87242≤ 𝑤2(𝑡) . (Eq
29)
Thus, the rate of change in the proportion of women with
undiagnosed stage 2 is therefore,
𝑑𝑤2(𝑡)/𝑑𝑡 = 17
𝑤1 − 𝛽7𝑤2 (Eq 30)
Where
17
is a constant dependent on progression factor from
undiagnosed stage 1 to undiagnosed stage 2
𝛽7is a constant that depends on the progression factor from
undiagnosed stage 2 to undiagnosed stage 3.
j) Undiagnosed Stage 3
The initial number of women at undiagnosed stage 3 be
denoted by 𝑤3(𝑡0)which is assumed to be at constant up to
time ts.. Let 𝑤3(𝑡) be the number of women at undiagnosed
stage 3 at any time 𝑡 > 𝑡𝑠 and 𝑤3(𝑡0) = 348967. The
boundary conditions therefore is,
𝑤3(𝑡)/𝑑𝑡 = 0when0 ≤ 𝑡 ≤ 𝑡𝑠and 𝑤3(𝑡0) ≤ 348967 ≤ 𝑤3(𝑡) The rate of change of the proportion of women with
Undiagnosed stage 3
𝑑𝑤3(𝑡)/𝑑𝑡 = 18
𝑤2 − 𝛽8𝑤3 − 𝛽9𝑤3 (Eq 31)
Where
18
is a constant dependent on progression factor from
undiagnosed stage 2 to undiagnosed stage 3
𝛽8is a constant that depends on the progression factor from
undiagnosed stage 3 to undiagnosed stage 4.
𝛽9is a constant of a factor representing death at stage 3.
k) Undiagnosed Stage 4
The initial number of women at undiagnosed stage 4 be
denoted by 𝑤4(𝑡0) which is assumed to be at constant up to
time ts. Let 𝑤4(𝑡) be the number of women at undiagnosed
stage 4 at any time 𝑡 > 𝑡𝑠.
𝑤4(𝑡0)=348967
𝑤4(𝑡)/dt=19
w3- β10w4 (Eq 32)
1919 is a constant dependent on progression factor from
undiagnosed stage 3 to undiagnosed stage 4
𝛽10is a constant of a factor representing death at stage 4.The
growth patterns for both diagnosed and undiagnosed status
in the population were identical hence yielding similar
MatlabTM
curves. However a difference was observed at the
starting point as the initial values that are estimated from the
WHO/ICO report taking 2010 as the base year for the
respective stages.
Death from Cervical Cancer
Some of the women are permanently removed from the
model through death denoted by (z). Let the initial number
of women deaths as a result of cervical cancer is denoted by
𝑍(𝑡0)which is assumed to be at constant up to time 𝑡𝑠 .Let
𝑍(𝑡) be the number of women who die from both diagnosed
and undiagnosed cervical cancer at any time 𝑡 > 𝑡𝑠. . The
boundary and the rate of change is therefore, 𝑑𝑍(𝑡)
𝑑𝑡=0, when0 ≤ 𝑡 ≤ 𝑡𝑠 and 𝑍(𝑡0) ≥ 2000 ≤ 𝑧(𝑡) (Eq 33)
Death as a result of undiagnosed cervical cancer
𝑧2 = 𝛽12𝑤3 + 𝛽14𝑤4 (Eq43 )
𝑧3 = 𝛽5𝑚4 + 𝛽4𝑚3 . (Eq 44)
𝑍 (𝑇𝑜𝑡𝑎𝑙 𝐷𝑒𝑎𝑡𝑠 𝑓𝑟𝑜𝑚 𝑐𝑒𝑟𝑣𝑖𝑐𝑎𝑙 𝑐𝑎𝑛𝑐𝑒𝑟) = 𝑧2 + 𝑧3 (Eq
45)
The proportion of death at any one time is dependent on the
women available to die from cervical cancer. The number of
women infected with HPV and at different stages of cervical
cancer at any time in the country can be estimated
approximately.
5. Discussion
The results of this mathematical model show that the
epidemiological trends of cervical cancer in Kenya can be
mathematically explored. The various MatlabTM
output
graphs show the trends of the population of HPV infected
women in different compartments over time. The resulting
decrease in numbers over time of pre-cervical cancer stage
never really goes to zero. This can be explained by the
possibility of part of the population of women with pre-
cancer state experiencing natural clearance of the HPV
infection while others progress to stage 1 of cervical cancer.
The results are similar to those of Lee & Tameru (2012) who
demonstrated a decrease in susceptible, HPV infected and
without treatment as well as a decrease in compartment of
women with treatment interventions after diagnosis with
HPV infection. The untreated compartment had an initial
increase followed by a decrease with time. This may be
attributed to the death rates which increase with disease
progression. The earlier stage( stage 1 and stage 2) of
Paper ID: OCT14311 463
International Journal of Science and Research (IJSR) ISSN (Online): 2319-7064
Index Copernicus Value (2013): 6.14 | Impact Factor (2013): 4.438
Volume 4 Issue 2, February 2015
www.ijsr.net Licensed Under Creative Commons Attribution CC BY
disease has lower death rate in comparison to the late
stages(Stage 3 and stage 4).The epidemiological trends of
cervical cancer in Kenya is comparable to results of HIV
epidemiology (Simwa and Pokhariyal 2003) in East Africa
which show that HPV /cervical cancer has a non zero
prevalence and hence a long term epidemiological disease.
6. Conclusion
In this paper a dynamic time varying model for estimating
control variables and changes in trends therein has been
developed. Baseline data set adapted from WHO/ICO and
published reports were used to test the model. These initial
conditions form the basis for further investigation into the
typography of cervical cancer in Kenya as well as prediction
of the trends that cervical cancer is likely to take. The model
is dynamic in the sense that it can be adjusted over the time
of investigation. The model predicted reasonable estimates
of real life expectations of progression of both diagnosed
and undiagnosed cervical, death from cervical cancer as well
as possible epidemiological trends taking into consideration
the impact of the various interventions available. However
given the inherent uncertainty against any inputs of
mathematical models, the outputs need to be compared with
observable epidemiological data.
7. Future Scope
There is need to develop a model covering the wider scope
of Africa as a continent in cervical cancer as well as develop
a model that accounts for change in detection process.
References
[1] Baussano, Iacopo, Fulvio Lazzarato, Guglielmo Ronco,
Joakim Dillner, and Silvia Franceschi. 2013. “Benefits
of Catch-up in Vaccination against Human
Papillomavirus in Medium- and Low-Income
Countries.” International Journal of Cancer 133: 1876–
81. doi:10.1002/ijc.28197.
[2] Di Bonito, L, and C Bergeron. 2012. “Cytological
Screening of Endocervical Adenocarcinoma.” Annales
de Pathologie 32: e8–14.
[3] Duraisamy, Krishnakumar, K S Jaganathan, Jagathesh
Chandra Bose, Shantha Biotechnics, and C
SVANHOLM BARRIE. 2011. “Methods of Detecting
Cervical Cancer.” Advan. Biol.Res 5 (4): 226–32.
[4] Elbasha, Elamin H, Erik J Dasbach, and Ralph P
Insinga. 2007. “Model for Assessing Human
Papillomavirus Vaccination Strategies.” Emerging
Infectious Diseases 13 (1): 28–41.
doi:10.3201/eid1301.060438.
[5] Lee, Shernita L, and Ana M Tameru. 2012. “A
Mathematical Model of Human Papillomavirus (HPV)
in the United States and Its Impact on Cervical Cancer.”
Journal of Cancer 3: 262–68. doi:10.7150/jca.4161.
[6] Legge, Francesco, Gilda Fuoco, Domenica Lorusso,
Alessandro Lucidi, Maddalena Borriello, Salvatore
Pisconti, Giovanni Scambia, and Gabriella Ferrandina.
2010. “Pharmacotherapy of Cervical Cancer,” July.
Informa UK Ltd London, UK.
[7] Markowitz, L E, E F Dunne, M Saraiya, H W Lawson,
H Chesson, E R Unger, Centers For Disease Control,
Prevention Cdc, and Advisory Committee On
Immunization Practices Acip. 2007. “Quadrivalent
Human Papillomavirus Vaccine: Recommendations of
the Advisory Committee on Immunization Practices
(ACIP).” MMWRRecommendations and Reports
Morbidity and Mortality Weekly
reportRecommendations and Reports Centers for
Disease Control 56: 1–24.
[8] Martens, Jolise E, Frank M M Smedts, Diana Ploeger,
Theo J M Helmerhorst, Frans C S Ramaekers, Jan W
Arends, and Anton H N Hopman. 2009. “Distribution
Pattern and Marker Profile Show Two Subpopulations
of Reserve Cells in the Endocervical Canal.”
International Journal of Gynecological Pathology
Official Journal of the International Society of
Gynecological Pathologists 28: 381–88.
[9] Mucheusi, Longino Kabakiza. 2012. “Brachytherapy in
Cancer of the Cervix : An African Perspective.” Cape
Peninsula University of Technology.
[10] Schlecht, N. F., Robert W. Platt, Eliane Duarte-Franco,
Maria C. Costa, Oa˜o, P. Sobrinho, Jose´ C. M. Prado,
et al. 2003. “Human Papillomavirus Infection and Time
to Progression and Regression of Cervical
Intraepithelial Neoplasia.” CancerSpectrum Knowledge
Environment 95 (17): 1336–43.
doi:10.1093/jnci/djg037.
[11] Simwa, R O, and G P Pokhariyal. 2003. “A Dynamical
Model for Stage-Specific HIV Incidences with
Application to Sub-Saharan Africa.” Applied
Mathematics and Computation 146: 93–104.
doi:10.1016/S0096-3003(02)00528-3.
[12] Situations, S. 2010. “Bivalent Human Papillomavirus
Vaccine (HPV2, Cervarix) for Use in Females and
Updated HPV Vaccination Recommendations from the
Advisory Committee.” Cdc.gov 59: 626–29.
[13] WHO/ICO. 2010. Human Papillomavirus and Related
Cancers in Kenya. Summary Report 2010. www. who.
int/ hpvcentre.
Author Profile
Dr. Lucy W. Kivuti-Bitok, is a Senior Lecturer in School of
Nursing sciences, University of Nairobi. She holds a BSc Nursing
(UoN) MHSM(Roskilde/Galilee), PhD Mathematical
Modeling(Health Systems Engineering)UoN
Prof G.P Pokhariyal is the Head, Applied Mathematics,
University of Nairobi. He is a holder of M.Sc. Mathematics , M.Sc.
Physics, Allahabad University, Ph.D. and D.SC. Mathematics,
Banaras Hindu University.
Dr Geoff McDonnell is a Medical Doctor, PhD Research Fellow at
Centre for Health Informatics, University of New South Wales,
Australia.
Professor Abdul Roudsari Director Health Information Science,
University of Victoria, Canada . He is holder of BSc (London),
MSc (London),PhD (London)
Paper ID: OCT14311 464
International Journal of Science and Research (IJSR) ISSN (Online): 2319-7064
Index Copernicus Value (2013): 6.14 | Impact Factor (2013): 4.438
Volume 4 Issue 2, February 2015
www.ijsr.net Licensed Under Creative Commons Attribution CC BY
ACKNOWLEDGEMENT
We thank the National Commission for Science, Technology and
Innovation(NACOSTI),Kenya for funding this study.
Paper ID: OCT14311 465