Embed Size (px)
Citation preview
Advances in Measurements of tropospheric
H h C
aerosols
Hugh Coe
Rami Alfarra James Allan Keith Bower Mike Flynn GordonRami Alfarra, James Allan, Keith Bower, Mike Flynn, Gordon McFiggans, Dantong Liu, Will Morgan, Jonny Taylor, Paul Williams
Gavin McMeeking – CSU Jacqui Hamilton – York
Doug Worsnop – Aerodyne Jose Jimenez – UC Boulder
Qi Zhang – UC Davis Markus Petters – N Carolina
Aerosol particle properties and tprocesses – a measurement
perspective
Outline
p p
• Background
• Organic aerosol – aerosol mass spectrometry
• Black carbon single particle soot photometry• Black carbon – single particle soot photometry
• cloud condensation nuclei
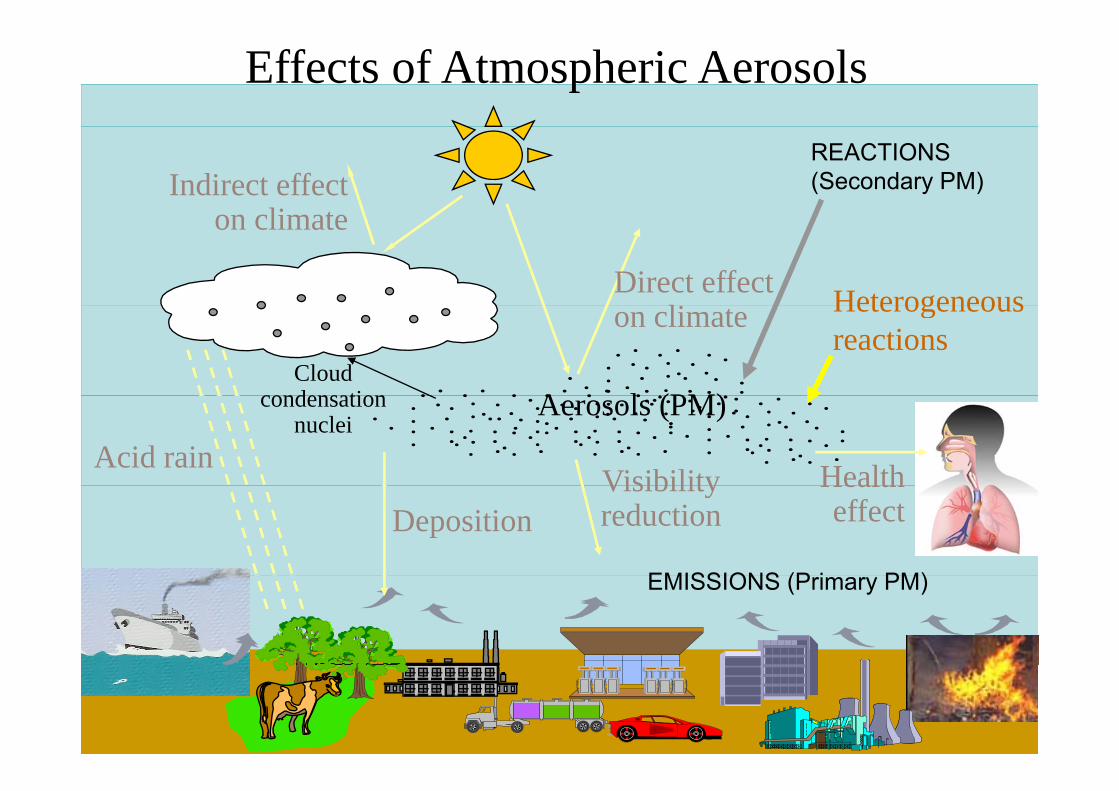
Effects of Atmospheric AerosolsREACTIONS (Secondary PM)REACTIONS (Secondary PM)REACTIONS (Secondary PM)Indirect effect
on climate
REACTIONS (Secondary PM)Indirect effect
on climate
REACTIONS (Secondary PM)Indirect effect
on climate
Direct effect li
on climate
Direct effect li
on climate
Direct effect li
on climate
Heterogeneous
A l (PM)A l (PM)A l (PM)
on climate
Cloud condensation A l (PM)
on climate
Cloud condensation A l (PM)
on climate
Cloud condensation
Heterogeneous reactions
Aerosols (PM)
Visibility
Aerosols (PM)
Visibility Health
Aerosols (PM)
Visibility Health
condensation nuclei
Aerosols (PM)
Visibility HealthAcid rain
condensation nuclei
Aerosols (PM)
Visibility HealthAcid rain
condensation nuclei
EMISSIONS (P i PM)
Visibility reduction
EMISSIONS (P i PM)
Visibility reduction
Health effect
EMISSIONS (P i PM)
Visibility reduction
Health effect
EMISSIONS (P i PM)
Visibility reduction
Health effectDeposition
EMISSIONS (P i PM)
Visibility reduction
Health effectDeposition
EMISSIONS (Primary PM)EMISSIONS (Primary PM)EMISSIONS (Primary PM)EMISSIONS (Primary PM)EMISSIONS (Primary PM)
What do field measurements tell us?
Id tif• Identify new processes
• Quantify properties and variations of propertiesQuantify properties and variations of properties
• Provide an important sanity check for model predictions
• Provide test cases against which process descriptions can b t t dbe tested
• Establish long term data sets to test larger scale models
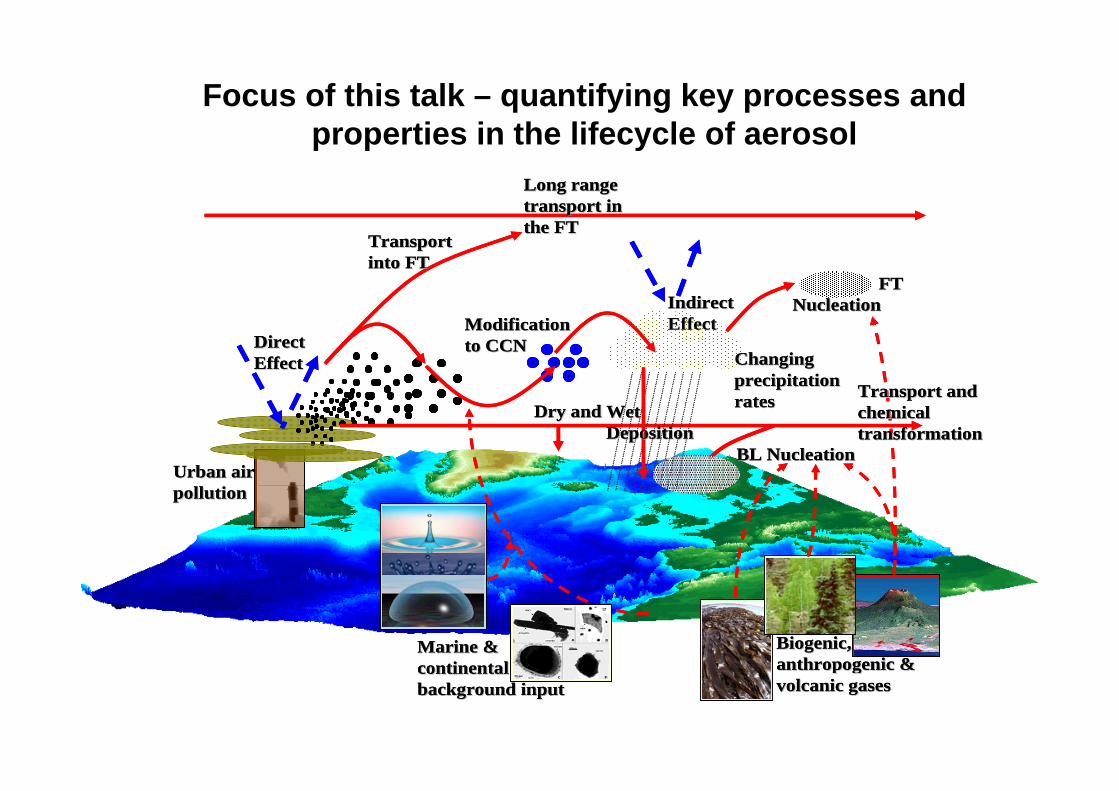
Focus of this talk – quantifying key processes and ti i th lif l f l
Long range Long range transport in transport in Long range Long range transport in transport in
properties in the lifecycle of aerosol
IndirectIndirect
pthe FTthe FT
Transport Transport into FTinto FT
FT FT NucleationNucleationIndirectIndirect
pthe FTthe FT
Transport Transport into FTinto FT
FT FT NucleationNucleation
Transport andTransport and
Modification Modification to CCNto CCN
Changing Changing precipitation precipitation
Direct Direct EffectEffect
Indirect Indirect EffectEffect
NucleationNucleation
Transport andTransport and
Modification Modification to CCNto CCN
Changing Changing precipitation precipitation
Direct Direct EffectEffect
Indirect Indirect EffectEffect
NucleationNucleation
Urban air Urban air Urban air Urban air
Dry andDry andTransport and Transport and chemical chemical transformationtransformation
Wet Wet DepositionDeposition
ratesrates
BL NucleationBL Nucleation
Dry andDry andTransport and Transport and chemical chemical transformationtransformation
Wet Wet DepositionDeposition
ratesrates
BL NucleationBL Nucleation
pollutionpollutionpollutionpollution
Marine & Marine & ti t lti t l
Marine & Marine & ti t lti t l
Biogenic, Biogenic, anthropogenic &anthropogenic &Biogenic, Biogenic, anthropogenic &anthropogenic &continental continental
background inputbackground inputcontinental continental background inputbackground input
anthropogenic & anthropogenic & volcanic gasesvolcanic gasesanthropogenic & anthropogenic & volcanic gasesvolcanic gases
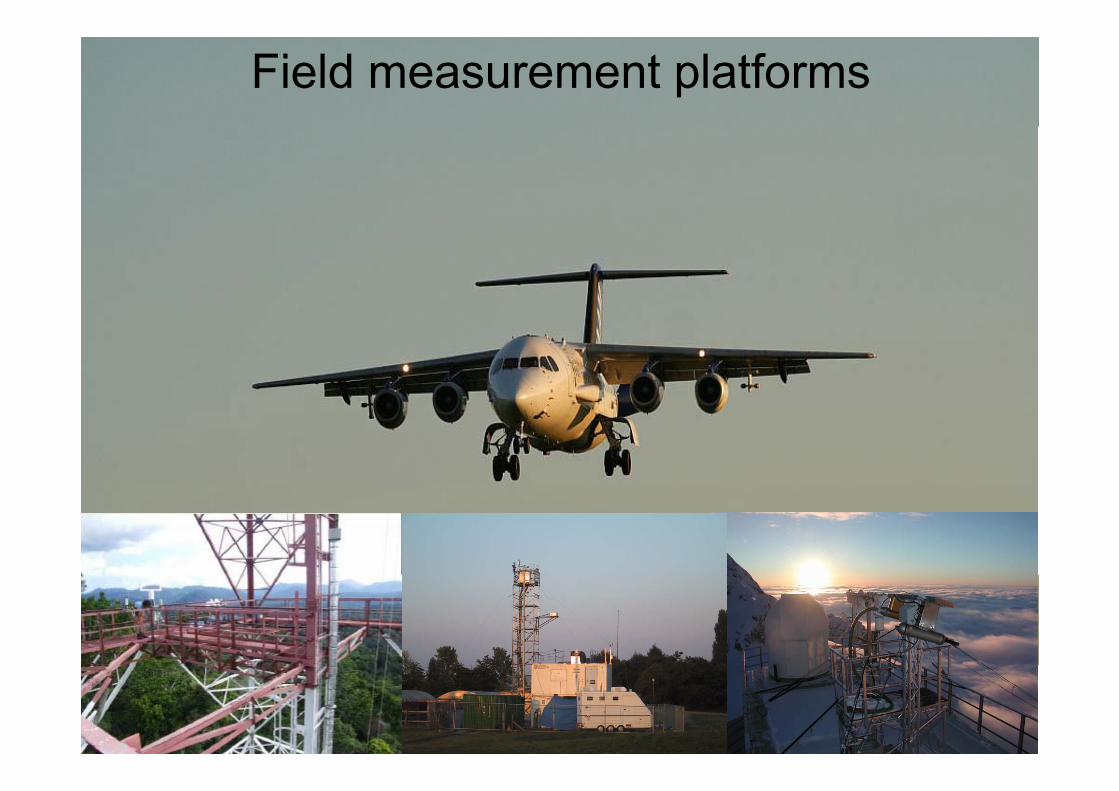
Field measurement platforms
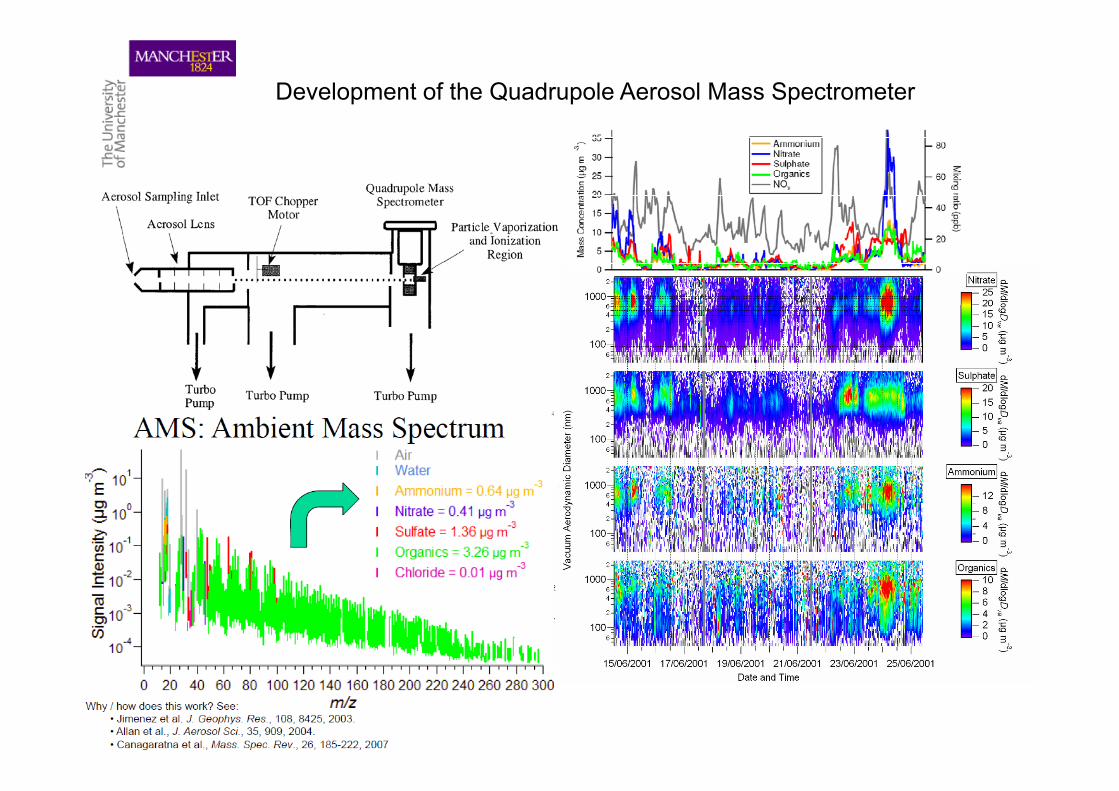
Development of the Quadrupole Aerosol Mass Spectrometer
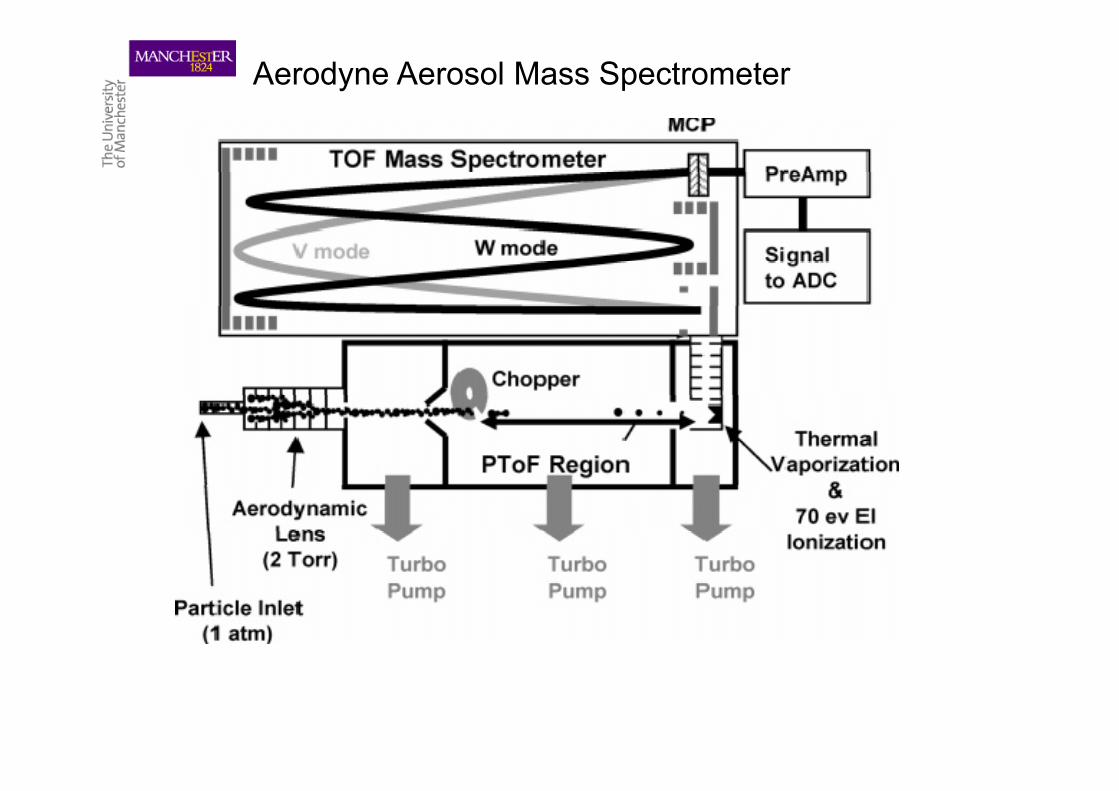
Aerodyne Aerosol Mass Spectrometer
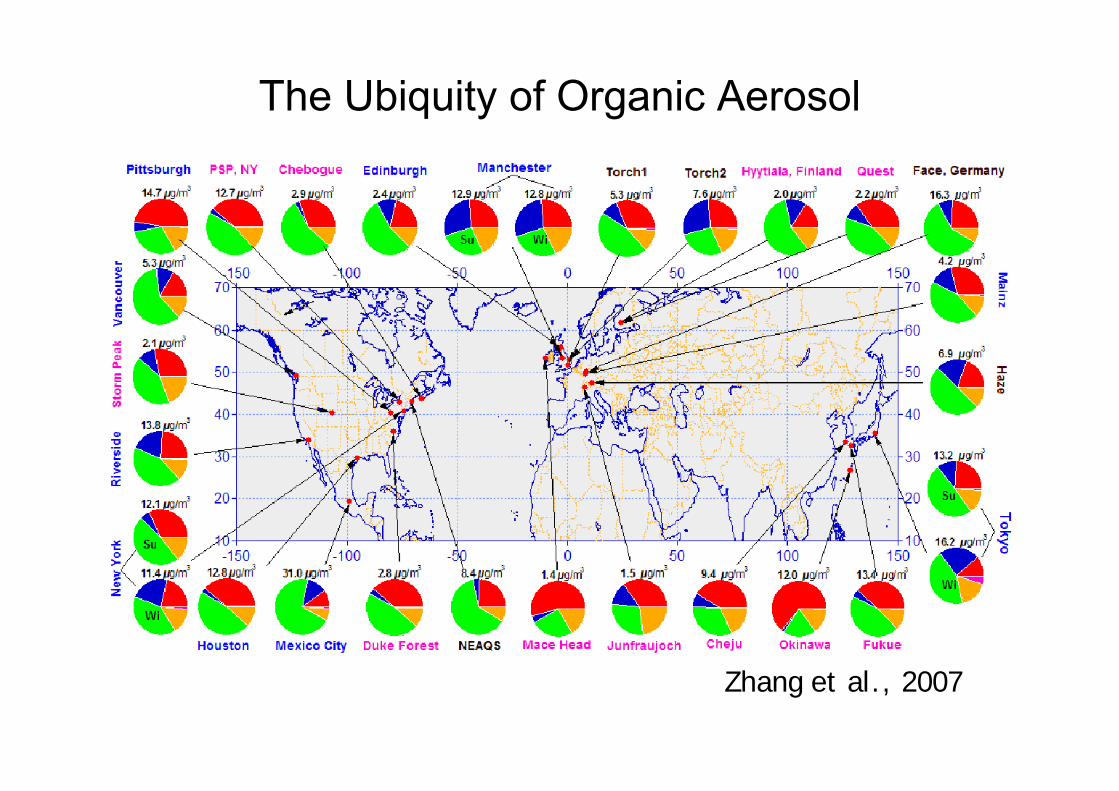
The Ubiquity of Organic Aerosol
Zhang et al., 2007
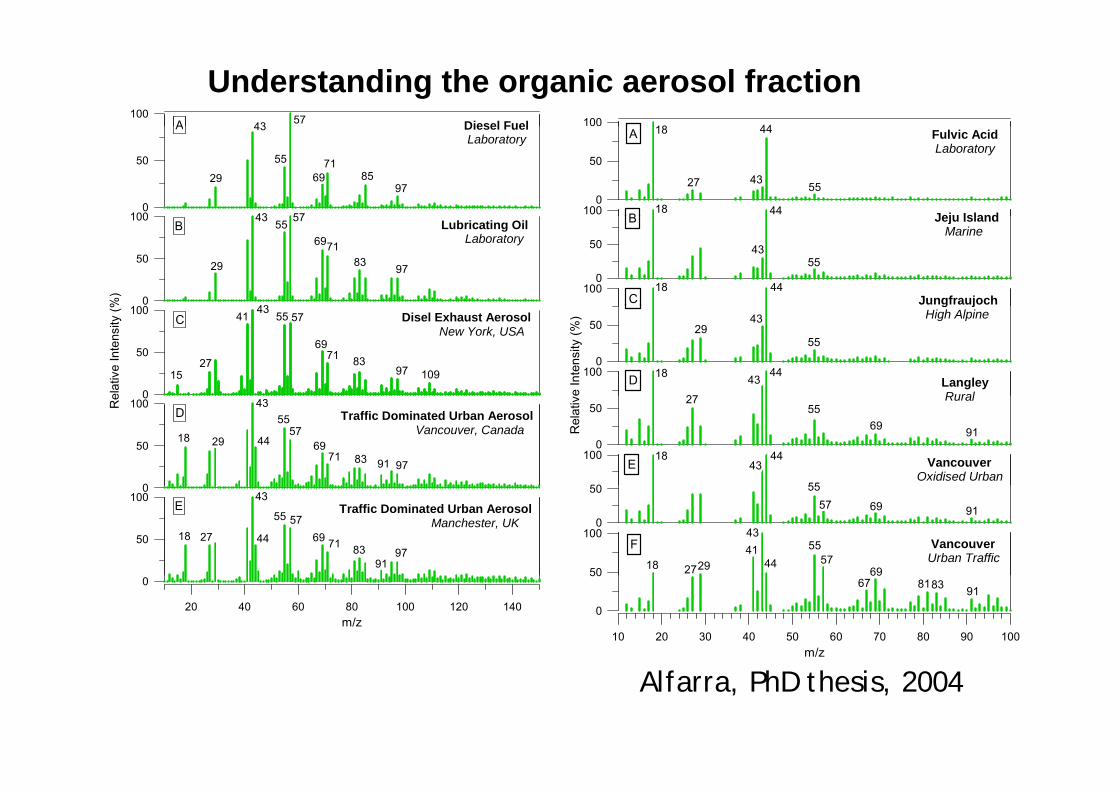
Understanding the organic aerosol fraction100
Diesel FuelA 43 57 100 4418
100
50
0
Diesel Fuel Laboratory
A
29
43
43
55
57
7169 85
97
100
50
0Jeju Island
Fulvic Acid Laboratory
44
44
4355
18
18
27
A
B100
50
0%)
Lubricating Oil Laboratory
B
29
43
43 55 57
7169
83 97
100
50
0
Jeju Island Marine
Jungfraujoch44
4355
18
B
C100
50
0elat
ive
Inte
nsity
(% Disel Exhaust Aerosol New York, USA
C
1527
4341 55 57
7169
8397 109
50
0
e In
tens
ity (%
)
100LangleyRural
g j High Alpine
4443
43
55
18
27
29
D0
Re
100
50
0
Traffic Dominated Urban Aerosol Vancouver, Canada
D
18 29
43
44
5557
7169
83 9791
Rel
ativ
e
50
0100
50
Rural
Vancouver Oxidised Urban
4443
55
18
5569 91
27
E
0100
50
E Traffic Dominated Urban Aerosol Manchester, UK
18 27
43
44
55 57
716983
9197
100
50
50
0
Vancouver Urban Traffic18 2927
4143
4455
5769
5557 69 91
F
14012010080604020m/z
0
100908070605040302010m/z
50
0
6967 8183 91
Alfarra, PhD thesis, 2004
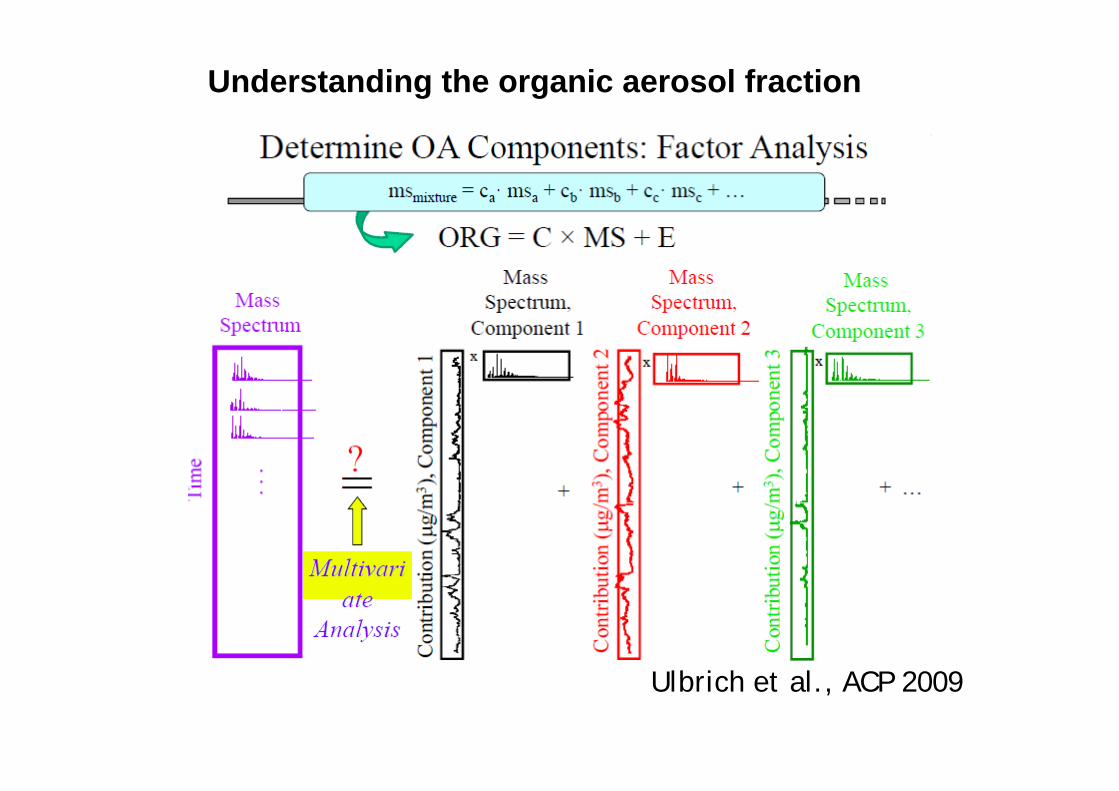
Understanding the organic aerosol fraction
Ulbrich et al., ACP 2009
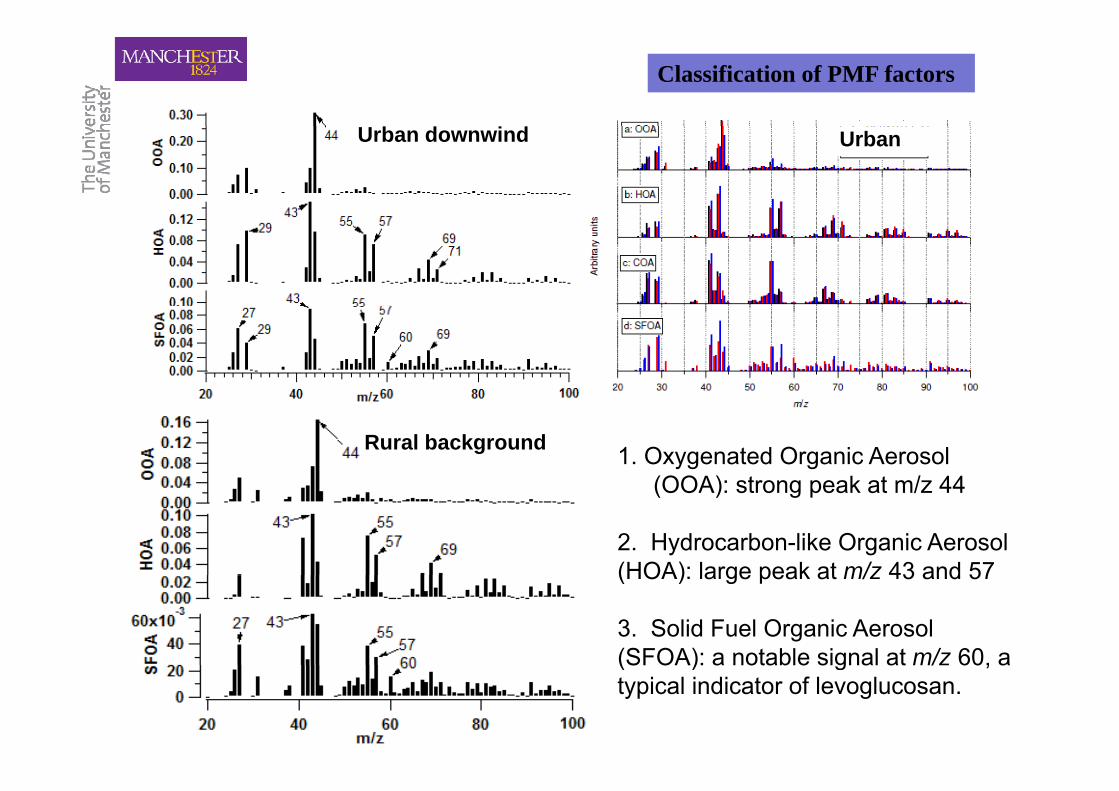
Classification of PMF factors
Urban downwind Urban
Rural background 1. Oxygenated Organic Aerosol (OOA): strong peak at m/z 44(OOA): strong peak at m/z 44
2. Hydrocarbon-like Organic Aerosol (HOA): large peak at m/z 43 and 57(HOA): large peak at m/z 43 and 57
3. Solid Fuel Organic Aerosol (SFOA): a notable signal at m/z 60, a(SFOA): a notable signal at m/z 60, a typical indicator of levoglucosan.
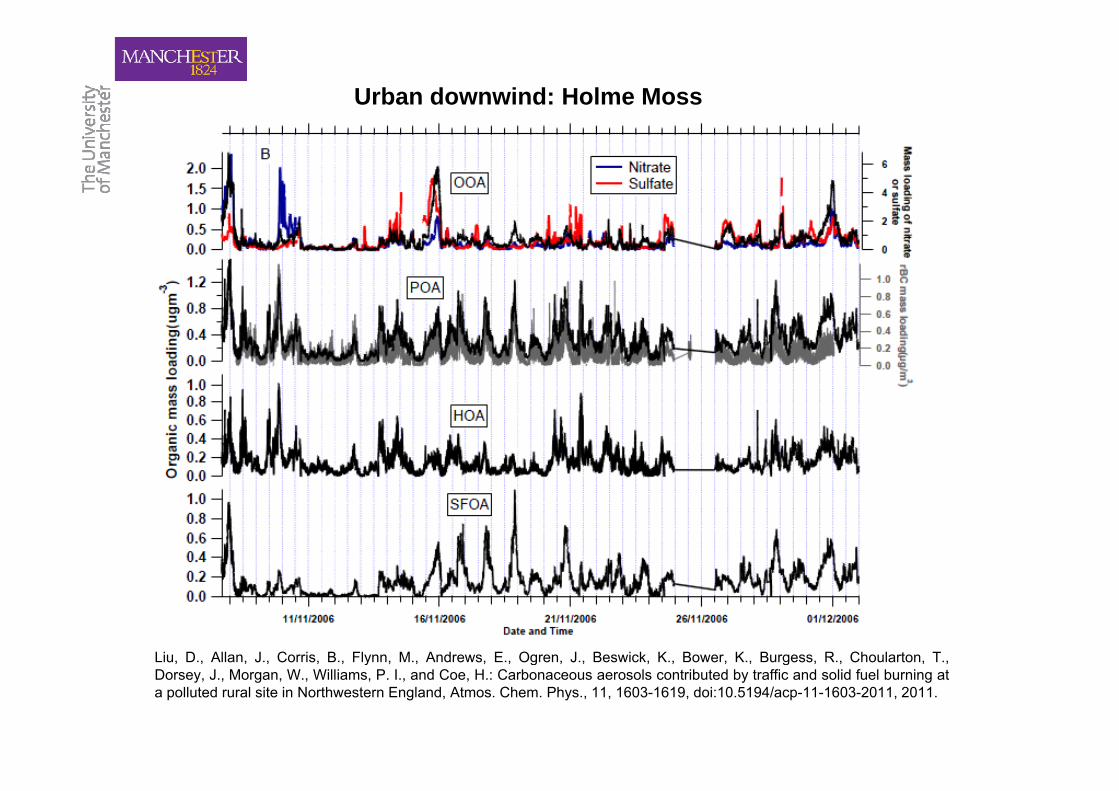
Urban downwind: Holme Moss
Liu, D., Allan, J., Corris, B., Flynn, M., Andrews, E., Ogren, J., Beswick, K., Bower, K., Burgess, R., Choularton, T.,y g gDorsey, J., Morgan, W., Williams, P. I., and Coe, H.: Carbonaceous aerosols contributed by traffic and solid fuel burning ata polluted rural site in Northwestern England, Atmos. Chem. Phys., 11, 1603-1619, doi:10.5194/acp-11-1603-2011, 2011.
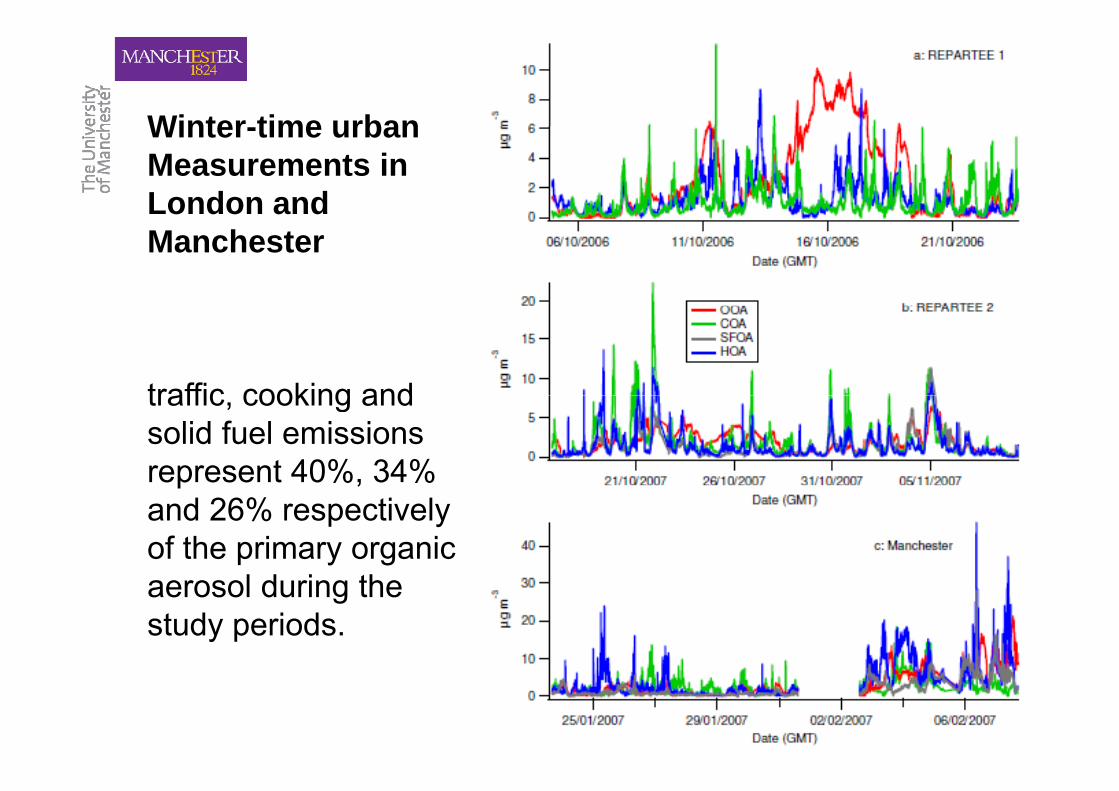
Winter time urbanWinter-time urban Measurements in London and Manchester
traffic cooking andtraffic, cooking and solid fuel emissions represent 40%, 34% p ,and 26% respectively of the primary organic
l d i thaerosol during the study periods.
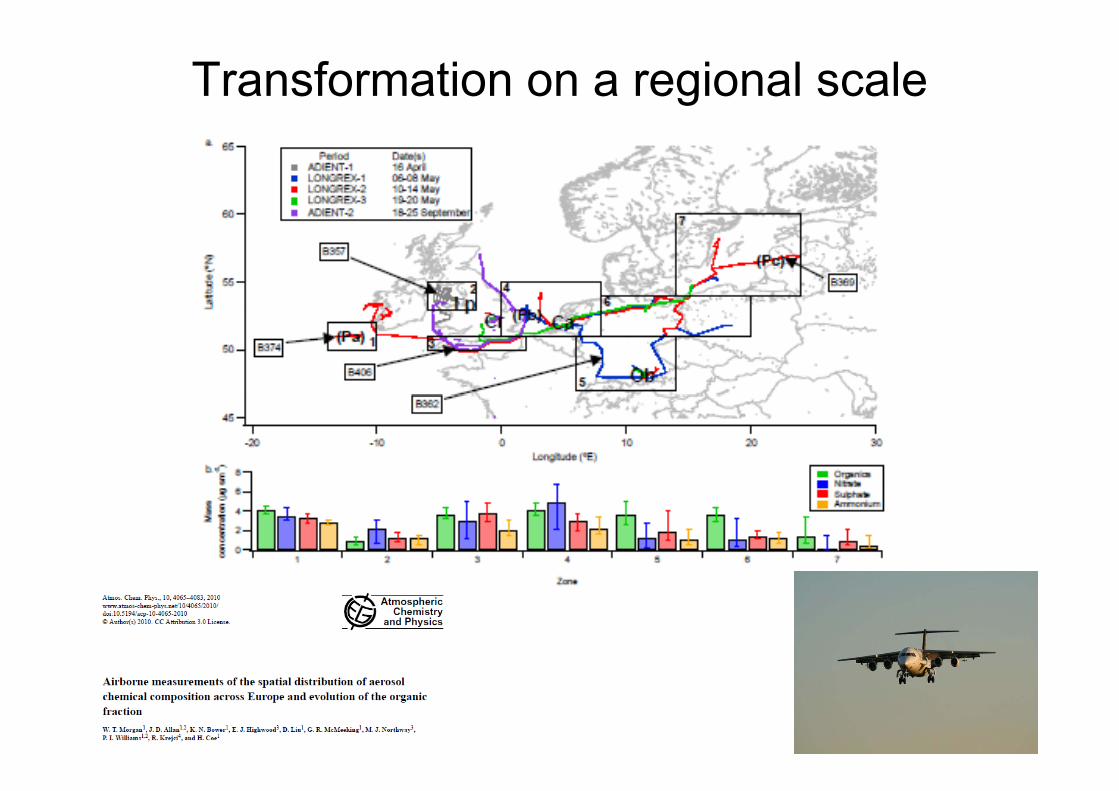
Transformation on a regional scale
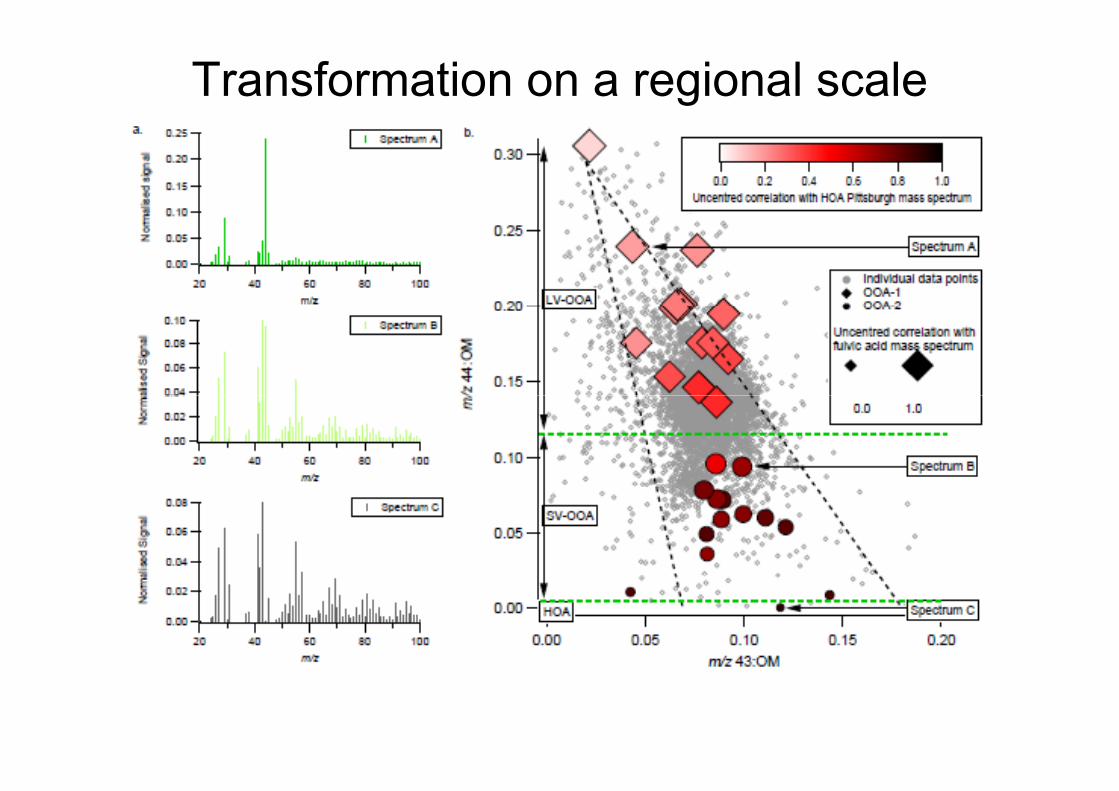
Transformation on a regional scale
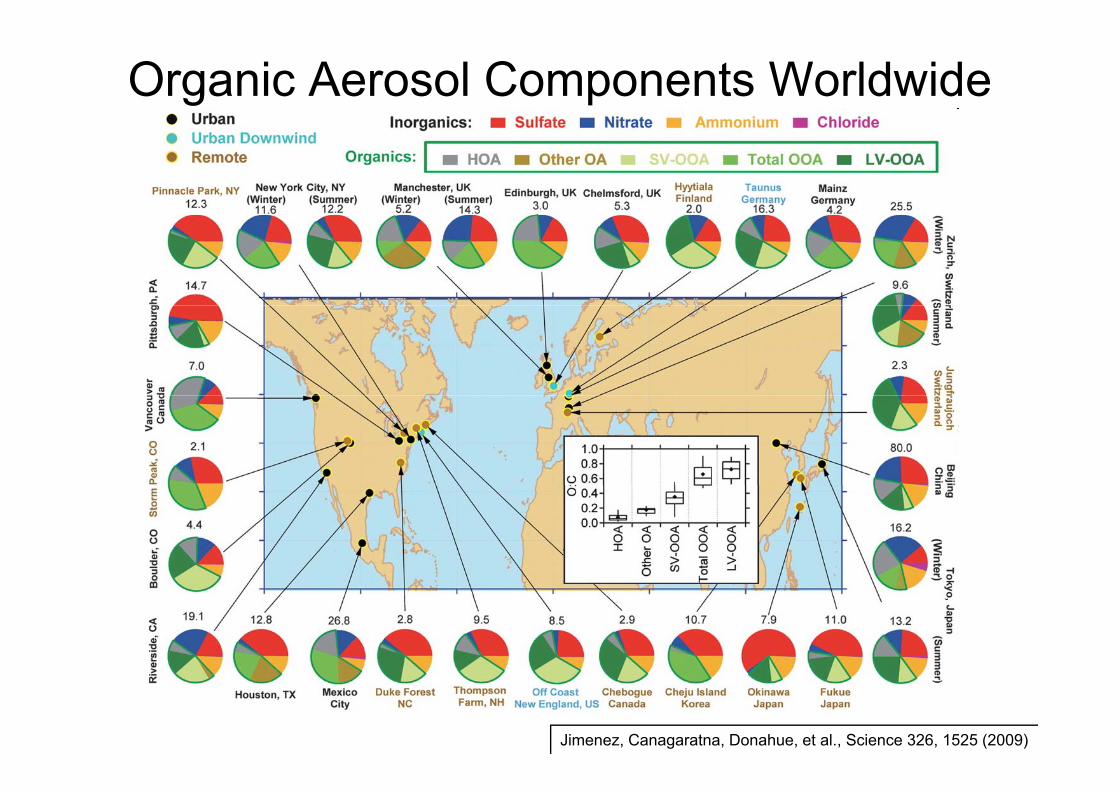
Organic Aerosol Components Worldwide
Jimenez, Canagaratna, Donahue, et al., Science 326, 1525 (2009)
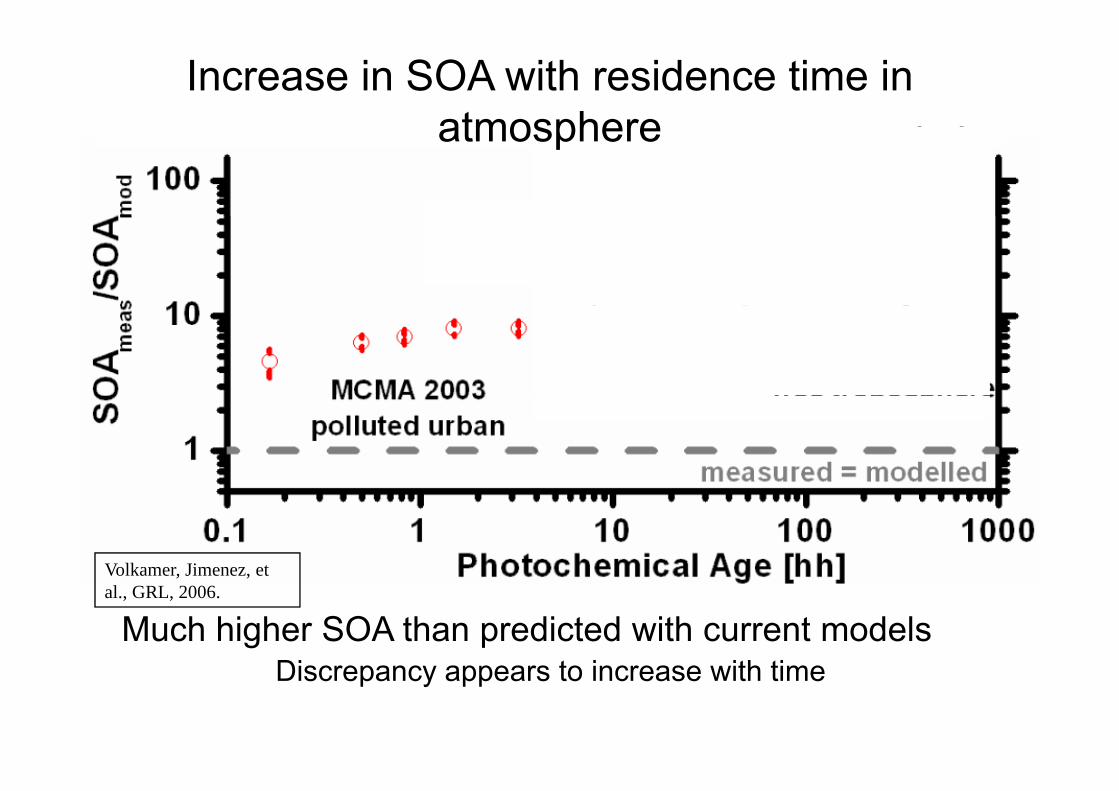
SOA Measurements vs. Models (II)Increase in SOA with residence time in atmosphere ( )
DeGouw et al.Heald et al.
Johnsonet al.
atmosphere
Volkamer, Jimenez, et
Much higher SOA than predicted with current modelsDi t i ith ti
Volkamer, Jimenez, et al., GRL, 2006.
Discrepancy appears to increase with time
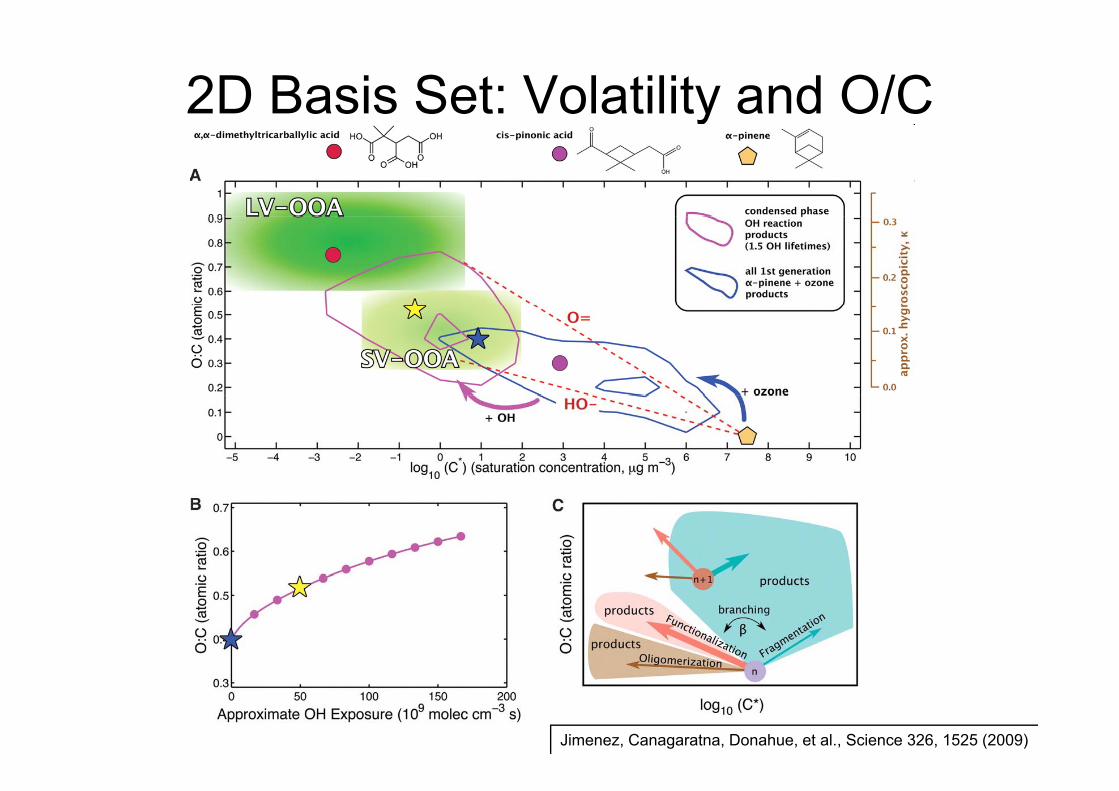
2D Basis Set: Volatility and O/C
Jimenez, Canagaratna, Donahue, et al., Science 326, 1525 (2009)
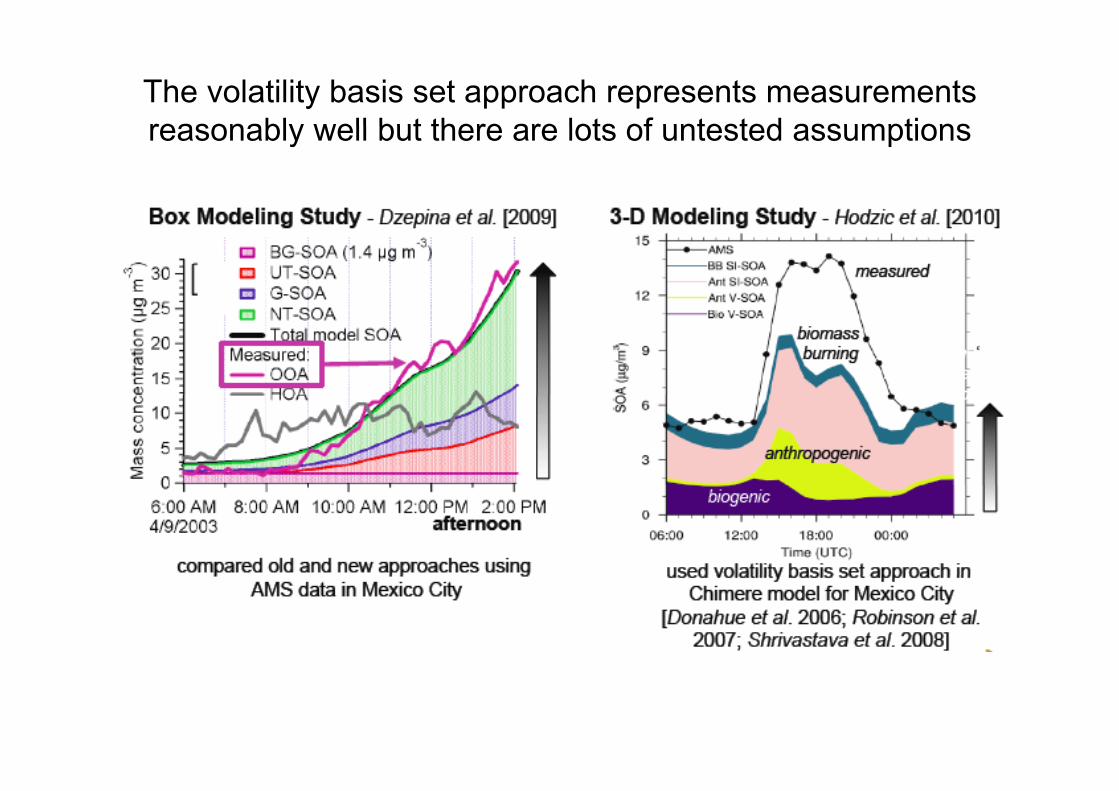
The volatility basis set approach represents measurements reasonably well but there are lots of untested assumptionsreasonably well but there are lots of untested assumptions

Organic Aerosol Components Worldwide
Jimenez, Canagaratna, Donahue, et al., Science 326, 1525 (2009)
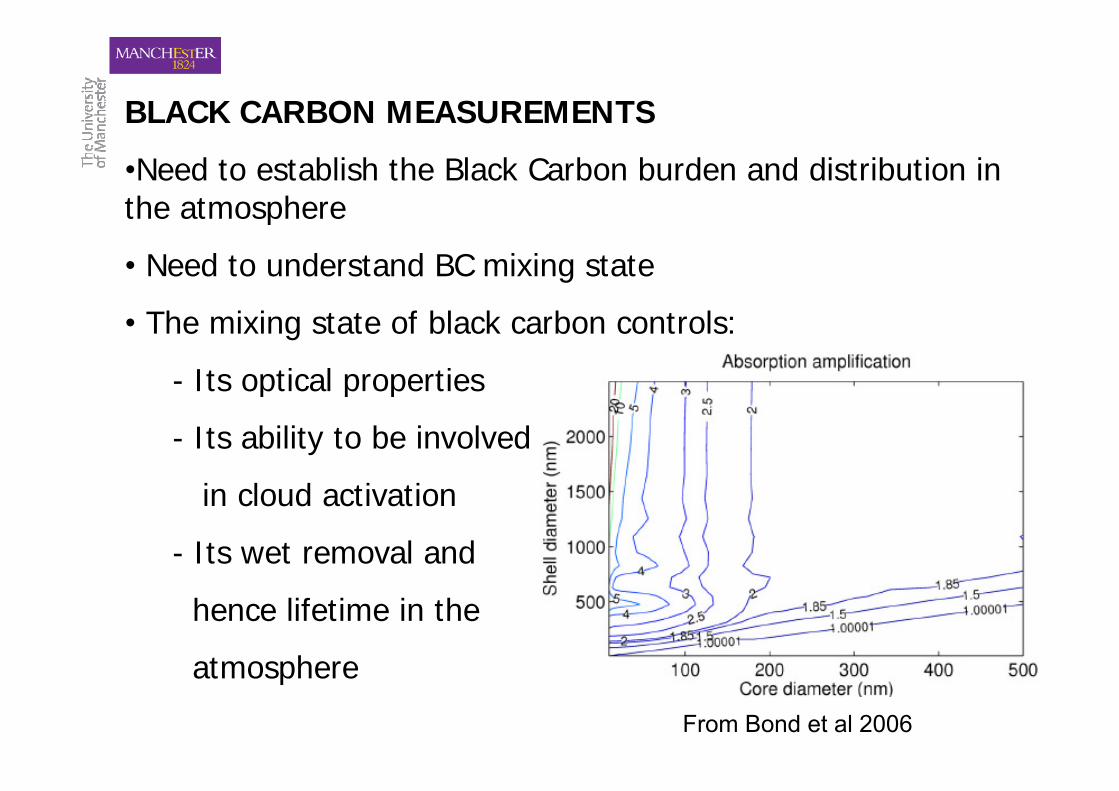
BLACK CARBON MEASUREMENTS
•Need to establish the Black Carbon burden and distribution in the atmospherethe atmosphere
• Need to understand BC mixing state
• The mixing state of black carbon controls:
- Its optical propertiesp p p
- Its ability to be involved
i l d ti tiin cloud activation
- Its wet removal and
hence lifetime in the
atmosphereatmosphere
From Bond et al 2006
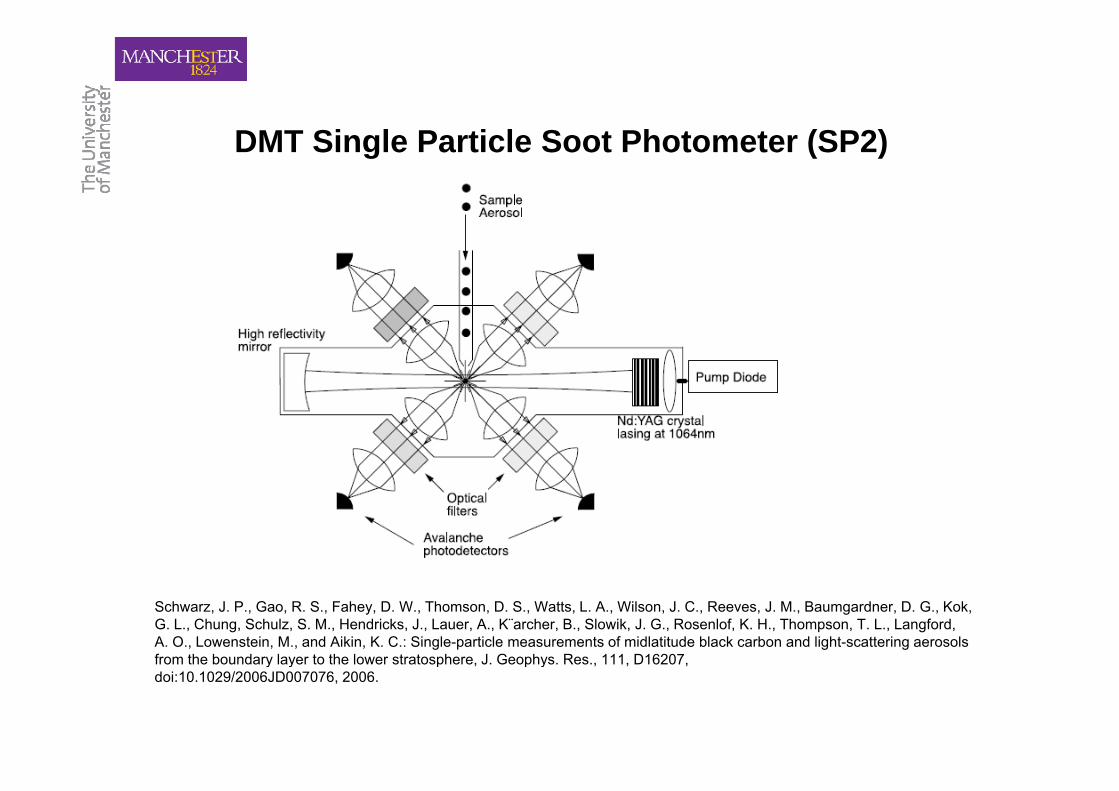
DMT Single Particle Soot Photometer (SP2)
Schwarz, J. P., Gao, R. S., Fahey, D. W., Thomson, D. S., Watts, L. A., Wilson, J. C., Reeves, J. M., Baumgardner, D. G., Kok, G. L., Chung, Schulz, S. M., Hendricks, J., Lauer, A., K¨archer, B., Slowik, J. G., Rosenlof, K. H., Thompson, T. L., Langford, A. O., Lowenstein, M., and Aikin, K. C.: Single-particle measurements of midlatitude black carbon and light-scattering aerosols from the boundary layer to the lower stratosphere, J. Geophys. Res., 111, D16207,y y p , p y , , ,doi:10.1029/2006JD007076, 2006.
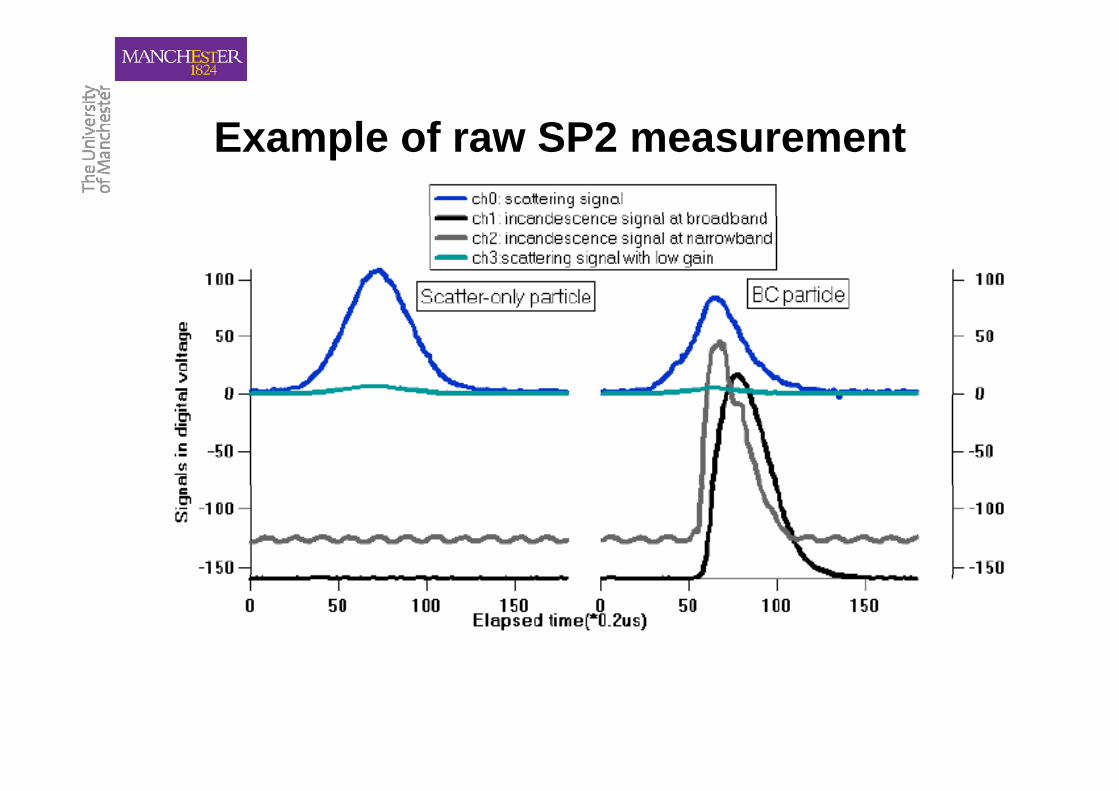
E l f SP2 tExample of raw SP2 measurement
Incandescence high gainLeading edge scatter fitg g
Scatter (TEAPD)
Scatter
Scatter (TEAPD)
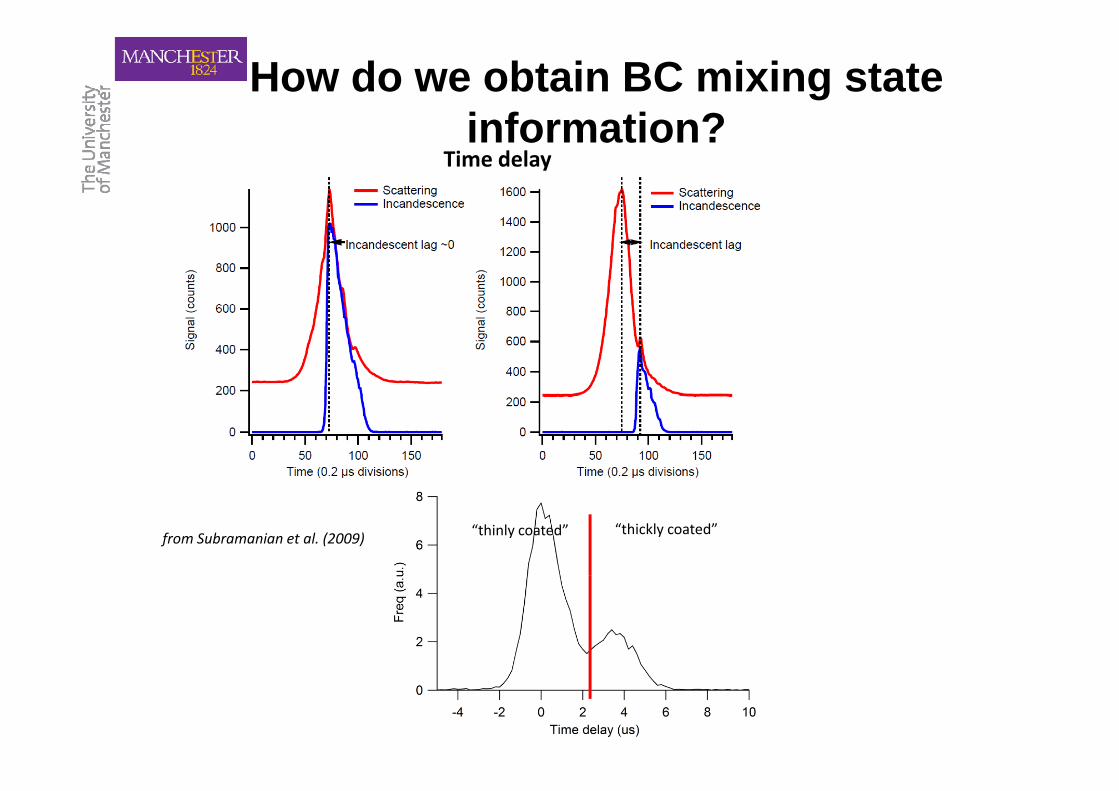
How do we obtain BC mixing state information?information?
Time delay
from Subramanian et al. (2009) “thickly coated”“thinly coated”
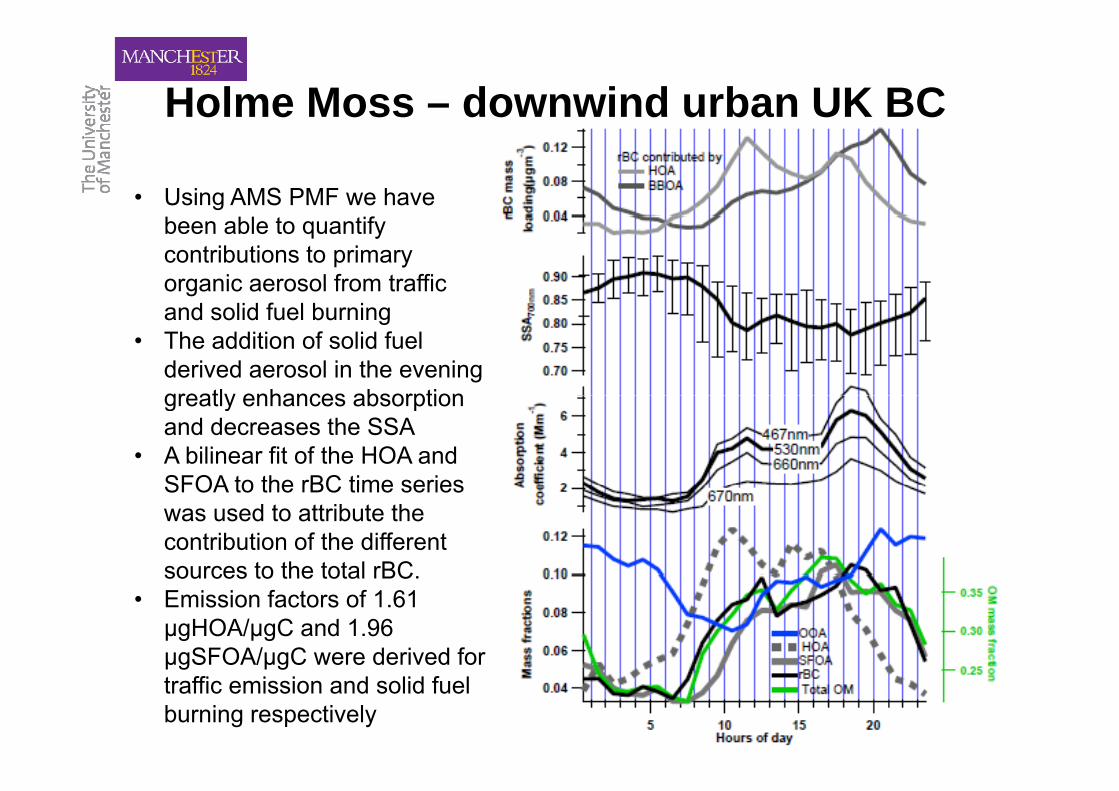
Holme Moss – downwind urban UK BC
• Using AMS PMF we have been able to quantify contributions to primary organic aerosol from traffic
d lid f l b iand solid fuel burning• The addition of solid fuel
derived aerosol in the evening greatly enhances absorptiongreatly enhances absorption and decreases the SSA
• A bilinear fit of the HOA and SFOA to the rBC time seriesSFOA to the rBC time series was used to attribute the contribution of the different sources to the total rBCsources to the total rBC.
• Emission factors of 1.61 μgHOA/μgC and 1.96 μgSFOA/μgC were derived for μgS O /μgC e e de ed otraffic emission and solid fuel burning respectively
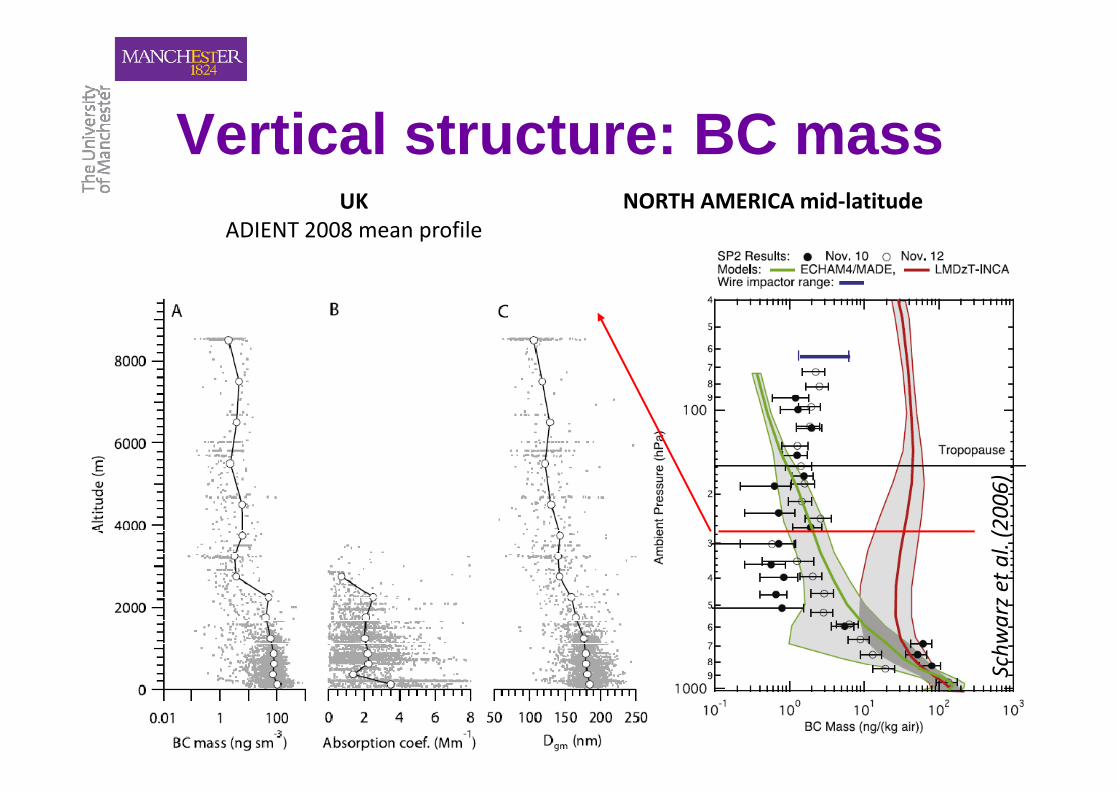
Vertical structure: BC massVertical structure: BC massNORTH AMERICA mid‐latitudeUK
ADIENT 2008 mean profile
6)t a
l. (2006
chwarz e
tSc
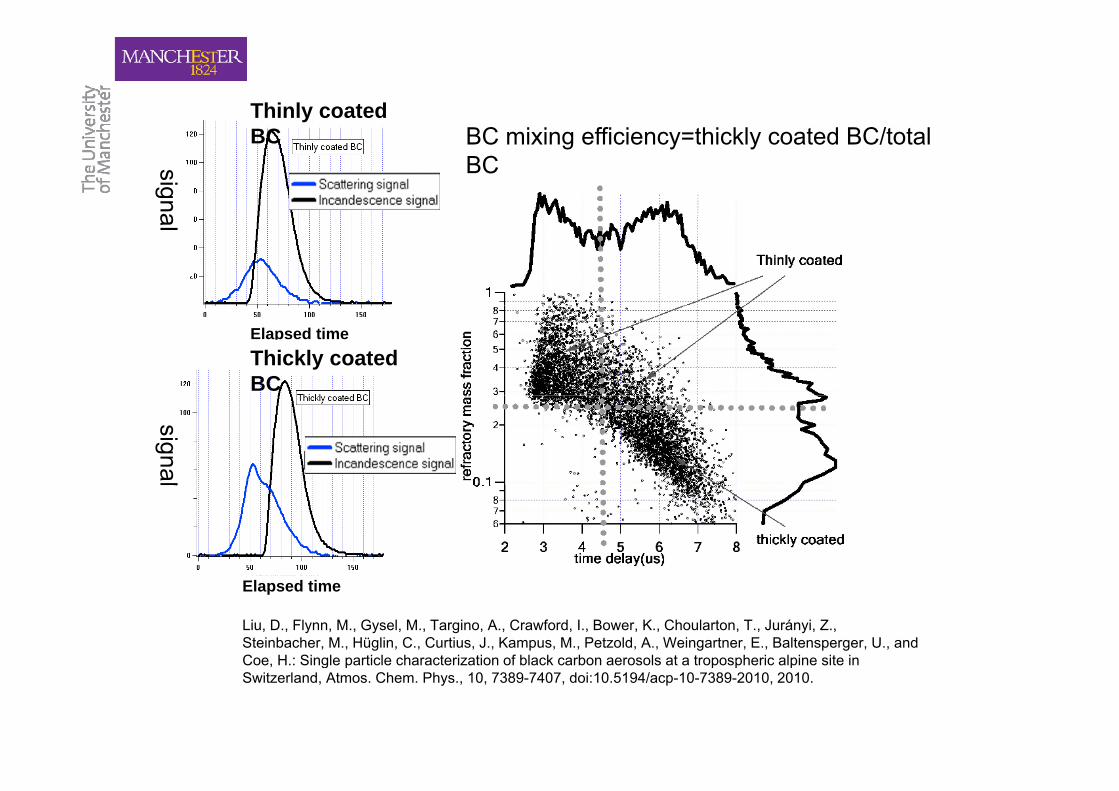
Thinly coated
signa
BC BC mixing efficiency=thickly coated BC/total BC
al
Elapsed timeThickly coated BC
signal
Liu, D., Flynn, M., Gysel, M., Targino, A., Crawford, I., Bower, K., Choularton, T., Jurányi, Z., Steinbacher, M., Hüglin, C., Curtius, J., Kampus, M., Petzold, A., Weingartner, E., Baltensperger, U., and Coe, H.: Single particle characterization of black carbon aerosols at a tropospheric alpine site in
Elapsed time
Coe, H.: Single particle characterization of black carbon aerosols at a tropospheric alpine site in Switzerland, Atmos. Chem. Phys., 10, 7389-7407, doi:10.5194/acp-10-7389-2010, 2010.
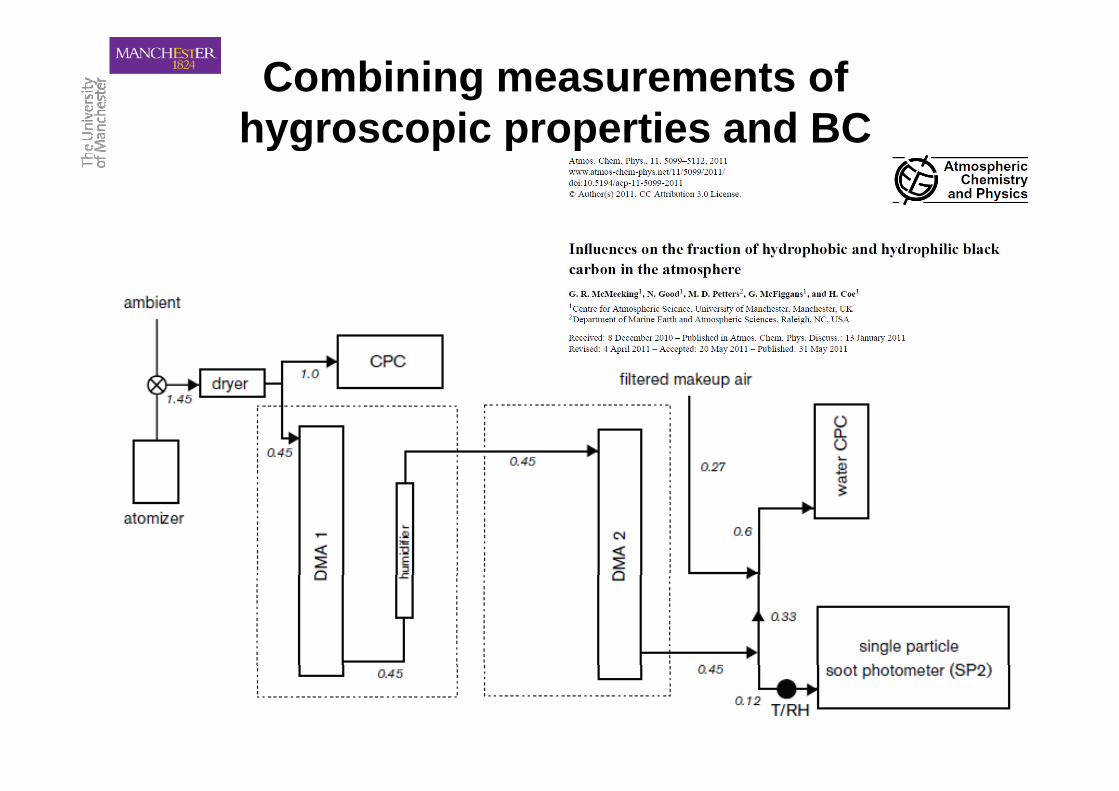
Combining measurements of hygroscopic properties and BChygroscopic properties and BC
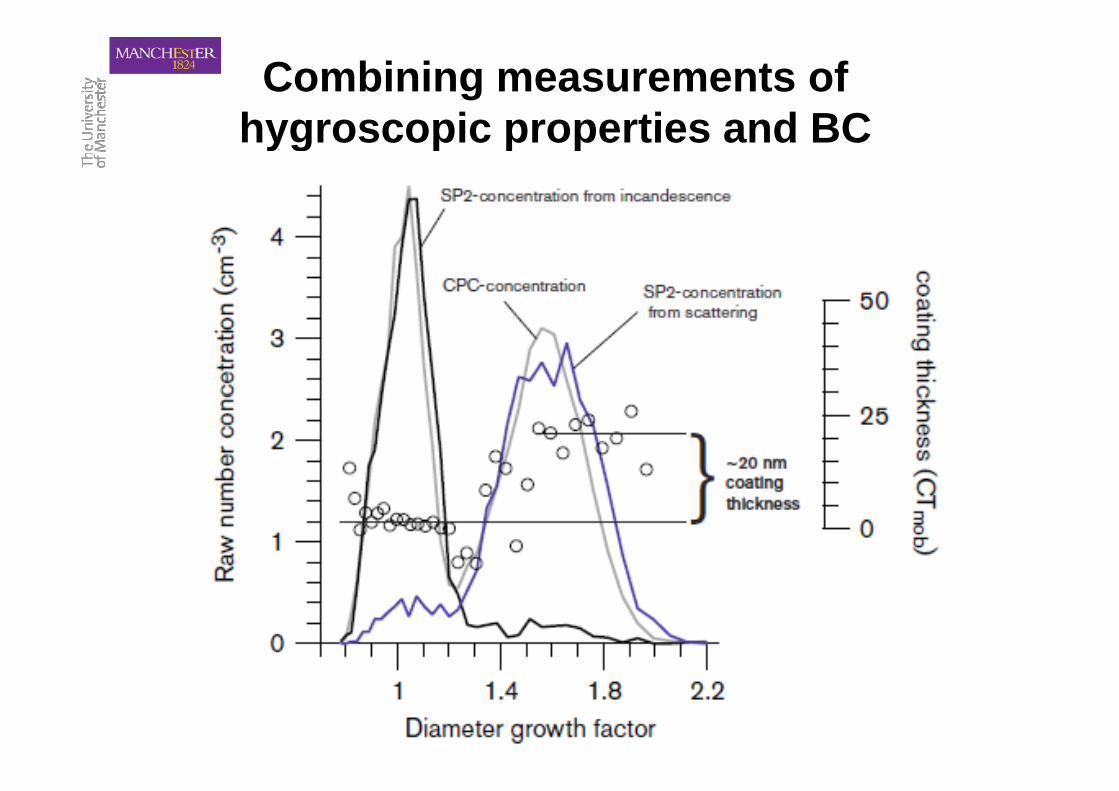
Combining measurements of hygroscopic properties and BChygroscopic properties and BC
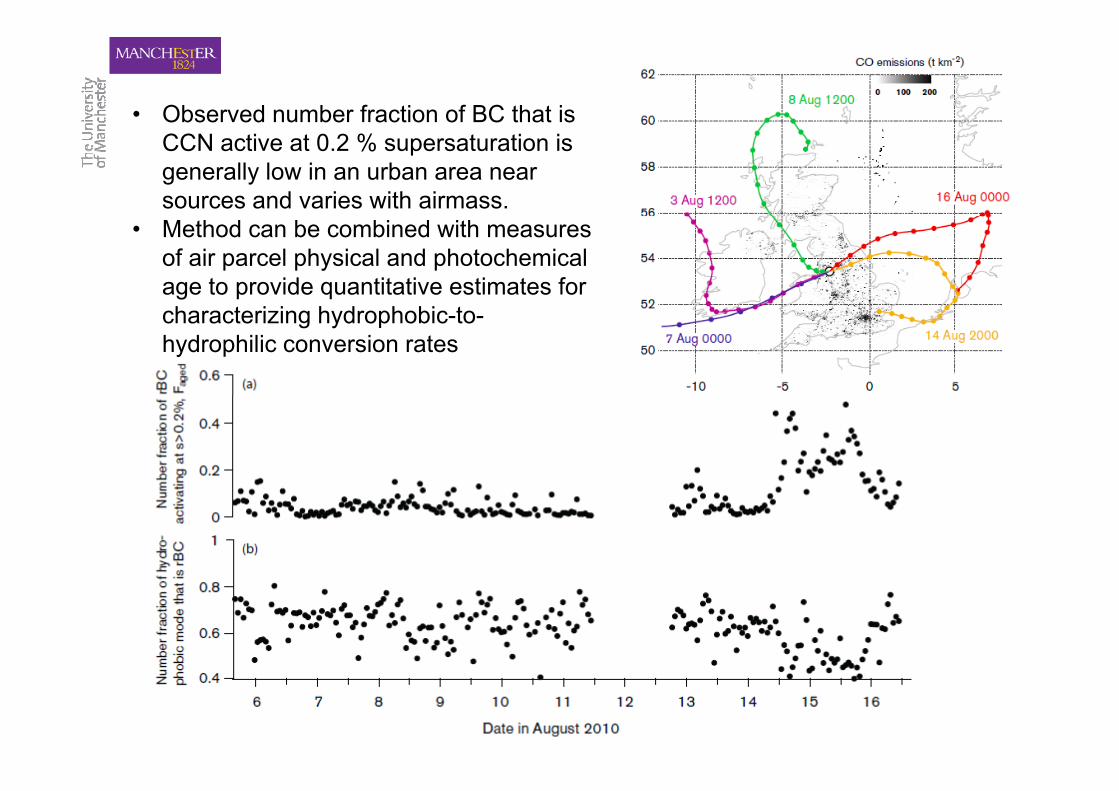
• Observed number fraction of BC that is CCN active at 0.2 % supersaturation is generally low in an urban area near sources and varies with airmass.
• Method can be combined with measures of air parcel physical and photochemical age to provide quantitative estimates for characterizing hydrophobic-to-hydrophilic conversion rates
SUMMARYSUMMARY• Recent measurements of organic aerosol have delivered
new insight into organic aerosol ubiquity and abundance• Novel mass spectrometric methods are being rapidly
developed to probe organic complexity and quantify organic processing in the atmosphereorganic processing in the atmosphere
• Measurements of black carbon on a particle by particle basis are delivering new information on its sizebasis are delivering new information on its size distribution and behaviour in the atmosphere
• Rapid advances in mass spectrometric and optical methods are rapidly increasing our ability to quantify key aerosol properties in the atmosphereaerosol properties in the atmosphere
Measurement Platforms2. How we measured aerosol in Borneo
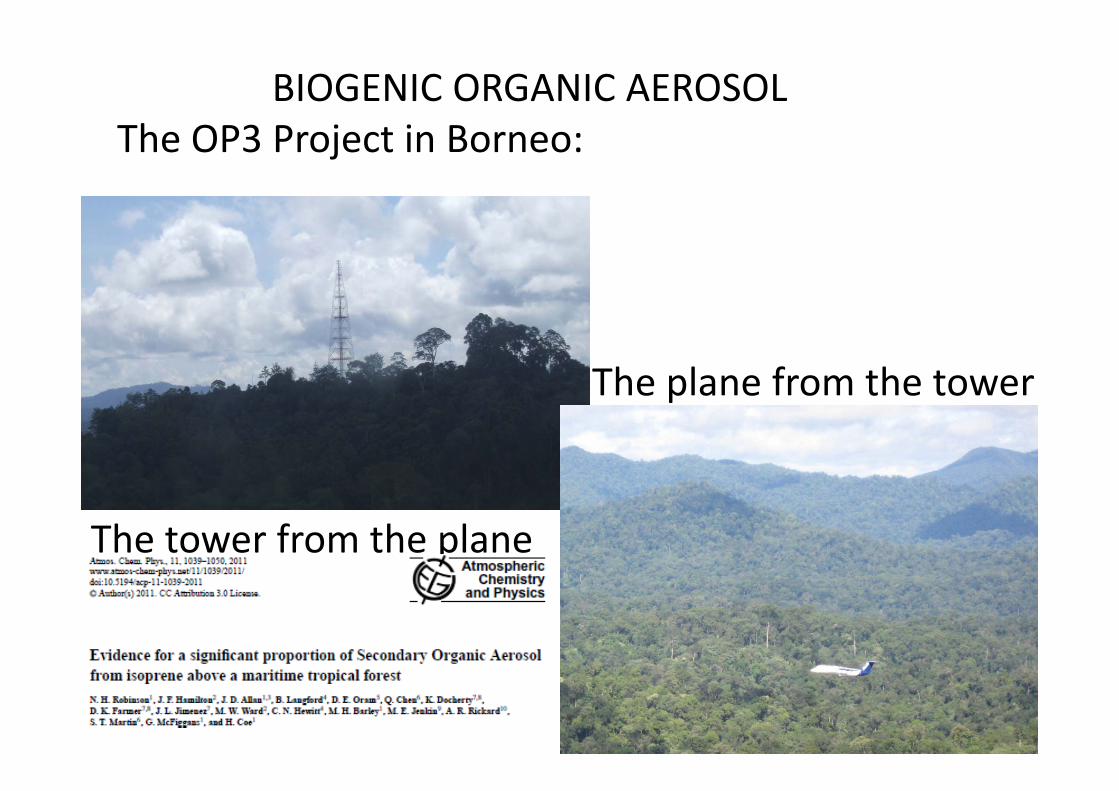
BIOGENIC ORGANIC AEROSOLTh OP3 P j i BMeasurement PlatformsThe OP3 Project in Borneo:
The plane from the towere p a e o t e to e
The tower from the plane
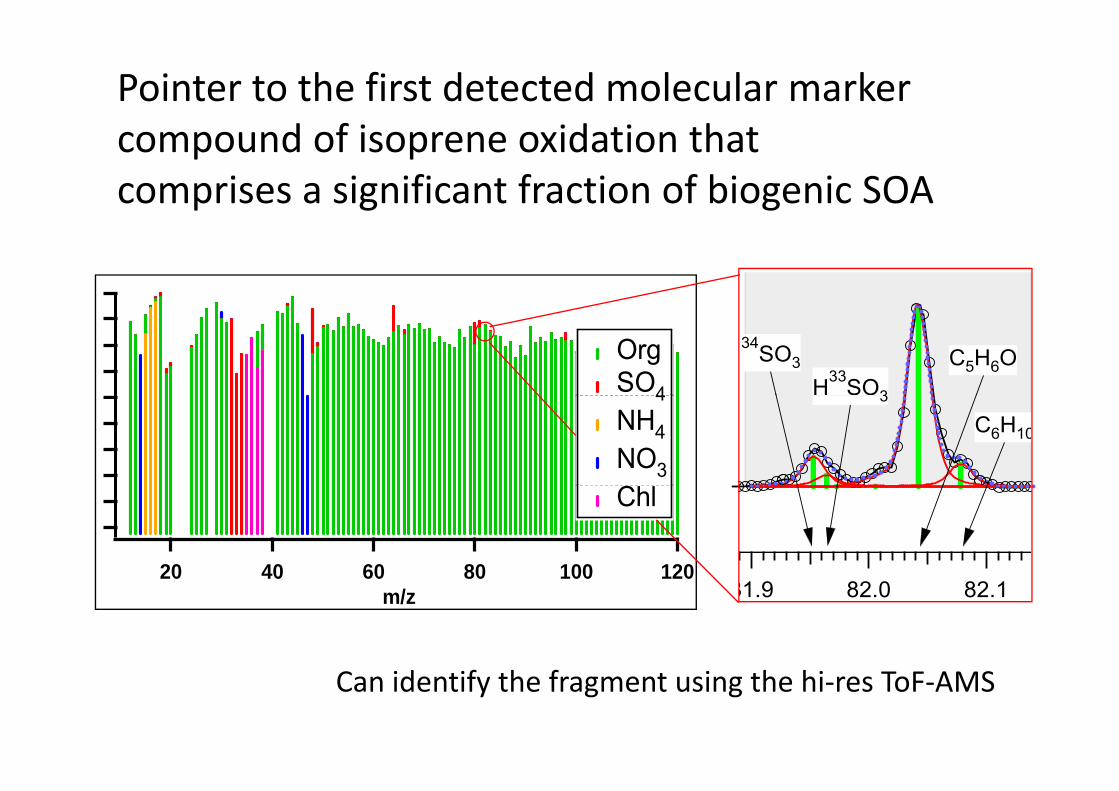
Identification of the 82 peak5. Organic AnalysisPointer to the first detected molecular marker
d f i id i hIdentification of the 82 peakcompound of isoprene oxidation that comprises a significant fraction of biogenic SOA
Org SO4
34SO3
H33SO3
C5H6O4
NH4 NO3
3
C6H10
12010080604020
Chl
12010080604020m/z 82.182.081.9
Can identify the fragment using the hi‐res ToF‐AMS
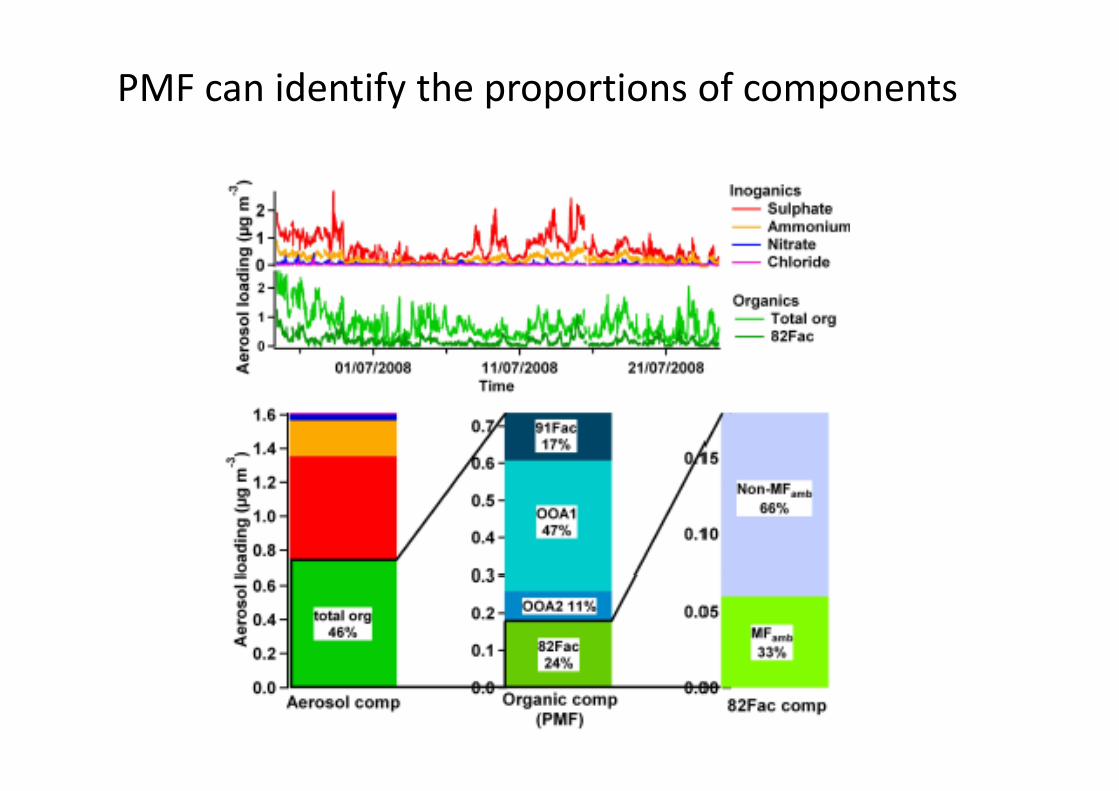
Identification of the 82 peak5. Organic AnalysisPMF can identify the proportions of components
Identification of the 82 peak
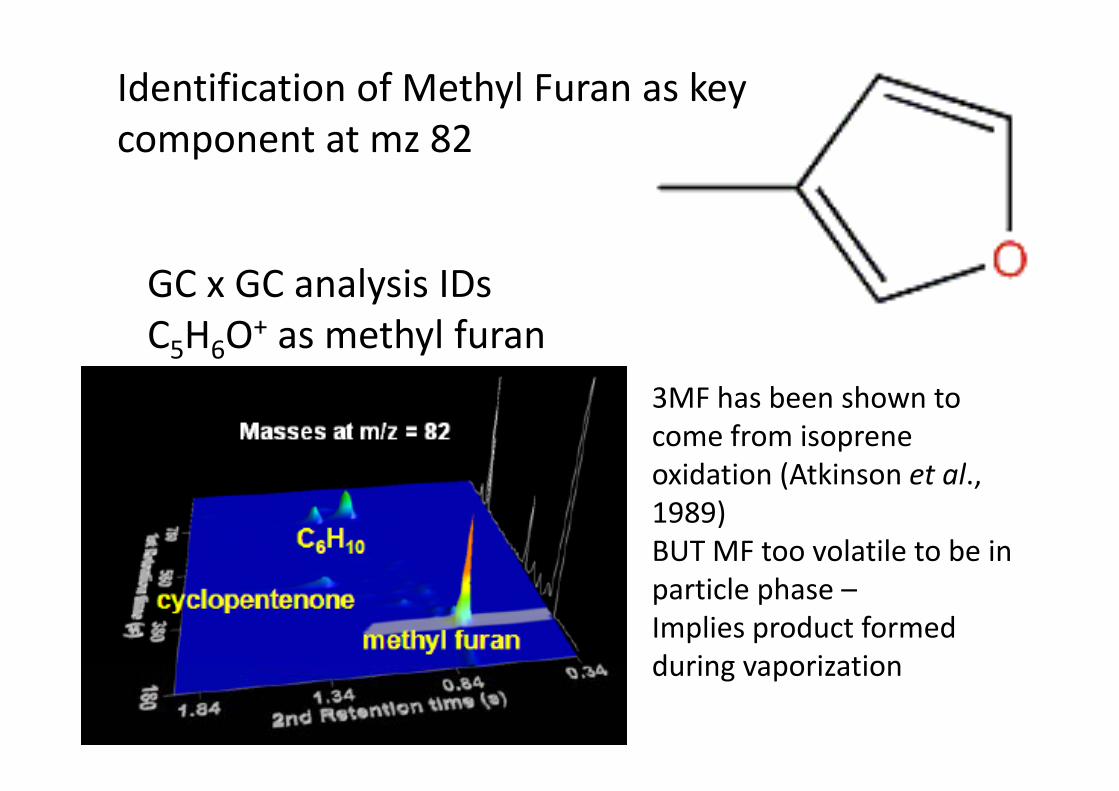
Identification of the 82 peak5. Organic AnalysisIdentification of Methyl Furan as key
82Identification of the 82 peakcomponent at mz 82
GC x GC analysis IDs C5H6O+ as methyl furan
3MF has been shown to3MF has been shown to come from isoprene oxidation (Atkinson et al., ( ,1989)BUT MF too volatile to be in particle phase –Implies product formed during vaporizationduring vaporization
Identification of the 82 peak5. Organic Analysis
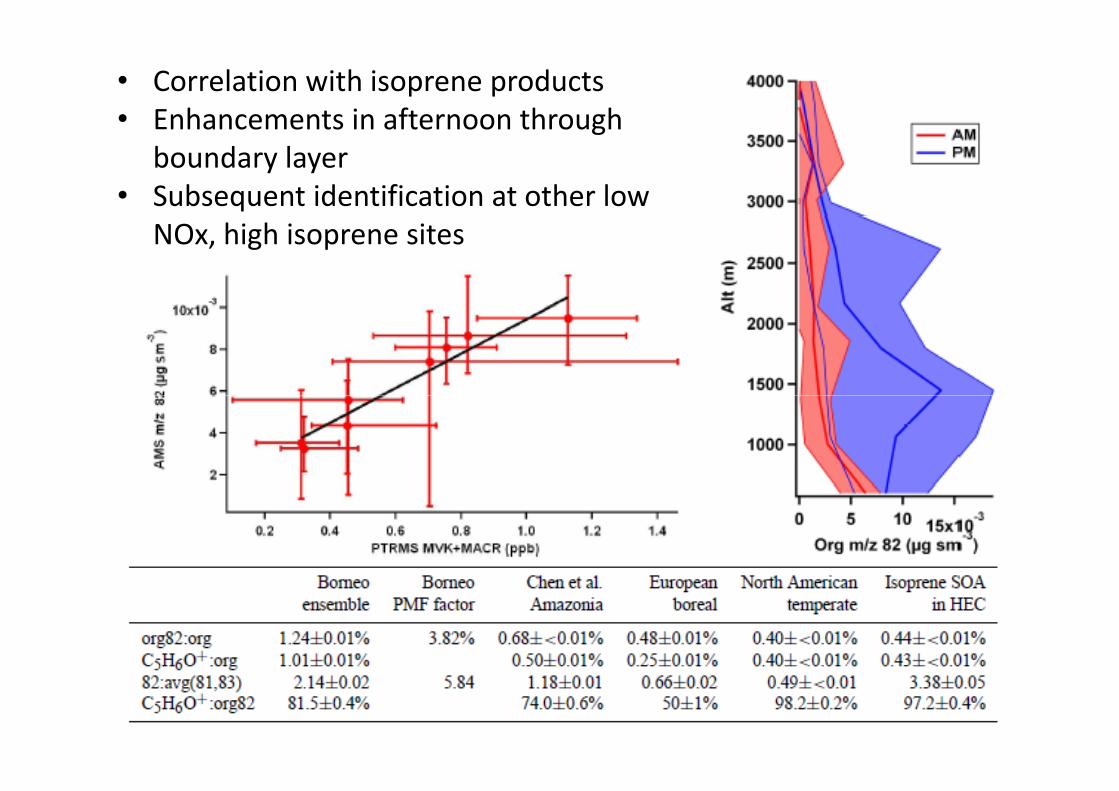
• Correlation with isoprene products• Enhancements in afternoon throughIdentification of the 82 peakEnhancements in afternoon through
boundary layer• Subsequent identification at other low
NOx, high isoprene sites
Identification of the 82 peak5. Organic AnalysisSUMMARY OF FINDINGS
Identification of the 82 peak• Methyl Furan identified in ambient samples during low
NOx‐high isoprene conditionsNOx high isoprene conditions• Likely MF is produced during measurement through
volatilisation • Precursor requires laboratory identification• Ubiquity of mz 82 at other low NOx, high isoprene sites
suggests mechanism important across all of the unpolluted tropics.
h h h• Suggestion is that there is an enhancement in presence of acids notably from sulphate
• Anal sis s ggests that an a erage of 23% (0 18 gm‐3)• Analysis suggests that an average of 23% (0.18 ugm‐3) and up to 53% (0.5 ugm‐3) of the organic aerosol may be produced from isoprene oxidation in Borneoproduced from isoprene oxidation in Borneo


![Re#analysis*of*tropospheric*aerosols*for*the*period*1980#2005* … · 2018-12-03 · atmospheric,chemistry., GAS-PHASE TROPOSPHERIC CHEMISTRY MOZART2.4 [O3-NOx-CO-CH4-NMHC] Temperature,](https://img.pdfslide.us/doc/110x75/5ec725f88da7136c5f6fb38d/reanalysisoftroposphericaerosolsfortheperiod19802005-2018-12-03-atmosphericchemistry.jpg)