Embed Size (px)
Citation preview
A Low-cost Calibration Facility for High-Frequency Acoustic Backscatter Instruments
D. Lemon, M. Clarke, P. Johnston, J. Buermans
ASL Environmental Sciences Inc., Victoria, B.C. Canada [email protected]
M. Taillefer
Maritime Way Scientific Ltd., Ottawa, ON. Canada
Abstract— Full-system calibration of acoustic instruments used to measure high-frequency backscatter from zooplankton and small fish in the ocean is required if the data are to be used to estimate biomass and populations from signals at different frequencies. Here we describe a test tank facility for calibrating high-frequency, narrow-band sonars operating at one or more frequencies from 125 kHz to 775 kHz and with beam-widths between 1.8 and 11 degrees. The all steel tank is cylindrical with a diameter of 2.43 metres and a length of 6.10 metres and holds 28.5 cubic metres of water. The absorbing material on the end wall is a coarse artificial turf which is easily available at minimal cost and reduces high-frequency reverberations in the tank to negligible levels after 6 reflections. Pulsed operation at pinging rates up to 10 Hz is therefore possible without interference from reverberations. Echoes from the target are recorded over a series of pings; the difference between the target strength computed from the mean of those echoes and the known target strength is a measure of the accuracy of the nominal instrument response calculated from the manufacturer’s transducer characteristics and bench measurements of the system electronics, and therefore allows a calibration correction to be made. An acoustic propagation model of the tank has also been developed to characterize the response of instruments placed in it and to identify optimum target placements.
I. INTRODUCTION Underwater acoustic instruments operating at high
frequencies are an increasingly important component of oceanographic measurements, for both physical and biological research. The necessity to have accurate measurements in coastal, open and arctic waters is becoming increasingly important and methods to test and calibrate these instruments are vital for effective operational measurements. Testing them during manufacturing or before use and calibrating them requires a convenient way to operate them in water under controlled conditions. A water tank large enough to accommodate propagation paths up to a few metres in length can provide that, if its acoustic characteristics are understood.
ASL Environmental Sciences (ASL) manufactures active sonar instruments for measuring ice draft and water column backscatter, operating at frequencies between 125 kHz and 775 kHz and with beam-widths between 1.8 and 11 degrees. A recent move of the company to new premises allowed ASL to acquire and install a new acoustic testing tank (Fig. 1) that can accommodate the frequencies and beam-widths of instruments used at ASL. The primary requirement and feature of the new test tank was to allow targets to be placed at known distances and angles from the instrument transducer without interference
(and reverberation) from sidelobe scattering from the boundaries.
Figure 1. ASL Acoustic Testing Tank
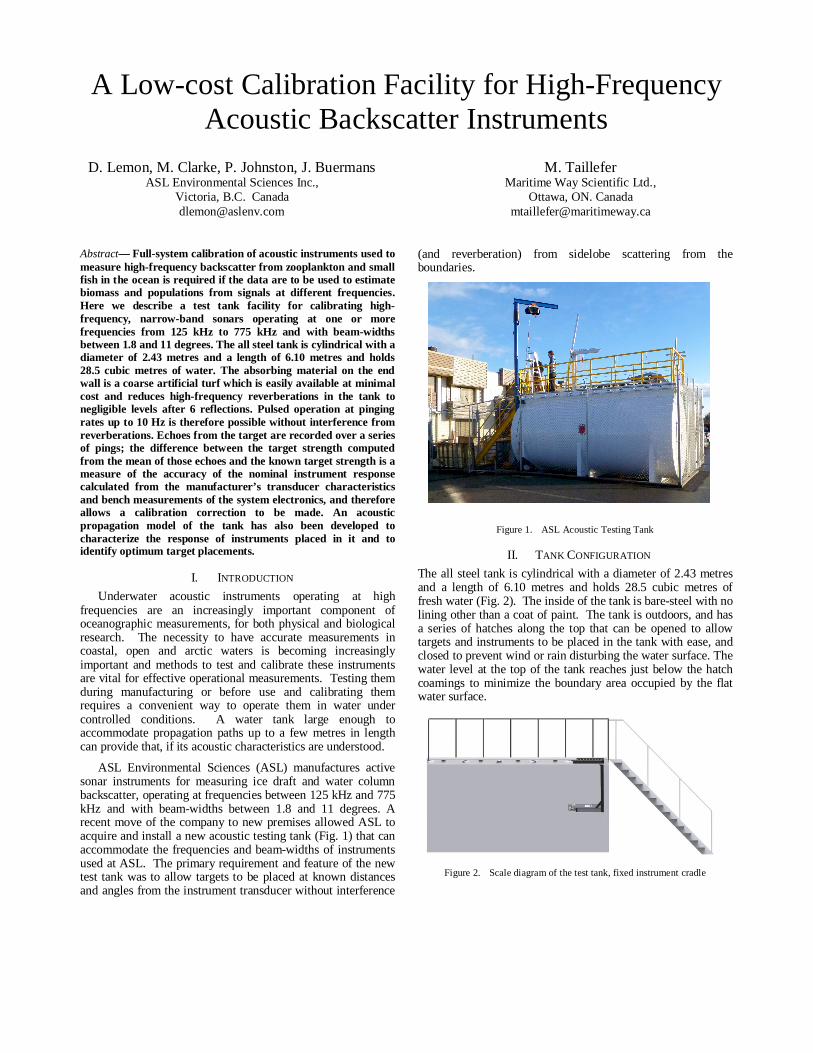
II. TANK CONFIGURATION The all steel tank is cylindrical with a diameter of 2.43 metres and a length of 6.10 metres and holds 28.5 cubic metres of fresh water (Fig. 2). The inside of the tank is bare-steel with no lining other than a coat of paint. The tank is outdoors, and has a series of hatches along the top that can be opened to allow targets and instruments to be placed in the tank with ease, and closed to prevent wind or rain disturbing the water surface. The water level at the top of the tank reaches just below the hatch coamings to minimize the boundary area occupied by the flat water surface.
Figure 2. Scale diagram of the test tank, fixed instrument cradle
From preliminary cursory modeling efforts, it was evident that all ray paths from a sound source would bounce off the cylindrical walls and reflect from the back end of the tank. Subsequently, an absorbing material was placed on the end wall to reduce reverberations in the tank. The absorbing material was chosen to be a coarse artificial turf which was easily available at minimal cost. As a result, the cylindrical shape and smooth, highly-reflective sidewalls combined with the absorbing material on the end wall produced an environment largely free of interfering echoes originating between the instrument (positioned on the tank centreline at one end) and the other end of the tank, thus allowing target spheres of known TS to be placed at ranges between 1.5 and 5 metres from the transducer.
The mounting and alignment mechanism (Figure 3) allows transducers to be positioned within 0.1 mm vertically and aimed with a precision of 0.1 °. In an effort to create the best water conditions inside the tank, a pump is used to circulate water and prevent temperature stratification.
Figure 3. Mounting and alignment mechanisms.
III. REVERBERATION SUPPRESSION Acoustic output measurements or testing in general can be
strongly affected by reflections or echoes from the test tank walls. This is particularly true for continuous-wave or rapidly-pulsed applications. To overcome this, the test tank needed to be coated with a lining which had to be of low ultrasonic reflection yet highly absorbent to ultrasound. The tank’s smooth steel interior walls are highly reflective and produce long-lasting (>1 second) reverberation, which can interfere with test and calibration measurements. Since transmissions from the instruments are all sent forward to the opposite end, with almost no backscatter from sidelobe interactions with the walls, reducing the reflectivity of the end wall would suppress the reverberation considerably.
Anechoic tiles (polyurethane or other similar materials) are available from various manufacturers at costs ranging from $1,250 USD to as high as $2,500 USD per square metre. To line the whole tank (~ 126 sq. m) could reach over $100,000.00 USD in anechoic materials Since all ray paths reflect off the walls towards the back end of the tank, modeling results indicated that simple materials such as carpeting or artificial turf (with a sound dispersing shag) might produce an adequate reduction in reflectivity at much lower costs. Tests of several such materials found that doormats of a coarse artificial turf
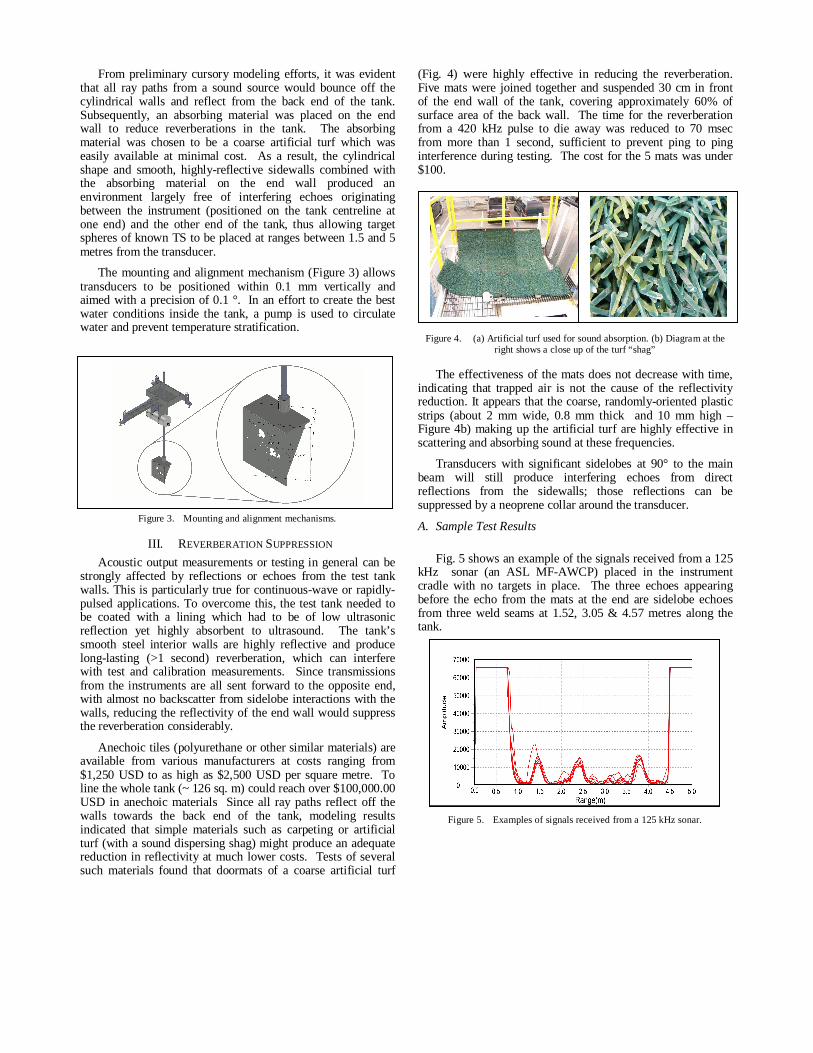
(Fig. 4) were highly effective in reducing the reverberation. Five mats were joined together and suspended 30 cm in front of the end wall of the tank, covering approximately 60% of surface area of the back wall. The time for the reverberation from a 420 kHz pulse to die away was reduced to 70 msec from more than 1 second, sufficient to prevent ping to ping interference during testing. The cost for the 5 mats was under $100.
Figure 4. (a) Artificial turf used for sound absorption. (b) Diagram at the
right shows a close up of the turf “shag”
The effectiveness of the mats does not decrease with time, indicating that trapped air is not the cause of the reflectivity reduction. It appears that the coarse, randomly-oriented plastic strips (about 2 mm wide, 0.8 mm thick and 10 mm high – Figure 4b) making up the artificial turf are highly effective in scattering and absorbing sound at these frequencies.
Transducers with significant sidelobes at 90° to the main beam will still produce interfering echoes from direct reflections from the sidewalls; those reflections can be suppressed by a neoprene collar around the transducer.
A. Sample Test Results
Fig. 5 shows an example of the signals received from a 125 kHz sonar (an ASL MF-AWCP) placed in the instrument cradle with no targets in place. The three echoes appearing before the echo from the mats at the end are sidelobe echoes from three weld seams at 1.52, 3.05 & 4.57 metres along the tank.
Figure 5. Examples of signals received from a 125 kHz sonar.
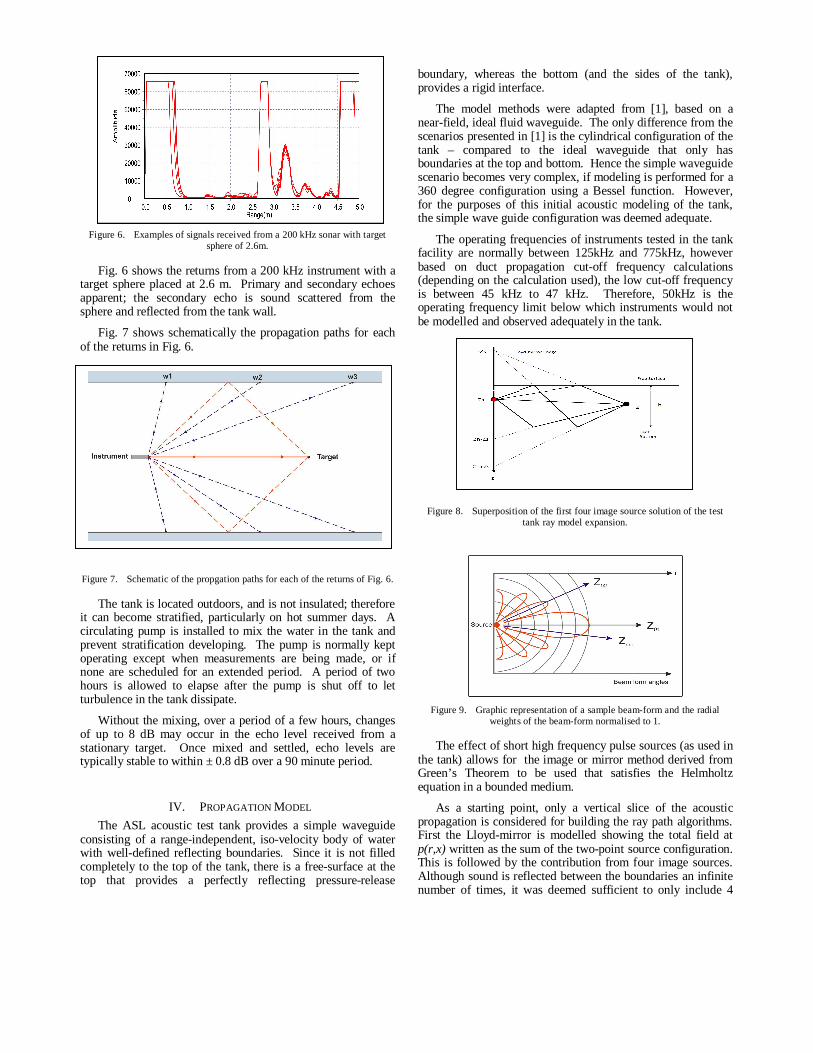
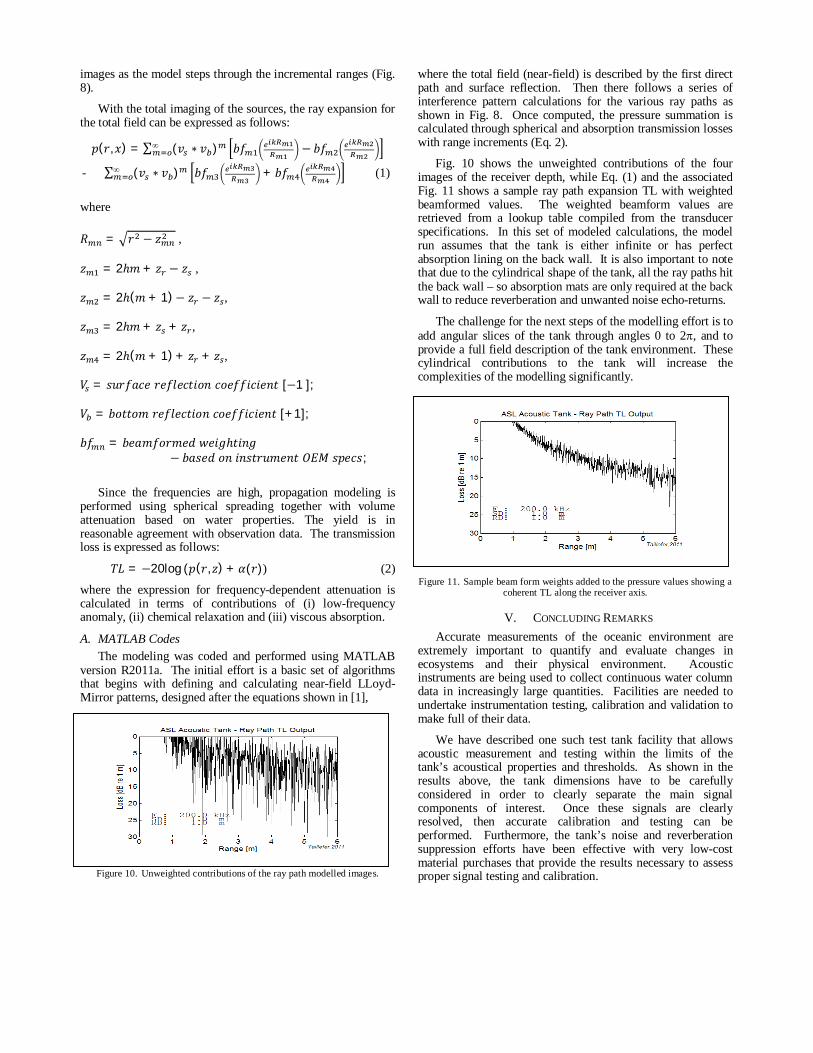
Figure 6. Examples of signals received from a 200 kHz sonar with target
sphere of 2.6m.
Fig. 6 shows the returns from a 200 kHz instrument with a target sphere placed at 2.6 m. Primary and secondary echoes apparent; the secondary echo is sound scattered from the sphere and reflected from the tank wall.
Fig. 7 shows schematically the propagation paths for each of the returns in Fig. 6.
Figure 7. Schematic of the propgation paths for each of the returns of Fig. 6.
The tank is located outdoors, and is not insulated; therefore it can become stratified, particularly on hot summer days. A circulating pump is installed to mix the water in the tank and prevent stratification developing. The pump is normally kept operating except when measurements are being made, or if none are scheduled for an extended period. A period of two hours is allowed to elapse after the pump is shut off to let turbulence in the tank dissipate.
Without the mixing, over a period of a few hours, changes of up to 8 dB may occur in the echo level received from a stationary target. Once mixed and settled, echo levels are typically stable to within ± 0.8 dB over a 90 minute period.
IV. PROPAGATION MODEL The ASL acoustic test tank provides a simple waveguide
consisting of a range-independent, iso-velocity body of water with well-defined reflecting boundaries. Since it is not filled completely to the top of the tank, there is a free-surface at the top that provides a perfectly reflecting pressure-release
boundary, whereas the bottom (and the sides of the tank), provides a rigid interface.
The model methods were adapted from [1], based on a near-field, ideal fluid waveguide. The only difference from the scenarios presented in [1] is the cylindrical configuration of the tank – compared to the ideal waveguide that only has boundaries at the top and bottom. Hence the simple waveguide scenario becomes very complex, if modeling is performed for a 360 degree configuration using a Bessel function. However, for the purposes of this initial acoustic modeling of the tank, the simple wave guide configuration was deemed adequate.
The operating frequencies of instruments tested in the tank facility are normally between 125kHz and 775kHz, however based on duct propagation cut-off frequency calculations (depending on the calculation used), the low cut-off frequency is between 45 kHz to 47 kHz. Therefore, 50kHz is the operating frequency limit below which instruments would not be modelled and observed adequately in the tank.
Figure 8. Superposition of the first four image source solution of the test
tank ray model expansion.
Figure 9. Graphic representation of a sample beam-form and the radial weights of the beam-form normalised to 1.
The effect of short high frequency pulse sources (as used in the tank) allows for the image or mirror method derived from Green’s Theorem to be used that satisfies the Helmholtz equation in a bounded medium.
As a starting point, only a vertical slice of the acoustic propagation is considered for building the ray path algorithms. First the Lloyd-mirror is modelled showing the total field at p(r,x) written as the sum of the two-point source configuration. This is followed by the contribution from four image sources. Although sound is reflected between the boundaries an infinite number of times, it was deemed sufficient to only include 4
images as the model steps through the incremental ranges (Fig. 8).
With the total imaging of the sources, the ray expansion for the total field can be expressed as follows:
푝(푟,푥) = ∑ (푣 ∗ 푣 ) 푏푓 − 푏푓∞
- ∑ (푣 ∗ 푣 ) 푏푓 + 푏푓∞ (1)
where 푅 = 푟 − 푧 , 푧 = 2ℎ푚 + 푧 − 푧 , 푧 = 2ℎ(푚 + 1)− 푧 − 푧 , 푧 = 2ℎ푚 + 푧 + 푧 , 푧 = 2ℎ(푚 + 1) + 푧 + 푧 , 푉 = 푠푢푟푓푎푐푒푟푒푓푙푒푐푡푖표푛푐표푒푓푓푖푐푖푒푛푡[−1]; 푉 = 푏표푡푡표푚푟푒푓푙푒푐푡푖표푛푐표푒푓푓푖푐푖푒푛푡[+1]; 푏푓 = 푏푒푎푚푓표푟푚푒푑푤푒푖푔ℎ푡푖푛푔
− 푏푎푠푒푑표푛푖푛푠푡푟푢푚푒푛푡푂퐸푀푠푝푒푐푠;
Since the frequencies are high, propagation modeling is performed using spherical spreading together with volume attenuation based on water properties. The yield is in reasonable agreement with observation data. The transmission loss is expressed as follows:
푇퐿 = −20log(푝(푟, 푧) + 훼(푟)) (2)
where the expression for frequency-dependent attenuation is calculated in terms of contributions of (i) low-frequency anomaly, (ii) chemical relaxation and (iii) viscous absorption.
A. MATLAB Codes The modeling was coded and performed using MATLAB
version R2011a. The initial effort is a basic set of algorithms that begins with defining and calculating near-field LLoyd-Mirror patterns, designed after the equations shown in [1],
Figure 10. Unweighted contributions of the ray path modelled images.
where the total field (near-field) is described by the first direct path and surface reflection. Then there follows a series of interference pattern calculations for the various ray paths as shown in Fig. 8. Once computed, the pressure summation is calculated through spherical and absorption transmission losses with range increments (Eq. 2).
Fig. 10 shows the unweighted contributions of the four images of the receiver depth, while Eq. (1) and the associated Fig. 11 shows a sample ray path expansion TL with weighted beamformed values. The weighted beamform values are retrieved from a lookup table compiled from the transducer specifications. In this set of modeled calculations, the model run assumes that the tank is either infinite or has perfect absorption lining on the back wall. It is also important to note that due to the cylindrical shape of the tank, all the ray paths hit the back wall – so absorption mats are only required at the back wall to reduce reverberation and unwanted noise echo-returns.
The challenge for the next steps of the modelling effort is to add angular slices of the tank through angles 0 to 2, and to provide a full field description of the tank environment. These cylindrical contributions to the tank will increase the complexities of the modelling significantly.
Figure 11. Sample beam form weights added to the pressure values showing a coherent TL along the receiver axis.
V. CONCLUDING REMARKS Accurate measurements of the oceanic environment are
extremely important to quantify and evaluate changes in ecosystems and their physical environment. Acoustic instruments are being used to collect continuous water column data in increasingly large quantities. Facilities are needed to undertake instrumentation testing, calibration and validation to make full of their data.
We have described one such test tank facility that allows acoustic measurement and testing within the limits of the tank’s acoustical properties and thresholds. As shown in the results above, the tank dimensions have to be carefully considered in order to clearly separate the main signal components of interest. Once these signals are clearly resolved, then accurate calibration and testing can be performed. Furthermore, the tank’s noise and reverberation suppression efforts have been effective with very low-cost material purchases that provide the results necessary to assess proper signal testing and calibration.

VI. REFERENCES
[1] F.B. Jensen, W.A. Kuperman, and M.B. Porter, Computational Ocean Acoustics. AIP Press, New York, 1994, pp. 16-17 & 108-110.