Embed Size (px)
Citation preview
research papers
J. Appl. Cryst. (2015). 48, 747–757 http://dx.doi.org/10.1107/S1600576715004896 747
Received 23 January 2015
Accepted 10 March 2015
Edited by A. Borbely, Ecole National Superieure
des Mines, Saint-Etienne, France
Keywords: twinning; synchrotron X-ray Laue
microdiffraction; crystal orientation maps; look-
up tables.
A look-up table based approach to characterizecrystal twinning for synchrotron X-ray Lauemicrodiffraction scans
Yao Li, Liang Wan and Kai Chen*
Center for Advancing Materials Performance from the Nanoscale (CAMP-Nano), State Key Laboratory for Mechanical
Behavior of Materials, Xi’an Jiaotong University, Xi’an, Shaanxi 710049, People’s Republic of China. *Correspondence
e-mail: [email protected]
An automated method has been developed to characterize the type and spatial
distribution of twinning in crystal orientation maps from synchrotron X-ray
Laue microdiffraction results. The method relies on a look-up table approach.
Taking into account the twin axis and twin plane for plausible rotation and
reflection twins, respectively, and the point group symmetry operations for a
specific crystal, a look-up table listing crystal-specific rotation angle–axis pairs,
which reveal the orientation relationship between the twin and the parent
lattice, is generated. By comparing these theoretical twin–parent orientation
relationships in the look-up table with the measured misorientations, twin
boundaries are mapped automatically from Laue microdiffraction raster scans
with thousands of data points. Taking advantage of the high orientation
resolution of the Laue microdiffraction method, this automated approach is also
applicable to differentiating twinning elements among multiple twinning modes
in any crystal system.
1. Introduction
Crystal twinning, referring to two or more homogeneous
individuals oriented by a defined symmetry element outside
the crystal’s point group, is commonly observed during crystal
growth, recrystallization annealing, phase transformation (Li
et al., 2014) and plastic deformation (Cahn, 1954). According
to the symmetry operation added into the crystal, twinning can
be cataloged into three types, including rotation, reflection
and inversion twins (Koch, 2004). The twin axis, twin plane
and twin center are the most important elements for the three
twinning types, respectively. Twinned crystals usually exhibit
unique effects distinct from their untwined counterparts in the
aspects of mechanical behavior (Christian & Mahajan, 1995;
Salem et al., 2005; Kaschner et al., 2006), texture evolution
(Brown et al., 2005; Proust et al., 2007), and other physical
properties. Often, because they have a lower interfacial energy
than ordinary grain boundaries (OGBs), twin boundaries
(TBs) have a major impact on yield stress (Konopka &
Wyrzykowski, 1997), work hardening (Bouaziz et al., 2008)
and fatigue cracking initiation (Heinz & Neumann, 1990), and
cause migration of twin walls in some shape memory alloys
induced by external magnetic fields (Likhachev & Ullakko,
2000). It is therefore essential to characterize the type,
element and spatial distribution of twinning in a crystalline
material to understand and predict its mechanical behavior.
As crystal twinning occurs commonly at the nanometre to
micrometre scale, conventional neutron and X-ray diffraction
cannot be employed to map the spatial distribution of crystal
twinning owing to their limited spatial resolution. Although
ISSN 1600-5767

electron diffraction based on transmission electron micro-
scopy (TEM) has an exceptional advantage of spatial resolu-
tion, its angular resolution is poor, and the viewing area is
usually only a couple of micrometres. With the emergence of
microdiffraction techniques such as electron backscatter
diffraction (EBSD) and synchrotron polychromatic X-ray
microdiffraction (mXRD), the microstructure (such as phase
distribution, crystallographic orientation, local microstrain
and defect distribution) of heterogeneous materials can be
studied on a length scale spanning intra-granular and inter-
granular dimensions. EBSD provides high spatial resolution
(down to the nanoscale) but relatively low angular/orientation
resolution (1–0.5� in the conventional setup, 0.1� in high-
resolution mode) (Wilkinson et al., 2006). Additionally, in
order to capture high-quality diffraction patterns, it is crucial
to make the EBSD sample surface free of contaminants,
oxidation layers and charge accumulation. However, with the
technique of mXRD, one can achieve an angular resolution
down to 0.01� and a 10�4 strain resolution with proper cali-
bration (Budai et al., 2003; Chen et al., 2010). Besides, it is
much easier to prepare samples for mXRD than for EBSD
because of the stronger penetration ability of X-rays
compared to backscattered electrons.
However, analysis and interpretation of mXRD data are less
advanced than those for TEM and EBSD. Though people have
characterized the type and/or distribution of twinning by
mXRD before (Savytskii et al., 2003; Wang et al., 2010; Guo et
al., 2011; Mun et al., 2011; Li et al., 2014), the need for an
automatic approach that is valid for all seven crystal systems
still exists (Wang et al., 2013). In this study, the X-ray Micro-
diffraction Analysis Software (XMAS) (Tamura, 2014) is used
to index Laue diffraction patterns and measure the crystal-
lographic orientation. Then a ‘look-up’ approach is developed
to determine and map the crystal twinning by comparing the
orientation outputs of a mXRD raster scan with a calculated
look-up table, which is established taking into account
geometric relationships between twin pairs and the rotational
symmetry of the point group.
2. Methodology
It is noted that the tensors referred to in this article are
denoted as three-dimensional square matrices. In the case of
hexagonal and trigonal systems, three-digit Miller index
notation is used throughout the mathematical calculations,
and the final outcomes are entirely converted to four-digit
Bravais–Miller indices.
According to Friedel’s law, conventional diffraction tech-
niques without anomalous scattering (Rossmann, 1961) are
unable to determine the existence of an inversion center in a
crystal from the intensities of its diffraction pattern. This is
because conventional diffraction methods impose an addi-
tional inversion center on the diffraction pattern. As a result,
inversion twins cannot be identified with the conventional
Laue diffraction method, and thus only rotation and reflection
twins are discussed in this paper. Moreover, because of the
addition of the inversion center, the method employed here is
insensitive to the chirality of the crystals, and thus reflection
twin cannot be detected in crystals with noncentrosymmetry.
For example, the Brazil twin in quartz is formed by reflecting
the parent crystal across the {1120} mirror plane. In this case
neither the position nor the intensity of the Laue diffraction
peaks will change with the formation of the twin domain,
unless the anomalous scattering technique is applied
(Gonzalez-Manas et al., 1993). Therefore, reflection twins can
only be identified in crystals with centrosymmetry. Their Laue
groups are listed in Table 1.
It can be proven that, for centrosymmetric crystals, the
relationship between a reflection twin and its parent can be
expressed by a pure rotation. The rotation angle–axis pair
associated with the reflection twin is defined by the twin plane,
lattice parameters and crystal point group (for details see
x2.3). A rotation twin by definition is also described through a
rotation axis and angle. We therefore will describe both types
of crystal twinning by look-up tables in terms of rotation
angle–axis pairs in this paper. By comparing the experimental
observed misorientation between each two adjacent positions
in a mXRD scan with the calculated ones, twin boundaries can
be detected within a suitable angular tolerance, and twin type
and element can be uniquely determined.
2.1. Treatment of rotations
The orientation of a crystal can be represented as a matrix,
and in this article we follow the definition used by XMAS and
call it orientation matrix G:
G ¼
a
b
c
24
35 ¼
ax ay az
bx by bz
cx cy cz
24
35; ð1Þ
where row vectors a, b and c are the basis lattice vectors while
x, y and z are the unit vectors of a Cartesian laboratory
coordinate system (O-xyz). On the other hand, it is often
convenient to define another Cartesian coordinate system (O-
aoboco, and we call it orthonormal coordinates in this article)
which is associated with the crystal lattice coordinate system
O-abc, so that the orientation for a crystal from any of the
seven crystal systems can be defined as a pure rotation that
brings O-xyz into O-aoboco. Here we define that the two
coordinates of O-abc and O-aoboco share the same origin and
the co axis is collinear with the c axis, bo is perpendicular to the
ac plane, and ao lies hence in the ac plane to fulfill the right-
handed criterion (Matthies et al., 1988); ao, bo and co are unit
research papers
748 Li, Wan and Chen � Crystal twinning characterization J. Appl. Cryst. (2015). 48, 747–757
Table 1Crystal systems and Laue groups.
Crystal systems Laue groups
Triclinic 1Monoclinic 2/mOrthorhombic mmmTetragonal 4/m, 4/mmmTrigonal 3, 3mHexagonal 6/m, 6/mmmCubic m3, m3m

vectors. Therefore, the transformation matrix L that brings O-
aoboco to O-abc has the following form:
L ¼
a sin � �b sin � cos �� 0
0 b sin � sin �� 0
a cos � b cos � c
24
35; ð2Þ
where a, b, c are the edge lengths of the unit cell, �, �, � are the
angles between the edges, and �* is the angle between the
reciprocal unit axes a* and b*. The relationships between O-
abc, O-aoboco and O-xyz are displayed in Fig. 1. Consequently,
the [uvw] direction in the lattice coordinate system can be
transformed into the [uovowo] direction referred to the
orthonormal coordinate system as
uo
vo
wo
24
35 ¼ L
u
v
w
24
35 and
u
v
w
24
35 ¼ L�1
uo
vo
wo
24
35; ð3Þ
where the superscript �1 denotes the inverse matrix. Simi-
larly, the (hokolo) plane in the orthonormal coordinate system
can be obtained from the (hkl) plane in the lattice coordinates
by (He & Jonas, 2007)
ho
ko
lo
24
35 ¼ ½LT
��1
h
k
l
24
35 and
h
k
l
24
35 ¼ LT
ho
ko
lo
24
35; ð4Þ
where the superscripts T and �1 denote the transpose and
inverse of a matrix, respectively.
For a mathematical representation of rotations, one can
alternatively choose rotation matrices, rotation angle–axis
pairs, Euler angles or unit quaternions. Here we prefer to use
unit quaternions for all calculations but angle–axis pairs to
display the final results, because the former are more accurate
in computing while the latter are more transparent in
expressing the rotation. The unit quaternion q = [q0 q1 q2 q3]
corresponding to an angle–axis pair {�, [u1 u2 u3]} has the form
of
q0 ¼ cosð�=2Þ; qi ¼ ui sinð�=2Þ; i ¼ 1; 2; 3; ð5Þ
where q0 and qi are the scalar and vector parts, respectively.
Accordingly, the rotation matrix R in terms of unit quaternion
q is
R ¼
1� 2ðq22 þ q2
3Þ 2ðq1q2 � q0q3Þ 2ðq1q3 þ q0q2Þ
2ðq1q2 þ q0q3Þ 1� 2ðq21 þ q2
3Þ 2ðq2q3 � q0q1Þ
2ðq1q3 � q0q2Þ 2ðq2q3 þ q0q1Þ 1� 2ðq21 þ q2
2Þ
24
35:ð6Þ
The mutual transformation between these rotation repre-
sentations can be found elsewhere (Brannon, 2002).
2.2. Calculating look-up tables for rotation twins
A rotation twin is defined as two twin components brought
into coincidence by rotating the parent lattice by a well
defined angle � (360�/n, n = 2, 3, 4, 6) around a well defined
axis t (twin axis) (Koch, 2004). The process of creating the
theoretical misorientation table for rotation twins relies on
rotational operations and symmetry operations of point
groups. In a specific crystal, the transformation matrix L is
obtained from the lattice constants by equation (2). The
directions of all symmetry-equivalent twin axes t in the crys-
tallographic coordinate system are converted to the corre-
sponding indices to in the orthonormal coordinate system by
equation (3):
to ¼ normðL tÞ; ð7Þ
where norm means normalization of a vector. The resulting
angle–axis pairs {�, to} are then converted to a group of
rotation matrices R by combining equations (5) and (6).
For completeness, one must take into account the rotational
symmetry operations of the respective point group, which can
be expressed as a set of rotation matrices S (Kocks et al., 2000).
Therefore, the matrices X describing the full rotational rela-
tionships between twin and parent orientations are obtained
as
X ¼ S R: ð8Þ
Subsequently, the rotational relationships between twin
components are represented as a group of rotation angle–axis
pairs {�, uo} derived from matrices X by inverse operations of
equations (6) and (5) (Brannon, 2002). It is worth noting that
the indices uo are in the orthonormal coordinate system. They
are then transformed into the corresponding indices u in the
lattice coordinate system by applying equation (3). Through
the procedure executed above, the look-up table of correla-
tion between rotation twin pairs is generated, involving a
group of rotation angles and corresponding rotation axes
{�, uo}.
2.3. Calculating look-up tables for reflection twins
A reflection twin is defined as two twin components brought
into coincidence by a mirror operation along a well defined
plane. Previous efforts to derive the correspondence matrices
related to the mirror twin–parent lattice orientation (Calbick
& Marcus, 1967; Bevis & Crocker, 1968; Niewczas, 2010) were
research papers
J. Appl. Cryst. (2015). 48, 747–757 Li, Wan and Chen � Crystal twinning characterization 749
Figure 1The definition and mutual relationship of the three coordinate systemsreferred to in this article.
restricted to cubic and hexagonal systems and did not include
the intrinsic rotational symmetry of their point groups. Here
we show an alternative way to implement a look-up table,
which is valid for all seven crystal systems and takes rotational
symmetry into account.
With respect to a specific reflection twin, the indices {p1 p2
p3} denoting the family of the twin planes in crystallographic
coordinates are converted to the corresponding indices {po1 po
2
po3} in orthonormal space utilizing the transformation matrix L
by equation (4). In linear algebra, the Householder transfor-
mation is introduced to describe a reflection (Householder,
1958):
H ¼ I � 2
ppo1
ppo2
ppo3
24
35 ppo
1 ppo2 ppo
3
� �; ð9Þ
where H is the Householder matrix, I is the identity matrix,
and the unit vector [ppo1 ppo
2 ppo3] is obtained by normalizing the
indices of each plane in {po1 po
2 po3}. The determinant of the
Householder matrix H is �1, indicating that a mirror opera-
tion changes the chirality of the coordinate system. Since as
stated above Laue diffraction is insensitive to chirality, it is
safe to multiply H by �1 without introducing a change in the
orientation of the crystal. It can be shown that det(�H) = 1
(det means the matrix determinant) and [�H]�1 = [�H]T,
which identifies �H as a rotation matrix.
Similar to the case of rotation twins, the rotational
symmetries of the point group need to be taken into account.
Thus the correspondence matrices X linking twin and parent
lattices can be expressed as
X ¼ S �H½ �; ð10Þ
where S is, again, the group of rotation matrices expressing the
rotational symmetry of the point group in a given crystal.
Finally, each rotation matrix in X is transformed into a pair of
angle–axis {�, u} in the lattice coordinate system following the
same route as for the rotation twin.
2.4. Experimental identification of twinning
As outlined in the previous section, a look-up table for
orientation relationships between two twin components can
be established as long as all the twin elements (twin axis or
twin plane) in a specific crystal are known. The existing twin
mode thereafter is identified utilizing a ‘look-up’ table method
by comparing the misorientation measurements from mXRD
scans with the theoretical rotation angle–axis pairs in the look-
up table.
2.4.1. Misorientation measurements from XMAS. The
misorientation matrix �G between any two pixels in a mXRD
scan from the XMAS outputs [G1 and G2, as explained in
equation (1)] is deduced as follows:
�G ¼ GT1 GT
2
� ��1: ð11Þ
From the inverse operations of equations (5) and (6), the
misorientation matrix �G is represented as a rotation angle–
axis pair {�cal, [ulcal vl
cal wlcal]} (the subscript cal means the
calculation results, and the superscript l denotes the labora-
tory coordinate system), and the rotation axis can be trans-
formed into [ucal vcal wcal] in the lattice coordinate system
through a similar transformation operation with equation (3):
ucal
vcal
wcal
24
35 ¼ GT
2
� ��1ul
cal
vlcal
wlcal
24
35: ð12Þ
The misorientation of any two adjacent grains is expressed as a
rotation angle–axis pair from a mXRD measurement. By
comparing measured values with the calculated angle–axis
pairs in the look-up table for each measured position pair,
twins are unambiguously identified within a specified toler-
ance range.
2.4.2. Tolerance for determination of twinning types. The
look-up table, involving a set of rotation angle–axis pairs,
reveals the rotational relationship between two twin compo-
nents. On the other hand, two adjacent grains are character-
ized as a pair of twins as long as the following two conditions
are satisfied simultaneously: first, the misorientation angle �cal
between the two grains must be equal to one of the theoretical
rotation angles defined in the look-up table; second, the
rotation axis ucal of two adjacent orientations must be parallel
to the theoretical axis corresponding to the rotation angle.
Before applying this method to real samples, it is necessary
to consider the potential deviations of the calculated �cal and
ucal values from the theoretical case. One contribution arises
from the orientation resolution of the experimental technique
(�0.01� for mXRD) and calculation errors. Secondly, a mate-
rial subjected to a mechanical/electrical/magnetic/temperature
field may exhibit small changes of the lattice parameters and/
or grain rotation from the strain-free state. For example,
deformation twinning is known to be accompanied by grain
rotations arising from the accumulation of geometrically
necessary dislocations (GNDs) (Straumanis, 1949). As a
result, the X-ray diffraction peaks from such materials will be
either broadened or split. Consequently, the measurement
accuracy of the crystal orientation is reduced.
Because of inherent uncertainties and errors in the crystal
orientation measurements, it is normal that between a pair of
twinned orientations the experimentally observed misor-
ientation is slightly different from the theoretical rotation
angle, and the rotation axis is not exactly parallel to the
theoretical direction. To account for these possibilities in
terms of the algorithm discussed, two orientations are defined
as a twin pair when
j�cal � �thj<Ea and jnormðuocalÞ normðuo
thÞ � 1j<Eb;
ð13Þ
where the subscript th denotes the theoretical values, uocal and
uoth are the corresponding axes in orthonormal coordinates
converted from ucal and uth by equation (3), and Ea and Eb are
open input variables defining the deviation angles between the
measured misorientation angle–axis pairs and the theoretical
values, depending on the resolution limit of the technique,
sample preparation history, defect density etc.
research papers
750 Li, Wan and Chen � Crystal twinning characterization J. Appl. Cryst. (2015). 48, 747–757

3. Applications
Scanning Laue mXRD experiments were conducted on
beamline 12.3.2 at the Advanced Light Source (ALS) of
Lawrence Berkeley National Laboratory (LBL). The samples,
mounted on a precision translation stage, were scanned at 45�
relative to the incident beam with an energy bandpass
between 5 and 24 keV at the focal spot (about 1 � 1 mm). At
each scanning position, a Laue diffraction pattern was
recorded with a PILATUS 1M detector located above the
sample in reflection geometry at 90� with respect to the inci-
dent X-ray beam. More details of the mXRD experiment setup
can be found elsewhere (Kunz et al., 2009). The obtained Laue
patterns were indexed using the software package XMAS
(Tamura et al., 2003) after calibrating the diffraction geometry.
The procedure provides an accurate measure of spatially
resolved grain orientations. By comparing the orientation
measurements with the look-up table for a certain twin mode
pixel by pixel, one can determine the types of crystal twinning
unequivocally and therefore the spatial distribution of twin
boundaries. Here we give several examples of the applications
of the look-up table described above.
3.1. Identification of the Dauphine twin in quartz – a generalcase of rotation twinning
The occurrence of the Dauphine twin in trigonal �-quartz
(space group P3121/P3221) is often related to the �–� phase
transformation (Van Tendeloo et al., 1975) or deformation
processes (Zinserling & Schubnikow, 1933). The Dauphine
twin law is a rotation twin related to a 180� rotation around the
h0001i axes. Given the space-group symmetry, the twin axes
actually consist of two equivalent axes [0001] and [0001].
However, for simplicity, the former is used to explain the
algorithm. To formulate the look-up table for the Dauphine
twin, we first derive the transformation matrix L from equa-
tion (2) using the lattice parameters of a = 4.921 A and c =
5.416 A (Glinnemann et al., 1992):
L ¼
4:9210 �2:4605 0
0 4:2617 0
0 0 5:4160
24
35: ð14Þ
By equation (7), the normalized indices of the twin axis in the
orthonormal coordinate system are also [001]; then the angle–
axis pair {180�, [001]} is converted to a rotation matrix R by
applying equations (5) and (6):
R ¼
�1 0 0
0 �1 0
0 0 1
24
35: ð15Þ
To describe the twinning correlations comprehensively, one
must multiply the rotation matrix R by each of the six rotation
matrices S belonging to point group 32 (Kocks et al., 2000), and
thus six rotational matrices X are obtained and represented as
six angle–axis pairs {�, uo} (Table 2). Finally, these axes are
research papers
J. Appl. Cryst. (2015). 48, 747–757 Li, Wan and Chen � Crystal twinning characterization 751
Table 2The rotational parameters involved in the derivation process of the look-up table for Dauphine twinning (twin element is {180�, [0001]}) in �-quartz.
Symmetry operators S of point group 32 Rotation matrices X = SR Angle–axis pairs in O-aoboco {�, uo} Angle–axis pairs in O-abc {�, u}
1 0 0
0 1 0
0 0 1
24
35 �1 0 0
0 �1 0
0 0 1
24
35 {180�, [001]} {180�, [0001]}
�1=2 31=2=2 0
�31=2=2 �1=2 0
0 0 1
24
35 1=2 �31=2=2 0
31=2=2 1=2 0
0 0 1
24
35 {60�, [001]} {60�, [0001]}
�1=2 �31=2=2 0
31=2=2 �1=2 0
0 0 1
24
35 1=2 31=2=2 0
�31=2=2 1=2 0
0 0 1
24
35 {60�, [001]} {60�, [0001]}
�1=2 �31=2=2 0
�31=2=2 1=2 0
0 0 �1
24
35 1=2 31=2=2 0
31=2=2 �1=2 0
0 0 �1
24
35 {180�, 1
2[31/210]} {180�, [1010]}
1 0 0
0 �1 0
0 0 �1
24
35 �1 0 0
0 1 0
0 0 �1
24
35 {180�, [010]} {180�, [0110]}
�1=2 31=2=2 0
31=2=2 1=2 0
0 0 �1
24
35 1=2 �31=2=2 0
�31=2=2 �1=2 0
0 0 �1
24
35 {180�, 1
2[31=210]} {180�, [1100]}
transformed into the lattice coordinate system by applying
equation (3) and denoted as Bravais–Miller indices.
The quartz sample demonstrated here was from the San
Andreas Fault Observatory at Depth (Chen et al., 2015). A
thin section was prepared by mounting
a slab with epoxy on a glass slide, with
subsequent mechanical grinding and
polishing to �30 mm thickness. A
320 � 240 mm area was scanned with
the mXRD technique with a step size of
4 mm and then analyzed using XMAS.
Owing to the uncertainty in unequi-
vocally indexing a Laue pattern of
trigonal crystals, XMAS may give a
wrong indexing with an orientation
ambiguity of 60 or 180� around the c
axis. Therefore, the output data
from XMAS were rechecked using
an improved peak-intensity-fitting
method (Chen et al., 2012).
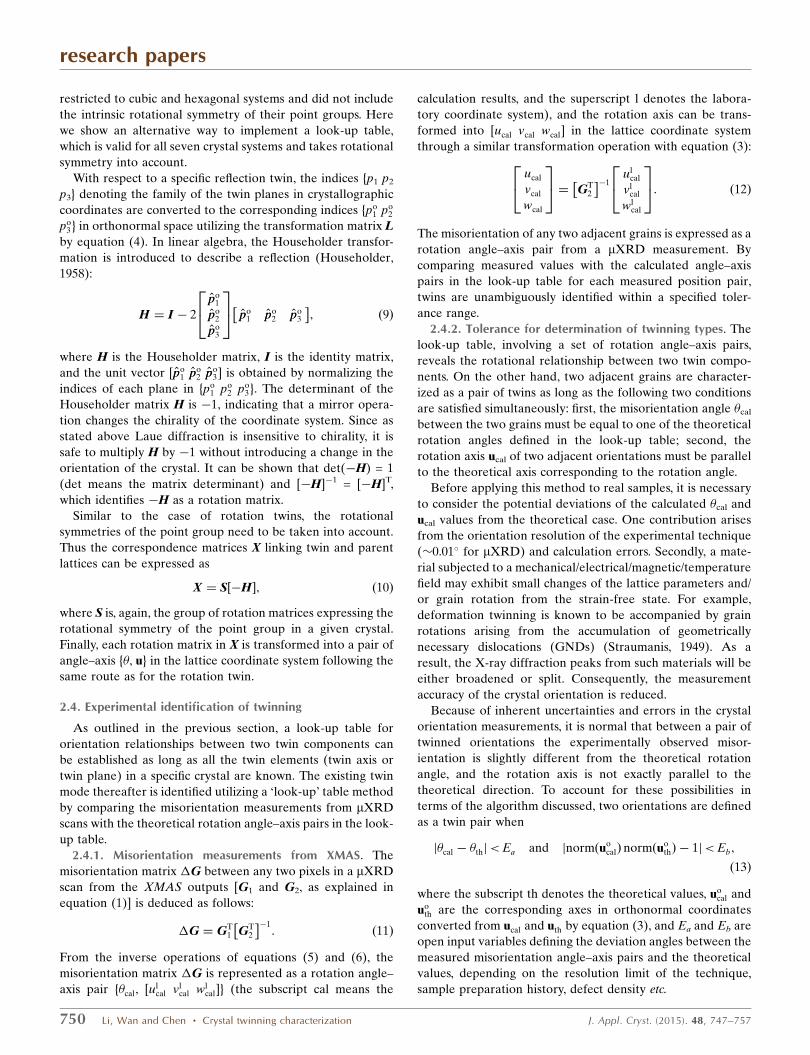
The orientation of the scanned area
is represented in Figs. 2(a)�2(c) by
Euler angles ’1, � and ’2 in Bunge
notation (Bunge & Morris, 1982),
respectively. The grey pixels indicate
the failure of orientation indexing from
XMAS, either because these positions
correspond to a different mineral
phase with too few reflections or
because the lattice at these spots
contains too many defects. A pixel-to-
pixel misorientation examination and
comparison with the last column of
Table 2 suggest that both OGBs and
Dauphine TBs are detected in the
scanned area, and their distribution is
shown in Fig. 2(d) with blue and red
curves, respectively. In this example, a
2� tolerance for both Ea and Eb was
employed. It is worth noting that the
misorientation between the parent and
twin domains here is 180� around the
[0110] axis. In other words, one would
probably miss those Dauphine twin
boundaries if not paying attention to
the rotational symmetry matrices S
when deducing the look-up table.
3.2. Identification of spinel twin incubic crystals – a general case ofreflection twinning
Table 3 summaries the theoretical
misorientation angles and corre-
sponding axes for the {111}h112i twin
in face-centered cubic (f.c.c.) crystals
(spinel twin law). In this case, the
angle–axis pairs {60�, h111i}, {180�, h111i}, {180�, h112i} and
{70.53�, h011i} have been reported in the previous literature
(Santamarta & Schryvers, 2004; Zhu et al., 2005), while
{109.47�, h011i}, {131.81�, h012i} and {146.44�, h113i}, which are
research papers
752 Li, Wan and Chen � Crystal twinning characterization J. Appl. Cryst. (2015). 48, 747–757
Figure 2The crystallographic orientation maps of the �-quartz sample indicated by Euler angles (a) ’1, (b) �and (c) ’2 in the Bunge setting. (d) The distribution of Dauphine twin boundaries denoted in red andordinary grain boundaries in blue. Scale bars represent 50 mm.
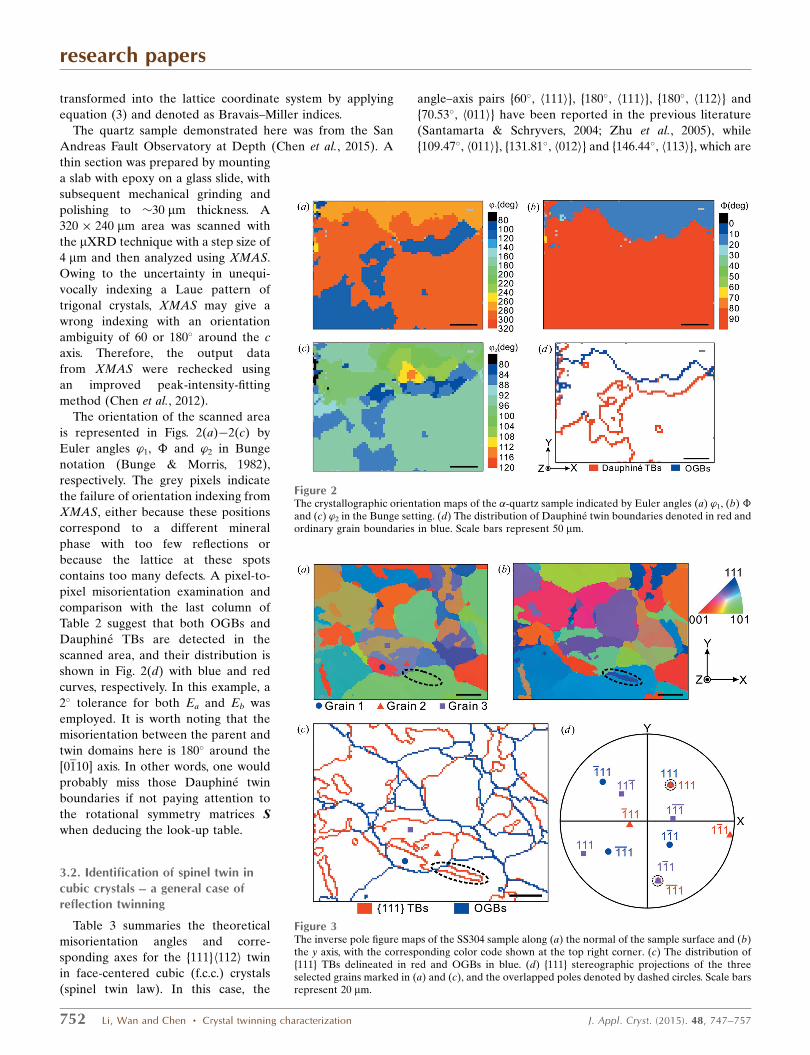
Figure 3The inverse pole figure maps of the SS304 sample along (a) the normal of the sample surface and (b)the y axis, with the corresponding color code shown at the top right corner. (c) The distribution of{111} TBs delineated in red and OGBs in blue. (d) {111} stereographic projections of the threeselected grains marked in (a) and (c), and the overlapped poles denoted by dashed circles. Scale barsrepresent 20 mm.

seldom referred to by previous studies, are also discovered by
taking the rotational symmetry into account.
An area of 150 � 119 mm was scanned with 1 mm step size
on a piece of annealed and polished stainless steel 304 (SS304)
with the micro-focused X-ray beam (Lupinacci et al., 2015).
After indexing all 17 850 Laue patterns with XMAS auto-
matically, the inverse pole figure (IPF) maps were plotted. The
crystallographic orientations in the direction normal to the
sample surface and parallel to the y axis are shown in Figs. 3(a)
and 3(b), respectively. Comparing the experimental measure-
ments and theoretical misorientation angle–axis pairs, the
distribution of various boundary types is drawn in Fig. 3(c),
where {111} TBs are delineated in red and the OGBs in blue.
The tolerances Ea and Eb were both set at 1� in this example.
In addition, it is worth noting that the grain information from
only one IPF map may be misleading. For example, the twin
boundary circled in Fig. 3(c) is almost invisible in the IPF map
along the sample surface normal in Fig. 3(a), while it is clearly
seen in Fig. 3(b).
In order to double check the output of the automated
twinning identification approach, the {111} stereographic
projection of the three adjacent grains marked in Figs. 3(a)
and 3(c) is plotted in Fig. 3(d). The (111) poles of Grain 1 and
Grain 2 overlap, so that they follow the {60�, [111]} rotation
angle–axis pair, while the (111) pole of Grain 2 is coincident
with the (111) pole of Grain 3, corresponding to the {131.81�,
[021]} rotation angle–axis pair listed in Table 3. As mentioned
above, the latter case here is easily overlooked if not consid-
ering the symmetry matrices S.
3.3. Multiple twinning modes in hexagonal metals
Seven twinning modes have been reported in hexagonal
close-packed metals, namely {1011}h1012i, {1012}h1011i,
{1013}h3032i, {1121}h1126i, {1122}h1123i, {1123}h1122i and
{1124}h2243i. In order to test the resolution/capability of our
automated approach, a magnesium (Mg) AZ31 alloy was
rolled to about 3% reduction and then cut and polished for
mXRD study. Fig. 4(a) shows the IPF map of a 450 � 300 mm
area along the sample surface normal. The scanning step size
here was 3 mm. From a comparison of misorientation between
each two adjacent scanning spots with the theoretical condi-
tions listed in Table 4, we obtain the spatial distribution of
different types of TBs and OGBs plotted in Fig. 4(b) using the
tolerance of 3� both for Ea and for Eb. As illustrated in
Fig. 4(b), one of the major benefits of this automated twinning
identification algorithm is the immediate representation of the
specific twin or even multiple twin types and corresponding
spatial distribution by handling a tremendous number of data
points in mXRD maps.
To scrutinize the boundaries in Fig. 4(b), one should find
some discrete pixels indicating a certain twin type along an
ordinary grain boundary, because the Laue diffraction peaks
from the highly plastically deformed region become fuzzy and
streaked, so that the crystal orientation is not measured
accurately.
The output results are rechecked by two means: one
through the stereographic projection approach, the other by
comparing with the previously reported matrix method
(Cheneau-Spath et al., 1994). The four grains marked in
Figs. 4(a) and 4(b) are selected as examples. From the
stereographic projections in Figs. 4(c) and 4(d), it is seen that
one of the {1012} poles of Grain 1 overlaps with one of Grain
2, while one of the {1121} poles of Grain 3 appears at the same
research papers
J. Appl. Cryst. (2015). 48, 747–757 Li, Wan and Chen � Crystal twinning characterization 753
Figure 4(a) The inverse pole figure map along the surface normal of the AZ31sample. (b) The spatial distribution of seven different types of twinboundaries and ordinary grain boundaries. Stereographic projections of(c) {1012} poles of Grain 1 and Grain 2, and (d) {1121} poles of Grain 3and Grain 4, as marked in (a) and (b). Dashed circles in (c) and (d) referto the overlapped poles. Scale bars represent 50 mm.
Table 3The look-up table describing the orientation relationships of spineltwinning in f.c.c. crystals (twin element is {111}h112i).
Rotation angle Rotation axis
60� h111i70.53� or acos (1/3) h011i109.47� or acos (�1/3) h011i131.81� or acos (�2/3) h012i146.44� or acos (�5/6) h113i180� h111i, h112i

research papers
754 Li, Wan and Chen � Crystal twinning characterization J. Appl. Cryst. (2015). 48, 747–757
Table 4The look-up table summarizing the twin–parent correlations in seven twinning systems in a hexagonal crystal, where the rotation axes are represented aseither direction indices huvtwi or the normal of the plane indices {hkil}, � = c/a.
Rotation axis Rotation axis
Twinning system Rotation angle (�) huvtwi {hkil} normal Rotation angle (�) huvtwi {hkil} normal
{1011}h1012i 180 1 0 13
2�2
� �{1011} 180 h1012i 1 0 1
4�2
3
� �
acos�8�2 þ 3
8�2 þ 6
� 1 0 1
3
4�2
� �{2021} acos
�8�2 � 3
8�2 þ 6
� 1 1 2
9
4�2
� �{2243}
acos�4�2 þ 3
4�2 þ 3
� h1120i {1120} acos
4�2 � 3
4�2 þ 3
� h1120i {1120}
acos2�2 � 3
4�2 þ 3
� h1011i 1 0 1
2�2
3
� �acos
�2�2 � 3
4�2 þ 3
� h1123i 1 1 2 2�2
�
{1012}h1011i 180 1 0 13
�2
� �{1012} 180 h1011i 1 0 1
2�2
3
� �
acos�2�2 þ 3
2�2 þ 6
� 1 0 1
3
2�2
� �{1011} acos
�2�2 � 3
2�2 þ 6
� 1 1 2
9
2�2
� �{1123}
acos��2 þ 3
�2 þ 3
� h1120i {1120} acos
�2 � 3
�2 þ 3
� h1120i {1120}
acos�2 � 6
2�2 þ 6
� h2021i 1 0 1
�2
3
� �acos
��2 � 6
2�2 þ 6
� h2243i {112�2}
{1013}h3032i 180 1 0 19
2�2
� �{1013} 180 h3032i 1 0 1
4�2
9
� �
acos�8�2 þ 27
8�2 þ 54
� 1 0 1
9
4�2
� �{2023} acos
�8�2 � 27
8�2 þ 54
� 1 1 2
27
4�2
� �{2249}
acos�4�2 þ 27
4�2 þ 27
� h1120i {1120} acos
4�2 � 27
4�2 þ 27
� h1120i {1120}
acos2�2 � 27
4�2 þ 27
� h3031i 1 0 1
2�2
9
� �acos
�2�2 � 27
4�2 þ 27
� h1121i 1 1 2
2�2
3
� �
{1121}h1126i 180 1 1 23
2�2
� �{1121} 180 h1126i 1 1 2 4�2
�
acos�8�2 þ 1
8�2 þ 2
� 1 1 2
3
4�2
� �{2241} acos
�8�2 � 1
8�2 þ 2
� 1 0 1
3
4�2
� �{2021}
acos�4�2 þ 1
4�2 þ 1
� h1010i {1010} acos
4�2 � 1
4�2 þ 1
� h1010i {1010}
acos2�2 � 1
4�2 þ 1
� h1123i 1 1 2 2�2
�acos
�2�2 � 1
4�2 þ 1
� h1013i 1 0 1 2�2
�

position for Grain 4, leading to the conclusion that Grain 1
and Grain 2 are a pair of {1012} twins and Grain 3 and Grain 4
are twinned along the {1121} plane. The orientation matrices
of these four grains are expressed as
G1 ¼
2:2878 1:7037 �1:4708
�0:5583 0:4299 3:1310
3:4855 �3:7048 1:1303
24
35; ð16Þ
G2 ¼
0:5508 �0:4386 �3:1311
�2:0561 2:2672 0:9655
3:8996 3:4501 0:2028
24
35; ð17Þ
G3 ¼
0:7420 0:5740 3:0692
0:4940 2:2637 �2:2208
�4:8032 1:8482 0:8156
24
35; ð18Þ
G4 ¼
2:0957 1:3607 �2:0141
�0:1082 0:9270 3:0706
3:5314 �3:6318 1:2209
24
35; ð19Þ
respectively. For {1012} and {1121} twins, the transformation
matrices derived in previous literature (Cheneau-Spath et al.,
1994) are
research papers
J. Appl. Cryst. (2015). 48, 747–757 Li, Wan and Chen � Crystal twinning characterization 755
Table 4 (continued)
Rotation axis Rotation axis
Twinning system Rotation angle (�) huvtwi {hkil} normal Rotation angle (�) huvtwi {hkil} normal
{1122}h1123i 1801 1 2
3
�2
� �{1122} 180 h1123i 1 1 2 2�2
�
acos�2�2 þ 1
2�2 þ 2
� 1 1 2
3
2�2
� �{1121}
acos�2�2 � 1
2�2 þ 2
� 1 0 1
3
2�2
� �{1011}
acos��2 þ 1
�2 þ 1
� h1010i {1010}
acos�2 � 1
�2 þ 1
� h1010i {1010}
acos�2 � 2
2�2 þ 2
� h2243i {112�2}
acos��2 � 2
2�2 þ 2
� h2023i {101�2}
{1123}h1122i 1801 1 2
9
2�2
� �{1123} 180 h1122i
1 1 24�2
3
� �
acos�8�2 þ 9
8�2 þ 18
� 1 1 2
9
4�2
� �{2243}
acos�8�2 � 9
8�2 þ 18
� 1 0 1
9
4�2
� �{2023}
acos�4�2 þ 9
4�2 þ 9
� h1010i {1010}
acos4�2 � 9
4�2 þ 9
� h1010i {1010}
acos2�2 � 9
4�2 þ 9
� h1121i
1 1 22�2
3
� �acos
�2�2 � 9
4�2 þ 9
� h1011i
1 0 12�2
3
� �
{1124}h2243i 1801 1 2
6
�2
� �{1124} 180 h2243i {112�2}
acos��2 þ 2
�2 þ 4
� 1 1 2
3
�2
� �{1122}
acos��2 � 2
�2 þ 4
� 1 0 1
3
�2
� �{1012}
acos��2 þ 4
�2 þ 4
� h1010i {1010}
acos�2 � 4
�2 þ 4
� h1010i {1010}
acos�2 � 8
2�2 þ 8
� h4483i
1 1 2�2
2
� �acos
��2 � 8
2�2 þ 8
� h4043i 1 0 1
�2
2
� �

Tf1012g ¼
�0:3639 0 10:544
2:6361 �5:6361 5:2722
3 0 0:3639
24
35; ð20Þ
Tf1121g ¼
�11:5444 0 0
�10:5444 9:5444 �10:5444
2 �4 �9:5444
24
35; ð21Þ
respectively. Imposing them onto G1 and G3, the calculated
G2 and G4 are
G2cal ¼
1:4481 �1:8831 2:1636
0:5590 �0:4304 �3:1347
3:9876 3:3542 0:2504
24
35; ð22Þ
G4cal ¼
�2:0332 �2:3304 �0:9029
2:0807 1:2359 �2:1268
3:5334 �3:6095 1:3594
24
35; ð23Þ
respectively. It is obvious that the calculated orientation
matrices can also be written as
G2cal eq ¼
0:5590 �0:4304 �3:1347
�2:0071 2:3135 0:9711
3:9876 3:3542 0:2504
24
35; ð24Þ
G4cal eq ¼
2:0807 1:2359 �2:1268
�0:0475 1:0945 3:0298
3:5334 �3:6095 1:3594
24
35; ð25Þ
owing to the sixfold rotational symmetry in hexagonal crystals.
Upon comparison, taking into account experimental uncer-
tainties, the orientation matrices G2cal_eq and G4cal_eq are in
good agreement with the measured results. More grains were
selected for a similar manual check, which confirmed that the
output results from the automated approach are reliable.
3.4. Identification of reflection twins in highly deformed calcite
The {0118} mechanical twin, easily visible as lamellar
morphologies, is the predominant mechanism of plastic
deformation at low temperature in the rhombohedral (space
group R32/c) mineral calcite (Ferrill et al., 2004; Chen et al.,
2011). In our mXRD experiment, a naturally deformed calcite
sample was scanned at a 2 mm step size over an area of 280 �
140 mm. A coarse grain with several parallel twin domains can
be seen from the orientation map of the angles between the
crystal c axis and the sample surface normal shown in Fig. 5(a).
Setting the tolerance values Ea and Eb to 5 and 5.5� in our twin
identification method, the unambiguous {0118} reflection twin
is determined. The spatial distribution of twin boundaries is
delineated in Fig. 5(b). It is worth noting that the tolerances Ea
and Eb were set to relatively large values owing to the
distortion and rotation of the crystals caused by severe plastic
deformation of the sample, which could also be seen from
diffraction patterns. As shown in Figs. 5(c) and 5(d), the two
Laue patterns corresponding to the scanning spots marked in
Fig. 5(a) exhibit very different characteristics. The pattern of
Grain 1 is relatively sharp, while Grain 2 shows obvious
streaking in Laue peaks caused by the abundant presence of
geometrically necessary dislocations (Ice & Barabash, 2007).
In addition, from the {0118} stereographic projection shown in
Fig. 5(e), the (1018) pole of Grain 1 and (1108) pole of Grain 2
are close but not exactly coincident. To summarize, the
selected threshold level has a significant impact on char-
acterization of the boundary types. If grain boundaries are
misindexed as twins, Ea and Eb will need to be reduced, while
if twins are mistaken as grain boundaries, it is necessary to set
larger threshold values. In general, to fully account for any
suspected ambiguity, it is relatively straightforward to run the
deformation twin identification routine multiple times over a
small range of Ea and Eb parameters.
research papers
756 Li, Wan and Chen � Crystal twinning characterization J. Appl. Cryst. (2015). 48, 747–757
Figure 5(a) Crystallographic orientation map of the calcite sample showing the angles between the crystal c axis and the surface normal. (b) The spatialdistribution of {0118} twin boundaries. (c), (d) Two Laue diffraction patterns of the two scanning spots marked in (a), and (e) the corresponding {0118}stereographic projection. Scale bars represent 30 mm.

4. Conclusions
A fully automated approach for determination of crystal
twinning modes is developed. This offers a fast and reliable
methodology to identify the exact nature of twinning based on
synchrotron Laue mXRD orientation maps. The major
advantage highlighted by this work is the new algorithm for
generating the theoretical look-up table which contains all the
possible rotational correlations for established twin laws. To
compare the misorientation angle and axis between adjacent
scanning spots with the established look-up table, the unam-
biguous types of crystal twinning and spatial distribution of
twin boundaries are automatically identified through an
appropriate selection of threshold values. This ‘look-up’
method is also valid for twinning determination in other raster
scanning crystal orientation mapping techniques such as
EBSD.
Acknowledgements
We acknowledge Professor H. R. Wenk of the Department of
Earth and Planetary Science, University of California
Berkeley (UCB), for providing the naturally deformed
�-quartz and calcite samples, Professor P. Hosemann of the
Department of Nuclear Engineering, UCB, for the SS304
specimen, and Professor Renlong Xin of the College of
Materials Science and Engineering, Chongqing University, for
the rolled AZ31 alloy. Experimental support from and helpful
discussions with Dr M. Kunz of ALS, LBL, are greatly
appreciated. The work is supported by the National Natural
Science Foundation of China (NSFC) under contract No.
51201127 and the Fundamental Research Funds for the
Central Universities (grant No. 2015gjhz03). KC is supported
by the National Young 1000 Talents Program of China. The
ALS is supported by the Director, Office of Science, Office of
Basic Energy Sciences, Materials Science Division, of the US
Department of Energy under contract No. DE-AC02-
05CH11231 at LBL. The microdiffraction program at the ALS
on beamline 12.3.2 was made possible by NSF grant No.
0416243.
References
Bevis, M. & Crocker, A. G. (1968). Proc. R. Soc. London Ser. A, 304,123–134.
Bouaziz, O., Allain, S. & Scott, C. (2008). Scr. Mater. 58, 484–487.Brannon, R. M. (2002). Report NM 87185-0820. Sandia National
Laboratories, Albuquerque, NM, USA.Brown, D. W., Agnew, S. R., Bourke, M. A. M., Holden, T. M., Vogel,
S. C. & Tome, C. N. (2005). Mater. Sci. Eng. A, 399, 1–12.Budai, J. D., Yang, W., Tamura, N., Chung, J. S., Tischler, J. Z., Larson,
B. C., Ice, G. E., Park, C. & Norton, D. P. (2003). Nat. Mater. 2, 487–492.Bunge, H. J. & Morris, P. R. (1982). Texture Analysis in Materials
Science: Mathematical Methods. London: Butterworths.Cahn, R. W. (1954). Adv. Phys. 3, 363–445.Calbick, C. J. & Marcus, R. B. (1967). Acta Cryst. 23, 12–17.Chen, K., Dejoie, C. & Wenk, H.-R. (2012). J. Appl. Cryst. 45, 982–989.Chen, K., Kunz, M., Tamura, N. & Wenk, H. R. (2011). Phys. Chem.
Miner. 38, 491–500.Chen, K., Kunz, M., Tamura, N. & Wenk, H.-R. (2015). Geology, 43,
219–222.
Chen, K., Tamura, N., Tang, W., Kunz, M., Chou, Y. C., Tu, K. N. &Lai, Y. S. (2010). J. Appl. Phys. 107, 063502.
Cheneau-Spath, N., Fillit, R. Y. & Driver, J. H. (1994). J. Appl. Cryst.27, 980–987.
Christian, J. W. & Mahajan, S. (1995). Prog. Mater. Sci. 39, 1–157.Ferrill, D. A., Morris, A. P., Evans, M. A., Burkhard, M., Groshong,
R. H. Jr & Onasch, C. M. (2004). J. Struct. Geol. 26, 1521–1529.Glinnemann, J., King, H. Jr, Schulz, H., Hahn, T., La Placa, S. &
Dacol, F. (1992). Z. Kristallogr. 198, 177–212.Gonzalez-Manas, M., Caballero, M. A., Capelle, B. & Epelboin, Y.
(1993). J. Appl. Cryst. 26, 122–127.Guo, H., Chen, K., Oh, Y., Wang, K., Dejoie, C., Syed Asif, S. A.,
Warren, O. L., Shan, Z. W., Wu, J. & Minor, A. M. (2011). NanoLett. 11, 3207–3213.
He, Y. & Jonas, J. J. (2007). J. Appl. Cryst. 40, 559–569.Heinz, A. & Neumann, P. (1990). Acta Metall. Mater. 38, 1933–1940.Householder, A. S. (1958). J. ACM, 5, 339–342.Ice, G. E. & Barabash, R. I. (2007). Dislocations in Solids, Vol. 13,
edited by F. R. N. Nabarro & J. P. Hirth, pp. 499–601. Amsterdam:Elsevier.
Kaschner, G. C., Tome, C. N., Beyerlein, I. J., Vogel, S. C., Brown,D. W. & McCabe, R. J. (2006). Acta Mater. 54, 2887–2896.
Koch, E. (2004). International Tables for Crystallography, Vol. C,edited by E. Prince. Dordrecht: Kluwer Academic Publishers.
Kocks, U. F., Tome, C. N. & Wenk, H.-R. (2000). Texture andAnisotropy: Preferred Orientations in Polycrystals and Their Effecton Materials Properties. Cambridge University Press.
Konopka, K. & Wyrzykowski, J. W. (1997). J. Mater. Process. Technol.64, 223–230.
Kunz, M. et al. (2009). Rev. Sci. Instrum. 80, 035108.Li, N., Wang, Y. D., Liu, W. J., An, Z. N., Liu, J. P., Su, R., Li, J. & Liaw,
P. K. (2014). Acta Mater. 64, 12–23.Likhachev, A. A. & Ullakko, K. (2000). Phys. Lett. A, 275, 142–151.Lupinacci, A., Chen, K., Li, Y., Kunz, M., Jiao, Z., Was, G. S., Abad,
M. D., Minor, A. M. & Hosemann, P. (2015). J. Nucl. Mater. 458, 70–76.
Matthies, S., Wenk, H.-R. & Vinel, G. W. (1988). J. Appl. Cryst. 21,285–304.
Mun, B. S., Chen, K., Leem, Y., Dejoie, C., Tamura, N., Kunz, M., Liu,Z., Grass, M. E., Park, C., Yoon, J., Lee, Y. Y. & Ju, H. (2011). Phys.Status Solidi (RRL), 5, 107–109.
Niewczas, M. (2010). Acta Mater. 58, 5848–5857.Proust, G., Tome, C. N. & Kaschner, G. C. (2007). Acta Mater. 55,
2137–2148.Rossmann, M. G. (1961). Acta Cryst. 14, 383–388.Salem, A. A., Kalidindi, S. R. & Semiatin, S. L. (2005). Acta Mater. 53,
3495–3502.Santamarta, R. & Schryvers, D. (2004). Intermetallics, 12, 341–348.Savytskii, D. I., Trots, D. M., Vasylechko, L. O., Tamura, N. &
Berkowski, M. (2003). J. Appl. Cryst. 36, 1197–1203.Straumanis, M. E. (1949). J. Appl. Phys. 20, 726–734.Tamura, N. (2014). Strain and Dislocation Gradients from Diffraction:
Spatially Resolved Local Structure and Defects, edited by R.Barabash & G. Ice, pp. 125–155. London: Imperial College Press.
Tamura, N., MacDowell, A. A., Spolenak, R., Valek, B. C., Bravman,J. C., Brown, W. L., Celestre, R. S., Padmore, H. A., Batterman,B. W. & Patel, J. R. (2003). J. Synchrotron Rad. 10, 137–143.
Van Tendeloo, G., Van Landuyt, J. & Amelinckx, S. (1975). Phys.Status Solidi A, 30, 11–15.
Wang, L., Barabash, R., Bieler, T., Liu, W. & Eisenlohr, P. (2013). Met.Mater. Trans. A, 44, 3664–3674.
Wang, Y.-D., Liu, W., Lu, L., Ren, Y., Nie, Z.-H., Almer, J., Cheng, S.,Shen, Y.-F., Zuo, L., Liaw, P. K. & Lu, K. (2010). Adv. Eng. Mater.12, 906–911.
Wilkinson, A. J., Meaden, G. & Dingley, D. J. (2006). Mater. Sci.Technol. 22, 1271–1278.
Zhu, Y., Liao, X. & Valiev, R. (2005). Appl. Phys. Lett. 86, 103112.Zinserling, K. & Schubnikow, A. (1933). Z. Kristallogr. 85, 454–461.
research papers
J. Appl. Cryst. (2015). 48, 747–757 Li, Wan and Chen � Crystal twinning characterization 757


![Nonlinear hydrodynamic theory of crystallization · proposed simple phase-field crystal (PFC) model [8–10]. The DFT models characterize the local state of the matter by the time-averaged](https://img.pdfslide.us/doc/110x75/5f7ba9ce2a14f7750765cf45/nonlinear-hydrodynamic-theory-of-crystallization-proposed-simple-phase-ield-crystal.jpg)


![Australia’s Resource Industry – A Look into the Crystal Ball · 6/5/2019 · 5/6/2019 Australia’s Resource Industry – A Look into the Crystal Ball | Speeches | RBA [*] Australia’s](https://img.pdfslide.us/doc/110x75/5fc212783162a949222312e9/australiaas-resource-industry-a-a-look-into-the-crystal-ball-652019-562019.jpg)