Embed Size (px)
Citation preview
Dry Bulk
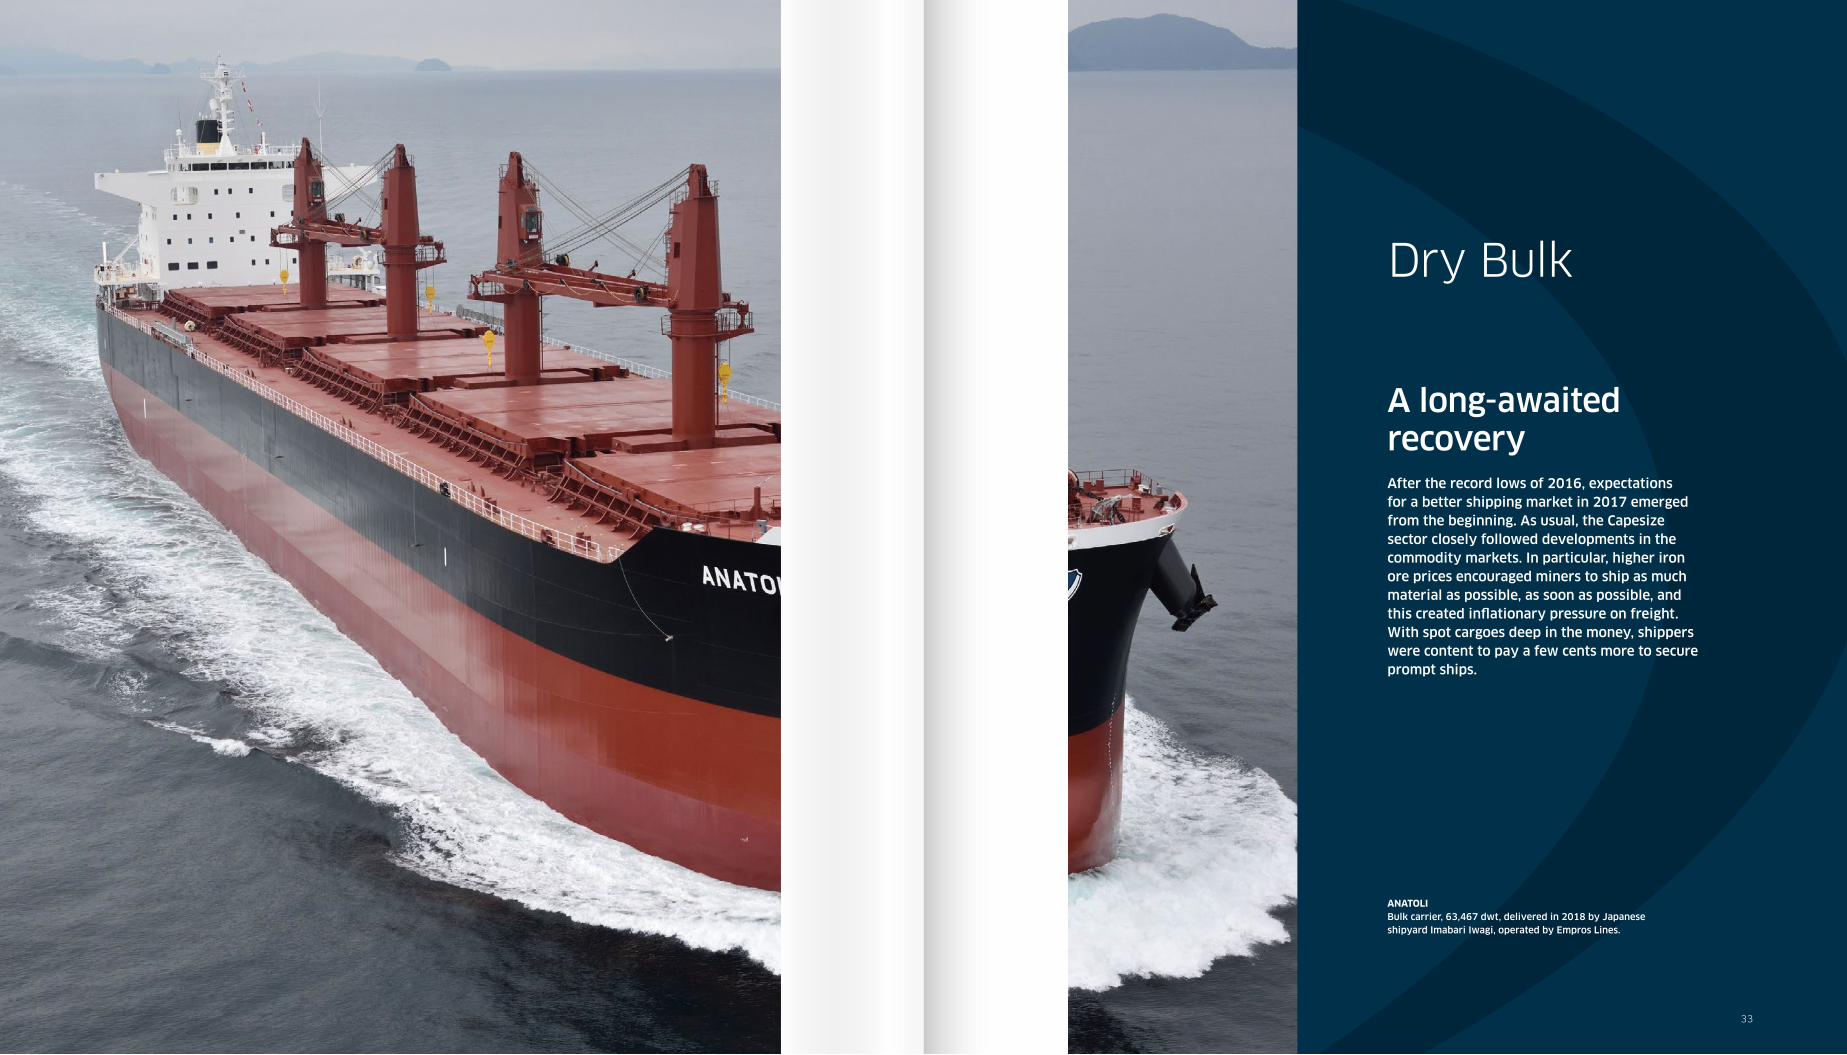
A long-awaited recoveryAfter the record lows of 2016, expectations for a better shipping market in 2017 emerged from the beginning. As usual, the Capesize sector closely followed developments in the commodity markets. In particular, higher iron ore prices encouraged miners to ship as much material as possible, as soon as possible, and this created infl ationary pressure on freight. With spot cargoes deep in the money, shippers were content to pay a few cents more to secure prompt ships.
33
ANATOLIBulk carrier, 63,467 dwt, delivered in 2018 by Japanese shipyard Imabari Iwagi, operated by Empros Lines.
BRS - Annual review 2018 35BRS - Annual review 201834
DRY BULKCHARTERING
DRY BULKCHARTERING
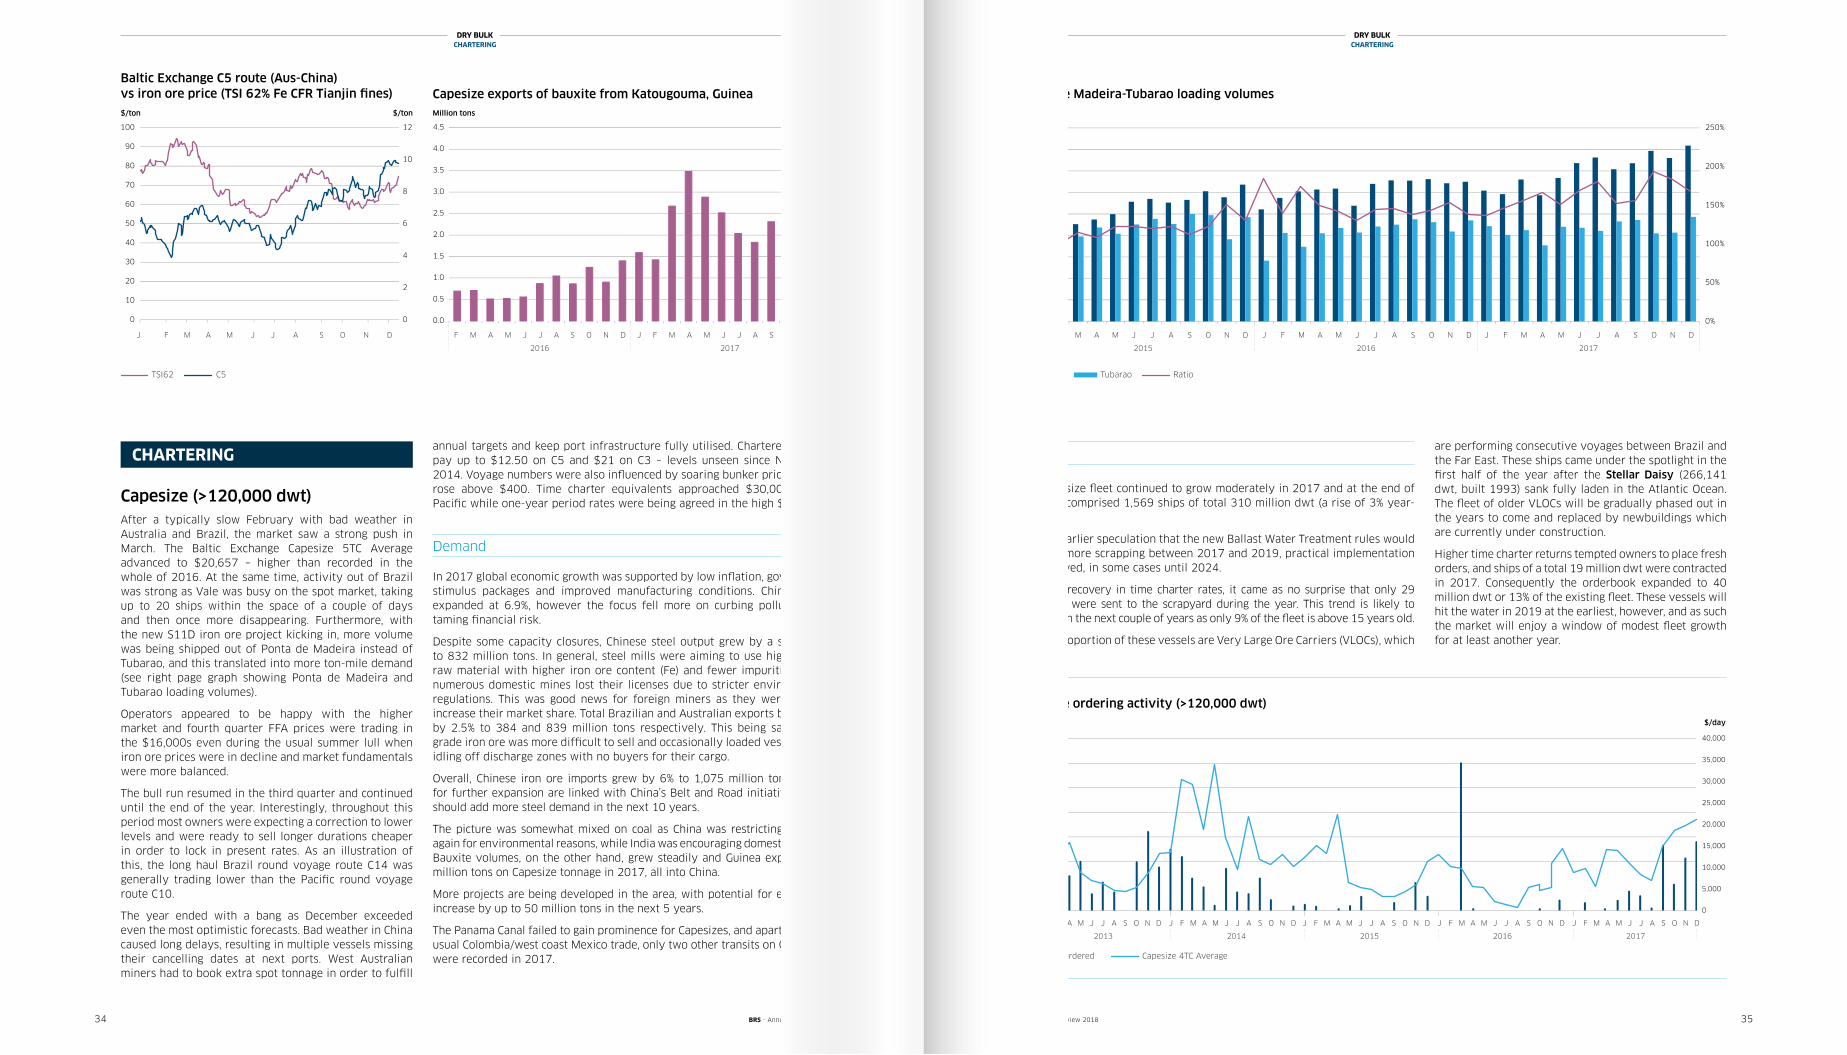
Capesize (>120,000 dwt)After a typically slow February with bad weather in Australia and Brazil, the market saw a strong push in March. The Baltic Exchange Capesize 5TC Average advanced to $20,657 – higher than recorded in the whole of 2016. At the same time, activity out of Brazil was strong as Vale was busy on the spot market, taking up to 20 ships within the space of a couple of days and then once more disappearing. Furthermore, with the new S11D iron ore project kicking in, more volume was being shipped out of Ponta de Madeira instead of Tubarao, and this translated into more ton-mile demand (see right page graph showing Ponta de Madeira and Tubarao loading volumes).
Operators appeared to be happy with the higher market and fourth quarter FFA prices were trading in the $16,000s even during the usual summer lull when iron ore prices were in decline and market fundamentals were more balanced.
The bull run resumed in the third quarter and continued until the end of the year. Interestingly, throughout this period most owners were expecting a correction to lower levels and were ready to sell longer durations cheaper in order to lock in present rates. As an illustration of this, the long haul Brazil round voyage route C14 was generally trading lower than the Pacifi c round voyage route C10.
The year ended with a bang as December exceeded even the most optimistic forecasts. Bad weather in China caused long delays, resulting in multiple vessels missing their cancelling dates at next ports. West Australian miners had to book extra spot tonnage in order to fulfi ll
CHARTERINGannual targets and keep port infrastructure fully utilised. Charterers had to pay up to $12.50 on C5 and $21 on C3 – levels unseen since November 2014. Voyage numbers were also infl uenced by soaring bunker prices, which rose above $400. Time charter equivalents approached $30,000 in the Pacifi c while one-year period rates were being agreed in the high $17,000s.
Demand
In 2017 global economic growth was supported by low infl ation, government stimulus packages and improved manufacturing conditions. Chinese GDP expanded at 6.9%, however the focus fell more on curbing pollution and taming fi nancial risk.
Despite some capacity closures, Chinese steel output grew by a strong 6% to 832 million tons. In general, steel mills were aiming to use high quality raw material with higher iron ore content (Fe) and fewer impurities, while numerous domestic mines lost their licenses due to stricter environmental regulations. This was good news for foreign miners as they were able to increase their market share. Total Brazilian and Australian exports both grew by 2.5% to 384 and 839 million tons respectively. This being said, lower grade iron ore was more diffi cult to sell and occasionally loaded vessels were idling off discharge zones with no buyers for their cargo.
Overall, Chinese iron ore imports grew by 6% to 1,075 million tons. Hopes for further expansion are linked with China’s Belt and Road initiative, which should add more steel demand in the next 10 years.
The picture was somewhat mixed on coal as China was restricting imports, again for environmental reasons, while India was encouraging domestic mining. Bauxite volumes, on the other hand, grew steadily and Guinea exported 31 million tons on Capesize tonnage in 2017, all into China.
More projects are being developed in the area, with potential for exports to increase by up to 50 million tons in the next 5 years.
The Panama Canal failed to gain prominence for Capesizes, and apart from the usual Colombia/west coast Mexico trade, only two other transits on Capesizes were recorded in 2017.
Supply
The Capesize fl eet continued to grow moderately in 2017 and at the end of the year comprised 1,569 ships of total 310 million dwt (a rise of 3% year-on-year).
Despite earlier speculation that the new Ballast Water Treatment rules would result in more scrapping between 2017 and 2019, practical implementation was delayed, in some cases until 2024.
With the recovery in time charter rates, it came as no surprise that only 29 Capesizes were sent to the scrapyard during the year. This trend is likely to continue in the next couple of years as only 9% of the fl eet is above 15 years old.
A large proportion of these vessels are Very Large Ore Carriers (VLOCs), which
0
2
4
6
8
10
12
0
10
20
30
40
50
60
70
80
90
100
1/1
7
2/1
7
3/1
7
4/1
7
5/1
7
6/1
7
7/1
7
8/1
7
9/1
7
10
/1
7
11
/1
7
12
/1
7
$/ton$/ton
Baltic Exchange C5 (Aus-China) Route vs Iron Ore Price (TSI 62% Fe CFR Tianjin �nes)
TSI62 C5
0.0
0.5
1.0
1.5
2.0
2.5
3.0
3.5
4.0
4.5
2/16 3/16 4/16 5/16 6/16 7/16 8/16 9/16 10/16 11/16 12/16 1/17 2/17 3/17 4/17 5/17 6/17 7/17 8/17 9/17 10/17 11/17 12/17
Million tons
Capesize exports of bauxite from Katougouma, Guinea
0
5,000
10,000
15,000
20,000
25,000
30,000
35,000
40,000
0
2
4
6
8
10
12
14
$/dayMillion dwt
Capesize Ordering Activity
Dwt Ordered Capesize 4TC Average
0%
50%
100%
150%
200%
250%
0
2
4
6
8
10
12
14
16
18
Million tons
Ponta de Madeira-Tubarao Discharge Volumes
PDM Tubarao Ratio
are performing consecutive voyages between Brazil and the Far East. These ships came under the spotlight in the fi rst half of the year after the Stellar Daisy (266,141 dwt, built 1993) sank fully laden in the Atlantic Ocean. The fl eet of older VLOCs will be gradually phased out in the years to come and replaced by newbuildings which are currently under construction.
Higher time charter returns tempted owners to place fresh orders, and ships of a total 19 million dwt were contracted in 2017. Consequently the orderbook expanded to 40 million dwt or 13% of the existing fl eet. These vessels will hit the water in 2019 at the earliest, however, and as such the market will enjoy a window of modest fl eet growth for at least another year.
Baltic Exchange C5 route (Aus-China) vs iron ore price (TSI 62% Fe CFR Tianjin fi nes) Capesize exports of bauxite from Katougouma, Guinea$/ton Million tons
Ponta de Madeira-Tubarao loading volumesMillion tons
0
2
4
6
8
10
12
0
10
20
30
40
50
60
70
80
90
100
1/1
7
2/1
7
3/1
7
4/1
7
5/1
7
6/1
7
7/1
7
8/1
7
9/1
7
10
/1
7
11
/1
7
12
/1
7
$/ton$/ton
Baltic Exchange C5 (Aus-China) Route vs Iron Ore Price (TSI 62% Fe CFR Tianjin �nes)
TSI62 C5
0.0
0.5
1.0
1.5
2.0
2.5
3.0
3.5
4.0
4.5
2/16 3/16 4/16 5/16 6/16 7/16 8/16 9/16 10/16 11/16 12/16 1/17 2/17 3/17 4/17 5/17 6/17 7/17 8/17 9/17 10/17 11/17 12/17
Million tons
Capesize exports of bauxite from Katougouma, Guinea
0
5,000
10,000
15,000
20,000
25,000
30,000
35,000
40,000
0
2
4
6
8
10
12
14
$/dayMillion dwt
Capesize Ordering Activity
Dwt Ordered Capesize 4TC Average
0%
50%
100%
150%
200%
250%
0
2
4
6
8
10
12
14
16
18
Million tons
Ponta de Madeira-Tubarao Discharge Volumes
PDM Tubarao RatioTSI62 C5 RatioPDM Tubarao
F M A M J J A S O N D J F M A M J J A S O N D
0
2
4
6
8
10
12
0
10
20
30
40
50
60
70
80
90
100
1/1
7
2/1
7
3/1
7
4/1
7
5/1
7
6/1
7
7/1
7
8/1
7
9/1
7
10
/1
7
11
/1
7
12
/1
7
$/ton$/ton
Baltic Exchange C5 (Aus-China) Route vs Iron Ore Price (TSI 62% Fe CFR Tianjin �nes)
TSI62 C5
0.0
0.5
1.0
1.5
2.0
2.5
3.0
3.5
4.0
4.5
2/16 3/16 4/16 5/16 6/16 7/16 8/16 9/16 10/16 11/16 12/16 1/17 2/17 3/17 4/17 5/17 6/17 7/17 8/17 9/17 10/17 11/17 12/17
Million tons
Capesize exports of bauxite from Katougouma, Guinea
0
5,000
10,000
15,000
20,000
25,000
30,000
35,000
40,000
0
2
4
6
8
10
12
14
$/dayMillion dwt
Capesize Ordering Activity
Dwt Ordered Capesize 4TC Average
0%
50%
100%
150%
200%
250%
0
2
4
6
8
10
12
14
16
18
Million tons
Ponta de Madeira-Tubarao Discharge Volumes
PDM Tubarao Ratio
2016 2017
J F M A M J J A S O N D
2015 2016 2017
0
2
4
6
8
10
12
0
10
20
30
40
50
60
70
80
90
100
1/1
7
2/1
7
3/1
7
4/1
7
5/1
7
6/1
7
7/1
7
8/1
7
9/1
7
10
/1
7
11
/1
7
12
/1
7
$/ton$/ton
Baltic Exchange C5 (Aus-China) Route vs Iron Ore Price (TSI 62% Fe CFR Tianjin �nes)
TSI62 C5
0.0
0.5
1.0
1.5
2.0
2.5
3.0
3.5
4.0
4.5
2/16 3/16 4/16 5/16 6/16 7/16 8/16 9/16 10/16 11/16 12/16 1/17 2/17 3/17 4/17 5/17 6/17 7/17 8/17 9/17 10/17 11/17 12/17
Million tons
Capesize exports of bauxite from Katougouma, Guinea
0
5,000
10,000
15,000
20,000
25,000
30,000
35,000
40,000
0
2
4
6
8
10
12
14
$/dayMillion dwt
Capesize Ordering Activity
Dwt Ordered Capesize 4TC Average
0%
50%
100%
150%
200%
250%
0
2
4
6
8
10
12
14
16
18
Million tons
Ponta de Madeira-Tubarao Discharge Volumes
PDM Tubarao Ratio
Capesize ordering activity (>120,000 dwt)Million dwt $/day
Dwt Ordered Capesize 4TC Average
2013 2014 2015 2016 2017
$/ton
J F M A M J J A S O N D J F M A M J J A S O N D J F M A M J J A S O N D
J F M A M J J A S O N D J F M A M J J A S O N D J F M A M J J A S O N D J F M A M J J A S O N D J F M A M J J A S O N D
BRS - Annual review 2018 BRS - Annual review 201836 37
To sum up, the Capesize sector saw a long-waited recovery in 2017. Expectations for the next few months are for a balanced market with healthy rates as iron ore and bauxite volumes continue to increase. Nevertheless, the outlook remains cautiously optimistic as the expanding orderbook and macroeconomic uncertainty pose some downside risks.
Babycape and Post-Panamax(87,000-122,000 dwt)After the mire of the previous year, 2017 began brightly. The period market showed this early on with a Tsuneishi built TESS 98 re-fixing for another year in February at almost double the period rate paid in 2016 for the same vessel. As a macro trend, Japanese built post-Panamaxes would continue to receive improving percentage returns versus the Baltic Exchange Panamax 4TC Average throughout 2017, as firmer commodities markets encouraged charterers to maximise. Rates of 110%-120% of the Panamax 4TC Average were not uncommon to see for large shallow Japanese built tonnage on period during the year. The more standard 93,000 dwt Chinese built vessels, which have been struggling since delivery, also benefited from stem maximisation.
The use of the neo-Panama Canal transit has been the biggest change in trading, with owners starting to make use of the locks in laden transit and ballast. We are still waiting for more volume to be shipped through, as the Cape of Good Hope option remained cheaper in most cases.
The market remains dominated by Australian exports, with western Australian shipments on Babycape (100-125,000 dwt) and east Australian loads on post-Panamaxes (87-99,000) making up a third of their respective spot market cargos.
With the first six Babycapes loaded from the Rio Tinto Amrun project, the increased volumes in the Baltic Sea and from Takoradi, it will be interesting to see how this change affects the market dynamic. Given the projected volumes, we will need some more ships. While we wrote in 2016 that Babycape was an optional size, now the sector trades as a Capesize versus Panamax arbitrage. Due to port restrictions, Babycape is the optimal ship on certain routes, therefore establishing a market in its own right.
Meantime, the Babycape supply is set to become more concentrated. Oldendorff remains the largest pure player, whilst Swissmarine now have a mixed Babycape/post-Panamax tonnage book, like that of Cargill.
With no new deliveries joining the market fleet in 2017, the Babycape orderbook remains limited, whilst the post-Panamax 2017 deliveries and orderbook were also sparse. It will be interesting to see how the new TESS 99 size integrates into the 95-100,000 dwt fleet. With Panamax operators now becoming period takers in post-Panamax/Babycape, we suspect that the demand will increase for 95-120,000 dwt tonnage, with neo-Panamax fittings becoming the norm.
During the second half of 2017 the appetite for post-Panamax and Babycape tonnage exceeded the supply. Pricing for such vessels has been an art rather than a science. Changes in the Capesize/Panamax ratio remains a strong driver for this fragile market in transition.
Excluding long-term committed vessels, there are only 85 vessels available from 100,000 to 122,000 dwt and 250 vessels ranging from 87,000 to 99,999 dwt, counting 27 different designs that could potentially mislead charterers.
Panamax (68,000-89,999 dwt)As expected, 2017 saw improvements across the board in the Panamax market. As we predicted in last year’s annual review, both commodity and freight markets saw more volatility compared to previous years, which in turn presented more trading opportunities for market participants, leading to a livelier market.
In particular a swinging market in the second and fourth quarters presented opportunities to traders and owners, as well as operators. All this combined to create a more positive outlook for the year to come.
2017 started in a steady fashion, with the Baltic Exchange Panamax 4 Time Charter Average hovering around the $7,000 mark for a sustained period of time. The end of Chinese New Year and the start of the east coast South America (ECSA) grain seasons led to a pick-up in rates and increased activity in March, and on April 18, the 4 Time Charter Average reached a temporary high for the year of $12,987. Mid-April fronthauls ex India for trips via ECSA to the Far East were being covered at $13,000-$14,000 levels, whilst the Atlantic market was trading in the mid-teens for various routes.
Although fleet growth did not yet slow (recording a rise of 3.3% in 2017), and demolition was lower than in 2016 (at 46 vessels compared to the previous year’s 110), owners were able to lock away their tonnage on period at decent levels.
Kamsarmax vessels were able to achieve $11,000-$12,000 for one-year period, depending on ship specifications. By the end of May the market had cooled with the east coast grain season unable to provide enough steam to maintain rates.
Quality Kamsarmax vessels were only able to fetch $10,000 + $400,000 ballast bonus arrival pilot station (aps) east coast South America for trips to the east, while Atlantic rounds were being concluded between $6,000 and $7,000 a day.
Naturally the summer saw a drop in market activity, though rates were largely stable. Nonetheless, we witnessed some small spikes in activity in
mid-July and mid-August, which we had not seen in previous years and which underlined the increased volatility in the market.
As usual, the fourth quarter was a busy period in the Panamax market. US Gulf grains supported the market, though east coast South America grains also remained a strong factor for pricing reasons. Furthermore, stronger coal and iron ore markets in 2017 caused a busy spell throughout the whole of the last quarter of the year, with global iron ore shipments up 6% year-on-year, and coal shipments just 0.5%.
Mid-October saw the Baltic Exchange Panamax Index climb to 1,651. Fronthauls were being covered around the $20,000 mark, while translatlantic levels were in the healthy mid-teens. Throughout November, freight markets came off slightly, only to rebound towards the end of November/beginning of December. All in all, we witnessed a very active end-of-year period.
For 2018, we expect to see a similar level of activity with the market continuing to show a sustained recovery. A reduction in newbuildings being delivered, and a healthy amount of activity in commodity markets, should support this outlook.
Volatility presented trading
opportunities
Pricing has been an art rather than a science
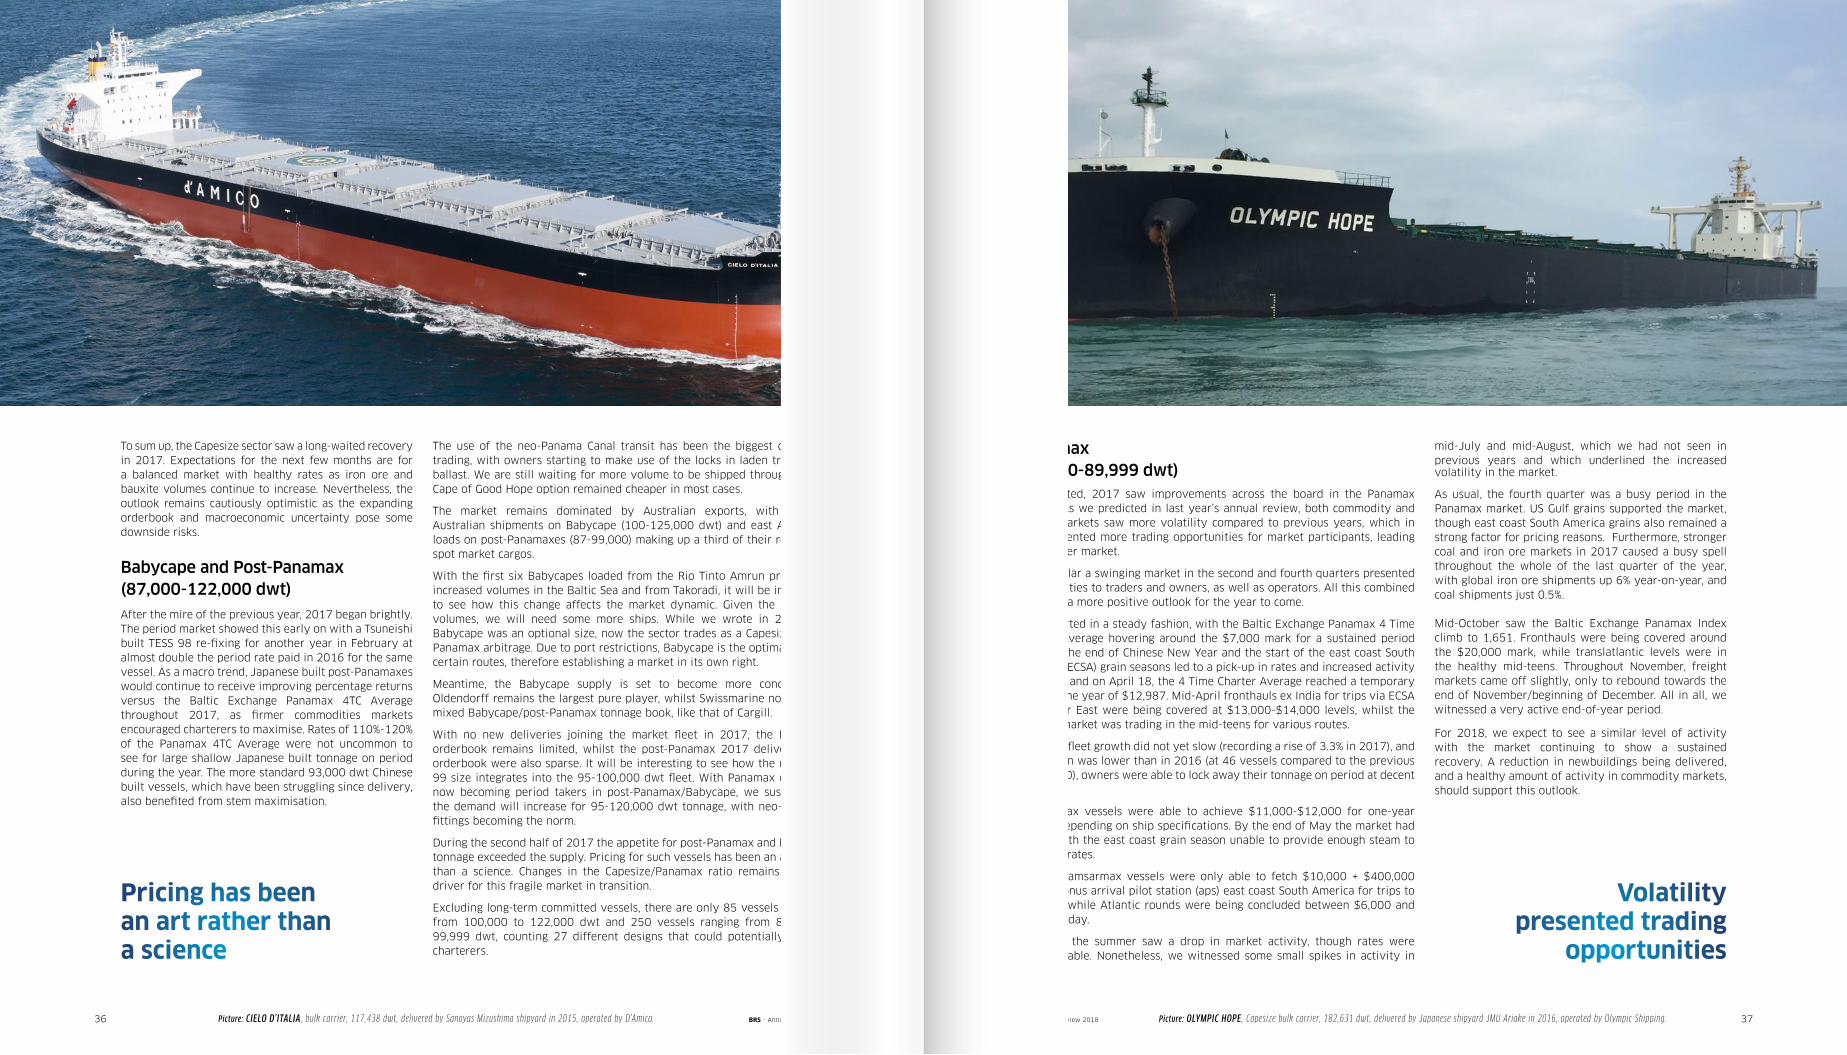
Picture: OLYMPIC HOPE , Capesize bulk carrier, 182,631 dwt, delivered by Japanese shipyard JMU Ariake in 2016, operated by Olympic Shipping.Picture: CIELO D’ITALIA , bulk carrier, 117,438 dwt, delivered by Sanoyas Mizushima shipyard in 2015, operated by D’Amico.
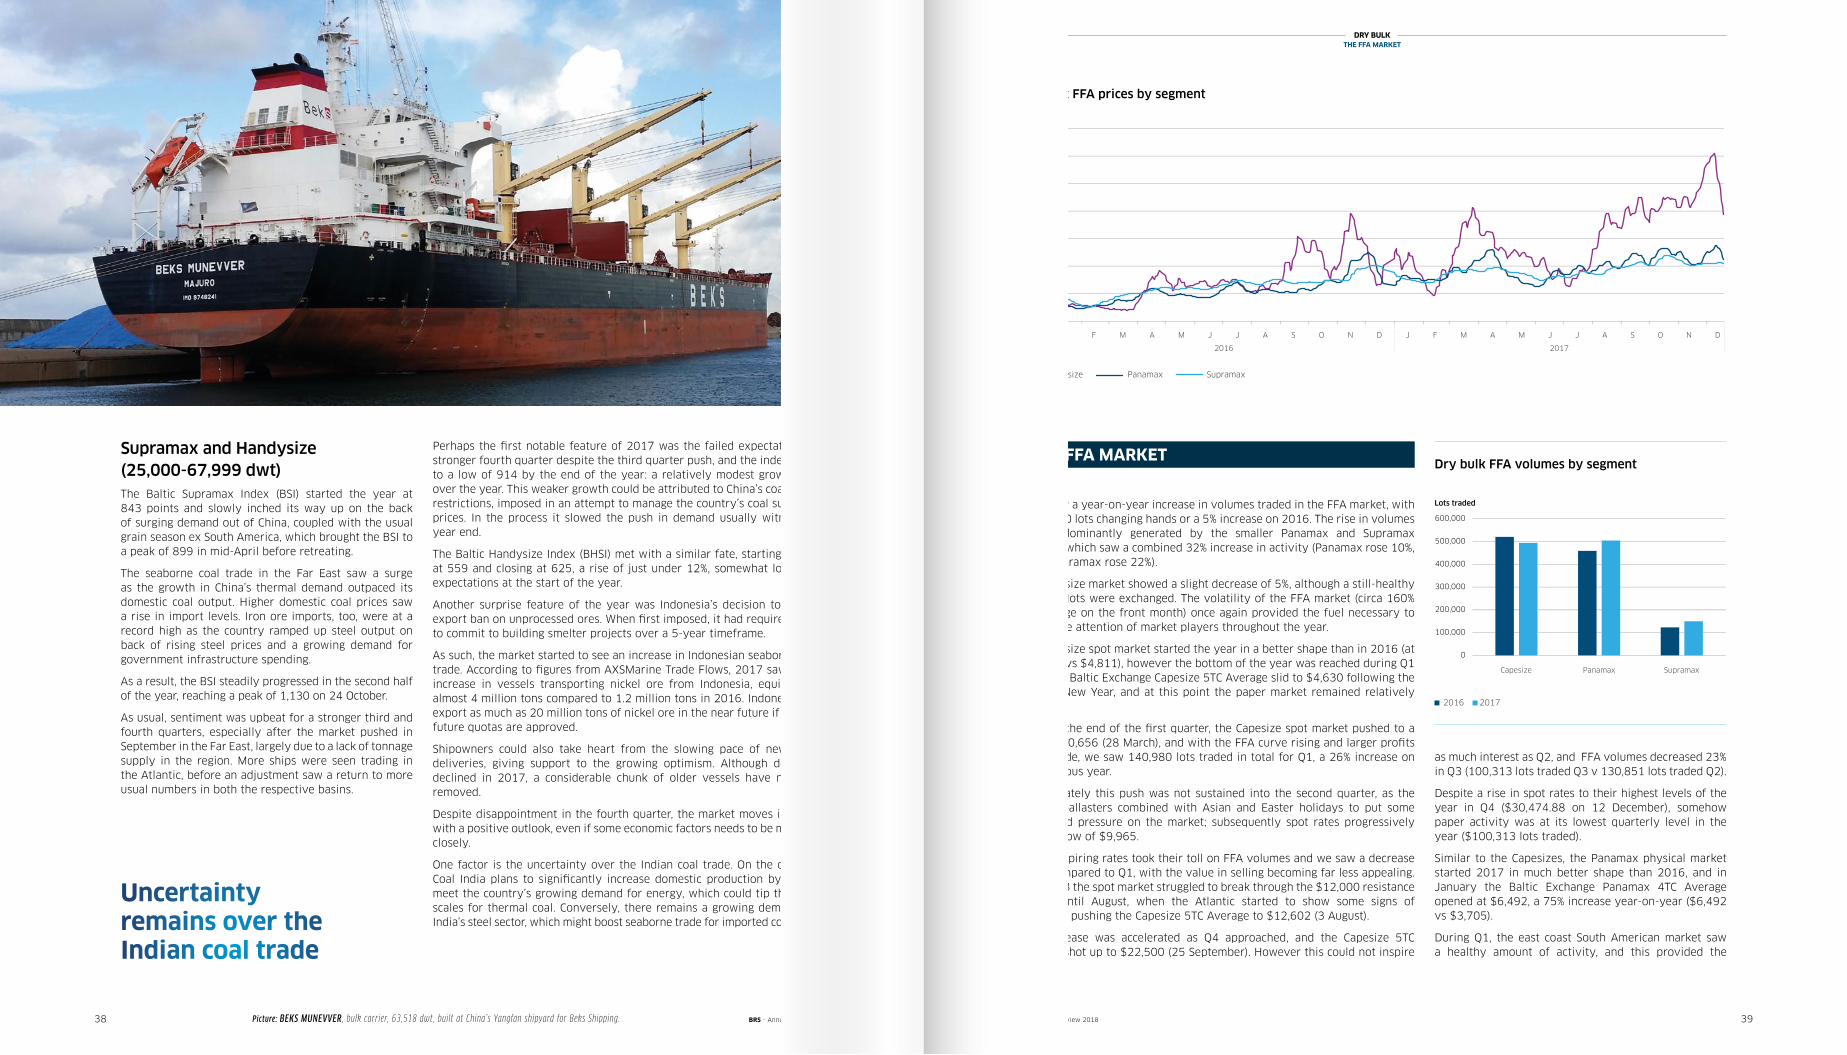
Picture: BEKS MUNEVVER , bulk carrier, 63,518 dwt, built at China’s Yangfan shipyard for Beks Shipping. BRS - Annual review 2018 BRS - Annual review 201838 39
DRY BULKTHE FFA MARKET
Supramax and Handysize (25,000-67,999 dwt)The Baltic Supramax Index (BSI) started the year at 843 points and slowly inched its way up on the back of surging demand out of China, coupled with the usual grain season ex South America, which brought the BSI to a peak of 899 in mid-April before retreating.
The seaborne coal trade in the Far East saw a surge as the growth in China’s thermal demand outpaced its domestic coal output. Higher domestic coal prices saw a rise in import levels. Iron ore imports, too, were at a record high as the country ramped up steel output on back of rising steel prices and a growing demand for government infrastructure spending.
As a result, the BSI steadily progressed in the second half of the year, reaching a peak of 1,130 on 24 October.
As usual, sentiment was upbeat for a stronger third and fourth quarters, especially after the market pushed in September in the Far East, largely due to a lack of tonnage supply in the region. More ships were seen trading in the Atlantic, before an adjustment saw a return to more usual numbers in both the respective basins.
Perhaps the fi rst notable feature of 2017 was the failed expectation for a stronger fourth quarter despite the third quarter push, and the index slipped to a low of 914 by the end of the year: a relatively modest growth of 8% over the year. This weaker growth could be attributed to China’s coal imports restrictions, imposed in an attempt to manage the country’s coal supply and prices. In the process it slowed the push in demand usually witnessed at year end.
The Baltic Handysize Index (BHSI) met with a similar fate, starting the year at 559 and closing at 625, a rise of just under 12%, somewhat lower than expectations at the start of the year.
Another surprise feature of the year was Indonesia’s decision to relax its export ban on unprocessed ores. When fi rst imposed, it had required miners to commit to building smelter projects over a 5-year timeframe.
As such, the market started to see an increase in Indonesian seaborne nickel trade. According to fi gures from AXSMarine Trade Flows, 2017 saw a 200% increase in vessels transporting nickel ore from Indonesia, equivalent to almost 4 million tons compared to 1.2 million tons in 2016. Indonesia could export as much as 20 million tons of nickel ore in the near future if expected future quotas are approved.
Shipowners could also take heart from the slowing pace of newbuilding deliveries, giving support to the growing optimism. Although demolition declined in 2017, a considerable chunk of older vessels have now been removed.
Despite disappointment in the fourth quarter, the market moves into 2018 with a positive outlook, even if some economic factors needs to be monitored closely.
One factor is the uncertainty over the Indian coal trade. On the one hand, Coal India plans to signifi cantly increase domestic production by 2019 to meet the country’s growing demand for energy, which could tip the import scales for thermal coal. Conversely, there remains a growing demand from India’s steel sector, which might boost seaborne trade for imported coking coal.
Uncertainty remains over the Indian coal trade
$/day
Dry bulk FFA rates by segment
Capesize Panamax Supramax
0
5,000
10,000
15,000
20,000
25,000
30,000
35,000
0
100,000
200,000
300,000
400,000
500,000
600,000
Capesize Panamax Supramax
Lots Traded
Dry bulk FFA volumes by segment
2016 2017
0
10
20
30
40
50
60
03/01/2012 03/11/2012 03/09/2013 03/07/2014 03/05/2015 03/03/2016 03/01/2017 03/11/2017
Million $
Dry Bulk Carrier S&P Prices - 5 years
Capesize Panamax Supramax
0
100
200
300
400
500
600
2012 2013 2014 2015 2016 2017
$/ldt
Bulk Carrier Demolition Prices
China Subcontinent
2017 saw a year-on-year increase in volumes traded in the FFA market, with 1,148,550 lots changing hands or a 5% increase on 2016. The rise in volumes was predominantly generated by the smaller Panamax and Supramax markets, which saw a combined 32% increase in activity (Panamax rose 10%, while Supramax rose 22%).
The Capesize market showed a slight decrease of 5%, although a still-healthy 494,096 lots were exchanged. The volatility of the FFA market (circa 160% on average on the front month) once again provided the fuel necessary to attract the attention of market players throughout the year.
The Capesize spot market started the year in a better shape than in 2016 (at $11,276 vs $4,811), however the bottom of the year was reached during Q1 when the Baltic Exchange Capesize 5TC Average slid to $4,630 following the Chinese New Year, and at this point the paper market remained relatively subdued.
Towards the end of the fi rst quarter, the Capesize spot market pushed to a fi rmer $20,656 (28 March), and with the FFA curve rising and larger profi ts to be made, we saw 140,980 lots traded in total for Q1, a 26% increase on the previous year.
Unfortunately this push was not sustained into the second quarter, as the fl ow of ballasters combined with Asian and Easter holidays to put some downward pressure on the market; subsequently spot rates progressively slid to a low of $9,965.
The uninspiring rates took their toll on FFA volumes and we saw a decrease of 7% compared to Q1, with the value in selling becoming far less appealing. During Q3 the spot market struggled to break through the $12,000 resistance barrier until August, when the Atlantic started to show some signs of tightness, pushing the Capesize 5TC Average to $12,602 (3 August).
This increase was accelerated as Q4 approached, and the Capesize 5TC Average shot up to $22,500 (25 September). However this could not inspire
as much interest as Q2, and FFA volumes decreased 23% in Q3 (100,313 lots traded Q3 v 130,851 lots traded Q2).
Despite a rise in spot rates to their highest levels of the year in Q4 ($30,474.88 on 12 December), somehow paper activity was at its lowest quarterly level in the year ($100,313 lots traded).
Similar to the Capesizes, the Panamax physical market started 2017 in much better shape than 2016, and in January the Baltic Exchange Panamax 4TC Average opened at $6,492, a 75% increase year-on-year ($6,492 vs $3,705).
During Q1, the east coast South American market saw a healthy amount of activity, and this provided the
THE FFA MARKET
Dry bulk FFA prices by segment$/day$/day
Dry bulk FFA rates by segment
Capesize Panamax Supramax
0
5,000
10,000
15,000
20,000
25,000
30,000
35,000
0
100,000
200,000
300,000
400,000
500,000
600,000
Capesize Panamax Supramax
Lots Traded
Dry bulk FFA volumes by segment
2016 2017
0
10
20
30
40
50
60
03/01/2012 03/11/2012 03/09/2013 03/07/2014 03/05/2015 03/03/2016 03/01/2017 03/11/2017
Million $
Dry Bulk Carrier S&P Prices - 5 years
Capesize Panamax Supramax
0
100
200
300
400
500
600
2012 2013 2014 2015 2016 2017
$/ldt
Bulk Carrier Demolition Prices
China Subcontinent
Dry bulk FFA volumes by segment
Lots traded
Capesize Panamax Supramax
Capesize Panamax Supramax
2016 2017
J F M A M J J A S O N D
2016 2017
J F M A M J J A S O N D
BRS - Annual review 2018 BRS - Annual review 201840 41
impetus to push the spot market to $11,025 by the end of March. With this fuel from the physical, paper trading was relatively active as we saw 126,655 lots traded during the first quarter.
This bullish sentiment on the spot continued until mid Q2 where we saw the spot level reach a first half of the year high of $12,987 on 18 April. However these heights were not sustained, as by 7 June we were back at $6,281 on the Panamax 4TC Average.
This volatile Q2 period was unsurprisingly the busiest for the Panamax FFAs as we saw 132,334 lots traded (a 28% increase on Q2 the previous year). With a busy grain season in Q3, and the historic Q4 sentiment playing a part, we finally reached a spot rate peak towards the end of the year of $13,740 (12 December - a four year high). With such movement it was a bit of a surprise to see the volumes for Q3 and Q4 combined increasing only 6% compared with the previous year.
Supramax volumes increased once again, notably in Q1 which saw a robust 90% year-on-year increase in volumes recorded. This quarter saw the lowest spot rates ($6,934), and healthy volatility as they ranged from $6,934 to $9,369 (+35%). Like the other FFA sizes, the highest spot level was reached in Q4 ($11,891, a 16% increase on last year’s highest spot value).
2017 FFA volumes rose 5% compared to 2016
Capesize At the end of 2016 we wrote that second hand Capesize values were likely to hold firm and rise in 2017, and this indeed occurred in quite a marked fashion.
We recorded just over 100 sale and purchase transactions during 2017 for bulk carriers over 100,000 dwt.
During the year there were many sales of vessels ‘‘en bloc’’. Plenty were done under pressure from financial institutions, with both opportunistic and traditional buyers, plus dedicated investment funds, stepping in to restructure the fragile state of several shipowners in difficulty.
Taking as our reference the value of a theoretical 180,000 dwt five-year-old ship built at a first-tier shipyard as evaluated weekly by the Baltic Exchange Sale & Purchase Assessment (BSPA) panel of brokers, we observe that prices rose by about 48% between the low point seen in early January and the high reached in mid-November, before stabilising at the end of the year.
We note the following price evolution for a vessel of this class built in 2012 ($m):
THE SECOND HAND MARKET
03/01/2017 $22.423
13/03/2017 $24.711
15/05/2017 $33.041
31/07/2017 $31.151
13/11/2017 $33.235
18/12/2017 $32.819
For the older vessels, a 10-year-old Capesize built in Japan was valued at around $16 million in early 2017, rose by about 50% to some $24 million in the second quarter of the year, then fell back to around $20.5 million at the end of the year (a drop of 14.5%).
In addition, we recorded some 33 demolition sales for bulkers over 100,000 dwt, including some 11 units of more than 200,000 dwt. This figure is well down on totals for 2016, when 82 bulkers over 100,000 dwt were scrapped.
However, while scrap sales have slowed sharply, a more favorable balance seems to have been found between supply and demand going into the new year. These more optimistic market prospects for 2018 should allow prices to hold, with a likely bullish trend in the short and medium term.
Panamax to Handysize The motto “Who Dares Wins” is often credited to the founder of the SAS, Colonel Sir David Stirling DSO OBE (1915-1990), however he may well have been inspired by a much earlier statement from the Ancient Greek historian and soldier Thucydides (460-400 BC) namely “Fortune Favours the Bold”.
As stated in our conclusion of last year’s annual review, those bold enough to purchase quality second hand tonnage in 2016 and the first half of 2017 have witnessed a spectacular appreciation in the value of their investment and should certainly reap handsome returns in the future.
During the year, financial institutions continued to offload distressed assets and forced sales continued until the third quarter of 2017.
The disposal of the remaining ships in the United Ocean fleet continued, with vessels being sold off at a regular rate of about 2 units per month (23 units in total, 16 of which were modern Kamsarmax and Supramax bulk carriers, and the remainder modern PCTCs). The fact that these vessels were a ‘‘rare’’ commodity in a ‘‘starved’’ (for modern tonnage) second hand market created fierce competition among traditional and not-so-traditional players who were eager to acquire such modern tonnage.
Other noteworthy ‘forced’ sales which were successfully concluded included:
• February-March: the Greenship Bulk Trust (part of Jaccar Holdings) - a fleet of 14 modern (built 2012-2015) ‘‘Crown-63’’ type Ultramaxes (financed by China Exim, DVB Bank and HSH Nordbank) was up for sale. Ultimately nine were sold to Eagle Bulk and five were purchased by J.P. Morgan.
• May: the 7-strong fleet (Supramaxes, Panamaxes/Kamsarmaxes, built 2007-2013) of Bariba Corp, Greece, was placed in the market in May. By the end of December all had been sold except one Kamsarmax.
At the same time, there were a few ‘’would be’’ sellers testing the market, although as of end 2017 no sales had been concluded:
• China’s Rosco fleet of 10 Panamaxes/Kamsarmaxes and 1 Capesize (all Japan built 2002-2011)
• Turkey’s Mardeniz fleet of 7 Supramaxes (all built Japan 2004-2013)
• China’s HNA (Grand China) fleet of 18 units (8 Capesizes, 9 Panamaxes/Kamsarmaxes, 1 Babycape)
At the same time freight rates improved, arming buyers with increased confidence for the future. By the end of the year, the Baltic Exchange Dry Index had risen 42% to stand at 1,366 points, and second hand values recorded gains of a similar magnitude.
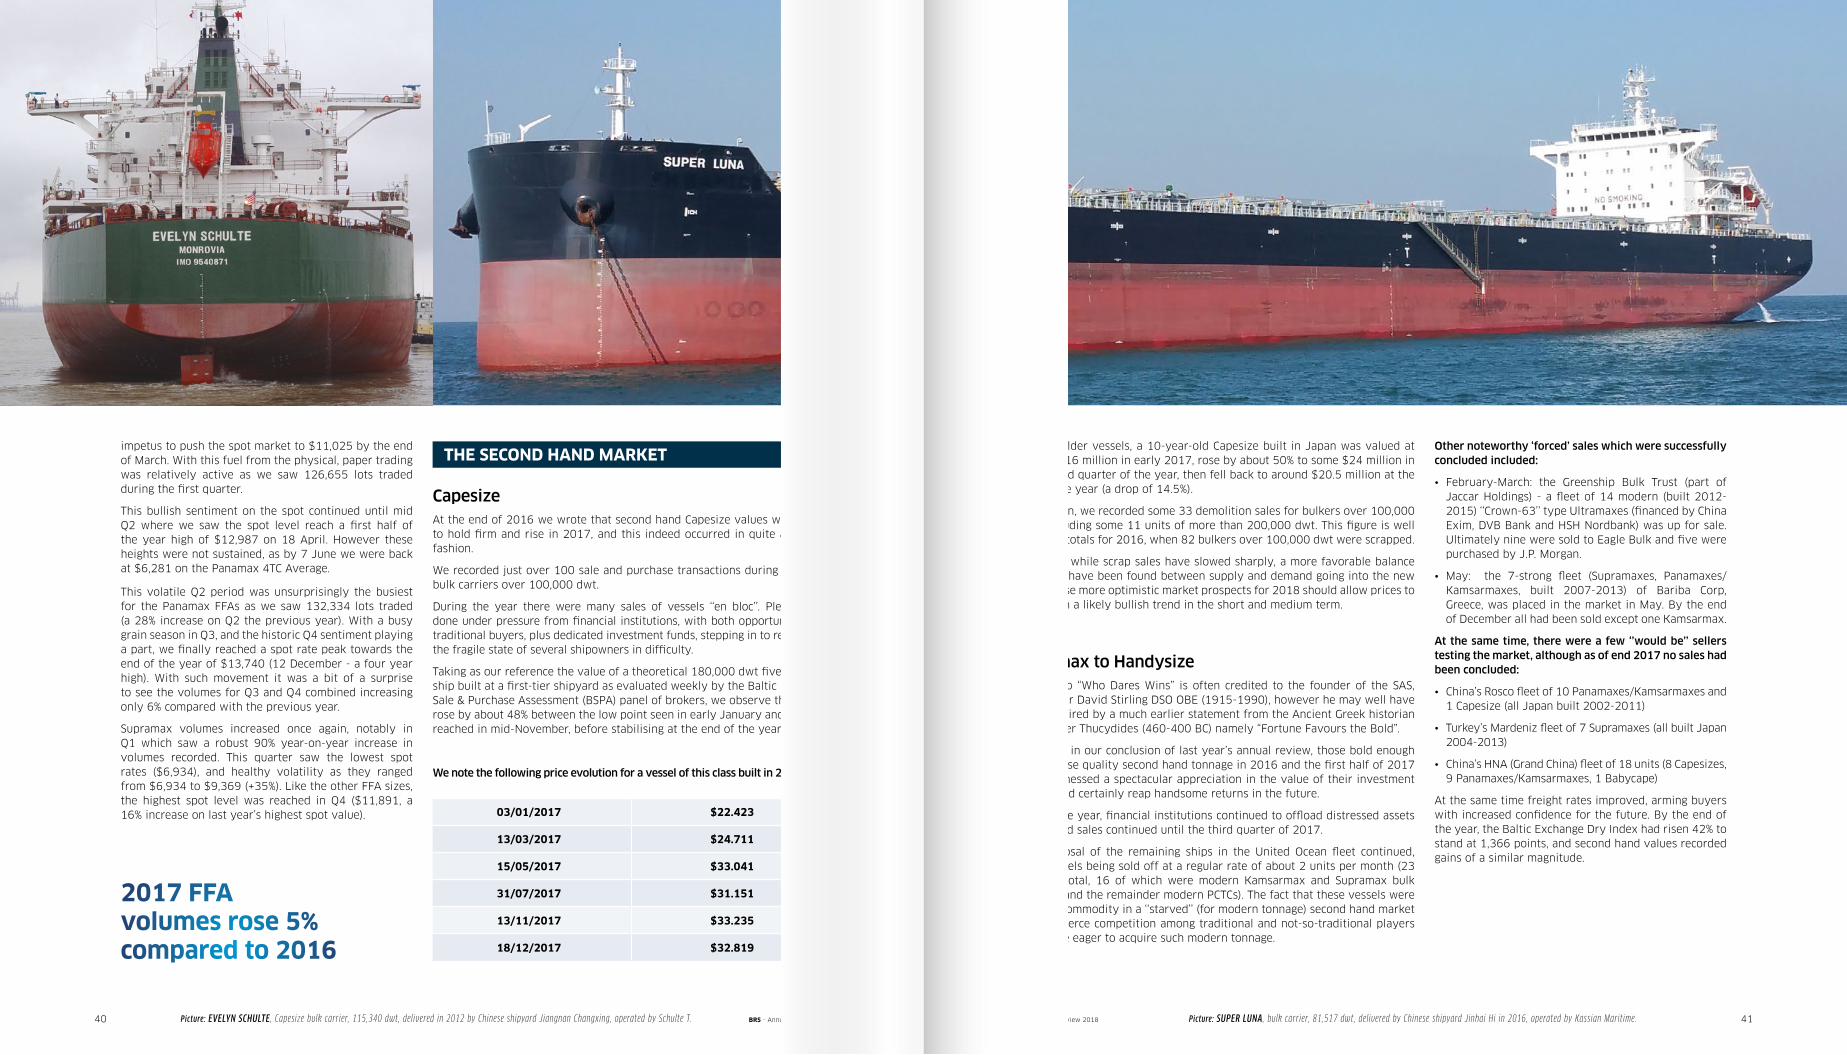
Picture: EVELYN SCHULTE , Capesize bulk carrier, 115,340 dwt, delivered in 2012 by Chinese shipyard Jiangnan Changxing, operated by Schulte T. Picture: SUPER LUNA , bulk carrier, 81,517 dwt, delivered by Chinese shipyard Jinhai Hi in 2016, operated by Kassian Maritime.
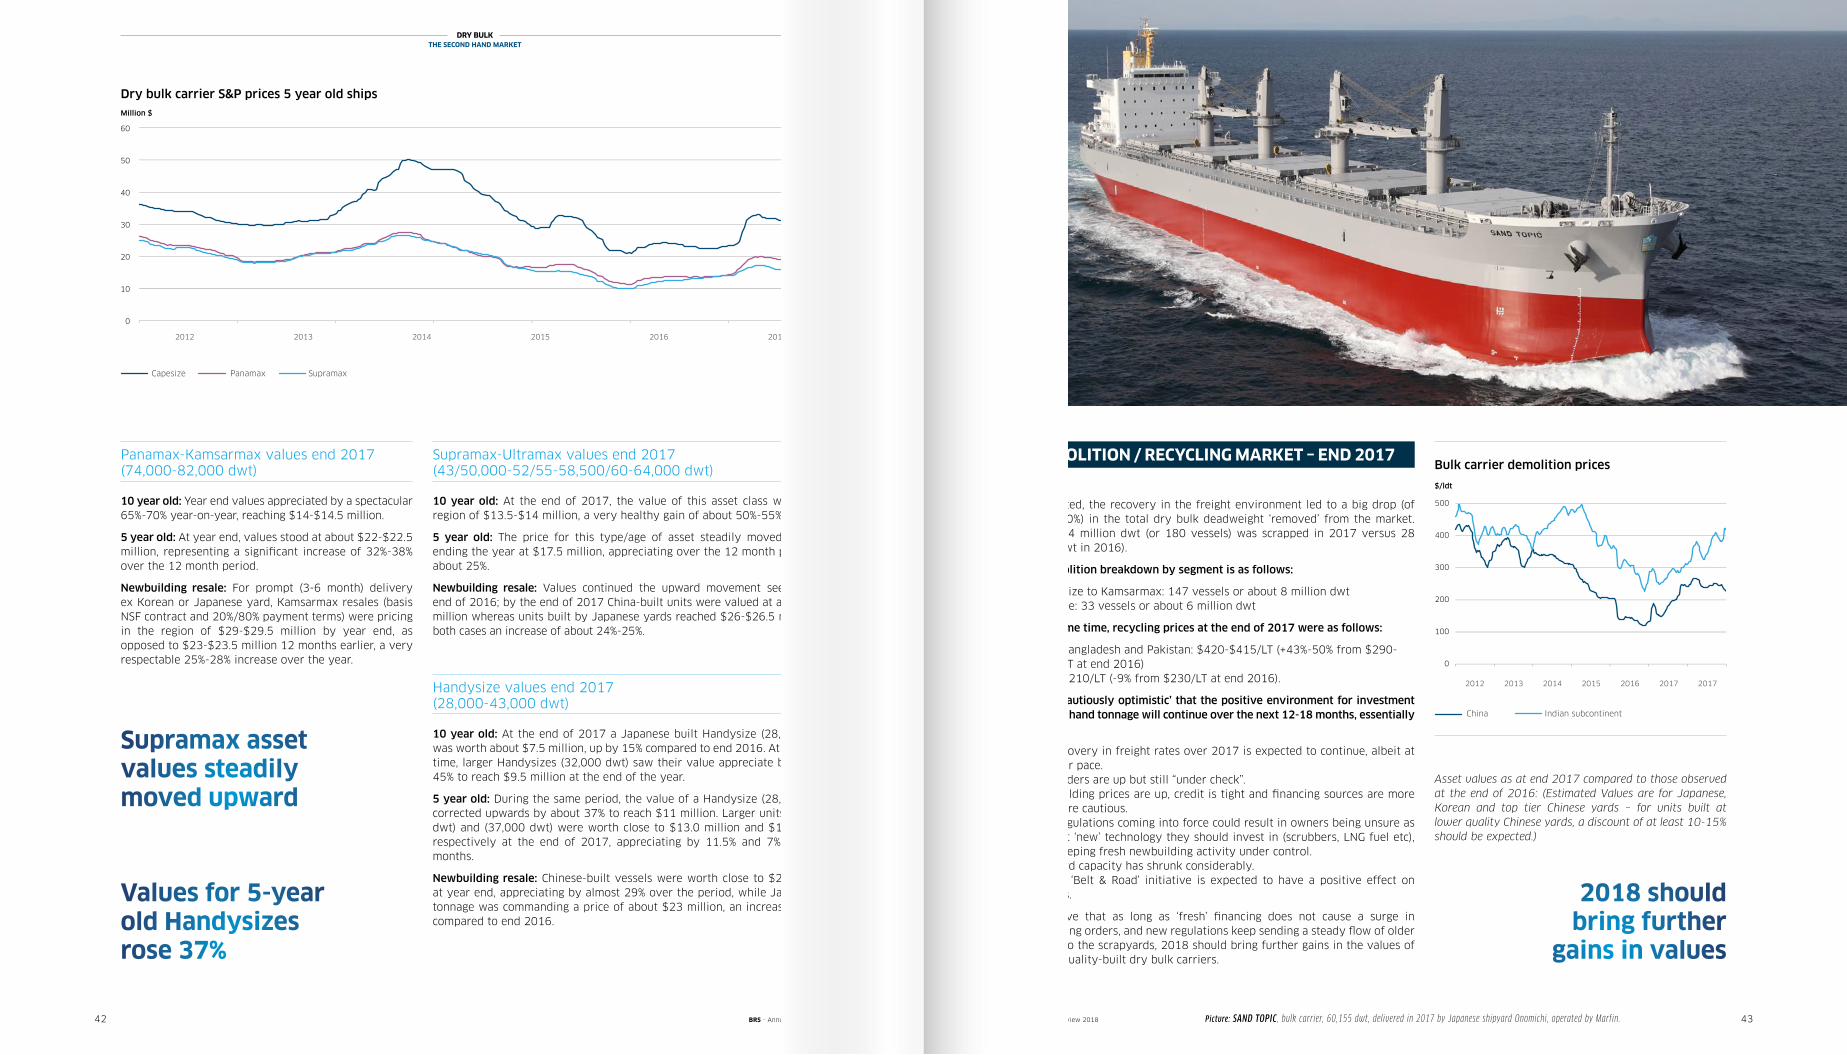
Picture: SAND TOPIC , bulk carrier, 60,155 dwt, delivered in 2017 by Japanese shipyard Onomichi, operated by Marfin.BRS - Annual review 2018 BRS - Annual review 201842 43
DRY BULKTHE SECOND HAND MARKET
Panamax-Kamsarmax values end 2017(74,000-82,000 dwt)
10 year old: Year end values appreciated by a spectacular 65%-70% year-on-year, reaching $14-$14.5 million.
5 year old: At year end, values stood at about $22-$22.5 million, representing a signifi cant increase of 32%-38% over the 12 month period.
Newbuilding resale: For prompt (3-6 month) delivery ex Korean or Japanese yard, Kamsarmax resales (basis NSF contract and 20%/80% payment terms) were pricing in the region of $29-$29.5 million by year end, as opposed to $23-$23.5 million 12 months earlier, a very respectable 25%-28% increase over the year.
Supramax-Ultramax values end 2017(43/50,000-52/55-58,500/60-64,000 dwt)
10 year old: At the end of 2017, the value of this asset class was in the region of $13.5-$14 million, a very healthy gain of about 50%-55%.
5 year old: The price for this type/age of asset steadily moved upward, ending the year at $17.5 million, appreciating over the 12 month period by about 25%.
Newbuilding resale: Values continued the upward movement seen at the end of 2016; by the end of 2017 China-built units were valued at about $23 million whereas units built by Japanese yards reached $26-$26.5 million, in both cases an increase of about 24%-25%.
Handysize values end 2017(28,000-43,000 dwt)
10 year old: At the end of 2017 a Japanese built Handysize (28,000 dwt) was worth about $7.5 million, up by 15% compared to end 2016. At the same time, larger Handysizes (32,000 dwt) saw their value appreciate by almost 45% to reach $9.5 million at the end of the year.
5 year old: During the same period, the value of a Handysize (28,000 dwt) corrected upwards by about 37% to reach $11 million. Larger units (32,000 dwt) and (37,000 dwt) were worth close to $13.0 million and $15 million respectively at the end of 2017, appreciating by 11.5% and 7% over 12 months.
Newbuilding resale: Chinese-built vessels were worth close to $21 million at year end, appreciating by almost 29% over the period, while Japan-built tonnage was commanding a price of about $23 million, an increase of 28% compared to end 2016.
Dry bulk carrier S&P prices 5 year old shipsMillion $
Bulk carrier demolition prices
$/ldt
Values for 5-year old Handysizes rose 37%
Supramax asset values steadily moved upward
As expected, the recovery in the freight environment led to a big drop (of around 50%) in the total dry bulk deadweight ‘removed’ from the market. Around 14 million dwt (or 180 vessels) was scrapped in 2017 versus 28 million dwt in 2016).
The demolition breakdown by segment is as follows:
• Handysize to Kamsarmax: 147 vessels or about 8 million dwt• Capesize: 33 vessels or about 6 million dwt
At the same time, recycling prices at the end of 2017 were as follows:
• India, Bangladesh and Pakistan: $420-$415/LT (+43%-50% from $290-$280/LT at end 2016)
• China $210/LT (-9% from $230/LT at end 2016).
We are ‘cautiously optimistic’ that the positive environment for investment in second hand tonnage will continue over the next 12-18 months, essentially because:
• The recovery in freight rates over 2017 is expected to continue, albeit at a slower pace.
• New orders are up but still “under check”.• Newbuilding prices are up, credit is tight and fi nancing sources are more
and more cautious.• New regulations coming into force could result in owners being unsure as
to what ‘new’ technology they should invest in (scrubbers, LNG fuel etc), thus keeping fresh newbuilding activity under control.
• Shipyard capacity has shrunk considerably. • China’s ‘Belt & Road’ initiative is expected to have a positive effect on
freights.
We believe that as long as ‘fresh’ fi nancing does not cause a surge in newbuilding orders, and new regulations keep sending a steady fl ow of older tonnage to the scrapyards, 2018 should bring further gains in the values of existing quality-built dry bulk carriers.
DEMOLITION / RECYCLING MARKET – END 2017
$/day
Dry bulk FFA rates by segment
Capesize Panamax Supramax
0
5,000
10,000
15,000
20,000
25,000
30,000
35,000
0
100,000
200,000
300,000
400,000
500,000
600,000
Capesize Panamax Supramax
Lots Traded
Dry bulk FFA volumes by segment
2016 2017
0
10
20
30
40
50
60
03/01/2012 03/11/2012 03/09/2013 03/07/2014 03/05/2015 03/03/2016 03/01/2017 03/11/2017
Million $
Dry Bulk Carrier S&P Prices - 5 years
Capesize Panamax Supramax
0
100
200
300
400
500
600
2012 2013 2014 2015 2016 2017
$/ldt
Bulk Carrier Demolition Prices
China Subcontinent
2018 should bring further
gains in values
$/day
Dry bulk FFA rates by segment
Capesize Panamax Supramax
0
5,000
10,000
15,000
20,000
25,000
30,000
35,000
0
100,000
200,000
300,000
400,000
500,000
600,000
Capesize Panamax Supramax
Lots Traded
Dry bulk FFA volumes by segment
2016 2017
0
10
20
30
40
50
60
03/01/2012 03/11/2012 03/09/2013 03/07/2014 03/05/2015 03/03/2016 03/01/2017 03/11/2017
Million $
Dry Bulk Carrier S&P Prices - 5 years
Capesize Panamax Supramax
0
100
200
300
400
500
600
2012 2013 2014 2015 2016 2017
$/ldt
Bulk Carrier Demolition Prices
China Subcontinent
Capesize Panamax Supramax
China Indian subcontinent
2012 2013 2014 2015 201720172016
2012 2013 2014 2015 2016 2017
Asset values as at end 2017 compared to those observed at the end of 2016: (Estimated Values are for Japanese, Korean and top tier Chinese yards – for units built at lower quality Chinese yards, a discount of at least 10-15% should be expected.)