Embed Size (px)
Citation preview

Gill Sans Bold
BiologyPreliminary CourseStage 6
A local ecosystem
Part 3: Field study
Incorporating October 2002
AMENDMENTS

Gill Sans Bold
Part 3: Field study 1
Contents
Introduction ............................................................................... 2
Field study of an ecosystem...................................................... 4
Abiotic factors .......................................................................................7
Carry out the field study ......................................................... 15
Write the report ....................................................................... 17
Exercises – Part 3 ................................................................... 19

2 A local ecosystem
Introduction
Throughout the unit, you have been gathering information that will gotowards your final report on your local ecosystem. Now you are going tobring the information you have gathered together and complete theinvestigations that you still need to do. You will carry out theinvestigations into the abiotic and biotic factors and then write the reportusing the field study scaffold.
Time management is an important skill to learn. Plan your activities thisweek so that you can complete all the necessary activities. There will betime allowed in the next part of the module for you to complete thewritten report.
In this part you will be given opportunities to:
• Choose equipment or resources and undertake a field study of a localterrestrial or aquatic ecosystem to identify data sources and:
– measure abiotic variables in the ecosystem being studied usingappropriate instruments relate this data to the distribution oforganisms
– estimate the size of a plant and animal population in anecosystem using transects and/or random quadrats
– collect, analyse and present data to describe the distribution ofthe plant and animal species whose abundance has beenestimated.
– describe two trophic interactions found between organisms in
the area studied
– identify data sources and gather, present and analyse data by:
– tabulation of data collected in the study
– calculation of mean values with ranges.
– graphing changes with time in the measured abiotic data
– evaluating variability in measurements made duringscientific investigations.

Gill Sans Bold
Part 3: Field study 3
• process and analyse information and present a report of theinvestigation of an ecosystem in which the purpose is introduced, themethods described and the results shown graphically and useavailable evidence to discuss their relevance
• gather information from first-hand and secondary sources toconstruct food chains and food webs to illustrate the relationshipsbetween member species in an ecosystem.
Extracts from Biology Stage 6 Syllabus © Board of Studies NSW, originallyissued 1999. The most up-to-date version can be found on the Board’s websiteat http://www.boardofstudies.nsw.edu.au/syllabus_hsc/index.html. This versionOctober 2002.

4 A local ecosystem
Field study of anecosystem
During this week you will complete the field study component of thismodule. When reading the syllabus points that you will be covering thisweek, the task looks daunting. You have already completed some ofthese tasks. This week you will complete the compulsory practicalactivity.
Virtual field trip
To make your own investigations easier carry out the virtual field trip ona mangrove ecosystem. This virtual field trip is on the Internet. If youdon’t have access to the Internet at home, you may be able to visit yourlocal distance education centre or a local library. In this virtual field trip,all the points that have to be covered by the syllabus are included.Practise carrying out this field study before you start on your own.You may use this as your field study if you cannot physically carry out afield study.
URL http://www.lmpc.edu.au/science
The report scaffold will help you to structure your information in ascientific way. If you feel confident to write your report without helpthen you will not need to use the scaffold. Find the Field study scaffoldnow and have a look at what you must do to complete the task.

Gill Sans Bold
Part 3: Field study 5
Planning a field trip
To carry out a field trip there are several steps that you need to follow
• choose your study area
• carry out a risk assessment
• choose and gather your equipment
• plan what data you will collect
• carry out the field study
• write the report
Use the information below to plan your field trip.
Choosing a study area
The study area that you decide on will probably be determined by whereyou live. If you have easy access to a natural area then choose that if notyou could study a local reserve. If all else fails there is always your ownbackyard. Examples of ecosystems are a balanced aquarium, leaf litterarea, dam, pond, stream, lake, mangrove, sand dune area, woodland,forest, grassland. Keep in mind the time that you have to completeyour study.
Answer Exercise 3.1
Suggestions of possible study area
Leaf litter
A forest area will have leaf litter. You can study the leaf litter. Theabiotic factors that you can look at are temperature and depth of litter.When looking at leaf litter wear gloves so that you are protected againstbites. For the biotic factors use a small quadrat. A suitable quadratwould be 25cm x 25 cm.
Collect the leaf litter using a shovel and place it on newspaper or in abaking dish. Count the animals present in your quadrat by slowlyremoving the larger pieces.

6 A local ecosystem
Paddock
You may be able to count the number of ants present in your paddock byusing a metre-square quadrat. Plants can be counted for abundance or forpercentage cover. A transect across a paddock is a good method to findthe distribution of plants. Measure some abiotic factors such astemperature and water content of the soil.
Preparation
Before you start your study, you need to be fully prepared.
Remember to respect the area that you are studying.The community is alive. If you turn over a stone or a log makesure you return it to the way it was. Do not collect specimensunless it is necessary. Disturb the environment as little as possible
Safety
When working outside make sure you wear sensible footwear andclothing. Wear blockout cream and a hat and carry water. Insectrepellent may be necessary. Tell someone where you are going.
Answer Exercise 3.2
Risk assessment
Risk assessment is a process that you go through to analyse the effects ofyour actions. It is used in industry to predict possible dangers that mayoccur. Think about the possible dangers that may occur during your fieldstudy. Discuss these risks now with your supervisor.
Answer Exercise 3.3
Gill Sans Bold
Part 3: Field study 7
Abiotic factors
Equipment
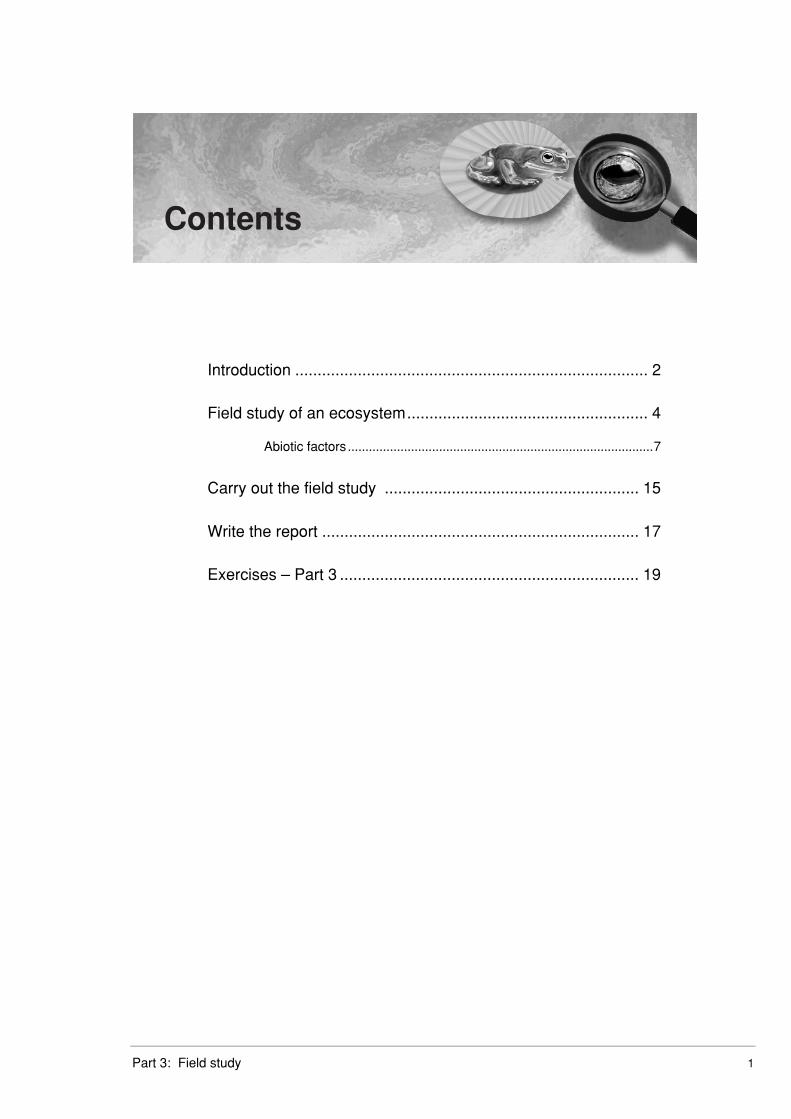
As a professional biologist, you would have a range of equipmentavailable to carry out your investigation. Unfortunately as a student youwill not have this range. What you have to decide at this point is theresources that you do have available. This will determine the abioticfactors that you will measure. Here is a list of resources that you mayhave. Go though the list and tick the ones that you have. Some areinstruments that you may have access to, others are simple pieces ofequipment that you will have around the house. Gather the resourcestogether before starting your study. The resources that you have willdetermine the abiotic features that you are able to measure.
Equipment Tick
Datalogger
A datalogger is a machine that records information in the field.The datalogger has different probes that record different factors.For example, you may want to measure
• temperature
• humidity
• the amount of rain
• dissolved oxygen
• growth
• salinity
• light intensity
Thermometer
A thermometer can be used to measure air or water temperature. Itis also useful for measuring the temperature of leaf litter.
A ruler
You can measure the depth of leaf litter or soil layers. Use theruler to measure out your quadrat.
Equipment Tick

8 A local ecosystem
Shovel
Use to collect leaf litter or to examine the soil.
A strip of paper
This will help you decide on wind direction. Hold the strip up andsee which way the wind is blowing.
A compass
Helpful for wind direction and for aspect.
Equipment Tick
Soil testing or pool pH kit or pH paper
You can use this to work out the pH of soil or water.
Scales
Weigh the soil, then evaporate the water and weigh again.
30 metre tape measure
Use to measure out transect.
Clipboard and pencil
To record your data.
Light meter
For measuring the amount of light.
Secchi disk
This disk measures turbidity (clearness of water).
Rain gauge
To measure rainfall over a long period.
Universal indicator paper
To measure the pH. Place 8 drops of water in 5 mL of water andcheck the colour chart.

Gill Sans Bold
Part 3: Field study 9
A test-tube or glass container
Place soil in the container and add water. Note the level of water.
Let the soil stand and then see how much water has soaked intothe soil. This will tell you how much water or how many airspaces are in the soil.
Cobalt chloride paper
This will tell you about the presence of water.
Camera
To record the site.
Answer Exercise 3.4
Plan what data you will collect
Once you know the equipment you have here is a list of the features thatyou may decide to measure. Remember you only have to measure someabiotic factors in your ecosystem. Look for changes in vegetation as thismay be reflected in changes in abiotic factors.
Abiotic factors to measure
These are suggestions of possible abiotic factors to measure.
• Aspect. The direction that the area faces. Whether it is cold andexposed or sheltered.
• Slope. Estimate this. Somewhere between 0-90 degrees. Does itdrain or is it swampy?
• Exposure. Estimate how exposed the site is to wind. Design a five-point scale.
• Salinity. Express as a scale from freshwater to saltwater.
• Temperature. If you don’t have a thermometer, estimate thetemperature or listen to a weather report for your area. Astemperature changes all the time, you should take the temperature atdifferent times.
• Surface. Rock or soil? Is it crumbly or hard?

10 A local ecosystem
• Light. Use a light meter or a datalogger. If you don’t have one ofthese you can estimate the amount of light on a scale of 1 to 5 where1 is dark and 5 is bright sunlight
• Soil pH. Use a testing kit or datalogger. Small changes in soil pHcan dramatically change the vegetation.
• Description of the soil. Soil can have many different features.
Dig a small hole and see how thick the topsoil is. If you canfind a cutting or a bank, you can draw the soil layers.Describe the soil. Is it
– sandy/clayey
– rich in humus/not rich in humus
– deep leaf litter/shallow leaf litter
– held together tightly by roots/easily eroded?
• Turbidity. This is the clearness of the water. It is important forphotosynthesis. Use a secchi disk. You can make one of these withsome string, a disk of wood or plastic that you have painted. Or usethe template below. The disk is then lowered into the water andbrought slowly to the surface. When you can just see the disk, youmeasure the length of string to the surface. Repeat the experimentand average the results.
A template for a secchi disk
• Water quality. Is there run-off from industry or houses? Is there alot of water available or not?
• Local climate. Including rainfall, humidity, wind direction, sunlighthours.

Gill Sans Bold
Part 3: Field study 11
Answer Exercise 3.5
You have to measure at least two different abiotic variables. This willdepend on your own ingenuity to decide which ones to measure.
Suggestions for measuring abiotic factors
If you have a thermometer you could measure air temperature and soiltemperature as two examples of abiotic factors. Choose three sites alongyour transect and take readings every half an hour and put the results onthe first page of the Results section of the Field study scaffold.
Record the distribution of vegetation along a transect line and take soilprofiles at three sites along your transect.
You will have to present your data in a table and then graph your resultsagainst time.
Hints for constructing tables
• Every table needs a title.
• Every column should have a heading.
• Units of measurement should be included.
• Figures should be aligned.
• A zero means that the reading was zero and not that the reading wasmissed.
• Do not use ditto marks for identical readings.
Graphing changes of abiotic factors against time
You also need to work out the mean and the range of your measurements.The mean is the average of your readings. For example, if you weremeasuring air temperature in your study area and you got the followingresults.
Time Temperature °C
6:00 am 4
7:00 am 6
8:00 am 10
9:00 am 15

12 A local ecosystem
10:00 am 17
11:00 am 19
noon 21
1:00 pm 21
2:00 pm 21
3:00 pm 20
4:00 pm 19
5:00 pm 19
6:00 pm 19
The mean temperature for this result would be worked out by adding allthe temperatures and dividing by the number of readings.
Mean temperature = 134
9 = 14.8 o C
The range of temperatures goes from 4 o C to 21 o C
Answer Exercise 3.6
When you have to graph a result, it is a good idea to use a spreadsheet ona computer. This is what professional scientists use.

Gill Sans Bold
Part 3: Field study 13
Screen shot reprinted by permission from Microsoft Corporation
When you have measured your abiotic factor, relate this to the distributionof organisms in your study area. Put this on the first page of the Discussionsection in your Field study scaffold.
Evaluating variability in measurement
You may find that some of your results do not fit in with the rest of yourdata. These points are called outliers. They can usually be explained bysome error in the measurement. When you are working in the field errorsin measurement may occur. Your equipment may not be operatingcorrectly. For this reason, it is important to look at the variability of yourresults.
Biotic factors
The next step is to record the biotic factors of your study area. Here is alist of equipment you may need.
Equipment list
Read through the list and tick if you have the resource.

14 A local ecosystem
Equipment Tick
String, pegs and a hammer
To make a quadrat
A microscope
To examine water and soil for micro-organisms.
Binoculars
Use for animal observations.
30 metre tape measure or piece of string
Use for transects
Answer Exercise 3.7
Gill Sans Bold
Part 3: Field study 15
Carry out the field study
Observations
Sit quietly in your area and observe the living things especially theinsects. Remember that many Australian animals are nocturnal and sleepduring the day.
Fill in the work sheet of animals in the Field study scaffold (Table 1).
The plants are the easiest to observe because they are so obvious. Recordthe names of all the plants you know. The plants that you don’t knowcan be called Unknown 1, Unknown 2 etc.
Record details of each plant that you see (Table 2).
If you observe any interactions between animals and plants start drawinga food web for your study area. Look for evidence of parasitism,commensalism, mutualism, and predator/prey relationships. Look forscavengers and decomposers. Fill in Table 4.
Sampling techniques
You have learnt about sampling techniques in Part 1. These techniquesare useful for working out how many of each species is in your area.Now I want you to use your knowledge to estimate the size of one animaland one plant species from your local ecosystem. Write down the nameof the animal and the plant that you are going to estimate.
_________________________________________________________
_________________________________________________________
_________________________________________________________
_________________________________________________________
Here is a summary of the techniques to use.
16 A local ecosystem
Transects (Sampling 2 - Distribution of a plant Transects sheet)
Use transects to work out the distribution of your chosen organism.
Use a 30-metre length of string or tape measure. You have to decidewhether your transect will be continuous, a point or a strip transect.
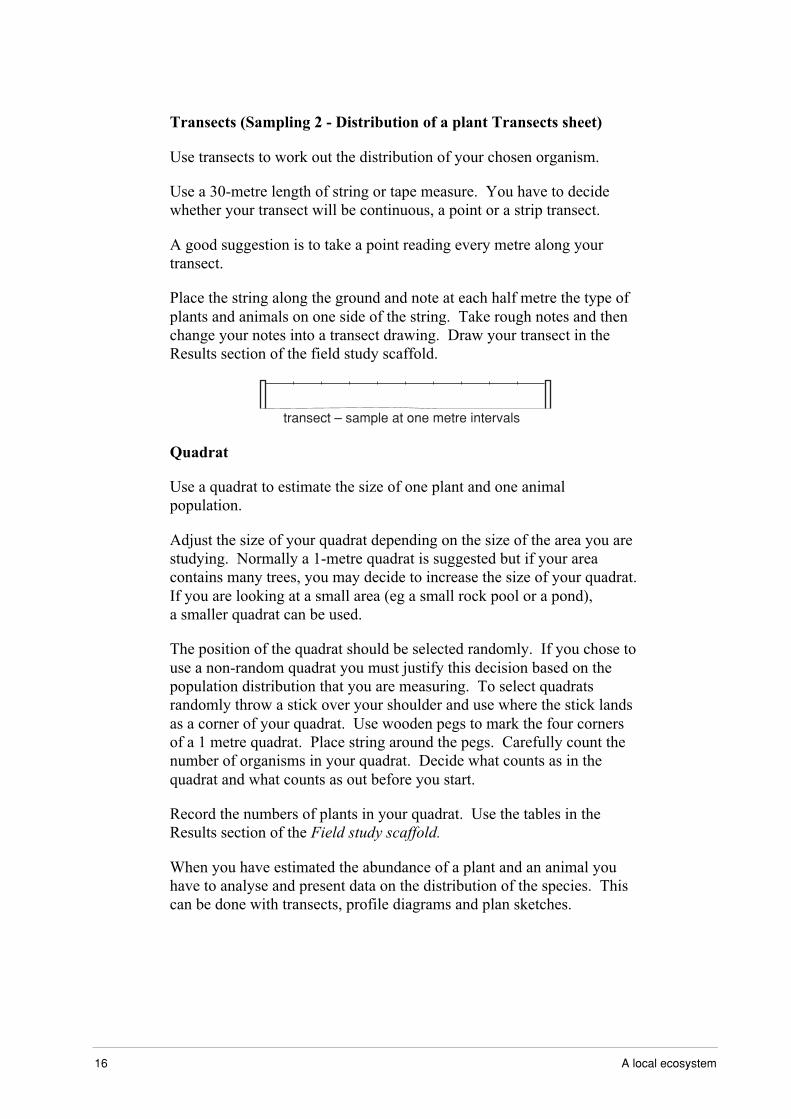
A good suggestion is to take a point reading every metre along yourtransect.
Place the string along the ground and note at each half metre the type ofplants and animals on one side of the string. Take rough notes and thenchange your notes into a transect drawing. Draw your transect in theResults section of the field study scaffold.
transect – sample at one metre intervals
Quadrat
Use a quadrat to estimate the size of one plant and one animalpopulation.
Adjust the size of your quadrat depending on the size of the area you arestudying. Normally a 1-metre quadrat is suggested but if your areacontains many trees, you may decide to increase the size of your quadrat.If you are looking at a small area (eg a small rock pool or a pond),a smaller quadrat can be used.
The position of the quadrat should be selected randomly. If you chose touse a non-random quadrat you must justify this decision based on thepopulation distribution that you are measuring. To select quadratsrandomly throw a stick over your shoulder and use where the stick landsas a corner of your quadrat. Use wooden pegs to mark the four cornersof a 1 metre quadrat. Place string around the pegs. Carefully count thenumber of organisms in your quadrat. Decide what counts as in thequadrat and what counts as out before you start.
Record the numbers of plants in your quadrat. Use the tables in theResults section of the Field study scaffold.
When you have estimated the abundance of a plant and an animal youhave to analyse and present data on the distribution of the species. Thiscan be done with transects, profile diagrams and plan sketches.
Gill Sans Bold
Part 3: Field study 17
Write the report
A written report is required to show that you have completed the fieldstudy and should include the following sections:
• A location map. Where your ecosystem is located in Australia (inthe Introduction of your Field study scaffold).
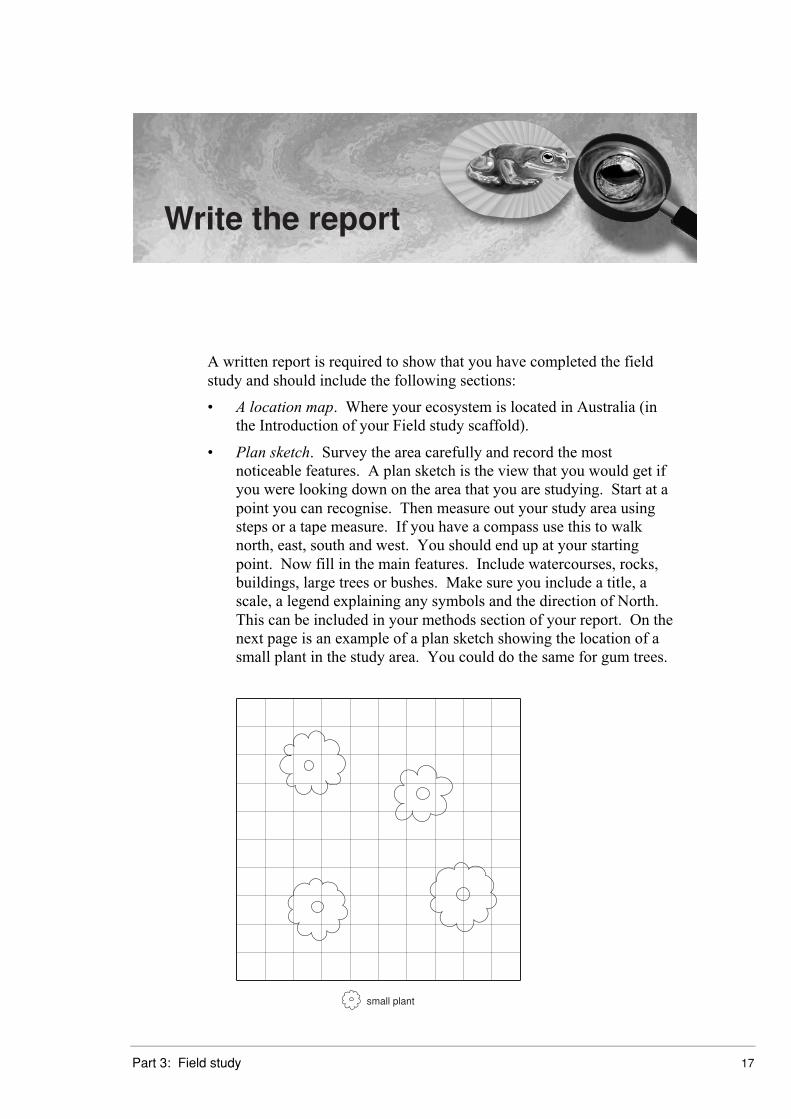
• Plan sketch. Survey the area carefully and record the mostnoticeable features. A plan sketch is the view that you would get ifyou were looking down on the area that you are studying. Start at apoint you can recognise. Then measure out your study area usingsteps or a tape measure. If you have a compass use this to walknorth, east, south and west. You should end up at your startingpoint. Now fill in the main features. Include watercourses, rocks,buildings, large trees or bushes. Make sure you include a title, ascale, a legend explaining any symbols and the direction of North.This can be included in your methods section of your report. On thenext page is an example of a plan sketch showing the location of asmall plant in the study area. You could do the same for gum trees.
small plant

18 A local ecosystem
Include a scale 1 cm = 1 metre. The plant in this diagram has an unevendistribution.
A profile diagram. A profile diagram is a side view of an imaginaryslice. This is a good way of showing how the vegetation pattern changes.It can be used to show changes in distribution of your plant and animalspecies. If you have a water source in your study area then this will showany changes caused by the presence of water.On a rock platform, a profile diagram is a good way of recording thedifferent types of animals found there.
• A summary of the main plants and animals in the study area.
Try to identify about 10 plant species. You may have to seek help todo this. Use Table 2 to record this information.
Animals are harder to locate than plants. Look for droppings, tracks,webs, nests and tree scratchings. Look for animal life in the leaflitter. Birds are often easier to locate than other animals especiallyin the early morning and the late evening. Record your animal datain Table 1.
• Build up a food web for your study area.
• Observing interactions
Look for examples of disease in plants. Observe herbivores as theyconsume their food.
Describe evidence of observed trophic interactions. For example,look for feeding, seeking shelter. Fill in Table 3.
• Make a plan now of what you need to take and what you are going tomeasure. Look carefully at the report scaffold now and make it clearin your mind what equipment you need and what you are going tomeasure before starting your field study.

Gill Sans Bold
Part 3: Field study 19
Exercises – Part 3
Exercises 3.1 to 3.7 Name: _________________________________
Your written work for this part of the module is to complete the fieldstudy report and return this to your teacher next week with Part 5 of themodule.
Exercise 3 .1
The study area I have chosen is
_________________________________________________________
_________________________________________________________
Exercise 3.2
What are some of the safety issues you must address before going intothe field?
_________________________________________________________
_________________________________________________________
_________________________________________________________
_________________________________________________________
_________________________________________________________
_________________________________________________________
_________________________________________________________
20 A local ecosystem
Exercise 3.3
Write down any risks that you can predict for going into the field. Whatsteps are you taking to prevent these risks?
_________________________________________________________
_________________________________________________________
_________________________________________________________
_________________________________________________________
_________________________________________________________
_________________________________________________________
Exercise 3.4
Make a list of the equipment you have available here to measure abioticfactors in your ecosystem.
_________________________________________________________
_________________________________________________________
_________________________________________________________
_________________________________________________________
_________________________________________________________
_________________________________________________________
_________________________________________________________
Exercise 3.5
Write down the abiotic factors that you are going to measure and howyou are going to measure them.
_________________________________________________________
_________________________________________________________
_________________________________________________________
_________________________________________________________
Gill Sans Bold
Part 3: Field study 21
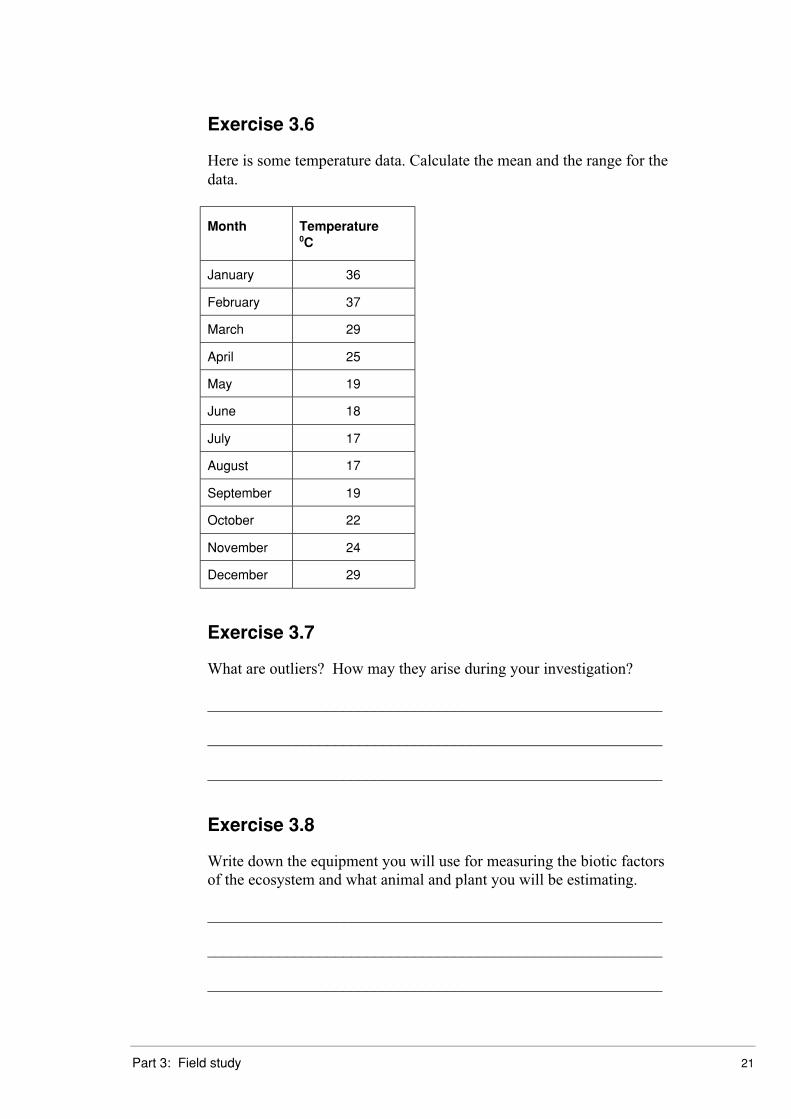
Exercise 3.6
Here is some temperature data. Calculate the mean and the range for thedata.
Month Temperature0C
January 36
February 37
March 29
April 25
May 19
June 18
July 17
August 17
September 19
October 22
November 24
December 29
Exercise 3.7
What are outliers? How may they arise during your investigation?
_________________________________________________________
_________________________________________________________
_________________________________________________________
Exercise 3.8
Write down the equipment you will use for measuring the biotic factorsof the ecosystem and what animal and plant you will be estimating.
_________________________________________________________
_________________________________________________________
_________________________________________________________