Embed Size (px)
Citation preview


A letter from the editors of Tropical Resources
The editors are very pleased to offer you this year's edition of Tropical Resources: The Bulletin of the Tropical Resources Institute. We are publishing many thought-provoking articles from locations around the globe. Some of the topics in this year's edition include land use and social ecology in Southeast Asia, sea turtle conservation in Liberia, ecotourism in China, and understory vegetation analysis of Costa Rican teak plantations.
This year the Tropical Resources Institute has undergone several changes. First, we are proud to be working with our new Director, Dr. Lisa Curran, and with the new Program Directors, Dr. Amity Doolittle and Mark Wishnie. They have helped us extensively with this year's bulletin and with efficient management ofTRI. Secondly, we have changed the name and format of the journal, which was formerly called TRI News. The TRI staff wanted to update the look and approach of the bulletin from that of years past. In addition to Tropical Resources, TRI will publish a newsletter informing students and faculty of events and alumni updates.
We hope you fmd this years edition of Tropical Resources to be interesting and beneficial to your own studies and research. Enjoy!
Sincerely,
Alison F orrestel Theodore Lanzano Christopher Menone

Dear Friends of TRI,
TRI has a rich history of supporting a diversity of tropical resource projects the worldwide through various partnerships and collaborators. This issue of Tropical Resources: The Bulletin of the Tropical Resources Institute reflects a continuation and respect for our legacy coupled with some exciting new developments and expanded partnerships. Because many of our projects have a component that is community-based and links the urban-rural sector by exploring pollution and resource use patterns, we have selected a new logo to encompass our broad interests and interdisciplinary programs. Moreover, we are seeking to develop long-term programs that build capacity both at F&ES and within our host countries. We feel that long-term in-country projects will be of increasing benefit to all.
During my first term at Yale F&ES and as Director of TRI, I sought to build on TRI successes and also to extend and to invigorate the program. Co-directors Amity Doolittle and Mark Wishnie have brought new skills and approaches, boundless energy and tremendous dedication to this endeavor especially in light of their relatively brief sixmonth tenure. Moreover, we are in the process of foraging several exciting new initiatives and collaborative partnerships worldwide. In addition, through several participatory meetings, we sought to incorporate suggestions and build a more interactive program especially for the Master's candidates at F&ES. I have been continually impressed by the passion, intellect and dedication of all students I have encountered at F&ES. We seek your ideas, programs and collaborative opportunities to further develop capacity for addressing resource use worldwide. For our readership, we are looking forward to your feedback and opportunities to continue to serve a broad community of engaged scholars in environmental problem-solving. TRI is poised to expand and to serve such a community with your assistance and engaged involvement. Together, we aim to develop a truly interdisciplinary institute that builds on history and our comparative advantage as an interdisciplinary professional school but embraces the challenges of multi-sectoral applied problem solving in specific contexts.
I commend the students and program directors for their efforts with this newsletter and look forward to working with you.
Sincerelv vours.
Lisa Curran
Tropical Resources: The Bulletin of the Yale Tropical Resources Institute 1

The Yale Tropical Resources Institute: Envisioning Synthesis and Synergy
Mission
The Mission of the Tropical Resources Institute is the application of interdisciplinary, problemoriented, applied research to the creation of practical solutions to the most complex challenges confronting the management of tropical resources worldwide. Lasting solutions will be achieved though the integration of social-economic needs with ecological realities, the strengthening of local institutions in collaborative relationships with international networks, the transfer of knowledge and skills between local, national, and international actors, and the training and education of a cadre of future environmental leaders.
Vision
The problems surrounding the management tropical resources are rapidly increasing in complexity, while demands on those resources are expanding exponentially. Emerging structures of global environmental governance and local conflicts over land use and environmental conservation require new strategies and leaders able to function across dIversity of disciplines and sectors, and at local and global scales. The Tropical Resources Institute aims to build linkages across natural and social sciences and among government agencies, academia and practitioners, enabling the formation of successful partnerships and collaborations among researchers, activists and governments. The Tropical Resources Institute seeks to train students to be a leaders in this new era, leveraging resources, knowledge, and expertise among governments, scientists, NGOs, and communities to provide the information and tools this new generation will require to equitably address the challenges ahead.
2 Spring 2002
Table of Contents
The Unseen, Unheard, and Misunderstood: What Can we Learn from a Social History of Property Relations? By Amity A. Doolittle, PhD ................................................................................................... 4
Preliminary Assessment of a Community-Based Ecotourism Project in Northwest Yunnan, China By YinLan Zhang, MEM 2001 ............................................................................................... 6
Understory Vegetation Characteristics along Teak (Tectona grandis) PlantationlNatural Forest Ecotones in Costa Rica. By Jeff Luoma, MF 2001 ...................................................................................................... 11
Sea Turtles in Liberia: A Baseline Survey By AliyaErce1awn, MES 2001 ............................................................................................. 17
Promoting Regeneration within a Rainforest Plantation: The Effect of Tree Species and Tree Structure on Vegetation Recruitment Patterns By Elizabeth Jones, MESc 2002 ........................................................................................... 21
-Community Management of Natural Resources in a de facto Decentralizing Indonesia: A Case Study from East Kalimantan By Steve Rhee, MESc, PhD Candidate ................................................................................ 25
Fuelwood Consumption, Woodland Regeneration and Forest Management in Rural Mali, West Africa By Jeffery A. Morton, MEM 2002 ..................................................................................... 31
On the Margins of Forest and Market: A Case Study of Medicinal Use in Four Communities Near Sinharaja, a Sri Lankan Rainforest ......................................... 38 By Kristen Ohlson, MESc 2001 and Uromi Goodale, PhD Candidate
Interview with Mark Wishnie By Theodore Lanzano, MEM Candidate 2003 .................................................................... .43
Tropical Resources: The Bulletin of the Yale Tropical Resources Institute 3
The Unseen, Unheard, and Misunderstood: What Can we Learn from a Social
History of Property Relations?
Amity A. Doolittle, PhD 1999
In 1990 a prominent politician from Sabah, Malaysia proudly announced at an international conference on conservation and biodiversity that he intended to expand the boundaries of Kinabalu Parkl to include an area, locally known as Bukit Hempuan (Hempuan Hill), that supported species-rich tropical forests.2 Shortly after this announcement, two-thirds ofBukit Hempuan was burned to the ground, allegedly by local people. Prominent biologists and politicians were furious that local people could act so destructively. The plans to include the once-valuable forests in Kinabalu Park had to be dropped.
Both politicians and biologists failed to understand why people burned the area; they failed to consider the social history of resource use on Bukit Hempuan. The government never openly acknowledged the fact that, prior to the formation of the Kinabalu Park in 1963, local people hunted and collected forest products there. This is not to suggest that policy makers were unaware of the local uses of the area. In 1962 the following was written about the southern boundary of the then proposed park, which bordered the town of Kundasang:
"It is uninhabited ... though there is a Dusun path called Jalan Dili3
•••• [The area is a] rich breeding ground for animals. Jalan Dili is used by hunters, collectors of damar (gum of Agathis) and collectors of rattan. Pigs, barking deer, and sumbar4 were conspicuous. It is considered to be the chief breeding ground for large mammals around Kinabalu .... The question on hunting rights may be difficult. It may be necessary along the southern boundary to establish a buffer zone where pig and deer can be shot and where timber may be extracted for house building. At Kundasang there were signs of agitation among villagers, and new 'rentis' (path) had been cut in the forest clearly as an endeavor to strike out claims before it might be too late ... 5"
During the formation of the Park these customary rights were disregarded, a buffer zone was never established, and any collection of timber, forest products and hunting was strictly prohibited in the Park.
Present day policy makers and government officials also ignored the fact that Bukit Hempuan had already been included in Kinabalu Park in 1963 when the boundaries were originally drawn and that documentation of prior customary rights to this area existed. They overlooked the fact that in 1984 Bukit Hempuan had been removed from the Park so that individuals close to Chief Minister Harris could log the forest for valuable Agathis trees. After the valuable logs were removed and the land was abandoned by politicians, local villagers "reclaimed" sections of this region, as they
4 Spring 2002
slowly encroached on the boundaries of Kinabalu Park for shifting cultivation. And when the politician wanted to take the land back again in 1990, people were angry. This entire history of informal and formal changes in the property rights and means of access to Bukit Hempuan was ignored when the politician made what he considered a generous gesture indicating his dedication to the conservation of biodiversity.
For the people in this area, this gesture was the last straw. They had given up the land to the Kinabalu Park in 1963. No one had publicly contested its removal from the Park in 1984 for the benefit of political elites. None of the politicians had asked whether the local people needed the land more than the already wealthy politicians. And no one dared suggest that the rural population might need the land more than the rare tropical plants did. But when the government threatened to unilaterally take away land that local people needed and had reclaimed, they acted. Burning the remaining forest seemed to be the only way that they could maintain control over the land. And it succeeded.6 Ironically, it was the state's project of protection that resulted in the destruction of Bukit Hempuan.
This story illustrates the importance of understanding the broader historical and political-economic circumstances that influence current land use strategies and property regimes in Sabah, as in many developing countries. Without this understanding, the actions of local villagers may seem unconnected, irrational, self-defeating and illogical. Without this understanding, politicians and biologists fail to realize that a "simple" gesture of moving the boundaries of the Park to include a single hillside could result in the destruction (at least temporarily) of that hillside.
Endnotes
1 Mount Kinabalu is the highest peak in Southeast Asia and supports a rich and unique botanical community (See Beaman and Beaman 1990; Davis, Heywood, and Hamilton 1995). It is also one of the primary tourist destinations in Malaysia. In 1995 there were over 146,000 visitors to Kinabalu Park.
2 In a 1984 report on "Bukit Hempuan and its Botanical Significance," Dr. John Beaman (a prominent botanist who has made the study of the botany of Mount Kinabalu part of his life's work) wrote about the many rare and endemic

species found on Bukit Hempuan. He believes that this report may have been a significant part of the motivation for including Bukit Hempuan in the Park (Dr. John Beaman, personal communication, March 8,1997).
3 lalan is the Malay word for path or road.
4 The Malay word, sumbar or sambar refers to a large deer (Cervis unicolor).
5 'The Royal Society of North Borneo Expedition Committee, September 1962, Report to the HE Governor of North Borneo on the proposed National Park of Kinabalu." Draft of an unpublished manuscript, no page numbers.
6 One question remains unanswered in my search for understanding of the order of events surrounding the burning of Bukit Hempuan: Were the fires set intentionally, or were they swidden fires that accidentally burned out of control? Or were they swidden fires that were allowed to burn out of control? The fires coincided with a month or more of drought. The drought, coupled with the damage done by the logging undoubtedly helped the fire burn hotter (J. Beaman, personal communication, March 8, 1997). Most people in Sabah, both politicians and local villagers, are quick to suggest that the fires were set intentionally. This story of the act of resistance by locals has entered the realm of local lore. Both politicians and locals use the story to make a point. Politicians draw on this story to show that local people will never manage and conserve resources without government intervention. Locals tell and retell the story to show that they too have power, and will no longer sit by while politicians take away their land.
Mount Kinabalu with water buffalo grazing in the foreground, February 16, 1897, sketch from the personal diary of Mr. W.R. Dunlop
References
Anonymous. 1962. "The Royal Society of North Borneo Expedition Committee, September 1962, Report to the H.E. Governor of North Borneo on the proposed National Park of Kinabalu." Manuscript.
Beaman, John H. and R.S. Beaman. 1990. Diversity and distribution of flora of Mount Kinabalu. In The Plant Diversity of Melesia, edited by P. Baas, K. Kalkman, and R Geesink. Dordrecht: Kluwer Academic Press.
Davis, S.D., V. H. Heywood, and A.c. Hamilton. 1995. Centers of Plant Diversity: A Guide and Strategy for their Conservation, Vol 2. Washington D.C.: WWF and IUCN.
Tropical Resources: The Bulletin of the Yale Tropical Resources Institute 5

Preliminary Assessment of a Community-Based Ecotourism Project in Northwest Yunnan, China
YinLan Zhang, MEM 2001
Introduction
How can an impoverished community with rich natural resources and scenic beauty protect its biodiversity while receiving economic benefits from its conservation efforts? Ecotourism has become an almost automatic answer to such a question; aided by the current popularity of community-centered development, community-based ecotourism is now an even better answer. However, a recent review of such projects around the world asserts that "while ecotourism rhetoric suggests that there is much support for community-based ecotourism venture, it is difficult to find successful cases of this in practice" (Scheyvens 1999). Only by examining how community-based ecotourism becomes established at the local level and how each stage in the development process progresses is it possible to determine why some ecotourism operations succeed while others fail.
A community-based ecotourism project was recently initiated in northwest Yunnan, China, as part of The Nature Conservancy's efforts to protect the rich biodiversity of the region. I examined the potential impacts of ecotourism on the communities involved, the institutional and social capacity of the communities to mitigate these impacts, and the outlook for communitybased ecotourism at these sites based on the current context of regional tourism.
The Site
Northwest Yunnan is one of the most ecologically and culturally diverse regions in the world. The dramatic, mountainous topography hosts ecosystems ranging from humid subtropical in the river valleys to alpine at higher elevations and containing a tremendous richness of species. The region is listed as one of Conservation International's Global Biodiversity Hotspots, based on endemic plant species, endemic non-fish vertebrates, and degree of threat. The province is home to about 40 million people, one third ?f w~ch belong to twenty-six ethnically non-Han groups mc1udmg the Yi, Bai, Naxi, Hani, and Dai.
The Lashi watershed (237 km2) is the site of the
pilot project for the Yunnan Great Rivers Project, a conservation and development plan developed by The Nature Conservancy and the Yunnan provincial government. The watershed is located in Lijiang County, about five kilometers northwest of Lijiang City, a major tourism center and UNESCO World Heritage Site with a
6 Spring 2002
charming and well preserved 800-year-old town center. (Lijiang is simultaneously the name of the city, county, and prefecture.) Two ethnic groups populate the watershed: the Naxi, which make up 95 percent of the population, occupy the lowlands, while the Yi (4 percent) live in the upland and mountainous regions.
Xicun and Yangyuchang, two upland Yi villages in Lashi township, are the focus of this study. They are located at the northwestern- and northernmost points of the watershed, respectively, at elevations between 2800 and 3200 meters. The altitude makes conditions adverse for agriculture. Per capita income for Lashi township is 1000 yuan (US $125), but income in Xicun, Yangyuchang, and other upland Yi villages is far below this average. The villages are, however, endowed with rich natural and aesthetic resources, including dense primary forests; dramatic views of Yulong Xueshan, the sacred mountain of the Naxi people; and the first bend of the Yangtze River.
The major source of cash income for the two villages used to be logging. However, since flooding in 1998 led to strict logging bans in the middle and upper reaches of the Yangtze River, this activity has been eliminated. In addition, the Natural Forest Protection Program has mandated the restoration of farmlands at slopes greater than 25 degrees to natural forest, which applies to about 40 percent of cultivated fields in Lijiang county (US Embassy Report 2000). The percentages are even higher in Xicun and Yangyuchang, which means that many villagers stand to lose large portions of their cropland. It is hoped that community-based ecotourism can provide an alternative source of income while encourao-ino- the villagers to protect the upland forests. 0 0
Yunnan Great Rivers Project project area (Courtesy of The Nature Conservancy)
Methodology
I was part of a Participatory Rural Appraisal (PRA) team that investigated Xicun and Yangyuchang to determine the needs and resources of the villages and to assist in the planning of the ecotourism project. We spent a week in each village, interviewing approximately 25 people in Xicun and 40 in Yangyuchang, engaging in resource and social mapping, compiling an agricultural calendar, recording oral histories, and making field observations. My specific role within the PRA team involved facilitating both the male and female participant groups in their various activities and interviewing 20 participants from both villages for my own study. The types of data I sought included the degree of popular participation in decisionmaking at the village level, existing institutional capacity, and level of social stratification. Tourism trends in the region were obtained through research in Lijiang, including literature reviews, observation, informal discussions with cafe and hotel managers, and participation in group tours.
Results and Discussion
Opportunities The scenic and natural resources of Xicun and
Yangyuchang provide opportunities to offer tourism services such as homestays, meals, horseback tours, and guided nature tours. The extent to which these opportunities can be realized depends both on project design and operation and on the capacity of the community. Certain provisions must be made to prevent outsiders from drawing away profits, and rules must be enacted to ensure that tourists do not travel without the aid of local guides, not only to boost income but also to educate the tourists and prevent damage to fragile resources. Aside from these design considerations, the
Access and Impact A community is not a homogenous group, but a
composite of various hierarchies and interests (Agrawal and Gibson 1999, Belsky 1999). As a result, some people are more able to capitalize on the opportunities provided by the ecotourism project. Households with more available labor, capital, education, and political connections would probably be the first to profit from ecotourism (Forsyth 1995, Belsky 1999, Bartsch 2000). These resources are not distributed randomly but tend to be concentrated in a few households. Of the sixty-eight households in Xicun, only some have the amenities, extra rooms, and desirable locations necessary for ecotourism. Two of the three most luxurious houses belong to the family of the deputy mayor of the administrative village Nanyao, which governs all the Yi villages in the watershed. The deputy mayor is in a favorable position not only because of his family's superior residences, but also because his son and daughter are two of the five villagers with middle-school education. I found him to be one of the most enthusiastic champions of ecotourism.
The link between political power, wealth, and education is also very apparent in Yangyuchang. The village mayor and his family live in some of the best houses in the village, and are the only households with water piped directly to their courtyards. The mayor's son is the only child in the village who has completed sixth grade and attends a middle school in town.
Although the smaller number of households in Yangyuchang (22) means that it would be possible to create
a rotational system wherein each family could have an opportunity to board guests, it was clear from the villagers' discussions that such fairness would be difficult to achieve. Although the villagers thought it would be ideal if everyone had a chance to house guests, they also
percentage of the population that can profit directly from
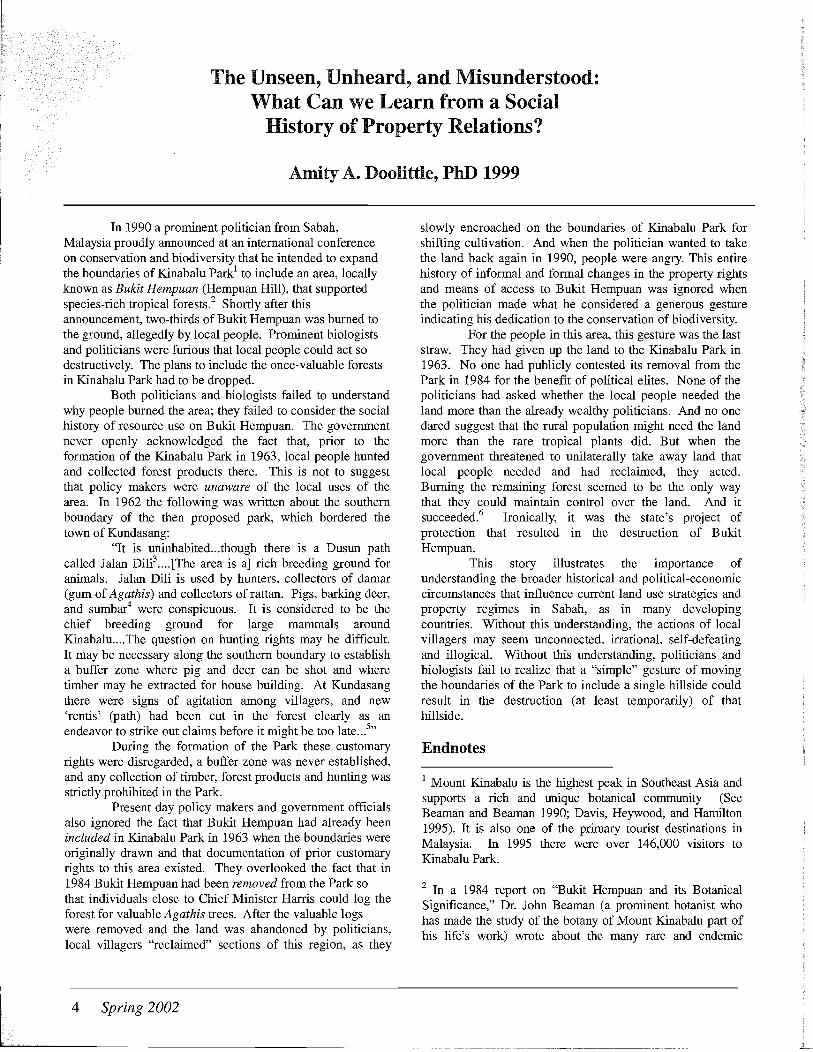
Yi women in Xicun mapping their resources
believed they should provide choices to the visitors. They claimed that those households not selected by tourists for homestays would
ecotourism is dependent upon existing household resources. The degree to which the community as a whole can benefit is affected by the ability of internal institutions to manage and distribute tourism revenues.
have a greater incentive for home improvements. This system would not only put those who could not afford to renovate at a disadvantage, but could also cause villagers to take financial risks that might not prove worthwhile. It was apparent that the desire for equality and fairness among the villagers was beginning to be challenged by the competition engendered by such a profitable business opportunity.
Tropical Resources: The Bulletin of the Yale Tropical Resources Institute 7

The social gap between men and women might also be widened by the implementation of ecotourism in these villages. Although other hierarchies, such as age, wealth, and political influence, exist, that of gender is the most visible. Like many other rural communities in China, the villages are highly patriarchal. The Yi belief system states that a man cannot join his ancestors after death unless he has a son. Such cultural doctrine places men in an ideologically higher position in the household and community. Although women take care of every aspect of domestic work and participate in a large proportion of agricultural activities outside the home, their decisionmaking power is very limited. Traditions are slowly changing, as evidenced by the fact that there are an equal number of girls and boys in Xicun's elementary school, but these communities are far from achieving gender equity. It was clear that the men were more capable of taking tourists on horseback tours and nature tours; not only do they frequently travel to towns with their horses and mules, but they also tend to have better education and language ability, making them more suitable guides. Opportunities existed for women to prepare meals for the guests, but during busy agricultural seasons, tourism may overburden the women.
Finally, because ecotourism inherently promotes a lower volume of tourists than conventional tourism, it is more difficult for the community at large to profit directly. Distribution of benefits from ecotourism through institutional channels thus becomes vitally important.
Institutions Institutional strengths differ between Xicun and
Yangyuchang. Because Yangyuchang is much smaller and one extended family makes up the entire village, it relies on informal channels to enforce norms and resolve conflicts. During both group and individual interviews, the relationships among the villagers were described as generally harmonious and reciprocity remained a strong social norm. With relatively few households, benefits could be distributed throughout the village in the form of a community fund, allowing both the direct and indirect beneficiaries to feel the advantages of ecotourism. Furthermore, the smaller size of the village could lower the cost of monitoring profits and contributions to the community fund.
Due to its larger size, Xicun has a village committee whose members are elected by the village every three years. The committee is made up of the village mayor, mayors from the three hamlets that make up Xicun, three members of the women's federation, one communist party representative, and one youth league leader. Although the village committee is subject to controls from higher administrative powers and has traditionally been a body that enforces orders from the top, it c.an effectively manage events at the local leveL In addition, two family committees comprised of the eldest men of the two village clans mediate conflicts and disputes between the clans. These two institutions would form a sound participatory base to manage ecotourism projects, create mechanisms to
8 Spring 2002
distribute benefits to the entire village, and establish and enforce conservation measures.
Although there are existing inequities among the villagers of Xicun and Yangyuchang and abuse of power by the politically powerful members, their overall cohesiveness and institutional strength are important assets that could mitigate the greater social stratification that ecotourism could potentially effect. It is thus extremely important to strengthen and support these social norms and institutions during the course of project development. However, despite the capacity of these communities to mediate internal conflicts, serious consideration must be given to jealousies and discontent likely to arise in other villages in the watershed not targeted for tourism development. A watershed management committee composed of appointed government officials has been established for the purpose of resolving inter-community conflicts, but the absence of popularly elected community representatives in this committee may compromise its effectiveness.
The Consumers Of course, the above discussion is meaningless if
tourists never reach these villages. The traffic to these sites is dependent in part on the marketing of these villages, a massive undertaking considering that few outsiders are aware of their existence. More importantly, a market for ecotourism has to exist within the region and a network of business and government support must develop to ensure the viability of ecotourism as a commercial enterprise and a development and conservation tooL
The target consumers for Xicun and Yangyuchang are mostly backpackers who place more emphasis on pristine surroundings and authenticity than on luxury accomodations. Although I found the number of these backpackers to be small compared to the number of tourists who arrive in Lijiang on package tours, they are numerous enough to garner businesses' attention. There are five hostels in the old town of Lijiang whose clientele comprise mostly students and backpackers, people who are most likely to visit Xicun and Yangyuchang. Although there are no official statistics on the volume of these types of tourists in Lijiang, it is clear that a market for ecotourism exist in the region.
The Suppliers An attempt has been made to capture the
ecotourism segment of the tourism market in Lijiang with the building of a cooperative ecolodge in Wenhai, a village close to Xicun and Yangyuchang. However, tourism in Wenhai has not been significant enough to impact the environment or living standards of the village. Between 1995 and 1999, each household received approximately 56 yuan (US $7) a year from tourism (Yang Fuquan pers. comm.). Chinese researchers familiar with this project stated that the only reason there had been tourists in the village every year was because of the commitment of an American who helped develop the project.

In Wenhai, a conscious effort has been made to disburse the benefits of ecotourism throughout the community and to facilitate development and conservation. There are lodges and homestays in other villages around Lijiang City, but most of them are small, unorganized private businesses that do not make any concerted efforts to conserve natural resources or contribute to overall community development. At the time of this research, there were no tourism operators in Lijiang that offered organized tours to these village lodges and homestays or that specialized in small-scale ecotours to rural communities. Wood (1997) has stressed the importance of establishing linkages between local communities and ecotourism businesses to reach a broader market. The absence of such businesses in the Lijiang area could pose a major obstacle to marketing these community-based ecotourism sites sufficiently to attract a steady flow of visitors.
Aside from the few village home stays and trekking lodges, most of the tourist attractions around Lijiang cater to conventional tourists on package tours, which has meant long miles of paved roads, cable cars to
On a policy level, I was informed that the provincial government was dedicated to expanding tourism in Yunnan. However, it was apparent that government officials did not have a good grasp of the principles of ecotourism. A research associate of Leadership for Environment and Development (LEAD) International in China observed: 'The operators of tourism to protected areas do not have a correct understanding of ecotourism and make no distinction between ecotourism and conventional tourism. Therefore, they build highways, hotels, other modern buildings, etc. in the scenic resort which conflict with the principles of ecotourism. On the other hand, the large investment to protected areas has greatly increased the cost of nature-based tourism, which makes running the tourism business more difficult and less money could be diverted to meet the conservation requirements" (LEAD 1999).
In addition, I found that policy makers had yet to appreciate the value of ecotourism, especially communitybased ecotourism, since it did not seem to generate very significant revenues. A Lijiang county official remarked
The author with the women of Yangyuchang
the glaciers and meadows of Yulong Xueshan, crowded restaurants, daily performances of ethnic dances, and little environmental or cultural sensitivity. Nature tourism with this level of impact produces many negative by-products; those I observed included commodification of culture, conflicts between local people over control of the lucrative tourism enterprises, and degraded environments.
Trends and Policy Tourism development trends in the area do not
appear to be shifting toward more environmental or cultural awareness. Many traditional houses in the Lijiang old town are being torn down to make room for modern structures. Residents of the old town have been squeezed out by developers dashing to turn homes into shops and hotels. A lUXury resort with a golf course has already broken ground in the foothills ofYulong Xueshan.
that she preferred to see the arrival of exclusively high-end tourists who spend their money in luxury hotels and expensive gift shops, which in most cases were owned by outsiders. Although these current policy and development trends do not exclude the possibilities of ecotourism in the region, they represent a set of dominant and opposing values that could significantly impede the progress of community-based ecotourism.
In addition to these obstacles at the policy and industry levels in China, there is also the inherent instability of the tourism industry. Tourism has been called a fashion industry (Prosser 1994) because the popularity of a tourist attraction rises and falls with changing cultural perceptions, attitudes, and values, greatly affecting the flow of visitors. A study of community-based ecotourism in Ecuador found that low visitations was one of the major challenges facing communities engaged in ecotourism, and that "disappointment within communities failing to benefit from
Tropical Resources: The Bulletin of the Yale Tropical Resources Institute 9
ecotourism led to cases of greater local acquiescence to oil development on indigenous lands and more unsustainable farming and logging practices" (Wood 1997). The villagers of Xicun and Yangyuchang had very high expectations for ecotourism that could be easily disappointed, which could lead to a similar decline in conservation efforts.
Conclusions
To carry out a socially, politiCally, and environmentally enlightened conservation and development project is a tremendous feat. As of now, it is not known how ecotourism will impact the villages in the Lashi watershed. Community participation, environmental conservation, and tourism are all politically charged issues, especially in a country like China. Dove (1995) notes, "Whenever development planning is brought to bear on a situation, there is a genuine risk that the existing balance of equity will be worsened." This is certainly. true for the ecotourism projects in Xicun and Yangyuchang. These two villages have high hopes for ecotourism development but there are many political, economic, and social obstacles. A great emphasis must be placed on education, training, and capacity building during the course of this project so that the communities will not only become aware of the obstacles but also have means of mitigating the impacts of both success and failure.
Acknowledgements
Bartsch, Henry. 1998. The impact of trekking tourism in a changing society: a Karen village in northern Thailand. In Turbulent Times and Enduring Peoples: Mountain Minorities in the South-East Asian Massif, edited by Jean Michaud. Richmond: Curzon Press.
Belsky, Jill. 1999. Misrepresenting commumtJes: the politics of community-based rural ecotourism in Gales Point Manatee, Belize. Rural Sociology 64 (4): 641-666.
Dove, MichaeL 1995. The theory of social forestry intervention: the state of the art in Asia. Agroforestry Systems 30: 315-340.
Forsyth, Timothy. 1995. Tourism and agricultural development in Thailand. Annals of Tourism Research 22 (4): 877-900.
LEAD Associate. 1999. Ecotourism in China: a case from Jiuzhaigou,Sichuan Province of China. www.LEAD.org/china
Prosser, R. 1994. Societal Change and the Growth in Alternative Tourism. In Ecotourism: a sustainable option?, edited by Erlet Cater and Gwen Lowman. New York: Wiley.
Scheyvens, Regina. 1999. Ecotourism and the empowerment of local communities. Tourism Management 20: 245-249.
I would like to thank The Nature Conservancy and TRI for funding my summer's work in China; Ed Norton and Rose Niu of TNC China for giving me the opportunity to work in Yunnan; Zhou Ruiliang, Yu Xiaogang, Du Juan, Yang Fuquan, and Graham Bullock for providing help, guidance, and friendship during my summer in Yunnan; and Professor Bill Burch for his advice and guidance. Finally, I would like to thank my mom, who visited me and brought chocolate just at the right time.
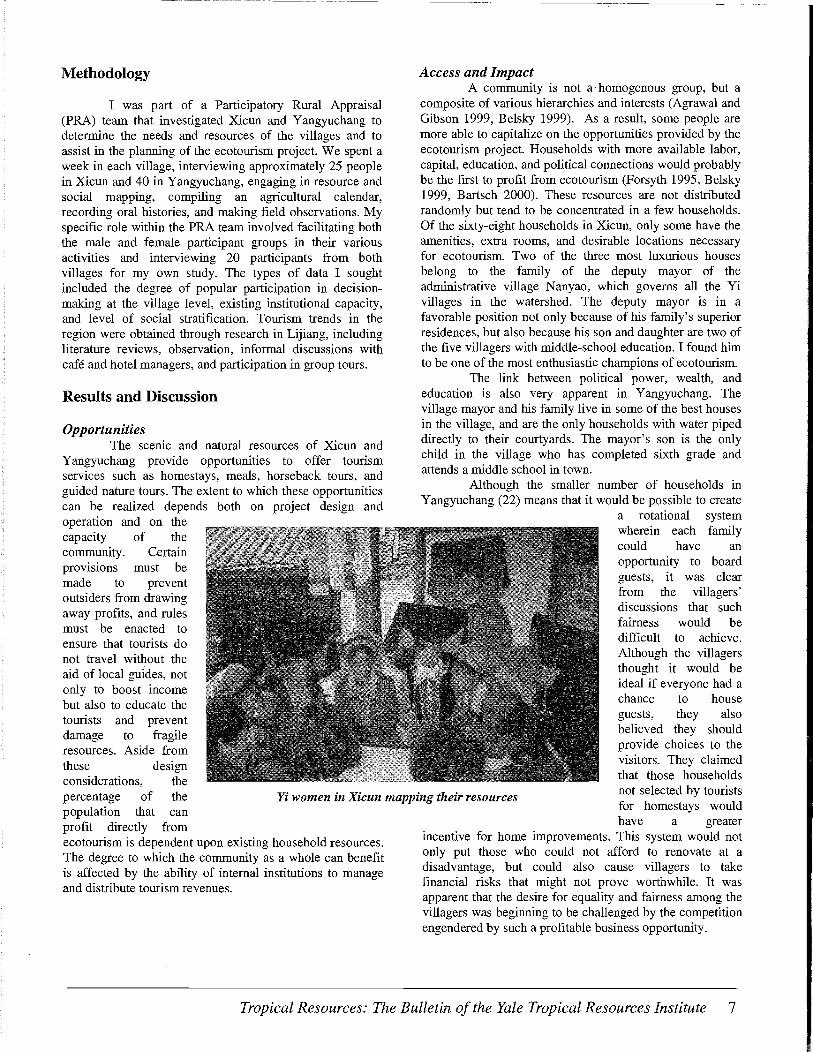
Yulong Xueshan (Jade Dragon Snow Mountain), the sacred mountain of the Naxis and one of the main tourist attractions in the region
References
Agrawal, Arun, and Clark Gibson. 1999. Enchantment and disenchantment: the role of community in natural resource conservation. World Development 27 (4): 629-649.
10 Spring 2002
US Embassy Report. August 2000. Trees Vs. People? PRC Natural Forest Protection. http://www.usembassychina.org.cn/ english/sandt/yunnan-forest -one.htm
Wood, Megan Epler. 1997. Meeting the global challenge of community participation in ecotourism: case studies and lessons from Ecuador. American Verde Working Paper No. 2. The Nature Conservancy.
Understory Vegetation Characteristics along Teak (Teetona grandis) PlantationlNatural Forest Ecotones in Costa Rica.
Jeff Luoma, MF 2002
"The future of a significant portion of tropical biodiversity may depend on the way in which production forests are managed." - D. Delgado, 1999.
Introduction
Teak (Tectona grandis) is a valuable timber species used for shipbuilding, furniture, and other carpentry (Weaver and Francis 1990), for popular flooring and paneling, and for specialized applications such as fIxtures requiring a high resistance to acids (Chudnoff 1984). As of the early 1990s, teak alone accounted for 14% of the total area of tropical plantations worldwide (Evans 1992). Teak is also an increasingly popular plantation tree in parts of Central America. However, erosion and lack of understory growth beneath pure teak stands is a commonly acknowledged problem that makes it difficult to maintain biodiversity and site productivity. Erosion is suspected to be the cause of much of the "pure teak problem," where teak experiences signifIcantly reduced second rotation growth (Champion and Seth 1968). Sometimes teak can suppress all ground vegetation (Evans 1992). Yet, teak stands can have abundant understory growth. A continuous litter layer and undergrowth can practically eliminate erosion problems (Ibid). Also, the biodiversity conservation value can be augmented by maintaining healthy and diverse understories (Johns 1997)
A signifIcant portion of local plant biodiversity can be found in plantations (Keenan 1997). Plantations next to natural forest may help reduce adverse edge effects on the forest as well as provide additional habitat for some forest species (Johns 1997). Studies have found that plantations can more quickly encourage forest succession processes on ecologically degraded sites by providing more suitable conditions for forest understory species (Parrotta et al. 1997; Lugo 1997; Powers et al 1997; Haggar et al. 1997). Most of these studies concentrate on woody vegetation. Allowing forest trees to re-grow is often not the aim of plantation managers, especially those anticipating a second rotation of a particular species, and so management often entails occasional 'cleaning' of woody species, leaving herbaceous and low-growing vegetation. Knowing the diversity and cover of this 'default' and mostly non-woody understory can help assess the biological conservation value of this form of management.
In a plantation, vegetation diversity has been found to develop relatively quickly near the forest boundary (i.e. ecotone) but develops more slowly with increasing
distance away from the forest (Parrotta, et al. 1997b). As examples, colonizing tree species with larger seeds concentrate near edges (Ibid.), and frugivorous bats roosting on edge trees result in higher colonization rates (i.e. diversity) at plantation edges (Lugo 1997). Though research has examined teak understory development in Indonesia and India, there is little data for teak understory and ecotones in Central America. If general teak plantation attributes relating to understory species diversity and cover differences along a teak/forest ecotone can be determined, this in turn may inform decisions for maintaining adequate understory cover for erosion control, landscape diversity, animal passageways, plantation strip widths, and understory enrichment planting.
The objectives of this study were threefold: (1) To examine the relationship between teak litter and understory variables. One hypothesis regarding the lack of understory beneath teak is that the sheer amount of teak litter suppresses understory vegetation. To test this, I investigated the relationship between teak litter weights and such variables as understory cover and plant diversity. (2) To obtain general regression models for understory species diversity and vegetation cover compared to plantation attributes in the teak/forest ecotone to reveal general correlated plantation variables for understory diversity and cover. (3) To examine the effects of forest edge distance on plant family diversity and cover, and determine various taxonomic trends.
Site Description
The research took place in the Parrita Valley in the foothills of the Cordillerra de Talamanca in Costa Rica near the town of Parrita - Latitude 9°31' N, Longitude 84°18'W. The average annual temperature is 26° C and the average annual rainfall varies between 3000-3600 nun. (from data at BARCA office, Parrita). Sampling took place between June 13 and August 15, 2000.
Seven teak stands ranging in age from 3-12 years and one stand of 49 years were sampled. All plots ranged in elevation from 10 to 200 m.as.I. Previous land uses had been pasture and/or agriculture. The stands had all received a typical treatment of cutting back any vegetation both before planting and for roughly the fIrst two years
Tropical Resources: The Bulletin of the Yale Tropical Resources Institute 11
after planting until the teak canopy established and further cutting was generally unnecessary. Initial spacing for the teak was 2.5x3 to 3x3 m for all the stands. About a third of the plots were on slopes <3%, while the rest were on 10-25% slopes. In slopes <3%, soils were typically riparian Inceptisols. Soils on slopes 2':3% were mostly Ultisols. Several soil samples showed organic material ranging from 1.5-5.6% and pHs ranging from 5.3 to 6.4. The sampled stands did not show any evidence of grazing nor of recent fires.
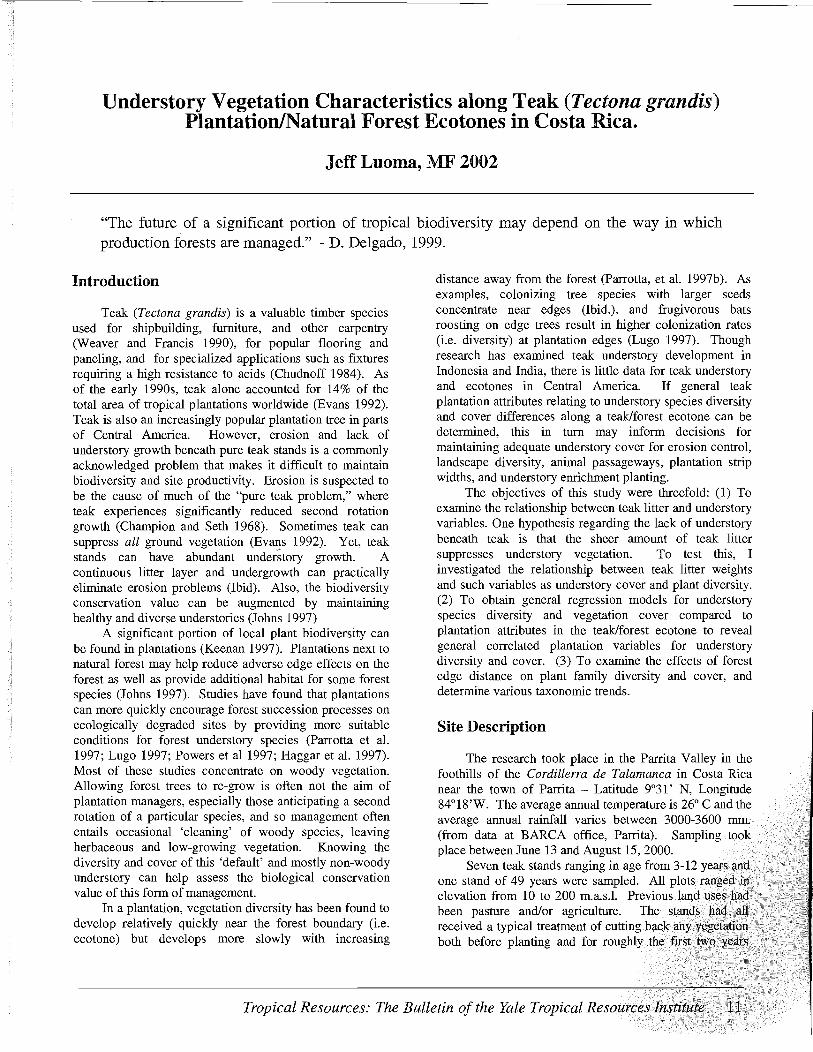
View of planting preparation and adjacent forest
Methods
Site Selection Criteria Teak plantations were chosen with the following
criteria: (1) Pure teak stands with a width greater than 50 m in order to measure "interior" teak conditions, (2) stands 3 years or older, as this age begins to show a reduced understory, (3) contiguous edges 100+ m long with a swath of natural forest (at least 2 ha and typically over 10 ha in order to include a broad range of native vegetation), (4) an adjacent forest canopy nearly as tall or taller than the teak canopy in order to limit light differences along the ecotone, and (5) no thinning or weeding cuts within the past year to allow any vigorously resprouting plants time to establish. Most of the plots had only low-growing understory below 1.4 m of shrubs, vines, herbs, and grasses.
Experimental Design Transects running from the forest/teak edge into the
teak (perpendicular to the edge line) were established at random points 15 to 40 m apart along the forest/teak edge. At each transect, 1 x 1 meter plots were set at 0 m (underneath the forest/teak canopy line), 3 m, 9 m, and 20 m further into the teak stand. These distances were chosen after visiting several of the teak plantations and informally assessing that understory floristic and vegetative cover changes generally seemed concentrated in the first 10-15 meters from the edge. A total of 45 transects of four plots
12 Spring 2002
each were measured in 8 different stands. Four stands had only four transects each.
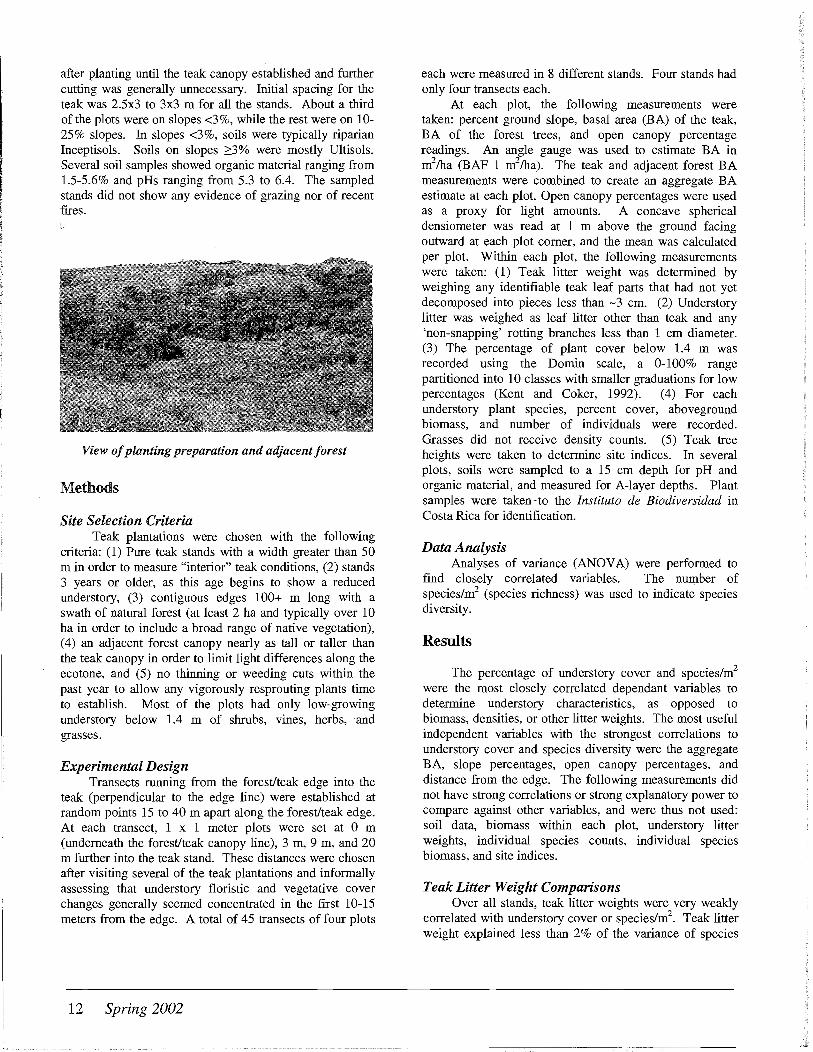
At each plot, the following measurements were taken: percent ground slope, basal area (BA) of the teak, BA of the forest trees, and open canopy percentage readings. An angle gauge was used to estimate BA in m2/ha (BAF 1 m2/ha). The teak and adjacent forest BA measurements were combined to create an aggregate BA estimate at each plot. Open canopy percentages were used as a proxy for light amounts. A concave spherical densiometer was read at 1 m above the ground facing outward at each plot corner, and the mean was calculated per plot. Within each plot, the following measurements were taken: (1) Teak litter weight was determined by weighing any identifiable teak leaf parts that had not yet decomposed into pieces less than -3 cm. (2) Understory litter was weighed as leaf litter other than teak and any 'non-snapping' rotting branches less than 1 cm diameter. (3) The percentage of plant cover below 1.4 m was recorded using the Domin scale, a 0-100% range partitioned into 10 classes with smaller graduations for low percentages (Kent and Coker, 1992). (4) For each understory plant species, percent cover, aboveground biomass, and number of individuals were recorded. Grasses did not receive density counts. (5) Teak tree heights were taken to determine site indices. In several plots, soils were sampled to a 15 cm depth for pH and organic material, and measured for A-layer depths. Plant samples were taken -to the Instituto de Biodiversidad in Costa Rica for identification.
Data Analysis Analyses of variance (ANOV A) were performed to
find closely correlated variables. The number of species/m2 (species richness) was used to indicate species diversity.
Results
The percentage of understory cover and species/m2 were the most closely correlated dependant variables to determine understory characteristics, as opposed to biomass, densities, or other litter weights. The most useful independent variables with the strongest correlations to understory cover and species diversity were the aggregate BA, slope percentages, open canopy percentages, and distance from the edge. The following measurements did not have strong correlations or strong explanatory power to compare against other variables, and were thus not used: soil data, biomass within each plot, understory litter weights, individual species counts, individual species biomass, and site indices.
Teak Litter Weight Comparisons Over all stands, teak litter weights were very weakly
correlated with understory cover or species/m2• Teak litter
weight explained less than 2% of the variance of species
per plot, and less than 1 % of cover variance. BA, distance from the edge, and open canopy percentages also varied with teak litter weight by less than 1 %. Yet, slope percentages showed a positive correlation with teak litter weight (r2 = 0.23). Teak litter weights at various slope percentages are presented in Table 1. The steepest stand (63% slope ±18%) had a mean teak litter weight over twice the average weight of any other stands (1770 g ± 729). When only the 28 plots in the 3-year old stand were examined, teak litter explained 31 % of the variation in vegetative cover and 18% of the variation in species diversity. However, these correlations promptly diminished with the inclusion of any older stand data.
Table 1: Teak litter weights at various slopes for 180 plots in the Parrita Valley, Costa Rica (standard errors in parentheses).
Percent slope Teak litter weight Plots
o :S slope :S 3 385 (± 206) g. 63
3 < slope:S 10 738 (± 336) 28
10 < slope :S 25 744 (± 432) 42
25 < slope :S 40 912 (± 616) 19
40 < slope:S 100 1196 (±737) 28
Regression Estimators for Understory Cover and Species Diversity
For general regression models, three variables had the strongest ability to predict understory cover and speciesfm2: BA, open canopy percentages, and the distance from the teak/forest edge. Notable correlations are shown in Table 2. BA and distance were negatively associated with cover and speciesfm2, while open canopy percentages were positively associated. Differences of r2 values were minimal using either squared roots or log transformations of values of both BA and distance from the edge. Similarly, the r2 values using the squared roots and the cubed roots of the open canopy percentages were nearly the same. The correlation coefficients for all of the models in Table 2 were P<.OOOL Slope was a positive but weak indicator for understory cover with r2=.02.
Table 2: Single and multiple regressions with number of species per m 2 and percent understory cover for 180 plots
in the Parrita Valley, Costa Rica.
Independent ~"riable(s) r' (adj. r') F vaine
s ~ rJ:B.ArB~A==~===7=-______________ r·_21 ____ -t_+_7._2-i ] f ~dislance from edge .17 37.5
~~~=-~=====----------t-----r--~ '" J:B.A V% open canopy log(distance from edge) .39 (.38) 37.4
~ " rl~~~~7~m~n_rer.fr~o=m=ed=~7)==~=-__________ ~·13 ____ -i __ 2_6.8~ ; ~ 1-J:B.A-;B=A=-...!.J-;::d=iSlan=c=e=fro=m=e<!ge-=--;;::::=====-t_.2_1 ...:.(._20..:..) ---!_Z_3.6---j ~.. J:B.A V%opencanopy ~distancefromedge .23 (.22) 17.6
Effects of Distance from Teak/Forest Edge and Taxonomic Trends
Distance from the edge was only very weakly correlated with any other independent variable. BA and distance from the edge had almost no correlation (r2=.002), and open canopy percentages and distance had a very slight negative correlation (r2= .01). (BA and open canopy percentages had a much stronger negative correlation (r2= .21).) Overall, the average percent understory cover per plot was 42% with a standard error of 10%, while the average number of speciesfm2 was 6.9 with a standard error of 1.8, though the median was 7.6. Stand average differences across distances to the edge are shown in Figure 1. Across all plots, the mean BA reading was 11.4 m2fha (±4.5), the mean open canopy percentage was 10.4% (±5.3%), and mean slope was 19.4% (±22.9%).
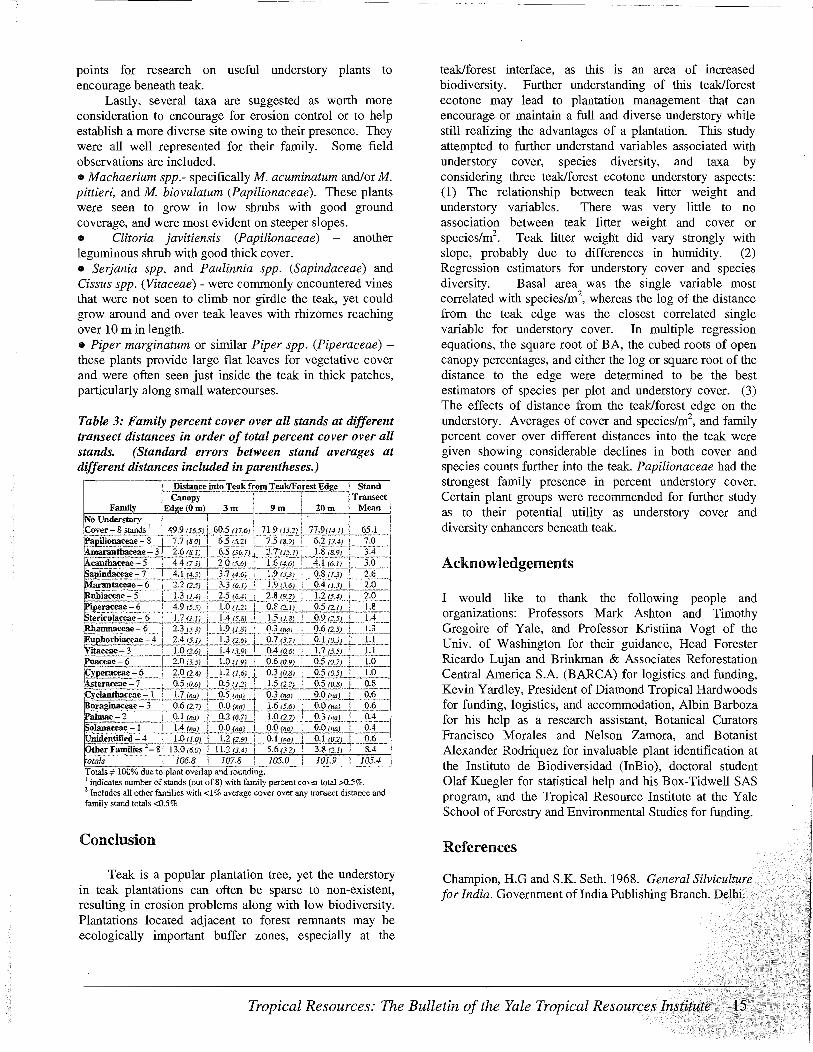
66 families and 132 genera were recorded. 94% of the species were identified to family, while 84% were identified to genera. 2.2% of the species counts were unidentified seedlings. Family data were compiled for different distances from the teak/forest edge using stand averages (Table 3). The subfamily Papilionaceae (Leguminosae) stood out as a clear presence in all the stands and across all edge distances, with about 7% average cover. Though Amaranthaceae and Acanthaceae covered 3.4% and 3.0% of the aggregated plots, they covered ::::0.5% in only three and five out of the eight stands, respectively. Sapindaceae and Marantaceae had a better distribution, being recorded as ::::0.5% in seven and six of the corresponding stands, but only had overall coverages of 2.6% and 2.0%. Amongst the families in Table 3, there were no clear differences in mean BA estimates nor mean open canopy percentages, though with mean slope percentages, there were some notable differences. Amaranthaceae had a mean slope reading of 4% (SE 7%), Piperaceae had a mean of 29% (SE 26%), and Rhamnaceae had a mean of 36% (23%).
Certain genera and species within the 18 families were more prevalent. In the Papilionaceae, the genus Machaerium alone provided over half of the cover, and about half of the Machaerium was provided from one stand with very steep slopes (-50-80% typical) that contained M. biovulatum 'siete cuero,' and M. acuminatum and/or M. pittieri 'bejuco negro.' Plots in other stands often recorded instances of the genus Lonchocarpus 'chapierno,' and vines of Desmodium and Centrosema ('pega pega' named for their epizoic seeds). Clitoria javitiensis was encountered growing well as a thick shrub in steeper slopes of a 12-year-old stand that had undergone a hard thinning two years earlier. In all, at least 12 different Papilionaceae species were encountered, more than any other family, and Papiiionaceae was the only family with a presence of>0.5% cover in every stand.
The family Amaranthaceae principally included species in the genera Achyrathes and Cyanthuia, with over 90% of the total cover from a 49-year-old stand on flat ground. Most of the Acanthaceae family (common name
Tropical Resources: The Bulletin of the Yale Tropical Resources Institute 13
'R6milla') were found in the younger stands with modest slopes (-10-30%) and in the 12-year-old stand that had been thinned two years earlier.
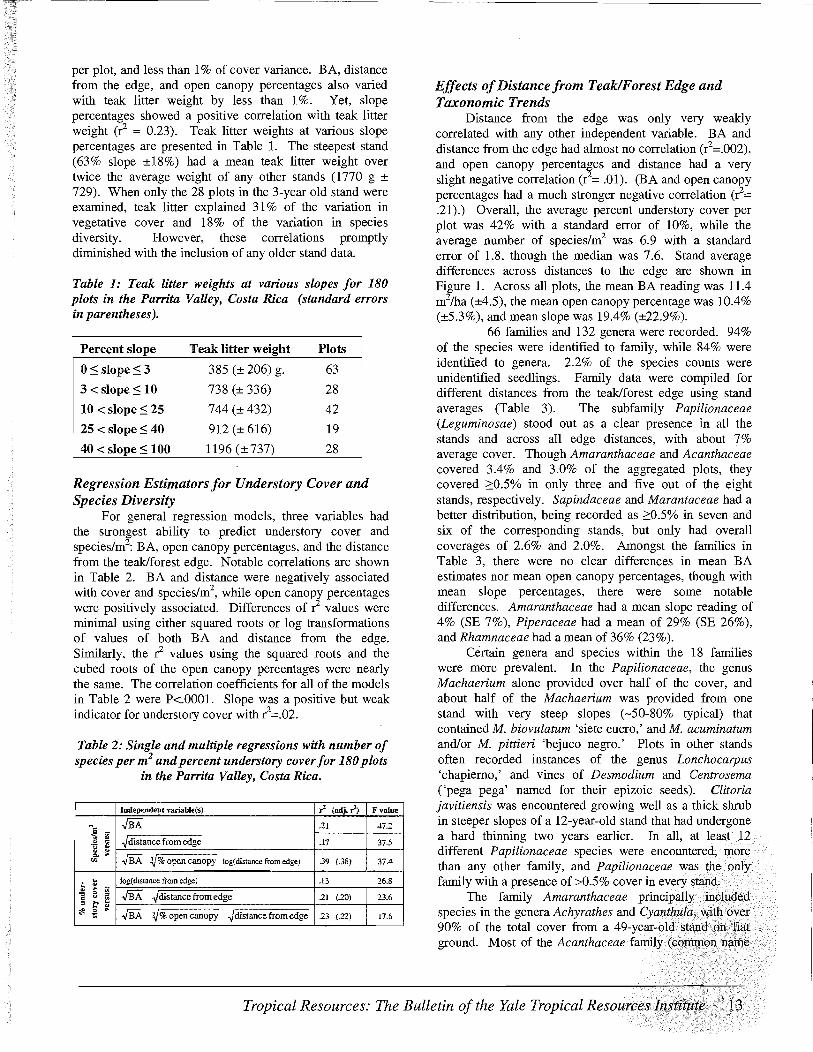
In the Sapindaceae family, the genera Paullina and Serjania accounted for most all of the cover. With the Marantaceae family, Calathea 'platanillo' was the single genus recorded. The family Rubiaceae consisted mostly of Psychotria with three quarters of that being P. horizontals, encountered in one 4-year-old stand with modest slopes (-5-35%). The Piperaceae were all Piper species, typically P. marginatum 'anicillo' where identified, though two stands also had P. reticulatum 'anicillo montana.' In the Sterculiaceae, nearly all the encountered plants were Guazuma invira or G. ulmifolia 'guacimo.'
Sample of Piperaceae Piper reticmatum
Plants of the family Rhamnaceae were all identified as two or three viny Gouania species. Both Euphorbiaceae, and Acalypha diversifolia 'camilla de mula' had the highest percent cover, accounting for over half of that family's total cover. In Vitaceae, all were of the genus Cissus, and all of those identified to species were the vine C. verticillata. Within Poaceae, species were a mix of typical pasture grasses. Paspalum spp. was encountered most frequently. The Cyperaceae mostly included the genera Seleria and Cyperus 'navajuela.' The Asteraceae were mostly Vernonia patens 'tuete' with Clibadium subariculatum 'murcielaguillo.' The family Cyclanthaceae consisted of Carludovica spp. 'tococa,' also from the 4-year-old stand.
The Boraginaceae included some small Cordia spp. 'laurel,' but were mostly Tournefortia spp. with one identified species T. hirsutissima. The Palmae were most all of the genus Roystonea 'palma reaL'
Discussion
Teak litter weight was not significantly correlated with either understory cover or speciesfm2, thus not supporting the hypothesis that the amount of teak leaves
14 Spring 2002
accumulating on the forest floor negatively impacts species diversity or understory cover. The main problem with this hypothesis seems that teak litter does not accumulate with any relation to teak growth beyond the first few years. The higher correlations in the 3-year old stand probably were due to shading effects of live teak leaves from trees that had not reached crown closure, where teak litter is dropped immediately below the trees, as well as more recent cleaning around the teak. The teak litter weight lacked significant correlation between any variable except for slope. The teak leaves seemed to decompose more slowly on the slopes. Exposed soil and resultant erosion were often obvious in the flatter stands. A potential cause of this exposed soil is increased and more constant humidity in the flatter stands, leading to faster decomposition of the teak leaves. That the highest teak litter weights were found in both the youngest and the steepest stands was probably due to increased air movement and drier conditions in these stands resulting from a more heterogeneous and open canopy. The teak litter may still be negatively affecting the understory through allelopathy or by temporarily blocking light upon leaf fall, but this was not correlated to teak litter weights.
Open canopy percentage measurements correlated positively to understory cover and speciesfm2, but with a relatively low correlation. Diffuse light on slopes and from nearby gaps were not easily measurable with the concave spherical densiometer. This instrument may be at best a very rough gauge for actual understory light conditions and diversity.. Comparing cover and species counts using a light meter that measures diffuse light may show tighter correlations.
The aggregate BA estimate was the highest correlated single predictor for speciesfm2 and was a strong factor for predicting cover. By implication, improvements in timely thinning regimes along a teak/forest ecotone can enhance understory cover and species diversity. One teak stand visited but not sampled during this study had well-spaced, large and healthy teak growing amidst a lush understory several meters talL The teak had straight boles and full crowns and the canopy was quite open. It was clear that thinning had created conditions for this understory to fill in very well. A similar-aged stand nearby had closely-spaced teak and was nearly devoid of understory.
The distance from the edge of the teak was consistently a strong negatively correlated indicator variable for cover and speciesfm2. Distance was only very weakly correlated to BA and open canopy percentages. Further studies that examine the effects of plantation strips of different widths next to forests on the understory across may yield strategies to maintain cover and diversity at desired levels.
The taxonomic data suggest that families such as Amaranthaceae, Acanthaceae, Sapindaceae, and Papilionaceae can successfully establish underneath teak. These families with higher coverage percentages noted in Table 3, and Papilionaceae in particular, may be starting
points for research on useful understory plants to encourage beneath teak.
Lastly, several taxa are suggested as worth more consideration to encourage for erosion control or to help establish a more diverse site owing to their presence. They were all well represented for their family. Some field observations are included. • Machaerium spp.- specifically M. acuminatum and/or M. pittieri, and M. biovulatum (Papilionaceae). These plants were seen to grow in low shrubs with good ground coverage, and were most evident on steeper slopes. • Clitoria javitiensis (Papilionaceae) another leguminous shrub with good thick cover. • Serjania spp. and Paulinnia spp. (Sapindaceae) and Cissus spp. (Vitaceae) - were commonly encountered vines that were not seen to climb nor girdle the teak, yet could grow around and over teak leaves with rhizomes reaching over 10 m in length. • Piper marginatum or similar Piper spp. (Piperaceae) -these plants provide large flat leaves for vegetative cover and were often seen just inside the teak in thick patches, particularly along small watercourses.
Table 3: Family percent cover over all stands at different transect distances in order of total percent cover over all stands. (Standard errors between stand averages at different distances included in parentheses.)
L"~~~!,:~~~!"_}:~~~.f!:!!.,-,!~!~·--= __ ~o-res-t-'!'dC"C __ ~g-e_-.,"-i -S-ta-n""""d-' t Canopy i i ! Transect
Family lEd e(Om} 3m i 9m . 20m i Mean No Understory , : I ! i . ;
'~~~~~~~~Ti~~f~~I+=~~:~ijij=7±Iii~i]1~~!i·::It·~ '-'!!l~~ae-:J..L.~~L~!J..J~~_0.0!l.L~-riL\'1) t-J~!':ZLL._1L __
o\cantbaceae-5 : 4.417.3)! Z.O{j.b) t 1.6(4.6): 4.) 16.1): 3.0
-~~!~:Z~~3~it!~H~~]~~tJl1~~}~~~r=n_~ ~~~~_=.L. __ ;_·4.c9 15.5)+j.0 (1.2) i ..Q,§ (2.!.Ll_~5 12JL~ _____ .1_~_
=!~t!;;t::L;l~~i:J .. :;~_~t~~t:::~:;~~j __ .~;~.:i~tt::::it=-~orbiac~_=_~_~.* (S.Iq __ l:2J1.6)--L_.Q,2p.7/ ! _Jl:.!_~d!_ .. L_.L-'... __
_!.~~ae_=.l.. ______ ~ __ '!':'Q.G,6Ll __ .. l-~('1,~J_L._<l:~j~6L';'. __ .PJ:';'~1-f_ .. _J·l oaceae - 6 i 2.0 (3.5) i l.0 (I.9)! 0.610.9) i 0.5 (0.7): LO .----raceae.::6-----:---2.0 a8JT-i~2(1.6j-f-·-O'3-;O:8)T-o:5(~5;--'-- To--
~~~~~;~;tf~~:j~11~~f~llj}!J~j'!r~~]J:=: aJmae - 2 ! 0.1 (na) 1 0.211l.7) i 1.0 (27) i 0.3 (naJ ' 0.4
-:;~i~t~i:=i-ti~LJ~::1f~~~£%¥:i~£:1=~~~~~~-l:::II~:: fuer FamiliES - 8' 13.0IMl 1 11.2 (3.4J I 5.6(2) t 3.812.1J: 8.4
vials I 106.8 i ]07.8 i 105.0 i 101_9 105..1-Totals oF 100% due to plant overlap and rounding. , indicates number of stand., (out of 8) v.'ith family percent cover total >0.5%. 2 Includes all otber families witb <l % average cover over any transect distance and family stand totals <0.5%
Conclusion
Teak is a popular plantation tree, yet the understory in teak plantations can often be sparse to non-existent, resulting in erosion problems along with low biodiversity. Plantations located adjacent to forest remnants may be ecologically important buffer zones, especially at the
teak/forest interface, as this is an area of increased biodiversity. Further understanding of this teak/forest ecotone may lead to plantation management that can encourage or maintain a full and diverse understory while still realizing the advantages of a plantation. This study attempted to further understand variables associated with understory cover, species diversity, and taxa by considering three teak/forest ecotone understory aspects: (1) The relationship between teak litter weight and understory variables. There was very little to no association between teak litter weight and cover or species/m2
. Teak litter weight did vary strongly with slope, probably due to differences in humidity. (2) Regression estimators for understory cover and species diversity. Basal area was the single variable most correlated with species/m2, whereas the log of the distance from the teak edge was the closest correlated single variable for understory cover. In multiple regression equations, the square root of BA, the cubed roots of open canopy percentages, and either the log or square root of the distance to the edge were determined to be the best estimators of species per plot and understory cover. (3) The effects of distance from the teak/forest edge on the understory. Averages of cover and species/m2, and family percent cover over different distances into the teak were given showing considerable declines in both cover and species counts further into the teak. Papilionaceae had the strongest family presence in percent understory cover. Certain plant groups were recommended for further study as to their potential utility as understory cover and diversity enhancers beneath teak.
Acknowledgements
I would like to thank the following people and organizations: Professors Mark Ashton and Timothy Gregoire of Yale, and Professor Kristiina Vogt of the Univ. of Washington for their guidance, Head Forester Ricardo Lujan and Brinkman & Associates Reforestation Central America S.A. (BARCA) for logistics and funding, Kevin Yardley, President of Diamond Tropical Hardwoods for funding, logistics, and accommodation, Albin Barboza for his help as a research assistant, Botanical Curators Francisco Morales and Nelson Zamora, and Botanist Alexander Rodriquez for invaluable plant identification at the Instituto de Biodiversidad (InBio), doctoral student Olaf Kuegler for statistical help and his Box-Tidwell SAS program, and the Tropical Resource Institute at the Yale School of Forestry and Environmental Studies for funding.
References
Champion, H.G and S.K. Seth. 1968. General Silviculture for India. Government of India Publishing Branch. Delhi.
Tropical Resources: The Bulletin of the Yale Tropical Resources Institute 15

Chudnoff, M. 1984. Tropical Timbers of the World Agriculture Handbook Number 607. USDA, Forest Service.
Delgado D., Finegan B. 1999. Biodiversidad vegetal en bosques manejados. Revista Forestal Centroamericana. 7: 25,14-20.
Evans, J. 1992. Plantation Forestry in the Tropics - 2nd edition. New Yark: Oxford University Press
Haggar, Jeremy, K. Wightman, R. Fisher. 1997. The potential of plantations to foster woody regeneration within a deforested landscape in lowland Costa Rica. Forest Ecology and Management 99: 55-64
Johns, Andrew G. 1997. Timber production and biodiversity conservation in tropical rain forests. Cambridge University Press.
Keenan R, Lamb D, Woldring 0, Irvine T, Jensen R. 1997. Restoration of plant biodiversity beneath tropical tree plantations in Northern Australia. Forest Ecology and Management 99: 117-131
Kent, M. and P. Coker. 1992. Vegetation Description and Analysis: A Practical Approach. West Sussex, England: John Wiley & Sons
Lugo, Ariel E. 1997. The apparent paradox of reestablishing species richness on degraded lands with tree monocultures. Forest Ecology and Management 99: 9-19
Parrotta, John A., J.W. Turnbull, N. Jones. 1997. Catalyzing native forest regeneration on degraded tropical lands. Forest Ecology and Management 99: 1-7
Parrotta, John A., O.H. Knowles, J.M. Wunderle Jr. 1997b. Development of floristic diversity in lO-year-old restoration forests on a bauxite mined sited in Amazonia. Forest Ecology and Management 99: 21-42
Powers, Jennifer Sarah, J.P. Haggar, R.F. Fisher. 1997. The effect of overstory composition on understory woody regeneration and species richness in 7-year-old plantations in Costa Rica. Forest Ecology and Management 99: 43-54
Weaver, P.L. and J.K. Francis. 1990. The Performance of Tectona grandis in Puerto Rico. Commonwealth Forestry Review 69(4): 313-323
16 Spring 2002
BARCA workers ready to plant trees

Sea Turtles in Liberia: A Baseline Survey
Aliya ErcelawD, MES 2001
Introduction
Sea turtles - species at risk Sea turtles are on their way out. All seven sea
turtle species have been classified as endangered or threatened worldwide. Concern for the future of sea turtles is justified, as anthropogenic threats to their survival are numerous. For example, their nesting sites are converted to hotels and houses. Adults are killed and their nests poached for food, oil, and aphrodisiacs. They are struck by boats, choked or strangled by trash in the water, and drowned by fishing nets and lines.
The magnitude and specific combinations of these and other threats to sea turtle populations vary greatly from location to location. Strategies adopted to conserve the populations have been equally diverse in scope and form. In some locations, such as in the United States, conservation programs (research, monitoring, and education) are developed and conducted by governmental agencies and non-governmental organizations with minimal participation by the local communities.
In other areas, there is an emphasis on local community participation in some, iLnot all, phases of conservation efforts. Examples of such projects are the Caribbean Conservation Corporation's partnership with the indigenous Miskito people in Nicaragua (Ripple 1996), the Sea Turtle Restoration Project's collaboration with the coastal Guaymi community of Punta Banco, Costa Rica (Arauz and Naranjo 2000), and Projeto TAMAR-IBAMA in northern Brazil (Vieitas et al. 1999).
Current efforts in Liberia: project origins and objectives
In Liberia, a country that is politically unstable and where laws may be enforced erratically, efforts are underway to protect sea turtles using a community-based approach. Save My Future Foundation (SAMFU), a small NGO based in Monrovia, Liberia, has been spearheading those efforts. In 1999, SAMFU created the Liberia Sea Turtle Project (LSTP) team to gather information on the status of sea turtle populations and to assist coastal communities in developing conservation programs.
Although sporadic and anecdotal accounts of sea turtle activity in Liberia exist in literature dating back to the late 1800s, detailed information is lacking. In March 2000, SAMFU began collecting baseline data by conducting a pilot survey of coastal community residents in various locations within four coastal counties (Grand Cape Mount, Margibi, Grand Bassa, and Rivercess).
According to A. Formia and S. Siakor (personal communication 2000), the surveys indicated: • leatherback (Dermochelys coriacea), olive ridley
(Lepidochelys olivacea), green (Chelonia mydas), and hawksbill sea turtles (Eretmochelys imbricata) nest in the region;
• there is suitable habitat for development of juvenile sea turtles along rocky sections of the coast;
• harvest of eggs and meat by residents is occurring, but the frequency and magnitude is unknown.
The present research was conducted in collaboration with SAMFU in July 2000. Our research objectives were the following:
(I) To conduct a rapid baseline survey of the Liberian coastline in order to gather qualitative data on the following:
a) the species, distribution, abundance, and seasonality of sea turtles that are using the beaches for nesting and the coastal waters for feeding; b) potential threats to the populations from anthropogenic or natural sources.
(II) To identify and prioritize areas for initiating community-based conservation programs. (III) To conduct a series of training workshops for the
Liberian LSTP team members and any other interested parties on the basic biology of sea turtles and "best practice" research/monitoring techniques.
The results of this research will aid in the development of future community-based sea turtle conservation programs.
Methodology
Project location Liberia is
located in Western Africa, bounded by Sierra Leone to the north, Guinea to the east, Cote d'Ivoire to the south, and the Atlantic Ocean to the west.
The country is divided into 13 counties, 9 of which border the
Tropical Resources: The Bulletin of the Yale Tropical Resources Institute 17

Atlantic Ocean. The coastline is 579 km in length. It is dominated by long stretches of sandy beaches, interspersed with rocky areas, estuaries and mangroves. Liberia is a tropical country, located near the equator at 6°30'N, 9°30'W.
The surveys were conducted in the counties of Grand Cape Mount, Margibi, Grand Bassa and Rivercess. Previous surveys had indicated the presence of sea turtles in each of these sites.
Map of survey sites in Liberia
We used three techniques to qualitatively determine the species, distribution, abundance and seasonal activity of sea turtles in the region:
.. walking the coastline;
.. interviews with coastal community residents; • inspecting specimens/specimen parts.
Walking the coastline
The presence of gravid females, nests, and/or tracks provide the most definitive indicators of nesting areas. However, as our interviews with residents quickly confirmed, the main nesting season does not begin until October and our research was conducted in July and August. In the absence of direct evidence of nesting, physical features of the area were used to identify potential nesting habitat. For example, leatherbacks, loggerheads and green sea turtles tend to nest in open habitat, hawksbills prefer to nest in the forest, and olive ridleys commonly nest on beaches separated from the mainland (Diez and Ottenwalder 1999). We also noted whether there were rocky areas in the nearby coastal water, which could serve as juvenile developmental habitat.
Interactions with residents Conducting semi-structured group interviews
with the residents of coastal villages quickly became our most important source of information after discovering that July and August are not prime nesting months in these
18 Spring 2002
regions. Upon_entering a village, we would first locate the chief who then asked the community members to gather in a central location. Our questions were directed towards the entire group of participants. From our interactions with the residents we collected information on: 1) ecological characteristics (seasonality, distribution, and numbers of sea turtles); 2) levels and types of sea turtle utilization; 3) trends in sea turtle availability; 4) role and importance of turtles in the diet and income of the people in the area; and 5) cultural connections to turtles. We interviewed residents from thirty-one villages, two towns, and one army base. Responses from the interviews were content coded for analysis. Content analysis involved clustering the villagers' responses into categories and determining the frequency with which those responses occurred.
Interviewing residents in a village in Margibi County
Inspecting specimens Turtle carapaces and eggs found in the markets
and the villages provided another method for verifying the species types present in an area. For all available carapaces, the following measurements were recorded: 1) Minimum curved carapace length (CCLmin is measured from the anterior point (nuchal scute) at midline to the posterior notch at midline between the supracaudals); 2) curved carapace width (CCW is measured at the widest point, spanning from ridge crest to ridge crest); and 3) number of marginal, costal and vertebral scutes.
Overall Findings
There are a number of conclusions that can be drawn from the surveys of Grand Cape Mount, Margibi, Grand Bassa and Rivercess Counties:
Species found in these regions Based on interviews with the villagers, there are
five species of sea turtles that use Liberia's beaches for nesting and/or the coastal waters for feeding. They are Dermochelys coriacea, Lepidochelys olivacea, Chelonia mydas, Eretmochelys imbricata, and Caretta caretta.
Although we did not see any of the species in the act of nesting or swimming in the waters, we were able to verify the presence of the olive ridley, green, and
hawksbill species through carapaces provided by the villagers. Tangible evidence of leatherbacks was scant; this species lacks a hard shell, allowing villagers to consume the entire animaL We did note, however, the presence of an old leatherback nest on the beach in Grand Cape Mount County. Since leatherbacks are very distinctive looking because of their size and their markings, we are confident that villagers are identifying this species correctly. The presence of loggerheads could not be confirmed from our survey; although this species was mentioned by villagers in three out of the four counties, none of the carapaces we examined were loggerheads. Loggerheads are similar in size and shape to the green sea turtles, so it is possible that the villagers were misidentifying them. However, since loggerhead carapaces have been seen in markets in Monrovia (A. Formia, pers. comm.), it is probable that this species is a very infrequent nester or is only present in the coastal/deeper waters.
Table 1: Vernacular sea turtle names shared by the villagers:
Language Species Bassa Kru Vai
Leatherback
Olive Ridley
Green
Hawksbill
Loggerhead
Kway
Kpokon Pyan Unknown
Pyan
Jrosway Lui
Pama Sacko Sawgbojrokroa Unknown Sawgbojrokroa Unknown
Sawgbojrokroa Unknown
Relative abundance of the nesting species The leatherback is the most common sea turtle
species nesting on Liberian beaches, followed in abundance by olive ridleys. Residents from villages in each of the counties described seeing 2-5 leatherbacks nesting locally each night during the prime nesting season. Although the numbers of nesting individuals do not indicate arribada style nesting (mass-nesting where hundreds to thousands of sea turtles converge on a beach) these regions seem to be significant nesting areas for leatherbacks and olive ridleys. Greens and hawksbills--and possibly loggerheads--only nest sporadically.
Nesting season The nesting season lasts primarily from October
through May (the dry season), with a peak in nesting occurring during the months of December and January. Leatherbacks nest infrequently during the monsoon season (June-August) as welL
Frequency of harvest by villagers and type of use Sea turtle meat and eggs are popular items in the
diet of Liberians. Although sea turtles do not constitute the villagers' main source of food, the adults and eggs are a relatively easy resource to obtain during the nesting season, requiring only an investment in flashlights and a
few hours of nocturnal walking. Estimates of take range from 20 adult sea turtles per person annually in Fanti Town to 88 annually for an entire county. Since Liberian fishermen use artisanal fishing methods, only a small proportion of the take is due to capture in fishing nets. Ghanian shrimp trawlers operating offshore, however, could be causing high mortality. Trawling in other areas of the world has been shown to cause more incidental deaths of sea turtles than any other source (Ripple 1996).
The meat, eggs, and/or shells are sometimes sold to other villagers, but the money derived from this activity is minor and less important to residents than personal consumption. In some West African countries there are cultural beliefs or traditions associated with sea turtles; this does not appear to be the case in Liberia.
What's next The survey results indicate that the beaches in
Liberia are significant nesting areas for sea turtles and that current levels of take by villagers could affect the status of the populations over the long-term. Since we were only able to cover counties along the northern and middle regions of Liberia's coastline, I recommend that the beach and village surveys be continued in the southern counties. The surveys should be conducted during the dry season to increase the chances of seeing nests and live turtles, rather than having to rely purely on carapaces and information provided by villagers. Underwater surveys of the coastal areas would be valuable as well, particularly in order to identify important feeding areas and to verify the presence of loggerheads.
After the surveys are completed, or even based on current information, it would be valuable to choose a pilot site for quantification of nesting density and reducing harvest by community members. Criteria for selecting a pilot site could include: high levels of nesting based on available initial information; significant levels of take by villagers; remoteness from other villages; and accessibility by SAMFU staff. Based on these criteria, Borgor Point--an area in Rivercess County--appears to be an ideal pilot site.
If SAMFU is serious about involving local residents in conservation programs, then training and paying the villagers to do the surveys with oversight by SAMFU should be considered. Initial discussions with residents of several villages indicated that locals would be willing and interested in participating in research activities if compensation were involved. They also indicated that they would be willing to stop hunting sea turtles and their eggs if assistance in developing an alternative source of income/food were provided. Tourism has provided a reliable source of income and reduced take in several other countries, but it is not an option in Liberia because of the dangerous political situation. Other possibilities mentioned by the villagers include increased rice and livestock farming, fishing, and coconut oil production with the use of presses. Caution should be exercised in the extent and type of activity that is promoted so as to ensure that another natural resource problem is not created. Since
Tropical Resources: The Bulletin of the Yale Tropical Resources Institute 19

sustainable harvest of sea turtles and their eggs currently appears to be impossible (based on theory and results from other community-based programs attempting limited take), SAMFU should emphasize eliminating sea turtle take by locals rather than just reducing it as the long-term goal.
Alternatives to egg hunting could include increased rice cultivation
Even if the pilot program is successful, sAMFU needs to be realistic about what it can accomplish on its own. A village by village approach with protection of sea turtles as the primary focus of SAMFU's efforts will be expensive, as well as time and labor-intensive. It may be worthwhile for SAMFU to partner with the myriad of other NGOS and aid agencies who are working to improve the quality of life in Liberian villages. Health, education, economic improvements, and natural resource management objectives-including the protection of sea turtles-could be coupled together, rather than taking a piece-meal approach.
The future of sea turtles in Liberia is uncertain. I am positive, however, that SAMFU will persevere in its efforts to protect sea turtles by involving the very people who depend on these species.
Acknowledgements
I would like to extend my gratitude to the following people: SAMFU staff members for inviting me to come to their beautiful country and assist in their efforts; Stephen Greaves and James Makor who enthusiastically accompanied me on every field trip; Angela Forrnia and Jamison Suter for their valuable advice and encouragement before and after the trip; and Professor Mark Ashton and Jim Bryan for taking a leap of faith and contributing TRI funds towards my research.
References
Arauz, R. and 1. Naranjo. 2000. Conservation and research of sea turtles, using coastal community organizations as the cornerstone of support-Punta Banco and the indigenous
20 Spring 2002
Guaymi community of Conte Burica, Costa Rica. In Proceedings of the Eighteenth International Sea Turtle Symposium, NOAA Technical Memorandum NMFSSEFSC-436, edited by F. Abreu-Grobois, R. BrisenoDuenas, R. Marquez and L. Sarti. U.S. Dept. of Commerce, 238-240.
Diez, C. and J. Ottenwalder. 1999. Habitat Surveys. In Research and Management Techniques for the Conservation of Sea Turtles, edited by K. Eckert, K. Bjorndal, F. Abreau-Grobois, and M. Donnelly. mCN/SSC Marine Turtle Specialist Group, 41-44.
Eckert, K., K. Bjorndal, F. Abreau-Grobois and M. Donnelly. 1999. Research and Management Techniques for the Conservation of Sea Turtles. IUCN/SSC Marine Turtle Specialist Group.
Forrnia, A. 2000. Personal communication. Doctoral student at Cardiff University, UK.
Lutcavage, M., P. Plotkin, B. Witherington and P. Lutz. 1997. Human Impacts on Sea Turtle Survival. In The Biology of Sea Turtles, edited by P. Lutz and J. Musick. London: CRC Press, 387-410
Ripple, 1996. Sea Turtles. Voyageur Press, Inc., MN.
Siakor, S. 2000. PersQnal communication. Member of SAMFU.
Vieitas, C., G. Lopez, and M. Marcovaldi. 1999. Local community involvement in conservation-the use of miniguides in a programme for sea turtles in Brazil. Oryx 33: 127-131.

Promoting Regeneration within a Rainforest Plantation: The Effect of Tree Species and Tree Structure
on Vegetation Recruitment Patterns
Libby Jones, MESc 2002
Introduction
In a country that has lost more than 30 percent of its forested area to land and agro-pastoral development in the past 50 years (Romero et al. 1999), reforestation projects in Panama are gravely needed to improve soil and water quality. The Panama Native Species Reforestation Project (PRO RENA), a recent partnership between Yale Tropical Resources Institute, Smithsonian Tropical Research Institute and Harvard's Center for International Development, focuses on developing strategies to restore abandoned pastures and degraded grasslands through native species reforestation. Though native tree species may provide greater ecological and economic resources than exotic species, little information exists regarding their effective management. It is therefore critical to develop a strong knowledge base regarding strategies that best promote native species regeneration. As our understanding of native species forest dynamics grows, so too will the effectiveness of reforestation efforts in Panama and around the world.
Better knowledge regarding the relative impacts of various structural and species components within a reforestation plot is crucial to guide forest managers when designing reforestation plantations. Studies indicate that sites containing perches, structural complexity, fruit, understory vegetation and close proximity to primary forest (Wunderle 1997) attract seed dispersers, though the significance of each component is unknown. This study aims to determine those aspects in native trees that promote the greatest level of seed dispersal and regeneration in forests plantations and consequently lead to more effective management strategies for tropical forest regeneration.
The objectives of the study are 1) to assess the abundance and diversity of seedling regeneration as a function of tree species and tree structure; 2) to assess the relative attractiveness of particular tree species and tree types to birds; and 3) to identify the management practices with respect to tree species and tree type that will best promote high levels of seed dispersal and seedling recruitment. I hypothesize that 1) there are particular tree species and/or tree types that promote greater regeneration than others; 2) birds are attracted to particular tree species and/or tree types more than others; and 3) regeneration rates are positively correlated to bird visitation rates.
Study Site
Data was collected at Red Tank, a recently established mixed native species plantation adjacent to the Panama Canal. The site began as a landfill in 1953. Operation stopped in 1995 and the site was spread with a 36-inch cover of clay to prepare for tree plantings (Phillips 2001). The purpose of the planting was to transplant adjacent tropical forest and promote regeneration without requiring intensive maintenance. Species were chosen based on their ability to produce food and shelter for animals, grow aggressively, and provide little economic incentive for harvesting by nearby communities. 14 species of trees were planted in patches of varying sized, totaling 13 hectares, at Red Tank late in the dry season (March and April) of 1998. Since the plantings, invasive grasses, particularly Saccharum spontaneum, have been cut approximately 2 times per year.
Methodology
Assessment of seedling regeneration as a function of tree species and tree structure.
A total of 5 areas were selected within Red Tank for the study. Criteria for plot selection included plantation size (150m x 40m minimum), availability of selected tree species, and accessibility. Sampled trees were selected using detailed maps of each area. A 15m buffer from every edge of the plot was outlined for each area. One transect for each subarea was chosen randomly and one tree of each of the seven species (Hura crepitans, Anacardium excelsum, Muntingia calabura, Dipteryx panamensis, Inga sp., Cordia sp., Luehea seemannii) was sampled. Unplanted areas almost entirely occupied by S. spontaneum, were sampled as a controL
For each tree, the following tree measurements were made 1) tree height; 2) height to crown (to the first leafing branch); 3) crown width; and 4) crown density. The understory regeneration at each tree was measured by placing 8 flags around the tree at 0.75 and 1.5 m from the center of the tree trunk and placing a rectangular sample frame measuring 0.5m x 0.2m at each flag. Within each frame, every species present was identified and its percent cover estimated. Percent cover of litter, soil, rocks and woody debris was estimated such that the final total percent
Tropical Resources: The Bulletin of the Yale Tropical Resources Institute 21
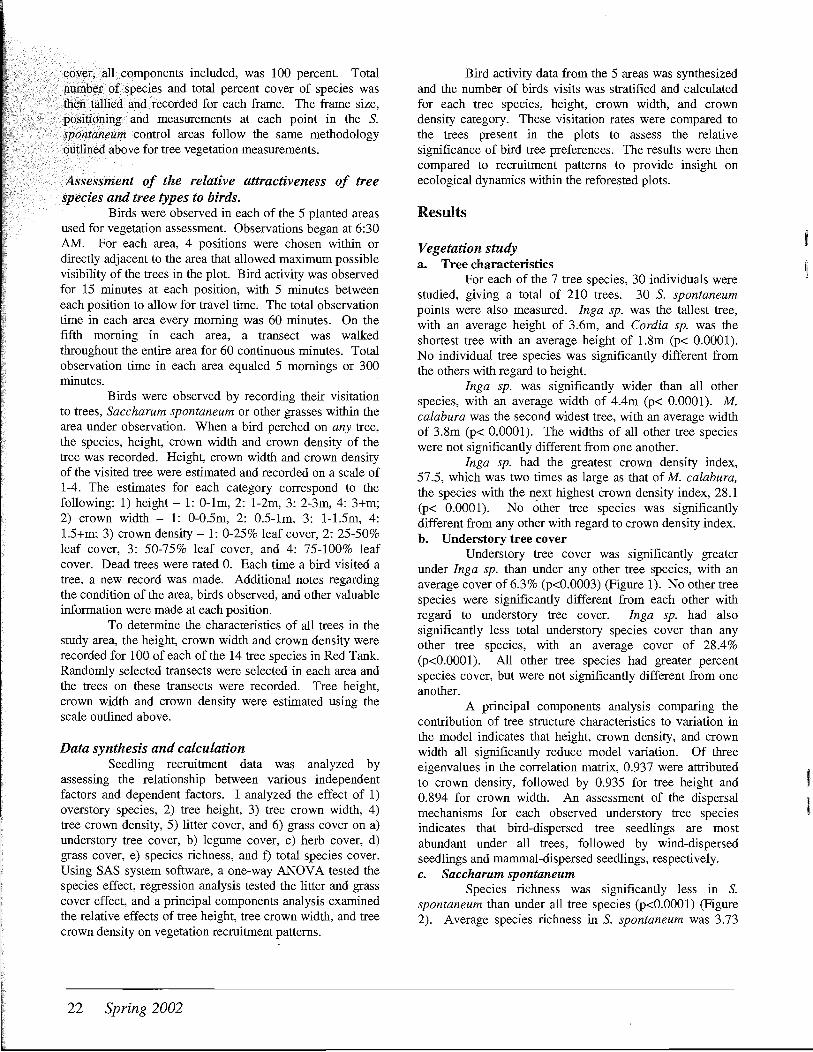
cover, all components included, was 100 percent. Total number of species and total percent cover of species was then tallied and recorded for each frame. The frame size, positioning and measurements at each point in the S. spontaneum control areas follow the same methodology outlined above for tree vegetation measurements.
Assessment of the relative attractiveness of tree species and tree types to birds.
Birds were observed in each of the 5 planted areas used for vegetation assessment. Observations began at 6:30 AM. For each area, 4 positions were chosen within or directly adjacent to the area that allowed maximum possible visibility of the trees in the plot. Bird activity was observed for 15 minutes at each position, with 5 minutes between each position to allow for travel time. The total observation time in each area every morning was 60 minutes. On the fifth morning in each area, a transect was walked throughout the entire area for 60 continuous minutes. Total observation time in each area equaled 5 mornings or 300 minutes.
Birds were observed by recording their visitation to trees, Saccharum spontaneum or other grasses within the area under observation. When a bird perched on any tree, the species, height, crown width and crown density of the tree was recorded. Height, crown width and crown density of the visited tree were estimated and recorded on a scale of 1-4. The estimates for each category correspond to the following: 1) height - 1: 0-lm, 2: I-2m, 3: 2-3m, 4: 3+m; 2) crown width - 1: O-O.5m, 2: 0.5-1m, 3: 1-1.5m, 4: 1.5+m; 3) crown density - 1: 0-25% leaf cover, 2: 25-50% leaf cover, 3: 50-75% leaf cover, and 4: 75-100% leaf cover. Dead trees were rated O. Each time a bird visited a tree, a new record was made. Additional notes regarding the condition of the area, birds observed, and other valuable information were made at each position.
To determine the characteristics of all trees in the study area, the height, crown width and crown density were recorded for 100 of each of the 14 tree species in Red Tank. Randomly selected transects were selected in each area and the trees on these transects were recorded. Tree height, crown width and crown density were estimated using the scale outlined above.
Data synthesis and calculation Seedling recruitment data was analyzed by
assessing the relationship between various independent factors and dependent factors. I analyzed the effect of 1) overstory species, 2) tree height, 3) tree crown width, 4) tree crown density, 5) litter cover, and 6) grass cover on a) understory tree cover, b) legume cover, c) herb cover, d) grass cover, e) species richness, and f) total species cover. Using SAS system software, a one-way ANOV A tested the species effect, regression analysis tested the litter and grass cover effect, and a principal components analysis examined the relative effects of tree height, tree crown width, and tree crown density on vegetation recruitment patterns.
22 Spring 2002
Bird activity data from the 5 areas was synthesized and the number of birds visits was stratified and calculated for each tree species, height, crown width, and crown density category. These visitation rates were compared to the trees present in the plots to assess the relative significance of bird tree preferences. The results were then compared to recruitment patterns to provide insight on ecological dynamics within the reforested plots.
Results
Vegetation study a. Tree characteristics
For each of the 7 tree species, 30 individuals were studied, giving a total of 210 trees. 30 S. spontaneum points were also measured. Inga sp. was the tallest tree, with an average height of 3.6m, and Cordia sp. was the shortest tree with an average height of 1.8m (p< 0.0001). No individual tree species was significantly different from the others with regard to height.
Inga sp. was significantly wider than all other species, with an average width of 4.4m (p< 0.0001). M. calabura was the second widest tree, with an average width of 3.8m (p< 0.0001). The widths of all other tree species were not significantly different from one another.
Inga sp. had the greatest crown density index, 57.5, which was two times as large as that of M. calabura, the species with the next highest crown density index, 28.1 (p< 0.0001). No other tree species was significantly different from any other with regard to crown density index. h. Understory tree cover
Understory tree cover was significantly greater under Inga sp. than under any other tree species, with an average cover of 6.3% (p<O.0003) (Figure 1). No other tree species were significantly different from each other with regard to understory tree cover. Inga sp. had also significantly less total understory species cover than any other tree species, with an average cover of 28.4% (p<O.OOOl). All other tree species had greater percent species cover, but were not significantly different from one another.
A principal components analysis comparing the contribution of tree structure characteristics to variation in the model indicates that height, crown density, and crown width all significantly reduce model variation. Of three eigenvalues in the correlation matrix, 0.937 were attributed to crown density, followed by 0.935 for tree height and 0.894 for crown width. An assessment of the dispersal mechanisms for each observed understory tree species indicates that bird-dispersed tree seedlings are most abundant under all trees, followed by wind-dispersed seedlings and mammal-dispersed seedlings, respectively. c. Saccharum spontaneum
Species richness was significantly less in S. spontaneum than under all tree species (p<O.OOO1) (Figure 2). Average species richness in S. spontaneum was 3.73
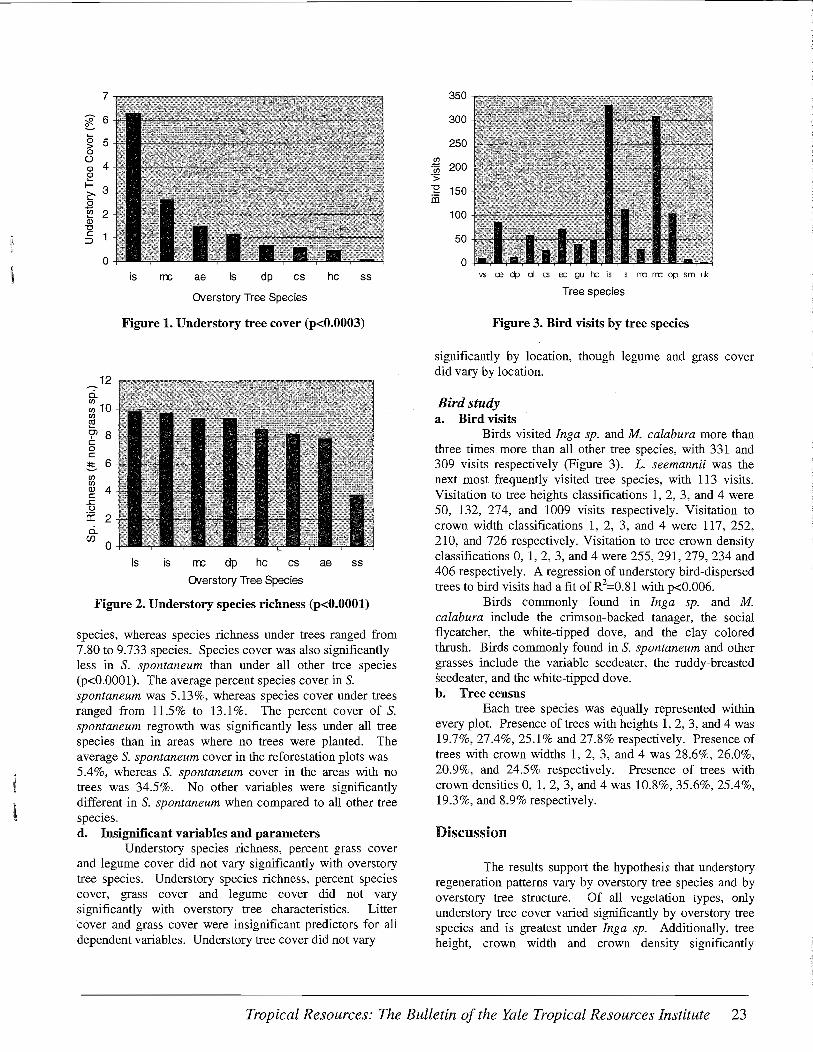
7
~ !L.-6
a; 5 > 0 0 (]) 4 ~ I- 3 ~ .8 (JJ 2 a;
""C C
::J
0 is me ae Is dp cs hc ss
Overstory Tree Species
Figure 1. Understory tree cover (p<O.0003)
12 ci. CJ)
CJ) 10 CJ)
~ Cl 8 C 0 c ~ 6
CJ) CJ) (]) 4 c ..c u a: 2 ci. (j)
0
Is is rrc dp hc cs ae ss
Overstory Tree Species
Figure 2. Understory species richness (p<O.OOOl)
species, whereas species richness under trees ranged from 7.80 to 9.733 species. Species cover was also significantly less in S. spontaneum than under all other tree species (p<O.OOOI). The average percent species cover in S. spontaneum was 5.13%, whereas species cover under trees ranged from 11.5% to 13.1%. The percent cover of S. spontaneum regrowth was significantly less under all tree species than in areas where no trees were planted. The average S. spontaneum cover in the reforestation plots was 5.4%, whereas S. spontaneum cover in the areas with no trees was 34.5%. No other variables were significantly different in S. spontaneum when compared to all other tree species. d. Insignificant variables and parameters
Understory species richness, percent grass cover and legume cover did not vary significantly with overstory tree species. Understory species richness, percent species cover, grass cover and legume cover did not vary significantly with overstory tree characteristics. Litter cover and grass cover were insignificant predictors for all dependent variables. Understory tree cover did not vary
350
300
250
.l!l 200 ·w .s;
"E 150 in
100
50
0 vs ce dp d cs e::: gu rc is Is rm rrc op sm uk
Tree species
Figure 3. Bird visits by tree species
significantly by location, though legume and grass cover did vary by location.
Bird study a. Bird visits
Birds visited Inga sp. and M. calabura more than three times more than all other tree species, with 331 and 309 visits respectively (Figure 3). L. seemannii was the next most frequently visited tree species, with 113 visits. Visitation to tree heights classifications 1, 2, 3, and 4 were 50, 132, 274, and 1009 visits respectively. Visitation to crown width classifications 1, 2, 3, and 4 were 117, 252, 210, and 726 respectively. Visitation to tree crown density classifications 0, 1, 2, 3, and 4 were 255, 291, 279, 234 and 406 respectively. A regression of understory bird-dispersed trees to bird visits had a fit of R2=0.81 with p<0.006.
Birds commonly found in Inga sp. and M. calabura include the crimson-backed tanager, the social flycatcher, the white-tipped dove, and the clay colored thrush. Birds commonly found in S. spontaneum and other grasses include the variable seedeater, the ruddy-breasted seedeater, and the white-tipped dove. b. Tree census
Each tree species was equally represented within every plot. Presence of trees with heights 1,2,3, and 4 was 19.7%,27.4%,25.1 % and 27.8% respectively. Presence of trees with crown widths 1, 2, 3, and 4 was 28.6%, 26.0%, 20.9%, and 24.5% respectively. Presence of trees with crown densities 0, 1, 2, 3, and 4 was 10.8%, 35.6%, 25.4%, 19.3%, and 8.9% respectively.
Discussion
The results support the hypothesis that understory regeneration patterns vary by overstory tree species and by overstory tree structure. Of all vegetation types, only understory tree cover varied significantly by overstory tree species and is greatest under Inga sp. Additionally, tree height, crown width and crown density significantly
Tropical Resources: The Bulletin of the Yale Tropical Resources Institute 23
determine tree recruitment rates, with crown density being the best predictor. However, because Inga sp. is significantly different from all other tree species in its high crown density, it is not possible to determine if the high understory tree recruitment can be attributed to characteristics that are specific to Inga sp. or to structure alone.
I speculate that regeneration success under Inga sp. is due to the relatively nitrogen-rich soils under Inga sp. and to the ability of Inga sp. to shade out pioneer grass species while facilitating growth of shade-tolerant tree species. Additionally, higher bird visitation rates on Inga sp. may further contribute to increased tree regeneration. The high correlation between bird visitation rates and birddispersed understory tree seedlings indicates that bird visits are a strong predictor of bird-dispersed recruitment rates. Additionally, birds generally visit trees of greatest height, crown width and crown density, which further supports the hypothesis that tree structure determines bird visitation rates and therefore regeneration patterns.
However, tree structure and/or tree species is an important determinant of understory tree recruitment, independent of bird visitation, as indicated by the significantly greater number of trees recruited by Inga sp. than by M. calabura, despite their similar bird visitation rates. The number of bird-dispersed trees under Inga sp. and M. calabura were identical, but additional winddispersed species were found under Inga sp.. This suggests that some characteristic of Inga sp. facilitates recruitment of wind-dispersed trees. Additional studies comparing regeneration rates under tree species with structure similar to Inga sp. would clarify whether high tree recruitment rates under Inga sp. can be attributed to its structure or to its species-specific characteristics.
In addition to species and/or structure dependent recruitment patterns, data indicates that the presence of any tree species in a reforestation plot increases the understory species richness and species cover relative to non-reforested areas, while significantly reducing the rate of S. spontaneum invasion. These results therefore emphasize the importance of reforestation in facilitating rainforest regeneration and suggest that tree species and structure are important factors to consider when choosing trees for reforestation projects.
Acknowledgements
This study would not have been possible without the collaboration and support of Arturo Cerezo, Roy Phillips, Mario Him, and other staff of the Panama Canal Authority. I would also like to thank Mark Wishnie, Mark Ashton and Oswald Schmitz for their guidance, Georgina Cullman and Jose Deago for their invaluable assistance in the field, and Adriana Sautu and staff at the Smithsonian Tropical Research Institute for help in facilitating all of my research arrangements. Financial support for this research was provided by the Native Species Reforestation Project and the Yale Tropical Resources Institute.
24 Spring 2002
References
Phillips, R. 2001. Interview by author. Red Tank operations manager.
Romero, M., A. Cerezo, A. Mosquera and D. Vargas. 1999. La industria forestal en Panama: consideraciones para su reconversion. Informe de Consultoria. Audtoridad Nacional del Ambiente (ANAM) y Organizacion Internacional de las Maderas Tropicales (OIMT). Proyecto: PD - 15/97 Rev.2.
Wunderle, J.M. 1997. The role of animal seed dispersal in accelerating native forest regeneration on degraded tropical lands. Forest Ecology and Management, 99:223-235.

Community Management of Natural Resources in a de facto Decentralizing Indonesia: A Case Study from East Kalimantan1
Steve Rhee, MESc, PhD Candidate
Introduction
In Indonesia, forests are often arenas of conflict among social actors with differential political power, especially in regions like Kalimantan that are rich in commercially valuable timber and also home to politically weak forest dependent communities (Dove 1993). Until the fall of Suharto in 1998, control over natural resources lay within the authority of a highly centralized state, which was characterized by authoritarian rule, aggressive exploitation of the nation's natural resources, and the marginalization of forest dependent communities justified through national laws and policies (Barber et al. 1994).
Recent changes in governance and policy affecting natural resource management in Indonesia have created unprecedented possibilities and challenges to forest comanagement initiatives, which attempt to devolve authority to local communities and settle disputes between villagers and other actors to improve both local livelihoods and forest health. A new forestry law that acknowledges "customary (traditionally managed) forests" and recently implemented political and fiscal decentralization laws promise a fresh political landscape to contest, negotiate, and manipulate rights, claims, and management of forest resources.
In 1999 the Government of Indonesia (GO!) passed a provocative set of decentralization laws, i.e., Law No. 22 regarding Regional Governance and Law No. 25 regarding Intergovernmental Fiscal Balance. The spirit of these two laws is in many ways diametrically opposed to the tradition of centralist control legitimated through previous legislation (Sembiring et al. 1999, Down to Earth 2000). Decentralization in Indonesia is a political reaction that attempts to guarantee that regions that possess natural resources will receive profit from these resources. It is assumed that regional autonomy will result in sustainable and democratic natural resource management, and that it will benefit local economies (NRM 2000).
Although Indonesia's decentralization laws were passed in May 1999, implementation has been slow and implementing regulations vague. During this transition period, GOI is preparing for the implementation of regional autonomy through activities such as synchronizing previous legislation with the decentralization laws and drafting implementing regulations. However, even though all of the regulations have not as yet been drafted,2 de facto decentralization is taking place. What I mean here by "de
facto decentralization" is as follows: because implementation processes have been slow and there seems to be great uncertainty among stakeholders as to how regional autonomy will operate, stakeholders are strategically maneuvering and positioning themselves, taking actions based on their own understandings of what decentralization means.
This paper describes the uncertainty and disparity in perceptions regarding regional autonomy as it applies to natural resources. This discussion is followed by a case study in East Kalimantan to illustrate that although there exists ambiguity regarding regional autonomy, stakeholders are acting strategically and that the actions of stakeholders, including local community members themselves, seem to be negatively impacting local communities as a whole.
Uncertainty and disparity in perceptions regarding decentralization
The level of uncertainty and disparity in perceptions regarding decentralization and its implications were captured in a study carried out from December 1999-February 2000 by the Institutional Task Force for Forestry Sector Decentralization under the auspices of the Ministry of Forestry and Estate Crops (MFEC 2000). In this study, the task force conducted interviews and group discussions with central and regional representatives of government agencies, legislative bodies, NGOs, universities, and communities, and held a three-day workshop with regional government representatives from six provinces (MFEC 2000). This study revealed that although regional stakeholders remain enthusiastic about forestry sector decentralization, there is no consensus on what it means, how it should be implemented, and how roles and responsibilities are divided. The results of this study also show that central government and regional government officials have significantly different opinions regarding authority over and responsibility for forests, such as: forest area determination, forest use determination, forest management area establishment, permitting production forests and protected areas, permitting the breeding and use of flora and fauna, the export of flora and fauna, and levies and tariffs (MFEC 2000). To justify their respective perceptions, government officials often draw upon existing legislation to bolster their arguments.
Although the level of uncertainty in the policy environment is high, stakeholders in certain areas are taking actions based on their respective understandings ofthe new
Tropical Resources: The Bulletin of the Yale Tropical Resources Institute 25
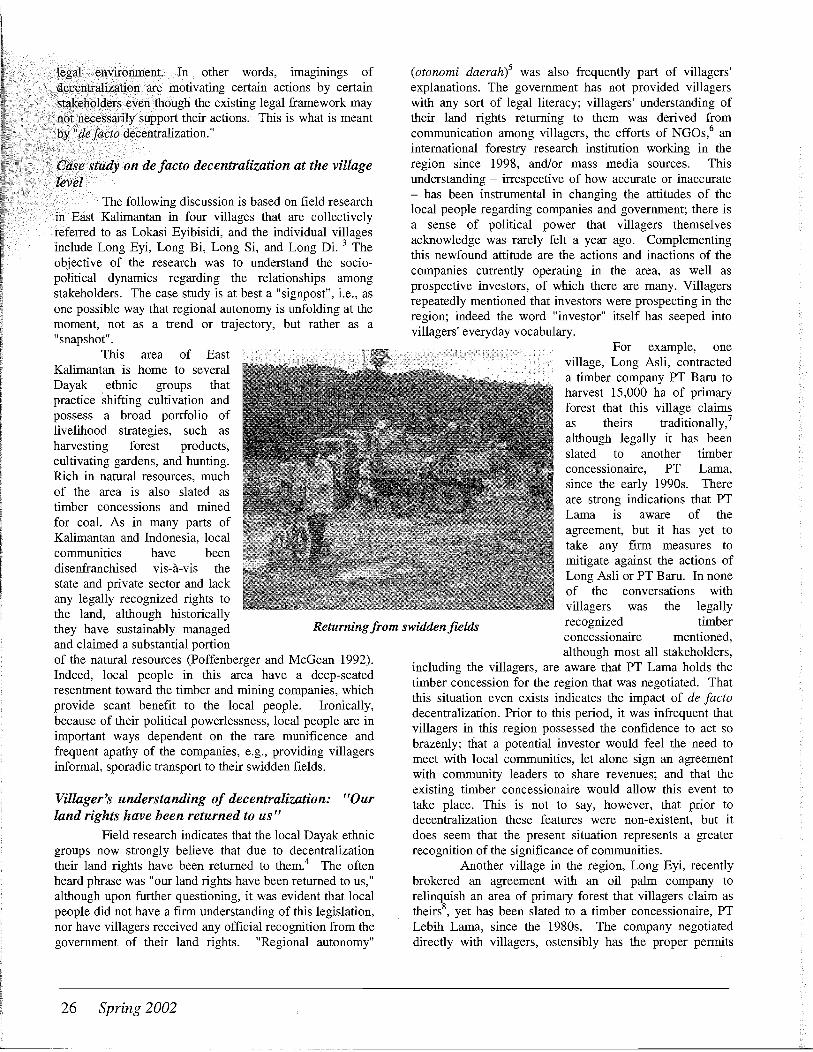
legal environment. In other words, imagmmgs of decentralization are motivating certain actions by certain stakeholders even though the existing legal framework may not necessarily support their actions: This is what is meant by "de facto decentralization."
Case study on de facto decentralization at the village level
The following discussion is based on field research in East Kalimantan in four villages that are collectively referred to as Lokasi Eyibisidi, and the individual villages include Long Eyi, Long Bi, Long Si, and Long Di. 3 The objective of the research was to understand the sociopolitical dynamics regarding the relationships among stakeholders. The case study is at best a "signpost", i.e., as one possible way that regional autonomy is unfolding at the moment, not as a trend or trajectory, but rather as a "snapshot" .
(otonomi daerah)5 was also frequently part of villagers' explanations. The government has not provided villagers with any sort of legal literacy; villagers' understanding of their land rights returning to them was derived from communication among villagers, the efforts of NGOs,6 an international forestry research institution working in the region since 1998, and/or mass media sources. This understanding - irrespective of how accurate or inaccurate - has been instrumental in changing the attitudes of the local people regarding companies and government; there is a sense of political power that villagers themselves acknowledge was rarely felt a year ago. Complementing this newfound attitude are the actions and inactions of the companies currently operating in the area, as well as prospective investors, of which there are many. Villagers repeatedly mentioned that investors were prospecting in the region; indeed the word "investor" itself has seeped into villagers' everyday vocabulary.
For example, one village, Long Asli, contracted a timber company PT Barn to harvest 15,000 ha of primary forest that this village claims as theirs traditionally,7 although legally it has been slated to another timber concessionaire, PT Lama, since the early 1990s. There are strong indications that PT Lama is aware of the agreement, but it has yet to take any firm measures to mitigate against the actions of Long Asli or PT Barn. In none of the conversations with villagers was the legally
This area of East Kalimantan is home to several DaYak ethnic groups that practice shifting cultivation and possess a broad portfolio of livelihood strategies, such as harvesting forest products, cultivating gardens, and hunting. Rich in natural resources, much of the area is also slated as timber concessions and mined for coal. As in many parts of Kalimantan and Indonesia, local communities have been disenfranchised vis-a.-vis the state and private sector and lack any legally recognized rights to the land, although historically they have sustainably managed and claimed a substantial portion
Returning from swidden fields recognized timber concessionaire mentioned,
of the natural resources (Poffenberger and McGean 1992). Indeed, local people in this area have a deep-seated resentment toward the timber and mining companies, which provide scant benefit to the local people. Ironically, because of their political powerlessness, local people are in important ways dependent on the Tare munificence and frequent apathy of the companies, e.g., providing villagers informal, sporadic transport to their swidden fields.
Villager's understanding of decentralization: land rights have been returned to us"
"Our
Field research indicates that the local Dayak ethnic groups now strongly believe that due to decentralization their land rights have been returned to them.4 The often heard phrase was "our land rights have been returned to us," although upon further questioning, it was evident that local people did not have a firm understanding of this legislation, nor have villagers received any official recognition from the government of their land rights. "Regional autonomy"
26 Spring 2002
although most all stakeholders, including the villagers, are aware that PT Lama holds the timber concession for the region that was negotiated. That this situation even exists indicates the impact of de facto decentralization. Prior to this period, it was infrequent that villagers in this region possessed the confidence to act so brazenly; that a potential investor would feel the need to meet with local communities, let alone sign an agreement with community leaders to share revenues; and that the existing timber concessionaire would allow this event to take place. This is not to say, however, that prior to decentralization these features were non-existent, but it does seem that the present situation represents a greater recognition of the significance of communities.
Another village in the region, Long Eyi, recently brokered an agreement with an oil palm company to relinquish an. area of primary forest that· villagers claim as theirs8
, yet has been slated to a timber concessionaire, PT Lebih Lama, since the 1980s. The company negotiated directly with villagers, ostensibly has the proper permits
from the government to operate there, and is presently building skid trails. In speaking with villagers about this oil palm company, the timber concessionaire never entered into conversations, and villagers' answers to questions regarding this timber concessionaire indicated that the company had not approached villagers about this situation.9 These examples indicate that villagers now perceive themselves as a significant enough political factor for the companies to consider them relevant to their operations. Both of these examples indicate a perceived increased bargaining power on the part of local communities. It must be noted that this is a perceived sense of political power and may not actually be the case. Indeed, there have been reports from other villages of threats from investors and sightings of surveyors who have not requested permission from villagers (Pers Comm. Wollenberg).
Increase in inter-village conflicts However, the new found sense of political power
among villagers has lead to a heightened sense of conflict both between and within villages, as well as the possibility of intra-village exploitation. For example, in the case of the oil palm company, the primary forest in question is actually claimed by all four villages collectively. While these four villages are adjacent to one another and to an outsider seem to constitute one location geographically, each village is dominated by a different Dayak ethnic group and are administratively independent of one another..
In the past, these four villages had mutually decided that the area in question would be a forest reserve that would be managed collectively, i.e., individual village boundaries within the forest were not delineated. Because Long Eyi has swiddens closest to the area of forest in question, the oil palm company negotiated with their community leaders, who. in return did not feel the need to inform the other three villages nor acknowledge to the company that the forest was shared by all four. Once confronted by the community leaders of the other three villages, a public meeting was held to resolve the issue. Long Eyi demanded that the only way to resolve the situation was to divide the forest reserve evenly among the four villages, such that each village could make its own decisions about how to utilize the forest. Long Bi, the village with the largest population (approximately 60% of the entire population of the four villages) vehemently disagreed to this and demanded to maintain the forest as a collective or divide the forest proportionally according to population. Each of the other two villages took opposing sides, and none of the four villages were willing to compromise their individual positions. All sides of this issue have rational and legitimate arguments to support individual viewpoints.
It also appears that although the oil palm company is aware of the conflict among the four villages, it is either unconcerned about this conflict or may be benefiting from the situation. The representative of the company, who now resides in Long Bi, only meets with community leaders of
Long Eyi and has not approached the community leaders of the other villages. It should be noted that prior to the decentralization laws, the relations between the various ethnic groups were not entirely positive, but this latest development with the oil palm company has sparked a heightened level of suspicion among the four villages.
Distance between community and their leaders: the lack of accountability
Suspicion and social jealousy within villages have increased as a consequence of these developments, i.e., many villagers feel that their community leaders are not representing the best interests of the community in negotiations with companies, but rather are acting in selfinterest. Indeed, prior to decentralization some villagers felt that the community leaders brokered their own deals with the mining and timber companies operating in the area at the cost of greater community interests. During the July 2000 field visit, this sense of village leaders' increasing self-interest was more frequently and strongly expressed by villagers. For example, since the mining company moved into the area in 1996 and destroyed the river that was a primary source of drinking water for the four villages, villagers of Lokasi Eyibisidi have demanded that the company build a piped water system sufficient enough to supply all four villages. After numerous promises and less than sincere implementation on the part of the company, in May 2000 the villagers renewed their demands for the water system, as well as daily transportation to their rice fields and a network of public lights and requisite generators, both of which had also been informally negotiated and promised in the past. These renewed and more vehement demands resulted in a written agreement between the mining company and the community leaders from the four villages signed by the Head of the Regency. The timing, intensity and legitimization of the communities' demands indicate that de facto decentralization, and the subsequent sense of political power that it imparts to local communities, played a significant role in the negotiations.
The written agreement, however, differs in significant ways from what was agreed upon verbally during a public meeting, viz., the timeline for the construction of the water system. During the public forum, the company acquiesced to a one-month deadline after the community refused the company's request for a three-month deadline. Upon arriving at the Regent's office, however, the company explained to the Regent and the community leaders that one-month was impossible; the community leaders agreed to provide a three-month deadline. The community leaders, however, did not publicly announce this to the villagers, and hence when one month passed, a substantial number of villagers were ready to protest. At this juncture, the community leaders explained to the villagers that the deadline was actually three months. It was this event and similar ones that triggered increased villager suspicion that their leaders and companies were colluding.
Tropical Resources: The Bulletin of the Yale Tropical Resources Institute 27
Whether community leaders are colluding with company is uncertain, yet that the high level of suspicion exists indicates that the fabric of the social relations between community leaders and their constituents is fraying (villagers themselves often informed me of this change in social relations). Although there are minor calls for responsibility, accountability and transparency by community members on the part of community leaders, the mechanisms for the implementation of these social institutions are not as yet in place and hence social attitudes are becoming more individualistic and self-interested.
Regional autonomy: opportunities for extraction companies
Furthermore, because of this sense of new found political power and the, at least, nominal acknowledgment of this by the actions of investors and existing companies, the lack of the villagers' legal literacy may have serious negative socio-economic and environmental consequences in the long-term (and perhaps short-term as well). The deals that have been brokered between the various companies and community leaders indicate the continued egregious exploitation of local people and the surrounding natural resources. For example, in the agreement with the oil palm company, Long Eyi will receive only a fraction of the market price for hardwoods to be harvested. Further, the community leaders of Long Eyi mentioned that the company would provide gardens for villagers in the area to plant coffee, candlenut and other garden crops. However, literature on the impact of oil palm on the livelihoods of small farmers belies these individuals' understanding of the benefits they will receive from the oil palm company (Casson 2000). Indeed many villagers, including the community leaders of Long Eyi, are aware of the deleterious consequences of oil palm for small farmers, yet the community leaders of this village seemed unconcerned. Several community leaders are well aware of the possibility that the oil palm company may only harvest timber and leave the region without planting. lO
Community leaders in Long Asli, who successfully sought out the timber company, signed an agreement without fully understanding one of the key terms of reference that transfers/delegates the authority over forest to the company (pelimpahan). One village leader who was absent during the signing of the contract knew the meaning of the term and what this term meant for community control over the forest in question. At the time of the field visit, he was attempting to convince other village leaders to renege on the agreement.
As a final example, in reviewing with a villager of Long Bi the signed agreement between the mining company and community leaders of Lokasi Eyibisidi regarding the water system, transport, and electricity, it was clear that his understanding of what was written in the contract and what I understood from the contract were quite different. The contract did not obligate the mining company to fulfill the demands of the communities in the same ways that the
28 Spring 2002
villagers themselves informed me of. When I raised this issue with this individual, he admitted that his understanding of written Indonesian was not very good and that he had a difficult time understanding what was written.
Conclusion
Through this case study, I have argued that the "micropolitics" of natural resource use in Lokasi Eyibisidi and the history that informs it indicate a more complex reality than expressed by community forestry advocates. Further, it points to challenges that community forestry advocates will need to address in the coming years.
I would, however, emphasize that the details of this case study are at best a "snapshot" of the consequences of de facto decentralization; it illustrates one possible direction of change of the socio-political and natural environments in the context of an ambiguous, transitional policy environment. Moreover, it is not the intention of this case study to represent local communities as politically powerful exploiters. At best, the present situation in this area of East Kalimantan shows that the repertoire of the "weapons of the weak" (Scott 1985) has, at least momentarily, broadened.
The effects of de facto decentralization on local communities are not entirely positive: This case study has shown that although de facto decentralization has seemingly provided opportunities to commurutles, companies have also received opportunities during this transition period. Furthermore, because of the historical disparity in political power between villagers and companies, there is a strong possibility that regional autonomy will benefit companies and local elite more than the local communities they ostensibly represent if the legislation on regional autonomy is not fully clarified to local people, e.g. the rights and obligations of social actors regarding the management of natural resources.
Moreover, even if the regional autonomy legislation is sufficiently clarified, certain basic issues in the decentralization process require attention to ensure increased equity, efficiency, participation and government responsiveness, all of which are often promised in decentralization initiatives, but rarely occur (Argawal and Ribot 1999), as this case study indicates. Agrawal and Ribot's (1999) analysis of decentralization of natural resources to local people in Africa and South Asia points to the centrality of downward accountability of local decision makers to their constituents. Although electoral processes
. are important to operationalize downward accountability, they also list the following as mechanisms: "procedures for recall; referenda; legal recourse through courts; thirdparty monitoring by media, NGOs, or independently elected controllers; auditing and evaluation; political pressures and lobbying by associations and associative movements; provision of information on roles and obligations of government by the media and NGOs; public reporting requirements of governments; education; embeddeness of
t;by

leaders in their community; belief systems of leaders and their communities; civic education and pride of leaders; performance awards; widespread participation; social movements; threats of social unrest and resistance; central state oversight of local government; and taxation" (Agrawal and Ribot 1999: 478-479).
Without mechanisms for downward accountability, decentralization in Indonesia is unlikely to achieve its ostensible goal. Further, given the history of centralized state control of forest resources in Indonesia and other countries, the move toward effective decentralization will require attention away from conceptualizing "communities as territorially fIxed, small and homogenous," which has been the focus of communitybased natural resource management advocates (Agrawal and Gibson 1999: 636). Instead, focus needs to be placed on the diverse interests of the multiple actors that constitute a community, the ways in which these actors influence decision-making, and the institutions11 that structure decision-making processes (Agrawal and Gibson 1999).
Acknowledgments
The research that informs this essay was conducted in collaboration with the Center for International Forestry Research (CIFOR) from June-September 1999, July 2000 and June-September 2001. The fIeldwork for the case study was carried out in a region of East Kalimantan, a long-term CIFOR research site. I thank Lini Wollenberg for comments on an earlier draft and her unfailing encouragement. I also thank CIFOR fIeld staff, specifIcally, Njau Anau, Asung Uluk, Made Sudana, Godwin Limberg, Tony Djogo and Moira Moeliono, for sharing their insights on and facilitating my understanding of the socio-political dynamics of this region. I am indebted to the villagers of Lokasi Eyibisidi for their hospitality, unending patience with my questions, and willingness to allow me to participate in their lives. CIFOR not only made my research in this region possible, but also provided me with full logistical support. I received generous fInancial support for the research from the Yale Council on Southeast Asian Studies, the Charles Kao Fund, the Program in Agrarian Studies, the Tropical Resources Institute, and the Yale Center for International and Area Studies. I claim full responsibility for any shortcomings and omissions.
Endnotes
1 An earlier draft of this article appeared in the Asia-PacifIc Community Forestry Newsletter, volume 12, no. 2. 2 One key implementing regulation under Law No. 22 was approved in May 2000, i.e., PP No. 25/2000 regarding Governmental Authority and Authority of a Province as an Autonomous Region. 3 Data for this article is drawn primarily from fIeldwork conducted in July 2000, with other periods of fIeldwork
(June- September 1999 and June-September 2001) also informing this analysis. Lokasi Eyibisidi is located within a region that is a long-term research site of Center for International Forestry Research. All names of villages and companies used in this essay are pseudonyms. 4 This may also be due to villagers' nascent awareness of other government regulations such as Regulation from the Minister of Agrarian Affairs/Head of the Bureau of Lands No. 5/1999 Guidelines to Resolve Adat (Customary) Communal Rights Conflicts, in which the National Land Agency will accept the registration of Adat lands and treat them as a communal and non-transferable right. Villagers in Lokasi Eyibisidi never specifIcally mentioned this government regulation and none had their lands registered. Leaders in other villages, however, are aware of the possibility and are attempting to register land as customary. 5 This Indonesian term is used nationally as a synonym for decentralization (desentralisasi). 6 A national NGO has worked in the area for the last year, and its work could be considered as inciting local people. 7 The Dayak ethnic group in this village is well recognized as the original inhabitants of the region, their history spanning many generations. 8 Prior to the arrival of the oil palm company, the four villages as a collective claimed this region of forest. See following discussion. 9 This is not to imply that the timber concessionaire is unaware of the situation or that the concessionaire has not approached the government or oil palm company. 10 Since the time of this fIeld study, CIFOR has organized cross visits for villagers to an area of East Kalimantan that has undergone oil palm development so that villagers in this area can see fIrst hand the effects of oil palm and better understand their rights (Pers Comm, Wollenberg) 11 "Institutions" are defIned as "sets of formal and informal rules and norms that shape interactions of humans with others and nature" (Agrawal and Gibson 1999: 637).
References
Agrawal, A. and C. Gibson. 1999. Enchantment and Disenchantment: The Role of Community in Natural Resource Conservation. World Development 27(4): 629-649.
Agrawal, A. and J. Ribot. 1999. Accountability in Decentralization: A Framework with South Asian and West African Cases. Journal of Developing Areas 33: 473-502.
Barber, c., N. C. Johnson, E. HafIld. 1994. Breaking Through the Logjam: Obstacles to Forest Policy Reform in Indonesia and the United States. Washington DC: W orId Resources Institute.
Tropical Resources: The Bulletin of the Yale Tropical Resources Institute 29

l_
Casson, A. 2000. The Hesitant Boom: Indonesia's Oil Palm Sub-Sector in an Era of Economic Crisis and Political Change. CIFOR. Jakarta, Indonesia.
Dove, M. 1993. A revisionist view of tropical deforestation and development. Environmental Conservation 20(1): 17-24. Down to Earth. 2000. Special Issue on regional autonomy, communities and natural resources. Newsletter No. 46.
MFEC. 2000. Institutional Task Force for Forestry Sector Decentralization. December 1999-February 2000. Ministry of Forestry and Estate Crops. Jakarta, Indonesia.
Natural Resources Management Program (NRM). 2000. NRM News. Volume 1, Number 1. Natural Resources Management Program. Jakarta, Indonesia
Personal Communication with Dr. Lini Wollenberg (October 2000). Poffenberger, M. and B. McGean (eds.) 1992. Communities and Forest Management in East Kalimantan: Pathway to Environmental Stability. University of California, Berkeley. Berkeley, USA.
Scott, James. 1985. Weapons of the Weak: Everyday Forms of Peasant Resistance. Yale University Press. New Haven, USA.
Sembiring, Sulaiman et al. 1999. Kajian Hukum dan Kebijakan Pengelolaan Kawasan Konservasi di Indonesia: Menuju Pengembangan Desentralisasi dan Peningkatan Peranserta Masyarakat. Natural Resources Management Program. Jakarta, Indonesia.
Fuelwood Consumption, Woodland Regeneration and Forest Management: A Case Study in Rural Mali, West Africa
Jeffery A. Morton, MEM 2001
Introduction
Deforestation, encroaching savannas and fuelwood consumption
Many hold the belief that the natural vegetation type of the Sudanian zone and much of sub-Saharan West Africa is a closed, dry tropical forest (Salzmann 2000, Fairhead and Leach 1996, White 1983). One author describes how closed forest once extended far into the subSaharan interior of West Africa. She concludes by stating that the current system, which is capable of supporting only woodland, is the result of human impacts (Steentofi 1988).
Although this theory dates back to the onset of African colonization (Fairhead and Leach 1996), the most prevalent body of English literature documenting deforestation and a fuelwood crisis first appears in the 1960's and 1970's. In 1975, one non-profit organization dedicated to focusing "attention on global problems" published a paper alerting the world to fuelwood consumption induced desertification. It identified the "ecologically disastrous spread of treeless landscapes" and asserted that deforestation associated with fuelwood collection was the major culprit (Eckholm 1975).
A consistent focus for many aid agencies, fuelwood issues in sub-Saharan West Africa have garnered considerable financial support. In 1986, the World Bank and the United Nations Development Program (UNDP) cofunded a study to remotely sense the continent of Africa to develop a fuelwood energy plan (Millington et aL 1992). A report in 1986 by mCN stated in direct reference to Mali that " ... destruction of woodland cover for firewood has led to serious erosion and desertification" (FAa 2001). More recently, a consultant to the United Nations highlighted the importance of forests in Mali given the "desertification and lack of fuelwood ... essential for the survival of more than 80 percent of the population of the country" (Maiga 1999).
A consultant for the World Bank recommended in the late 1980s that research in sub-Saharan West Africa should concentrate on fast growing, drought-resistant tree and shrub species to address concerns about future fuelwood supplies (De Troyer 1986). CARE, a nongovernmental development agency, focused on projects addressing the 'fight against desertification'. Falling within this category are problems of fuelwood availability, largely in the drier regions of northern Mali (Sumberg and Burke 1991).
Much attention has been given to the issue of fuel wood demand. Meeting the demand has traditionally been linked with deforestation and savannization. Recently,
however, dissension regarding the validity of such a causal relationship has surfaced.
Need for reevaluation New data and recent publications have come to
question the theory of fuelwood driven savannization. In an aforementioned study funded by World BanklUNDP, researchers found that "(t)here is little evidence to suggest that the incursion of savanna vegetation into forested areas is a consequence of fuel wood collection alone" (Millington et al. 1992).
One study in the Sudanian zone of northeastern Nigeria found indications that the transition to the present day savanna vegetation is the result of climatic changes and natural fires and not anthropogenic activities and impacts. Jesse Ribot (1999), in addressing the issue of urban fuelwood consumption, asserts that regeneration studies do not support claims of permanent deforestation. Nor does data support any theory that fuelwood supplies would be insufficient to meet demand in the near future. In Malawi, Abbot and Homewood (1999) found fuelwood consumption to be less than half of available deadwood biomass. A study in Senegal reported that local inhabitants did not consider fuelwood a scarce resource (Lykke 2000). This was also true of local populations in northern Ghana (BrookmanAmissah et al. 1980).
Fairhead and Leach (1995, 1996) studied a site in the Sudanian zone of northern Guinea where they found evidence to outright contradict the classical fuel wood crisis theory. Here, they concluded that the impact of local populations on woodlands in the area was, in fact, positive. Forest islands surrounding villages were not relics of a former forest, as the deforestation scenario would assume. The forest islands were planted and maintained by village populations. Locals actually created closed dry forest islands out of what was once exclusively bush savanna, rather than vice versa.
The Study
This study addresses the theory that population growth at the village level has increased pressure on natural resources, especially for fuelwood. It also addresses the question of whether fuel wood consumption has resulted in deforestation and an associated ecosystem shift from forest to derived savanna.
Tropical Resources: The Bulletin of the Yale Tropical Resources Institute 31

The Study Site
The study site is a small, rural village, Dafela, in Mali, West Africa supporting a population of 986 individuals. Geographically, the village is located approximately 10 kilometers southeast of the city of Kita, 13.03 degrees north latitude and 9.29 degrees west longitude. Ecologically, it is best categorized as a Sudanian woodland savanna. In Dafela, there are three recognized seasons: the rainy season from mid-June through October, the cold season from November through January, and the hot season from February until the first rains. The cold and hot seasons combined, about 7 months, comprise the dry season. Average annual precipitation over the last five years is 997 mm.
The forest structure is generally one of open woodland, where woodlands are considered to have a canopy cover of 40% by area. There are tall trees exceeding 8 meters in height, but the canopy is not closed. Categorizing the forest structure across the whole of the landscape, however, is difficult to do. Areas of fallow are intermingled with plots that are too rocky to farm and have different ground and upperstory structures. Microsite variation and the presence of at least one 'reserve', a plot reported to never have been farmed, add to the landscape's heterogeneity .
Methodology
Fuelwood consumption Observations were made for two non-consecutive
weeks within four households. Data collection was modeled after Abbot and Homewood (1999). Weight measurements were conducted with a hanging scale graduated to one ounce.
Women are the primary consumers of fuelwood. Every household includes several women of cooking and water-heating age, and each is responsible for her own woodpile. Each woodpile was weighed at the beginning of the monitoring period. Throughout the week, additions to the pile were noted. At the end of the week, residual wood was weighed and subtracted from the running total weight. The difference is the fuelwood used by each woman. The sum of these figures is the weekly consumption total for the household.
Forest regeneration Two hectares of a fallow plot, Inventory Plot A, were
identified and demarcated. Time elapsed since last clearing was known to be five years. A systematic grid design (Avery and Burkhart 1994) was established within the fallow. Twenty foci were situated in the plot at intervals of 33:33 meters from north to south and 40 meters from east to west. The area within a radius of 5.64 meters from each focus point was then inventoried, creating an area of 100 m2
for each sub-plot. The total area inventoried of the 2
32 Spring 2002
hectares (40,000 m2) was 2000 m2
, thus establishing a 5% sample.
Trees included in the inventory were those with diameter at breast height (DBH) greater than 1.78 cm and height greater than 1.5 m. Relevant measurements taken include DBH, total tree height, taper of main stem and tree species. For trees whose heights could not be measured using a graduated staff, a clinometer was used. The volume of the stem was calculated assuming a conical shape of the bole and using breast height as the base of the cone. This method actually underestimates the volume by discounting the area of the bole from its base to DBH. Tree volume estimates were multiplied by an average wood density measure to calculate an estimate weight of the plot in kilograms.
The average dry wood density was calculated in the following manner. Three specimens of each of the three most recurrent fuelwood species in the inventory plot were felled. These were Terminalia macroptera, Cassia sieberiana and Combretum glutinosum. The trees were then sectioned and weighed in the field (wet weights).
Cross sections (cookies) from the main stem at breast height were also taken from each of the nine trees. The volume of the cookies was estimated by treating each as a cylinder. The cookies were brought back to the lab and dried for two weeks at 85° Celsius. The average of the nine dry weight densities is .6221 g cc·!.
Species composition Species identification was accomplished via a
combination of sources. Most were identified by obtaining local names of individuals from Dafelans and matching them with scientific names listed in either von Maydell (1983) or Fairhead and Leach (1996). Other species were identified by using the von Maydell work as a field key or with the help of local forestry agents.
Forest structure and field trees During the course of the study, the existence of a
'reserve' was called to the attention of the author. The reserve is a plot of undefined area but within the range of 2-6 hectares. It is said to have never been farmed and is the holding of one family. Although whether or not it has actually ever been farmed is difficult to establish, one can safely assume that the forest plot has remained out of cultivation for at least 80 years, or roughly the lifetime of the oldest members of the village.
The reserve was inventoried in an attempt to determine if field trees, or trees that had survived the last clearing of Inventory Plot A, were spaced in a way that might mimic an uncultivated site. A replica of the Plot A inventory design was established within the reserve, Inventory Plot B. The species and canopy classification (dominant, D; co-dominant, C; or intermediate, I) of all individuals of canopy stature that fell within sub-plots were noted. The same canopy classifications were applied to individuals encountered in sub-plots of Inventory Plot A.
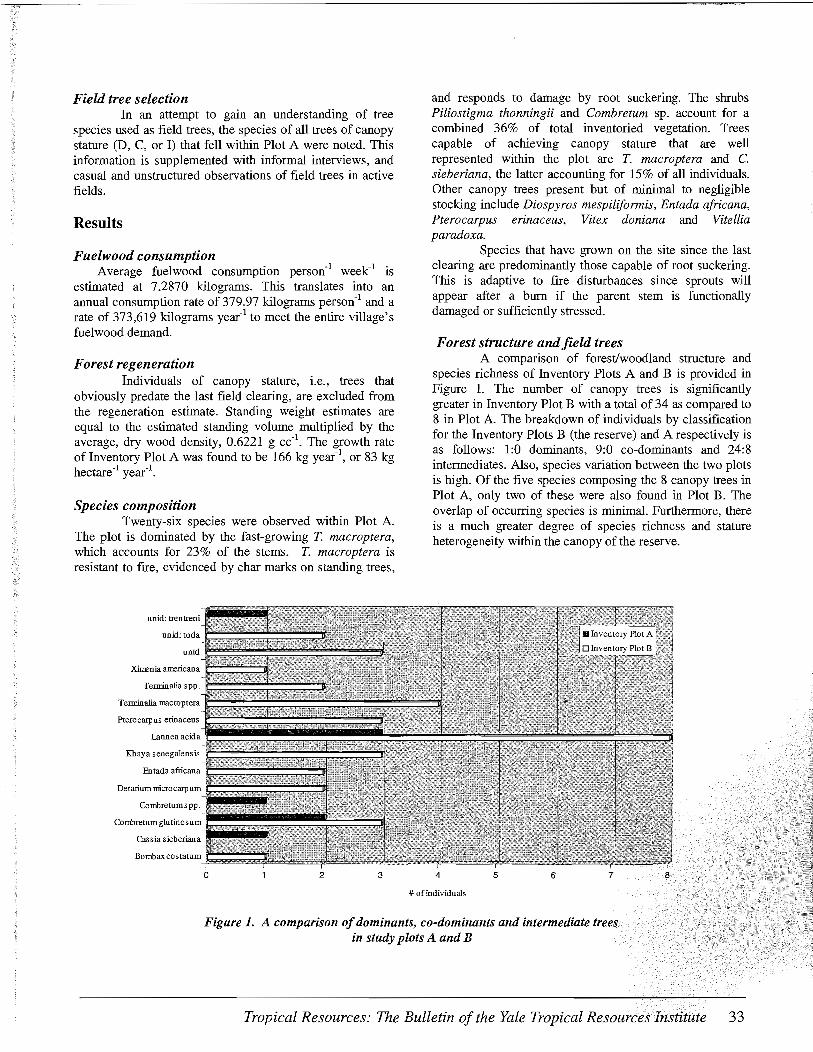
Field tree selection In an attempt to gain an understanding of tree
species used as field trees, the species of all trees of canopy stature (D, C, or I) that fell within Plot A were noted. This information is supplemented with informal interviews, and casual and unstructured observations of field trees in active fields.
Results
Fuelwood consumption Average fuelwood consumption person·! week-! is
estimated at 7.2870 kilograms. This translates into an annual consumption rate of 379.97 kilograms person·! and a rate of 373,619 kilograms year·! to meet the entire village's fuelwood demand.
Forest regeneration Individuals of canopy stature, i.e., trees that
obviously predate the last field clearing, are excluded from the regeneration estimate. Standing weight estimates are equal to the estimated standing volume multiplied by the average, dry wood density, 0.6221 g cc-!. The growth rate of Inventory Plot A was found to be 166 kg year-!, or 83 kg hectare-! year-I.
Species composition Twenty-six species were observed within Plot A.
The plot is dominated by the fast-growing T. macroptera, which accounts for 23% of the stems. T. macroptera is resistant to flTe, evidenced by char marks on standing trees,
unid: toda C:::::::::::::::;::::::::;:::;:;:; unid ~,,;,;,.;; ........
XiIrenia americana
Terrninalia spp.
and responds to damage by root suckering. The shrubs Piliostigma thonningii and Combretum sp. account for a combined 36% of total inventoried vegetation. Trees capable of achieving canopy stature that are well represented within the plot are T. macroptera and C. sieberiana, the latter accounting for 15% of all individuals. Other canopy trees present but of minimal to negligible stocking include Diospyros mespiliformis, Entada africana, Pterocarpus erinaceus, Vitex doniana and Vitellia paradoxa.
Species that have grown on the site since the last clearing are predominantly those capable of root suckering. This is adaptive to fire disturbances since sprouts will appear after a burn if the parent stem is functionally damaged or sufficiently stressed.
Forest structure and field trees A comparison of forest/woodland structure and
species richness of Inventory Plots A and B is provided in Figure 1. The number of canopy trees is significantly greater in Inventory Plot B with a total of 34 as compared to 8 in Plot A. The breakdown of individuals by classification for the Inventory Plots B (the reserve) and A respectively is as follows: 1:0 dominants, 9:0 co-dominants and 24:8 intermediates. Also, species variation between the two plots is high. Of the five species composing the 8 canopy trees in Plot A, only two of these were also found in Plot B. The overlap of occurring species is minimal. Furthermore, there is a much greater degree of species richness and stature heterogeneity within the canopy of the reserve.
TerrninaliamacroPtera~I~~~;~I;~~~;~~~~j]~~~ Pterocarpus erinaceus
Lannea acida
Entada afiicaua
Detarium microcarpum
Combretumspp.
COmbretumglutinosum
Cassia sieberiana
Bombaxcostatum
o 2 3 4 5 6 7
# of individuals
Figure 1. A comparison of dominants, co-dominants and intermediate trees in study plots A and B
8
Tropical Resources: The Bulletin of the Yale Tropical Resources Institute 33
Field tree selection The field tree inventory in Plot A differs from the
forest structure comparison in that it accounts for canopy trees found anywhere within the two-hectare fallow, and not simply within sub-plots. By far, the most recurring species is Vitellia paradoxa, representing one-third of all canopy trees. Lannea acida and Terminalia macroptera are the second most prevalent species, each composing approximately 11 % of all canopy trees.
In a peanut field adjacent to Inventory Plot A, ten Vitellia paradoxa and one unidentified individual, locally called dogoda, constitute all field trees. A survey of 97 trees within another field yielded: V. paradoxa, 41; Lannea acida, 15; Parkia biglobosa, 14; T. macroptera, 9; Pterocarpus erinaceus, 3; eleven other species, 13. Again, V. paradoxa is clearly the dominant presence; it represents 42% of all field trees. The next most frequent species lag far behind with L. acida at 15% and the nere tree, P. biglobosa, composing approximately 14%.
Some villagers were asked about field tree selections in unstructured interviews. One woman said that species used as field trees included P. Biglobosa, V. paradoxa, T. macroptera, P. erinaceus, and V. doniana. A man reported that V. paradoxa was the only species he chose to leave in a field. He observed that this species did not severely affect the production of crops, in this case millet, growing immediately adjacent to and underneath it. He conceded that the presence of any tree within a field did promote growth in field crops. Unfortunately, most species encourage prolific height growth but negatively impacted the development of the valued part of the plant, the grain. V. paradoxa, he noted, was an exception to this.
Yet another woman listed V. paradoxa, P. biglobosa, Lannea sp. and K. senegalensis as species left in fields. K. senegalensis, she noted, is only to be left if it is too big to cut. Other trees are left simply if "it pleases them." Minimally, this could refer to their size and therefore ability to shade or their location within the field. All implications of the statement, however, are not fully understood.
Discussion
With a consumption rate of 379.97 kilograms person- l year- l and a regeneration rate of 83 kg hectare- l
year-\ each person needs access to about 4.5 hectares of fallow land to meet their annual fuel wood needs.
At this site, the theory that fuel wood consumption has led to deforestation is invalid. All women observed during the course of the study plainly stated that they do not fell live trees as a source for fuelwood. Field observations revealed that they instead break off dead limbs and fell snags. This fuelwood collection technique is corroborated to some degree by Abbot and Homewood (1999) and explicitly by Fairhead and Leach (1996). In Dafela, deforestation due to a rural, fuelwood-based energy demand is not occurring.
34 Spring 2002
Fuelwood consumption The current study estimates average fuelwood
consumption in Dafela to be 7.2870 kg person- l week-I. This seems reasonable given rates observed and cited in the Abbot and Homewood study (1999). In it, the authors used primary data to estimate fuelwood consumption at 10.1 kg capita- l week-I. The study occurred in miombo woodlands, which are similar in floristic composition to those encountered in Dafela (Salzmann 2000). Two other studies Abbot and Homewood cite observed consumption rates of 6.8 kg capita- l week- l and 13 kg capita- l week-I.
In terms of its impact upon woody vegetation, fuelwood collection by rural populations of the current study site does not induce deforestation. Live trees are not felled for fuelwood. The reasons for this are numerous. First, fuel wood is generally collected from fallow lands. Women responsible for fuelwood collection recognize that the felling of live trees within a fallow will negatively impact the quality of the plot and diminish its future value as an agricultural field. The negative effects associated with the clearing of trees, which include nutrient depletion, soil erosion and increased solar radiation at the woodland floor, far outweigh the utility of fuelwood.
Second, living trees are not harvested for fuelwood because live trees are difficult to fell and their wood is not ready to burn when freshly cut. It must be dried before it is readily combustible. Dead branches and snags can be much more easily harvested and are combustible at the time of collection. When ample dead wood biomass is present, there is simply no logic in harvesting live trees.
Although fuelwood is not perceived as scarce and fuelwood collection does not result in deforestation, the collection practices of Dafela are not completely without consequence. The collection of dead, woody biomass for fuelwood does remove nutrients from the system. Archibold (1995) cites that the "quantity of nutrients stored in the above-ground biomass accounts for the greatest proportion of the nutrient capital in savanna vegetation." In this way, fuelwood collection methods are detrimental to the system To what degree the woodland is affected and whether or not it is affected at all in terms of vegetation growth or species composition, however, is beyond the scope of this study.
Forest regeneration Given wood densities similar to those calculated in
the present study, estimates of fuelwood supplies in wooded savannas and wooded savanna fallows range from 497.68 kg ha- l year- l to 746.52 kg ha- l year-I, and from 311.05 kg ha- l year- l to 1244.2 kg ha- l year-\ respectively (Montalembert and Clement 1983).
Given similar wood densities, regeneration rates of a "natural forest in a coppice exploitation" in Burkina Faso were as follows: 379.48 kg ha- l year- l in a Sudano-Sahelian zone, 497.68 kg ha-l year-1 and 646.98 kg ha-1 year-l in two sites in the Northern Sudanian zone and 578.55 kg ha-1
year- l at one site in the Southern Sudanian zone (Renes 1991). Species similarities between Inventory Plot A and the Burkina Faso sites are strongest with the Sudano-

Sahelian site and the fIrst of the two Northern Sudanian sites.
These numbers differ considerably from the regeneration growth rate of 83 kg ha- l year- l calculated in this study. Given that only main stem wood was included in the rate, the author is much more inclined to accept the rates of the cited studies as an accurate fIgure for above-ground, woody growth. If even the most conservative growth rate from the cited literature of 311.05 kg ha- l year- l is applicable to the study site's woodlands, the annual fuelwood demand of one person, 379.97 kilograms person- l
year-\ could be met by about 1.2 hectares.
Species composition At a site similar in floristic compOSItIOn to the
current study site, single stem, slower growing tree species capable of achieving canopy dominant heights evinced poor regeneration. Species with the strongest regeneration were generally fIre resistant, capable of vegetative sprouting and/or shrubs. Within this species category, Combretum nigricans, C. glutinosum, T. macroptera and Acacia macrostachya account for one half (Lykke 1998). The author's conclusion, supported by local perceptions, is that the system is currently undergoing a shift in vegetative composition, favoring shrubby species.
Many of the same dynamics and system attributes described in the Lykke study are present at this study site. The results of the inventory have revealed a woodland of shrubby species almost identical to the one in Senegal. Although overall woody volume does not appear to be of concern or a problem in the area, there are signs that the species' composition of the woodlands is shifting. Three species in the area, Khaya senegalensis, Afzelia africana, and dogoda are considered threatened by the national forest service and are protected by law. All three are forest species capable of attaining dominant statures, and all are reportedly slow growing. The carpenter of Dafela asserts that they are all infrequently found.
If a shift in species composition is occurring in and around Dafela, looking at potential sources of regeneration is important. Four land uses presently serve as seed sources for forest tree species: sacred groves, uncultivable rocky outcroppings, reserves, and agricultural land supporting fIeld trees.
Sacred groves are religious or historically signifIcant sites; they are protected but are generally small plots. Rocky outcroppings are considered unsuitable for cultivation, but they do support tree growth and are actively used as sources of fuel wood. The identifIed reserve is at least 2 hectares large and evinces several canopy strata. As noted, it is home to several forest tree species not observed in Inventory Plot A, the fallow. Finally, fIeld trees provide seed for adjacent lands. A few species are kept as fIeld trees because of specifIc traits, such as V. paradoxa, maintained for its importance as a cooking oil source. If, however, the only other criteria for leaving a tree in a fIeld is that it is too large to merit clearing, slower growing species will be
markedly disadvantaged, especially given a typical, 5 year cultivationl7 year fallow cycle.
Future Research
Urban fuelwood consumption This study did not look at urban fuelwood supply
or consumption; it focused solely on rural collection and consumption. Whether urban consumption is related to deforestation is contentious, and knowledge of the urban fuelwood market is lacking. SpecifIc areas to explore include the collection methodologies of urban fuelwood suppliers, the mechanisms that bring this good to market and regional prices charged.
Land use Wood volume does not appear to be a problem in
Dafela. This is not, however, to say that there should be no concern for the woody vegetation in the area. Trees are felled to create agricultural fIelds. Fairhead and Leach (1996) note that fuelwood is a by-product of agriculture. Some of the woody biomass cleared during agricultural fIeld preparation is used as fuelwood, but energy is not the motivation for clearings. To gain a better understanding of the present status of forests and possible future trends, a better base of knowledge regarding land use should be constructed.
Five identifIed land uses are: sacred groves, uncultivable rocky outcroppings, cultivable land set aside in reserve, agricultural fallow and active agricultural fIelds. To better develop resource management plans, a more comprehensive understanding of the prevalence and nature of these land uses is necessary. At minimum, this requires boundary-walks of villages and associated lands supplemented by personal interviews with villagers. At best, remote sensing and aerial photographs could supply wonderfully useful information. Once a general idea of how much area is proportionally claimed by each land use, specifIc attributes of some of the land uses should be more closely examined. Sacred groves should be largely exempted from such a study for obvious reasons.
Insofar as reserves are concerned, much can be learned. SpecifIcs regarding the degree of management should be determined. This will help clarify its provenance: does it represent natural regeneration or enrichment plantings; is it' protected from fIre; etc. A more comprehensive inventory of the reserve and other land uses should also be executed to determine the stocking levels of individual species.
Field trees Field trees are a seed source for large, single
stemmed forest tree species. The species composition and selection process of fIeld trees should be studied in greater depth. A broader inventory will give a clearer picture of farmer preferences. Species found in fIelds can also be compared to those found in fallow and other land use
Tropical Resources: The Bulletin of the Yale Tropical Resources Institute 35

inventories to determine their overall presence. This information should be complemented by a structured, wider-ranged interview process with the objective of determining how individuals choose which trees will remain in their fields.
Focusing on individual species In Senegal it is indicated that certain, slower
growing species may be declining and in danger of disappearing from certain systems (Lykke 1998). The general species composition trend reflects a shift from highly valued tree species to lesser-valued shrubby species (Lykke 2000). Indications are that there may be the same transition occurring around Dafe1a. To determine if this is the case, the following suggestions are made for future study regarding floristic composition.
1. Local populations should be asked if they have noticed a change in their forests.
2. Inquiries should be made into tree species with valued characteristics, primary or secondary.
3. Locals should be asked if there is any trend in the presence of valued species.
4. If a change is perceived, locals should be asked why they feel that change is taking place.
5. If the species is declining, informants should be asked if they feel that there is a danger of that species vanishing entirely from the site.
6. If local extinction is considered possible, respondents should be asked what substitute, if any, they will use to compensate for the valued characteristics lost.
This line of questioning is certainly not exhaustive, but it should serve as a baseline to establish local perceptions and awareness of species composition change.
Final Thoughts
Neither fuelwood supply nor wood volume seem to be scarce in Dafe1a. It does appear, however, that much of the land surrounding the village is either currently in use as an agricultural field or is in fallow. If this is the case, field trees represent an important seed source for forest tree species. For this reason, it is necessary to determine field tree selection criteria and to evaluate species presence across land uses. Potentially threatened species, especially those that are valued by local people for unique attributes, can then be targeted by conservation efforts.
Acknowledgements
I would like to thank my academic advisors; Dr. Mark S. Ashton, Dr. Thomas G. Siccama, and James Bryan; and my in country collaborators; M. Jean Dakou and M. Oumar Cisse of the US Peace Corps, Mali and Daouda Sidibe and the entire village of Dafela. I also acknowledge the generous contributions from the Tropical Resources
36 Spring 2002
Institute and the Leonard G. Carpenter Fund at the Yale School of Forestry & Environmental Studies; and the Lindsay Fellowship for Research in Africa at the Council on African Studies of the Yale Center for International and Area Studies.
References
Abbot, J. and K. Homewood. 1999. A history of change: causes of miombo woodland decline in a protected area in Malawi. Journal of Applied Ecology 36: 422-433.
Archibold, O.W. 1995. Ecology of World Vegetation. London: Chapman and HalL
Avery, T.E. and H.E. Burkhart. 1994. Forest Measurements, 4th ed. New York: McGraw Hill Inc.
Brookman-Amissah, J., J.B. Hall, M.D. Swaine, and J.Y. Attakorah. 1980. A Re-Assessment of a Fire Protection Experiment in North-Eastern Ghana Savanna. Journal of Applied Ecology 17: 85-99.
De Troyer, C. 1986. Desertification Control in the Sudanian and Sahelian Zones of West Africa - Better Management of the Renewable Resource Base. Forest Ecology and Management 16: 233-241.
Eckholm, E. 1975. The Other Energy Crisis: Firewood. Worldwatch Paper 1. Washington, D.C.: Worldwatch Institute.
Fairhead J. and M. Leach. 1995. False Forest History, Complicit Social Analysis: Rethinking Some West African Environmental Narratives. World Development 23 (6): 1023-1035.
Fairhead, J. and M. Leach. 1996. Misreading the African Landscape. Cambridge: Cambridge University Press.
Food and Agriculture Organization website. 2001. United Nations. http://www.fao.orglforestry.
Lykke, A. M. 1998. Assessment of species composition change in savanna vegetation by means of woody plants' size class distributions and local information. Biodiversity and Conservation 7: 1261-1275.
Lykke, A. M. 2000. Local perceptions of vegetation change and priorities for conservation of woody-savanna vegetation in SenegaL Journal of Environmental Management 59: 107-120.
Maiga, A. 1999. Ressources forestieres naturelles et plantations, Cas du Mali. CE-FAO Programme Partenariat (1998-2000) Projet GCP!lNT/6791EC.

~--------- ----------~-------------------------------------------------------------------------------------
Millington, A. c., P.J. Styles, R.W. Critchley. 1992. Mapping forests and savannas in sub-Saharan Africa from advanced very high resolution radiometer (A VHRR) imagery. In Nature and Dynamics of Forest-Savanna Boundaries, edited by Furley et aL London: Chapman and HalL
Montalembert, M.R. and J. Clement. 1983. Fuelwood Supplies in the Developing Countries. Rome: Food and Agriculture Organization of the United Nations.
Renes, G. J. B. 1991. Regeneration capacity and productivity of natural forest in Burkina Faso. Forest Ecology and Management 41: 291-308.
Ribot, J. 1999. A history of fear: imagining deforestation in the West African dryland forests. Global Ecology and Biogeography 8: 291-300.
Salzmann, U. 2000. Are modem savannas degraded forests?-A Holocene pollen record from the Sudanian vegetation zone of NE Nigeria. Vegetation History and Archaeobotany 9: 1-15.
Steentoft, M. 1988. Flowering Plants in West Africa. Cambridge: Cambridge University Press.
Sumberg, J. and M. Burke. 1991. People, trees and projects: a review of CARE's activities in West Africa. Agroforestry Systems 15: 65-78.
von Maydell, H.J. 1983. Arbres et Arbustes du Sahel: Leurs caracteristiques et leurs utilisations. Deutsche Gessellschaft fiir Technische Zusammenarbeit.
White, F. 1983. The Vegetation of Africa. Paris: United Nations Educational, Scientific and Cultural Organization.
Tropical Resources: The Bulletin of the Yale Tropical Resources Institute 37

On the Margins of Forest and Market: A Case Study of Medicinal Use in Four Communities
Near Sinharaja, a Sri Lankan Rainforest
Kristen Ohlson, MESc 2001 and Uromi Goodale, PhD Candidate
Introduction
Along with the majority of rural households in Sri Lanka (78 %), community members living on the periphery of Sinharaja rain forest have historically practiced "indigenous" or "traditional" medicine (Bandar and Mahatantila 1996). In Sri Lanka, traditional medicine refers to an intricate system of healing that draws from two sources: Sinhala Vedakama, the earliest known health care system recorded in Sri Lanka, and Ayurveda, a system introduced over three thousand years ago from northern India (Uragoda 1987). Throughout the island, practitioners of traditional medicine utilize a wide range of plant elements as principal ingredients with which to formulate mixtures, oils, balms, compresses, and other remedies. The diversity of species used for these treatments gives insight into the complexity of this health care system: out of the 3150 plant species recorded in Sri Lanka, over 500 are used in traditional medicine, of which 248 are used commonly (Bandara and Mahatantila 1996, World Bank 1997).
Historically, community members living on the periphery of Sinharaja World Heritage Site have held a unique combination of knowledge about the medicinal qualities of plants found in the rain forest. They have drawn upon their skills in plant identification to collect wild plants from Sinharaja Forest for their medicinal preparations (McDermott et al. 1990). Over 211 species with medicinal properties have been found in the reserve, 66% of which are endemic, offering a wealth of unique remedies to these commumtles (Gunatilleke and Gunatilleke 1985). Communities have been found to use 100 of these species solely for medicinal purposes (McDermott et aL 1990). In addition to collecting plants for medicines, rural households on the periphery of Sinharaja also cultivate medicinal plants. These communities are in fact renowned for managing intricate home gardens comprised of multitudes of species, both native and exotic (Gunatilleke et al. 1993).
The combination of knowledge and access to a wide range of species, a well-developed understanding of the medicinal properties of these plants, and the ability to cultivate other plants has allowed generations of families living near Sinharaja to utilize traditional medicine to address health concerns. However, several changes have occurred in this region that influence community members' access to and choices regarding medicines. One was the designation of Sinharaja as a Man and the Biosphere Reserve in 1978, thus restricting all legal non-timber forest product (NTFP) collection solely to kitul palm (Caroyta
38 Spring 2002
urens L.) tapping, thereby prohibiting all extraction of medicinal plants (Caron 1995). Caron (1995) found that home gardens, as opposed to forest collection, not only played a more prominent role in food procurement by community members in the village of Pitikele, but was increasingly an important source of cash income. A second factor influencing the access to and use of medicinal plants has been the conversion of food crops to tea as identified by the IUCN (1993). A third factor has been the increasing availability and affordability of pharmaceutical medicines.
The purpose of this study is to discover what sources of medicines are important for four communities located near Sinharaja rain forest. We also determine how the relative importance of these medicinal sources change with distance from forest reserve to closest major market. Furthermore, through a series of interviews and comparison with previous studies in this region, we attempt to offer a contemporary look at the changing trends in medicinal usage and the long-term impact of these trends for protected area establishment and management.
Site Description
Sinharaja rain forest, designated as a World Heritage Site in 1988, encompasses approximately 11,000 hectares (Caron 1995) and lies within the southwestern quarter of Sri Lanka known as the 'wet zone' (Gunatilleke and Gunatilleke 1991). The forests within Sinharaja have been classified as humid rainforest, receiving a mean annual rainfall of 4054mm distributed evenly throughout the year (Gunatilleke and Gunatilleke 1985). Temperature varies diurnally, ranging from 20.2°C to 25.2°C. The undulating topography of Sinharaja encompasses an elevation variation of 90 to 1170 meters (Gunatilleke and Gunatilleke 1983). Four important land uses within the buffer zone of Sinharaja forest include paddy fields, home gardens, tea plantations, and forest product collection (Caron 1995).
Community Descriptions
The study was conducted in four villages bordering the northwestern portion of Sinharaja forest: Pitikele, Weddegala, Kalawana, and Kosgulana. The locations of these communities represent a gradient of distance between the protected area and the market (Table 1).

¥}
Table 1: Distance to market, population and interview sample size or our ages. Village! Town Distance to # of Households Estimated Total Population % of Village!
Name Kalawana (km) Interviewed (# of households) Town Interviewed Pitikele 16.9 13 25 52%
Kosgulana 18.7 14 25 56% Weddegala 11.9 10 50 20% Kalawana 0 13 1000 1%
-* The distances were calculated usmg a standard compass (m 500 yard mcrements) from the Rakwana, Sn Lanka one mch map, revised 1972 and reprinted 1987.
Kalawana, the economic center for the entire recion and located 17.5 km from the northwest gate of b
Sinharaja, contains a population of roughly 5000 residents. Approximately seventy different shops sell a wide range of products throughout the week, including two stores that offer exclusively ayurvedic medicinal products. On Saturdays, fresh produce, meats and other products reach the Kalawana open-air market from central markets includino- Colombo and Nuwaraeliya. Vendors also include represen~tives from ayurvedic medicinal companies that sell their products from mobile stations. Residents from all four villages rely upon Kalawana as their primary source of purchasing and selling goods.
On the opposite end of the gradient, both Pitikele and Kosgulana, each populated by approximately 100 residents, are located within 1.0 km from Sinharaja. Electricity, running water, and public transportation have not yet reached either of the villages so transit from each village during the 2000 field season required a significant amount of time. For example, residents who live in Pitikele travel approximately four hours (round trip) on foot and by bus to Kalawana, the major market town (16.9 km one way). Due to the two small stores located in their village, Koso-ulana residents make smaller purchases more easily b
than do those in Pitikele, who have to walk to Kuduwa or Weddegala to shop in a store. As tea comprises the primary source of income for residents of both villages, they also meet the "tea lorry" which collects tea harvests about 0.5 km from each village. Community members carry bags of freshly plucked tea, some weighing 15-20 kg, 3 times per week to the tea lorries. Often tea lorry drivers offer rides to residents for a small fee giving them the opportunity to visit Weddegala or Kalawana.
Finally Weddegala, lying 5.7 km from the forest and 11.9 km from the market town, is slightly larger with approximately 200 residents. Because it is located at the southern end of a major road that leads through Kalawana on to the district capital, Ratnapura, Weddegala is distinguished from Kosgulana and Pitikele. With the availability of facilities such as regular bus service, electricity, running water, and telephone, a higher percentage of middle class residents live here, although many still earn income from agricultural products. A few small stores conduct business within the center of this town and some sell medicines.
Methods
Interviews with household members and indigenous doctors
A Sri Lankan and an American, as well as another Sri Lankan villager from the nearby community of Kuduwa, comprised our group of interviewers. We conducted ten to fifteen interviews per community for a total of fifty interviews. We randomly selected these households using a list of houses provided by either a community member or the post office. Our interviewing group resided in each community during the period of.the interviews. We interviewed respondents either alone or m a group. Other family members or friends were present. Questions included household information (number of family members, ages, and genders), property information (area and types of gardens), and time spent (percentages) on different activities in gardens. We asked detailed questions about quantities, types, and sources of medicines used by respondents' households over the previous year.
We also interviewed three ayurvedic doctors. Interviews were informal and designed to provide us with information on specific medicines as well as various medical systems practiced by community residents.
Statistical analysis We obtained regression models using the standard
linear regression procedure of Statistical Analysis Syst~m (SAS@; Freund and Little 2000) to answer the followmg questions: 1) what sources of medicines are important for four communities located near Sinharaja?, 2) how does the relative importance of these medicinal sources change with distance from forest reserve and closest market?, 3) does time spent working in the tea garden and on preparing medicines affect medicines across these sources and categories?, and 4) does a difference exist in the percentage of medicines derived from home gardens between the four communities? For each regression model, we used a stepwise selection procedure for variable selection. We identified outliers from residual plots against the dependant variable and the studentized residual values. Out of the 50 households that we interviewed, we identified and confirmed two as outliers and therefore did not include them in the analysis.
Tropical Resources: The Bulletin of the Yale Tropical Resources Institute 39
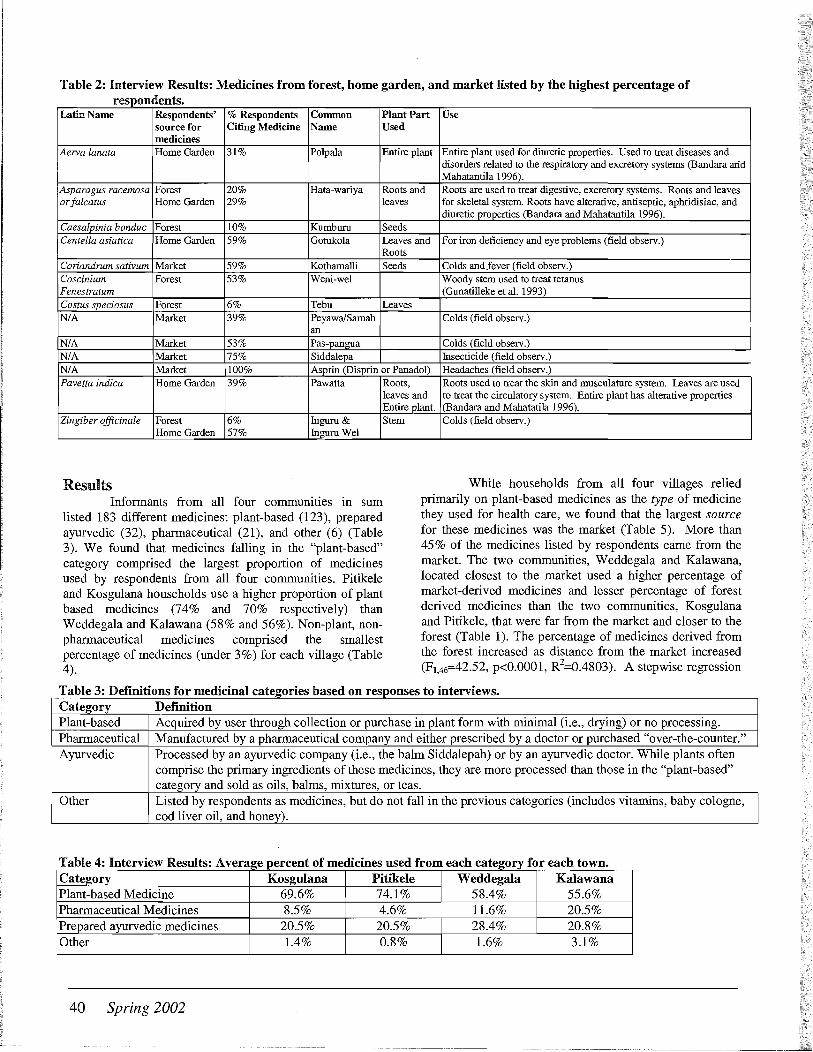
Table 2: Interview Results: Medicines from forest, home garden, and market listed by the highest percentage of d ts respon en .
Latin Name Respondents' % Respondents Common Plant Part Use source for Citing Medicine Name Used medicines
Aerva lanata Home Garden 31% Polpala Entire plant Entire plant used for diuretic properties. Used to treat diseases and disorders related to the respiratory and excretory systems (Bandara arid Mahatantila 1996).
Asparagus racernosa Forest 20% Hata-wariya Roots and Roots are used to treat digestive, excretory systems. Roots and leaves orfalcatus Home Garden 29% leaves for skeletal system. Roots have alterative, antiseptic, aphridisiac, and
diuretic properties (Bandara and Mahatantila 1996). Caesalpinia bonduc Forest 10% Kumburu Seeds Centella asiatica Home Garden 59% Gotukola Leaves and For iron deficiency and eye problems (field observ.)
Roots Coriandncm sativum Market 59% Kothamalli Seeds Colds andJever (field observ.) Coscinium Forest 53% Weni-wel Woody stem used to treat tetanus F enestratum (Gunatilleke et al. 1993) Costus speciosus Forest 6% Tebu Leaves N/A Market 39% PeyawaiSamah Colds (field observ.)
an N/A Market 53% Pas-pan!!Ua Colds (field observ.) N/A Market 75% Siddalepa Insecticide (field observ.) N/A Market 100% Asprin (Disprin or Panadol) Headaches (field observ.) Pavetta indica Home Garden 39% Pawatta Roots, Roots used to treat the skin and musculature system. Leaves are used
leaves and to treat the circulatory system. Entire plant has alterative properties Entire plant. (Bandara and Mahatatila 1996).
Zingiber officinale Forest 6% Inguru & Stem Home Garden 57% Inguru WeI
Results Informants from all four commumtles in sum
listed 183 different medicines: plant-based (123), prepared ayurvedic (32), pharmaceutical (21), and other (6) (Table 3). We found that medicines falling in the "plant-based" category comprised the largest proportion of medicines used by respondents from all four communities. Pitikele and Kosgulana households use a higher proportion of plant based medicines (74% and 70% respectively) than Weddegala and Kalawana (58% and 56%). Non-plant, nonpharmaceutical medicines comprised the smallest percentage of medicines (under 3%) for each village (Table 4).
Colds (field observ.)
While households from all four villages relied primarily on plant-based medicines as the type of medicine they used for health care, we found that the largest source for these medicines was the market (Table 5). More than 45% of the medicines listed by respondents came from the market. The two communities, Weddegala and Kalawana, located closest to the market used a higher percentage of market-derived medicines and lesser percentage of forest derived medicines than the two communities, Kosgulana and Pitikele, that were far from the market and closer to the forest (Table 1). The percentage of medicines derived from the forest increased as distance from the market increased (Fl,46=42.52, p<O.OOOl, R2=0.4803). A stepwise regression
T bi 3 D fi .. f a e : e lmtions or me Cln cate~ones b d ase on responses to mteI'Vlews. Category Definition Plant-based Acquired by user through collection or purchase in plant form with minimal (i.e., drying) or no processing. Pharmaceutical Manufactured by a pharmaceutical company and either prescribed by a doctor or purchased "over-the-counter." Ayurvedic Processed by an ayurvedic company (i.e., the balm Siddalepah) or by an ayurvedic doctor. While plants often
comprise the primary ingredients of these medicines, they are more processed than those in the "plant-based" category and sold as oils, balms, mixtures, or teas.
Other Listed by respondents as medicines, but do not fall in the previous categories (includes vitamins, baby cologne, cod liver oil, and honey).
a e : T bi 4 Int eI'Vlew es : R ults A verage percen 0 me cines use t f di· df romeac ht h t ca egory or eac own. Cate~ory Kosgulana PitikeIe Wedde~aIa Kalawana Plant-based Medicine 69.6% 74.1% 58.4% 55.6% Pharmaceutical Medicines 8.5% 4.6% 11.6% 20.5% Prepared ayurvedic medicines 20.5% 20.5% 28.4% 20.8% Other 1.4% 0.8% 1.6% 3.1%
40 Spring 2002

model was used to determine if other variables could also explain the proportion of forest products used as medicine. No variables other than distance were found to be significant. The four communities differed in the proportion ofthe medicines that was sought from the forest (F3,44=9.91, p <.0001), with Kosgulana having significantly more forest derived medicines than any of the other village in this study (post hoc Bonferroni multiple comparisons at a=.05). There was no difference in the percentage of medicines derived from home gardens in the four communities (F3.44=2.09, p = 0.1149, post hoc Bonferroni multiple comparisons at a=.05), nor was this variable related to distance from market (Fl,46=2.88, p<0.0962, R2=0.0590).
The majority of respondents (96%) owned a tea garden. The size of the tea gardens ranged from 0.25 acres to 5 acres. Size of tea gardens did not significantly influence the percent of medicines derived from the forest, home garden, or the market. However, the larger the tea garden size the less likely the trend that medicines were plant-based (F1,46=5.69, p<.0212, R2=0.1101).
construction materials, and firewood (McDermott 1986, Caron 1994).
The long-term impact of these restrIctions in Sinharaja rain forest will almost certainly be the loss of traditional botanical knowledge about these plants (Gunatilleke et al. 1993). McDermott et al. (1990), who interviewed 85 respondents in 12 communities around the periphery of Sinharaja, found over 100 medicinal species collected from the forest. In our study of four villages, respondents (70% fewer) listed 25 species (400% fewer). This striking difference in number of species may be attributable to her larger sample size or, more likely, the location of villages sampled. However, it also might indicate a loss of use and possibly knowledge that has occurred in the previous 15 years.
Our data demonstrate that as tea-garden sizes increase, use of plant-based medicines decreases. Since households with larger tea gardens most likely have greater incomes and less available time, it stands to reason that they might choose to spend less money on time-consuming plant-based medicines and more money on a combination
T able 5 A : veraj?;e percentaj?;e 0 me cmes f di' ste t>y respon ents as commg rom eac Ii db d f h source or eac ht own. Source Kosgulana Forest 15% HG 30% Market 45% Sold 0%
Discussion
Respondents who live closer to the reserve collect more medicinal plants from the forest than those who live closer to the market. This finding is consistent with past non-timber forest product (NTFP) studies that found family members of communities located near Sinharaja rain forest to utilize a wide range of forest products (McDermott et al. 1990, Gunatilleke et al. 1993, Caron 1995). It is significant that a curvilinear relationship characterizes the relationship between the proportion of forest medicines used by our respondents and distance to the market. A dramatic increase in forest medicines occurs after 17 km from the market town, Kalawana. Since this relationship represents a distance gradient between market and forest, the inverse might also be true, suggesting that only residents of villages located at the periphery of the reserve collect forest medicines.
This finding suggests that restrictive extraction policies set within Sinharaja forest will likely have a greater impact on communities closer to the forest, such as Pitikele and Kosgulana, than those such as Weddegala and Kalawana. Conservationists worked to establish Sinharaja as a reserve in 1978 as a means to prevent uncontrolled logging by the government and others. However, the impact of restrictions imposed upon all forest extraction, with the exception of kitul palm tapping, has been borne most heavily by residents of these buffer communities, who were suddenly deprived an important source of medicines, food,
Pitikele Weddegala Kalawana 7% 0% 0%
41% 56% 48% 47% 44% 52% 5% 0% 0%
of pharmaceutical and prepared ayurvedic medicines. Although the correlation between tea-garden size and use of pharmaceutical medicines was not significant, we observed a trend of increasing use of pharmaceutical and ayurvedic medicines with increasing tea garden size.
We found that Kosgulana residents use significantly more forest medicines than the other villages. Although Pitikele is situated closer to Sinharaja, higher levels of tea cultivation in Pitikele may explain why residents use less forest medicines. Though the correlation between tea-garden size and forest derived medicinal use is not significant, the longer history of tea cultivation in Pitikele may have provided residents with a steadier income, reducing their need to collect medicines from the forest. Another reason for the greater use of forest medicines in Kosgulana than in Pitikele could be the latter community's close proximity to the forest department office in Kuduwa. Pitikele respondents either collect fewer medicines from the forest, or they may have concealed the extent of their collection. Given that we personally observed encroachment upon government land in Kosgulana, it seems likely that Kosgulana residents feel less observed and more encouraged to collect medicines from the forest than those in Pitikele do.
Our data do not reveal any differences between villages in the proportion of medicines that come from their home gardens and there is no significant relationship with distance for the regression. This may be explained by the ubiquitous presence of home gardens throughout Sri Lanka. Several studies have shown the tremendous canopy stratification and species diversity that Sri Lankan
Tropical Resources: The Bulletin of the Yale Tropical Resources Institute 41
homegardens contain across virtually the entire country (Newman 1985, Jacob and Alles 1987, Perera and Rajapakse 1991, Ranasinghe and Newman 1993).
Summary
This study has been an attempt to understand the source and type of medicines used by rural communities along a gradient between forest and market. We interviewed residents in four communities located at varying distances between Sinharaja rain forest and the central market town of the region. Although our study was limited to use of medicinal plants in only four villages, this methodology has broader applications. For example, it appears to be an effective method for defining forest buffer communities. By conducting interviews on forest product collection along a gradient of distance to proposed reserves, identification of stakeholder communities would be greatly simplified. In turn, potentially restrictive forest use policies could be tailored to address these communities' needs.
Acknowledgements
Field research for this project was conducted in the summer of 2000 with the financial assistance of the Tropical Resources Institute at Yale University. We would like to thank Dr. Mark Ashton, Dr. Robert Medelsohn, Drs. Nimal and Savitri Gunatilleke, Dr. Herath Gunatilake, and Dr.B.M.P. Singakumara for their valuable insights. At the Sinharaja field station, we would like to thank K.S.T. Janaka, Somelatha, Thandulah and everyone there. We are indebted to Dr. Manel Lakdivdas for her hospitality in Maharagama. Thanks also to Eben Goodale and Calvin Kiehn for their comments. Finally, we would like to thank all of the residents of Pitkele, Waddagala, Kalawana, and Kosgulana who shared their valuable time and knowledge.
References
Bandara, N.M.S.A., and K.C.P. Mahatantila. 1996. A survey of medicinal plants in Ritigala and its surrounding plain. The Sri Lanka Forester XXII(3-4): 3-21.
Caron, Cynthia M. 1995. The role of nontimber tree products in household food procurement strategies: profile of a Sri Lankan village. Agroforestry Systems 32(2): 99-117.
Caron, Cynthia M. 1994. Securing and Conserving: Food, Property And Sinharaja Forest. Tropical Resources Institute Working Paper. Yale School of Forestry and Environmental Studies, New Haven: 45pp.
Gunatilleke, C.V. S., and LA.U.N. Gunatilleke. 1983. A Forestry Case Study of the Sinharaja Rainforest in Sri Lanka. In Forest and Watershed Development and Conservation in Asia and the Pacific, edited by Lawrence S. Hamilton. Boulder: Westview Press, 289-359. Gunatilleke, C.V.S., and LA. U.N. Gunatilleke. 1985.
42 Spring 2002
Phytosociology of Sinharaja - a contribution to rain forest conservation in Sri Lanka. Biological Conservation 31 :21-40.
Gunatilleke, LA.U.N., and C.V.S. Gunatilleke. 1991. Threatened woody endemics of the wet lowlands of Sri Lanka and their conservation. Biological Conservation. 55:17-36.
Gunatilleke, LA.U.N., C.V.S. Gunatilleke, and P. Abeygunawardena. 1993. Interdisciplinary research towards management of non-timber forest resources in lowland rain forests of Sri Lanka. Economic Botany 47(3): 282-290.
Freund, R.J., 'and R.C. Littell. 2000. SAS@ system for regression. 3rd Edition. Cary, North Carolina.
IUCN. 1993. Management Plan for the Conservation of the Sinharaja Forest. Phase II. Prepared in collaboration with The Forest Department of the Ministry of Forestry, Irrigation & Mahaweli Development.
Jacob, V.J., and W.S. Alles. 1987. Kandyan Gardens of Sri Lanka. Agroforestry Systems 5: 123-137.
McDermott, M. 1986. Sinharaja -Ttropical Rainforest, Tropical Village: A Global Resource, A Local Resource, A Threatened Resource:- Unpublished manuscript.
McDermott, M., C.V.S. Gunatilleke, and LA.U.N. Gunatilleke. 1990. The Sinharaja rain forest: conserving both biological diversity and a way of life. The Sri Lanka Forester XIX (3-4): 3-22.
Newman, S.M. 1985. A survey of interculture practices and research in Sri Lanka. Agroforestry Systems 3: 25-36.
Perera, A. H., and R.M.N. Rajapakse. 1991. A baseline study of Kandyan forest gardnes of Sri Lanka: structure, composition, and utilization. Forest Ecology and Management 45: 269-280.
Ranasinghe, D.M.S.H.K., and S.M. Newman. 1993. Agroforestry research and practice in Sri Lanka. Agroforestry Systems 22: 119-130.
Uragoda, C.G. 1987. A History of Medicine in Sri Lanka, From the Earliest Time to 1948. Colombo: Sri Lanka Medical Association.
World Bank. 1997. Sri Lanka-Conservation and Sustainable Use of Medicinal Plants Project. ID#LKGE35828.

-,._--------_____________________________ ~~~~~ ____ " __ ~ _ "_J
Interview with Mark Wishnie
Theodore Lanzano, MEM 2003 Candidate
Recently, Tropical Resources caught up with recent FES grad, Mark Wishnie (MFS 2002). Mark is currently the co-Program Director of TRI and also directs the PRORENA project in Latin America.
How did you get interested in the tropics and in Panama?
MW: Before starting at F&ES I had been working on riparian habitat issues in the Pacific Northwest, and I was interested in looking at similar issues in another context. The tropics were appealing because very little work on that subject has been done. Mark Ashton had some conversations with Rick Condit at the Smithsonian Tropical Research Institute and with his dad [Peter S. Ashton] at the Harvard Center for International Development. They had been talking about starting a research project to look at native species silviculture in the neotropics. Mark was able to get together some additional funding to support the development of a project in Panama on native species reforestation. So, that's how I got down to Panama.
Can you tell us a little bit about the PRORENA project?
MW: The PRORENA project is focused on developing socially, ecologically, and economically viable strategies for restoring native tree cover to degraded landscapes in Panama. The idea is that individual landowners, who control the largest proportion of the deforested land base, will be most likely to incorporate tree cultivation into their land management strategies if trees represent some sort of economically and socially viable land use option. And of course we're trying to develop these strategies because we think that including more trees makes for land uses that can provide a whole lot of other values as welL We're focusing on Panama as sort of a starting point-a test case. Our main in-country partners are the Smithsonian Tropical Research Institute, particularly the Center for Tropical Forest Science, the Panama Canal Authority, two private companies called Ecoforest and Fututro Forestal, the National Environerrmtal Authority, and the InterAmerican Tropical Tuna Commission, which is interested in reforesting abandoned pasture lands to
protect water quality around its deep-ocean research laboratory. The Center for Tropical Forest Science maintains a network of 15 long-term, large-scale research plots around the world in the tropics. The idea is that if this project is successful in Panama that we would then start to look at replicating it in other locations. But the idea is sort of two-fold: one part of our efforts involves applying some of the long-term ecological and demographic data that the Center for Tropical Forest Science is developing in its plots to find ways to deal with problems in rural areas of these countries. The other part is to initiate new research, specifically on developing socially and economically relevant reforestation strategies. In the fIrst two-year phase we've been focusing on collecting existing information from literature searches and trying to take advantage of existing projects.
How common is reforestation in Panama?
MW: There's very little reforestation going on in Panama, and that's common throughout the tropics. The reforestation that is going on, is mostly involves a very few exotic species - the same four trees you [md worldwide, teak, Caribbean pine, and a couple of species of Acacia and Eucalyptus. More than 93% of all plantings in Panama in 1999 was a monoculture of one of these four species There are some projects where people are using native trees for a variety of purposes - for erosion control, for commercial production, for conservation values. We're [PRORENA] trying to capture the information that's contained in those projects, because it means that these other entities, government agencies, private companies and NGOs, have already invested all the resources in starting up a project, maintaining plots, and purchasing land. That's a tremendous investment, and we can take advantage of that effort by simply going in and setting up monitoring plots and integrating designed experiments into somebody else's ongoing project. So with little expenditure of resources, we are able to get together a lot of good, valuable data. Also, with more than 1400 different tree species native to Panama, it gives us a place to start.
Tropical Resources: The Bulletin of the Yale Tropical Resources Institute 43
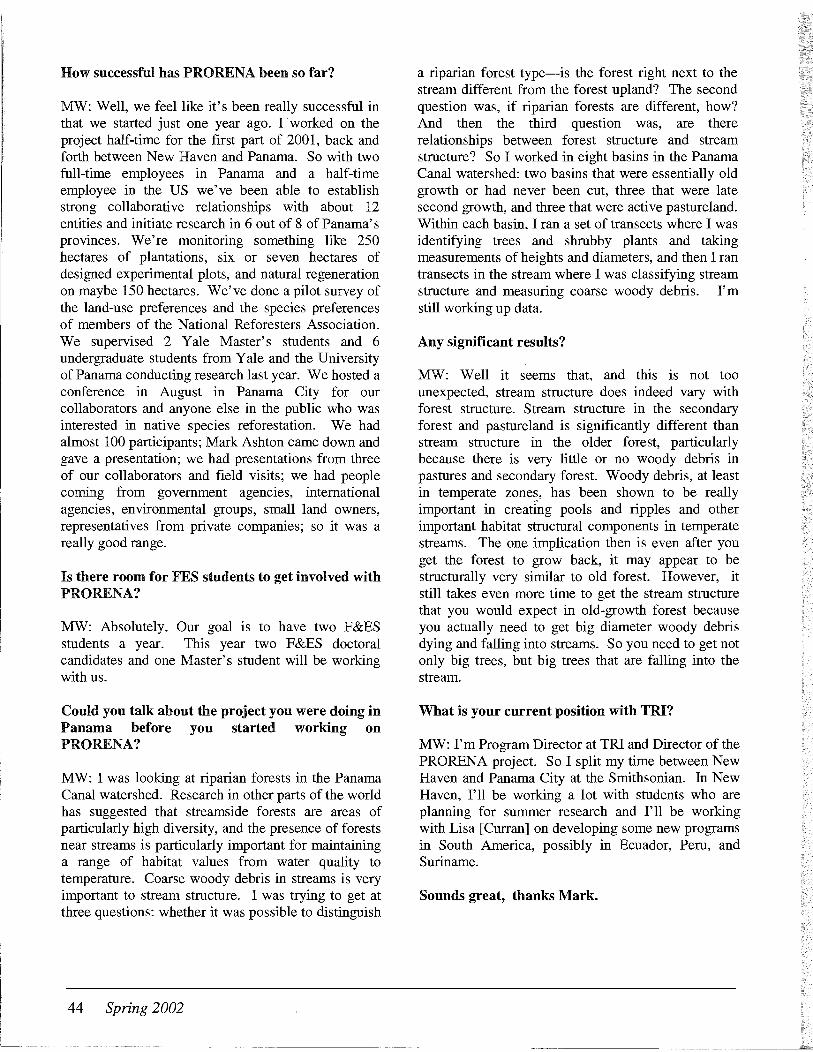
How successful has PRORENA been so far?
MW: Well, we feel like it's been really successful in that we started just one year ago. r worked on the project half-time for the first part of 2001, back and forth between New Haven and Panama. So with two full-time employees in Panama and a half-time employee in the US we've been able to establish strong collaborative relationships with about 12 entities and initiate research in 6 out of 8 of Panama's provinces. We're monitoring something like 250 hectares of plantations, six or seven hectares of designed experimental plots, and natural regeneration on maybe 150 hectares. We've done a pilot survey of the land-use preferences and the species preferences of members of the National Reforesters Association. We supervised 2 Yale Master's students and 6 undergraduate students from Yale and the University of Panama conducting research last year. We hosted a conference in August in Panama City for our collaborators and anyone else in the public who was interested in native species reforestation. We had almost 100 participants; Mark Ashton came down and gave a presentation; we had presentations from three of our collaborators and field visits; we had people coming from government agencies, international agencies, environmental groups, small land owners, representatives from private companies; so it was a really good range.
Is there room for FES students to get involved with PRORENA?
MW: Absolutely. Our goal is to have two F&ES students a year. This year two F&ES doctoral candidates and one Master's student will be working with us.
Could you talk about the project you were doing in Panama before you started working on PRORENA?
MW: I was looking at riparian forests in the Panama Canal watershed. Research in other parts of the world has suggested that streamside forests are areas of particularly high diversity, and the presence of forests near streams is particularly important for maintaining a range of habitat values from water quality to temperature. Coarse woody debris in streams is very important to stream structure. I was trying to get at three questions: whether it was possible to distinguish
44 Spring 2002
a riparian forest type-is the forest right next to the stream different from the forest upland? The second question was, if riparian forests are different, how? And then the third question was, are there relationships between forest structure and stream structure? So I worked in eight basins in the Panama Canal watershed: two basins that were essentially old growth or had never been cut, three that were late second growth, and three that were active pastureland. Within each basin, I ran a set of transects where I was identifying trees and shrubby plants and taking measurements of heights and diameters, and then I ran transects in the stream where I was classifying stream structure and measuring coarse woody debris. I'm still working up data.
Any significant results?
MW: Well it seems that, and this is not too unexpected, stream structure does indeed vary with forest structure. Stream structure in the secondary forest and pastureland is significantly different than stream structure in the older forest, particularly because there is very little or no woody debris in pastures and secondary forest. Woody debris, at least in temperate zones, has been shown to be really important in creatIng pools and ripples and other important habitat structural components in temperate streams. The one implication then is even after you get the forest to grow back, it may appear to be structurally very similar to old forest. However, it still takes even more time to get the stream structure that you would expect in old-growth forest because you actually need to get big diameter woody debris dying and falling into streams. So you need to get not only big trees, but big trees that are falling into the stream.
What is your current position with TRI?
MW: I'm Program Director at TRI and Director of the PRORENA project. So I split my time between New Haven and Panama City at the Smithsonian. In New Haven, I'll be working a lot with students who are planning for summer research and I'll be working with Lisa [Curran] on developing some new programs in South America, possibly in Ecuador, Peru, and Suriname.
Sounds great, thanks Mark.

TRI Study Countries Summer 2001
Belize: Maria Amador, Erika Diamond
Brazil: Anna Fanzeres, Roberto Frau, Eirivelthon Lima
China: Guoqian Wang
Dominica: Kim Thurlow
Ecuador: Sally Nunally, Marc Stem
Ethiopia: Yesmeserach Megenasa
India: Nalin S. Rao
Indonesia: Nissa Mardiah, Laura Meitzner, Steve Bae Rhee
Mexico: Citlali Cortes-Monrano
Nigeria: James Coleman
Panama: Marybeth Howlett, Libby Jones, Heather Peckham, Maria Ana de Rijk, Rachel Roth
Tanzania: Cassie M. Hays
Uganda: Carrie Magee

Tw,,,,,,,,,,...,1 Resources
The Institute is a student-edited bulletin where Masters and PhD candidates from the Yale School of Forestry and Environmental Studies publish the results of their TRI-funded independent research.
Director Usa
Program Directors
Yale
Yale
210
dedicated to the application of inter-disci plinary, problem-oriented, applied research to the creation of practical solutions to the most complex challenges confronting the management of tropical resources worldwide.
Yale School of Forestry and Environmental Studies
205 Prospect Street New Haven, Connecticut 06511 United States of America
www.yale.edu/tri


![ERAmerica Records [finding aid]. Library of Congress. [PDF …lcweb2.loc.gov/service/mss/eadxmlmss/eadpdfmss/2011/ms... · 2015-01-12 · Letter thanking Al Manning Letter to editors](https://img.pdfslide.us/doc/110x75/5e9826fdb53964455e5402ef/eramerica-records-finding-aid-library-of-congress-pdf-2015-01-12-letter-thanking.jpg)