Embed Size (px)
Citation preview

A LABORATORY INVESTIGATION OF
ABATEMENT OF AIRBORNE DIESEL PARTICULATE MATTER USING WATER
DROPLETS
Lucas Rojas Mendoza
Thesis submitted to the faculty of the Virginia Polytechnic Institute and State University in partial
fulfillment of the requirements for the degree of
Master of Science
In
Mining Engineering
Emily A. Sarver, Chair
Gerald H. Luttrell
John R. Saylor
September 14, 2016
Blacksburg, VA
Keywords: Diesel Particulate Matter, DPM, Water drops, Scavenging
Copyright 2016, Lucas Rojas Mendoza
A LABORATORY INVESTIGATION OF ABATEMENT OF AIRBORNE DIESEL
PARTICULATE MATTER USING WATER DROPLETS
Lucas Rojas Mendoza
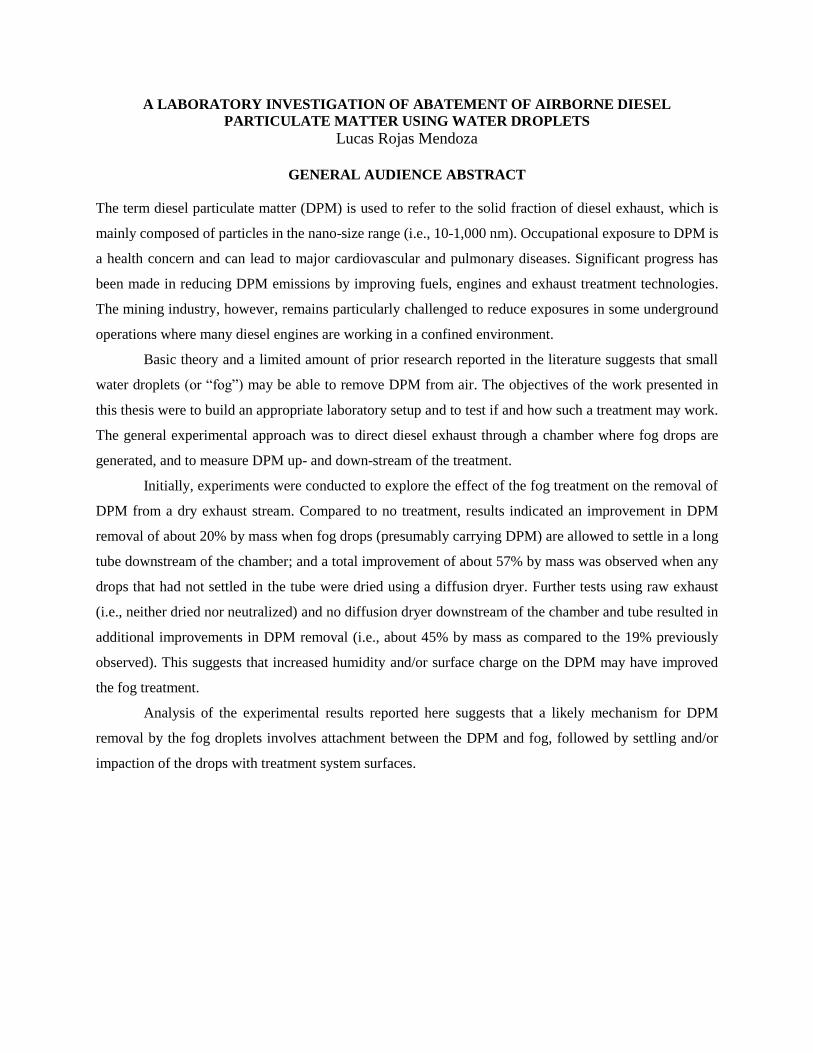
ACADEMIC ABSTRACT
The term diesel particulate matter (DPM) is used to refer to the solid phase of diesel exhaust, which
is mainly composed of elemental carbon and organic carbon. DPM is generally in the nano-size range (i.e.,
10-1,000 nm). Occupational exposure is a health concern, with effects ranging from minor eye and
respiratory system irritation to major cardiovascular and pulmonary diseases. Significant progress has been
made in reducing DPM emissions by improving fuels, engines and after-treatment technologies. However,
the mining industry, in particular, remains challenged to curb exposures in some operations where relatively
many diesel engines are working in confined environments with relatively low airflow.
Basic theory and a limited amount of prior research reported in the literature suggest that water sprays may
be able to scavenge airborne DPM. The goals of the work presented in this thesis were to build an
appropriate laboratory set up and to test the efficacy of micron-scale water (or fog) droplets to remove DPM
from an air stream. The general experimental approach was to direct diesel exhaust through a chamber
where fog drops are generated, and to measure DPM up- and down-stream of the treatment.
Initially, fundamental experiments were conducted to explore the effect of the fog drops on the
removal of (electrically neutralized) DPM from a dry exhaust stream. Compared to no treatment (i.e.,
control) and with the use of a diffusion dryer downstream of the fog treatment, the fog improved DPM
removal by about 57% by mass and 45% by number density (versus no treatment). Without the use of the
diffusion dryer, improvement in DPM removal was about 19% by mass. Analysis of the results suggests
that a likely mechanism for the DPM removal in this experimental system is thermal coagulation between
DPM and fog droplets, followed by gravitational settling and/or impaction of the droplets with system
components.
Further tests using raw exhaust (i.e., neither dried nor neutralized) having a higher DPM number
density; shorter residence times; additional fogging devices; and no diffusion dryer downstream of the fog
treatment were also carried out. These yielded an average overall improvement in DPM mass removal of
about 45% attributed to the fog treatment (versus no treatment). The significant increase in DPM removal
in these tests compared to the initial test (i.e., 19% removal by mass) cannot be fully explained by
differences in residence time or DPM and fog droplet densities. Increased humidity in the system (due to
the undried exhaust) may have allowed for a larger mean droplet size, and therefore might explain more
rapid settling of DPM-laden droplets. Another possible contributing factor is ambient surface charge of the
DPM, which might perhaps result in more efficient attachment between DPM and fog drops and/or
increased deposition loses in the system.
A LABORATORY INVESTIGATION OF ABATEMENT OF AIRBORNE DIESEL
PARTICULATE MATTER USING WATER DROPLETS
Lucas Rojas Mendoza
GENERAL AUDIENCE ABSTRACT
The term diesel particulate matter (DPM) is used to refer to the solid fraction of diesel exhaust, which is
mainly composed of particles in the nano-size range (i.e., 10-1,000 nm). Occupational exposure to DPM is
a health concern and can lead to major cardiovascular and pulmonary diseases. Significant progress has
been made in reducing DPM emissions by improving fuels, engines and exhaust treatment technologies.
The mining industry, however, remains particularly challenged to reduce exposures in some underground
operations where many diesel engines are working in a confined environment.
Basic theory and a limited amount of prior research reported in the literature suggests that small
water droplets (or “fog”) may be able to remove DPM from air. The objectives of the work presented in
this thesis were to build an appropriate laboratory setup and to test if and how such a treatment may work.
The general experimental approach was to direct diesel exhaust through a chamber where fog drops are
generated, and to measure DPM up- and down-stream of the treatment.
Initially, experiments were conducted to explore the effect of the fog treatment on the removal of
DPM from a dry exhaust stream. Compared to no treatment, results indicated an improvement in DPM
removal of about 20% by mass when fog drops (presumably carrying DPM) are allowed to settle in a long
tube downstream of the chamber; and a total improvement of about 57% by mass was observed when any
drops that had not settled in the tube were dried using a diffusion dryer. Further tests using raw exhaust
(i.e., neither dried nor neutralized) and no diffusion dryer downstream of the chamber and tube resulted in
additional improvements in DPM removal (i.e., about 45% by mass as compared to the 19% previously
observed). This suggests that increased humidity and/or surface charge on the DPM may have improved
the fog treatment.
Analysis of the experimental results reported here suggests that a likely mechanism for DPM
removal by the fog droplets involves attachment between the DPM and fog, followed by settling and/or
impaction of the drops with treatment system surfaces.

iv
ACKNOWLEDGEMENTS
I would first like to thank and express my sincere gratitude to my thesis advisor Dr. Emily
Sarver for her continuous support with my Masters studies and related research, for her patience, and for
always having her office door open for my research and writing questions.
I would also like to thank my committee members. I’m especially appreciative of the technical
guidance and continuous feedback provided on my research by Dr John Saylor, and for his time and
involvement since the beginning of this research project.
I would also like to thank Dr. Gerald Luttrell for his advice and valuable feedback.
I would like to thank CDC/NIOSH office of Mine Safety and Health Research (OMSHR) for
funding my thesis work under contract no. 200-2014-59646. I’m especially appreciative of the support and
technical feedback given by Dr James Noll and by Mr. Shawn Vanderslice.
I would also like to thank TSI specialists Aaron Avenido and Maynard Havlicek for helping
troubleshoot issues with our TSI particle counters.
I also want to extend my sincere thanks to all of my friends. I’m particularly appreciative of Dónal
McElwaine, Meredith Scaggs, and Ali Haghighat, for their unconditional support and companionship.
Finalmente, quiero agradecer y expresar mi profunda y sincera gratitud con mi familia, por su
absoluto e incondicional apoyo. Quiero en especial dedicar mi trabajo de tesis a mis padres: Jorge Humberto
Rojas y Astrid Mendoza, a mis hermanos: Natasha, Juan Daniel y María Alejandra, y a mi abuela: Rocío
Cano por ser siempre mi fuente inagotable de motivación. Gracias por su amor y por siempre velar por mi
bienestar a pesar de la distancia. Este logro no hubiera sido posible sin ustedes.
v
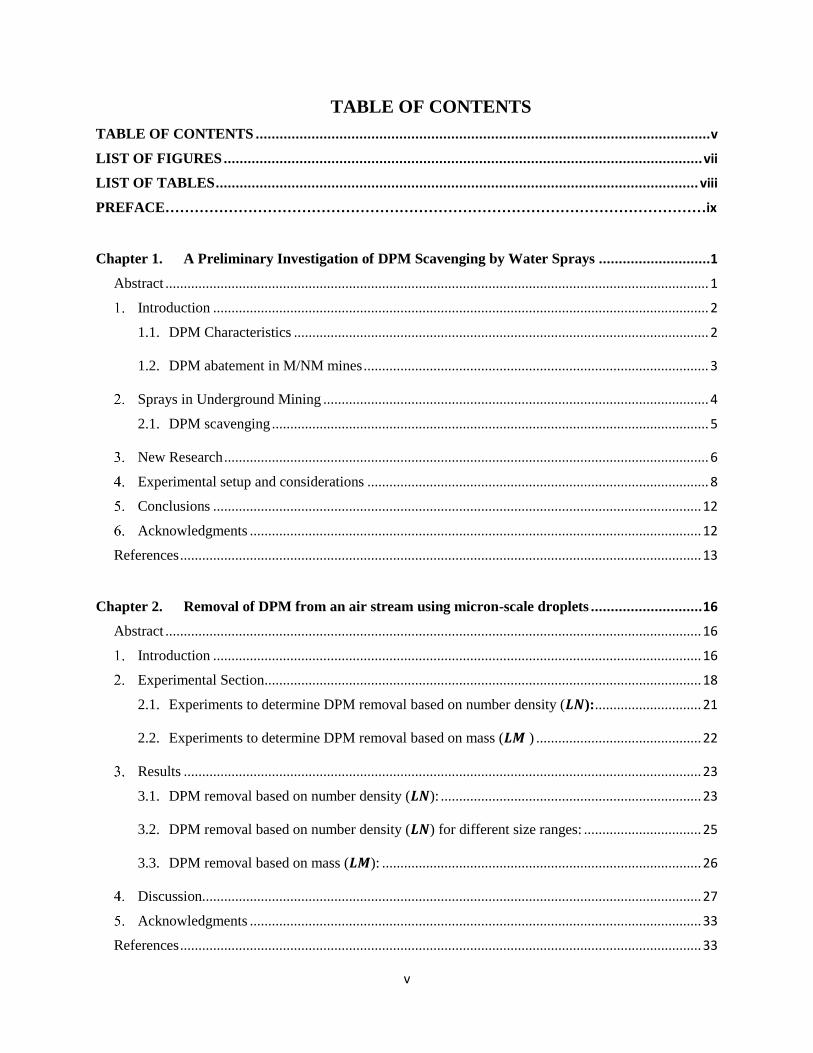
TABLE OF CONTENTS
TABLE OF CONTENTS .................................................................................................................. v
LIST OF FIGURES ........................................................................................................................ vii
LIST OF TABLES ......................................................................................................................... viii
PREFACE…………………………………………………………………………………………………ix
Chapter 1. A Preliminary Investigation of DPM Scavenging by Water Sprays ............................1
Abstract .................................................................................................................................................... 1
Introduction ....................................................................................................................................... 2
1.1. DPM Characteristics ................................................................................................................. 2
1.2. DPM abatement in M/NM mines .............................................................................................. 3
Sprays in Underground Mining ......................................................................................................... 4
2.1. DPM scavenging ....................................................................................................................... 5
New Research .................................................................................................................................... 6
Experimental setup and considerations ............................................................................................. 8
Conclusions ..................................................................................................................................... 12
Acknowledgments ........................................................................................................................... 12
References .............................................................................................................................................. 13
Chapter 2. Removal of DPM from an air stream using micron-scale droplets ............................ 16
Abstract .................................................................................................................................................. 16
Introduction ..................................................................................................................................... 16
Experimental Section ....................................................................................................................... 18
2.1. Experiments to determine DPM removal based on number density (𝑳𝑵): ............................. 21
2.2. Experiments to determine DPM removal based on mass (𝑳𝑴 ) ............................................. 22
Results ............................................................................................................................................. 23
3.1. DPM removal based on number density (𝑳𝑵): ....................................................................... 23
3.2. DPM removal based on number density (𝑳𝑵) for different size ranges: ................................ 25
3.3. DPM removal based on mass (𝑳𝑴): ....................................................................................... 26
Discussion........................................................................................................................................ 27
Acknowledgments ........................................................................................................................... 33
References .............................................................................................................................................. 33
vi
Chapter 3. DPM removal from an exhaust stream by fog drops under variable engine loading,
flow rate, and drop number density ................................................................................................ 36
Introduction ..................................................................................................................................... 36
Experimental Procedure .................................................................................................................. 38
Results ............................................................................................................................................. 41
Discussion........................................................................................................................................ 43
Acknowledgements ......................................................................................................................... 47
References .............................................................................................................................................. 47
Chapter 4. Conclusions and Future Work .................................................................................. 50
Appendix A. Chapter 2 Supplemental Data ................................................................................... 51
Appendix B. Chapter 3 Supplemental Data ................................................................................... 52
Appendix C. Supplemental Data Chapters 2 and 3 ........................................................................ 53
vii
LIST OF FIGURES
Figure 1.1 Illustrative depiction of DPM size distribution by number and by mass, and water droplet
scavenging efficiency as a function of aerodynamic diameter.. ................................................................... 4
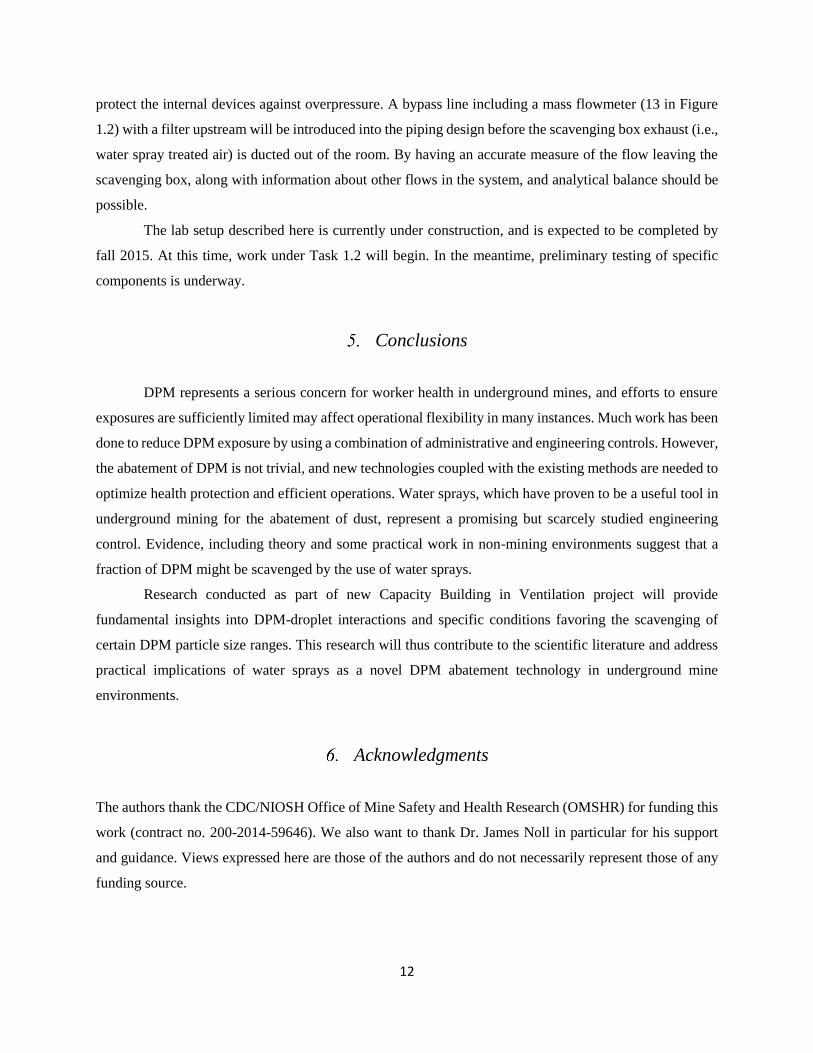
Figure 1.2 Preliminary design for DPM scavenging experiments using a water spray system and list of key
components. ................................................................................................................................................ 10
Figure 2.1 DPM Scavenging experimental apparatus. Locations A, B, and C are sampling locations ...... 19
Figure 2.2 Fogging chamber and settling tube with dimensions ................................................................ 20
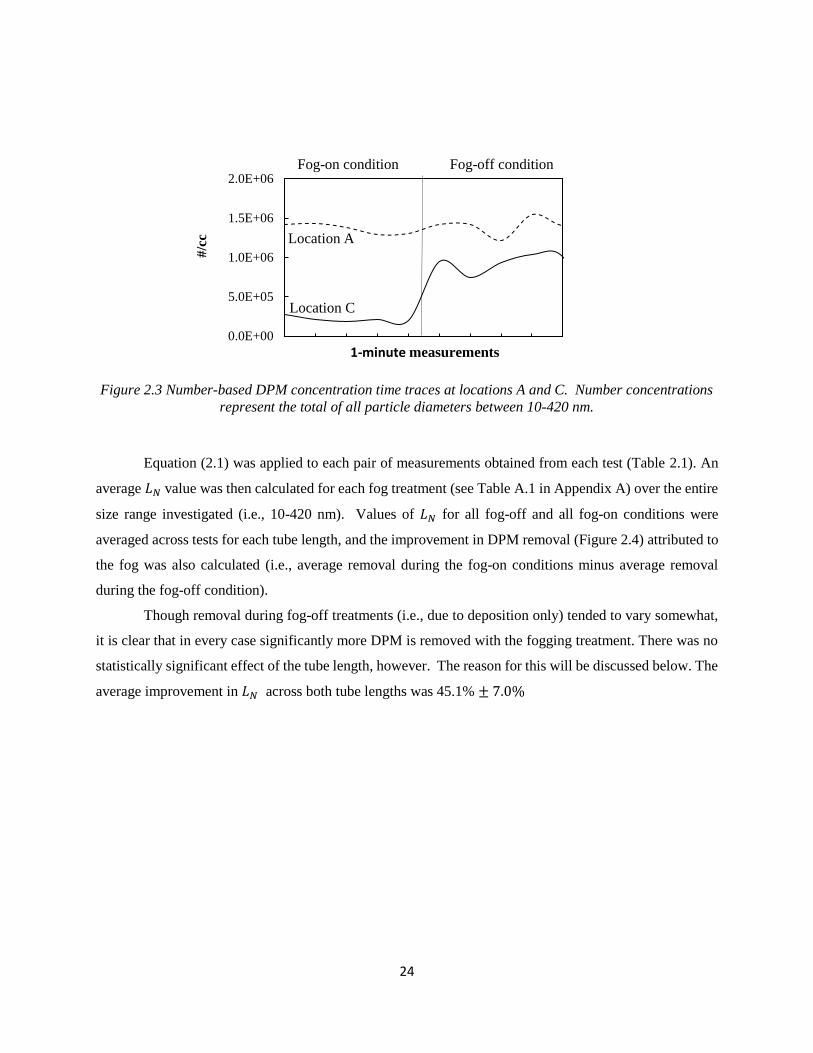
Figure 2.3 Number-based DPM concentration time traces at locations A and C. Number concentrations
represent the total of all particle diameters between 10-420 nm. ............................................................... 24
Figure 2.4 Average LN values for each treatment condition accounting for all particles between 10-420 nm.
Error bars represent 95% confidence intervals. .......................................................................................... 25
Figure 2.5 Values of LN for each of the five size bins for the fog-on and fog-off conditions, as well as the
percent improvement due to fog. Error bars represent 95% confidence intervals. ................................... 26
Figure 2.6 Photographs of filters collected during mass-based experiments at locations A, B, and C ....... 26
Figure 2.7 Mass-based results: (a) mass collected at each location for each treatment condition, and (b)
mass-based DPM removal (LM) between locations A and B and locations A and C. ................................. 27
Figure 2.8 DPM attachment and DPM number density as a function of residence time. ........................... 31
Figure 3.1 Experimental setup .................................................................................................................... 38
Figure 3.2 DPM size distribution at high load (HL) and low load (LL). Error bars are 95% confidence
intervals. ...................................................................................................................................................... 41
Figure 3.3 Average LM values for each treatment condition in tests varying flow rate and engine load. The
improvement in LM attributed to the fog treatment is also shown for each condition. ................................ 42
Figure 3.4 Average LM values for each treatment condition in tests varying number of fogging devices. The
improvement in LM attributed to the fog treatment is also shown for each condition. ................................ 43
Figure 3.5 DPM attachment as a function of residence time for different DPM and water drop number
densities. ..................................................................................................................................................... 44
viii
LIST OF TABLES
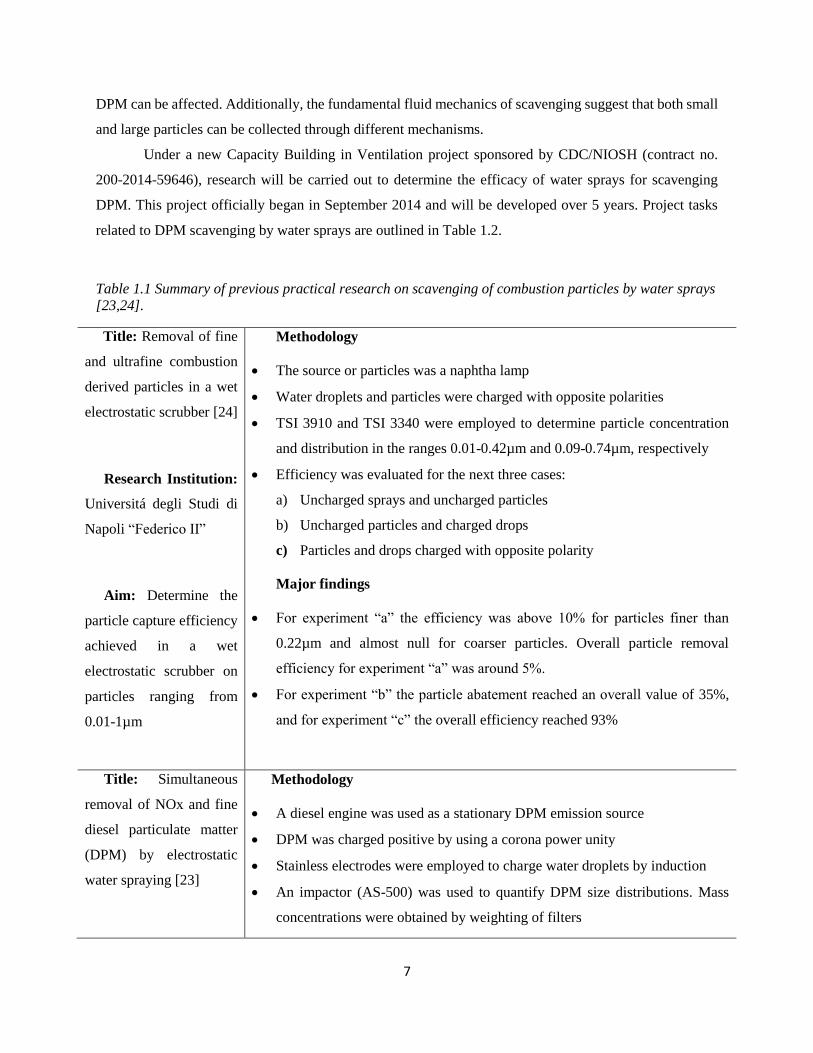
Table 1.1 Summary of previous practical research on scavenging of combustion particles by water sprays
...................................................................................................................................................................... 7
Table 1.2 Description of project tasks related to DPM scavenging by water sprays. ................................... 9
Table 2.1 Conditions for DPM removal based on number densities .......................................................... 22
Table 3.1 Test conditions ............................................................................................................................ 40
Table 3.2 Experimental conditions for prior and current work. .................................................................. 46
ix
PREFACE
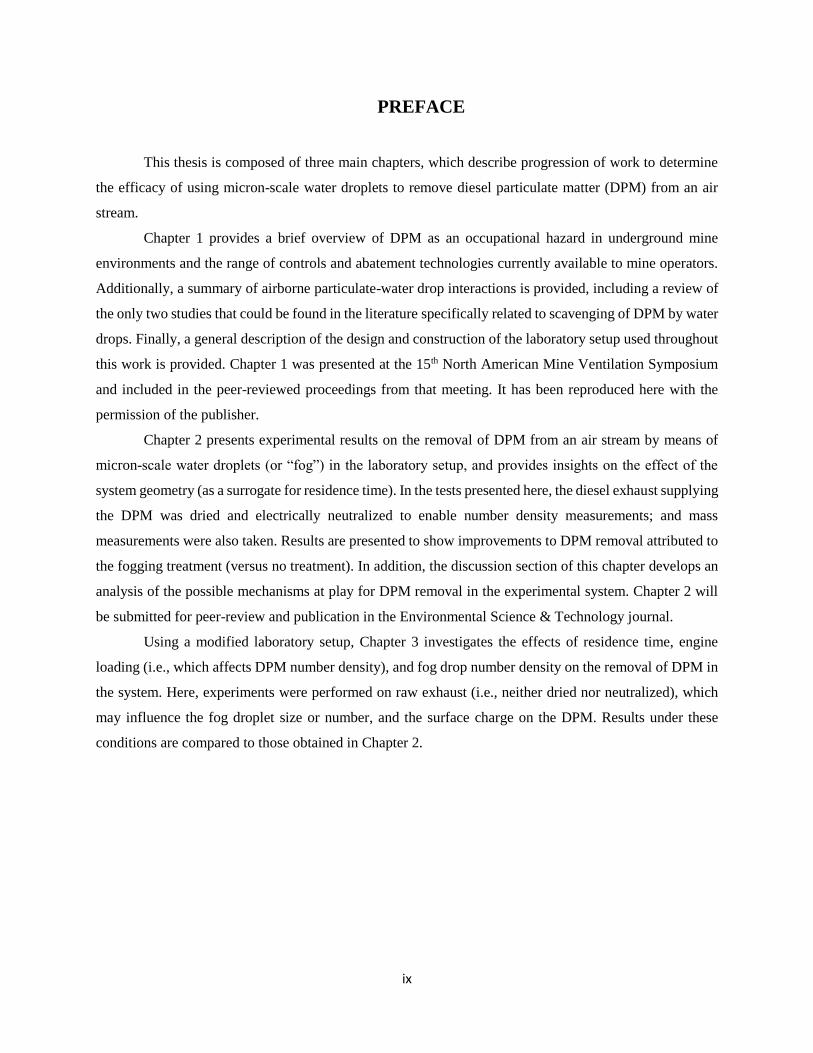
This thesis is composed of three main chapters, which describe progression of work to determine
the efficacy of using micron-scale water droplets to remove diesel particulate matter (DPM) from an air
stream.
Chapter 1 provides a brief overview of DPM as an occupational hazard in underground mine
environments and the range of controls and abatement technologies currently available to mine operators.
Additionally, a summary of airborne particulate-water drop interactions is provided, including a review of
the only two studies that could be found in the literature specifically related to scavenging of DPM by water
drops. Finally, a general description of the design and construction of the laboratory setup used throughout
this work is provided. Chapter 1 was presented at the 15th North American Mine Ventilation Symposium
and included in the peer-reviewed proceedings from that meeting. It has been reproduced here with the
permission of the publisher.
Chapter 2 presents experimental results on the removal of DPM from an air stream by means of
micron-scale water droplets (or “fog”) in the laboratory setup, and provides insights on the effect of the
system geometry (as a surrogate for residence time). In the tests presented here, the diesel exhaust supplying
the DPM was dried and electrically neutralized to enable number density measurements; and mass
measurements were also taken. Results are presented to show improvements to DPM removal attributed to
the fogging treatment (versus no treatment). In addition, the discussion section of this chapter develops an
analysis of the possible mechanisms at play for DPM removal in the experimental system. Chapter 2 will
be submitted for peer-review and publication in the Environmental Science & Technology journal.
Using a modified laboratory setup, Chapter 3 investigates the effects of residence time, engine
loading (i.e., which affects DPM number density), and fog drop number density on the removal of DPM in
the system. Here, experiments were performed on raw exhaust (i.e., neither dried nor neutralized), which
may influence the fog droplet size or number, and the surface charge on the DPM. Results under these
conditions are compared to those obtained in Chapter 2.
1
Chapter 1. A Preliminary Investigation of DPM Scavenging by Water Sprays
L. Rojas-Mendoza a, E. McCullough a, E. Sarver a,*, J.R. Saylor b
𝑎 Virginia Tech, Department of Mining and Minerals, Blacksburg, VA 24060, USA
𝑏 Clemson University, Department of Mechanical Engineering, Clemson, SC 29634,
USA
Paper peer reviewed and originally published in the proceedings of the 15th North American Mine
Ventilation Symposium, June 20-25, 2015. Blacksburg, Virginia, preprints no. 15-48
Abstract
Diesel particulate matter (DPM) presents serious occupational health concerns, particularly in
enclosed environments such as underground mines. Since 2002, DPM has been subject to regulations
implemented by the Federal Mine Safety and Health Administration (MSHA). While current strategies to
curb DPM exposures have been largely successful (e.g., improved ventilation and engine exhaust
treatments), challenges still exist in some mine settings, particularly where relatively high airflows are not
practicable. New technologies to remove DPM from such areas are needed. Water sprays have long been
used in underground mine operations as part of comprehensive dust control programs. Indeed, significant
research has been focused on the spray mechanisms for abating dust, with observations indicating that both
material wetting and airborne-particle scavenging contribute to reductions in respirable dust concentrations.
However, little attention has been given to the efficacy of spray droplets to scavenge DPM.
As part of a new Capacity Building in Ventilation project sponsored by the National Institute for
Occupational Safety and Health (NIOSH), we aim to determine if and how water sprays might be used to
control DPM in underground mines. This paper reviews DPM in the underground mine environment,
airborne particle-water droplet interactions, and our research progress to date. The laboratory setup for
experimental work is specifically described and several challenges are discussed, including dilution of the
engine exhaust stream to achieve a steady supply of DPM under flow conditions compatible with analytical
instruments.
Keywords: Diesel Particulate Matter, DPM, Water Sprays, Scavenging, Nanoparticles
2
Introduction
Diesel particulate matter (DPM) is a component of diesel exhaust that is hazardous to human health.
It is classified by EPA and OSHA as a potential or suspected carcinogen [1, 2]. The type and severity of
harm is dependent upon two factors: the amount of DPM to which a person is exposed, and the duration of
the exposure [1]. The physical symptoms range from minor discomforts such as headaches and eyes
irritation under acute exposure, and major cardiovascular and pulmonary diseases (i.e., lung inflammation)
under long term exposure [1-3]. Epidemiological studies demonstrate a relationship between DPM
exposure and increased lung cancer rates, which could be related to the presence of polycyclic aromatic
hydrocarbons (PAH) [3].However, specific mechanisms for health impacts from DPM exposures are not
fully understood, particularly the adverse impacts of nanoparticles [3, 5]. Nanoparticle research is a
significant priority because pulmonary deposition increases with decreasing particle sizes, and because
some chemicals that are innocuous at larger sizes can be toxic at the nanoscale [4].
Underground miners represent a particularly high-risk population when it comes to DPM
exposures [5], because they often work in enclosed environments where heavy diesel-powered equipment
is used [6, 7]. In metal and nonmetal mines (M/NM), ventilation challenges (i.e., low air flows, leakage,
recirculation) can make DPM difficult to abate, such that it becomes a restrictive variable for mining
planning and operation [7-9].
In the US, issues related to occupational health of miners are covered by the Mine and Safety and
Health Administration (MSHA) [2, 6]. Regulation pertaining to permissible personal exposures in M/NM
mines is found in the Code of Federal Regulation (CFR) from 30 CFR 57.5060 to 30 CFR 57.5075. DPM
exposure limits have been regulated since 2002 [8], and the final personal exposure limit (PEL) became
effective on May 20, 2008 [9]. It mandates that a miner’s exposure to DPM must not exceed an average
eight-hour equivalent full shift airborne concentration of 160 µg/m3 (on the basis of total carbon, TC) [10].
In general, noncompliance can be determined by use of a single sample collected and analyzed per the CFR
[11]. The CFR also limits the amount of sulfur permitted in diesel fuel and the type of additives that can be
used, and requires mine operators to monitor “as often as necessary” the concentration of DPM to protect
miner health [13, 14].
1.1. DPM Characteristics
Diesel exhaust is composed of two phases, both of which contribute to occupational health risks:
gas and solid particles [4, 5, 10]. The gaseous phase includes compounds such as CO, CO2, NOx, SOx and
a number of hydrocarbons [6, 15]. The solid phase is mainly composed of highly agglomerated

3
carbonaceous material and ash, in addition to volatile sulfur and organic compounds [4]. The carbonaceous
material is comprised of elemental carbon (EC) or soot and organic carbon (OC) [5]. TC is the sum of the
EC and OC portions [6, 16]. The volatile organic fraction is the consequence of unburned fuel and lube oil,
while sulfuric acid and sulfate particles are created from oxidation of SO2 [5, 6].
Beyond classification by chemistry, DPM can be also be divided into different size ranges based
on aerodynamic diameter (AD), which is defined as the diameter of a 1g/cm3 density sphere of the same
settling velocity (in air) as the particle of interest [4, 15]. Fine particles are generally those with AD <2.5µm,
ultrafine particles are those with AD <0.1µm (100nm), and nano-particles are those with AD < 0.05µm
(50nm) [4, 5].
Based on size and formation mechanism, DPM particles can be classified in one of three typical
modes: nuclei, accumulation, or coarse [4,15]. The nuclei mode is mostly composed of volatile organic and
sulfur compounds residing in the nanoparticle range between about 0.003-0.03µm (i.e., in the general region
shown as “1” in Figure 1.1) [15]. These particles are formed in the engine during the exhaust dilution and
cooling [14], which make their characteristics highly variable with engine operation, dilution and sampling
conditions [4, 5, 17]. These particles only account for 0.1 to 10% of the total mass, but around 90% of the
total particle count [5, 15]. The accumulation mode includes submicron solids (carbonaceous agglomerates
and adsorbed material) with diameters of roughly 0.030-0.5µm (i.e., in the general region “2” in Figure
1.1). This mode moves from the upper end of the nanoparticle range, through the superfine range, to lower
end of the fine range [4]. The transition between the accumulation and coarse mode is somewhat fuzzy, but
occurs between 0.5-1µm. Finally, the coarse mode includes particles > 1µm (i.e., in the general region “3”
in Figure 1.1), which are generated as a consequence of deposition in the engine walls and sampling
systems. Relatively few particles actually fall into this mode by number, but they account for about 5-20%
of the total mass [15]. From a mass perspective, most DPM resides in the accumulation mode; but from a
number perspective, most particles are found in the nuclei mode [5, 15]. This can be clearly observed in
Figure 1.1. In regards to safety, this may present a concern because DPM is regulated on a mass basis – is
as generally the case with all airborne particulates due to limitations of analytical methods – but some health
effects may be strongly influenced by nanoparticle exposure [5].
1.2. DPM abatement in M/NM mines
Numerous efforts have been made to curb DPM exposure in underground M/NM mines (i.e., [7–
10, 18, 19]). Both engineering and administrative controls exist. Administrative controls include
modifications to operational procedures to decrease the hazard. Limiting equipment speeds, restricting
engine idling and identifying areas where no personal should be located are examples of administrative

4
controls [2, 6]. On the other hand, engineering controls are technical improvements that either reduce DPM
generation (i.e., upgraded engine technologies, exhaust filters and preventative maintenance programs to
minimize emissions) [2, 9], or reduce miner exposures (e.g., sealing equipment cabs, providing increased
ventilation) [2, 6, 10, 11]. Adjusting ventilation is indeed one of the simplest options for limiting DPM
exposure in principle, however this is challenging in large-opening mines. In such environments, it may be
impractical to significantly increase airflow or to introduce effective ventilation controls (i.e., permanent
sealing, stoppings and curtains) [6]. NIOSH has conducted some research related to improved ventilation
layouts for large-opening mines [e.g., 6–8, 18], but many operations will undoubtedly remain challenged
to meet current (and any future) DPM exposure limits. Not only might these challenges result in instances
of overexposures, but in many cases they may also constrain operational flexibility (e.g., in terms of
production schedules, resource appropriation, etc.)
In light of the above, new technologies are needed for DPM abatement. Water sprays have long
been used in mining environments to control airborne dusts [21, 22]. While few studies can be located in
the published literature regarding the efficacy of sprays to reduce DPM, theory and very fundamental work
on water droplet-particle interactions suggest that certain size ranges of DPM should be affected (i.e., [22–
25]) .
Figure 1.1 Illustrative depiction of DPM size distribution by number and by mass, and water droplet
scavenging efficiency as a function of aerodynamic diameter. DPM size distribution (based on Kittelson
(1997), [4]) exhibits three characteristic modes: Nuclei (shown as “1”), accumulation (shown as “2”), and
coarse mode (shown as “3”) For the scavenging efficiency (based on and Kim et al. (2001), [17]) the zone
shown as “4” corresponds to an area where the efficiency reaches a minimum.
Sprays in Underground Mining
The concentration of airborne particles in underground mines is conventionally controlled by
ventilation (i.e., via dilution and/or displacement), dust collector systems, and/or water sprays [22]. These
techniques are ubiquitous in mining operations to control dust. Water sprays are often employed as part of
0.001 0.01 0.1 1 10S
caven
gin
g
Eff
icie
ncy
No
rmal
ized
Co
nce
ntr
atio
n
Aerodynamic Diameter (µm)
1 2 3
4

5
a wet scrubber or as a local treatment by direct application to the zone of interest (i.e., nearby production
areas and mineral processing installations) [18, 20, 23].
Water sprays are effective through two major mechanisms: wetting suppression and particle
scavenging [17, 18] . Wetting suppression is the most common method of dust control at mine operations,
and the premise is that particles are prevented from becoming airborne in the workplace. Wetting may be
functional when it is applied to bulk materials, or when it limits particles previously deposited on walls and
equipment surfaces from being liberated [21]. Wetting effectiveness can be enhanced by increasing wetting
uniformity and the number of water sprays[22]. The role of particle scavenging, also called collection, is
rather to remove particles from the air. Mechanistically, the idea is for particles to collide with water
droplets, and then to fall out of the air [20, 21, 24].
The scavenging efficiency is related to the ability of a drop or group of drops to capture airborne
particles [24, 27]. This efficiency can be quantified by the scavenging coefficient (E), which is defined as
the number of particles scavenged relative to the total number of particles. Practically, a coefficient can be
calculated for certain size ranges or modes [28], or even certain types of particles. The scavenging efficiency
depends on many factors of the water drop (i.e., density, diameter, charge, surface tension and viscosity),
the particle (i.e., density, diameter and electrical charge) and also on the airflow and spray characteristics.
Spray characteristics include the type of nozzle (e.g., geometry), operating pressure and flow rate [29]. The
most common nozzles designs employed for dust abatement in the mining industry include: hollow cone
pattern, full-cone pattern, and flat spray patterns [29]. Each of them produces different water drop diameters
and mean velocities.
A fair amount of research has been conducted on water sprays for dust particles in the respirable
range. It is widely accepted that the capture efficiency is directly proportional to the relative velocity
between the spray droplets and the dust particles, and inversely proportional to the droplet diameters [24,
29]. Smaller water droplets can be obtained by using atomizing or fog sprays, steam sprays, electrically-
atomized sprays and sonically atomized sprays [22]. Previous research conducted by Saylor et al., (2013)
demonstrated that the scavenging efficiency for particles within the sub-micron range (i.e., 0.1-10µm) can
be increased by using an ultrasonic standing-wave field [28]. However, it should be noted that the collection
mechanism for dust particles might differ from the mechanism governing DPM scavenging since drop-
particle interactions are size dependent.
2.1. DPM scavenging
There are four possible mechanisms of particle scavenging by water droplets: impaction;
interception, Brownian diffusion and electrostatic attraction [22, 24, 30]. Impaction occurs when the path

6
where particles are travelling is obstructed by water droplets [26]. This mechanism depends on the Stoke’s
number [26], and it plays a major role in spray scavenging of particles with diameters larger than 5µm [17].
Thus, impaction is the governing mechanism for airborne dust scavenging, but is not expected to
significantly affect DPM. Interception occurs when the fluid stream carrying airborne particles passes close
to a water droplet. The efficiency of particle scavenging by interception is directly proportional to the
particle diameter and inversely proportional to the droplet diameter [24, 25]. However, Brownian diffusion,
which refers to random motion of particles within a fluid, governs particle- droplet interactions for
nanoparticles [25, 27, 30]. Indeed, the effect of interception and impaction are negligible for particles under
0.05µm, where around 90% of the count of particles reside [17]. The final mechanism, electrostatic
attraction might also be important under conditions where DPM, water droplets or both possess sufficient
electrical charge to overcome inertial forces[26].
DPM scavenging will be highly dependent on the particle-drop interactions [28]. Under fixed
conditions of droplet diameter and velocity, scavenging efficiency should be related to the particle diameter
[17]. Figure 1.1 provides an illustrative depiction of overall scavenging efficiency as a function of the AD.
This plot was developed based on research by Kim et al., (2001) that addressed scavenging via diffusion,
interception and impaction [17]. As seen in the figure, for ultrafine and smaller particles (i.e., < 0.1µm) the
scavenging efficiency increases as the particle diameter decreases, which is attributed the strong influence
of Brownian diffusion. Additionally, for relatively large particles (i.e., > 1µm) the scavenging efficiency
increases as particle size increases, which is attributed to impaction forces. For a certain size range in the
middle (i.e., in the zone “4” in Figure 1.1) scavenging is very inefficient. This range is known as the
Greenfield gap [31], and poor scavenging is understood to be the consequence of competing inertial forces
and Brownian motion [28].
While the discussion above suggests that at least some fraction of DPM should be subject to
significant scavenging by water sprays, little practical research has been carried out along these lines. In
fact, a thorough search of the literature turned up only three related studies. These are summarized in Table
1.1.
New Research
Clearly there is limited published research regarding DPM scavenging by water sprays. However,
the few available studies indicate that for certain cases (e.g., neutral drop-neutral DPM) a fraction of the
7
DPM can be affected. Additionally, the fundamental fluid mechanics of scavenging suggest that both small
and large particles can be collected through different mechanisms.
Under a new Capacity Building in Ventilation project sponsored by CDC/NIOSH (contract no.
200-2014-59646), research will be carried out to determine the efficacy of water sprays for scavenging
DPM. This project officially began in September 2014 and will be developed over 5 years. Project tasks
related to DPM scavenging by water sprays are outlined in Table 1.2.
Table 1.1 Summary of previous practical research on scavenging of combustion particles by water sprays
[23,24].
Title: Removal of fine
and ultrafine combustion
derived particles in a wet
electrostatic scrubber [24]
Research Institution:
Universitá degli Studi di
Napoli “Federico II”
Aim: Determine the
particle capture efficiency
achieved in a wet
electrostatic scrubber on
particles ranging from
0.01-1µm
Methodology
The source or particles was a naphtha lamp
Water droplets and particles were charged with opposite polarities
TSI 3910 and TSI 3340 were employed to determine particle concentration
and distribution in the ranges 0.01-0.42µm and 0.09-0.74µm, respectively
Efficiency was evaluated for the next three cases:
a) Uncharged sprays and uncharged particles
b) Uncharged particles and charged drops
c) Particles and drops charged with opposite polarity
Major findings
For experiment “a” the efficiency was above 10% for particles finer than
0.22µm and almost null for coarser particles. Overall particle removal
efficiency for experiment “a” was around 5%.
For experiment “b” the particle abatement reached an overall value of 35%,
and for experiment “c” the overall efficiency reached 93%
Title: Simultaneous
removal of NOx and fine
diesel particulate matter
(DPM) by electrostatic
water spraying [23]
Methodology
A diesel engine was used as a stationary DPM emission source
DPM was charged positive by using a corona power unity
Stainless electrodes were employed to charge water droplets by induction
An impactor (AS-500) was used to quantify DPM size distributions. Mass
concentrations were obtained by weighting of filters

8
Research Institution:
Kobe University Japan
Aim: Evaluate the
effectiveness of an
electrostatic water
spraying scrubber for the
removal of NOx and DPM
emissions in marine
exhaust gas
Scrubber efficiency was evaluated at different engine loads for the next
scenarios:
a) No water spray (NS)
b) Neutral drop-neutral DPM (ND-NP)
c) Charged drop-neutral DPM (CD-NP)
d) Charged drop-charged DPM (CD-CP)
Major findings
DPM mass concentration increased when engine load increased
ND-NP mass based scavenging efficiency roughly ranged from 10 to 20% for
different engine loads
Mass based efficiency increased for the other scenarios. CD-NP < ND-CP <
CD-CP
The mass-based scavenging efficiency showed to be directly proportional to
the voltage applied for charged particles and drops
Experimental setup and considerations
Four main parts of the experimental set up are easily identified: A diesel engine as DPM source; a
scavenging box (i.e., which includes the water spray system) to produce water droplets that can interact
with DPM; particle counters on either side of the box to determine the efficiency of scavenging under
different scenarios; and a number of devices allowing for system monitoring and control (e.g., pressure
gauges, flowmeters). The most significant challenges to building and running the lab experimental system
are environmental health and safety constraints, influence of dilution conditions on DPM concentration,
protection of the particle counters (i.e., from overwhelming concentrations or pressures) and control of the
water spray parameters. A preliminary design and component list are presented in Figure 1.2.
The DPM source employed for research purposes is a small diesel engine (component 1 in Figure
1.2). The main environmental concern regarding operation of a diesel engine indoors stems from the
potential emissions into the laboratory space. Additionally, noise must be limited. The chosen engine
creates low noise levels when run at 800 to 1000 rpm [32]; and an enclosure (the dashed lines in component
2 of Figure 1.2) with foam insulation material glued on the internal walls will provide additional assurance.

9
Table 1.2 Description of project tasks related to DPM scavenging by water sprays.
Task 1
Construction of
laboratory setup for
spray/ventilation tests
Timeframe
Year 1
Description
Design of the lab set up
Identifying and acquiring main components of the system
o Source of DPM -diesel engine
o Particle counters
o Scavenging box
o Water spray system
o Miscellaneous (i.e., flowmeters, pressure gauges)
Identifying and meeting environmental work space requirements
Construction of lab set up
Debugging and troubleshooting of lab set up
Task 2
Small-scale testing of
water sprays on DPM
scavenging
Timeframe
Year 2
Description
Gathering data related to the overall scavenging efficiency of the water spray
system
Determining scavenging efficiency as a function of DPM diameter
Testing on a small fraction of the engine exhaust (e.g., 1-10%)
Variables
Spray atomization rate
Dilution rate
Airflow reaching the scavenging box (dilution rate & bleed-off fraction)
Task 3
Large-scale testing of
water sprays on DPM
scavenging
Timeframe
Years 3-4
Description
Adjusting lab set up for large-scale testing
Experiments will be conducted on progressively larger fractions of the
exhaust stream
Determining the scavenging coefficient for the total amount of DPM for each
particle diameter
Additional Variables
Engine operating load
Flow temperature
Task 4
Field testing of water
sprays
Timeframe
Years 4
Description
The scavenging box will be decoupled from the DPM source and tested in an
actual mining environment

10
The enclosure will also serve to reduce vibrations and prevent accidental contact with the engine.
A fan is located on top of the enclosure to guarantee enough make-up air in order to prevent overheating.
A thermal insertion meter (17 in Figure 1.2) will also be employed to measure the total exhaust volume,
which should be between 30 and 40 CFM. The primary diesel exhaust (and the water-spray treated fraction
of exhaust) will be piped out of the lab via a fume hood or window (21 in Figure 1.2). In either case, DPM
and CO monitors will be employed in several locations of the lab to guarantee that there is not leakage in
the system.
Dilution conditions influence the number of DPM particles in the system, especially for particles
with AD lower than 01µm [18]. Conditions affecting the nucleation rate of DPM particles are dilution
Legend of components 1 Diesel Engine 2 Soundproof Enclosure 3 Gas Bottle 4 Pressure Regulator 5 Diffusion Dryer 6 Particle Counters 7 Hygrometer
8 On/off Valve 9 Control Valve 10 Rotameter 11 Nebulizer 12 Scavenging Chamber 13 Flowmeter 14 Pressure Gauge
15 Pressure Check Valve 16 Water Supply 17 Thermal Insertion Meter 18 Dilution Bridge 19 Filter 20 Release Valve 21 Window/Fume Hood
Figure 1.2 Preliminary design for DPM scavenging experiments using a water spray system and list of key
components.

11
temperature, dilution ratio, residence time, relative humidity and sulfur content [5, 15, 17]. Sulfur content
will be managed by use of a consistent fuel source, however the other variables will require careful control
and monitoring in order to guarantee repeatable conditions – and therefore reproducibility of data. A
fractional bleed-off will be taken from the main exhaust and will be controlled by using an on/off valve (8
in Figure 1.2) in conjunction with a control manual valve (9 in Figure 1.2). The on/off valve will allow the
control valve to remain fixed once the desired flow has been reached. Dilution will be primarily controlled
by mixing high-purity dry air with the exhaust bleed-off. If necessary, a dilution “bridge” (18 in Figure 1.2)
might be incorporated to drop the DPM concentration to readable levels for the particle counters. The bridge
reduces concentration by filtering a fraction of the bleed-off flow [33]. Dilution conditions are known to
have substantial influence on the DPM size distributions and consequently on the DPM concentration
measurements.
By using a tee, one fraction of the diluted flow will be taken directly into the scavenging box while
the remaining flow will be directed toward the pre-treatment particle counters. In a similar way, the air
leaving the scavenging box will also be split into two fractions. The major fraction will be directly exhausted
from the lab, while the remaining fraction will be directed toward the post-treatment particle counters. The
pre- and post-treatment analysis will be configured identically to measure DPM concentration (i.e., by
particle number as a function of size) entering and exiting the scavenging box. The flow through the particle
counters will be regulated by a set of on/off-control valves and monitored with rotameters.
For the initial project stages, the scavenging box will be constructed of clear plastic, and will
include a water drain. The spray source (11 in Figure 1.2) will be an ultrasonic atomizer. This equipment
converts high frequency electrical energy to mechanical vibrations, which are intensified by a probe to
break water into micro-droplets. A 40 kHz atomizing probe will be used, providing atomization rates up to
30 mL/min and a median drop size of about 50µm [34]. The atomizer will be mounted on the top of the
scavenging box, and the water (16 in Figure 1.2) entering this equipment will be regulated with a peristaltic
pump.
Key to the lab setup are the particle counters (6 in Figure 1.2). The TSI 3910 nanoparticle counter
(NanoScan) will cover the size range 0.001-0.45µm (10450nm) while the TSI 3330 optical particle sizer
(OPS) will cover the range 0.3-10µm [35, 36]. Two diffusion dryers (5 in Figure 1.2) will be used to ensure
that the particle counters only count DPM (and not water droplets). These pieces of equipment dry and
remove water vapor from the gas flow by collecting large water droplets at the inlet and removing excess
moisture by diffusional capture [37]. A hygrometer (7 in Figure 1.2) will be employed to guarantee that the
majority of the water vapor and droplets are removed during the previous drying stage. A pressure gauge
(14 in Figure 1.2) will be installed downstream of each diffusion dryer to guarantee that the particle counters
are working under near-atmospheric pressure; a pressure check valve (15 in Figure 1.2) will be used to
12
protect the internal devices against overpressure. A bypass line including a mass flowmeter (13 in Figure
1.2) with a filter upstream will be introduced into the piping design before the scavenging box exhaust (i.e.,
water spray treated air) is ducted out of the room. By having an accurate measure of the flow leaving the
scavenging box, along with information about other flows in the system, and analytical balance should be
possible.
The lab setup described here is currently under construction, and is expected to be completed by
fall 2015. At this time, work under Task 1.2 will begin. In the meantime, preliminary testing of specific
components is underway.
Conclusions
DPM represents a serious concern for worker health in underground mines, and efforts to ensure
exposures are sufficiently limited may affect operational flexibility in many instances. Much work has been
done to reduce DPM exposure by using a combination of administrative and engineering controls. However,
the abatement of DPM is not trivial, and new technologies coupled with the existing methods are needed to
optimize health protection and efficient operations. Water sprays, which have proven to be a useful tool in
underground mining for the abatement of dust, represent a promising but scarcely studied engineering
control. Evidence, including theory and some practical work in non-mining environments suggest that a
fraction of DPM might be scavenged by the use of water sprays.
Research conducted as part of new Capacity Building in Ventilation project will provide
fundamental insights into DPM-droplet interactions and specific conditions favoring the scavenging of
certain DPM particle size ranges. This research will thus contribute to the scientific literature and address
practical implications of water sprays as a novel DPM abatement technology in underground mine
environments.
Acknowledgments
The authors thank the CDC/NIOSH Office of Mine Safety and Health Research (OMSHR) for funding this
work (contract no. 200-2014-59646). We also want to thank Dr. James Noll in particular for his support
and guidance. Views expressed here are those of the authors and do not necessarily represent those of any
funding source.

13
References
[1] United States Environmental Protection Agency, “Diesel Particulate Matter,” January 4,
2014. [Online]. Available: http://www.epa.gov/region1/eco/airtox/diesel.html.
[2] United States Department of Labor, “Diesel Exhaust/Diesel Particulate Matter,” January,
2013. [Online]. Available: https://www.osha.gov/dts/hazardalerts/diesel_exhaust_hazard_alert.html.
[3] Clean Air Task Force, “An analysis of diesel air pollution and public health in America,”
pp. 1–54, 2005.
[4] D. Kittelson, “Engines and Nanaoparticles: A Review,” J. Aerosol Sci., vol. 29, no. 5, pp.
575–588, 1997.
[5] The National Institute for Occupational Safety and Health (NIOSH), Diesel Aerosols and
Gases in Underground Mines: Guide to Exposure Assessment and Control. 2011.
[6] R. H. Grau, R. B. Krog, S. B. Obertson, J. M. Mutmansky, and R. V Ramani, “Maximizing
the ventilation of large-opening mines,” Proc. 11th U.S./North Am. Mine Vent. Symp., pp. 53–60,
2006.
[7] R. B. Krog, R. H. G. Iii, T. P. Mucho, and S. B. Robertson, “Ventilation Planning layouts
for large opening mines,” SME Prepr. 04-187, Littleton, CO Soc. Mining, Metall. Explor. Inc., pp. 1–
9, 2011.
[8] R. H. G. Iii, S. B. Robertson, R. B. Krog, G. J. Chekan, and T. P. Mucho, “Raising the Bar
of Ventilation for Large-Opening Stone Mines,” Heal. (San Fr., 2001.
[9] J. D. Noll, L. Patts, and R. Grau, “The effects of ventilation controls and environmental
cabs on diesel particulate matter concentrations in some limestone mines,” 2007.
[10] Code of Federal Regulations Title 30 Part 57 Section 5060 (30CFR57.5060), Limit
on Exposure to diesel particulate matter. 2013.
[11] Code of Federal Regulations Title 30 Part 57 Section 5061 (30CFR57.5061),
Compliance Determinations. 2013.
[12] Code of Federal Regulations Title 30 Part 57 Section 5065 (30CFR57.5065),
Fueling Practices. 2013.[13] Code of Federal Regulations Title 30 Part 57 Section 5071
(30CFR57.5071), Exposure Monitoring. 2013.
[14] DieselNet, “Diesel Exhaust Particle Size,” 2007. [Online]. Available:
http://courses.washington.edu/cive494/DieselParticleSize.pdf.
[15] D. Kittelson, W. Watts, and J. Johnson, “Diesel Aerosol Sampling Methodology -
CRC E-43: Final Report,” 2002.

14
[16] The National Institute for Occupational Safety and Health (NIOSH), “Elemental
carbon (diesel particulate): METHOD 5040,” 1999. .
[17] H. T. Kim, C. H. Jung, S. N. Oh, and K. W. Lee, “Particle Removal Efficiency of
Gravitational Wet Scrubber Considering Diffusion, Interception, and Impaction,” Environ. Eng. Sci.,
vol. 18, no. 2, pp. 125–136, 2001.
[18] I. Abdul-khalek, D. Kittelson, and F. Brear, “The Influence of Dilution Conditions
on Diesel Exhaust Particle Size Distribution easurements,” Soc. Automot. Eng., no. 724, 1999.
[19] R. H. Grau, T. P. Mucho, S. B. Robertson, a C. Smith, and F. Garcia, “Practical
techniques to improve the air quality in underground stone mines,” Proc. North Am. U.S. Mine Vent.
Symp., pp. 123–129, 2002.
[20] L. Takiff and G. Aiken, “A Real-Time, Wearable Elemental Carbon Monitor for
Use in Underground Mines,” 13th United States/North Am. Mine Vent. Symp., pp. 137–141, 2010.
[21] H. Services, “Best Practices for Dust Control in Metal / Nonmetal Mining,” 2010.
[22] F. N. Kissell, “Handbook for Dust Control in Mining,” pp. 1–131, 2003.
[23] T. Ha Hong, O. Nishida, H. Fujita, and H. Wataru, “Simultaneous removal of NOx
and fine diesel particulate matter (DPM) by electrostatic water spraying scrubber,” J. Mar. Eng.
Technol., vol. A 15, pp. 45–53, 2009.
[24] L. D. Addio, F. Di Natale, C. Carotenuto, G. Scoppa, and V. Dessy, “Removal of
fine and ultrafine combustion derived particles in a wet electrostatic scrubber,” Proc. XXXVI Meet.
Ital. Sect. Combust. Inst., 2013.
[25] L. Cheng, “Collection of airborne dust by water sprays,” Ind. Eng. Chem. Process
Des., vol. 12, no. 3, pp. 221–225, 1973.
[26] H. H. Tran, N. Osami, F. Hirostugu, and H. Wataru, “Prediction for Diesel
Particulate Matter ( DPM ) Collection Efficiency of Electrostatic Water Spraying Scrubber,” vol. 44,
no. 5, 2009.
[27] C. Copeland, “Suppression and dispersion of airborne dust and nanoparticulates,”
Michigan Technological Univesity, 2007.
[28] W. Ran, J. R. Saylor, and R. G. Holt, “Improved particle scavenging by a
combination of ultrasonics and water sprays,” J. Aerosol Sci., vol. 67, pp. 104–118, 2014.
[29] D. Pollock and J. Organiscak, “Airborne Dust Capture and Induced Airflow of
Various Spray Nozzle Designs,” Aerosol Sci. Technol., vol. 41, pp. 711–720, 2007.
[30] S. Calvert, “Scrubbing” in Air Pollution, 3d ed. New York, 1977.
[31] S. M. Greenfield, “Rain Scavenging of Radioactive Particulate Matter from the
Atmosphere,” J. Meteorol., vol. 14, pp. 115–125, 1957.

15
[32] Kubota Global, “EA330-E3-NB1 Kubota EA series,” 2015. [Online]. Available:
http://www.kubotaengine.com/products/engines/vertical-diesel/kubota-ea-series/ea330-e4-nb1.
[33] TSI, “Using the TSI Dilution Bridge with the SMPS,” 2014.
[34] Sonics & Materials Inc, “Ultrasonic Atomizers,” 2015. [Online]. Available:
http://www.sonics.com/lp-atomizers.htm.
[35] TSI, “Optical Particle Sizer 3330,” 2015. [Online]. Available:
http://www.tsi.com/optical-particle-sizer-3330/.
[36] TSI, “Nanoscan SMPS nanoparticle sizer 3910,” 2015. [Online]. Available:
http://www.tsi.com/nanoscan_smps_nanoparticle_sizer_3910/.
[37] Air Techniques International (ATI), “DD 250 Diffusion Dryer,” 2003. [Online].
Available: http://www.atitest.com/html/products/details/dd250.html.

16
Chapter 2. Removal of DPM from an air stream using micron-scale droplets
L. Rojas-Mendoza a, E. Sarver a,*, J. R. Saylor b
𝑎 Virginia Tech, Department of Mining and Minerals, Blacksburg, VA 24060, USA
𝑏Clemson University, Department of Mechanical Engineering, Clemson, SC 29634, USA
Keywords: Diesel particulate matter (DPM), DPM removal, DPM coagulation, micron-scale water drops.
Abstract
Respiratory exposures to diesel particulate matter (DPM) present health risks, particularly in
confined environments or those with a relatively high number of emission sources. Despite a variety of
existing control technologies, exposures in some occupational environments remain unacceptably high
(e.g., underground mine environments), and new technologies and abatement strategies are needed.
Fundamental theory on droplet-particle interactions suggests that micron-scale water drops can scavenge
DPM from an air stream. Here, we present experimental results on DPM removal from a diesel exhaust
stream using a fog of water droplets. Measured scavenging coefficients, based on both number density and
mass, show that significant DPM removal is possible. We discuss the potential scavenging mechanisms at
play and provide insights on future work necessary for scale-up of a fog-based exhaust treatment
technology.
Introduction
Diesel-powered engines are extensively used in industrial activities in both on- and off-road
applications1–3. Diesel exhaust emissions contain a complex mixture of gases and very small particles4–6.
The solid fraction of the exhaust is called diesel particulate matter (DPM), and consists mainly of elemental
carbon, organic carbon and sulfur compounds4.
In terms of size, DPM particles are typically classified into two modes: the nuclei mode which is
composed of volatile particulates in the nanoparticle range (<50nm); and the accumulation mode which
includes larger particulate (50-1000nm) made of carbonaceous material with adsorbed hydrocarbons and
sulfates 4. In terms of number, the majority of the particles reside in the nuclei mode, while most of the
mass resides in the accumulation mode4–6.

17
DPM is recognized as an environmental and occupational hazard2,6,7. Due to its size, it can
penetrate deep into the respiratory system, and inhalation can lead to tissue irritation and to chronic
cardiovascular and respiratory diseases1–3. Indeed DPM is classified as a human carcinogen, and
epidemiological studies have indicated that occupational exposures can result in increased risk of lung
cancer2,8,9.
Particularly concerning are recent studies suggesting that, in the nanometer range, deleterious
health effects of particles scale to their size and number density and not to their mass10,11. For example,
animal studies show that even normally inert compounds such as Teflon12 and titanium dioxide13 can cause
inflammation responses in lung tissue when exposures occur in the form of nanoparticles versus larger
particles. Hence, DPM particulate in the nanometer range could have substantial health effects, in which
case abatement technologies focused primarily on mass reduction would not be adequate for risk mitigation.
To curb DPM exposures, a number of controls have been developed. These include low emission
engines, cleaner fuels, and exhaust treatments such as diesel particulate filters and oxidation catalysts2,7,14.
However, DPM exposures remain relatively high in some environments (e.g., underground mines, truck
loading depots, marine ports)6,14 – either because adoption of controls is not feasible or not sufficient.
Underground miners, for example, generally experience the highest exposures (versus other occupations)
due to use of equipment in confined spaces15. Even with controls in place, adequate reduction of DPM
levels in some mines is a challenge because the necessary ventilation is not practicable16–18.
Although the importance of respirable particle size in determining health effects is increasingly
recognized19,20, occupational DPM exposures are generally measured and regulated based on mass
concentrations18,21. Consequently, the effectiveness of DPM controls is assessed in terms of mass removal7.
Thus, technologies that effectively remove most of the particulate residing in the accumulation mode may
be seen as successful even if smaller nucleation mode particles are largely unaffected. In light of the above,
it is critical to explore and apply new technologies in order to reduce both mass-based and number-based
exposures.
Water sprays are ubiquitous in industry as part of respirable particle exposure controls22–24. They
are mainly used in wet scrubbers and by direct application in very dusty areas23–25. Water sprays are
effective in reducing particle loading in the air through two major mechanisms: wetting suppression, in
which water drops are applied to surfaces to prevent particles from becoming airborne; and particle
scavenging, in which suspended particles are brought into contact with water droplets23,26. Scavenging by
water drops is highly dependent on the particle and drop diameters, densities, number concentrations, and
on air properties23,27,28. Particle diameters play a particularly large role in determining the efficiency of
particle removal by drops27. All else equal, for large particle diameters, the main mechanism at play is
inertial impaction, which occurs when the momentum of the particle prevents it from following the
18
streamlines around the drop, resulting in impact between the two27,29. In general, inertia tends to dominate
at diameters larger than a micron30 and is essentially negligible for nanometer-scale particles23. For very
small diameters, on the other hand, diffusive effects due to Brownian motion of particles becomes the
dominant scavenging mechanism27,29,30.
While fundamental fluid mechanics and preliminary studies suggest that drop scavenging can affect
both large and small particles via different mechanisms, only a few studies have been identified that directly
relate to the applicability of spray treatments on the removal and control of DPM or other combustion-
related particulate. One of those studies evaluated the particle capture efficiency of 180µm drops in a wet
electrostatic scrubber, and showed that under ambient charged conditions (i.e., water and DPM) the removal
of particles was greater than 10% for particles finer than 0.22µm28. The other study investigated the
effectiveness of an electrostatic water-spraying scrubber for simultaneous removal of NOx and DPM. This
study showed that the efficiency of DPM removal (on a mass basis) ranged from 10-20% for ambient
charged water drops having mean diameters ranging from 170-220 µm29.
The objective of the work presented here was to investigate the efficacy of using micron-scale water
droplets to remove DPM from a diesel exhaust stream in a laboratory environment. Results are presented
to show how application of a fog of water droplets improved DPM removal in terms of both number density
and mass.
Experimental Section
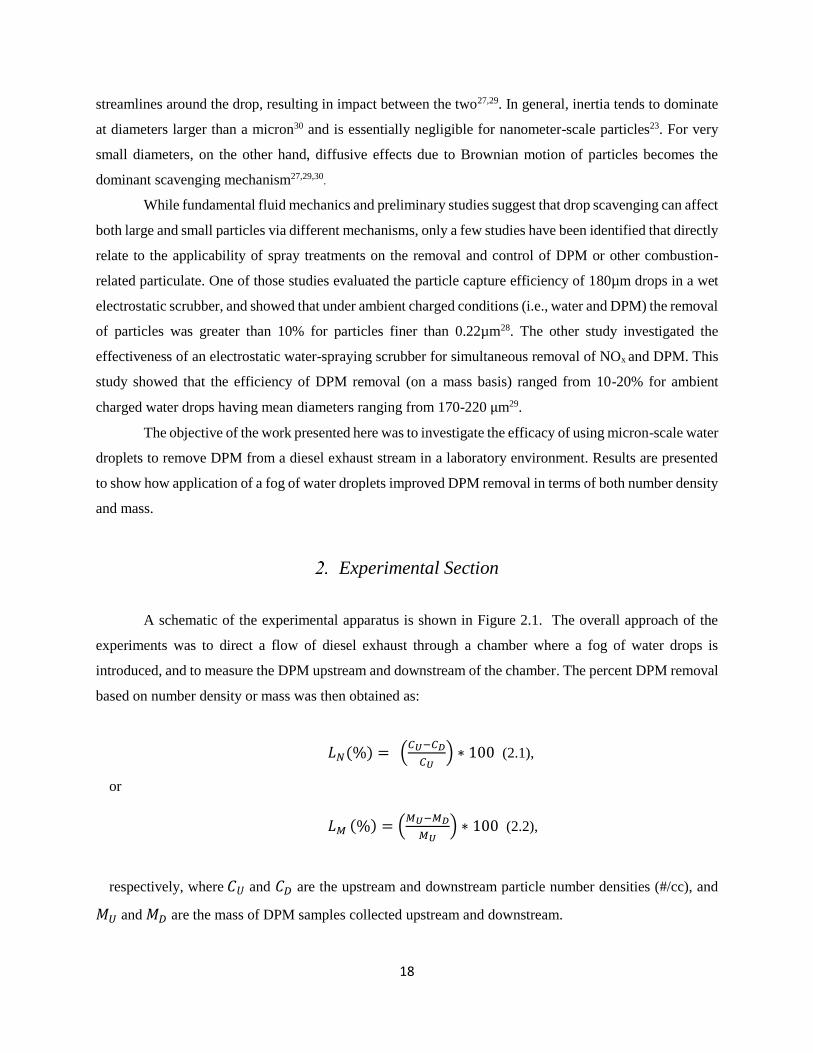
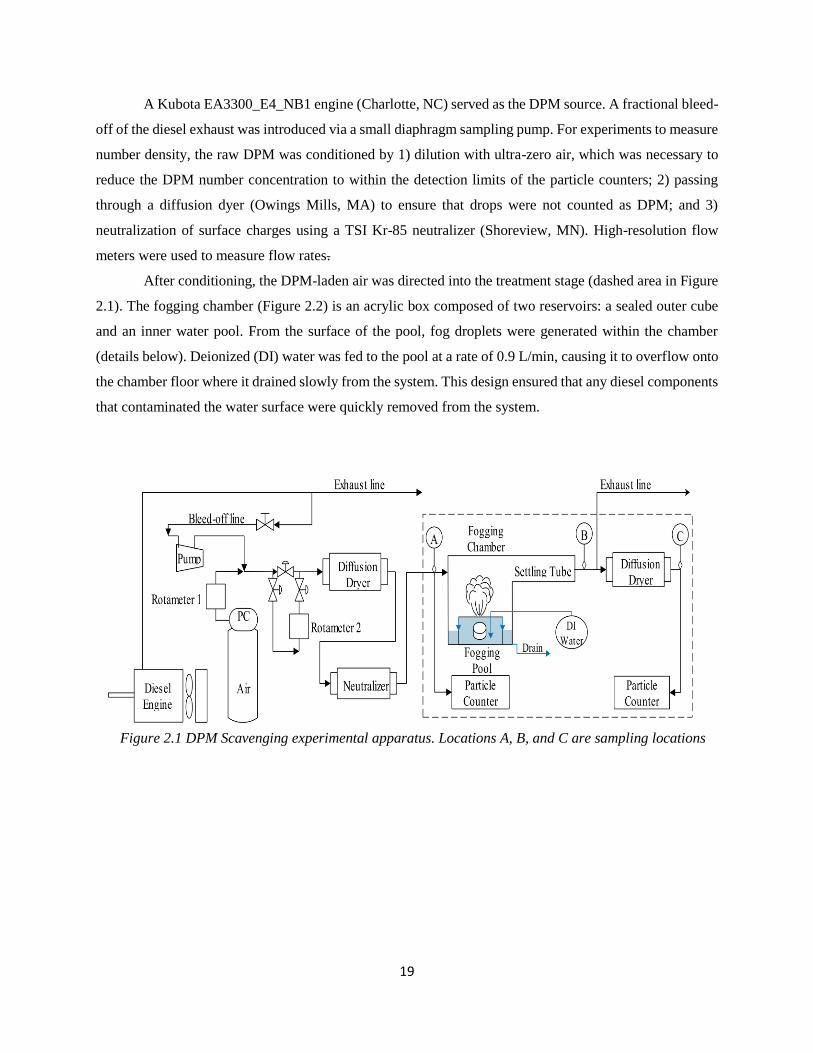
A schematic of the experimental apparatus is shown in Figure 2.1. The overall approach of the
experiments was to direct a flow of diesel exhaust through a chamber where a fog of water drops is
introduced, and to measure the DPM upstream and downstream of the chamber. The percent DPM removal
based on number density or mass was then obtained as:
𝐿𝑁(%) = (𝐶𝑈−𝐶𝐷
𝐶𝑈) ∗ 100 (2.1),
or
𝐿𝑀 (%) = (𝑀𝑈−𝑀𝐷
𝑀𝑈) ∗ 100 (2.2),
respectively, where 𝐶𝑈 and 𝐶𝐷 are the upstream and downstream particle number densities (#/cc), and
𝑀𝑈 and 𝑀𝐷 are the mass of DPM samples collected upstream and downstream.
19
A Kubota EA3300_E4_NB1 engine (Charlotte, NC) served as the DPM source. A fractional bleed-
off of the diesel exhaust was introduced via a small diaphragm sampling pump. For experiments to measure
number density, the raw DPM was conditioned by 1) dilution with ultra-zero air, which was necessary to
reduce the DPM number concentration to within the detection limits of the particle counters; 2) passing
through a diffusion dyer (Owings Mills, MA) to ensure that drops were not counted as DPM; and 3)
neutralization of surface charges using a TSI Kr-85 neutralizer (Shoreview, MN). High-resolution flow
meters were used to measure flow rates.
After conditioning, the DPM-laden air was directed into the treatment stage (dashed area in Figure
2.1). The fogging chamber (Figure 2.2) is an acrylic box composed of two reservoirs: a sealed outer cube
and an inner water pool. From the surface of the pool, fog droplets were generated within the chamber
(details below). Deionized (DI) water was fed to the pool at a rate of 0.9 L/min, causing it to overflow onto
the chamber floor where it drained slowly from the system. This design ensured that any diesel components
that contaminated the water surface were quickly removed from the system.
Figure 2.1 DPM Scavenging experimental apparatus. Locations A, B, and C are sampling locations

20
The fog-generating device or “fogger” used here is a 24 W submersible ultrasonic transducer
operating in the megahertz range. Acoustic energy from the transducer is directed upward through the
water to the air-water interface, resulting in the formation of water droplets with a mean diameter of
approximately 3.9µm and a number density of about 5.0 x 10⁵ drops/cc (for the flow rates investigated
here). The size of the water droplets was determined by allowing the drops to impact a glass slide, and then
by imaging them with a Zeiss Axiovert 200M MAT stereoscope microscope (Oberkochen, Germany)
coupled with a digital camera (AxiocamMRC5). Images were processed using ImageJ (NIH, Bethesda,
MA).
The combination of DPM and fog flowed from the chamber into an acrylic settling tube (inner
diameter of 4.45cm) with length of either 61cm or 183cm, referred to as the “short” and “long” tube,
respectively. Use of these two tubes enabled different durations of DPM-fog interaction, at a given flow
rate. DPM number densities were measured at locations A and C (Figure 2.1) using a pair of identical
particle counters (NanoScan SMPS Nanoparticle sizer 390, TSI, Shoreview, MN). The NanoScan
instrument counts particles from 10-420nm, which are classified into 13 size bins, and makes measurements
3.8 cm
2.6 cm
15.2 cm
8.9 cm
2.6 cm
4.4 cm
20.3 cm
15.2 cm
20.3 cm
20.3 cm
15.2 cm
Short: 61.0 cm Long: 182.9 cm
Top View 3D View
Cross Section D-D Front View
D D
Inlet
Outlet Drain
Figure 2.2 Fogging chamber and settling tube with dimensions

21
at a frequency of 1 measurement/min. Mass samples were acquired at locations A, B, and C by using a
pump to aspirate a fraction of the air stream through a non-hydroscopic polycarbonate (PC) filter.
2.1. Experiments to determine DPM removal based on number density
(𝑳𝑵):
To determine 𝐿𝑁 (Eq. (2.1)), four test conditions were investigated: fogger on versus fogger off,
each using the short and the long settling tube (Table 2.1). In total, 80 pairs of measurements were obtained
at locations A and C. Data was collected during four different engine runs, two using the short tube and two
using the long tube. In each engine run, both fog treatments (i.e., on and off) were randomly assigned and
tested twice. Each fogging condition test consisted of 5 one-minute measurements (i.e., 20 measurements
in each engine run). A 5-minute lag was introduced in between tests to ensure that any possible carryover
effect from the previous condition was not considered. Values for 𝐿𝑁 were calculated for particle diameters
spanning the entire measurement range of the NanoScan and for specific bin sizes, as described below.
The engine was warmed-up for 60 minutes to ensure a steady-state exhaust condition before data
was collected. During this period, and for 10 minutes at the end of each experiment, the NanoScans were
run in parallel at location A to confirm correlation between their measurements. When evaluating NanoScan
data across the entire size range, no correction was necessary as the two instruments only differed on
average by 0.6%, and the correlation coefficient between the two instruments was greater than 0.99 during
these check runs. When looking at individual size bins, paired number density-measurements were used to
build calibration curves between NanoScan1 and NanoScan2 (i.e., for each individual size bin). Only the
five bin sizes that could be linearly scaled to one another were considered. These were: 23.7-31.6; 31.6-
42.2; 42.2-56.2; 56.2-75; 75-100; and 23.7-100nm. For all of these five bins, the calibration curve between
NanoScan 1 and NanoScan 2 had correlation coefficients greater than 0.9 and residual errors were normally
distributed and evenly spaced around zero. Moreover, these five size bins were consistently observed to
account for more than 92% of the total number of DPM particles at location A.
Next (i.e., after warming up and collecting paired measurements at location A) one NanoScan unit
was moved to location C. Then, as an additional check, 8.5 L/min of dilution air (and no DPM) was
introduced into the fogging chamber while the fogger was on in order to determine background particulate
concentration due to the water itself. Such particles exist due to the finite amount of contaminants in DI
water, which remain as particles when the droplets evaporate. Upon successful completion of these checks,
data was acquired following the sequence shown in Table 2.1. This background particulate concentration
was < 4.0 x 10⁴ particles/cc.
22
When the fogger was turned off, the system was considered to be in “deposition mode,” meaning
some DPM is lost due simply to deposition on surfaces. When the fogger was on, the system was considered
to be in “scavenging mode,” meaning particles are removed through both drop removal and deposition.
Across all particle diameters, the upstream DPM concentration (measured at location A) was quite
stable. For the entire course of these experiments (i.e., 80 1-minute samples) the average DPM number
density was 1.36 x 10⁶ ±0.03 x 10⁶ particles/cc (i.e., 95% confidence interval for the average value). The
background concentration of particles associated with fog droplets was < 4.0 x 10⁴ particles/cc, as noted
above, and this level represented less than 3% of the mean DPM number density at location A. This is
further discussed in the next section. The background concentration of particles in the dilution air was
negligible (<1.0 particle/cc). The dilution ratio was kept constant for all experiments at 5.0 L/min of diesel
exhaust to 3.5 L/min of dilution air.
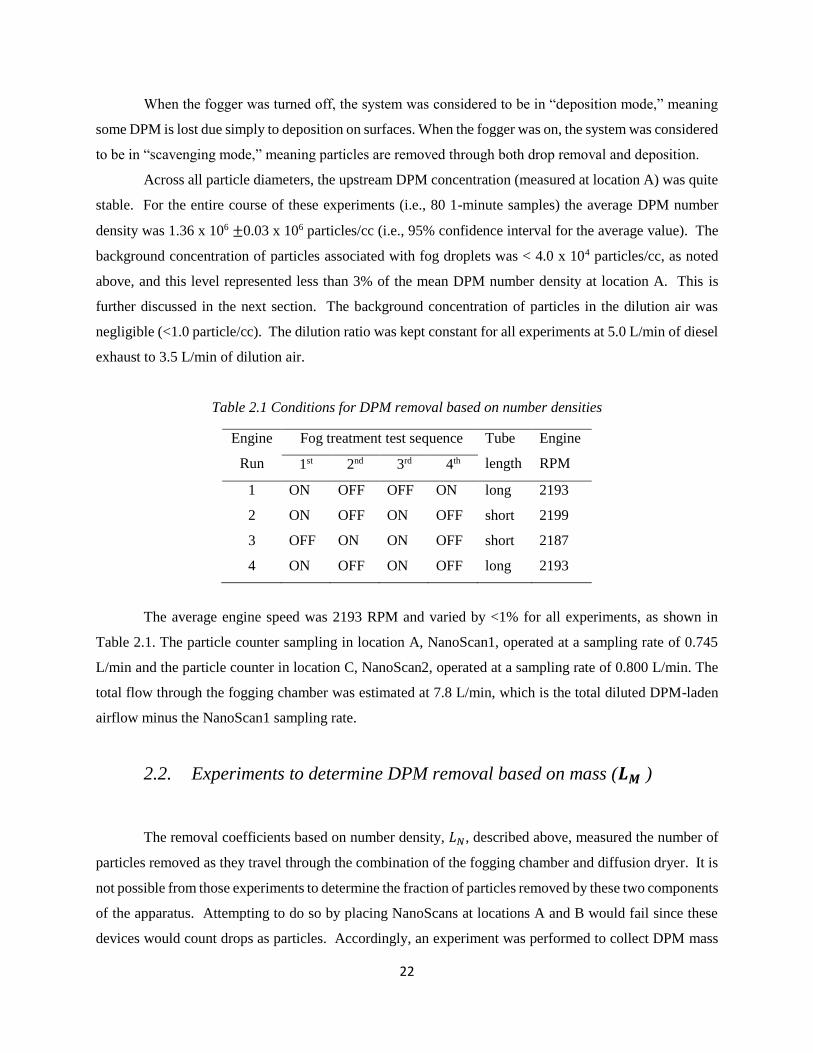
Table 2.1 Conditions for DPM removal based on number densities
Engine
Run
Fog treatment test sequence Tube
length
Engine
RPM 1st 2nd 3rd 4th
1 ON OFF OFF ON long 2193
2 ON OFF ON OFF short 2199
3 OFF ON ON OFF short 2187
4 ON OFF ON OFF long 2193
The average engine speed was 2193 RPM and varied by <1% for all experiments, as shown in
Table 2.1. The particle counter sampling in location A, NanoScan1, operated at a sampling rate of 0.745
L/min and the particle counter in location C, NanoScan2, operated at a sampling rate of 0.800 L/min. The
total flow through the fogging chamber was estimated at 7.8 L/min, which is the total diluted DPM-laden
airflow minus the NanoScan1 sampling rate.
2.2. Experiments to determine DPM removal based on mass (𝑳𝑴 )
The removal coefficients based on number density, 𝐿𝑁, described above, measured the number of
particles removed as they travel through the combination of the fogging chamber and diffusion dryer. It is
not possible from those experiments to determine the fraction of particles removed by these two components
of the apparatus. Attempting to do so by placing NanoScans at locations A and B would fail since these
devices would count drops as particles. Accordingly, an experiment was performed to collect DPM mass
23
samples for gravimetric measurements in order to assess where DPM losses occur within the system. Such
measurements are insensitive to deposited water and so sampling of drops at location B would not cause
errors. Values for 𝐿𝑀 (Eq. (2.2)) were obtained between locations A and B and locations A and C. The
difference between A-B and A-C losses is attributed to DPM removal in the downstream diffusion dryer.
This experiment used the long settling tube, and the fog-on and fog-off treatment conditions were run
sequentially, each for 150 minutes.
Samples were acquired on PC filters having a pore size of 0.2µm and a measured filter retention
efficiency of approximately 97% across the entire size range of the NanoScan. The flow rate of the sampling
pumps was calibrated to 1.7 L/min. Any moisture in the samples was removed by drying in a 40 deg C
oven. The filters were weighed before and after sample collection using a Sartorius Cubis MSE6.6S
microbalance (Göttingen, Germany). The dilution ratio was fixed at 5.5 L/min of diesel exhaust to 4 L/min
of ultra-zero dry air, and the total flow through the fogging chamber was estimated at 7.8 L/min as for the
number density experiments. The engine speed was 2200 RPM and the engine was again warmed-up for
60 minutes’ prior sample collection.
Analysis of number- and mass-based data were conducted with the JMP pro 11 statistical package
(SAS, Cary, NC).
Results
3.1. DPM removal based on number density (𝑳𝑵):
Figure 2.3 shows a sample time trace where the DPM number densities at locations A and C are
plotted versus time for the fog-off and fog-on conditions. As the plots show, the presence of fog reduces
the number concentration at location C for nominally constant concentrations at location A. A similar
trend was observed for all fog-off and fog-on experiments (see Figure A.1 in Appendix A ) As mentioned
above, the average DPM concentration at location A was consistent across all tests, with an average value
of 1.36 x 10⁶ ± 0.03 x 10⁶ particles/cc. When the fog was off, the average concentration at location C
was 7.71 x 10⁵ ±0.44 x 10⁶ particles/cc; and when the fog was on, the average concentration was 1.66
x 105 ± 0.13 x 10⁶ particles/cc.
24
Equation (2.1) was applied to each pair of measurements obtained from each test (Table 2.1). An
average 𝐿𝑁 value was then calculated for each fog treatment (see Table A.1 in Appendix A) over the entire
size range investigated (i.e., 10-420 nm). Values of 𝐿𝑁 for all fog-off and all fog-on conditions were
averaged across tests for each tube length, and the improvement in DPM removal (Figure 2.4) attributed to
the fog was also calculated (i.e., average removal during the fog-on conditions minus average removal
during the fog-off condition).
Though removal during fog-off treatments (i.e., due to deposition only) tended to vary somewhat,
it is clear that in every case significantly more DPM is removed with the fogging treatment. There was no
statistically significant effect of the tube length, however. The reason for this will be discussed below. The
average improvement in 𝐿𝑁 across both tube lengths was 45.1% ± 7.0%
Figure 2.3 Number-based DPM concentration time traces at locations A and C. Number concentrations
represent the total of all particle diameters between 10-420 nm.
0.0E+00
5.0E+05
1.0E+06
1.5E+06
2.0E+06
1 2 3 4 5 6 7 8 9 10
#/c
c Location A
Fog-on condition Fog-off condition
Location C
1-minute measurements

25
3.2. DPM removal based on number density (𝑳𝑵) for different size ranges:
The improvement in DPM removal due to the fog treatment was evaluated for five individual size
bins: 23.7-31.6; 31.6-42.2; 42.2-56.2; 56.2-75; 75-100; and 23.7-100 nm. Using the same analysis as above
for the total particle counts, average 𝐿𝑁 values across both tube lengths were determined for the five bins
for both fog treatment conditions. These data are presented in Figure 2.5, which clearly shows that the fog
treatment significantly increases DPM removal in all five bins. Average improvements in particle removal
ranged from 39.6% to 54.6% and the average improvement across all five bins was 45.4% ± 6.9% – which
is consistent with the average improvement across the entire size range investigated (i.e., 45.1 ± 6.9%).
Short tube Long tube
Fog-off 40.2 46.2
Fog-on 86.6 89.9
Improvement 46.4 43.8
0.0
20.0
40.0
60.0
80.0
100.0
LN
(%
)
Figure 2.4 Average 𝐿𝑁 values for each treatment condition accounting for all particles between 10-420
nm. Error bars represent 95% confidence intervals.
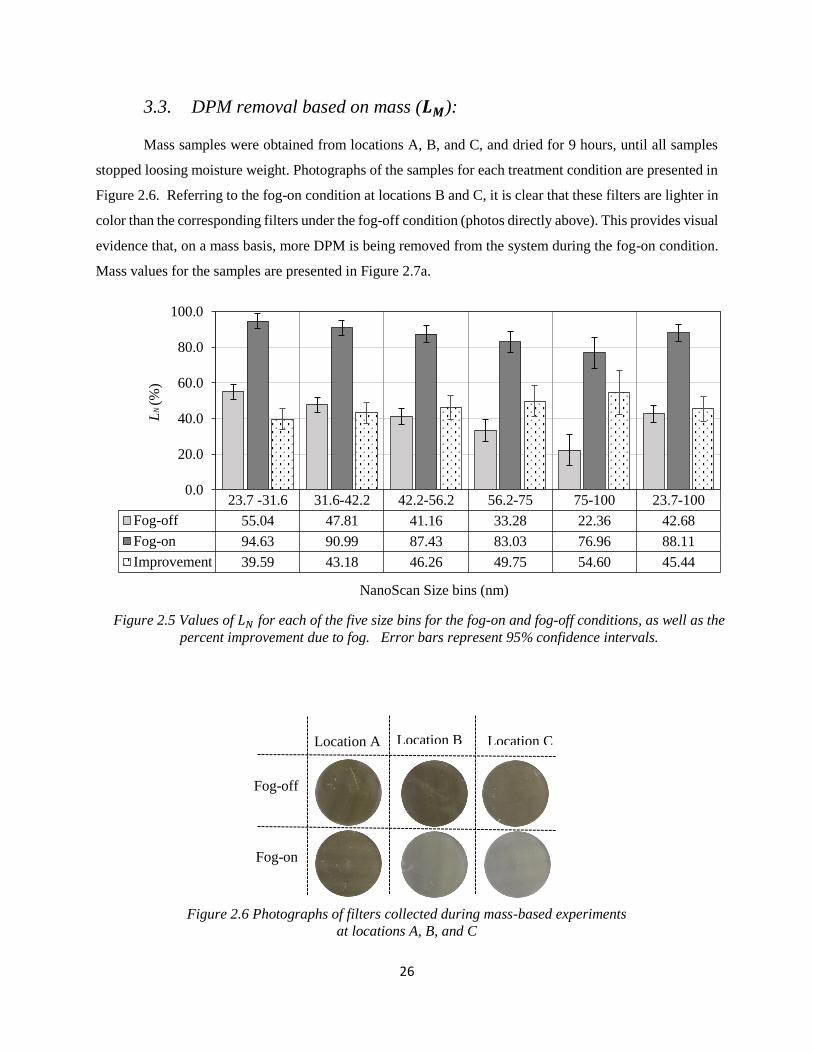
26
3.3. DPM removal based on mass (𝑳𝑴):
Mass samples were obtained from locations A, B, and C, and dried for 9 hours, until all samples
stopped loosing moisture weight. Photographs of the samples for each treatment condition are presented in
Figure 2.6. Referring to the fog-on condition at locations B and C, it is clear that these filters are lighter in
color than the corresponding filters under the fog-off condition (photos directly above). This provides visual
evidence that, on a mass basis, more DPM is being removed from the system during the fog-on condition.
Mass values for the samples are presented in Figure 2.7a.
23.7 -31.6 31.6-42.2 42.2-56.2 56.2-75 75-100 23.7-100
Fog-off 55.04 47.81 41.16 33.28 22.36 42.68
Fog-on 94.63 90.99 87.43 83.03 76.96 88.11
Improvement 39.59 43.18 46.26 49.75 54.60 45.44
0.0
20.0
40.0
60.0
80.0
100.0
LN
(%)
NanoScan Size bins (nm)
Fog-off
Fog-on
Location A Location B Location C
Figure 2.5 Values of 𝐿𝑁 for each of the five size bins for the fog-on and fog-off conditions, as well as the
percent improvement due to fog. Error bars represent 95% confidence intervals.
Figure 2.6 Photographs of filters collected during mass-based experiments
at locations A, B, and C
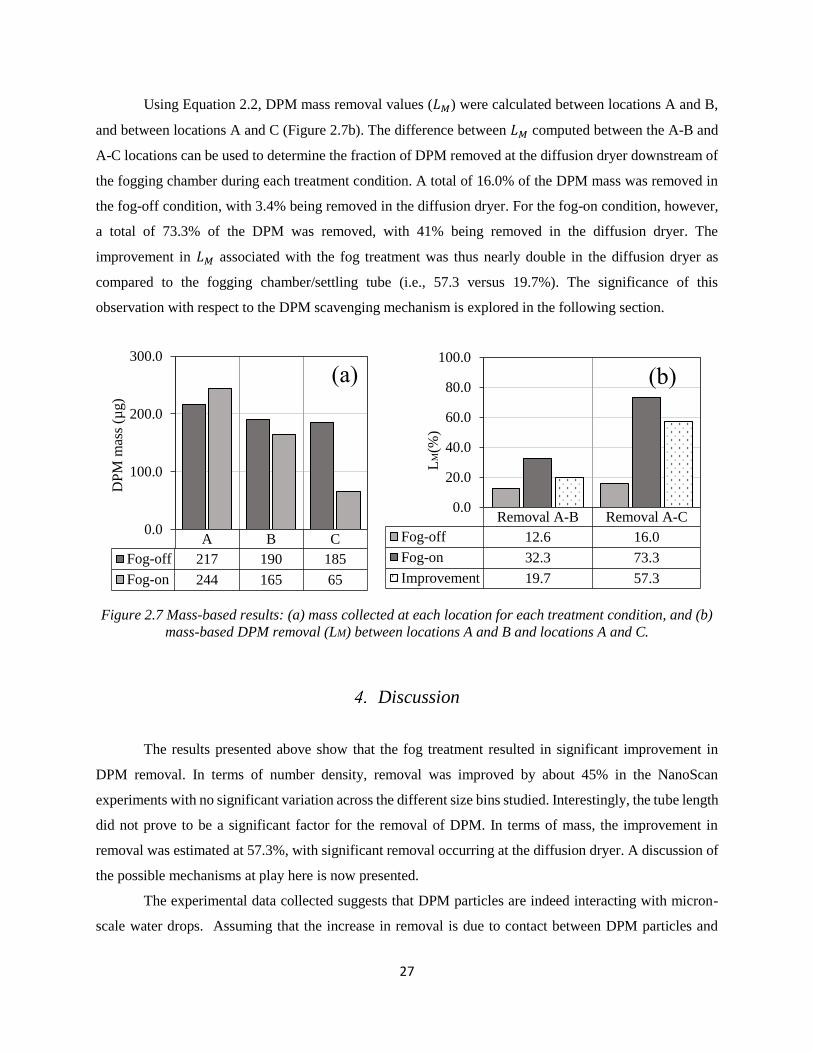
27
Using Equation 2.2, DPM mass removal values (𝐿𝑀) were calculated between locations A and B,
and between locations A and C (Figure 2.7b). The difference between 𝐿𝑀 computed between the A-B and
A-C locations can be used to determine the fraction of DPM removed at the diffusion dryer downstream of
the fogging chamber during each treatment condition. A total of 16.0% of the DPM mass was removed in
the fog-off condition, with 3.4% being removed in the diffusion dryer. For the fog-on condition, however,
a total of 73.3% of the DPM was removed, with 41% being removed in the diffusion dryer. The
improvement in 𝐿𝑀 associated with the fog treatment was thus nearly double in the diffusion dryer as
compared to the fogging chamber/settling tube (i.e., 57.3 versus 19.7%). The significance of this
observation with respect to the DPM scavenging mechanism is explored in the following section.
Discussion
The results presented above show that the fog treatment resulted in significant improvement in
DPM removal. In terms of number density, removal was improved by about 45% in the NanoScan
experiments with no significant variation across the different size bins studied. Interestingly, the tube length
did not prove to be a significant factor for the removal of DPM. In terms of mass, the improvement in
removal was estimated at 57.3%, with significant removal occurring at the diffusion dryer. A discussion of
the possible mechanisms at play here is now presented.
The experimental data collected suggests that DPM particles are indeed interacting with micron-
scale water drops. Assuming that the increase in removal is due to contact between DPM particles and
A B C
Fog-off 217 190 185
Fog-on 244 165 65
0.0
100.0
200.0
300.0
DP
M m
ass
(µg)
Removal A-B Removal A-C
Fog-off 12.6 16.0
Fog-on 32.3 73.3
Improvement 19.7 57.3
0.0
20.0
40.0
60.0
80.0
100.0
LM
(%)
(a) (b)
Figure 2.7 Mass-based results: (a) mass collected at each location for each treatment condition, and (b)
mass-based DPM removal (LM) between locations A and B and locations A and C.

28
water drops, then the resulting increases in 𝐿𝑁 and 𝐿𝑀 must occur by the subsequent removal of the particle-
containing drops. Possible mechanisms for removal of such drops include gravitational settling; impact of
the drops with the internal walls of the system due to inertial effects when the flow changes direction and/or
due to turbulence in the flow; and impact with the drying media in the diffusion dryer. Each of these is
explored in turn to ascertain their possible contribution to the observed results.
First, however, the means by which the particles come into contact with the drops must be
addressed. This combination, or coagulation, of particles with drops can occur through a variety of
mechanisms, but for the conditions explored in these experiments it is likely to be due to two main
mechanisms: kinematic coagulation and thermal coagulation30. Kinematic coagulation occurs as a result of
relative motion between particles and can occur due to differential settling between water droplets and
DPM, and/or as a result of turbulence in the system. Turbulence is not expected to be a significant factor
here as the Reynolds numbers for the chamber and the settling tube were estimated to be about 10 and 1000,
respectively. The rate of collisions between small and large particles due to differential settling is described
by30:
𝑑𝑁
𝑑𝑇=
𝜋
4𝑑𝑑
2𝑉𝑇𝑆𝑁𝐸 (2.3)
where, 𝑑𝑑 is the diameter of the water drop, 𝑉𝑇𝑆 is the relative velocity between drops and particles (i.e.,
terminal settling velocity), N is the number density of DPM particles, and E is the capture efficiency. E is
roughly proportional to the Stokes number, Stk, defined as:
𝑆𝑡𝑘 = 𝜌𝑝𝑑𝑝
2𝐶𝑐𝑉
18𝜂𝑑𝑑 (2.4)
where 𝜌𝑝 is the particle density, 𝑑𝑝is the particle diameter, 𝐶𝐶 is the slip correction factor and 𝜂 is the air
viscosity. A large Stokes number implies a higher probability of collection by impaction. The capture
efficiency is low except for the scenario where particles and drops are a few micrometers or larger 30.
Therefore, the effect of kinematic coagulation (due to impaction) should be negligible for the present system
with nanometer-scale DPM particles.
Thermal coagulation, on the other hand, is driven by Brownian motion of particles. Its effect is
significant for very small particles, and increases further in systems containing a combination of large and
small particles30 – such is the case here, where nanometer-scale DPM particles interact with micron-scale
water droplets. For this system, the rate of change in number density due to thermal coagulation can be
described by30:

29
𝑑𝑁
𝑑𝑡= − 𝐾𝑁2 (2.5)
where N is the total number density of the aerosol (i.e., DPM number density plus water drops number
density) and K is the coagulation coefficient. Equation (2.5) shows that the rate of collision is proportional
to the square of the concentration, meaning that the coagulation process is not linear and will be slowed
down as time progresses. K depends on the size of all particles involved and its calculation is complicated
for poly-dispersed aerosols.
DPM in the five specific size bins investigated above (i.e., 23.7-31.6; 31.6-42.2; 42.2-56.2; 56.2-
75; 75-100 nm) is considered. Assuming that DPM within each size bin is monodisperse (i.e., there are only
five particle sizes, which are taken as the geometric mean diameter in each bin: 27.4, 36.5,48.7, 64.9 and
86.6 nm) and also that all water drops are monodisperse (i.e., with diameter of 3.9 µm), a simplified analysis
on the fraction of DPM attaching to water droplets can be performed. The mean DPM concentration
(obtained from number density values measured at location A) for each size bin was 1.9 x 10⁵, 3.1 x 10⁵,
3.3 x 10⁵, 2.6 x 10⁵, and 1.5 x 10⁵ particles/cc, respectively; and that of the water droplets was
approximately 5.0 x 10⁵ drops/cc with a mean size of 3.9 µm.
Due to the relative size difference between water droplets and DPM particles the coagulation
coefficient can be calculated as:
𝐾𝑑−𝑖 ≅ 𝜋(𝑑𝑑𝐷𝑖) (2.6)
where 𝑑𝑑 is the diameter of the water drops and 𝐷𝑖 is the diffusivity coefficient for DPM in the ith size
interval:
𝐷𝑖 = 𝑘𝑇𝐶𝐶
3𝜋𝜂𝑑𝑖 (2.7)
where 𝑑𝑖 is the diameter of DPM in the ith size interval, 𝑘 is the Boltzmann’s constant and 𝑇 is the absolute
temperature. Based on the above, coagulation between water droplets and DPM particles should proceed
approximately 100 times faster than coagulation of DPM particles with each other, or water drops with each
other. Therefore, only the interactions between DPM and water drops will be considered. Integrating
Equation (2.5), the total concentration of DPM and water drops as a function of time can be obtained using:
𝑁(𝑡) =𝑁𝑜
1+𝐾𝑁𝑜∗𝑡 (2.8)

30
where NO is the total initial concentration obtained by summing DPM and water drop number densities
(for each bin size), and K is the coagulation coefficient for each drop-DPM size combination. Equation 2.8
was applied to the five DPM bin sizes of interest, and the concentration of DPM in the ith size bin was
calculated by:
𝑁𝑖(𝑡) =𝑁𝑜
1+𝐾𝑁𝑜∗𝑡− 𝑁𝑑 (2.9)
where 𝑁𝑑 is the water drop number density. Finally, the total DPM number density (across all size
bins) as a function of time, 𝑁𝐷𝑃𝑀(𝑡) was calculated by integrating Equation 2.9 to give:
𝑁𝐷𝑃𝑀(𝑡) = ∑ 𝑁𝑖(𝑡) 𝑖 (2.10)
For this analysis, it is assumed that once a DPM particle comes together with a water drop, the
particle remains attached (i.e., DPM-drop interaction is not reversible). Additionally, any change in
concentration is due to the effective disappearance of DPM particles and not water droplets, which should
essentially preserve their original size upon coagulation with a DPM particle.
The percent of DPM attaching to water droplets as a function of time can then estimated by
comparing the present DPM number density (i.e., airborne DPM in the system which is not attached to
water drops) to the original number density. Figure 2.8 shows the fraction of attachment expected during
the maximum residence time considered here (i.e., 65 seconds with the long settling tube), and the
corresponding DPM number density as a function of time (i.e., which is expected to decrease as DPM
particles attach to water drops). The residence time for the fogging chamber alone was calculated to be
about 43 s (i.e., dividing the total volume of the chamber and settling tube by the total flow rate through
them). Similarly, the residence time for each tube length was calculated to be 7 and 21 s for the short and
long tube, respectively.
Under the given conditions and assumptions, the fraction of particles attached to water droplets
reached an asymptotic value (i.e., near the unity) at about 40 s which means that no significant extra
attachment would be expected for increased residence time beyond this point, and therefore most of the
attachment occurs in the fogging chamber. At least with regard to the process of particles attaching to drops,
this may help to explain the insignificant effect of the tube length observed here.
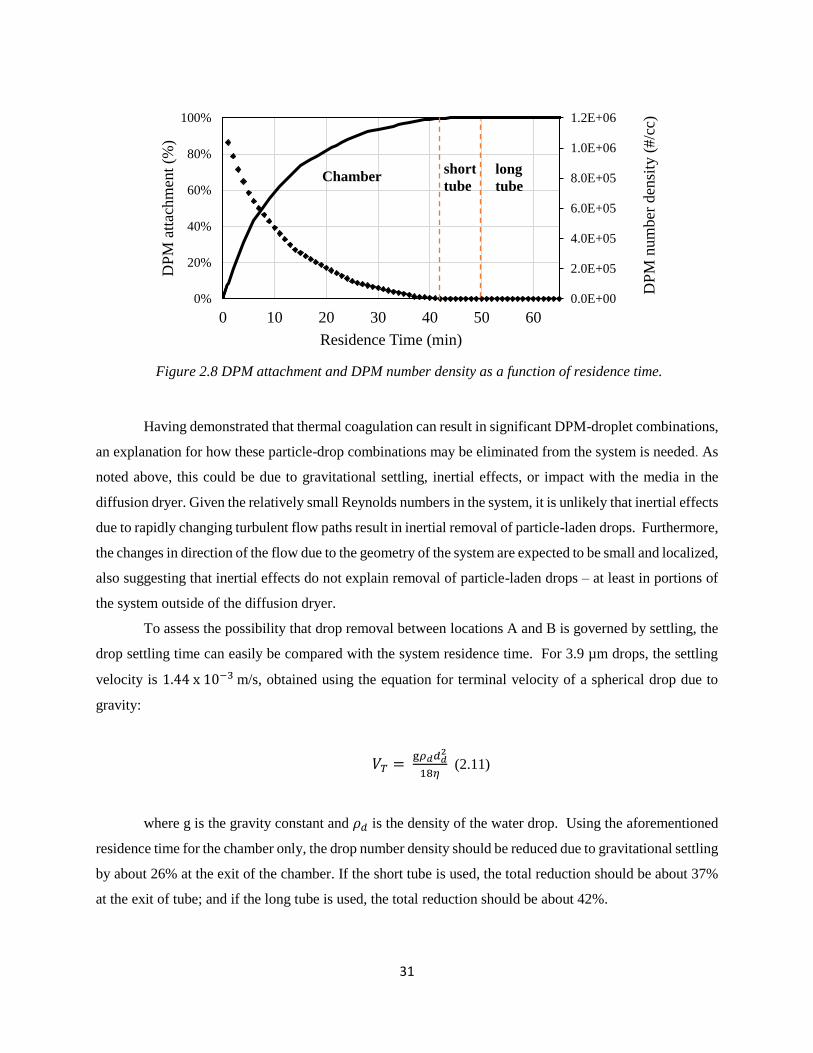
31
Having demonstrated that thermal coagulation can result in significant DPM-droplet combinations,
an explanation for how these particle-drop combinations may be eliminated from the system is needed. As
noted above, this could be due to gravitational settling, inertial effects, or impact with the media in the
diffusion dryer. Given the relatively small Reynolds numbers in the system, it is unlikely that inertial effects
due to rapidly changing turbulent flow paths result in inertial removal of particle-laden drops. Furthermore,
the changes in direction of the flow due to the geometry of the system are expected to be small and localized,
also suggesting that inertial effects do not explain removal of particle-laden drops – at least in portions of
the system outside of the diffusion dryer.
To assess the possibility that drop removal between locations A and B is governed by settling, the
drop settling time can easily be compared with the system residence time. For 3.9 µm drops, the settling
velocity is 1.44 x 10⁻³ m/s, obtained using the equation for terminal velocity of a spherical drop due to
gravity:
𝑉𝑇 = g𝜌𝑑𝑑𝑑
2
18𝜂 (2.11)
where g is the gravity constant and 𝜌𝑑 is the density of the water drop. Using the aforementioned
residence time for the chamber only, the drop number density should be reduced due to gravitational settling
by about 26% at the exit of the chamber. If the short tube is used, the total reduction should be about 37%
at the exit of tube; and if the long tube is used, the total reduction should be about 42%.
Figure 2.8 DPM attachment and DPM number density as a function of residence time.
0.0E+00
2.0E+05
4.0E+05
6.0E+05
8.0E+05
1.0E+06
1.2E+06
0%
20%
40%
60%
80%
100%
0 10 20 30 40 50 60
DP
M n
um
ber
den
sity
(#/c
c)
DP
M a
ttac
hm
ent
(%)
Residence Time (min)
Chamber short
tube
long
tube
32
Assuming that DPM-drop attachment is homogenous (i.e., the DPM is homogeneously distributed
among the drops) then the settling of each water drop should be associated with an incremental decrease in
DPM number density (and increase in DPM removal). Figure 2.8 indicates that, under the given
assumptions for the coagulation analysis, attachment is expected to near 100% by the time water drops
reach the exit of fogging chamber. In addition, a reduction of 42% in water drops is expected at the exit of
the long tube due to settling. Taken together, this would translate to an estimated removal of 42% occurring
between locations A and B. This value is higher than the observed 𝐿𝑀 value at location B during fog-on
conditions (i.e., 19% (Figure 2.7)). However, given the numerous assumptions made in this analysis, the
observed and theoretical values are in reasonable agreement – suggesting that the proposed two-step
mechanism (i.e., coagulation of DPM and water droplets, followed by settling and/or impaction of drops)
is a plausible explanation for the improvement in DPM removal seen between locations A and B.
Finally, removal of DPM-laden drops between locations B and C should be considered. The mass-
based results showed that significant removal occurs in the diffusion dryer, but only during the fog-on
conditions. This suggests that impaction of DPM-laden water drops with the solid surfaces of the diffusion
dryer is occurring. It is possible that drop impaction is happening due to diffusion alone (i.e., as might be
the case as the air flows through other system components). Additionally, as drops are pulled toward the
surfaces during drying, DPM may be pulled toward the walls making impaction more likely. While the
diffusion dryer (between locations B and C) was utilized here to enable number-based results (i.e., ensuring
the downstream NanoScan unit only counted DPM, not water droplets), its positive effect on the removal
of DPM from the system may indicate a possible application for such a device within a real treatment
system.
Though further work is required to confirm the exact mechanism for DPM removal shown here,
DPM-water droplet attachment followed by droplet removal provides a likely explanation. Given the
limited scope of results presented in this study, an investigation of additional conditions is necessary to
demonstrate the applicability of such a treatment for real diesel exhaust streams. Future research should
focus on raw exhaust and the effect of the treatment under shorter residence times, or higher exhaust
velocities, as this would better represent practical conditions. Other factors to consider in a scaled-up
treatment scheme include temperature, engine loading, pressure drop and water consumption.
33
Acknowledgments
The authors would like to thank the CDC/NIOSH office of Mine Safety and Health Research
(OMSHR) for funding this work (contract no. 200-2014-59646). Findings and conclusions expressed here
are those of the authors and do not necessarily represent those of OMSHR.
References
(1) United States Department of Labor. Diesel Exhaust/Diesel Particulate Matter;
https://www.osha.gov/dts/hazardalerts/diesel_exhaust_hazard_alert.html.
(2) Diesel Particulate Matter & Occupational Health Issues; Australian Institute of
Occupational Hygienists (AIOH): Tullamarine, Vic, AU., 2013;
https://www.aioh.org.au/documents/item/15.
(3) United States Environmental Protection Agency Website; Diesel Particulate Matter;
https://www3.epa.gov/region1/eco/airtox/diesel.html.
(4) Kittelson, D. B.; Engines and Nanoparticles: A Review. J. Aerosol Sci. 1997, 29 (5/6); DOI
10.1016/S0021-8502(97)10037-4.
(5) DieselNet Website; Diesel Exhaust Particle;
https://www.dieselnet.com/tech/dpm_size.php#intro.
(6) Diesel Aerosols and Gases in Underground Mines: Guide to Assessment exposure and
Control; U.S. Department of Health and Human Services, Public Health Service, Centers for Disease
Control and Prevention, National Institute for Occupational Safety and Health, DHHS (NIOSH):
Pittsburgh, PA, 2011; http://www.cdc.gov/niosh/mining/UserFiles/works/pdfs/2012-101.pdf.
(7) Bugarski, A. D.; Schanakenberg, G.H.; Hummer, J.A.; Cauda, E.; Janisko, S.J.; Patts, L.D.
Effects of Diesel Exhaust Aftertreatment Devices on Concentrations and Size Distribution of Aerosols in
Underground Mine Air. Environ. Sci. Technol. 2009, 43, 6737–6743; DOI 10.1021/es9006355.
(8) United States Department of Labor Website. Diesel Exhaust/Diesel Particulate Matter;
https://www.osha.gov/dts/hazardalerts/diesel_exhaust_hazard_alert.html.
(9) Noll, J. D.; Bugarski, A. D.; Patts, L. D.; Mischler, S. E.; McWilliams, L. Relationship
between Elemental Carbon, Total Carbon, and Diesel Particulate Matter in Several Underground Metal /
Non-metal Mines. Environ. Sci. Technol. 2007, 41, 710–716; DOI 10.1021/es061556a.
34
(10) Dockery, D. W.; Pope, A.; Xu, X.; Spengler; J.D.; Ware, J.H.; Fay, M.E.; Ferris, B.G.;
Speizer, F.E. An Association between Air Pollution and Mortality in Six U.S. cities. J. Med. 1996, 329,
1753–1759; DOI 10.1056/NEJM199312093292401.
(11) Pope, C. A.; Thun, M.J.; Namboodiri, M.M.; Dockery, D.W.; Evans, J.S.; Speizer, F.E.;
Heath, C.W. Particulate Air Pollution as a Predictor of Mortality in a Prospective Study of U.S. adults. Am.
J. Respir. Crit. Care. Med. 1995, 151, 669–674; DOI 10.1164/ajrccm/151.3_Pt_1.669.
(12) Warheit, D. B.; Seidel, W. C.; Carakostas, M. C.; Hartsky, M. A. Attenuation of
perfluoropolymer fume pulmonary toxicity: Effect of filters, combustion method, and aerosol age. Exp.
Mol. Pathol. 1990, 52(3), 309–329; DOI 10.1016/0014-4800(90)90072-L.
(13) Seaton, A.; MacNee, W.; Donaldson, K.; Godden, D. Particulate air pollution and acute
health effect. Lancet. 1995, 345(8943), 176-178 117 (1995). DOI 10.1016/S0140-6736(95)90173-6.
(14) Bugarski, A. D.; Cauda, E.; Janisko, S. J.; Hummer, J. A.; Patts, L. D. Aerosols Emitted in
Underground Mine Air by Diesel Engine Fueled with Biodiesel. J. Air. Waste. Manag. Assoc. 2010, 60(2),
237–244; DOI 10.3155/1047-3289.60.2.237.
(15) Grau, R. H.; Mucho, T.P.; Robertson, A.C.; Smith, A.C.; Garcia, F. Practical techniques to
improve the air quality in underground stone mines. Proc. 9th North Am. U.S. Mine Vent. Symp. 2002,
123–129; https://www.cdc.gov/niosh/mining/UserFiles/works/pdfs/ptoit.pdf.
(16) Noll, J. D.; Patts, L.; Grau, R.H. The effects of ventilation controls and environmental cabs
on diesel particulate matter concentrations in some limestone mines. Proc. 12th North Am. U.S. Mine Vent.
Symp. 2008, 463-468; http://www.cdc.gov/niosh/mining/UserFiles/works/pdfs/teovc.pdf.
(17) Grau, R. H.; Krog, R.B.; Robertson, S.B. Maximizing the ventilation of large-opening
mines. Proc. 11th North Am. U.S. Mine Vent. Symp. 2006, 53-60;
http://www.cdc.gov/niosh/mining/pubs/pubreference/outputid1979.htm.18.
(18) Grau, S.B.; Robertson, S. B.; Krog, R.B.; Chekan, G. J.; Mucho, T. P. Raising the Bar of
Ventilation for Large-Opening Stone Mines. Proc. 10th North Am. U.S. Mine Vent. Symp. 2004, 349-355;
http://www.cdc.gov/niosh/mining/works/coversheet445.html.
(19) Gomes, J.F.; Albuquerque, P.C.; Esteves, H.M.; Carvalho, P. A. Notice on a methodology
for characterizing emissions of ultrafine particles / nanoparticles in microenvironments. Energy and
Emissions Control Technologies. 2013, 1, 15–27; DOI 10.2147/EECT.S48148.
(20) Gomes, J.; Guerreiro, C.; Lavrador, D.; Carvalho, P. A.; Miranda, R.M.; TEM analysis as
a tool for toxicological assessment of occupational exposure to airborne nanoparticles from welding.
Microscopy and Microanalysis. 2013,19(4), 153–154; DOI 10.1017/S1431927613001384.
(21) Code of Federal Regulations Title 30 Part 57 Section 5066 (30CFR57.5060); Limit on
Exposure to Diesel Particulate Matter, 2013.
35
(22) Pollock, D.; Organiscak, J. Airborne Dust Capture and Induced Airflow of Various Spray
Nozzle Designs. Aerosol Sci. Technol. 2007, 41(7), 711–720; DOI 10.1080/02786820701408517.
(23) Kim, H.T.; Jung, C. H.; Oh, S. N.; Lee, K.W. Particle Removal Efficiency of Gravitational
Wet Scrubber Considering Diffusion, Interception, and Impaction. Environ. Eng. Sci. 2001, 18(2), 125–
136; DOI 10.1089/10928750151132357.
(24) Copeland, C.R. Suppression and Dispersion of Airborne Dust and Nanoparticulates. Ph.D.
Dissertation, Michigan Technological University, Houghton, MI, 2007.
(25) Ha, T.H.; Nishida, O.; Fujita, H.; Wataru, H. Simultaneous Removal of NOx and fine diesel
particulate matter (DPM) by electrostatic water spraying scrubber. J. Mar. Eng. Technol. 2009, 8(3), 45–
53 (2009); DOI 10.1080/20464177.2009.11020226.
(26) Best Practices for Dust Control in Metal / Nonmetal Mining; U.S. Department of Health
and Human Services, Public Health Service, Centers for Disease Control and Prevention, National Institute
for Occupational Safety and Health, DHHS (NIOSH): Pittsburgh, PA, 2010;
http://www.cdc.gov/niosh/mining/UserFiles/works/pdfs/2010-132.pdf
(27) Ran, W.; Saylor, J. R; Holt, R. G. Improved particle scavenging by a combination of
ultrasonics and water sprays. J. Aerosol Sci. 2014, 67, 104–118; DOI 10.1016/j.jaerosci.2013.08.009.
(28) D’Addio, L.; Di Natale, F.; Carotenuto, C., Scoppa, G.; Dessy, V.; Lancia, A. Removal of
Fine and Ultrafine Combustion Derived Particles in a Wet Electrostatic Scrubber. Proc. XXXVI Meeting
of the Italian Section of the Combustion Institute. 2013; http://www.combustion-
institute.it/proceedings/XXXVI-ASICI/papers/36proci2013.VI4.pdf.
(29) Tran, H.H.; Osami, N.; Hirotsugu, F.; Wataru, H. Prediction for Diesel Particulate Matter
(DPM) Collection Efficiency of Electrostatic Water Spraying Scrubber. Journal of the JIME. 2009, 44(5),
808-815; DOI 10.5988/jime.44.808.
(30) Hinds, W.C. Aerosol technology. Properties, Behavior and measurement of airborne
particle, 2nd, ed.; Wiley-Interscience: New York, 1999.

36
Chapter 3. DPM removal from an exhaust stream by fog drops under
variable engine loading, flow rate, and drop number density
L. Rojas-Mendoza a, E. Sarver a,*, J. R. Saylor b
𝑎 Virginia Tech, Department of Mining and Minerals, Blacksburg, VA 24060, USA
𝑏Clemson University, Department of Mechanical Engineering, Clemson, SC 29634, USA
Diesel particulate Matter (DPM) is a byproduct of fuel combustion in diesel engines. It is classified
as a carcinogen, with associated respiratory and cardiovascular health effects. The composition, size, and
concentration of DPM is dependent on factors such as engine type, loading and fuel composition. Prior
work has shown that micron-scale water or “fog” droplets can be used to scavenge DPM from a
concentrated air-stream; and the proposed mechanism in that work is via DPM attachment to droplets,
which then fall out of the air or impact with scrubber system surfaces. These steps should depend on factors
such as the size and number density of DPM and fog drops, and on the system flow rate and effective
residence time – each of which was tested in the work presented here. Under the range of conditions tested,
the influence of each of these factors on DPM removal was observed to be relatively small (or could not be
observed at all). However, across all test conditions, the overall improvement in DPM removal attributed
to the fog treatment (vs. no treatment) here was nearly 2-3x greater than that observed in prior work. This
may be due to increased humidity in the system (due to the undried exhaust), which could have resulted in
a larger water droplet size and therefore might explain more rapid settling of DPM-laden droplets. Another
possible contributing factor to the observed improvement is surface charge of the DPM, which could have
led to more efficient attachment between DPM and drops and/or increased deposition loses in the system.
Keywords: Diesel Particulate Matter, DPM, Diesel Engine, Engine Loading, Residence time, water
drops.
Introduction
Diesel engines have seen widespread use for well over a century due to their relatively high thermal
efficiency and fuel economy1. More recently, however, adverse health risks of diesel exhaust have become
increasingly clear. Many of these risks are associated with the physical and chemical properties of exhaust
components1–3. The term diesel particulate matter (DPM) is used to refer to the solid components of diesel
exhaust , which are a mixture of elemental and organic carbon (EC and OC) and minor constituents

37
including sulfates and metal ash 3. The OC fraction of DPM results from unburned fuel and lube oil,
whereas EC or soot is formed during the combustion of locally rich regions within the fuel, as a byproduct
of fuel rich combustion. DPM is classified as a carcinogen6,7 and epidemiological studies have
demonstrated a positive correlation between long-term exposure DPM and other combustion-related fine
particulate and increased cardiovascular and pulmonary diseases8,9.
Diesel engines operate in relative fuel rich/oxygen lean conditions and are characterized by
relatively high emissions of particulate as compared to spark-ignition engines2,3,10. Typically, these
emissions range from 107 − 109 𝑝𝑎𝑟𝑡𝑖𝑐𝑙𝑒𝑠/𝑐𝑐 and cover two primary size ranges: the nuclei mode where
particles have diameters less than about <50 nm, and the accumulation mode where diameters are from
about 50-10,000 nm. Most OC resides in the nuclei mode as semi-volatile compounds, while most EC is in
the accumulation mode3.
The physical and chemical properties of DPM vary with the type of engine, fuel (e.g., petro- vs.
bio-diesel) and operating conditions such as loading (i.e., a function of torque and rotational speed)2,3,9,11,12.
Loading is a particularly important factor with respect to DPM toxicity 9,13,14, and on the effectiveness of
after-treatment technologies2,3,15. Engine load alone can affect the EC/OC ratio, and the size distribution
and number density of DPM. For diesel engines, the load is roughly proportional to the equivalence ratio,
3 defined as the actual fuel/air ratio over the stoichiometric fuel/air ratio for complete combustion. Light
loads generally favor the formation of OC and small particles. As load is increased the volatiles are oxidized
leading to larger soot particles (i.e., EC), but lower total number density of DPM. With further loading, the
formation of soot offsets the decrease in volatiles, resulting in increased DPM mean size and number
density3.
Significant research has been conducted to develop after-treatment technologies for the abatement
and control of DPM16. However, implementation of such technologies is often hindered by operational
constrains and/or economics16. Moreover, the effectiveness of after-treatment technologies is generally
assessed in terms of DPM mass reduction, even though DPM size and number density may be critical
factors in terms of health implications3,8,16.
Previous research performed by the authors (Chapter 2) has demonstrated that, under certain
conditions, micron-scale water or “fog” droplets can significantly improve DPM removal from a
concentrated exhaust stream in terms of both mass and number concentration. In that work, the exhaust was
electrically neutralized and dried to enable measurements of DPM number density and size distribution up-
and down-stream from the fog treatment. The results suggested that DPM removal in the experimental
system was likely driven by coagulation between DPM and fog drops, followed by settling of the DPM-
laden drops. In that case, the size and number density of DPM and fog drops are important variables, since
they dictate the rate at which coagulation occurs. The time available for coagulation and settling within the
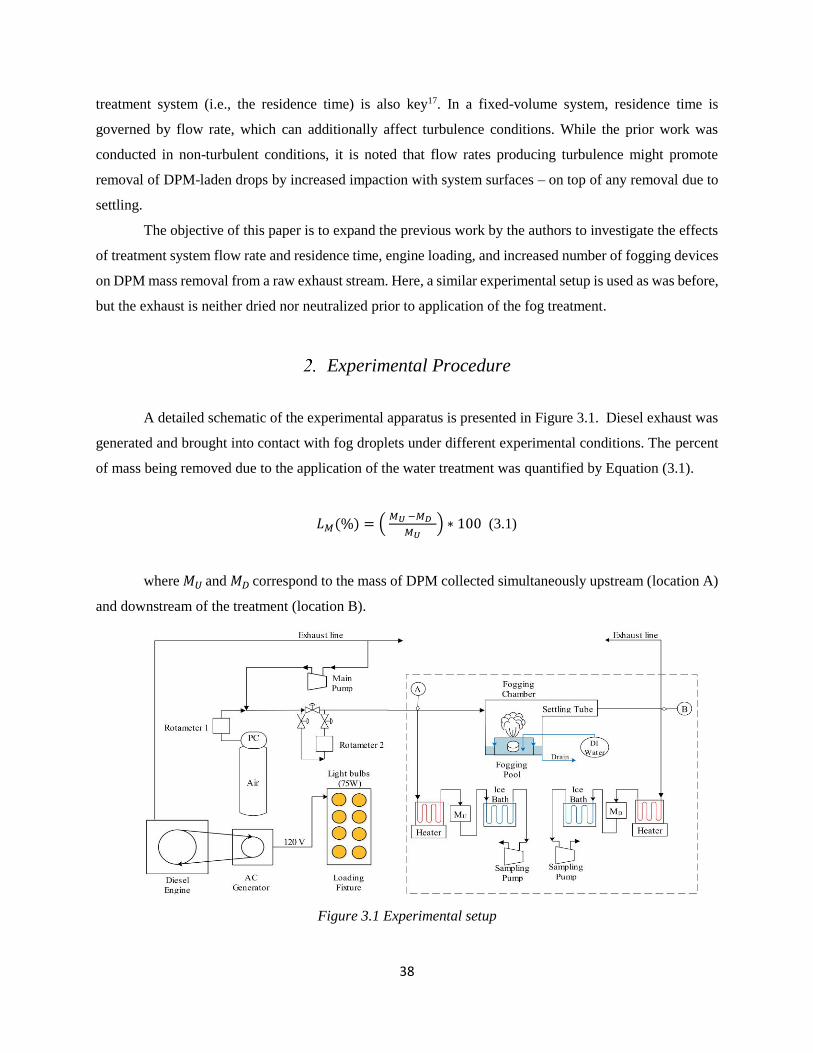
38
treatment system (i.e., the residence time) is also key17. In a fixed-volume system, residence time is
governed by flow rate, which can additionally affect turbulence conditions. While the prior work was
conducted in non-turbulent conditions, it is noted that flow rates producing turbulence might promote
removal of DPM-laden drops by increased impaction with system surfaces – on top of any removal due to
settling.
The objective of this paper is to expand the previous work by the authors to investigate the effects
of treatment system flow rate and residence time, engine loading, and increased number of fogging devices
on DPM mass removal from a raw exhaust stream. Here, a similar experimental setup is used as was before,
but the exhaust is neither dried nor neutralized prior to application of the fog treatment.
Experimental Procedure
A detailed schematic of the experimental apparatus is presented in Figure 3.1. Diesel exhaust was
generated and brought into contact with fog droplets under different experimental conditions. The percent
of mass being removed due to the application of the water treatment was quantified by Equation (3.1).
𝐿𝑀(%) = ( 𝑀𝑈 −𝑀𝐷
𝑀𝑈) ∗ 100 (3.1)
where 𝑀𝑈 and 𝑀𝐷 correspond to the mass of DPM collected simultaneously upstream (location A)
and downstream of the treatment (location B).
Figure 3.1 Experimental setup
39
A Kubota EA3300_E4_NB1 Engine (Charlotte, NC) with a maximum output of 5150 W (6.9 HP)
and a maximum speed of 3000 RPM was employed as the DPM source. The engine was coupled with a
portable belt-driven generator with a maximum output of 2900 W (3.9 HP). The generator operating speed
was 3480-3780 with available power outputs of 120V and 240V. In order to provide the generator with the
required speed a ratio of 1.7 between the engine and generator sheave diameters was used. Load was applied
to the engine by using incandescent light bulbs, each rated at 75 W (0.1 HP).
A diaphragm pump was used to take a fractional bleed-off of the raw diesel exhaust. Exhaust flow
was measured using a high precision rotameter, and was directed without any treatment (e.g., drying or
neutralizing) to the treatment area of the experimental setup (i.e., within the dashed line in Figure 3.1). This
consisted of the “fogging chamber” with sampling lines located just up and downstream. The fogging
chamber is a Plexiglas structure with two reservoirs (see Figure B.1 in Appendix B for detailed drawings).
The inner reservoir acts as water pool with a replacement rate of 0.9 L/min; this minimizes contamination
of the water surface from which fog droplets are generated. The outer reservoir provides the primary
treatment system volume (5637cm3), and includes a drain to continually remove water overflow from the
inner reservoir. An Alpine fogging device (Commerce, CA) is used to produce water droplets with an
estimated mean size of 3.9µm and a number density of about 5.0 x 10⁵ droplets/cc. The exhaust/fog mixture
exits the chamber through a 61cm long settling tube (913cm3).
Paired mass samples were collected at locations A and B on 37mm diameter, 0.2µm pore size
polycarbonate (PC) filters in standard 2-piece air sampling cassettes. Escort ELF pumps (Zefon, Ocala, FL)
calibrated to a flow rate of 1.7 L/min were used. Prior work showed that the capture efficiency under these
conditions was ~97% for all particles in the 10-400nm size range (See Chapter 2). In order for significant
DPM mass to be collected on the hygroscopic PC filter without stalling or flooding the sampling pump
(particularly at location B), a hot water bath was used upstream of the sample cassette to minimize liquid
water accumulating on the filter; and an ice bath was used downstream to promote condensation, which
was trapped before air entered the pump. This was done at both locations A and B to be consistent. Filters
were weighed before and after sample collection using a Sartorius Cubis MSE6.6S microbalance
(Göttingen, Germany). Sample moisture was removed by drying the samples in an over at 40 deg C for ten
hours. Sample mass was determined simply as the difference between the DPM-loaded dry filter and the
clean dry filter prior to sample collection.
Experiments were performed to independently vary engine load, flow rate, and fog droplet number
density (Table 3.1). Each experiment was conducted in a single engine run. The engine was warmed up for
60 minutes to reach a stable condition and ultrapure air was purged through the treatment system; then the
exhaust bleed off was directed through the treatment system and data collection commenced.

40
Table 3.1 Test conditions
Engine
Run
Flow
mode
Load
mode
Sequence of fog treatment conditions (no.
of devices) Sampling
time
(min)
Engine
RPM 1st 2nd 3rd 4th
1 HF HL ON (1) OFF ON (1) OFF* 60 2216
2 LF HL ON (1) OFF ON (1) OFF 60 2195
3 HF LL ON (1) OFF ON (1) OFF 60 2205
4 LF LL ON (1) OFF ON (1) OFF 60 2190
5 LF HL
ON (1) OFF ON (2) OFF
20 2216 ON (4) OFF ON (4) OFF
ON (1) OFF ON (2) OFF
*Sample was only collected for 30 minutes instead of 60 minutes.
All experiments were performed using the same fuel and under similar RPM (1.2<% difference).
In each experiment, mass samples were collected under two fogging conditions: when the fogger was on
(“ON”) and when it was off (“OFF”), in order to determine the overall effect of the fog treatment on DPM
removal (i.e., the improvement in 𝐿𝑀 between OFF and ON conditions). In the OFF condition, DPM losses
are attributed to deposition on system components (e.g., walls, fittings, tubing). In the ON condition, losses
are attributed to both deposition and scavenging by the water droplets.
To vary engine load, two modes were used. Low load (LL) was achieved by adding no load to the
engine (i.e., no light bulbs were used) and high load (HL) was achieved by illuminating 16 bulbs for a total
of approximately 1200 watts (1.6 HP). Prior to starting experiments (i.e., DPM mass collection), the DPM
size distribution under each loading condition was characterized. For this, number-resolved size
distributions were obtained (location A) using a NanoScan SMPS nanoparticle sizer 3910 (10-400nm) and
an Optical Particle sizer 3330 (300-10,000nm, OPS), both from TSI (Shoreview, MN). Dilution air was
necessary in order to obtain accurate number-resolved measurements. This reduced the number density of
particles in the exhaust stream to readable levels for the particle counters, and prevented condensation from
water in the exhaust. For the low load condition, a ratio of 3.7 L/min of diesel exhaust to 6.3 L/min of
dilution air was used. For the high load condition, a ratio of 3.1 L/min of diesel exhaust to 6.9 L/min of
dilution air was used.
As expected, increased loading resulted in higher DPM number densities and increased geometric
mean size. Measurements obtained with the NanoScan are shown in Figure 3.2. The average number density
and geometric mean size for the low load condition were 2.89 x 10⁶ ± 0.48 x 10⁶ #/cc and 44.22 ±
1.25 nm; and for the high load condition, they were 4.21 x 10⁶ ± 1.05 x 10⁶ #/cc and 61.16 ± 5.51 nm.
Measurements obtained with the OPS showed that all DPM was less than 1,000nm for both loading
conditions, and average number densities from the OPS were 8 (low load) and 3 (high load) orders of
magnitude less than those from the NanoScan. Assuming spherical particles and constant specific gravity

41
(i.e., across all sizes), then DPM in the OPS range should only account for about 0.2% and 2.2% of the total
mass concentration at low and high load, respectively. For this reason, it was considered insignificant for
analysis of experimental results reported here.
Figure 3.2 DPM size distribution at high load (HL) and low load (LL). Error bars are 95%
confidence intervals.
Two different residence times were tested by varying the exhaust flow rate (i.e., through the fixed
treatment system volume). Low flow (LF) mode was achieved with a total flow rate of 8.3 L/min (measured
at the inlet of the fogging chamber), and high flow (HF) used 18.3 L/min. Both flow rates were tested at
both engine loads.
The number of fogging devices was varied (i.e., 1, 2 or 4 devices operating simultaneously) in an
attempt to vary the water droplet number density. Each number of devices was tested under low flow, high
load conditions. In previous work (Chapter 2), estimates of the mean droplet diameter and droplet number
density from a single device (i.e., one of the 4 devices used here) were 3.9 µm and 5.0 x 10⁵ #/cc,
respectively. All four fogging devices came from the same production batch and were assumed to have
similar droplet characteristics.
Results
Equation 3.1 was applied to each pair of up- and down-stream mass measurements taken under a
given set of test conditions (i.e., a given load, low rate and number of fogging devices) in order to calculate
percent DPM removal (LM). For each test condition, an average 𝐿𝑀 value was then calculated for the fogger
ON and the fogger OFF treatment condition. The difference between these values is used to describe the
improvement in DPM removal attributed to the fog treatment. Figure 3.3 shows the results where engine
0.0E+00
2.0E+06
4.0E+06
6.0E+06
8.0E+06
1.0E+07
10 100 1000
dN
/dlo
g(D
p)
#/c
c
Particle Size (nm)
HL LL
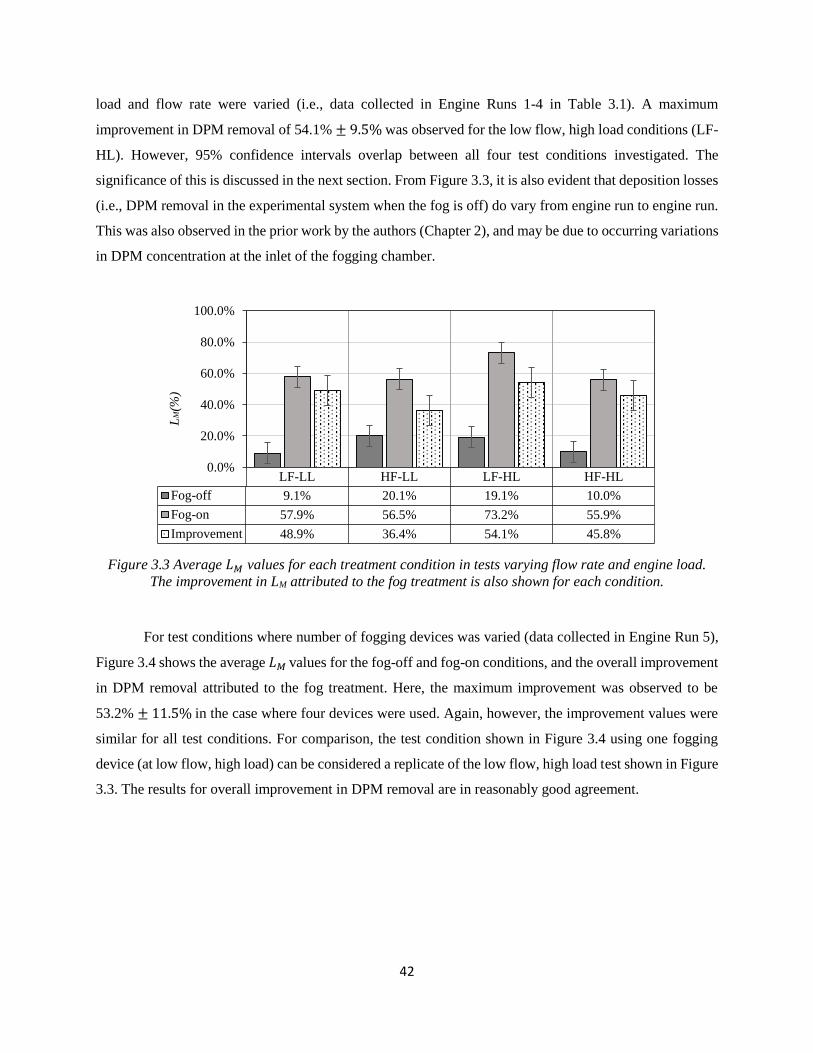
42
load and flow rate were varied (i.e., data collected in Engine Runs 1-4 in Table 3.1). A maximum
improvement in DPM removal of 54.1% ± 9.5% was observed for the low flow, high load conditions (LF-
HL). However, 95% confidence intervals overlap between all four test conditions investigated. The
significance of this is discussed in the next section. From Figure 3.3, it is also evident that deposition losses
(i.e., DPM removal in the experimental system when the fog is off) do vary from engine run to engine run.
This was also observed in the prior work by the authors (Chapter 2), and may be due to occurring variations
in DPM concentration at the inlet of the fogging chamber.
Figure 3.3 Average 𝐿𝑀 values for each treatment condition in tests varying flow rate and engine load.
The improvement in LM attributed to the fog treatment is also shown for each condition.
For test conditions where number of fogging devices was varied (data collected in Engine Run 5),
Figure 3.4 shows the average 𝐿𝑀 values for the fog-off and fog-on conditions, and the overall improvement
in DPM removal attributed to the fog treatment. Here, the maximum improvement was observed to be
53.2% ± 11.5% in the case where four devices were used. Again, however, the improvement values were
similar for all test conditions. For comparison, the test condition shown in Figure 3.4 using one fogging
device (at low flow, high load) can be considered a replicate of the low flow, high load test shown in Figure
3.3. The results for overall improvement in DPM removal are in reasonably good agreement.
LF-LL HF-LL LF-HL HF-HL
Fog-off 9.1% 20.1% 19.1% 10.0%
Fog-on 57.9% 56.5% 73.2% 55.9%
Improvement 48.9% 36.4% 54.1% 45.8%
0.0%
20.0%
40.0%
60.0%
80.0%
100.0%
LM
(%)

43
Figure 3.4 Average 𝐿𝑀 values for each treatment condition in tests varying number of fogging devices.
The improvement in LM attributed to the fog treatment is also shown for each condition.
Discussion
Across all test conditions investigated here, results presented in Figures 3.3 and 3.4 show that the
fogging treatment yielded an increased DPM mass removal versus no treatment. However, differences
between test conditions were generally subtle. This observation is explored below, and the analyses offered
assume that, as previously suggested (Chapter 2), the primary DPM removal mechanism involves at two
step process whereby DPM and fog droplets attach due to thermal coagulation, and then the DPM-laden
drops are removed by gravitational settling and/or impaction of with the surfaces in the system (i.e., due to
inertial effects).
To start, the DPM-drop coagulation rate is considered. Following a similar analysis to the one
performed in the discussion section of Chapter 2 (i.e., see Equations 2.8-2.10), the coagulation rate can be
predicted using the system residence time, and the fog droplet and DPM particles sizes and number
densities. The residence time of the fogging chamber and settling tube was calculated to be about 22 and
47 s for the low and high flow test conditions, respectively. For the case of a single fogging device, the
average droplet mean size was estimated to be 3.9 µm and the number density was estimated to be 5.0 x
105 droplets/cc. As a conservative estimate, the analysis below assumes that that the droplet mean size
remains constant and the number density doubles and quadruples for the case of two and four devices,
respectively, (i.e., 10 x 105 and 20 x 105 droplets/cc).
To estimate the DPM particle size distribution and number density, coagulation must be considered
between different sizes of DPM and the fog droplets. Number-resolved size distributions obtained for each
loading condition (see Figure 3.2) were used to estimate the percent attachment expected between DPM
1 Fogger 2 Foggers 4 Foggers
Fog-off 7.0% 7.0% 7.0%
Fog-on 53.1% 53.2% 60.3%
Improvement 46.0% 46.2% 53.2%
0.0%
20.0%
40.0%
60.0%
80.0%
100.0%
LM
(%)

44
and drops as a function of time. To simplify analysis, only the DPM contained in five size bins from the
NanoScan data was considered (i.e., such that coagulation could be calculated for just five combinations of
DPM and droplet sizes). The five bins were: 23.7-31.6, 31.6-42.2, 42.2-56.2, 56.2-75, 75-100nm; and
calculations were based on the geometric mean size from each bin. These bins accounted for 90 and 84%
of the total DPM particle count in the low and high load conditions, respectively.
Using the above values for residence time, and fog droplet and DPM sizes and number densities,
Figure 3.5 shows the fraction of DPM-drop attachment expected for the experimental conditions tested
here. Examining the influence of engine loading at high flow rate, the attachment is expected to be about
77% at low load (i.e., point 1 in Figure 3.5) and about 65% at high load (i.e., point 2). By shifting to low
flow rate, the expected attachment increases to about 96% at low load (i.e., point 3) and about 88% at high
load (i.e., point 4). Thus, the variation in engine load tested in the current work is only expected to change
coagulation of DPM and fog droplets by about 8-12%; and the variation in flow rate is only expected to
change coagulation by about 19-23%.
Similarly, Figure 3.5 illustrates that doubling or quadrupling the fog droplet number density at the
low flow rate and high engine load tested should only result in 10-12% increase in coagulation – and the
attachment with a single fogger under these conditions was likely already relatively high (i.e., 88%). So,
when considering just the coagulation step of the proposed DPM removal mechanism, it is perhaps not
surprising that only modest improvements (if any) were observed upon varying flow rate, engine load or
number of fogging devices.
Figure 3.5 DPM attachment as a function of residence time for different DPM and water drop
number densities.
0%
20%
40%
60%
80%
100%
0 10 20 30 40 50
DP
M A
ttac
hm
ent
(%)
Residence Time 1 fogger (LL) 1 fogger (HL) 2 foggers (HL) 4 foggers (HL)
High flow Low flow
1
2
3
4
45
Moving on to the second step of the proposed mechanism, removal of DPM-laden drops is
considered. Here, flow rate is expected to be the most significant variable and may influence drop removal
in two primary ways: affecting the residence time, which should have an impact on the fraction of drops
being removed due to gravitational settling; and affecting the turbulence conditions, which should influence
the likelihood of impaction of drops with system surfaces. For 3.9 µm drops, the settling velocity should
be 1.44 x 10⁻³ m/s, obtained using the equation for terminal velocity of a spherical drop due to gravity:
𝑉𝑇 = g𝜌𝑑𝑑𝑑
2
18𝜂 (3.2)
where g is the gravity constant, 𝜌𝑑 is the density of the water drop, 𝑑𝑑 is the drop mean diameter
and 𝜂 is the air viscosity. Accounting for the residence times tested (i.e., 22 and 47 s for the high and low
flow modes, respectively), gravitational settling should thus reduce the number of fog droplets by about 17
and 35% (i.e., calculated by comparing drop settling time with the system residence time) at the exit of the
settling tube for the high and low flow conditions, respectively. While this analysis indicates that
approximately doubling the flow rate should cut the drop removal rate in half, experimental results shown
here are relatively similar for the high and low flow conditions tested. This suggests that another removal
mechanism could be at play. Turbulence in the system, particularly during the high flow condition, may
provide a possible explanation.
For the low flow condition, the fogging chamber and settling tube had estimated Reynolds numbers
of 13 and 1136, respectively. Therefore, flow conditions were laminar and inertial removal (i.e., by
impaction) of DPM-laden drops is unlikely. However, for the high flow condition, the chamber and tube
had estimated Reynolds numbers of 30 and 2500, respectively. Thus, turbulent conditions in the settling
tube could have promoted impaction-related removal of DPM-laden drops, in addition to removal due to
gravitational settling.
Beyond comparisons between experimental conditions tested here, the results of the current work
are particularly noteworthy when compared with those observed in earlier work (Chapter 2). Here, the
improvement in DPM mass removal attributed to the fog treatment was on average about 45% across the
fogging chamber and settling tube (i.e., location A to B). In the prior study, the improvement attributed to
the treatment across the chamber and tube was only about 20%. The conditions for both studies are
summarized in Table 3.2.
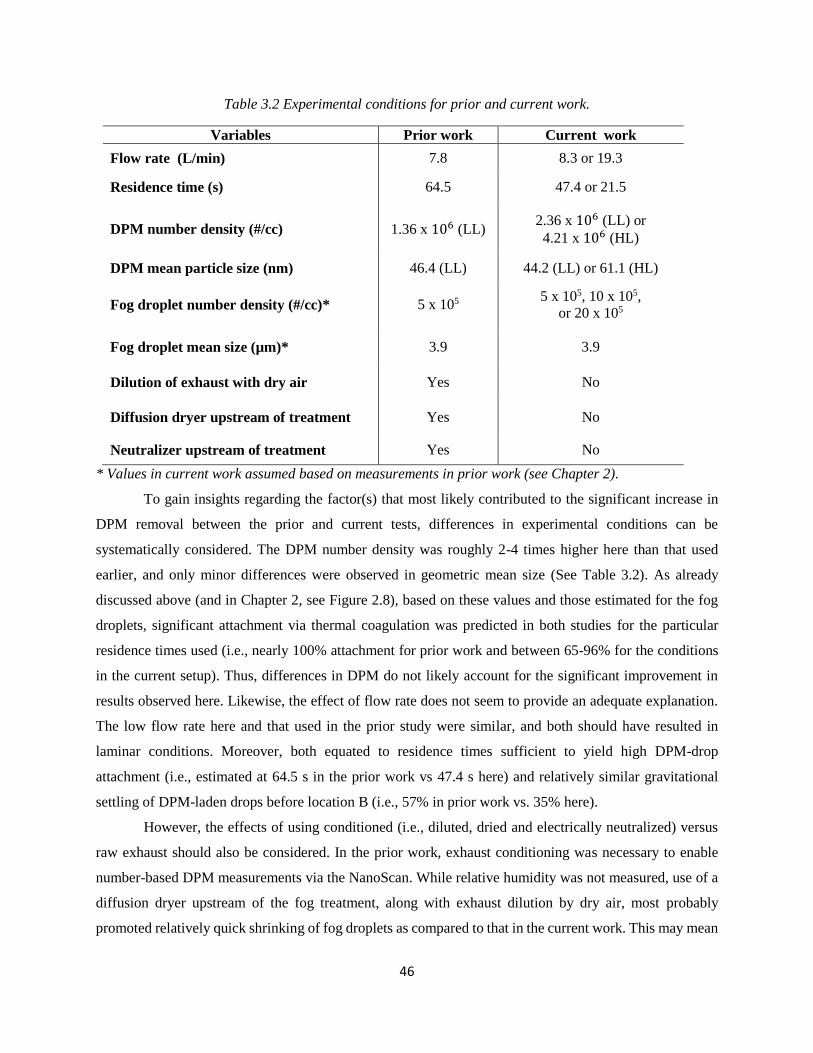
46
Table 3.2 Experimental conditions for prior and current work.
Variables Prior work Current work
Flow rate (L/min) 7.8 8.3 or 19.3
Residence time (s) 64.5 47.4 or 21.5
DPM number density (#/cc) 1.36 x 10⁶ (LL) 2.36 x 10⁶ (LL) or
4.21 x 10⁶ (HL)
DPM mean particle size (nm) 46.4 (LL) 44.2 (LL) or 61.1 (HL)
Fog droplet number density (#/cc)* 5 x 10⁵ 5 x 10⁵, 10 x 105,
or 20 x 105
Fog droplet mean size (µm)* 3.9 3.9
Dilution of exhaust with dry air Yes No
Diffusion dryer upstream of treatment Yes No
Neutralizer upstream of treatment Yes No
* Values in current work assumed based on measurements in prior work (see Chapter 2).
To gain insights regarding the factor(s) that most likely contributed to the significant increase in
DPM removal between the prior and current tests, differences in experimental conditions can be
systematically considered. The DPM number density was roughly 2-4 times higher here than that used
earlier, and only minor differences were observed in geometric mean size (See Table 3.2). As already
discussed above (and in Chapter 2, see Figure 2.8), based on these values and those estimated for the fog
droplets, significant attachment via thermal coagulation was predicted in both studies for the particular
residence times used (i.e., nearly 100% attachment for prior work and between 65-96% for the conditions
in the current setup). Thus, differences in DPM do not likely account for the significant improvement in
results observed here. Likewise, the effect of flow rate does not seem to provide an adequate explanation.
The low flow rate here and that used in the prior study were similar, and both should have resulted in
laminar conditions. Moreover, both equated to residence times sufficient to yield high DPM-drop
attachment (i.e., estimated at 64.5 s in the prior work vs 47.4 s here) and relatively similar gravitational
settling of DPM-laden drops before location B (i.e., 57% in prior work vs. 35% here).
However, the effects of using conditioned (i.e., diluted, dried and electrically neutralized) versus
raw exhaust should also be considered. In the prior work, exhaust conditioning was necessary to enable
number-based DPM measurements via the NanoScan. While relative humidity was not measured, use of a
diffusion dryer upstream of the fog treatment, along with exhaust dilution by dry air, most probably
promoted relatively quick shrinking of fog droplets as compared to that in the current work. This may mean

47
that the fog droplets in the current work were actually larger than was assumed here (i.e., that assumption
was based on earlier measurements in the experimental setup with dry air). Larger droplets are not expected
to dramatically change the DPM-drop attachment. For example, all else being equal, 7μm drops would
result in an expected attachment of about 97% at low flow and high load conditions in this setup, as
compared to the expected 88% assuming 3.9μm drops. However, larger drops would be subject to much
faster gravitational settling. Again taking 7μm drops as an example, removal due to settling would be about
88% at the exit of the settling tube at low flow conditions in this set up, as compared to just 35% assuming
3.9μm drops.
The fact that DPM particles in the current work retained their ambient surface charge versus being
neutralized in earlier work may also be a critical factor in the difference in observed results. Indeed,
previous research related to use of water spray treatments for removal of DPM (or other combustion-related
particulate) from concentrated air streams has indicated that results are significantly improved when
particles and water are oppositely charged (i.e., versus having the same or no charge)18,19. While this factor
has not been a specific focus of work by the authors to date, it seems plausible that ambient charge on the
DPM (and water, if the two are opposite in sign) may enhance DPM removal by the fog treatment described
here.
Acknowledgements
The authors thank the CDC/NIOSH Office of Mine Safety and Health Research (OMSHR) for
funding this work (contract no. 200-2014-59646). Views expressed here are those of the authors and do not
necessarily represent those of the funding agency. We also want to thank Zachary Henderson for supporting
data collection.
References
(1) Heywood, J.B. Internal combustion engine fundamentals. In: Duffy A, Morris JM, editors.
New York: McGraw: Hill, In.; 1988.
(2) El-Shobokshy, M.S. The Effect of Diesel Engine Load on Particulate Matter Carbon
Emission. Atmospheric Environment. 1994, 18(11), 2305-2311.
(3) Kittelson, D. B.; Engines and Nanoparticles: A Review. J. Aerosol Sci. 1997, 29 (5/6); DOI
10.1016/S0021-8502(97)10037-4.
48
(4) Seaton, A.; MacNee, W.; Donaldson, K.; Godden, D. Particulate air pollution and acute
health effect. Lancet. 1995, 345(8943), 176-178 117 (1995). DOI 10.1016/S0140-6736(95)90173-6.
(5) Warheit, D. B.; Seidel, W. C.; Carakostas, M. C.; Hartsky, M. A. Attenuation of
perfluoropolymer fume pulmonary toxicity: Effect of filters, combustion method, and aerosol age. Exp.
Mol. Pathol. 1990, 52(3), 309–329; DOI 10.1016/0014-4800(90)90072-
(6) Diesel Particulate Matter & Occupational Health Issues; Australian Institute of
Occupational Hygienists (AIOH): Tullamarine, Vic, AU., 2013;
https://www.aioh.org.au/documents/item/15.
(7) United States Department of Labor Website. Diesel Exhaust/Diesel Particulate Matter;
https://www.osha.gov/dts/hazardalerts/diesel_exhaust_hazard_alert.html.
(8) Pope, A.C.; Burnett, R.T.; Thun, M.J.; Calle, E.E.; Krewski, D.; Ito, K.; Thuston, G.D.
Lung Cancer, cardiopulmonary mortality and long-term exposure to fine particulate air pollution. J. Am.
Med. Assoc. 2002, 287 (9), 1132-1141.
(9) McDonal, J.D.; Campen, M.J.; Harrod, K.S.; Seagrave, J.C; Seilkop, S.K.; Mauderly; J.L.
Engine-Operating Load Influences Diesel Exhaust composition and Cardiopulmonary and Inmune
Responses. Environ Health Perspect. 2011, 119(8), 1136-1141.
(10) Fiebig, M.; Wiartalla, A.; Holderbaum, B.; Kiesow, S. Particulate emissions from diesel
engines: Correlation between engine technology and emissions. J. Occup Med Toxicol. 2014, 9(6); DOI
10.1186/1745-6673-9-6.
(11) Bugarski, A. D.; Cauda, E.; Janisko, S. J.; Hummer, J. A.; Patts, L. D. Aerosols Emitted in
Underground Mine Air by Diesel Engine Fueled with Biodiesel. J. Air. Waste. Manag. Assoc. 2010, 60(2),
237–244; DOI 10.3155/1047-3289.60.2.237.
(12) Huang, L.; Bohac, S.V.; Chernyak, S.M.; Batterman, S.A. Effects of fuels, engine load and
exhaust after treatment on diesel engine SVOC emissions and development of SVOC profiles for receptor
modeling. Atmos Environ. 2015, 102, 229-239; DOI 10.1016/j.atmosenv.2014.11.046.
(13) Stevens, T.; Cho, S.H.; Linak, W.P.; Gilmour, M.I. Differential potentiation of allergic
lung disease in mice exposed to chemically distinct diesel samples. Toxicol Sci. 2009, 107, 522-534.
(14) McDonald, J.D.; Harrod, K.S.; Seagrave, J.C.; Seilkop S.K.; Mauderly, J.L. Effects of low
sulful and a catalyzed particle trap on the composition and toxicity of diesel omissions. Environ Health
Perspect. 2004; 112, 1307-1312.
(15) An, H.; Yang, W.M.; Chou, S.K.; Chua, K.J. Combustion and emissions characteristics of
diesel engine fueled by biodiesel at partial load conditions. Applied Energy. 2012, 99, 363-371; DOI
10.1016/j.apenergy.2012.05.049.
49
(16) Bugarski, A. D.; Schanakenberg, G.H.; Hummer, J.A.; Cauda, E.; Janisko, S.J.; Patts, L.D. Effects
of Diesel Exhaust Aftertreatment Devices on Concentrations and Size Distribution of Aerosols in
Underground Mine Air. Environ. Sci. Technol. 2009, 43, 6737–6743; DOI 10.1021/es9006355
(17) Hinds, W.C. Aerosol technology. Properties, Behavior and measurement of airborne particle, 2nd,
ed.; Wiley-Interscience: New York, 1999.
(18) Ha, T.H.; Nishida, O.; Fujita, H.; Wataru, H. Simultaneous Removal of NOx and fine diesel
particulate matter (DPM) by electrostatic water spraying scrubber. J. Mar. Eng. Technol. 2009,
8(3), 45–53 (2009); DOI 10.1080/20464177.2009.11020226.
(19) D’Addio, L.; Di Natale, F.; Carotenuto, C., Scoppa, G.; Dessy, V.; Lancia, A. Removal of
Fine and Ultrafine Combustion Derived Particles in a Wet Electrostatic Scrubber. Proc.
XXXVI Meeting of the Italian Section of the Combustion Institute. 2013;
http://www.combustion-institute.it/proceedings/XXXVI-ASICI/papers/36proci2013.VI4.pdf.
50
Chapter 4. Conclusions and Future Work
For the conditions studied here, the fog treatment resulted in significant DPM removal. Both
number- and mass-based results indicated that under specific conditions airborne DPM can indeed be
removed from a concentrated air stream using micron-scale water droplets. Thermal coagulation between
DPM and fog drops, followed by gravitational settling and/or impaction of DPM-laden drops with system
surfaces, seems to provide a plausible explanation for observed results. Though these results appear
promising, investigation of such a fog treatment under more realistic conditions – such as shorter residence
times and higher velocities – is necessary to demonstrate the practicality and to explore potential directions
for scale up to field applications.
Two potential directions for scale up to field application have been envisioned. First, fog drops
could be used to treat diesel emissions at the source by designing a tailpipe scrubber. Second, fog drops
could be used as part of a local area treatment by designing a very large scrubber, through which high-DPM
air could be passed (e.g., large diameter ventilation tubing equipped with a series of internal fogging
devices). Each approach requires further research in order to identify the most critical challenges and/or
constraints, and then to devise and test initial prototypes.
Another possible option would be to couple a fogging treatment into an already existing tailpipe
technology, either as a means to further reduce DPM emissions or to enhance the lifetime of system
components. For instance, a water-bath conditioner system with a disposable filter element (DFE) could be
equipped with a number of inline fogging devices to collect DPM before it reaches the filter media. In a
DFE, the exhaust is directed into a water bath that acts to cool the exhaust, as well as eliminate flaming and
sparking risks. Downstream, a water trap is used to condense vapor and recycle it back to the bath, prior to
filtering of the exhaust stream. Use of a fogging treatment in combination with the bath could potentially
increase the life of the DFE by promoting some DPM removal upstream. Because this approach involves
modifying an already accepted and commercialized technology, it may also represent a relatively simple
way to demonstrate the benefits of a fog treatment.
Evaluating the efficacy as well as the economic, environmental, and practical feasibility of these
options using fundamental theories and calculations should be a first step. Analysis should attempt to
determine which alternatives, if any, are well-suited for use in industry.

51
Appendix A. Chapter 2 Supplemental Data
Figure A.1. DPM number density time traces at locations A and C including the total of all particle between
10-420 nm.
Table A.1 Average DPM removal coefficients (𝐿𝑁) for each fog treatment condition.
Engine
Run/Tube
length
N
Fog treatment test
1st 2nd 3rd 4th
1-long 20 89.9%
(ON)
55.3%
(OFF)
55.3%
(OFF)
90.1%
(ON)
2-short 20 84.3%
(ON)
32.9%
(OFF)
83.9%
(ON)
34.1%
(OFF)
3-short 20 45.1%
(OFF)
89.4%
(ON)
88.8%
(ON)
46.9%
(OFF)
4-short 20 89.9%
(ON)
37.5%
(OFF)
89.8%
(ON)
37.5%
(OFF)
0.0E+00
5.0E+05
1.0E+06
1.5E+06
2.0E+06
1 2 3 4 5 6 7 8 9 10 11 12 13 14 15 16 17 18 19 20
#/c
c
1-minute measurement
Engine 4
0.0E+00
5.0E+05
1.0E+06
1.5E+06
2.0E+06
1 6 11 16
#/c
c
1-minute measurement
Engine run 2
Location A
Location C
0.0E+00
5.0E+05
1.0E+06
1.5E+06
2.0E+06
1 2 3 4 5 6 7 8 9 10 11 12 13 14 15 16 17 18 19 20
#/c
c
1-minute measurement
Engine run 3
ON OFF OFF ON ON OFF ON OFF
0.0E+00
5.0E+05
1.0E+06
1.5E+06
2.0E+06
1 6 11 16
#/c
c
1-minute measurement
Engine run 1
ON OFF ON OFF OFF ON ON OFF
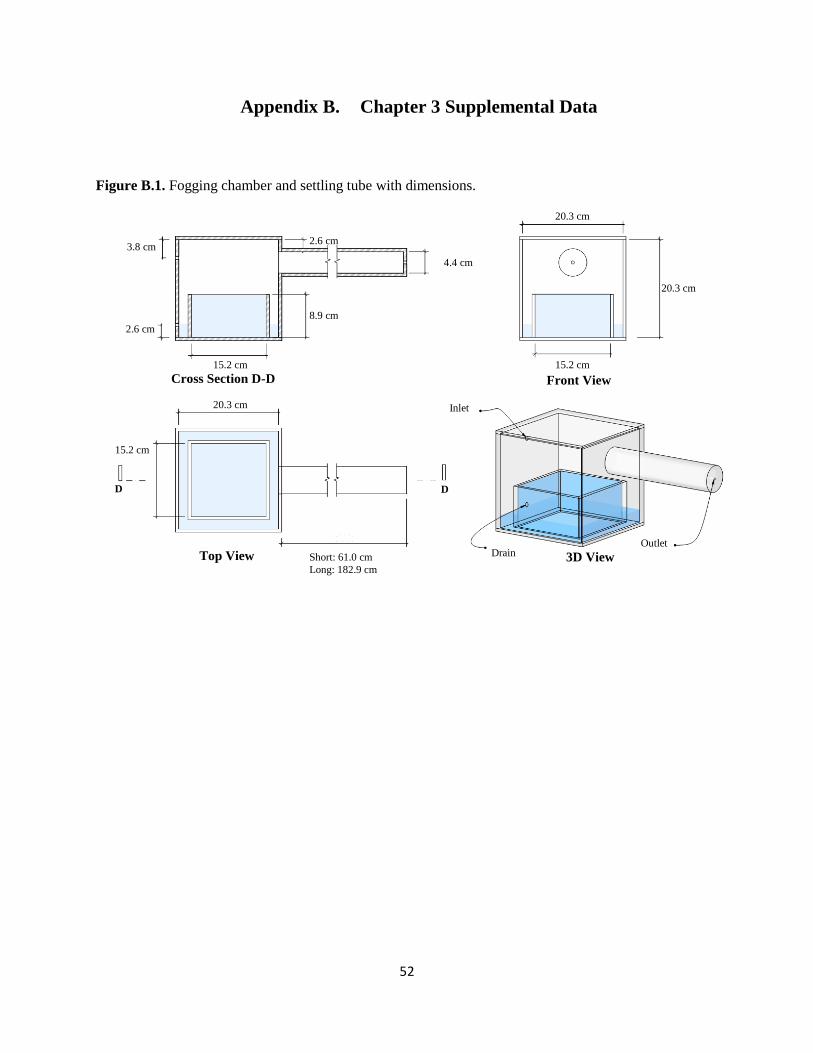
52
Appendix B. Chapter 3 Supplemental Data
Figure B.1. Fogging chamber and settling tube with dimensions.
3.8 cm
2.6 cm
15.2 cm
8.9 cm
2.6 cm
4.4 cm
20.3 cm
15.2 cm
20.3 cm
20.3 cm
15.2 cm
Short: 61.0 cm Long: 182.9 cm
Top View 3D View
Cross Section D-D Front View
D D
Inlet
Outlet Drain

53
Appendix C. Supplemental Data Chapters 2 and 3
Table C.1 Number-based measurements for different fog treatment tests (Chapter 2). Engine run #1
Engine
Run / Tube
Length
Fog
treatment
test
Sample
NanoScan #1 - Location A
Size bins (nm) / Number density (#/cc) Total number density (#/cc)
Geo Mean (nm)
GSD 10-13.3 13.3-17.8 17.8-23.7 23.7-31.6 31.6-42.2 42.2-56.2 56.2-75 75-100 100-133.4 133.4-177.8 177.8-237.1 237.1-316.2 316.2-420
1 - long
ON
1 1.82E+04 6.45E+03 3.62E+04 1.79E+05 2.98E+05 3.22E+05 2.50E+05 1.36E+05 3.37E+04 0.00E+00 0.00E+00 0.00E+00 0.00E+00 1.28E+06 45.95 1.55
2 1.34E+04 8.55E+03 4.69E+04 1.80E+05 2.72E+05 2.78E+05 2.10E+05 1.20E+05 4.00E+04 0.00E+00 0.00E+00 0.00E+00 0.00E+00 1.17E+06 45.19 1.57
3 2.07E+04 3.60E+03 3.11E+04 1.84E+05 3.27E+05 3.78E+05 3.19E+05 1.96E+05 6.64E+04 0.00E+00 0.00E+00 0.00E+00 0.00E+00 1.53E+06 48.74 1.56
4 1.52E+04 9.33E+03 5.22E+04 2.03E+05 3.12E+05 3.21E+05 2.42E+05 1.33E+05 3.77E+04 0.00E+00 0.00E+00 0.00E+00 0.00E+00 1.32E+06 44.96 1.56
5 1.95E+04 4.89E+03 3.01E+04 1.72E+05 2.97E+05 3.35E+05 2.74E+05 1.63E+05 5.02E+04 0.00E+00 0.00E+00 0.00E+00 0.00E+00 1.35E+06 47.68 1.56
OFF
1 2.49E+04 4.34E+02 1.66E+04 1.68E+05 3.05E+05 3.48E+05 2.85E+05 1.67E+05 4.92E+04 0.00E+00 0.00E+00 0.00E+00 0.00E+00 1.37E+06 48.19 1.55
2 1.81E+04 2.43E+03 2.88E+04 1.65E+05 2.89E+05 3.33E+05 2.87E+05 1.86E+05 7.41E+04 0.00E+00 0.00E+00 0.00E+00 0.00E+00 1.38E+06 49.47 1.57
3 2.42E+04 1.64E+03 1.48E+04 1.58E+05 3.05E+05 3.61E+05 3.04E+05 1.78E+05 5.04E+04 0.00E+00 0.00E+00 0.00E+00 0.00E+00 1.40E+06 48.88 1.54
4 2.22E+04 2.61E+03 2.43E+04 1.73E+05 3.08E+05 3.45E+05 2.74E+05 1.50E+05 3.45E+04 0.00E+00 0.00E+00 0.00E+00 0.00E+00 1.33E+06 46.95 1.54
5 2.03E+04 0.00E+00 2.40E+04 1.67E+05 2.88E+05 3.13E+05 2.42E+05 1.29E+05 2.77E+04 0.00E+00 0.00E+00 0.00E+00 0.00E+00 1.21E+06 46.28 1.53
OFF
1 1.64E+04 7.65E+03 5.11E+04 2.05E+05 3.20E+05 3.36E+05 2.62E+05 1.53E+05 5.24E+04 0.00E+00 0.00E+00 0.00E+00 0.00E+00 1.40E+06 46.07 1.57
2 1.74E+04 4.98E+03 4.60E+04 2.04E+05 3.11E+05 3.13E+05 2.27E+05 1.19E+05 3.05E+04 0.00E+00 0.00E+00 0.00E+00 0.00E+00 1.27E+06 44.42 1.54
3 1.93E+04 1.08E+04 4.58E+04 2.00E+05 3.25E+05 3.58E+05 2.98E+05 1.92E+05 7.85E+04 0.00E+00 0.00E+00 0.00E+00 0.00E+00 1.53E+06 47.94 1.59
4 1.87E+04 6.05E+03 4.64E+04 2.10E+05 3.40E+05 3.63E+05 2.81E+05 1.57E+05 4.42E+04 0.00E+00 0.00E+00 0.00E+00 0.00E+00 1.47E+06 46.00 1.55
5 2.46E+04 3.86E+03 4.10E+04 2.27E+05 3.63E+05 3.79E+05 2.89E+05 1.64E+05 5.24E+04 0.00E+00 0.00E+00 0.00E+00 0.00E+00 1.55E+06 46.02 1.56
ON
1 1.84E+04 4.57E+03 3.61E+04 1.81E+05 3.03E+05 3.36E+05 2.78E+05 1.75E+05 6.81E+04 0.00E+00 0.00E+00 0.00E+00 0.00E+00 1.40E+06 48.17 1.57
2 1.29E+04 8.61E+03 4.98E+04 1.86E+05 2.83E+05 2.90E+05 2.16E+05 1.15E+05 3.05E+04 0.00E+00 0.00E+00 0.00E+00 0.00E+00 1.19E+06 44.57 1.55
3 2.08E+04 6.42E+03 4.03E+04 2.02E+05 3.33E+05 3.60E+05 2.86E+05 1.66E+05 5.15E+04 0.00E+00 0.00E+00 0.00E+00 0.00E+00 1.47E+06 46.69 1.56
4 1.86E+04 6.36E+03 4.40E+04 2.02E+05 3.23E+05 3.45E+05 2.71E+05 1.59E+05 5.46E+04 0.00E+00 0.00E+00 0.00E+00 0.00E+00 1.42E+06 46.54 1.57
5 1.88E+04 7.63E+03 4.80E+04 2.11E+05 3.32E+05 3.50E+05 2.71E+05 1.56E+05 5.02E+04 0.00E+00 0.00E+00 0.00E+00 0.00E+00 1.45E+06 45.98 1.56
Fog
treatment
test
Sample
NanoScan #2 - Location C
Size bins (nm) / Number density (#/cc) Total number density (#/cc)
Geo Mean (nm)
GSD 10-13.3 13.3-17.8 17.8-23.7 23.7-31.6 31.6-42.2 42.2-56.2 56.2-75 75-100 100-133.4 133.4-177.8 177.8-237.1 237.1-316.2 316.2-420
ON
1 4.15E+03 2.63E+03 0.00E+00 7.04E+03 2.16E+04 3.19E+04 3.17E+04 2.15E+04 8.18E+03 0.00E+00 0.00E+00 0.00E+00 0.00E+00 1.29E+05 52.34 1.64
2 4.27E+03 2.48E+03 0.00E+00 6.96E+03 2.34E+04 3.53E+04 3.49E+04 2.32E+04 8.38E+03 0.00E+00 0.00E+00 0.00E+00 0.00E+00 1.39E+05 52.66 1.62
3 3.85E+03 2.34E+03 0.00E+00 6.84E+03 2.24E+04 3.42E+04 3.47E+04 2.38E+04 8.90E+03 0.00E+00 0.00E+00 0.00E+00 0.00E+00 1.37E+05 53.45 1.61
4 4.02E+03 2.33E+03 0.00E+00 6.89E+03 2.30E+04 3.50E+04 3.52E+04 2.38E+04 8.66E+03 0.00E+00 0.00E+00 0.00E+00 0.00E+00 1.39E+05 53.19 1.61
5 3.50E+03 1.97E+03 0.00E+00 6.50E+03 2.14E+04 3.21E+04 3.15E+04 2.02E+04 6.44E+03 0.00E+00 0.00E+00 0.00E+00 0.00E+00 1.24E+05 52.38 1.60
OFF
1 1.14E+04 0.00E+00 6.12E+03 7.48E+04 1.38E+05 1.56E+05 1.24E+05 6.74E+04 1.49E+04 0.00E+00 0.00E+00 0.00E+00 0.00E+00 5.92E+05 47.31 1.53
2 1.08E+04 1.47E+02 5.82E+03 7.03E+04 1.38E+05 1.63E+05 1.34E+05 7.45E+04 1.62E+04 0.00E+00 0.00E+00 0.00E+00 0.00E+00 6.13E+05 48.28 1.53
3 1.10E+04 2.11E+02 5.46E+03 6.99E+04 1.35E+05 1.58E+05 1.29E+05 7.09E+04 1.49E+04 0.00E+00 0.00E+00 0.00E+00 0.00E+00 5.94E+05 47.96 1.53
4 1.11E+04 1.21E+02 5.34E+03 7.06E+04 1.37E+05 1.62E+05 1.34E+05 7.59E+04 1.78E+04 0.00E+00 0.00E+00 0.00E+00 0.00E+00 6.15E+05 48.45 1.53
5 9.25E+03 6.31E+02 8.72E+03 7.00E+04 1.31E+05 1.51E+05 1.22E+05 6.51E+04 1.17E+04 0.00E+00 0.00E+00 0.00E+00 8.65E+02 5.70E+05 47.42 1.53
OFF
1 9.65E+03 1.46E+03 1.19E+04 7.89E+04 1.41E+05 1.59E+05 1.27E+05 7.08E+04 1.76E+04 0.00E+00 0.00E+00 0.00E+00 0.00E+00 6.17E+05 47.20 1.54
2 1.03E+04 1.25E+03 1.25E+04 8.37E+04 1.44E+05 1.56E+05 1.19E+05 6.17E+04 1.18E+04 0.00E+00 0.00E+00 0.00E+00 4.69E+02 6.00E+05 45.88 1.54
3 1.07E+04 1.10E+03 1.10E+04 8.24E+04 1.48E+05 1.65E+05 1.30E+05 6.94E+04 1.40E+04 0.00E+00 0.00E+00 0.00E+00 3.27E+02 6.32E+05 46.75 1.53
4 1.22E+04 8.01E+02 9.07E+03 8.45E+04 1.55E+05 1.76E+05 1.40E+05 7.46E+04 1.46E+04 0.00E+00 0.00E+00 0.00E+00 4.20E+02 6.67E+05 47.04 1.53
5 1.09E+04 6.16E+02 9.90E+03 8.16E+04 1.54E+05 1.82E+05 1.52E+05 8.83E+04 2.32E+04 0.00E+00 0.00E+00 0.00E+00 0.00E+00 7.03E+05 48.58 1.54
ON
1 2.33E+03 1.05E+03 3.11E+02 8.62E+03 2.15E+04 3.02E+04 2.96E+04 2.04E+04 8.31E+03 0.00E+00 0.00E+00 0.00E+00 0.00E+00 1.22E+05 53.48 1.58
2 1.53E+03 8.36E+02 9.65E+02 7.86E+03 1.94E+04 3.20E+04 3.93E+04 3.68E+04 2.27E+04 4.29E+03 0.00E+00 0.00E+00 0.00E+00 1.66E+05 63.10 1.60
3 2.93E+03 9.62E+02 0.00E+00 1.03E+04 2.52E+04 3.44E+04 3.24E+04 2.15E+04 8.26E+03 0.00E+00 0.00E+00 0.00E+00 0.00E+00 1.36E+05 52.54 1.57
4 2.37E+03 9.07E+02 0.00E+00 8.61E+03 2.21E+04 3.11E+04 3.01E+04 2.04E+04 7.91E+03 0.00E+00 0.00E+00 0.00E+00 0.00E+00 1.24E+05 53.43 1.57
5 2.74E+03 1.24E+03 2.14E+02 9.47E+03 2.36E+04 3.27E+04 3.14E+04 2.10E+04 7.82E+03 0.00E+00 0.00E+00 0.00E+00 0.00E+00 1.30E+05 52.61 1.58

54
Table C.2 Number-based measurements for different fog treatment tests (Chapter 2). Engine run #2
Engine Run / Tube Length
Fog treatment
test Sample
NanoScan #1 - Location A
Size bins (nm) / Number density (#/cc) Total number density (#/cc)
Geo Mean (nm)
GSD 10-13.3 13.3-17.8 17.8-23.7 23.7-31.6 31.6-42.2 42.2-56.2 56.2-75 75-100 100-133.4 133.4-177.8 177.8-237.1 237.1-316.2 316.2-420
2 - short
ON
1 1.62E+04 6.35E+03 4.98E+04 2.06E+05 3.19E+05 3.35E+05 2.63E+05 1.59E+05 5.95E+04 0.00E+00 0.00E+00 0.00E+00 0.00E+00 1.41E+06 46.50 1.57
2 2.20E+04 5.41E+03 3.76E+04 2.01E+05 3.28E+05 3.51E+05 2.75E+05 1.60E+05 5.18E+04 0.00E+00 0.00E+00 0.00E+00 0.00E+00 1.43E+06 46.54 1.56
3 1.89E+04 4.21E+03 3.64E+04 1.86E+05 3.10E+05 3.40E+05 2.74E+05 1.62E+05 5.28E+04 0.00E+00 0.00E+00 0.00E+00 0.00E+00 1.38E+06 47.25 1.56
4 1.50E+04 8.37E+03 5.03E+04 1.96E+05 3.02E+05 3.12E+05 2.37E+05 1.32E+05 3.66E+04 0.00E+00 0.00E+00 0.00E+00 0.00E+00 1.29E+06 45.10 1.56
5 1.66E+04 4.47E+03 3.61E+04 1.74E+05 2.88E+05 3.16E+05 2.57E+05 1.56E+05 5.51E+04 0.00E+00 0.00E+00 0.00E+00 0.00E+00 1.30E+06 47.52 1.57
OFF
1 1.75E+04 8.32E+03 3.67E+04 1.73E+05 2.96E+05 3.39E+05 2.89E+05 1.84E+05 7.08E+04 0.00E+00 0.00E+00 0.00E+00 0.00E+00 1.41E+06 48.67 1.58
2 1.93E+04 6.27E+03 3.25E+04 1.73E+05 3.00E+05 3.42E+05 2.88E+05 1.82E+05 6.93E+04 0.00E+00 0.00E+00 0.00E+00 0.00E+00 1.41E+06 48.65 1.57
3 1.48E+04 9.34E+03 4.83E+04 1.88E+05 2.88E+05 2.96E+05 2.22E+05 1.21E+05 3.26E+04 0.00E+00 0.00E+00 0.00E+00 0.00E+00 1.22E+06 44.74 1.56
4 2.02E+04 6.04E+03 4.32E+04 2.07E+05 3.43E+05 3.76E+05 3.03E+05 1.82E+05 6.32E+04 0.00E+00 0.00E+00 0.00E+00 0.00E+00 1.54E+06 47.30 1.57
5 1.69E+04 1.17E+04 5.16E+04 2.04E+05 3.25E+05 3.46E+05 2.68E+05 1.48E+05 3.95E+04 0.00E+00 0.00E+00 0.00E+00 0.00E+00 1.41E+06 45.47 1.56
ON
1 2.34E+04 4.36E+03 2.55E+04 1.77E+05 3.16E+05 3.62E+05 3.01E+05 1.84E+05 6.50E+04 0.00E+00 0.00E+00 0.00E+00 0.00E+00 1.46E+06 48.53 1.56
2 2.11E+04 4.83E+03 2.62E+04 1.67E+05 3.05E+05 3.54E+05 2.93E+05 1.70E+05 4.71E+04 0.00E+00 0.00E+00 0.00E+00 0.00E+00 1.39E+06 48.01 1.55
3 1.96E+04 4.21E+03 3.39E+04 1.83E+05 3.04E+05 3.26E+05 2.50E+05 1.32E+05 2.91E+04 0.00E+00 0.00E+00 0.00E+00 2.36E+03 1.28E+06 45.85 1.55
4 2.35E+04 3.37E+03 2.41E+04 1.75E+05 3.16E+05 3.59E+05 2.90E+05 1.63E+05 4.06E+04 0.00E+00 0.00E+00 0.00E+00 0.00E+00 1.40E+06 47.39 1.54
5 1.68E+04 5.95E+03 3.81E+04 1.78E+05 2.91E+05 3.17E+05 2.56E+05 1.56E+05 5.64E+04 0.00E+00 0.00E+00 0.00E+00 0.00E+00 1.31E+06 47.31 1.57
OFF
1 1.76E+04 7.50E+03 3.95E+04 1.82E+05 2.94E+05 3.13E+05 2.42E+05 1.33E+05 3.53E+04 0.00E+00 0.00E+00 0.00E+00 0.00E+00 1.26E+06 45.69 1.55
2 1.83E+04 4.13E+03 3.37E+04 1.76E+05 2.93E+05 3.15E+05 2.44E+05 1.35E+05 3.65E+04 0.00E+00 0.00E+00 0.00E+00 0.00E+00 1.26E+06 46.18 1.55
3 2.16E+04 2.81E+03 2.44E+04 1.69E+05 2.90E+05 3.20E+05 2.54E+05 1.46E+05 4.44E+04 0.00E+00 0.00E+00 0.00E+00 0.00E+00 1.27E+06 47.18 1.55
4 1.71E+04 3.62E+03 3.14E+04 1.66E+05 2.83E+05 3.19E+05 2.68E+05 1.69E+05 6.51E+04 0.00E+00 0.00E+00 0.00E+00 0.00E+00 1.32E+06 48.63 1.57
5 1.98E+04 3.36E+03 2.71E+04 1.67E+05 2.92E+05 3.28E+05 2.68E+05 1.57E+05 4.88E+04 0.00E+00 0.00E+00 0.00E+00 0.00E+00 1.31E+06 47.74 1.55
Fog treatment
test Sample
NanoScan #2 - Location C
Size bins (nm) / Number density (#/cc) Total number density (#/cc)
Geo Mean (nm)
GSD 10-13.3 13.3-17.8 17.8-23.7 23.7-31.6 31.6-42.2 42.2-56.2 56.2-75 75-100 100-133.4 133.4-177.8 177.8-237.1 237.1-316.2 316.2-420
ON
1 6.50E+03 1.06E+03 0.00E+00 2.39E+04 5.90E+04 7.66E+04 6.53E+04 3.33E+04 2.39E+03 0.00E+00 0.00E+00 0.00E+00 2.64E+03 2.71E+05 49.43 1.58
2 5.59E+03 9.78E+02 0.00E+00 1.70E+04 4.42E+04 5.89E+04 5.21E+04 2.95E+04 5.82E+03 0.00E+00 0.00E+00 0.00E+00 6.22E+02 2.15E+05 50.21 1.56
3 4.51E+03 0.00E+00 0.00E+00 2.13E+04 4.26E+04 4.96E+04 3.99E+04 2.16E+04 4.95E+03 0.00E+00 0.00E+00 0.00E+00 7.32E+01 1.85E+05 47.98 1.54
4 3.51E+03 0.00E+00 0.00E+00 1.63E+04 3.90E+04 5.30E+04 5.03E+04 3.32E+04 1.10E+04 0.00E+00 0.00E+00 0.00E+00 0.00E+00 2.06E+05 52.99 1.53
5 4.78E+03 0.00E+00 0.00E+00 2.06E+04 4.27E+04 5.12E+04 4.31E+04 2.56E+04 7.56E+03 0.00E+00 0.00E+00 0.00E+00 0.00E+00 1.96E+05 49.35 1.55
OFF
1 1.50E+04 2.58E+03 2.12E+04 1.28E+05 2.21E+05 2.43E+05 1.90E+05 1.02E+05 2.19E+04 0.00E+00 0.00E+00 0.00E+00 0.00E+00 9.43E+05 46.29 1.54
2 1.11E+04 0.00E+00 3.16E+04 1.48E+05 1.78E+05 1.38E+05 8.46E+04 6.50E+04 5.44E+04 3.06E+04 0.00E+00 0.00E+00 0.00E+00 7.42E+05 46.39 1.72
3 1.35E+04 4.34E+03 2.69E+04 1.34E+05 2.22E+05 2.38E+05 1.82E+05 9.62E+04 2.02E+04 0.00E+00 0.00E+00 0.00E+00 0.00E+00 9.37E+05 45.52 1.54
4 1.69E+04 2.40E+03 2.57E+04 1.50E+05 2.52E+05 2.70E+05 2.03E+05 1.03E+05 1.72E+04 0.00E+00 0.00E+00 0.00E+00 1.11E+03 1.04E+06 45.38 1.53
5 1.60E+04 0.00E+00 2.13E+04 1.35E+05 2.35E+05 2.61E+05 2.07E+05 1.14E+05 2.66E+04 0.00E+00 0.00E+00 0.00E+00 0.00E+00 1.01E+06 46.87 1.53
ON
1 4.59E+03 2.84E+03 0.00E+00 1.25E+04 4.83E+04 7.11E+04 6.17E+04 2.58E+04 0.00E+00 0.00E+00 0.00E+00 3.51E+03 7.54E+03 2.38E+05 53.61 1.75
2 3.11E+03 1.13E+03 1.11E+03 1.28E+04 3.59E+04 5.35E+04 5.40E+04 3.63E+04 1.17E+04 0.00E+00 0.00E+00 0.00E+00 0.00E+00 2.10E+05 54.11 1.54
3 5.02E+03 2.91E+03 6.02E+02 1.76E+04 5.09E+04 6.87E+04 5.60E+04 2.06E+04 0.00E+00 0.00E+00 0.00E+00 4.16E+03 7.17E+03 2.34E+05 51.65 1.77
4 3.98E+03 1.80E+03 1.96E+03 1.63E+04 4.32E+04 5.79E+04 4.86E+04 2.06E+04 0.00E+00 0.00E+00 0.00E+00 1.71E+03 5.05E+03 2.01E+05 50.59 1.71
5 3.86E+03 3.46E+03 1.95E+02 1.30E+04 3.93E+04 5.77E+04 5.51E+04 3.31E+04 7.72E+03 0.00E+00 0.00E+00 0.00E+00 3.37E+02 2.14E+05 51.93 1.56
OFF
1 6.60E+03 8.04E+03 2.44E+04 9.01E+04 1.79E+05 2.24E+05 1.92E+05 1.03E+05 8.69E+03 0.00E+00 0.00E+00 0.00E+00 5.82E+03 8.41E+05 48.15 1.56
2 1.43E+04 1.67E+03 1.96E+04 1.24E+05 2.16E+05 2.38E+05 1.86E+05 9.75E+04 1.82E+04 0.00E+00 0.00E+00 0.00E+00 2.65E+02 9.16E+05 46.25 1.53
3 5.03E+03 2.51E+03 2.64E+04 9.59E+04 1.65E+05 1.93E+05 1.67E+05 1.04E+05 3.37E+04 0.00E+00 0.00E+00 0.00E+00 0.00E+00 7.92E+05 48.79 1.55
4 1.06E+04 3.09E+03 1.83E+04 1.01E+05 1.92E+05 2.24E+05 1.76E+05 8.15E+04 0.00E+00 0.00E+00 0.00E+00 0.00E+00 9.13E+03 8.16E+05 46.83 1.57
5 1.32E+04 1.82E+03 1.41E+04 1.02E+05 1.97E+05 2.33E+05 1.90E+05 1.00E+05 1.44E+04 0.00E+00 0.00E+00 0.00E+00 1.64E+03 8.68E+05 47.55 1.53

55
Table C.3 Number-based measurements for different fog treatment tests (Chapter 2). Engine run #3
Engine Run / Tube
Length
Fog
treatment test
Sample
NanoScan #1 - Location A
Size bins (nm) / Number density (#/cc) Total number density (#/cc)
Geo Mean (nm)
GSD 10-13.3 13.3-17.8 17.8-23.7 23.7-31.6 31.6-42.2 42.2-56.2 56.2-75 75-100 100-133.4 133.4-177.8 177.8-237.1 237.1-316.2 316.2-420
3 - short
ON
1 1.87E+04 1.77E+04 4.74E+04 1.82E+05 3.14E+05 3.61E+05 3.02E+05 1.79E+05 5.25E+04 0.00E+00 0.00E+00 0.00E+00 0.00E+00 1.47E+06 47.13 1.58
2 1.38E+04 1.55E+04 5.52E+04 1.85E+05 2.78E+05 2.82E+05 2.06E+05 1.03E+05 1.78E+04 0.00E+00 0.00E+00 0.00E+00 1.18E+03 1.16E+06 43.31 1.56
3 1.39E+04 1.81E+04 5.72E+04 1.83E+05 2.68E+05 2.69E+05 1.96E+05 1.02E+05 2.33E+04 0.00E+00 0.00E+00 0.00E+00 0.00E+00 1.13E+06 43.14 1.57
4 2.04E+04 2.19E+04 7.23E+04 2.47E+05 3.59E+05 3.53E+05 2.54E+05 1.34E+05 3.70E+04 0.00E+00 0.00E+00 0.00E+00 0.00E+00 1.50E+06 43.17 1.57
5 1.51E+04 1.50E+04 5.27E+04 1.86E+05 2.90E+05 3.15E+05 2.62E+05 1.70E+05 7.17E+04 0.00E+00 0.00E+00 0.00E+00 0.00E+00 1.38E+06 47.29 1.60
OFF
1 1.58E+04 2.01E+04 6.77E+04 2.18E+05 3.25E+05 3.34E+05 2.52E+05 1.39E+05 3.85E+04 0.00E+00 0.00E+00 0.00E+00 0.00E+00 1.41E+06 44.17 1.58
2 1.40E+04 1.92E+04 6.57E+04 2.06E+05 3.03E+05 3.03E+05 2.17E+05 1.04E+05 1.40E+04 0.00E+00 0.00E+00 0.00E+00 3.56E+03 1.25E+06 42.74 1.57
3 1.59E+04 1.64E+04 5.66E+04 2.00E+05 3.15E+05 3.36E+05 2.64E+05 1.50E+05 4.27E+04 0.00E+00 0.00E+00 0.00E+00 0.00E+00 1.40E+06 45.43 1.57
4 1.77E+04 1.50E+04 6.13E+04 2.19E+05 3.10E+05 2.94E+05 2.00E+05 9.72E+04 1.93E+04 0.00E+00 0.00E+00 0.00E+00 0.00E+00 1.23E+06 42.05 1.55
5 1.40E+04 2.09E+04 6.48E+04 1.99E+05 2.88E+05 2.84E+05 1.99E+05 9.32E+04 1.16E+04 0.00E+00 0.00E+00 0.00E+00 4.01E+03 1.18E+06 42.22 1.57
OFF
1 1.64E+04 2.07E+04 6.93E+04 2.27E+05 3.48E+05 3.69E+05 2.91E+05 1.69E+05 5.01E+04 0.00E+00 0.00E+00 0.00E+00 0.00E+00 1.56E+06 45.27 1.58
2 1.83E+04 1.63E+04 5.41E+04 2.04E+05 3.34E+05 3.68E+05 2.96E+05 1.69E+05 4.58E+04 0.00E+00 0.00E+00 0.00E+00 0.00E+00 1.50E+06 46.07 1.57
3 1.48E+04 1.91E+04 5.41E+04 1.79E+05 2.75E+05 2.91E+05 2.29E+05 1.33E+05 4.07E+04 0.00E+00 0.00E+00 0.00E+00 0.00E+00 1.23E+06 45.11 1.59
4 1.66E+04 1.54E+04 5.00E+04 1.85E+05 3.04E+05 3.38E+05 2.77E+05 1.66E+05 5.22E+04 0.00E+00 0.00E+00 0.00E+00 0.00E+00 1.40E+06 46.71 1.58
5 1.69E+04 1.70E+04 5.30E+04 1.93E+05 3.11E+05 3.42E+05 2.80E+05 1.71E+05 6.02E+04 0.00E+00 0.00E+00 0.00E+00 0.00E+00 1.44E+06 46.73 1.59
ON
1 1.38E+04 1.32E+04 5.60E+04 1.97E+05 2.99E+05 3.07E+05 2.27E+05 1.17E+05 2.20E+04 0.00E+00 0.00E+00 0.00E+00 0.00E+00 1.25E+06 43.84 1.55
2 1.26E+04 1.50E+04 5.86E+04 1.90E+05 2.77E+05 2.76E+05 2.02E+05 1.09E+05 2.97E+04 0.00E+00 0.00E+00 0.00E+00 0.00E+00 1.17E+06 43.63 1.57
3 2.02E+04 7.77E+03 4.03E+04 1.91E+05 2.96E+05 3.00E+05 2.15E+05 1.08E+05 2.14E+04 0.00E+00 0.00E+00 0.00E+00 1.15E+03 1.20E+06 43.95 1.55
4 1.69E+04 7.94E+03 4.54E+04 1.91E+05 2.94E+05 3.12E+05 2.55E+05 1.71E+05 8.44E+04 1.55E+04 0.00E+00 0.00E+00 0.00E+00 1.39E+06 48.55 1.62
5 1.66E+04 1.79E+04 5.89E+04 2.07E+05 3.26E+05 3.50E+05 2.77E+05 1.58E+05 4.43E+04 0.00E+00 0.00E+00 0.00E+00 0.00E+00 1.46E+06 45.48 1.57
Fog treatment
test Sample
NanoScan #2 - Location C
Size bins (nm) / Number density (#/cc) Total number density (#/cc)
Geo Mean (nm)
GSD 10-13.3 13.3-17.8 17.8-23.7 23.7-31.6 31.6-42.2 42.2-56.2 56.2-75 75-100 100-133.4 133.4-177.8 177.8-237.1 237.1-316.2 316.2-420
ON
1 6.77E+03 6.76E+03 2.49E+04 8.86E+04 1.50E+05 1.69E+05 1.36E+05 7.26E+04 1.26E+04 0.00E+00 0.00E+00 0.00E+00 1.29E+03 6.68E+05 45.94 1.56
2 8.47E+03 6.10E+03 2.31E+04 9.13E+04 1.45E+05 1.52E+05 1.13E+05 5.71E+04 8.91E+03 0.00E+00 0.00E+00 0.00E+00 3.87E+02 6.05E+05 44.14 1.55
3 1.25E+04 6.92E+03 2.29E+04 1.09E+05 1.73E+05 1.79E+05 1.33E+05 6.95E+04 1.48E+04 0.00E+00 0.00E+00 0.00E+00 0.00E+00 7.21E+05 44.35 1.56
4 1.32E+04 6.21E+03 2.55E+04 1.25E+05 2.08E+05 2.22E+05 1.67E+05 8.20E+04 9.87E+03 0.00E+00 0.00E+00 0.00E+00 2.39E+03 8.62E+05 44.81 1.55
5 1.70E+04 3.72E+03 2.18E+04 1.36E+05 1.98E+05 1.84E+05 1.22E+05 6.22E+04 1.99E+04 0.00E+00 0.00E+00 0.00E+00 0.00E+00 7.64E+05 43.03 1.56
OFF
1 3.88E+03 0.00E+00 0.00E+00 1.82E+04 3.41E+04 3.87E+04 3.17E+04 1.96E+04 7.02E+03 0.00E+00 0.00E+00 0.00E+00 0.00E+00 1.53E+05 48.88 1.57
2 9.21E+02 3.76E+02 1.72E+03 9.90E+03 3.00E+04 4.63E+04 4.69E+04 3.03E+04 8.20E+03 0.00E+00 0.00E+00 0.00E+00 0.00E+00 1.75E+05 54.73 1.48
3 5.38E+03 2.04E+03 0.00E+00 2.08E+04 5.97E+04 7.74E+04 5.80E+04 1.38E+04 0.00E+00 0.00E+00 0.00E+00 9.50E+03 1.12E+04 2.58E+05 53.54 1.90
4 1.74E+03 0.00E+00 3.33E+03 1.63E+04 2.58E+04 2.95E+04 2.79E+04 2.30E+04 1.44E+04 4.22E+03 0.00E+00 0.00E+00 0.00E+00 1.46E+05 54.45 1.67
5 2.55E+03 0.00E+00 2.93E+03 1.79E+04 2.55E+04 2.89E+04 3.11E+04 3.21E+04 2.35E+04 7.12E+03 0.00E+00 0.00E+00 0.00E+00 1.72E+05 58.72 1.71
OFF
1 1.20E+03 3.23E+02 3.03E+03 1.49E+04 3.54E+04 4.96E+04 4.81E+04 3.13E+04 9.93E+03 0.00E+00 0.00E+00 0.00E+00 0.00E+00 1.94E+05 53.15 1.51
2 1.65E+03 8.52E+02 2.16E+03 1.36E+04 2.60E+04 3.14E+04 2.70E+04 1.63E+04 4.80E+03 0.00E+00 0.00E+00 0.00E+00 0.00E+00 1.24E+05 49.00 1.55
3 1.31E+03 5.99E+02 2.45E+03 1.37E+04 2.59E+04 3.17E+04 2.83E+04 1.83E+04 6.64E+03 0.00E+00 0.00E+00 0.00E+00 0.00E+00 1.29E+05 50.38 1.56
4 3.54E+03 0.00E+00 0.00E+00 1.81E+04 2.99E+04 3.41E+04 3.25E+04 2.83E+04 1.76E+04 2.92E+03 0.00E+00 0.00E+00 0.00E+00 1.67E+05 54.91 1.66
5 2.72E+03 1.28E+03 0.00E+00 1.02E+04 3.45E+04 5.26E+04 5.14E+04 3.14E+04 6.70E+03 0.00E+00 0.00E+00 0.00E+00 2.55E+02 1.91E+05 53.50 1.51
ON
1 9.59E+03 4.82E+03 2.31E+04 1.01E+05 1.57E+05 1.59E+05 1.15E+05 5.66E+04 7.82E+03 0.00E+00 0.00E+00 0.00E+00 0.00E+00 6.34E+05 43.60 1.53
2 9.64E+03 4.67E+03 2.27E+04 1.00E+05 1.57E+05 1.60E+05 1.15E+05 5.57E+04 7.20E+03 0.00E+00 0.00E+00 0.00E+00 5.00E+02 6.32E+05 43.65 1.54
3 1.10E+04 3.18E+03 1.71E+04 9.48E+04 1.61E+05 1.76E+05 1.36E+05 7.05E+04 1.20E+04 0.00E+00 0.00E+00 0.00E+00 6.00E+01 6.82E+05 45.57 1.54
4 1.13E+04 3.08E+03 1.98E+04 1.04E+05 1.76E+05 1.89E+05 1.44E+05 7.22E+04 9.71E+03 0.00E+00 0.00E+00 0.00E+00 1.18E+03 7.30E+05 45.23 1.54
5 1.05E+04 4.64E+03 2.34E+04 1.08E+05 1.80E+05 1.94E+05 1.48E+05 7.33E+04 8.65E+03 0.00E+00 0.00E+00 0.00E+00 2.01E+03 7.52E+05 45.07 1.55
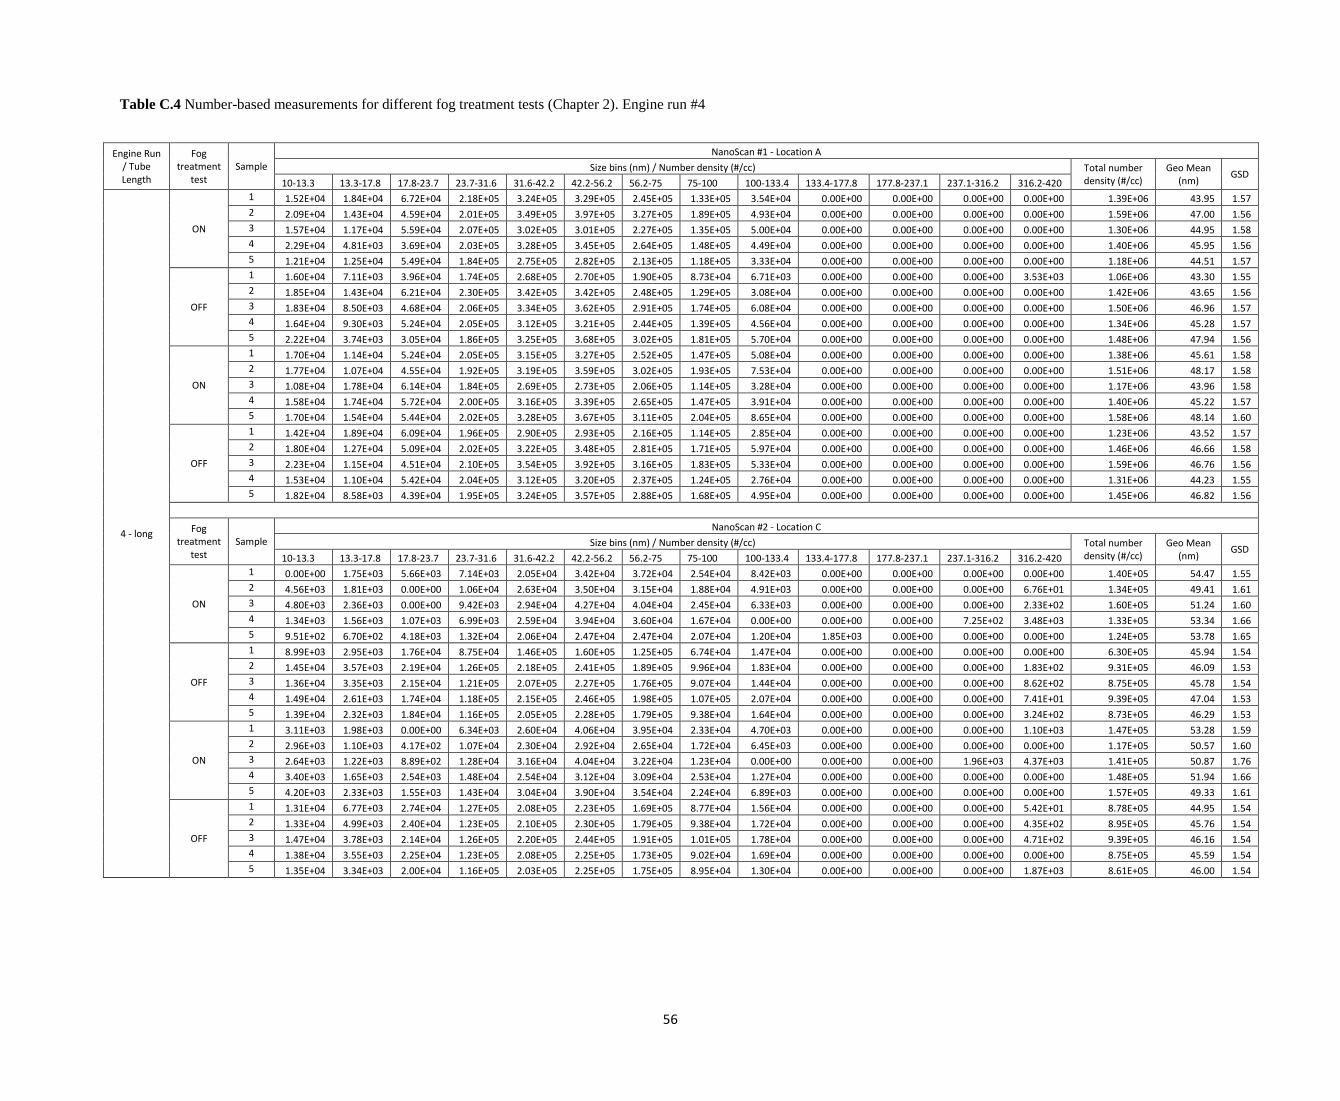
56
Table C.4 Number-based measurements for different fog treatment tests (Chapter 2). Engine run #4
Engine Run / Tube Length
Fog treatment
test Sample
NanoScan #1 - Location A
Size bins (nm) / Number density (#/cc) Total number density (#/cc)
Geo Mean (nm)
GSD 10-13.3 13.3-17.8 17.8-23.7 23.7-31.6 31.6-42.2 42.2-56.2 56.2-75 75-100 100-133.4 133.4-177.8 177.8-237.1 237.1-316.2 316.2-420
4 - long
ON
1 1.52E+04 1.84E+04 6.72E+04 2.18E+05 3.24E+05 3.29E+05 2.45E+05 1.33E+05 3.54E+04 0.00E+00 0.00E+00 0.00E+00 0.00E+00 1.39E+06 43.95 1.57
2 2.09E+04 1.43E+04 4.59E+04 2.01E+05 3.49E+05 3.97E+05 3.27E+05 1.89E+05 4.93E+04 0.00E+00 0.00E+00 0.00E+00 0.00E+00 1.59E+06 47.00 1.56
3 1.57E+04 1.17E+04 5.59E+04 2.07E+05 3.02E+05 3.01E+05 2.27E+05 1.35E+05 5.00E+04 0.00E+00 0.00E+00 0.00E+00 0.00E+00 1.30E+06 44.95 1.58
4 2.29E+04 4.81E+03 3.69E+04 2.03E+05 3.28E+05 3.45E+05 2.64E+05 1.48E+05 4.49E+04 0.00E+00 0.00E+00 0.00E+00 0.00E+00 1.40E+06 45.95 1.56
5 1.21E+04 1.25E+04 5.49E+04 1.84E+05 2.75E+05 2.82E+05 2.13E+05 1.18E+05 3.33E+04 0.00E+00 0.00E+00 0.00E+00 0.00E+00 1.18E+06 44.51 1.57
OFF
1 1.60E+04 7.11E+03 3.96E+04 1.74E+05 2.68E+05 2.70E+05 1.90E+05 8.73E+04 6.71E+03 0.00E+00 0.00E+00 0.00E+00 3.53E+03 1.06E+06 43.30 1.55
2 1.85E+04 1.43E+04 6.21E+04 2.30E+05 3.42E+05 3.42E+05 2.48E+05 1.29E+05 3.08E+04 0.00E+00 0.00E+00 0.00E+00 0.00E+00 1.42E+06 43.65 1.56
3 1.83E+04 8.50E+03 4.68E+04 2.06E+05 3.34E+05 3.62E+05 2.91E+05 1.74E+05 6.08E+04 0.00E+00 0.00E+00 0.00E+00 0.00E+00 1.50E+06 46.96 1.57
4 1.64E+04 9.30E+03 5.24E+04 2.05E+05 3.12E+05 3.21E+05 2.44E+05 1.39E+05 4.56E+04 0.00E+00 0.00E+00 0.00E+00 0.00E+00 1.34E+06 45.28 1.57
5 2.22E+04 3.74E+03 3.05E+04 1.86E+05 3.25E+05 3.68E+05 3.02E+05 1.81E+05 5.70E+04 0.00E+00 0.00E+00 0.00E+00 0.00E+00 1.48E+06 47.94 1.56
ON
1 1.70E+04 1.14E+04 5.24E+04 2.05E+05 3.15E+05 3.27E+05 2.52E+05 1.47E+05 5.08E+04 0.00E+00 0.00E+00 0.00E+00 0.00E+00 1.38E+06 45.61 1.58
2 1.77E+04 1.07E+04 4.55E+04 1.92E+05 3.19E+05 3.59E+05 3.02E+05 1.93E+05 7.53E+04 0.00E+00 0.00E+00 0.00E+00 0.00E+00 1.51E+06 48.17 1.58
3 1.08E+04 1.78E+04 6.14E+04 1.84E+05 2.69E+05 2.73E+05 2.06E+05 1.14E+05 3.28E+04 0.00E+00 0.00E+00 0.00E+00 0.00E+00 1.17E+06 43.96 1.58
4 1.58E+04 1.74E+04 5.72E+04 2.00E+05 3.16E+05 3.39E+05 2.65E+05 1.47E+05 3.91E+04 0.00E+00 0.00E+00 0.00E+00 0.00E+00 1.40E+06 45.22 1.57
5 1.70E+04 1.54E+04 5.44E+04 2.02E+05 3.28E+05 3.67E+05 3.11E+05 2.04E+05 8.65E+04 0.00E+00 0.00E+00 0.00E+00 0.00E+00 1.58E+06 48.14 1.60
OFF
1 1.42E+04 1.89E+04 6.09E+04 1.96E+05 2.90E+05 2.93E+05 2.16E+05 1.14E+05 2.85E+04 0.00E+00 0.00E+00 0.00E+00 0.00E+00 1.23E+06 43.52 1.57
2 1.80E+04 1.27E+04 5.09E+04 2.02E+05 3.22E+05 3.48E+05 2.81E+05 1.71E+05 5.97E+04 0.00E+00 0.00E+00 0.00E+00 0.00E+00 1.46E+06 46.66 1.58
3 2.23E+04 1.15E+04 4.51E+04 2.10E+05 3.54E+05 3.92E+05 3.16E+05 1.83E+05 5.33E+04 0.00E+00 0.00E+00 0.00E+00 0.00E+00 1.59E+06 46.76 1.56
4 1.53E+04 1.10E+04 5.42E+04 2.04E+05 3.12E+05 3.20E+05 2.37E+05 1.24E+05 2.76E+04 0.00E+00 0.00E+00 0.00E+00 0.00E+00 1.31E+06 44.23 1.55
5 1.82E+04 8.58E+03 4.39E+04 1.95E+05 3.24E+05 3.57E+05 2.88E+05 1.68E+05 4.95E+04 0.00E+00 0.00E+00 0.00E+00 0.00E+00 1.45E+06 46.82 1.56
Fog treatment
test Sample
NanoScan #2 - Location C
Size bins (nm) / Number density (#/cc) Total number density (#/cc)
Geo Mean (nm)
GSD 10-13.3 13.3-17.8 17.8-23.7 23.7-31.6 31.6-42.2 42.2-56.2 56.2-75 75-100 100-133.4 133.4-177.8 177.8-237.1 237.1-316.2 316.2-420
ON
1 0.00E+00 1.75E+03 5.66E+03 7.14E+03 2.05E+04 3.42E+04 3.72E+04 2.54E+04 8.42E+03 0.00E+00 0.00E+00 0.00E+00 0.00E+00 1.40E+05 54.47 1.55
2 4.56E+03 1.81E+03 0.00E+00 1.06E+04 2.63E+04 3.50E+04 3.15E+04 1.88E+04 4.91E+03 0.00E+00 0.00E+00 0.00E+00 6.76E+01 1.34E+05 49.41 1.61
3 4.80E+03 2.36E+03 0.00E+00 9.42E+03 2.94E+04 4.27E+04 4.04E+04 2.45E+04 6.33E+03 0.00E+00 0.00E+00 0.00E+00 2.33E+02 1.60E+05 51.24 1.60
4 1.34E+03 1.56E+03 1.07E+03 6.99E+03 2.59E+04 3.94E+04 3.60E+04 1.67E+04 0.00E+00 0.00E+00 0.00E+00 7.25E+02 3.48E+03 1.33E+05 53.34 1.66
5 9.51E+02 6.70E+02 4.18E+03 1.32E+04 2.06E+04 2.47E+04 2.47E+04 2.07E+04 1.20E+04 1.85E+03 0.00E+00 0.00E+00 0.00E+00 1.24E+05 53.78 1.65
OFF
1 8.99E+03 2.95E+03 1.76E+04 8.75E+04 1.46E+05 1.60E+05 1.25E+05 6.74E+04 1.47E+04 0.00E+00 0.00E+00 0.00E+00 0.00E+00 6.30E+05 45.94 1.54
2 1.45E+04 3.57E+03 2.19E+04 1.26E+05 2.18E+05 2.41E+05 1.89E+05 9.96E+04 1.83E+04 0.00E+00 0.00E+00 0.00E+00 1.83E+02 9.31E+05 46.09 1.53
3 1.36E+04 3.35E+03 2.15E+04 1.21E+05 2.07E+05 2.27E+05 1.76E+05 9.07E+04 1.44E+04 0.00E+00 0.00E+00 0.00E+00 8.62E+02 8.75E+05 45.78 1.54
4 1.49E+04 2.61E+03 1.74E+04 1.18E+05 2.15E+05 2.46E+05 1.98E+05 1.07E+05 2.07E+04 0.00E+00 0.00E+00 0.00E+00 7.41E+01 9.39E+05 47.04 1.53
5 1.39E+04 2.32E+03 1.84E+04 1.16E+05 2.05E+05 2.28E+05 1.79E+05 9.38E+04 1.64E+04 0.00E+00 0.00E+00 0.00E+00 3.24E+02 8.73E+05 46.29 1.53
ON
1 3.11E+03 1.98E+03 0.00E+00 6.34E+03 2.60E+04 4.06E+04 3.95E+04 2.33E+04 4.70E+03 0.00E+00 0.00E+00 0.00E+00 1.10E+03 1.47E+05 53.28 1.59
2 2.96E+03 1.10E+03 4.17E+02 1.07E+04 2.30E+04 2.92E+04 2.65E+04 1.72E+04 6.45E+03 0.00E+00 0.00E+00 0.00E+00 0.00E+00 1.17E+05 50.57 1.60
3 2.64E+03 1.22E+03 8.89E+02 1.28E+04 3.16E+04 4.04E+04 3.22E+04 1.23E+04 0.00E+00 0.00E+00 0.00E+00 1.96E+03 4.37E+03 1.41E+05 50.87 1.76
4 3.40E+03 1.65E+03 2.54E+03 1.48E+04 2.54E+04 3.12E+04 3.09E+04 2.53E+04 1.27E+04 0.00E+00 0.00E+00 0.00E+00 0.00E+00 1.48E+05 51.94 1.66
5 4.20E+03 2.33E+03 1.55E+03 1.43E+04 3.04E+04 3.90E+04 3.54E+04 2.24E+04 6.89E+03 0.00E+00 0.00E+00 0.00E+00 0.00E+00 1.57E+05 49.33 1.61
OFF
1 1.31E+04 6.77E+03 2.74E+04 1.27E+05 2.08E+05 2.23E+05 1.69E+05 8.77E+04 1.56E+04 0.00E+00 0.00E+00 0.00E+00 5.42E+01 8.78E+05 44.95 1.54
2 1.33E+04 4.99E+03 2.40E+04 1.23E+05 2.10E+05 2.30E+05 1.79E+05 9.38E+04 1.72E+04 0.00E+00 0.00E+00 0.00E+00 4.35E+02 8.95E+05 45.76 1.54
3 1.47E+04 3.78E+03 2.14E+04 1.26E+05 2.20E+05 2.44E+05 1.91E+05 1.01E+05 1.78E+04 0.00E+00 0.00E+00 0.00E+00 4.71E+02 9.39E+05 46.16 1.54
4 1.38E+04 3.55E+03 2.25E+04 1.23E+05 2.08E+05 2.25E+05 1.73E+05 9.02E+04 1.69E+04 0.00E+00 0.00E+00 0.00E+00 0.00E+00 8.75E+05 45.59 1.54
5 1.35E+04 3.34E+03 2.00E+04 1.16E+05 2.03E+05 2.25E+05 1.75E+05 8.95E+04 1.30E+04 0.00E+00 0.00E+00 0.00E+00 1.87E+03 8.61E+05 46.00 1.54
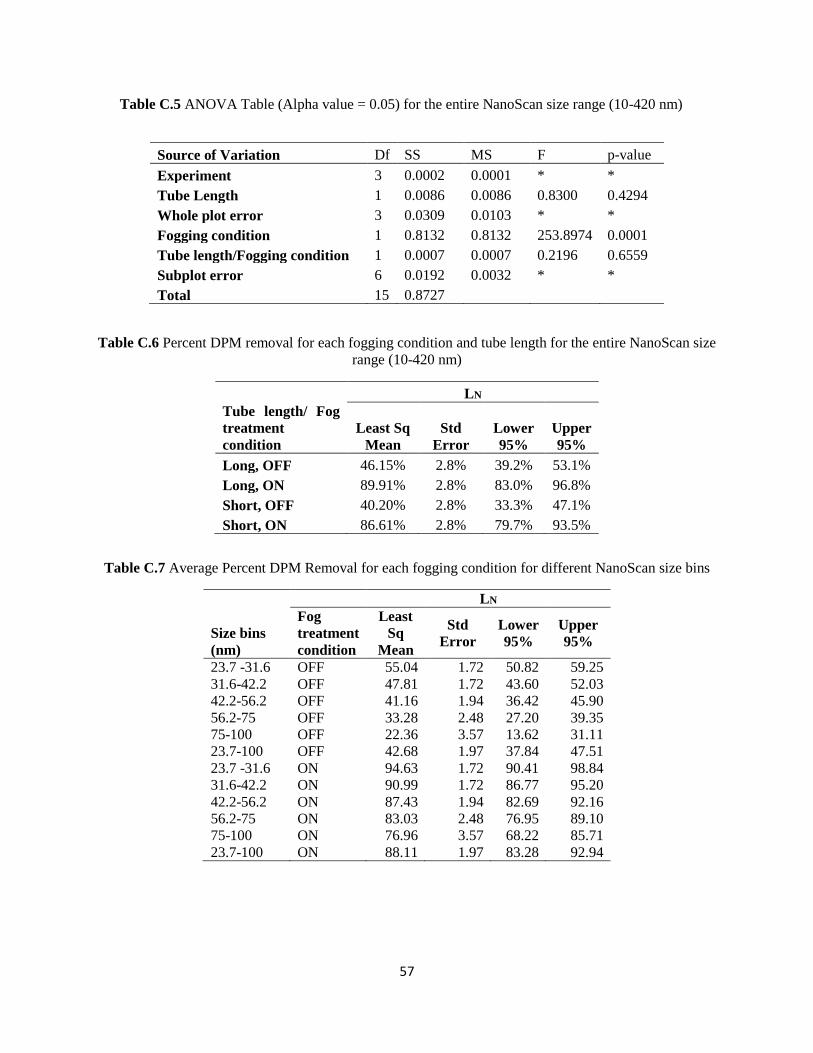
57
Table C.5 ANOVA Table (Alpha value = 0.05) for the entire NanoScan size range (10-420 nm)
Source of Variation Df SS MS F p-value
Experiment 3 0.0002 0.0001 * *
Tube Length 1 0.0086 0.0086 0.8300 0.4294
Whole plot error 3 0.0309 0.0103 * *
Fogging condition 1 0.8132 0.8132 253.8974 0.0001
Tube length/Fogging condition 1 0.0007 0.0007 0.2196 0.6559
Subplot error 6 0.0192 0.0032 * *
Total 15 0.8727
Table C.6 Percent DPM removal for each fogging condition and tube length for the entire NanoScan size
range (10-420 nm)
LN
Tube length/ Fog
treatment
condition
Least Sq
Mean
Std
Error
Lower
95%
Upper
95%
Long, OFF 46.15% 2.8% 39.2% 53.1%
Long, ON 89.91% 2.8% 83.0% 96.8%
Short, OFF 40.20% 2.8% 33.3% 47.1%
Short, ON 86.61% 2.8% 79.7% 93.5%
Table C.7 Average Percent DPM Removal for each fogging condition for different NanoScan size bins
LN
Size bins
(nm)
Fog
treatment
condition
Least
Sq
Mean
Std
Error
Lower
95%
Upper
95%
23.7 -31.6 OFF 55.04 1.72 50.82 59.25
31.6-42.2 OFF 47.81 1.72 43.60 52.03
42.2-56.2 OFF 41.16 1.94 36.42 45.90
56.2-75 OFF 33.28 2.48 27.20 39.35
75-100 OFF 22.36 3.57 13.62 31.11
23.7-100 OFF 42.68 1.97 37.84 47.51
23.7 -31.6 ON 94.63 1.72 90.41 98.84
31.6-42.2 ON 90.99 1.72 86.77 95.20
42.2-56.2 ON 87.43 1.94 82.69 92.16
56.2-75 ON 83.03 2.48 76.95 89.10
75-100 ON 76.96 3.57 68.22 85.71
23.7-100 ON 88.11 1.97 83.28 92.94
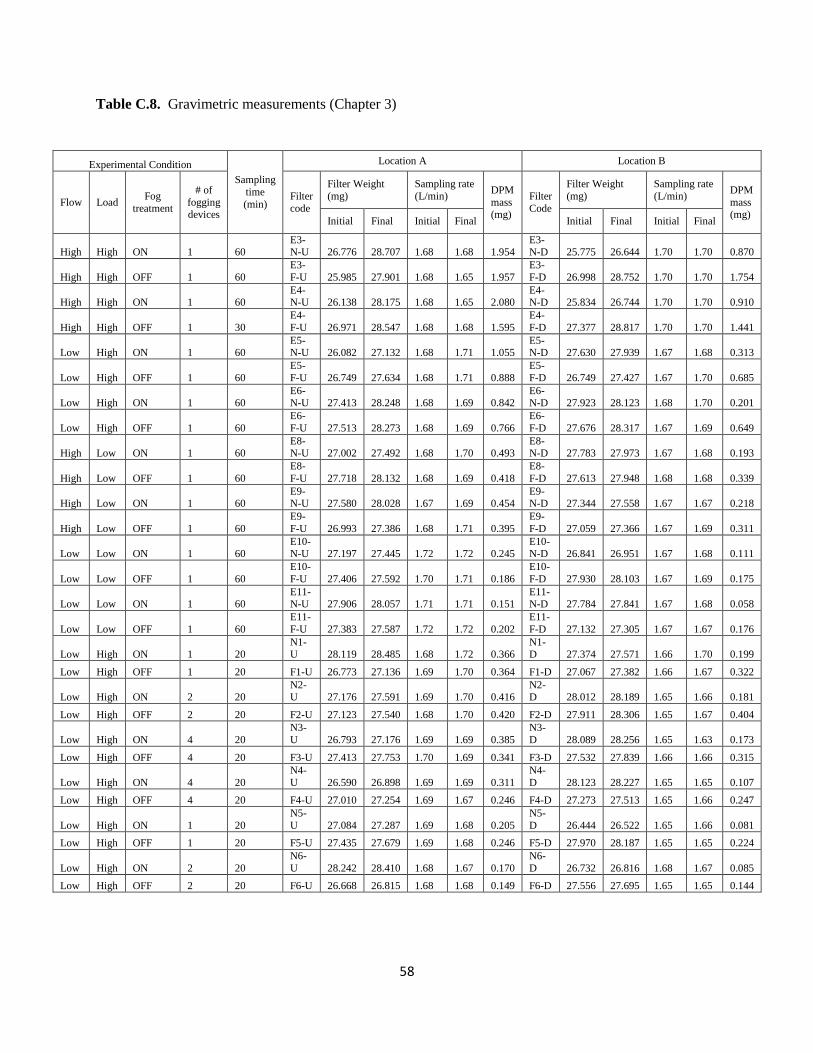
58
Table C.8. Gravimetric measurements (Chapter 3)
Experimental Condition
Sampling
time
(min)
Location A Location B
Flow Load Fog
treatment
# of
fogging devices
Filter
code
Filter Weight
(mg)
Sampling rate
(L/min) DPM
mass (mg)
Filter
Code
Filter Weight
(mg)
Sampling rate
(L/min) DPM
mass (mg)
Initial Final Initial Final Initial Final Initial Final
High High ON 1 60 E3-N-U 26.776 28.707 1.68 1.68 1.954
E3-N-D 25.775 26.644 1.70 1.70 0.870
High High OFF 1 60
E3-
F-U 25.985 27.901 1.68 1.65 1.957
E3-
F-D 26.998 28.752 1.70 1.70 1.754
High High ON 1 60 E4-N-U 26.138 28.175 1.68 1.65 2.080
E4-N-D 25.834 26.744 1.70 1.70 0.910
High High OFF 1 30
E4-
F-U 26.971 28.547 1.68 1.68 1.595
E4-
F-D 27.377 28.817 1.70 1.70 1.441
Low High ON 1 60 E5-N-U 26.082 27.132 1.68 1.71 1.055
E5-N-D 27.630 27.939 1.67 1.68 0.313
Low High OFF 1 60
E5-
F-U 26.749 27.634 1.68 1.71 0.888
E5-
F-D 26.749 27.427 1.67 1.70 0.685
Low High ON 1 60 E6-N-U 27.413 28.248 1.68 1.69 0.842
E6-N-D 27.923 28.123 1.68 1.70 0.201
Low High OFF 1 60
E6-
F-U 27.513 28.273 1.68 1.69 0.766
E6-
F-D 27.676 28.317 1.67 1.69 0.649
High Low ON 1 60 E8-N-U 27.002 27.492 1.68 1.70 0.493
E8-N-D 27.783 27.973 1.67 1.68 0.193
High Low OFF 1 60
E8-
F-U 27.718 28.132 1.68 1.69 0.418
E8-
F-D 27.613 27.948 1.68 1.68 0.339
High Low ON 1 60 E9-N-U 27.580 28.028 1.67 1.69 0.454
E9-N-D 27.344 27.558 1.67 1.67 0.218
High Low OFF 1 60
E9-
F-U 26.993 27.386 1.68 1.71 0.395
E9-
F-D 27.059 27.366 1.67 1.69 0.311
Low Low ON 1 60 E10-N-U 27.197 27.445 1.72 1.72 0.245
E10-N-D 26.841 26.951 1.67 1.68 0.111
Low Low OFF 1 60
E10-
F-U 27.406 27.592 1.70 1.71 0.186
E10-
F-D 27.930 28.103 1.67 1.69 0.175
Low Low ON 1 60 E11-N-U 27.906 28.057 1.71 1.71 0.151
E11-N-D 27.784 27.841 1.67 1.68 0.058
Low Low OFF 1 60
E11-
F-U 27.383 27.587 1.72 1.72 0.202
E11-
F-D 27.132 27.305 1.67 1.67 0.176
Low High ON 1 20 N1-U 28.119 28.485 1.68 1.72 0.366
N1-D 27.374 27.571 1.66 1.70 0.199
Low High OFF 1 20 F1-U 26.773 27.136 1.69 1.70 0.364 F1-D 27.067 27.382 1.66 1.67 0.322
Low High ON 2 20 N2-U 27.176 27.591 1.69 1.70 0.416
N2-D 28.012 28.189 1.65 1.66 0.181
Low High OFF 2 20 F2-U 27.123 27.540 1.68 1.70 0.420 F2-D 27.911 28.306 1.65 1.67 0.404
Low High ON 4 20
N3-
U 26.793 27.176 1.69 1.69 0.385
N3-
D 28.089 28.256 1.65 1.63 0.173
Low High OFF 4 20 F3-U 27.413 27.753 1.70 1.69 0.341 F3-D 27.532 27.839 1.66 1.66 0.315
Low High ON 4 20
N4-
U 26.590 26.898 1.69 1.69 0.311
N4-
D 28.123 28.227 1.65 1.65 0.107
Low High OFF 4 20 F4-U 27.010 27.254 1.69 1.67 0.246 F4-D 27.273 27.513 1.65 1.66 0.247
Low High ON 1 20
N5-
U 27.084 27.287 1.69 1.68 0.205
N5-
D 26.444 26.522 1.65 1.66 0.081
Low High OFF 1 20 F5-U 27.435 27.679 1.69 1.68 0.246 F5-D 27.970 28.187 1.65 1.65 0.224
Low High ON 2 20
N6-
U 28.242 28.410 1.68 1.67 0.170
N6-
D 26.732 26.816 1.68 1.67 0.085
Low High OFF 2 20 F6-U 26.668 26.815 1.68 1.68 0.149 F6-D 27.556 27.695 1.65 1.65 0.144