Embed Size (px)
Citation preview
Frank Kilzer
Vice President of Material and Facility Resources
St. Alexius Medical Center
Bismarck, North Dakota
GS1 global Healthcare User Group – GS1 HUG
June 8, 2007
Orlando, Florida
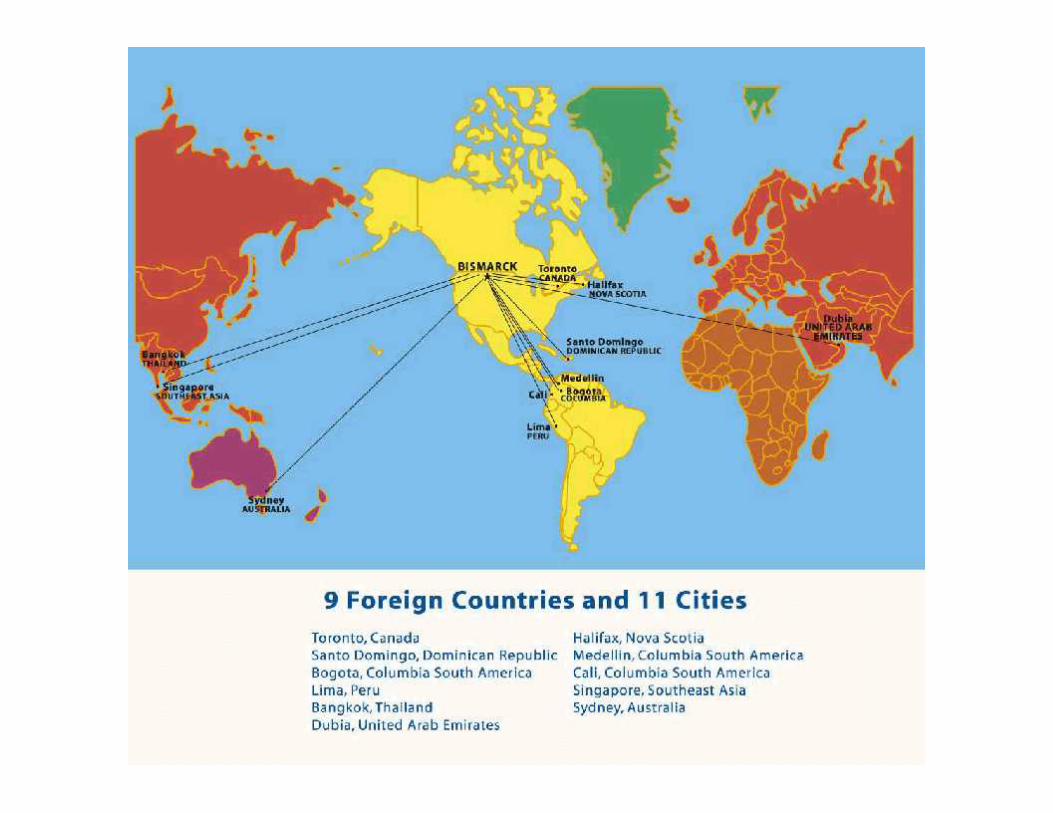
A Journey~~
Making The Hospital A Safer Place
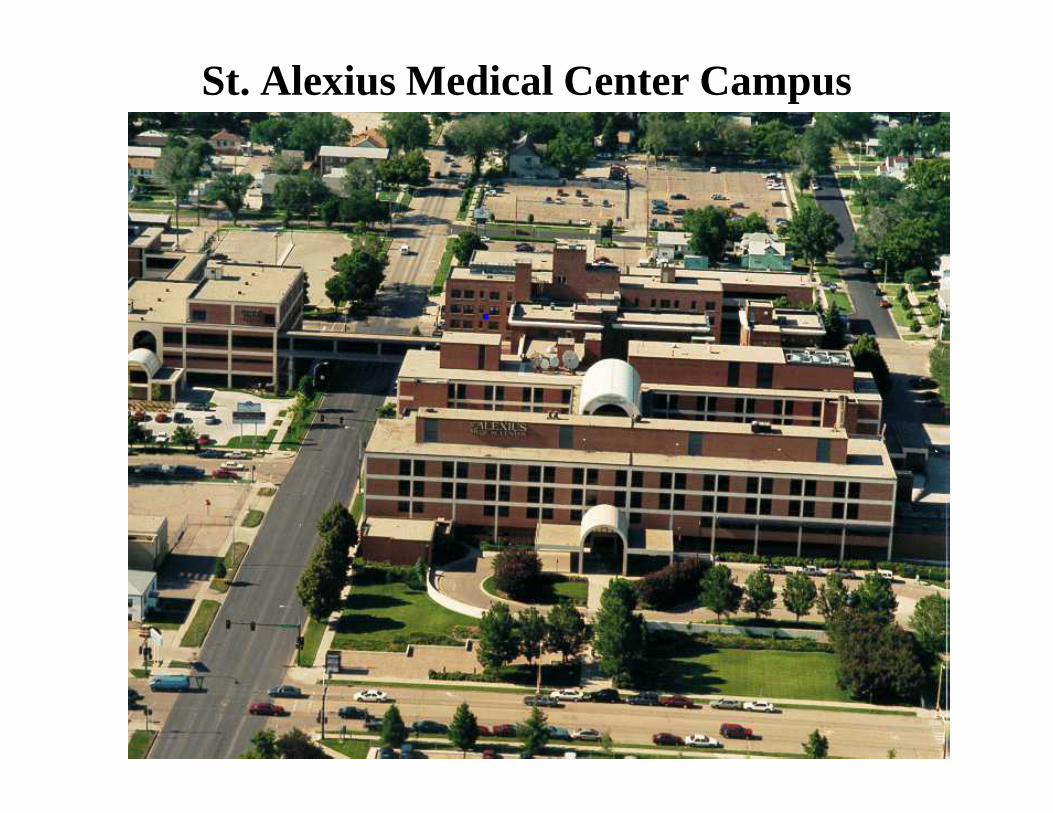
St. Alexius Medical Center Campus
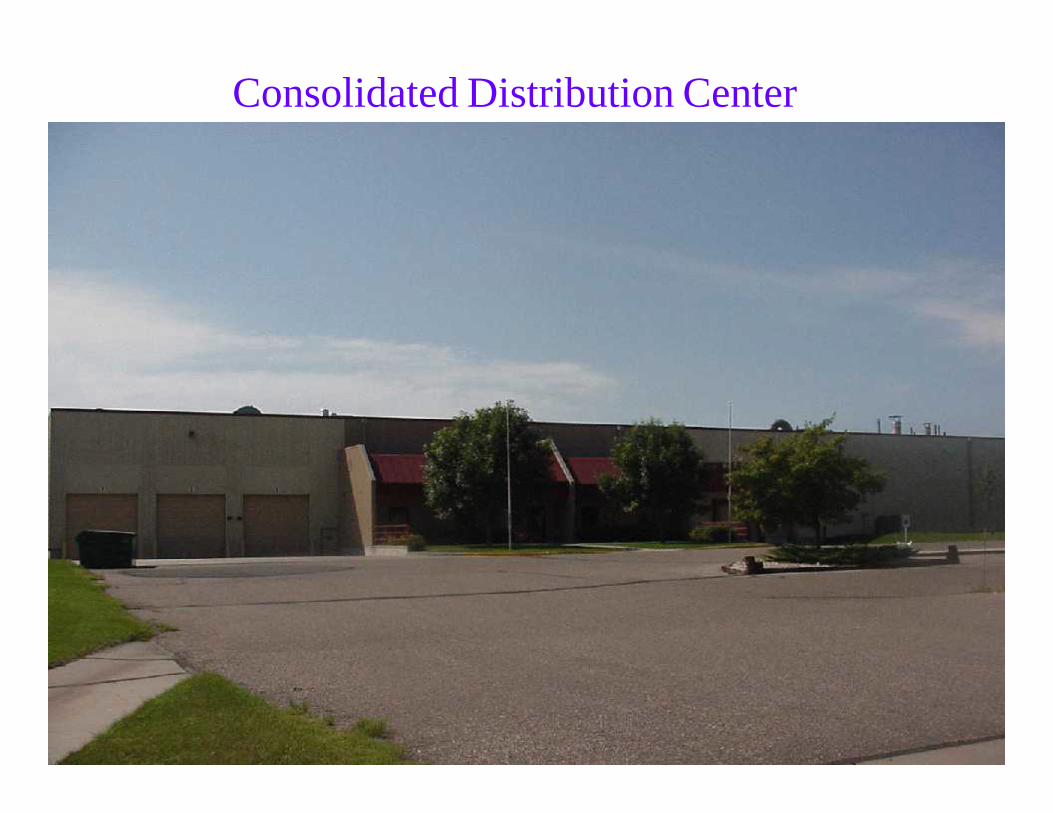
Consolidated Distribution Center
Presentation Overview
• Share the St. Alexius Story - - - our journey
• Talk about the current status of the health industry supply chain.
• Identify its deficiencies and the changes that are needed
• Provide examples for Auto ID technology and how it can be used to improve patient safety
• Present a vision for what the health care supply chain model
of the future should look like
Outcome For Today
• Gain a better understanding of how industry standards and Auto ID technology can be help make hospitals safer
• From the St. Alexius journey over the past three decades I want to share what I believe is the health care supply chain model of the future and how this model will increase operational efficiencies, reduce the cost of healthcare and improve patient safety.
Expanded Role of the Health Industry's Supply Chain
• Meeting the JCAHO Patient Safety Goals
• Improving quality of patient care
• Traceability – Critical to the industry especially with FDA
• Controlling utilization
• Reducing cost
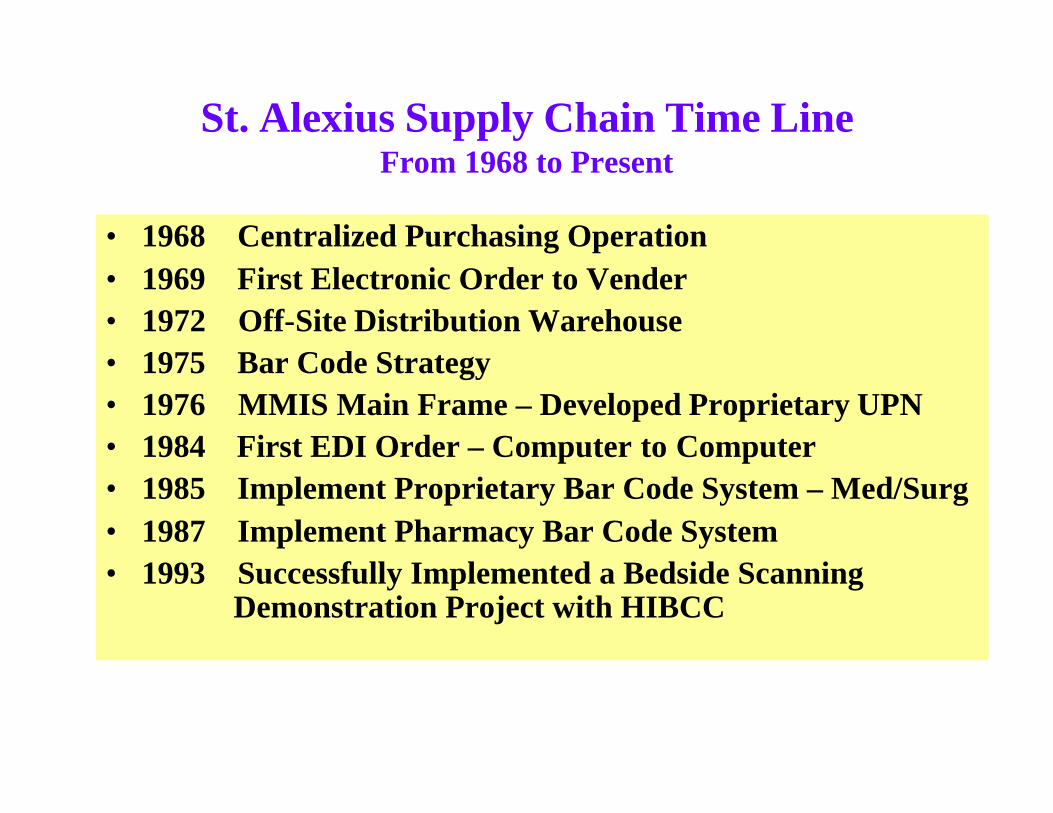
St. Alexius Supply Chain Time LineFrom 1968 to Present
• 1968 Centralized Purchasing Operation
• 1969 First Electronic Order to Vender
• 1972 Off-Site Distribution Warehouse
• 1975 Bar Code Strategy
• 1976 MMIS Main Frame – Developed Proprietary UPN
• 1984 First EDI Order – Computer to Computer
• 1985 Implement Proprietary Bar Code System – Med/Surg
• 1987 Implement Pharmacy Bar Code System
• 1993 Successfully Implemented a Bedside Scanning Demonstration Project with HIBCC
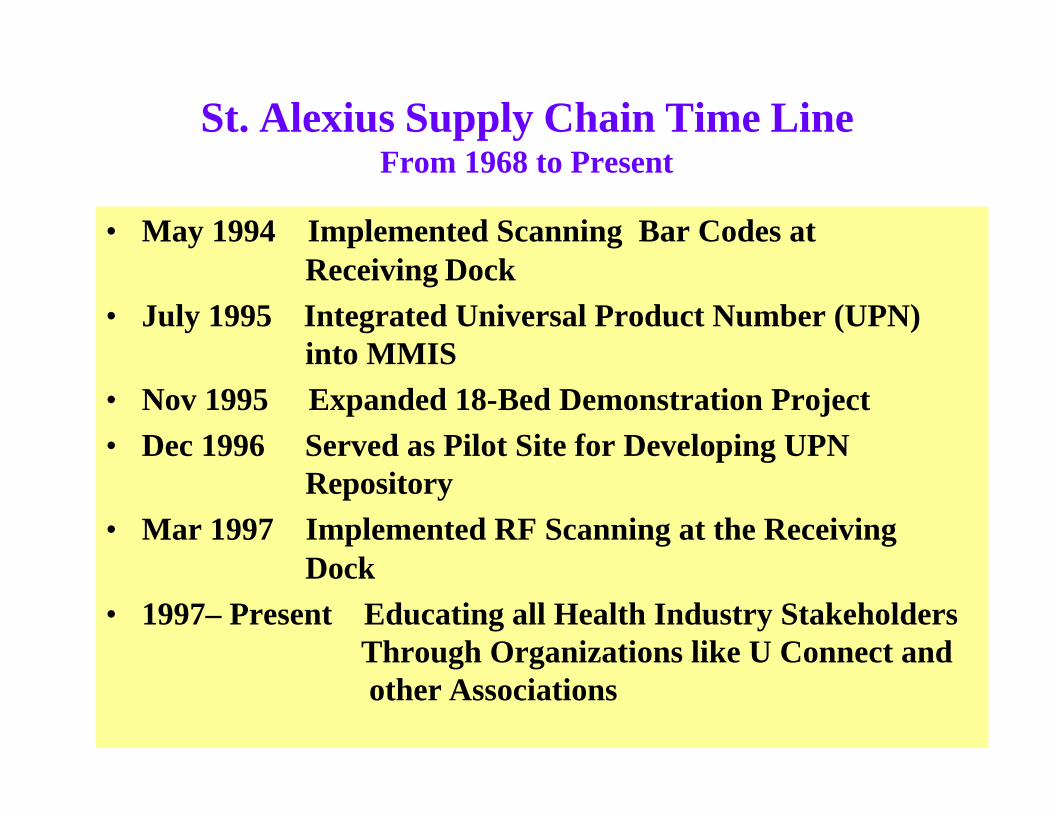
St. Alexius Supply Chain Time LineFrom 1968 to Present
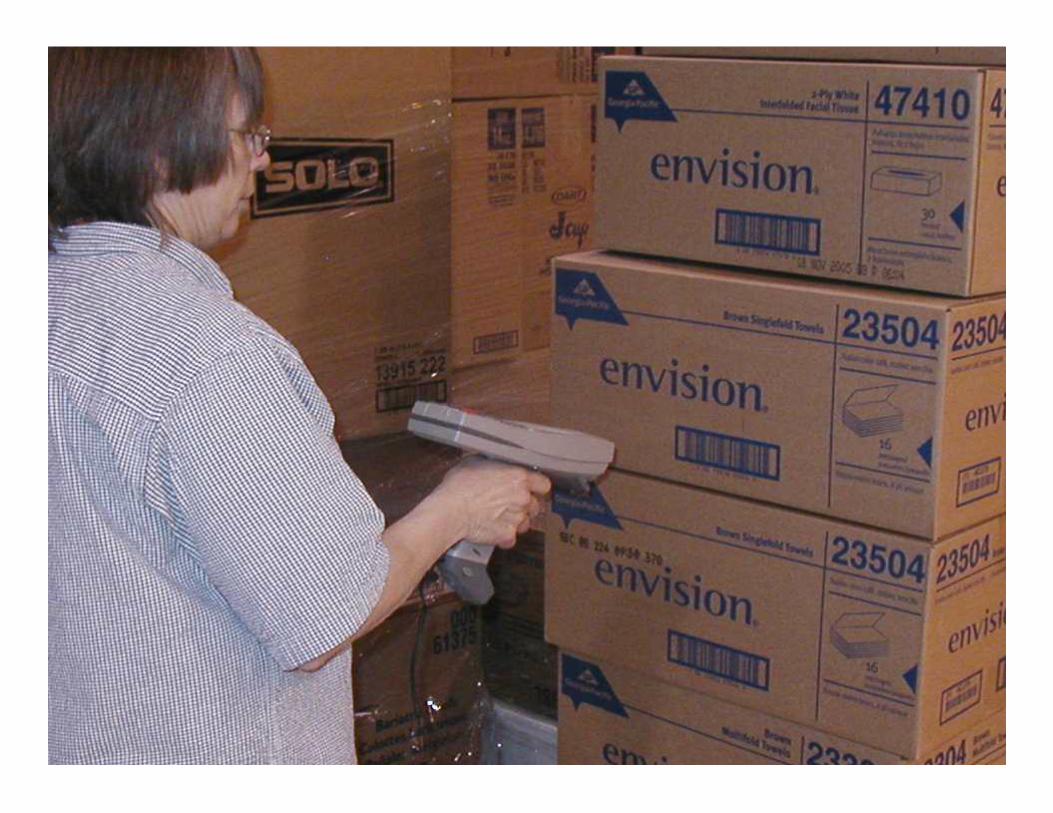
• May 1994 Implemented Scanning Bar Codes at Receiving Dock
• July 1995 Integrated Universal Product Number (UPN) into MMIS
• Nov 1995 Expanded 18-Bed Demonstration Project
• Dec 1996 Served as Pilot Site for Developing UPN Repository
• Mar 1997 Implemented RF Scanning at the Receiving Dock
• 1997– Present Educating all Health Industry Stakeholders Through Organizations like U Connect and other Associations
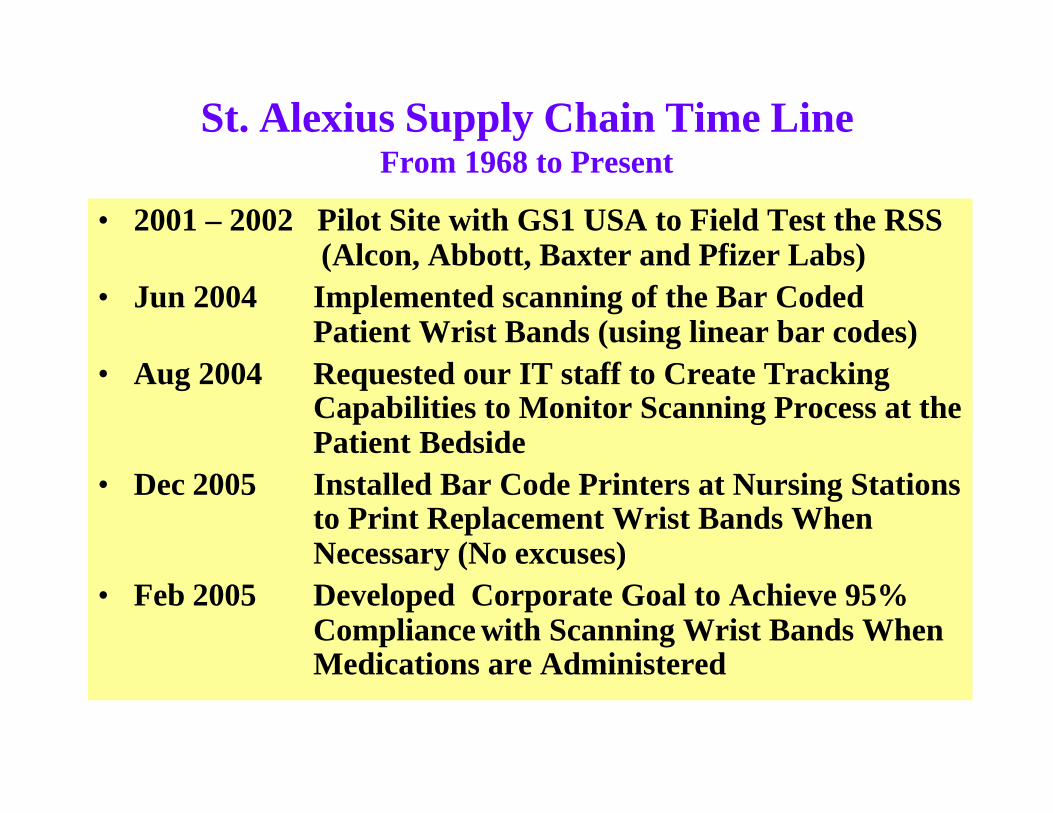
St. Alexius Supply Chain Time LineFrom 1968 to Present
• 2001 – 2002 Pilot Site with GS1 USA to Field Test the RSS (Alcon, Abbott, Baxter and Pfizer Labs)
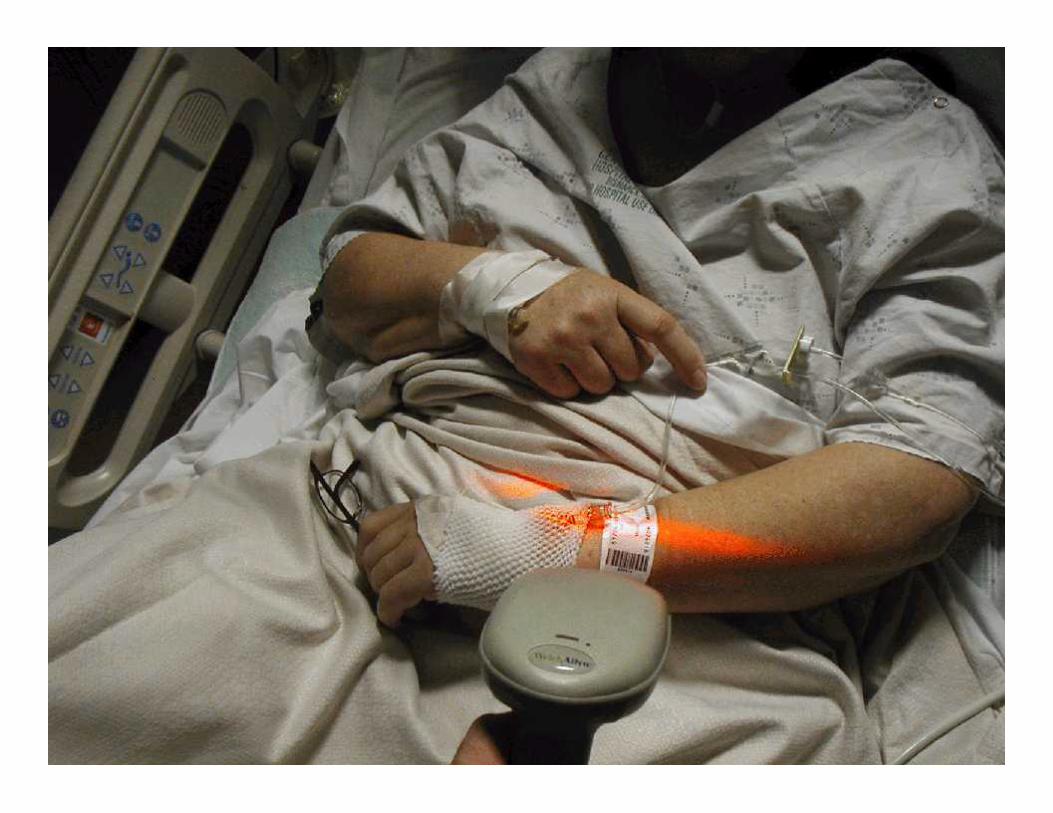
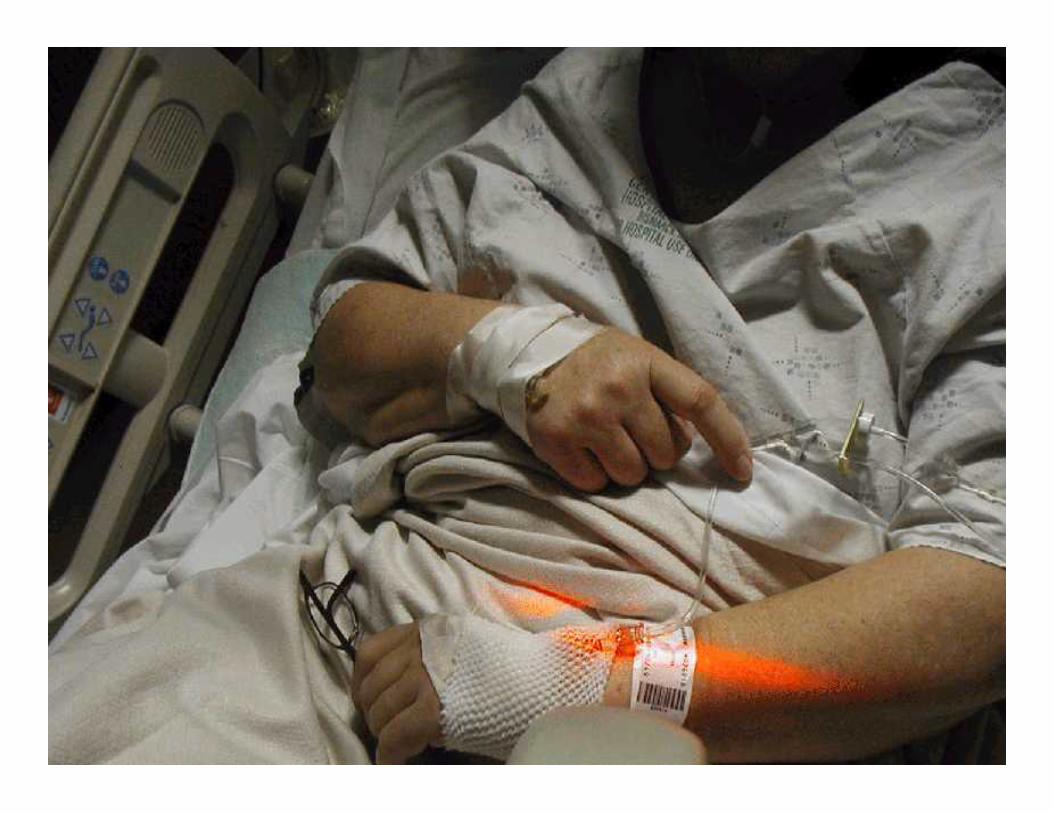
• Jun 2004 Implemented scanning of the Bar Coded Patient Wrist Bands (using linear bar codes)
• Aug 2004 Requested our IT staff to Create Tracking Capabilities to Monitor Scanning Process at the Patient Bedside
• Dec 2005 Installed Bar Code Printers at Nursing Stations to Print Replacement Wrist Bands When Necessary (No excuses)
• Feb 2005 Developed Corporate Goal to Achieve 95% Compliance with Scanning Wrist Bands When Medications are Administered
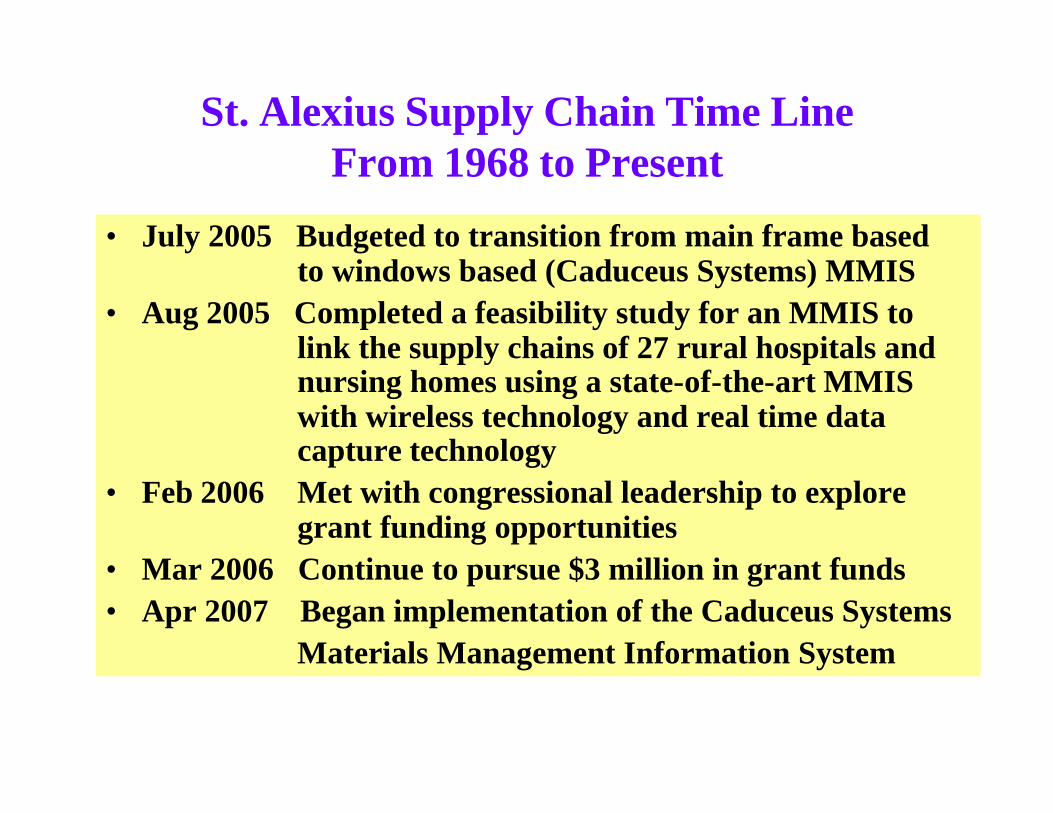
St. Alexius Supply Chain Time LineFrom 1968 to Present
• July 2005 Budgeted to transition from main frame based to windows based (Caduceus Systems) MMIS
• Aug 2005 Completed a feasibility study for an MMIS to link the supply chains of 27 rural hospitals and nursing homes using a state-of-the-art MMIS with wireless technology and real time data capture technology
• Feb 2006 Met with congressional leadership to explore grant funding opportunities
• Mar 2006 Continue to pursue $3 million in grant funds
• Apr 2007 Began implementation of the Caduceus Systems
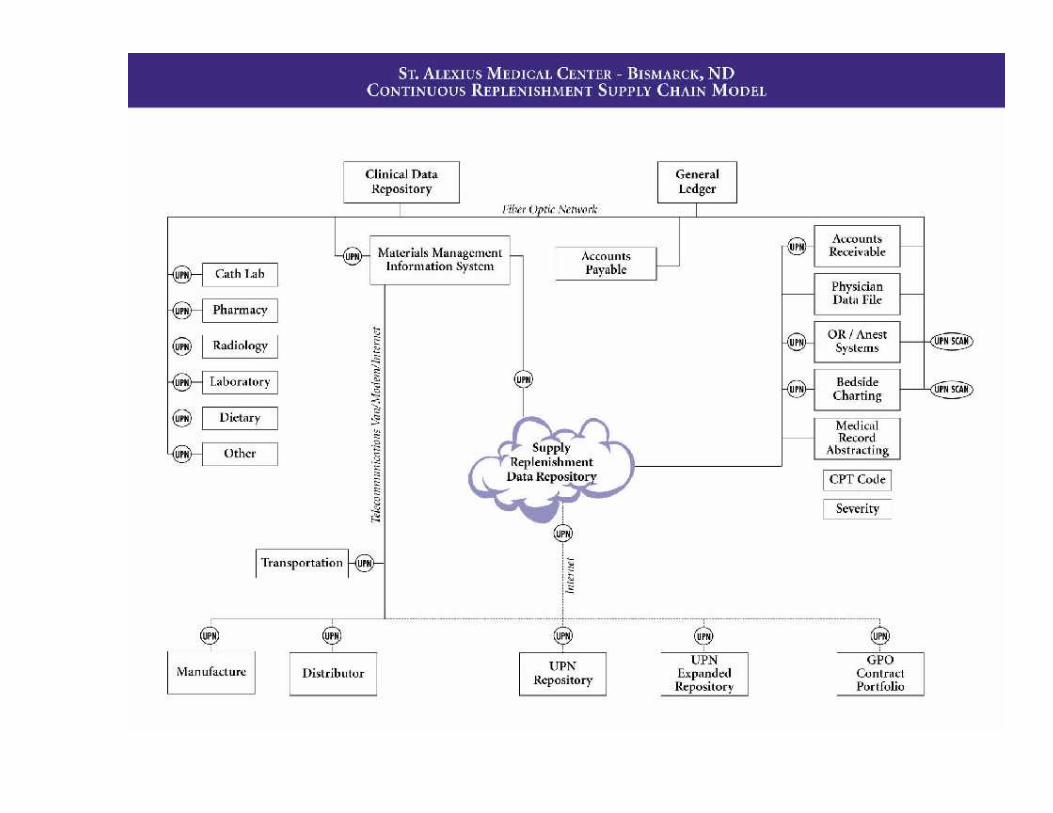
Materials Management Information System
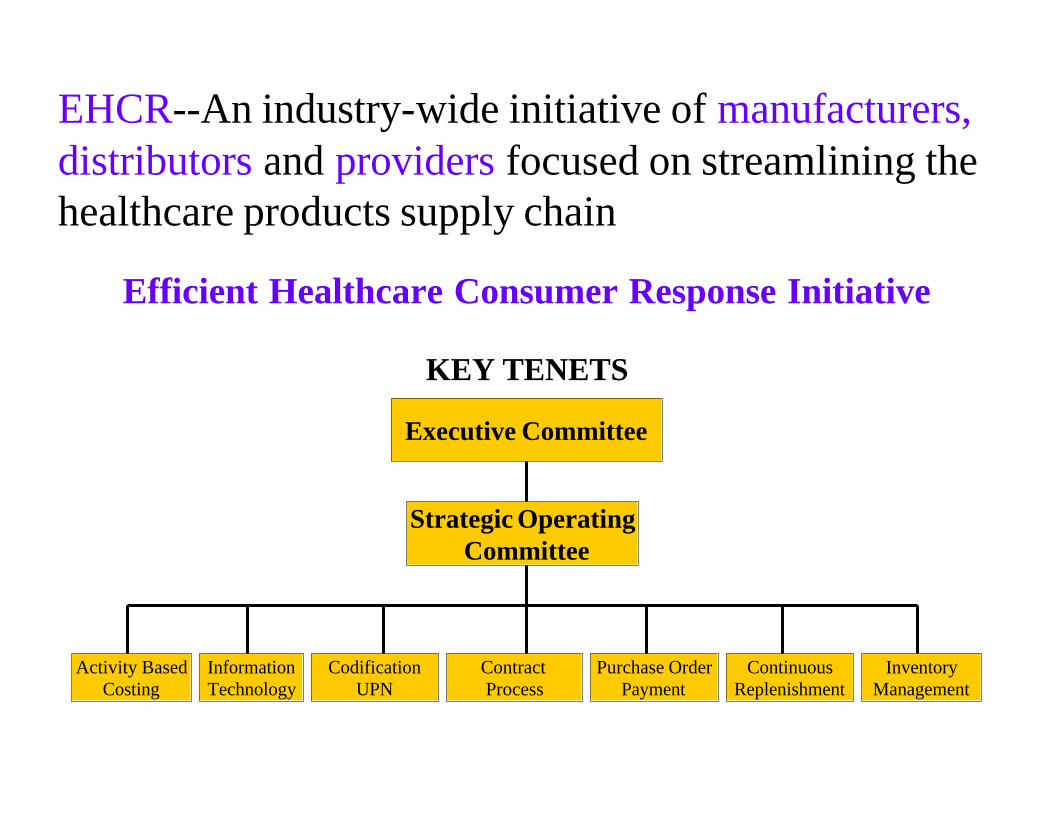
EHCR--An industry-wide initiative of manufacturers, distributors and providers focused on streamlining the healthcare products supply chain
Efficient Healthcare Consumer Response Initiative
KEY TENETS
Executive Committee
Strategic OperatingCommittee
Activity BasedCosting
Contract Process
Purchase OrderPayment
ContinuousReplenishment
InventoryManagement
InformationTechnology
CodificationUPN
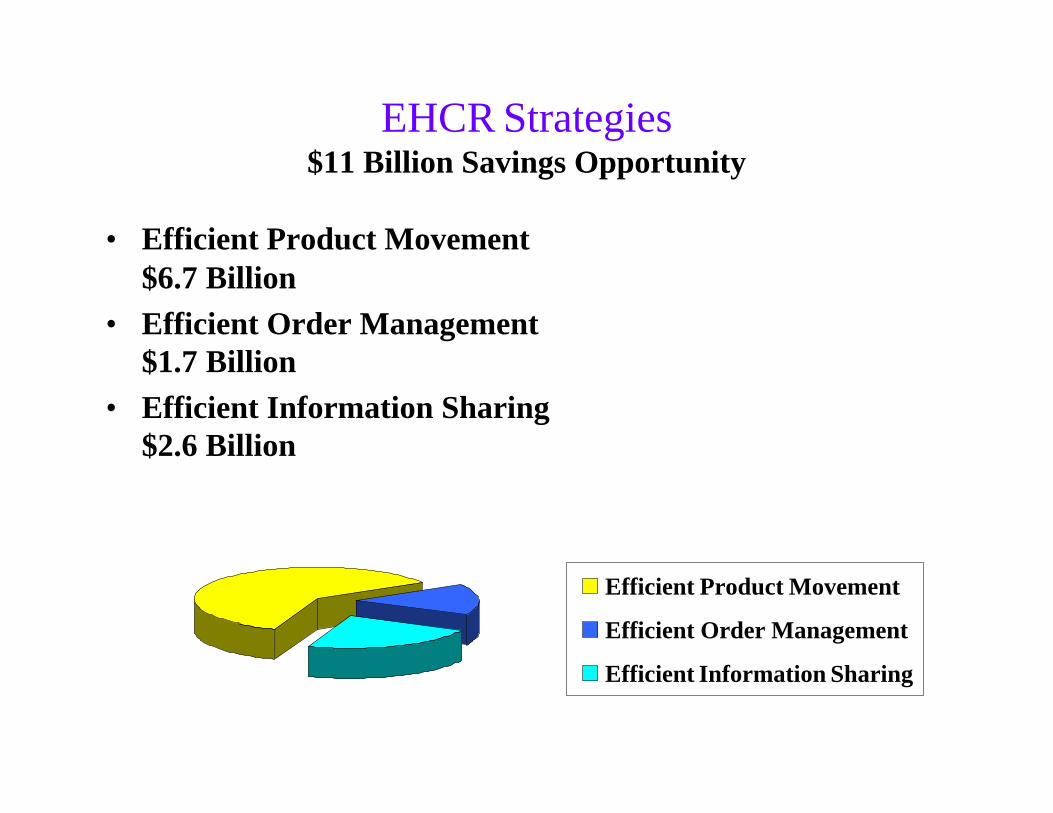
EHCR Strategies$11 Billion Savings Opportunity
• Efficient Product Movement $6.7 Billion
• Efficient Order Management $1.7 Billion
• Efficient Information Sharing $2.6 Billion
Efficient Product Movement
Efficient Order Management
Efficient Information Sharing
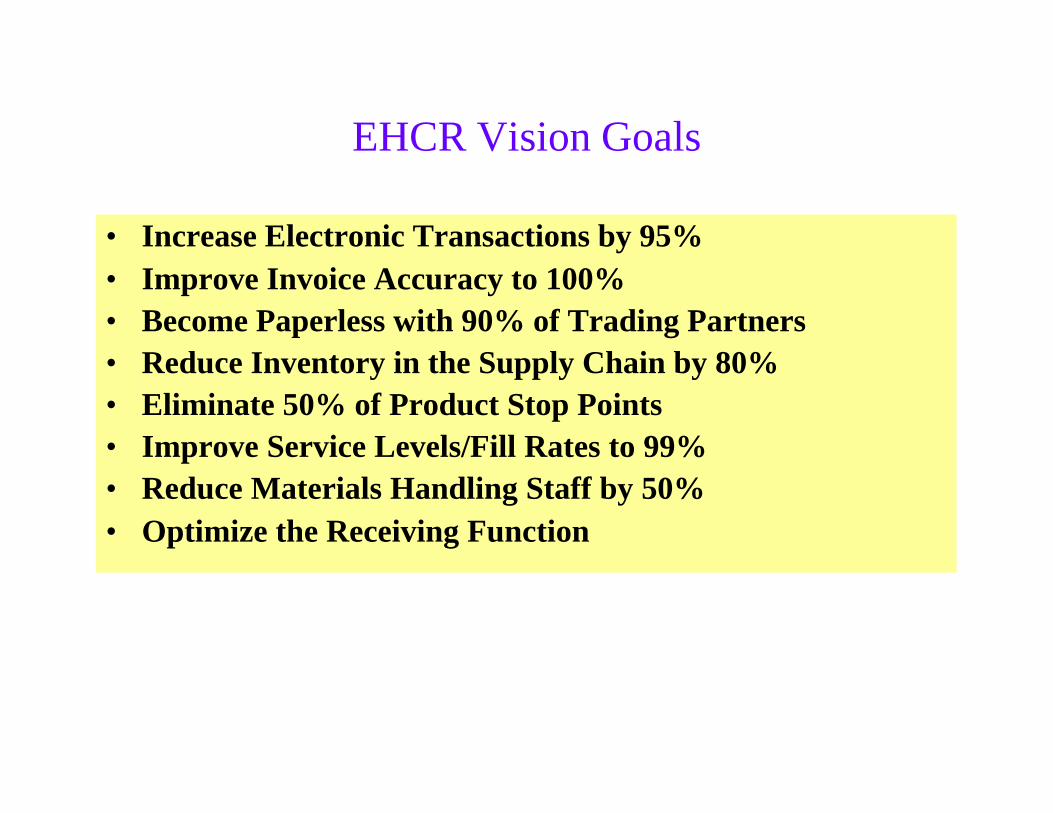
EHCR Vision Goals
• Increase Electronic Transactions by 95%
• Improve Invoice Accuracy to 100%
• Become Paperless with 90% of Trading Partners
• Reduce Inventory in the Supply Chain by 80%
• Eliminate 50% of Product Stop Points
• Improve Service Levels/Fill Rates to 99%
• Reduce Materials Handling Staff by 50%
• Optimize the Receiving Function
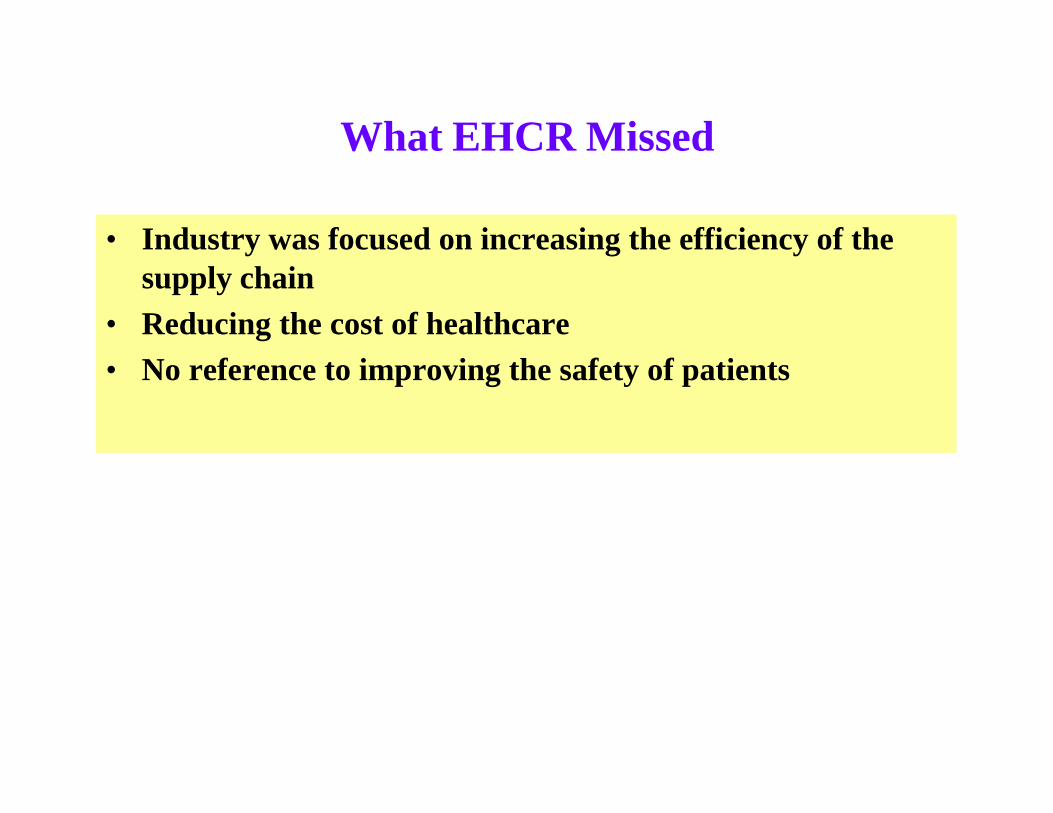
What EHCR Missed
• Industry was focused on increasing the efficiency of the supply chain
• Reducing the cost of healthcare
• No reference to improving the safety of patients
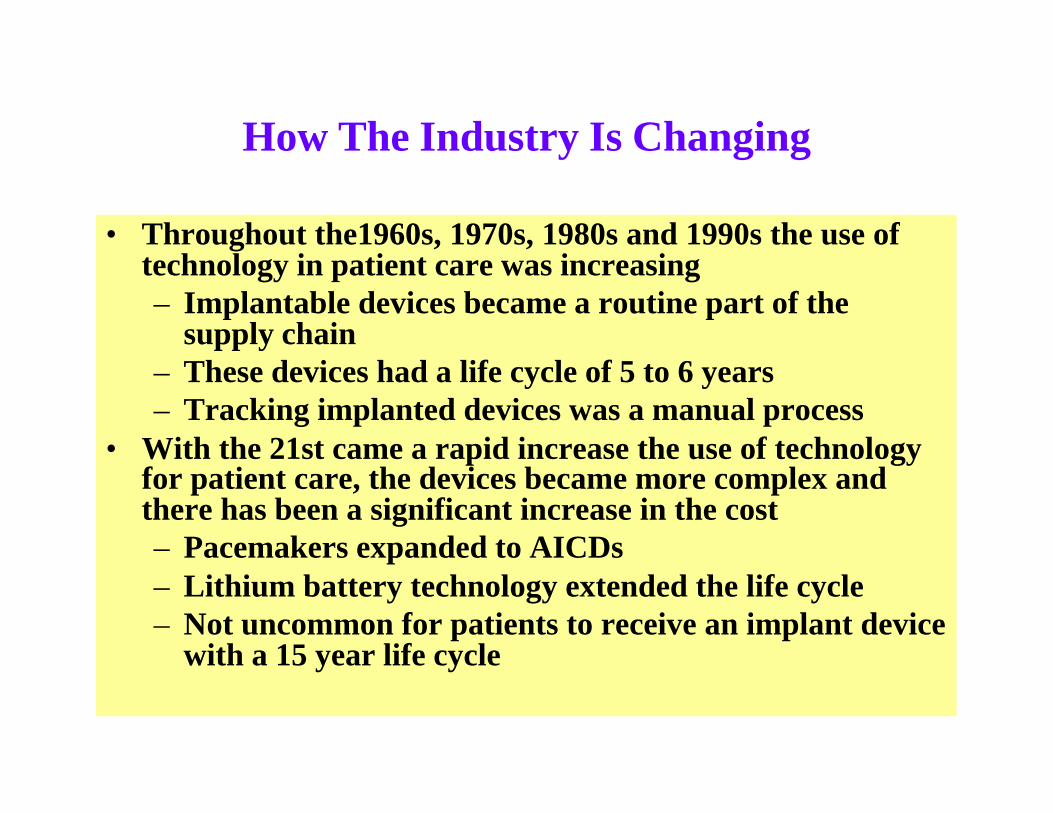
How The Industry Is Changing
• Throughout the1960s, 1970s, 1980s and 1990s the use of technology in patient care was increasing – Implantable devices became a routine part of the
supply chain – These devices had a life cycle of 5 to 6 years– Tracking implanted devices was a manual process
• With the 21st came a rapid increase the use of technology for patient care, the devices became more complex and there has been a significant increase in the cost– Pacemakers expanded to AICDs– Lithium battery technology extended the life cycle– Not uncommon for patients to receive an implant device
with a 15 year life cycle
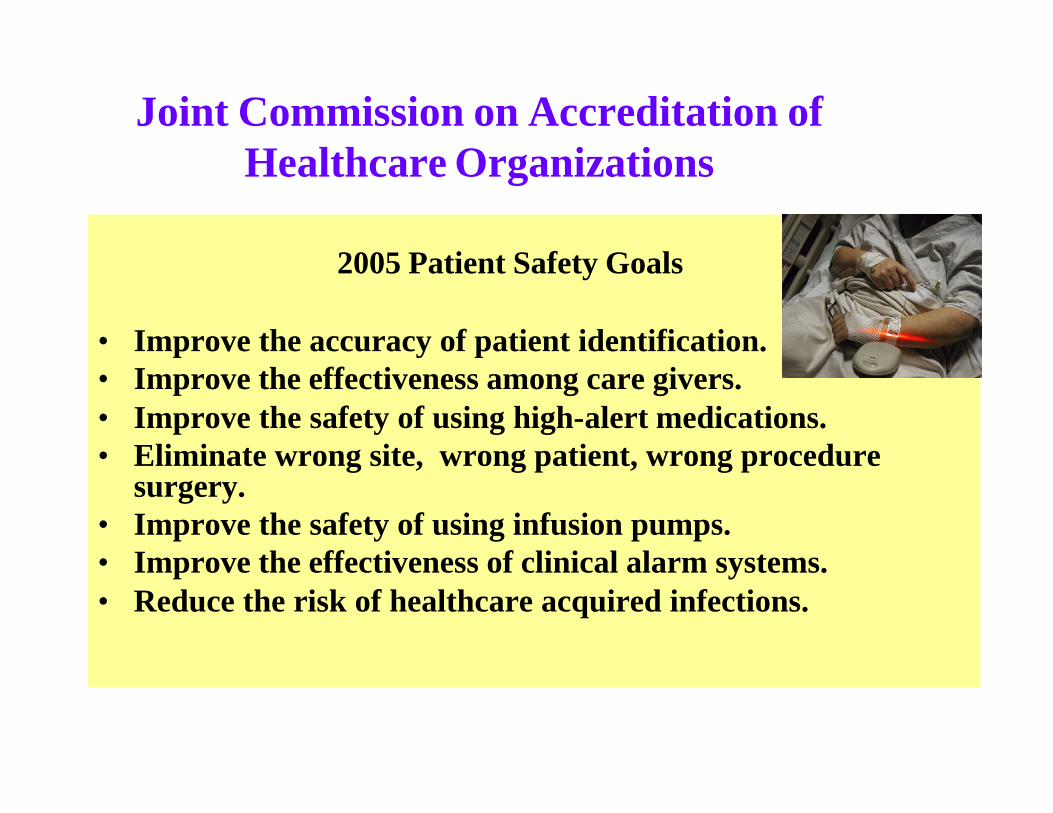
Joint Commission on Accreditation of Healthcare Organizations
2005 Patient Safety Goals
• Improve the accuracy of patient identification.• Improve the effectiveness among care givers.• Improve the safety of using high-alert medications. • Eliminate wrong site, wrong patient, wrong procedure
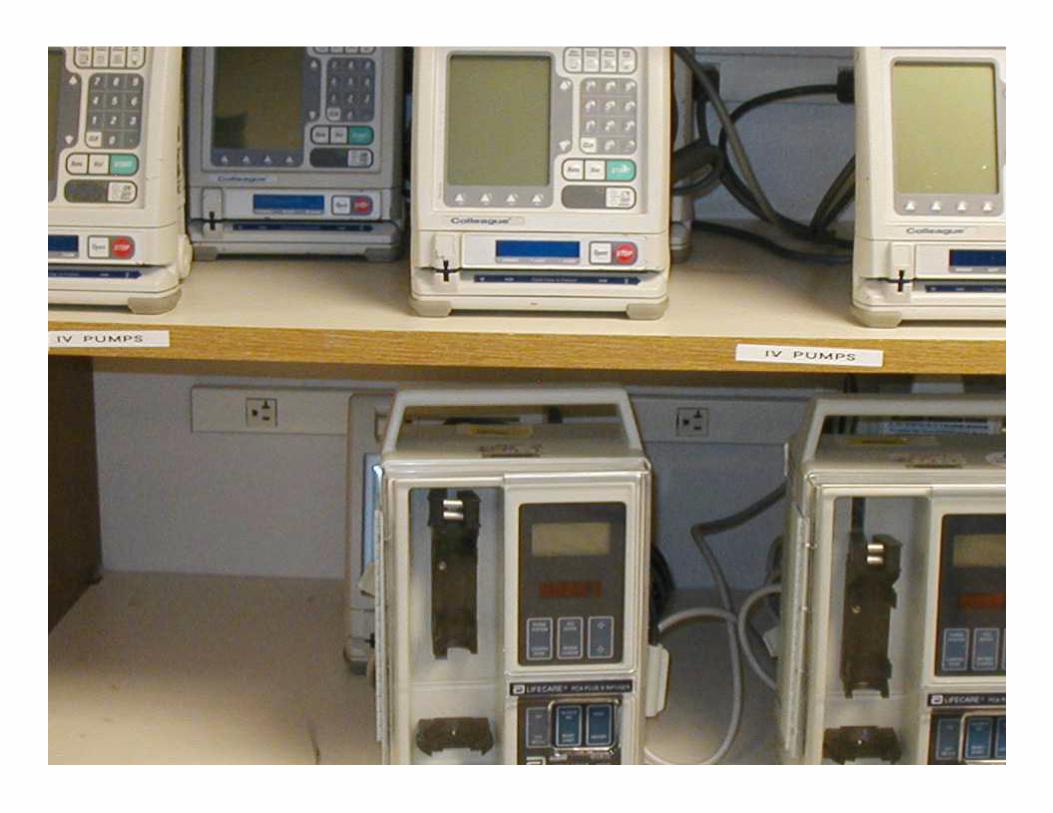
surgery. • Improve the safety of using infusion pumps.• Improve the effectiveness of clinical alarm systems.• Reduce the risk of healthcare acquired infections.
U.S. Food and Drug Administration Launches New Program
The Center for Devices and Radiological Health’sPostmarket Transformation Initiative will better protect the public health by allowing the FDA to identify, analyze and act on problems more quickly, including alerting the public sooner of potential medical device issues.“Over the next decade, medical technology innovations will fundamentally transform the health care and delivery system, providing new solutions with medical devices that will challenge existing paradigms and revolutionize the way treatments are delivered,” said Scott Gottlieb, FDA’s Deputy Commissioner for Medical and Scientific Affairs. www.fda.gov/cdrh/postmarket/mdpi.html
Source: HPN Daily Update – January 24, 2006
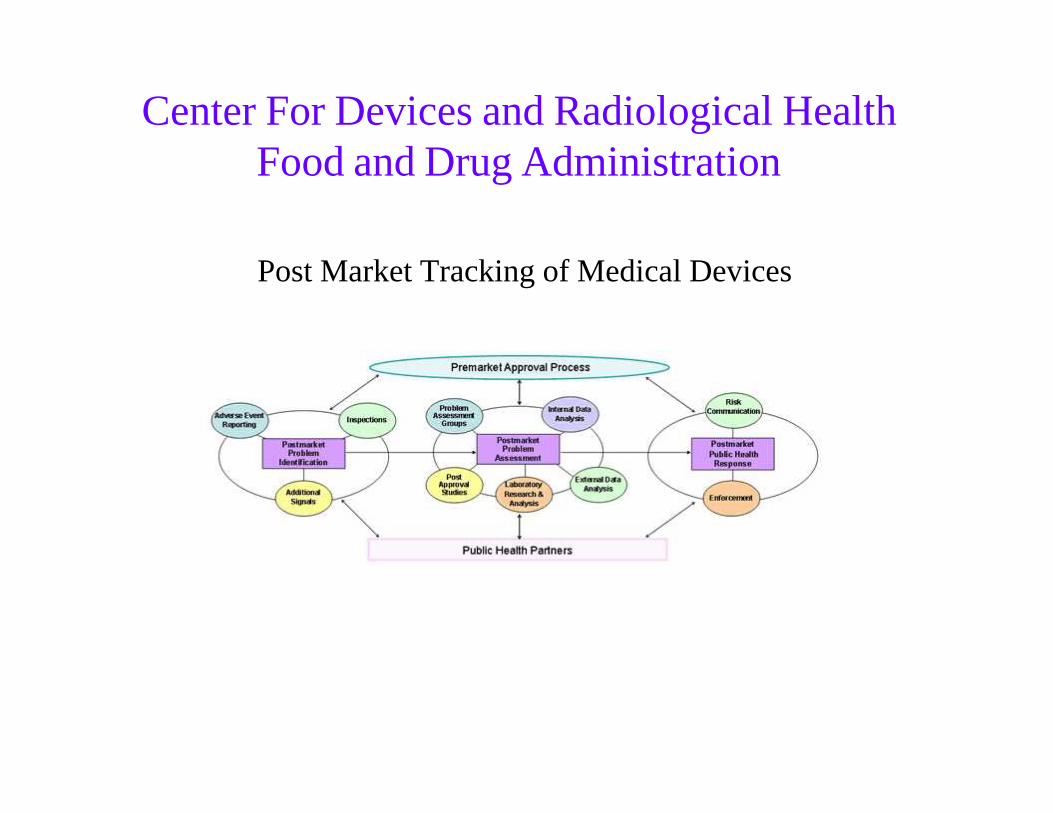
Center For Devices and Radiological HealthFood and Drug Administration
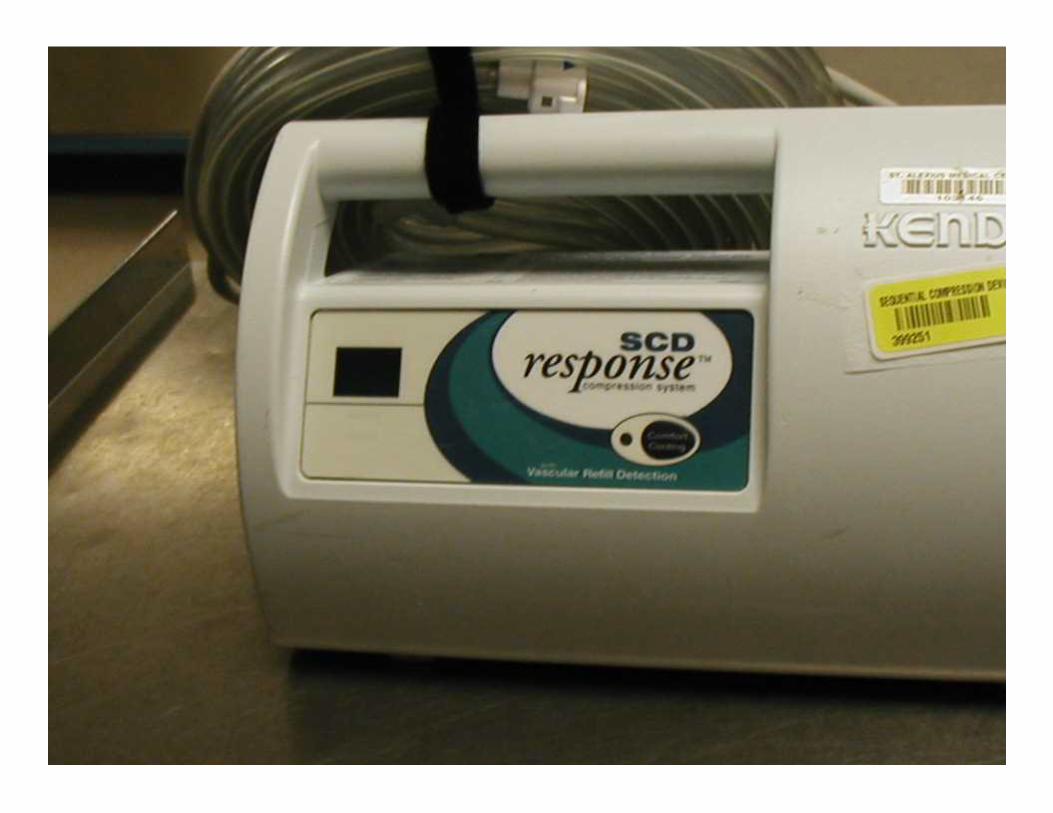
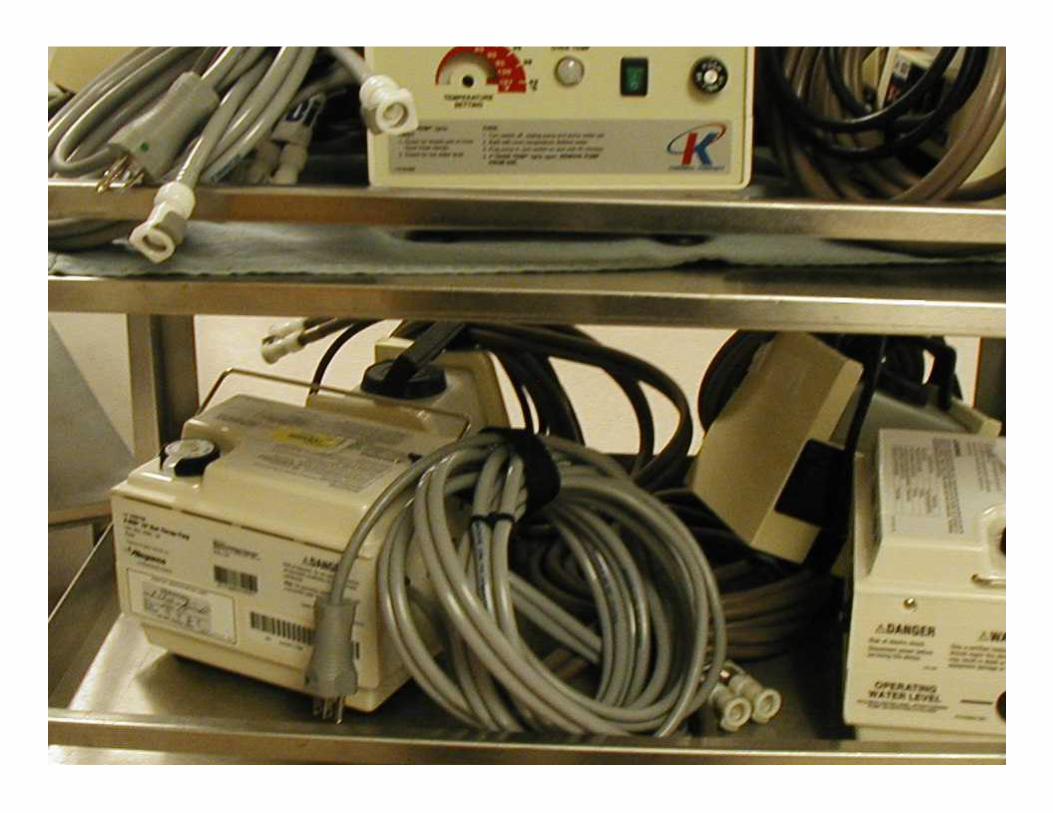
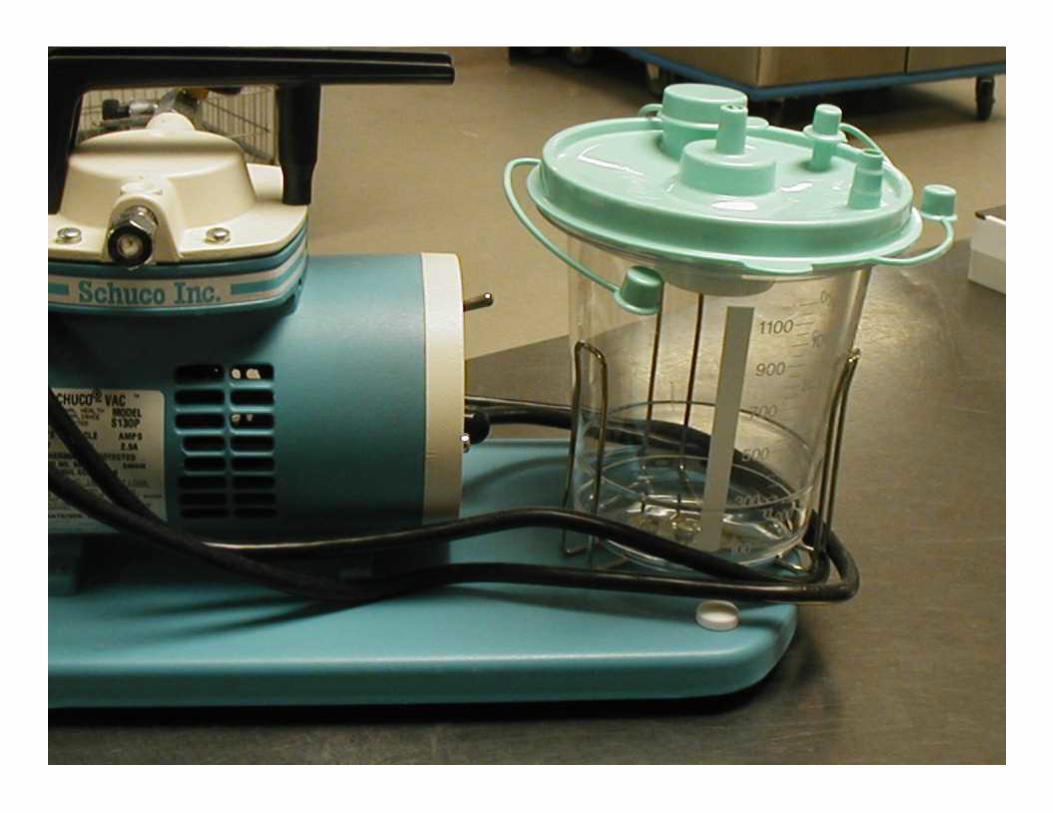
Post Market Tracking of Medical Devices
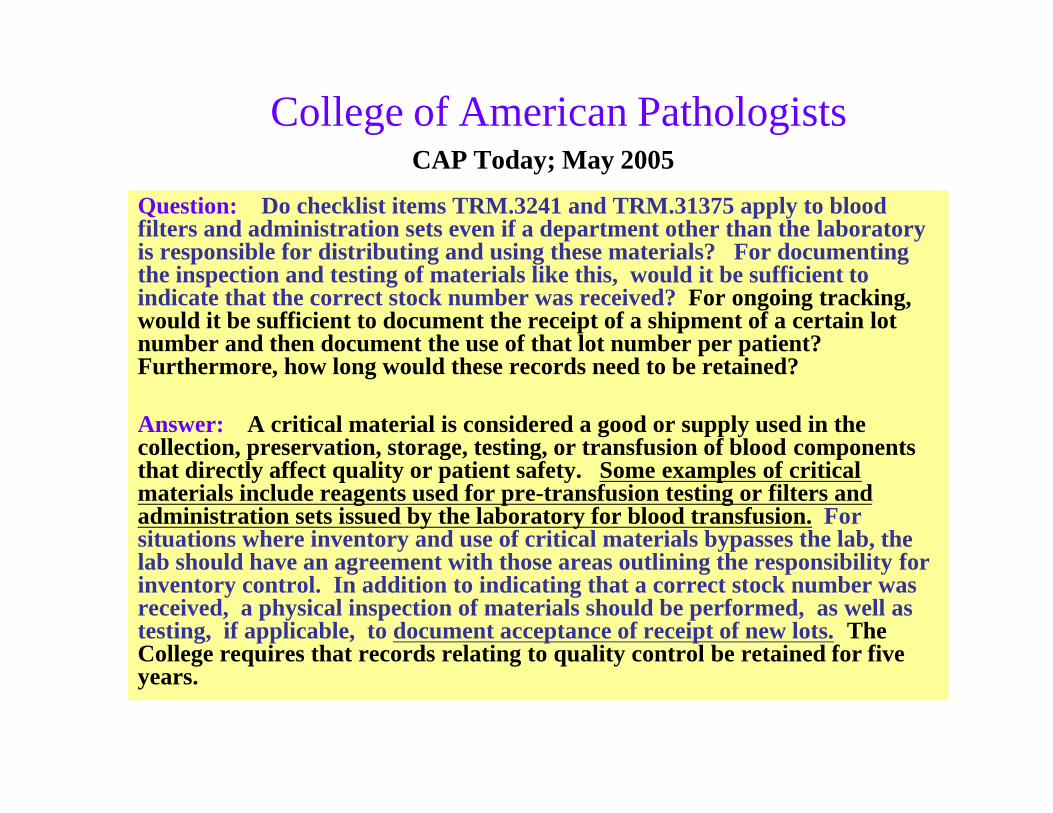
College of American PathologistsCAP Today; May 2005
Question: Do checklist items TRM.3241 and TRM.31375 apply to blood filters and administration sets even if a department other than the laboratory is responsible for distributing and using these materials? For documenting the inspection and testing of materials like this, would it be sufficient to indicate that the correct stock number was received? For ongoing tracking, would it be sufficient to document the receipt of a shipment of a certain lot number and then document the use of that lot number per patient?Furthermore, how long would these records need to be retained?
Answer: A critical material is considered a good or supply used in the collection, preservation, storage, testing, or transfusion of blood components that directly affect quality or patient safety. Some examples of critical materials include reagents used for pre-transfusion testing or filters and administration sets issued by the laboratory for blood transfusion. For situations where inventory and use of critical materials bypasses the lab, the lab should have an agreement with those areas outlining the responsibility for inventory control. In addition to indicating that a correct stock number was received, a physical inspection of materials should be performed, as well as testing, if applicable, to document acceptance of receipt of new lots. The College requires that records relating to quality control be retained for five years.
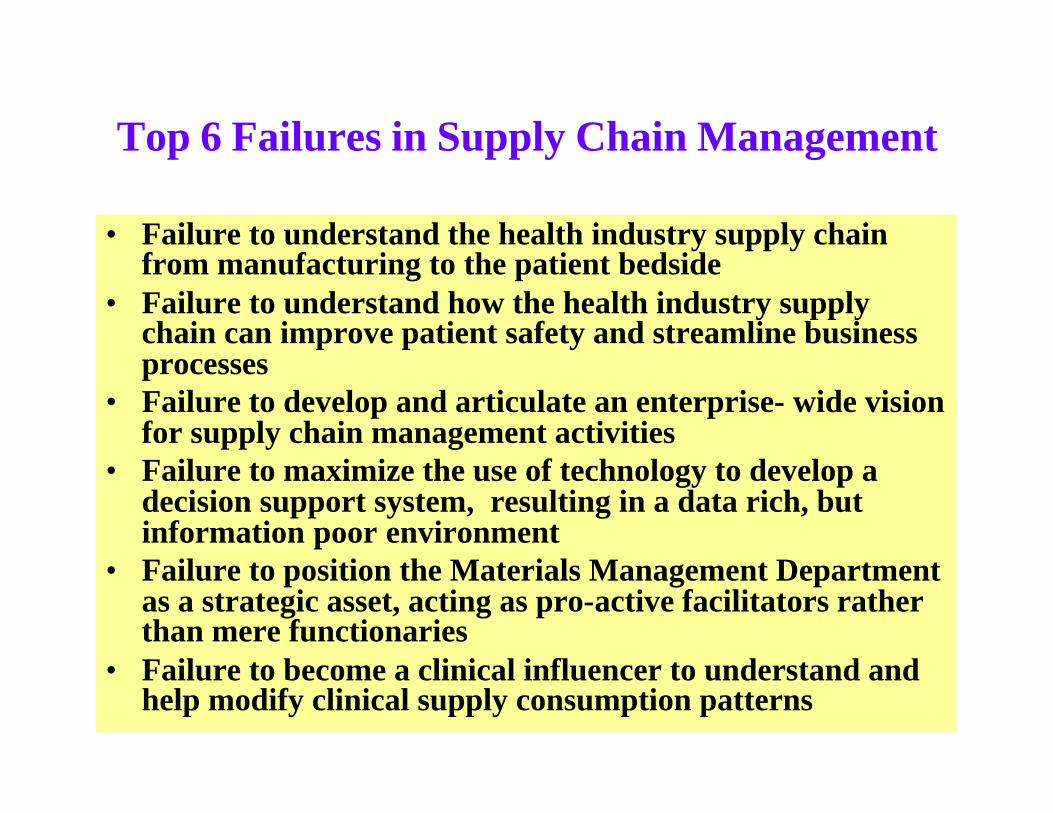
Top 6 Failures in Supply Chain Management
• Failure to understand the health industry supply chain from manufacturing to the patient bedside
• Failure to understand how the health industry supply chain can improve patient safety and streamline business processes
• Failure to develop and articulate an enterprise- wide vision for supply chain management activities
• Failure to maximize the use of technology to develop a decision support system, resulting in a data rich, but information poor environment
• Failure to position the Materials Management Department as a strategic asset, acting as pro-active facilitators rather than mere functionaries
• Failure to become a clinical influencer to understand and help modify clinical supply consumption patterns
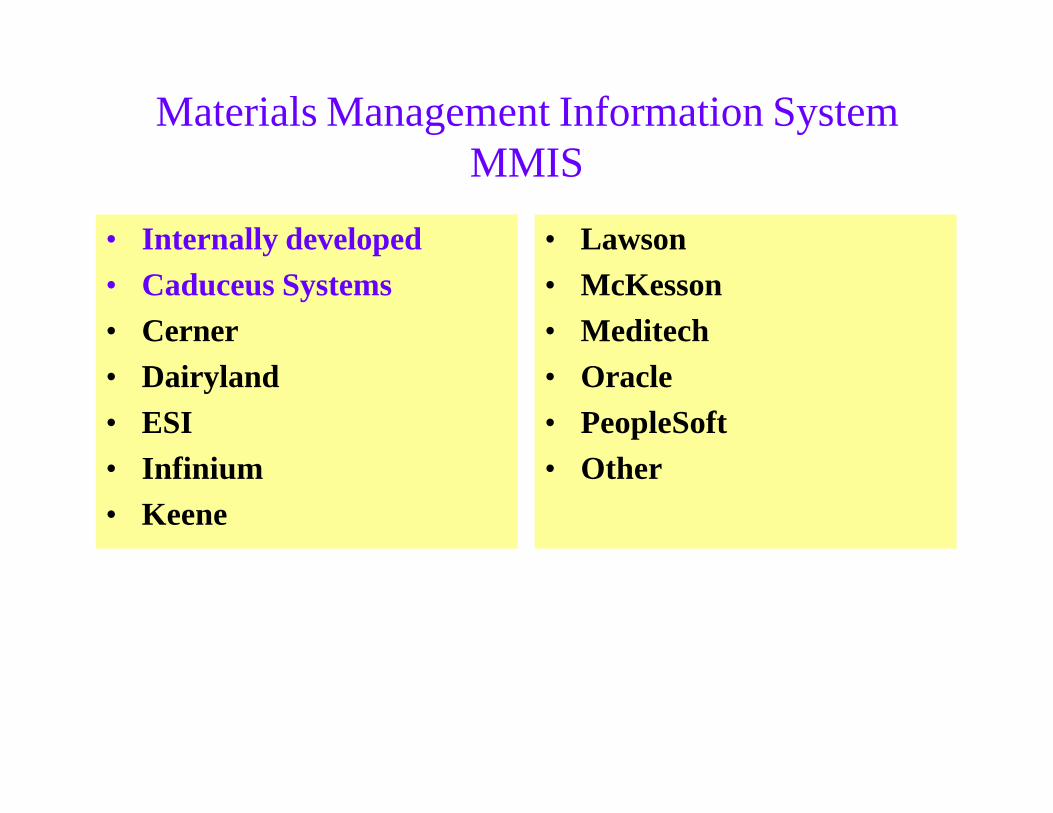
Materials Management Information SystemMMIS
• Internally developed
• Caduceus Systems
• Cerner
• Dairyland
• ESI
• Infinium
• Keene
• Lawson
• McKesson
• Meditech
• Oracle
• PeopleSoft
• Other
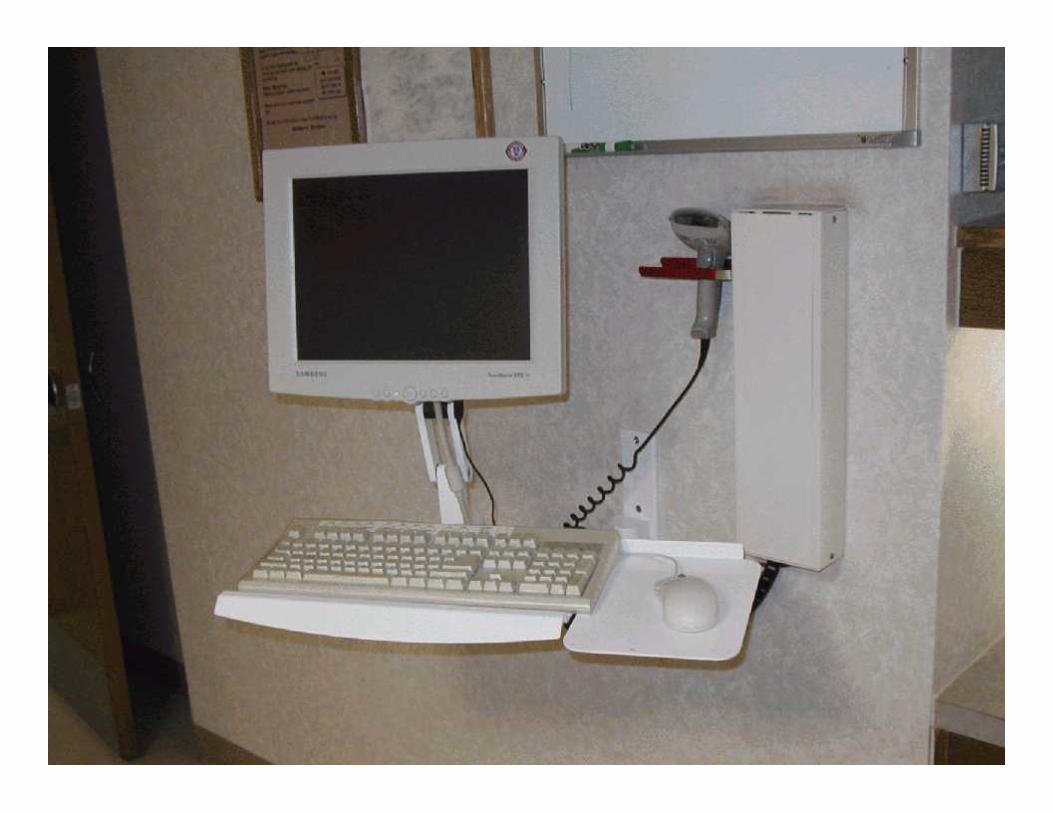
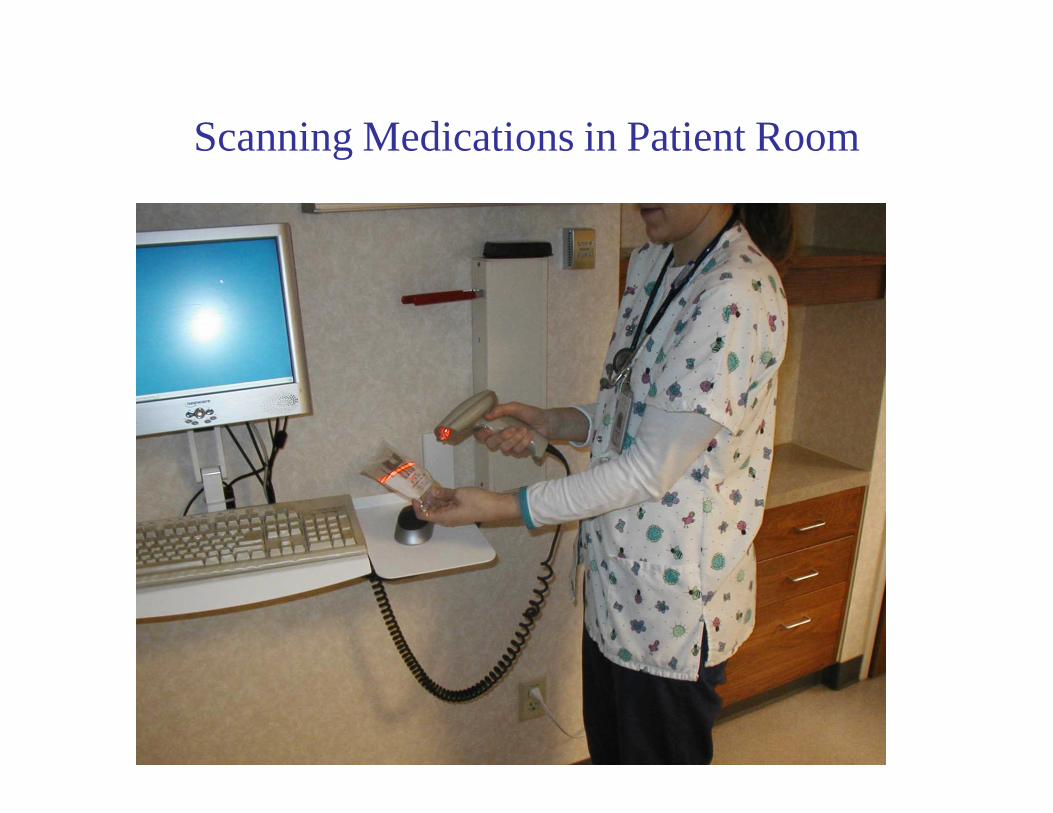
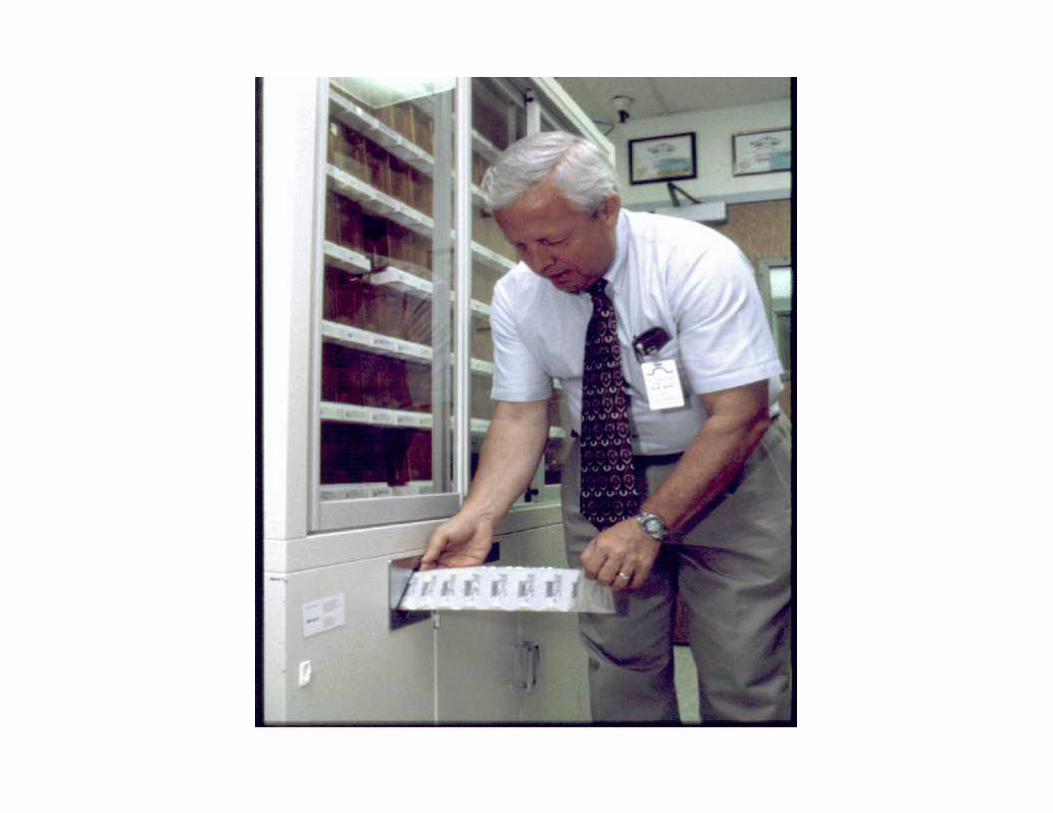
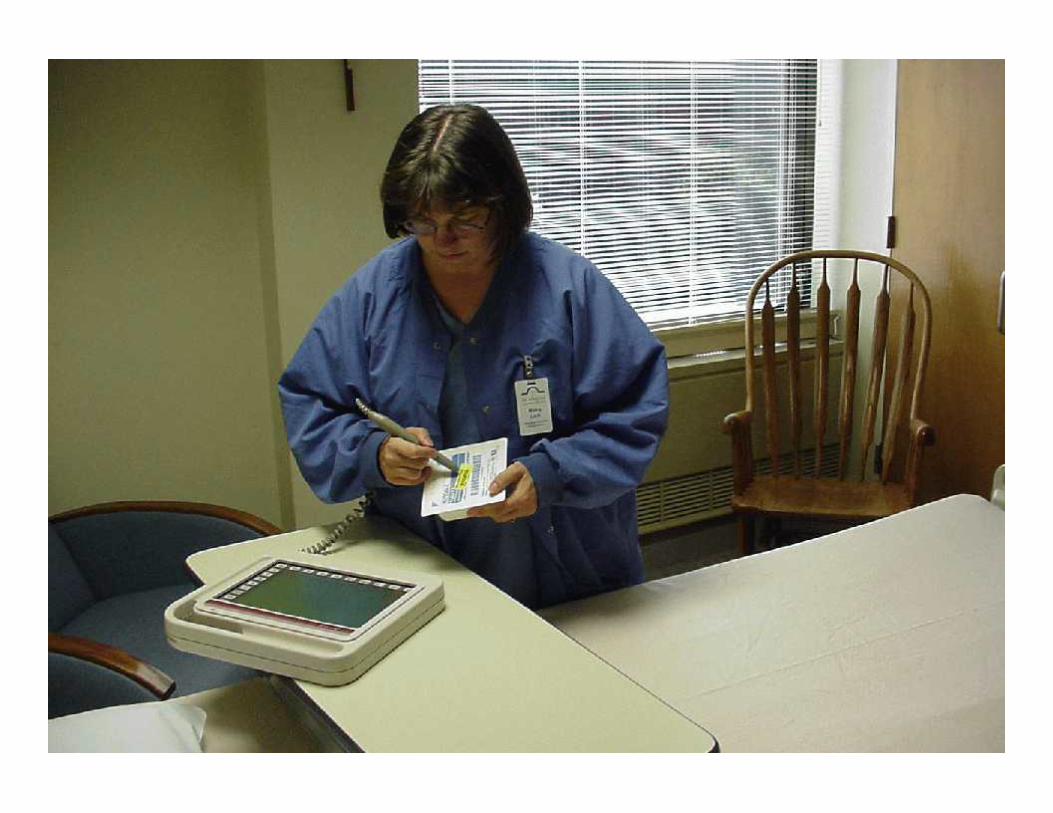
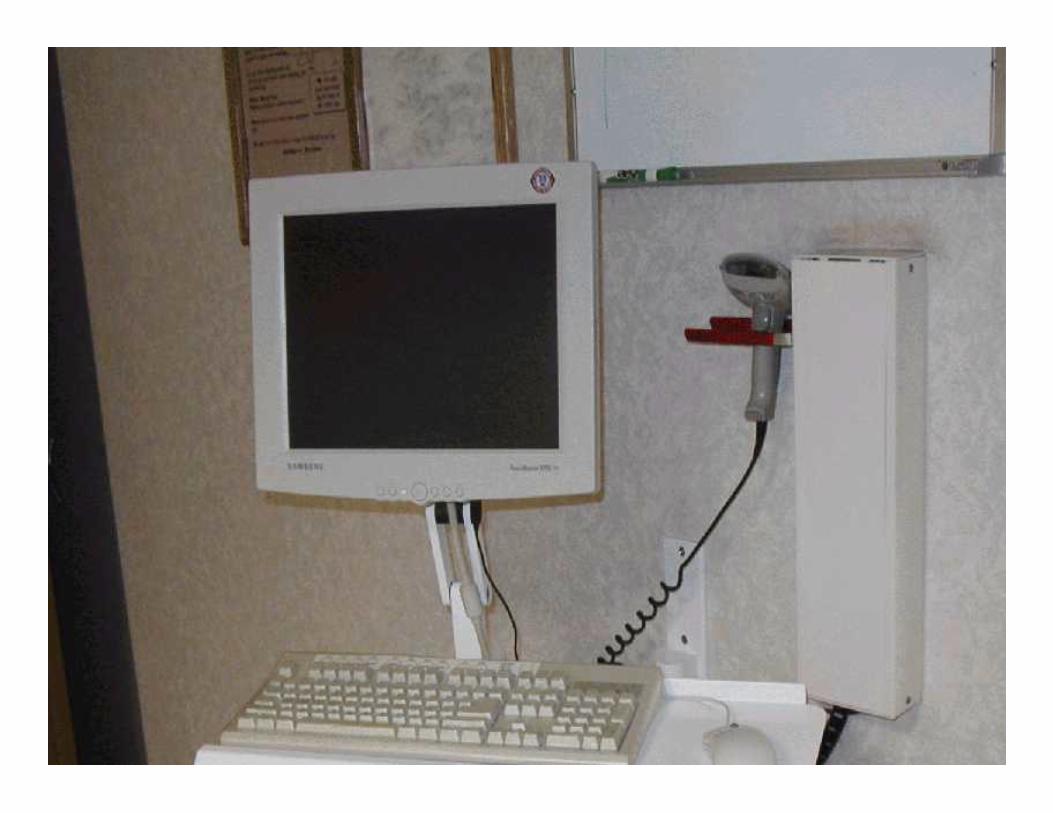
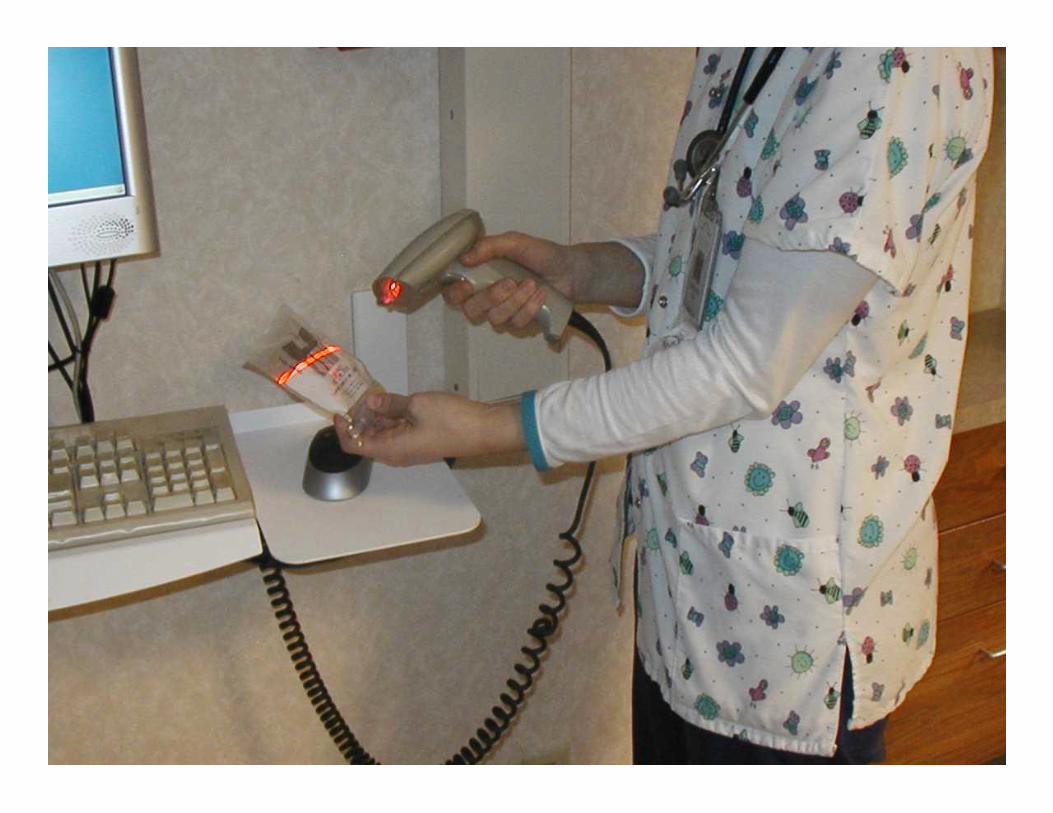
Scanning Medications in Patient Room
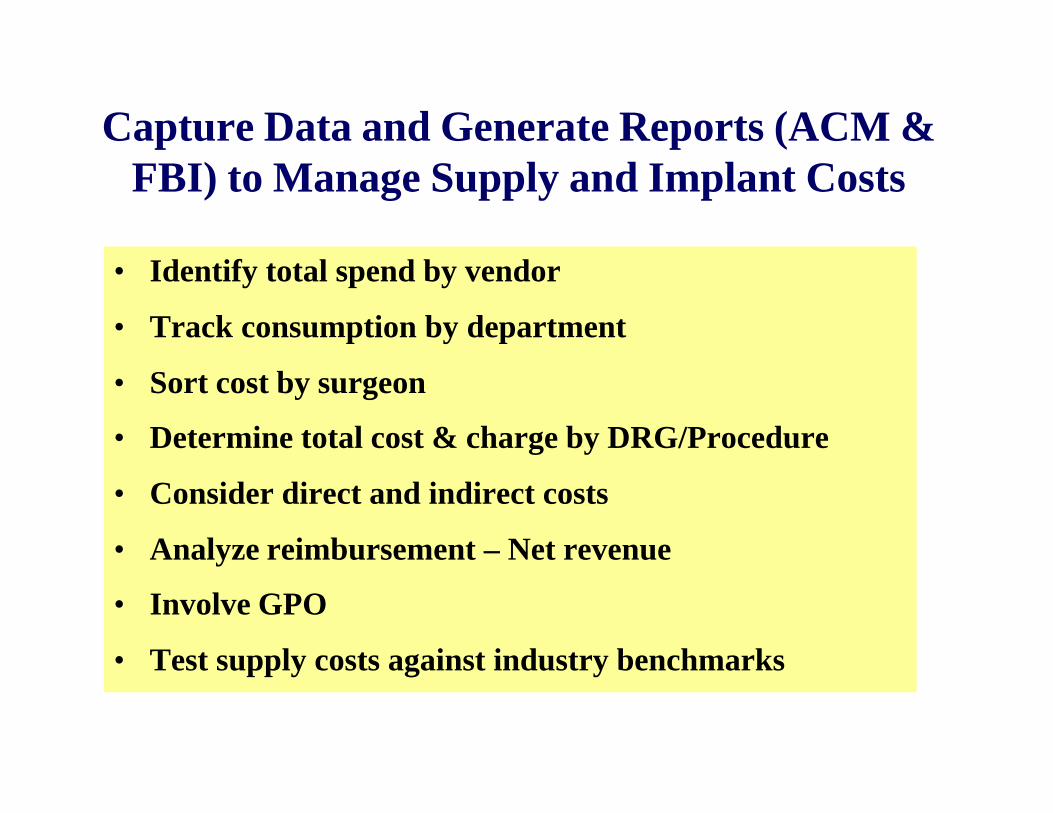
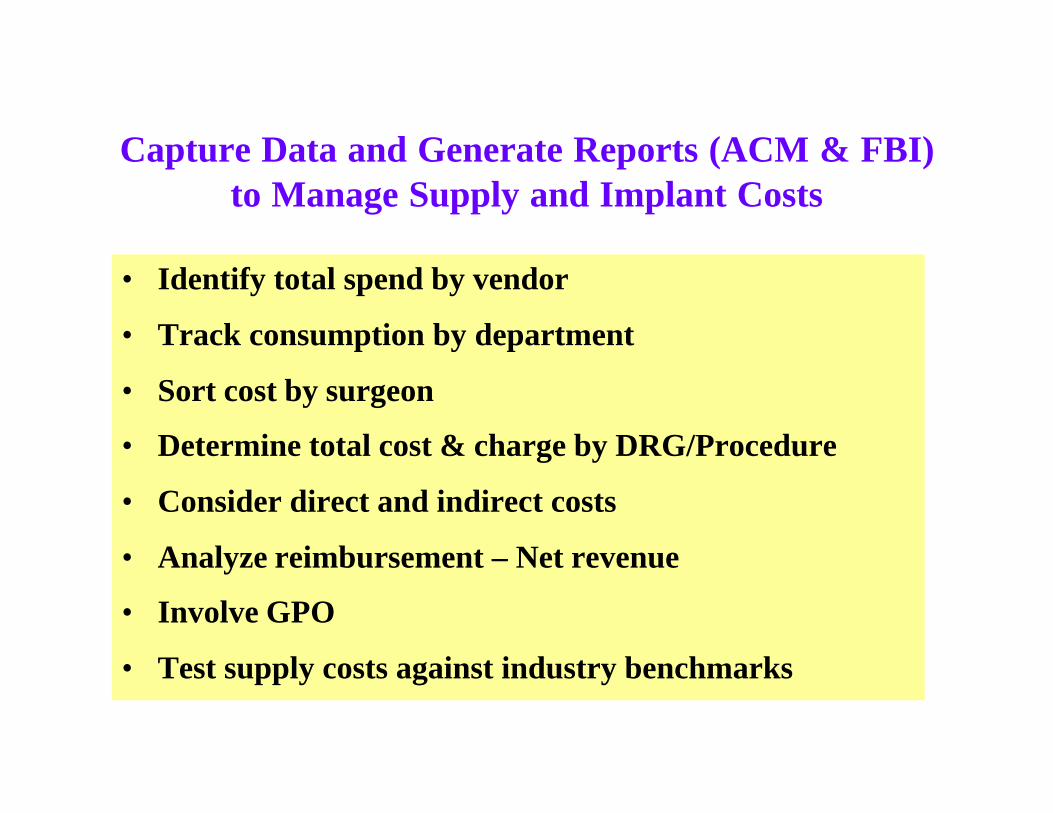
Capture Data and Generate Reports (ACM & FBI) to Manage Supply and Implant Costs
• Identify total spend by vendor
• Track consumption by department
• Sort cost by surgeon
• Determine total cost & charge by DRG/Procedure
• Consider direct and indirect costs
• Analyze reimbursement – Net revenue
• Involve GPO
• Test supply costs against industry benchmarks
Reimbursement History
• Analyze payer mix
• Assess profitability by product line
– Orthopedics
– Neurosurgery - Spine
– Cardiology
• Determine profitability of each physician
• Identify reimbursement for every patient
• Pursue opportunities to reduce costs
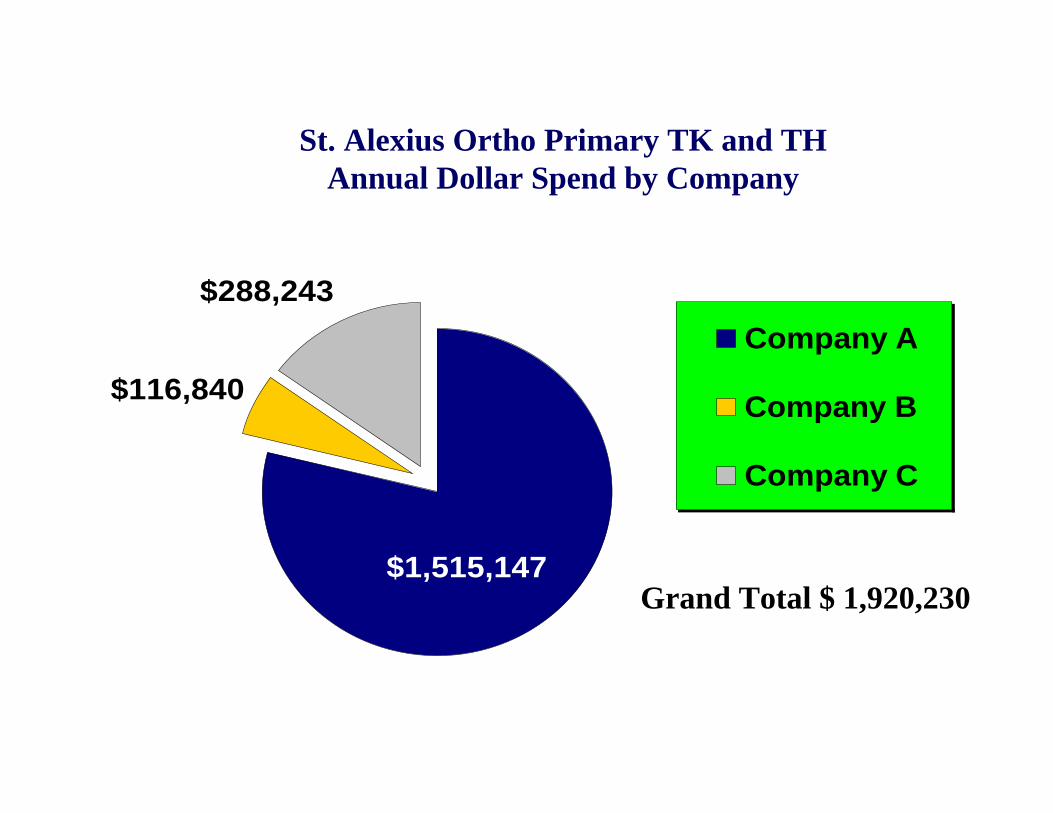
$116,840
$288,243
$1,515,147
Company A
Company B
Company C
St. Alexius Ortho Primary TK and TH Annual Dollar Spend by Company
Grand Total $ 1,920,230
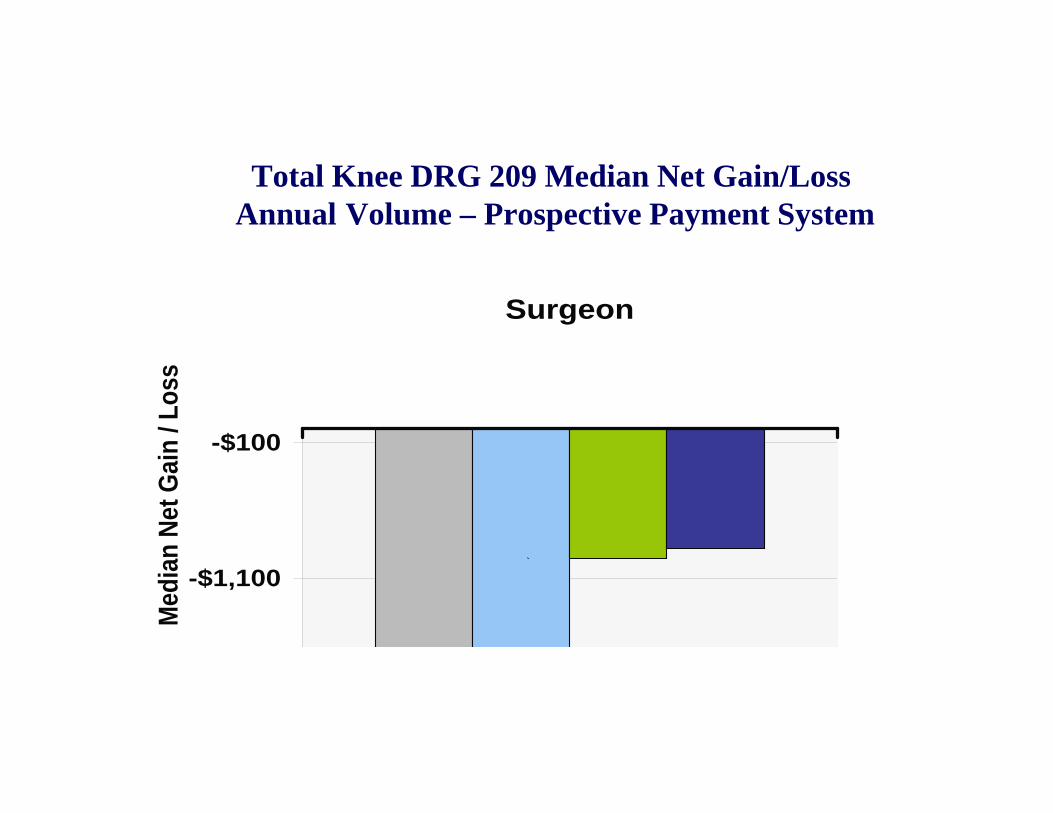
Total Knee DRG 209 Median Net Gain/LossAnnual Volume – Prospective Payment System
-$2,100
-$1,100
-$100
Surgeon
Med
ian
Net
Gai
n /
Lo
ss
`
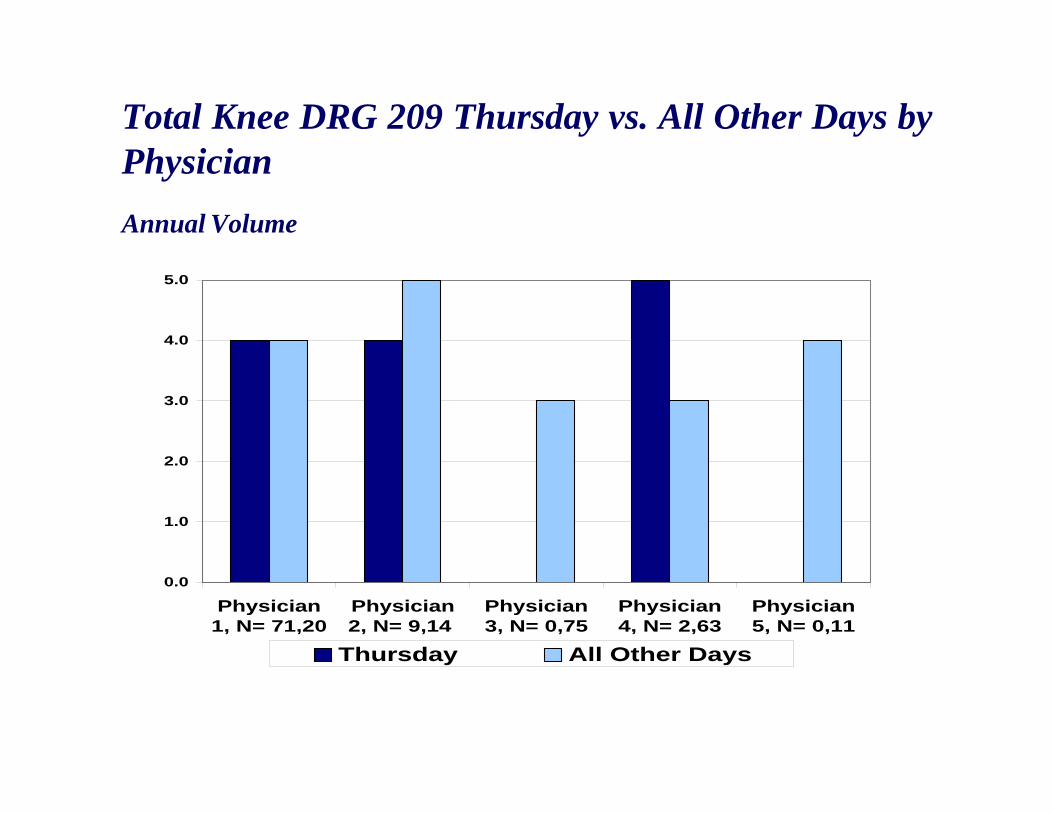
0.0
1.0
2.0
3.0
4.0
5.0
Physician1, N= 71,20
Physician2, N= 9,14
Physician3, N= 0,75
Physician4, N= 2,63
Physician5, N= 0,11
Thursday All Other Days
Total Knee DRG 209 Thursday vs. All Other Days by Physician
Annual Volume
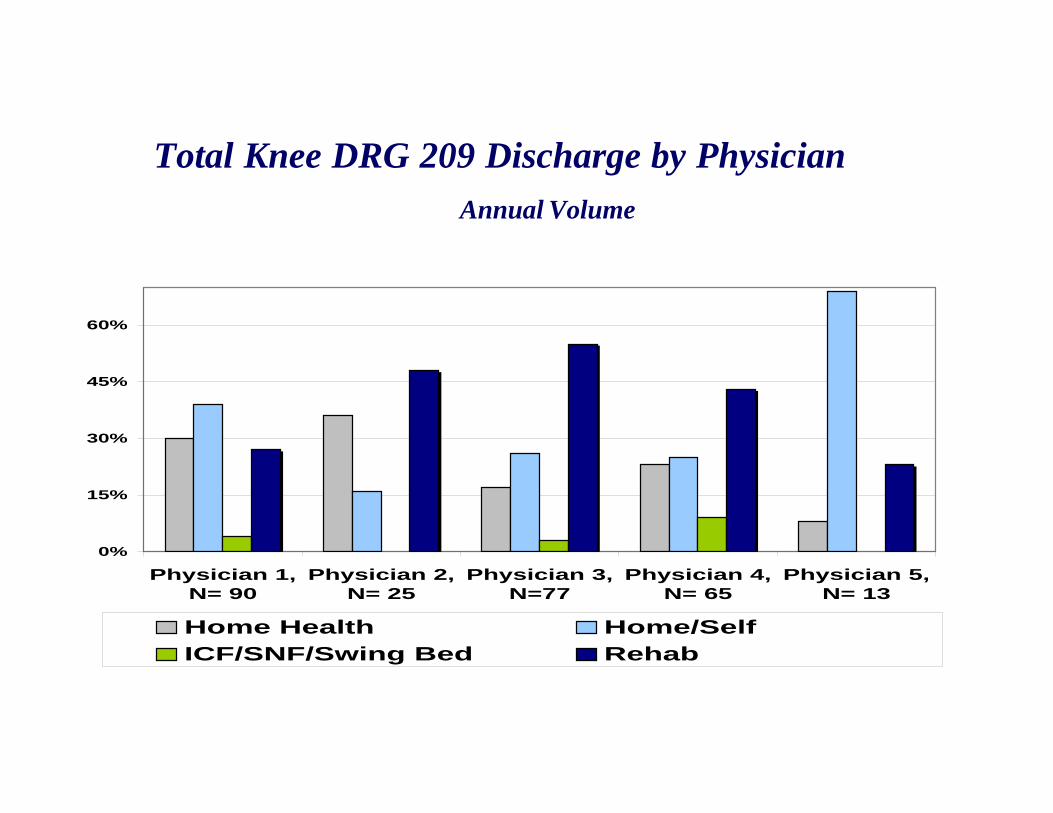
0%
15%
30%
45%
60%
Physician 1,N= 90
Physician 2,N= 25
Physician 3,N=77
Physician 4,N= 65
Physician 5,N= 13
Home Health Home/Self
ICF/SNF/Swing Bed Rehab
Total Knee DRG 209 Discharge by Physician
Annual Volume
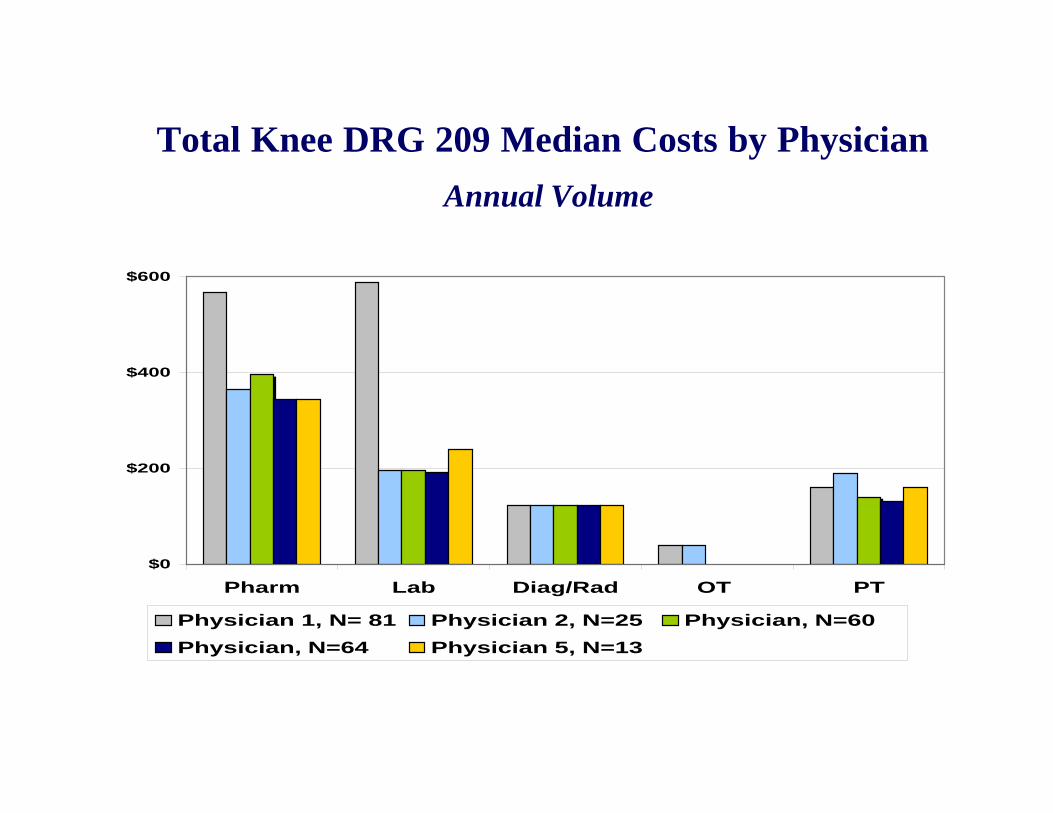
$0
$200
$400
$600
Pharm Lab Diag/Rad OT PT
Physician 1, N= 81 Physician 2, N=25 Physician, N=60
Physician, N=64 Physician 5, N=13
Total Knee DRG 209 Median Costs by Physician
Annual Volume
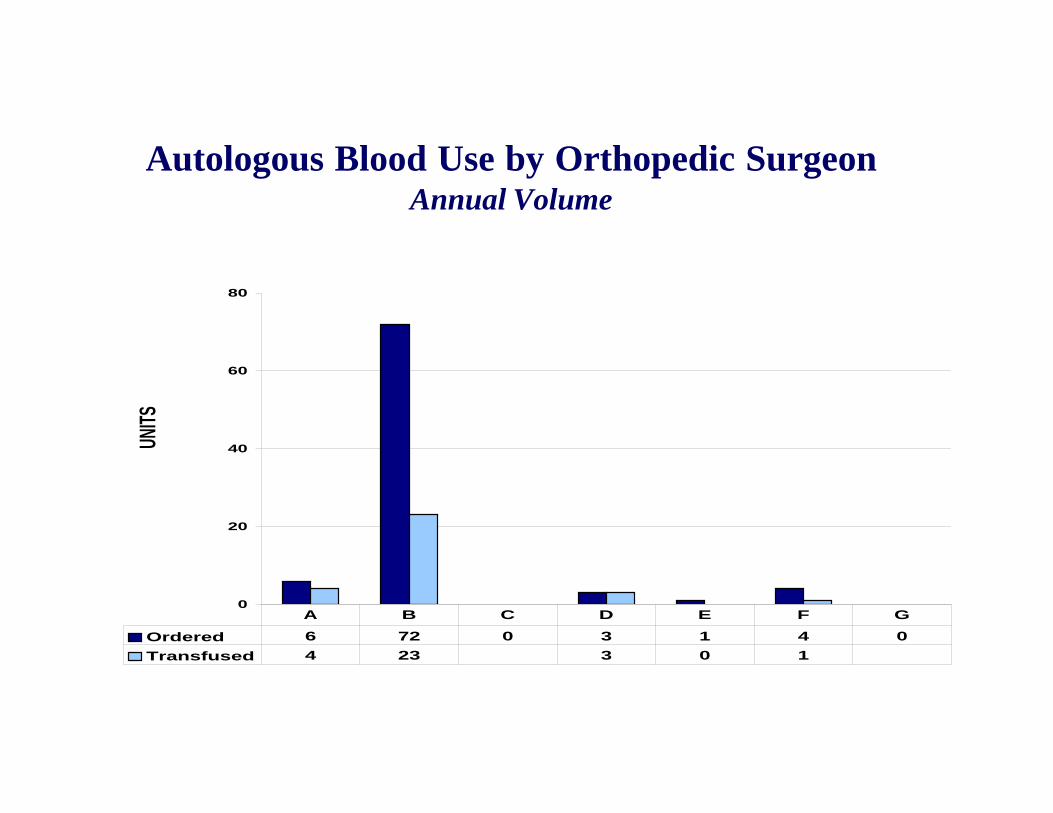
0
20
40
60
80
Ordered 6 72 0 3 1 4 0
Transfused 4 23 3 0 1
A B C D E F G
UNIT
SAutologous Blood Use by Orthopedic Surgeon
Annual Volume
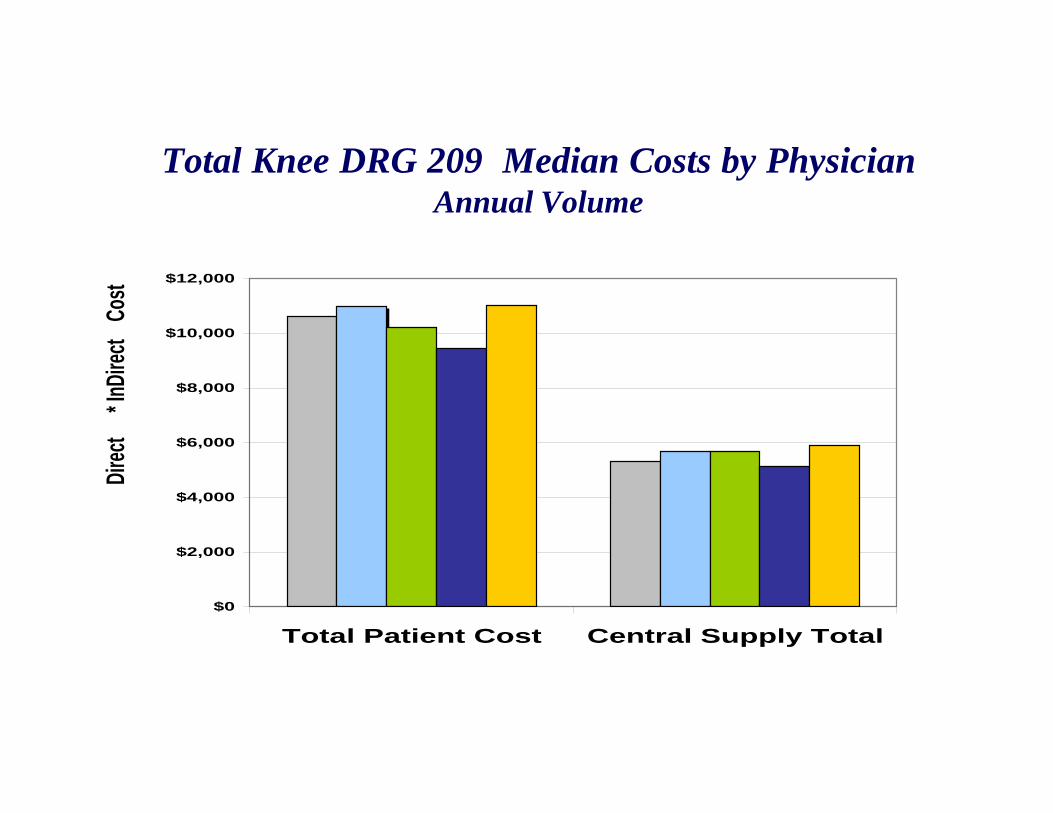
$0
$2,000
$4,000
$6,000
$8,000
$10,000
$12,000
Total Patient Cost Central Supply Total
Dire
ct* I
nDire
ct
Cost
Total Knee DRG 209 Median Costs by PhysicianAnnual Volume
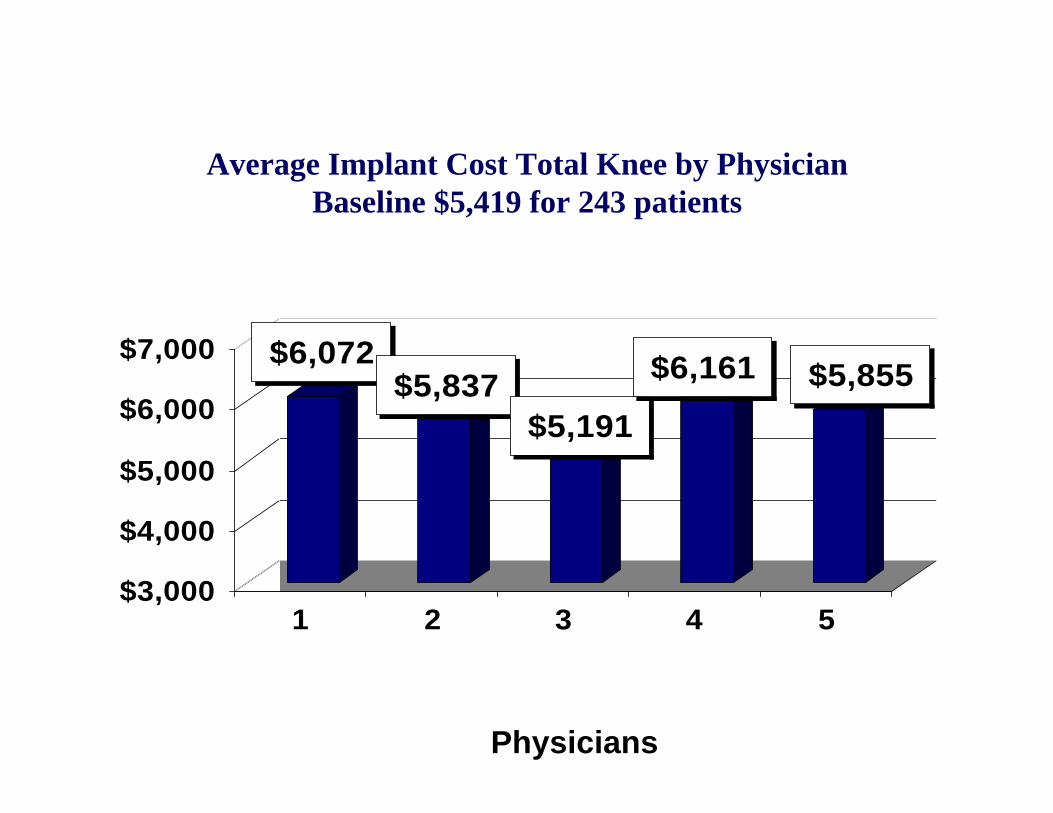
$6,072$5,837
$5,191
$6,161 $5,855
$3,000
$4,000
$5,000
$6,000
$7,000
1 2 3 4 5
Average Implant Cost Total Knee by PhysicianBaseline $5,419 for 243 patients
Physicians
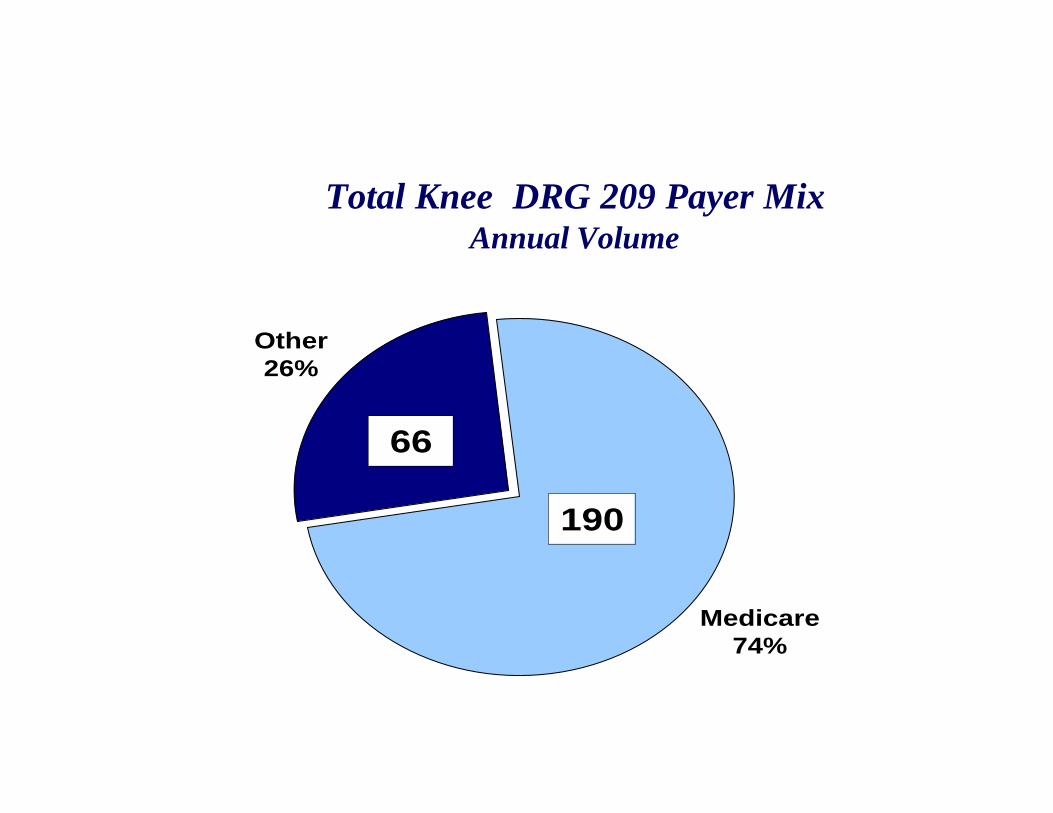
Other26%
Medicare74%
66
190
Total Knee DRG 209 Payer MixAnnual Volume
0.0
1.0
2.0
3.0
4.0
5.0
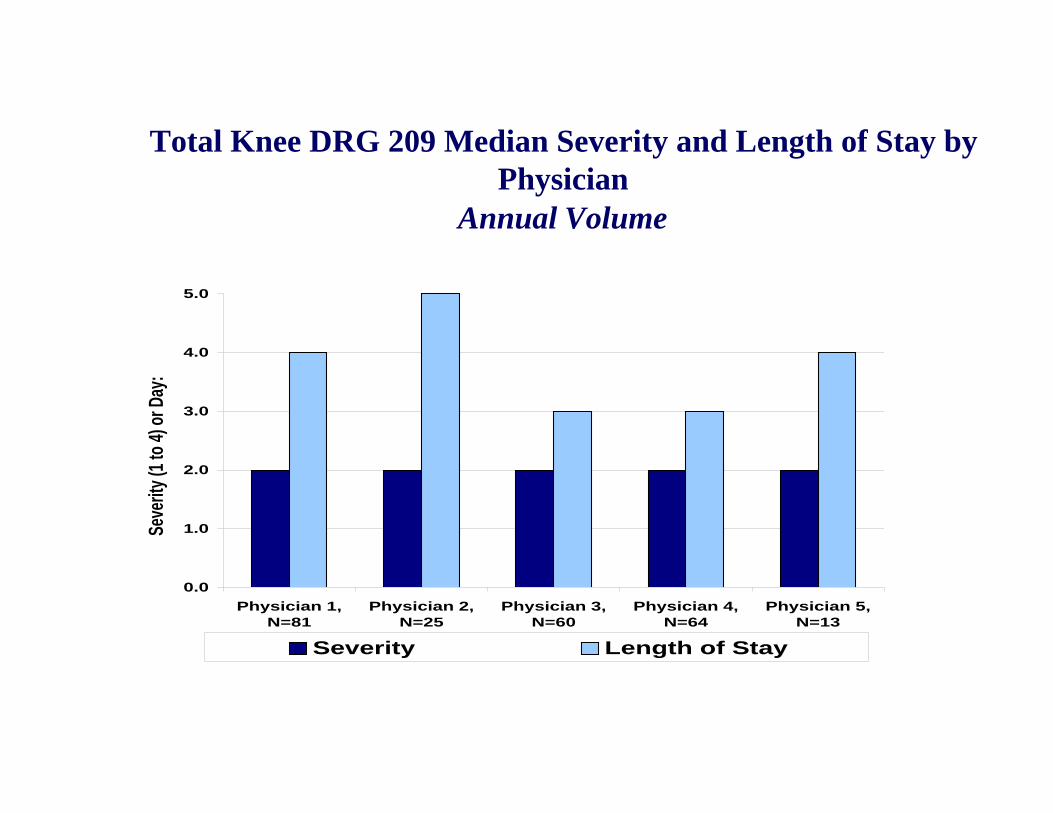
Physician 1,N=81
Physician 2,N=25
Physician 3,N=60
Physician 4,N=64
Physician 5,N=13
Severity Length of Stay
Seve
rity
(1 to
4) o
r Day
:Total Knee DRG 209 Median Severity and Length of Stay by
PhysicianAnnual Volume
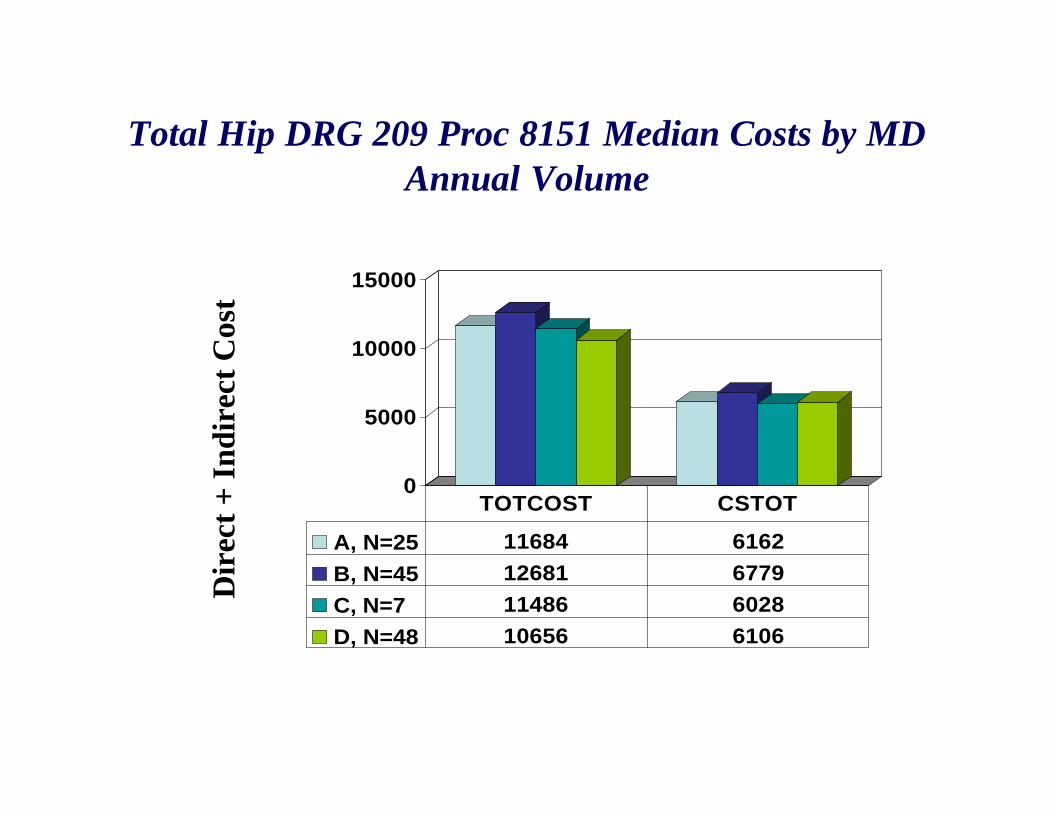
Total Hip DRG 209 Proc 8151 Median Costs by MDAnnual Volume
0
5000
10000
15000
A, N=25 11684 6162
B, N=45 12681 6779
C, N=7 11486 6028
D, N=48 10656 6106
TOTCOST CSTOT
Dir
ect
+ I
nd
irec
t C
ost
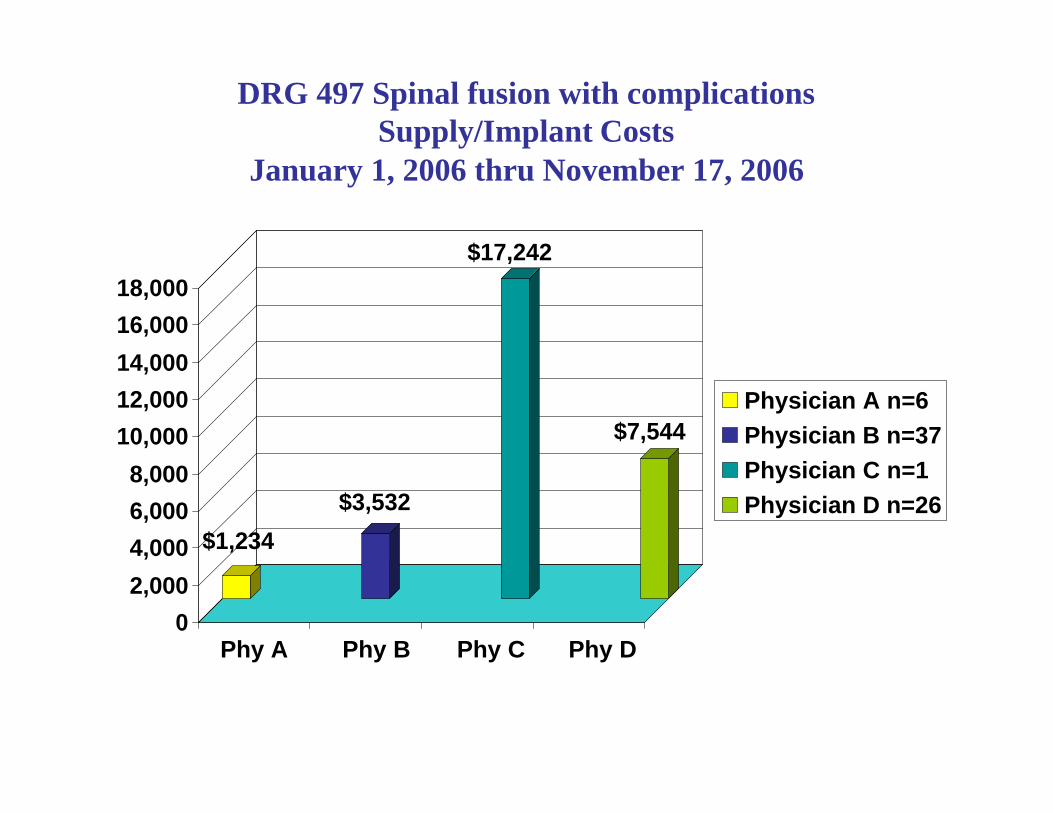
DRG 497 Spinal fusion with complicationsSupply/Implant Costs
January 1, 2006 thru November 17, 2006
$1,234
$3,532
$17,242
$7,544
0
2,000
4,000
6,000
8,000
10,000
12,000
14,000
16,000
18,000
Phy A Phy B Phy C Phy D
Physician A n=6
Physician B n=37
Physician C n=1
Physician D n=26
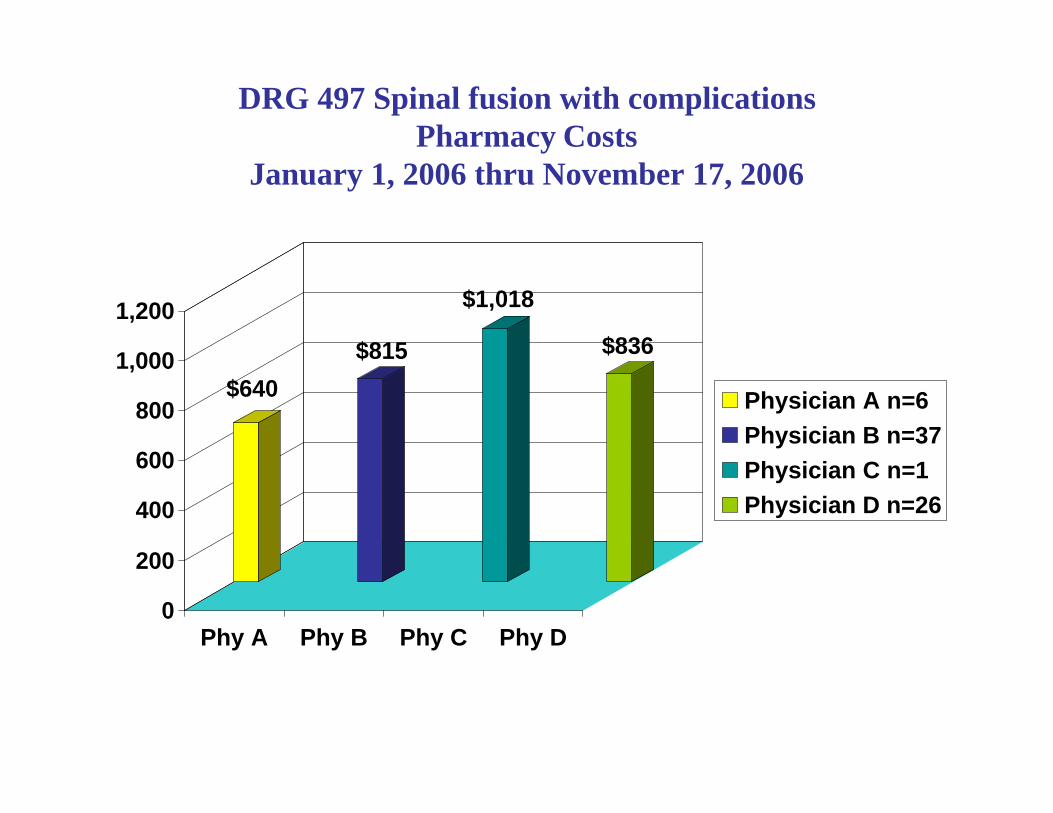
DRG 497 Spinal fusion with complicationsPharmacy Costs
January 1, 2006 thru November 17, 2006
$640
$815
$1,018
$836
0
200
400
600
800
1,000
1,200
Phy A Phy B Phy C Phy D
Physician A n=6
Physician B n=37
Physician C n=1
Physician D n=26
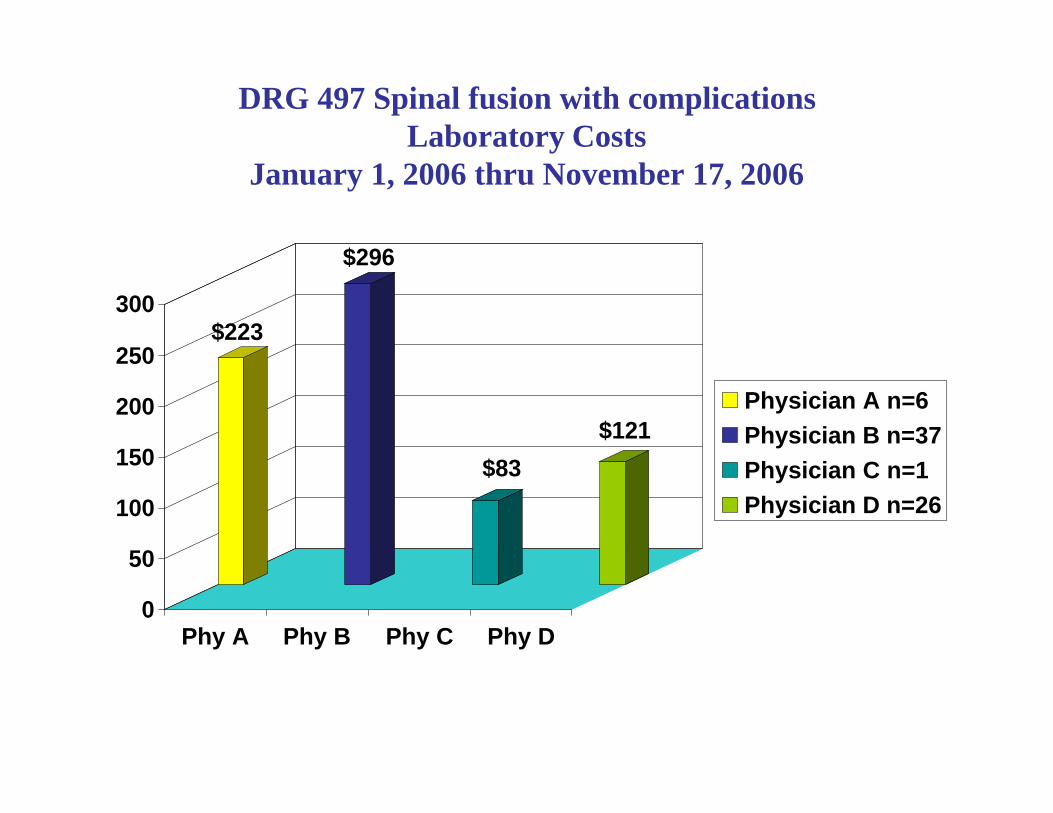
DRG 497 Spinal fusion with complicationsLaboratory Costs
January 1, 2006 thru November 17, 2006
$223
$296
$83
$121
0
50
100
150
200
250
300
Phy A Phy B Phy C Phy D
Physician A n=6
Physician B n=37
Physician C n=1
Physician D n=26
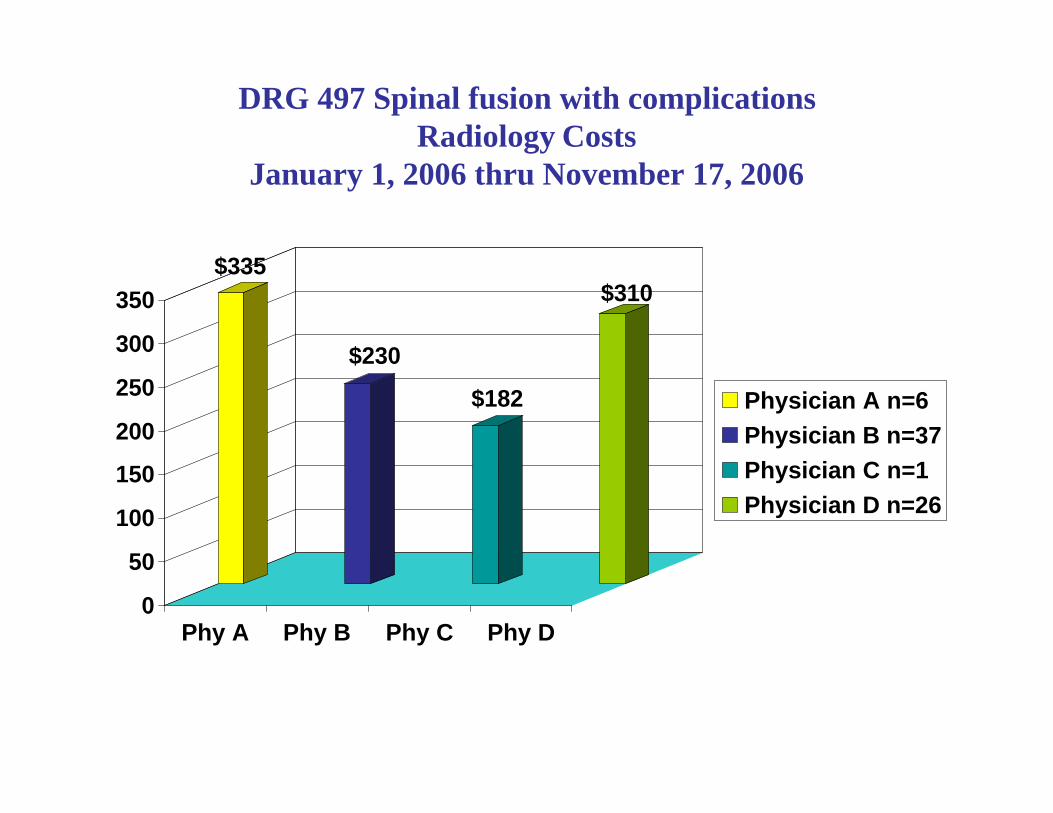
DRG 497 Spinal fusion with complicationsRadiology Costs
January 1, 2006 thru November 17, 2006
$335
$230
$182
$310
0
50
100
150
200
250
300
350
Phy A Phy B Phy C Phy D
Physician A n=6
Physician B n=37
Physician C n=1
Physician D n=26
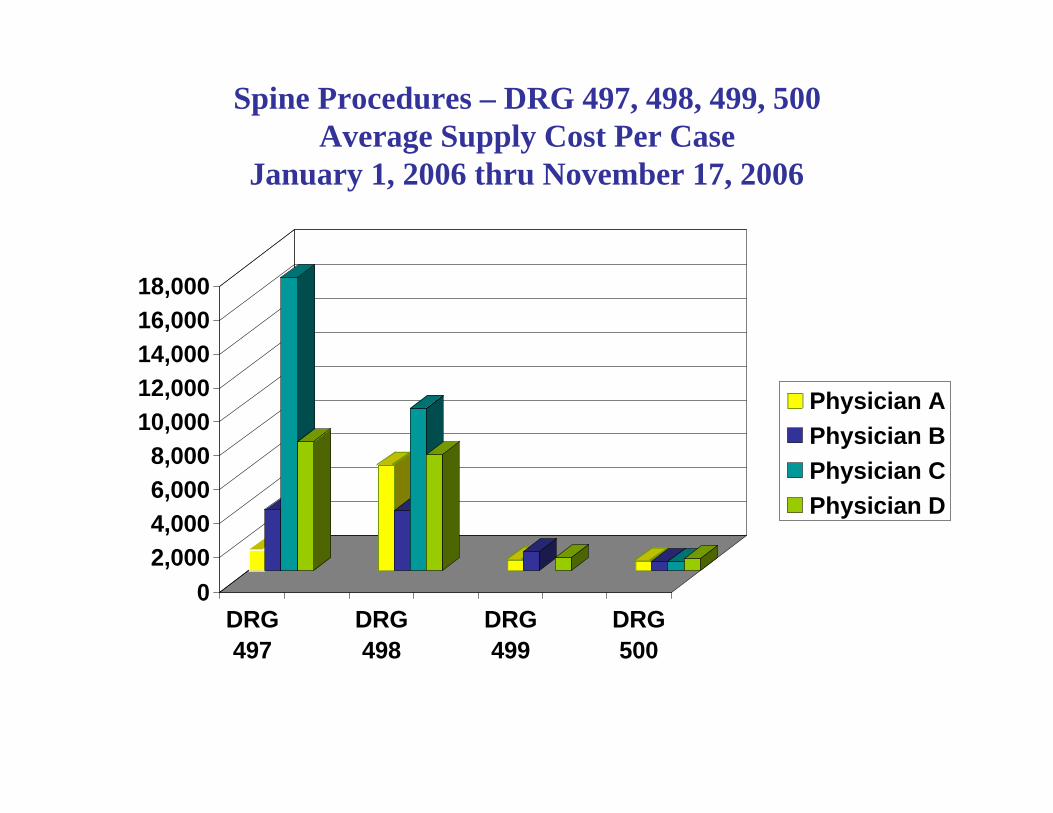
Spine Procedures – DRG 497, 498, 499, 500Average Supply Cost Per Case
January 1, 2006 thru November 17, 2006
0
2,000
4,000
6,000
8,000
10,000
12,000
14,000
16,000
18,000
DRG
497
DRG
498
DRG
499
DRG
500
Physician A
Physician B
Physician C
Physician D
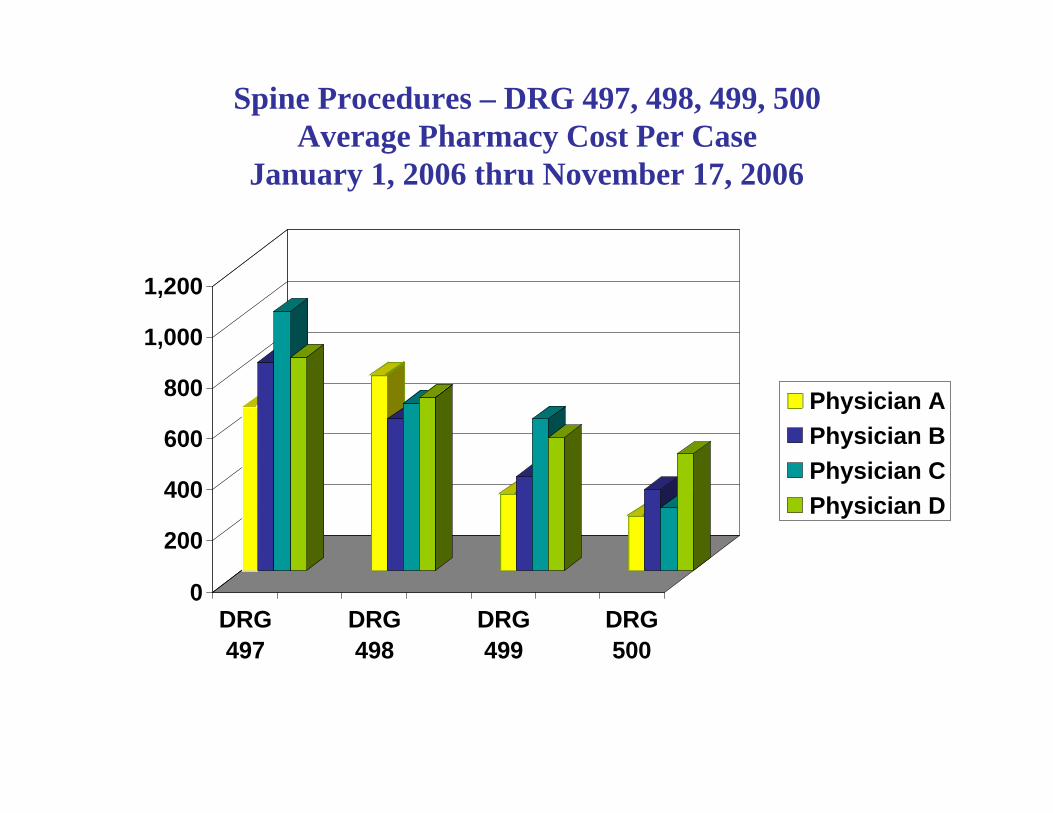
Spine Procedures – DRG 497, 498, 499, 500Average Pharmacy Cost Per Case
January 1, 2006 thru November 17, 2006
0
200
400
600
800
1,000
1,200
DRG
497
DRG
498
DRG
499
DRG
500
Physician A
Physician B
Physician C
Physician D
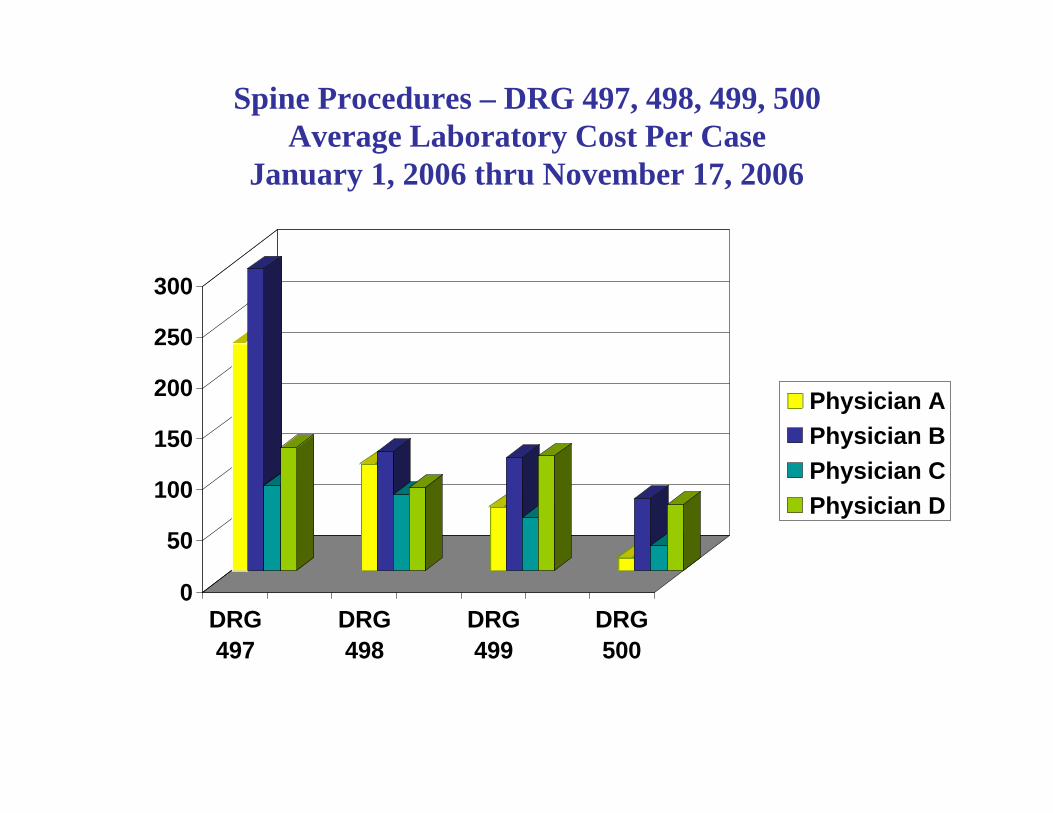
Spine Procedures – DRG 497, 498, 499, 500Average Laboratory Cost Per Case
January 1, 2006 thru November 17, 2006
0
50
100
150
200
250
300
DRG
497
DRG
498
DRG
499
DRG
500
Physician A
Physician B
Physician C
Physician D
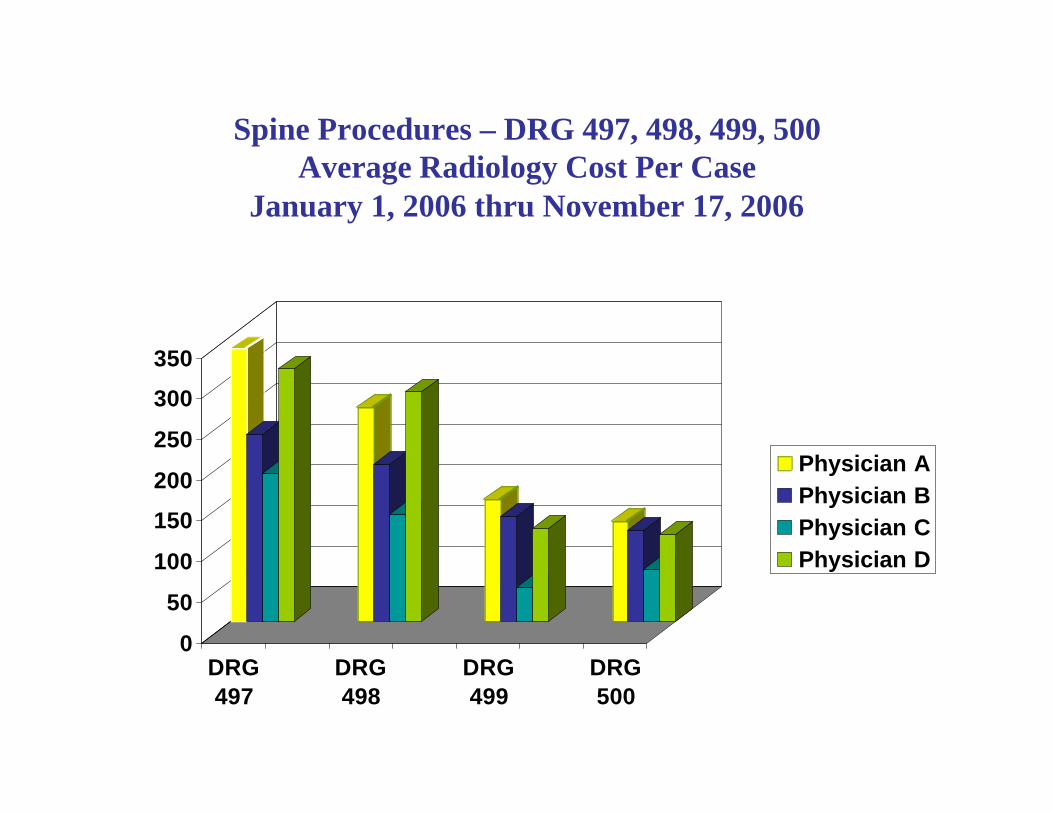
Spine Procedures – DRG 497, 498, 499, 500Average Radiology Cost Per Case
January 1, 2006 thru November 17, 2006
0
50
100
150
200
250
300
350
DRG
497
DRG
498
DRG
499
DRG
500
Physician A
Physician B
Physician C
Physician D
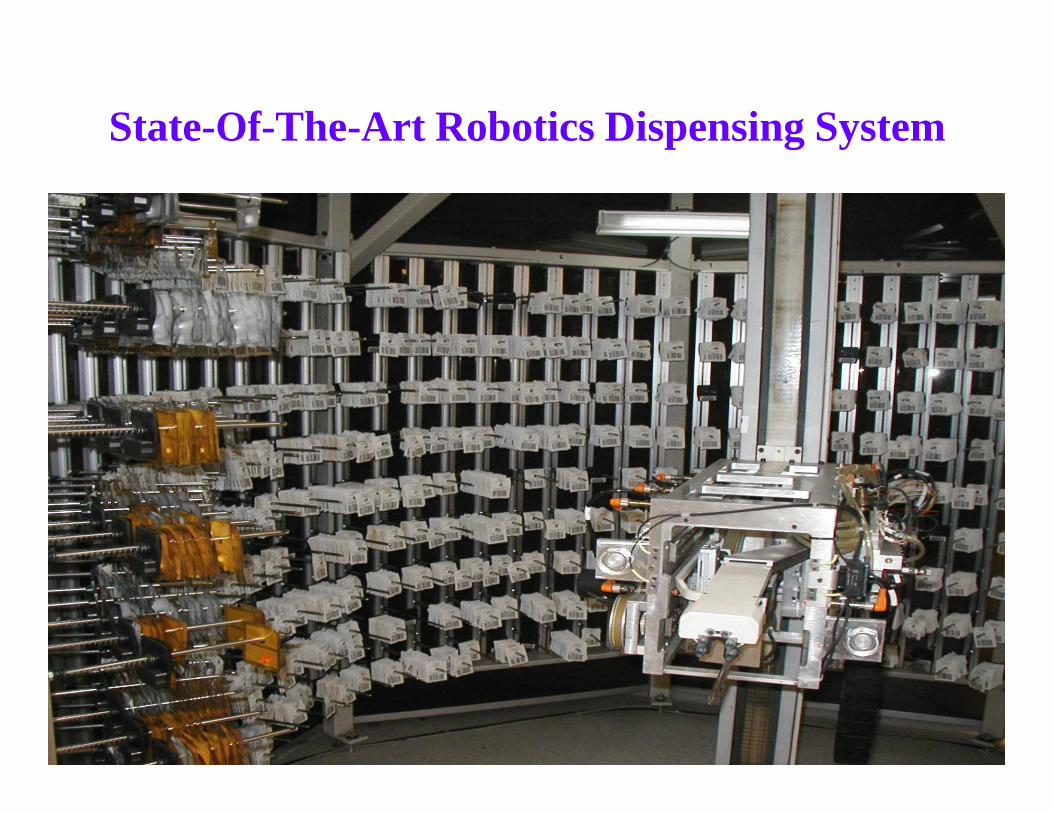
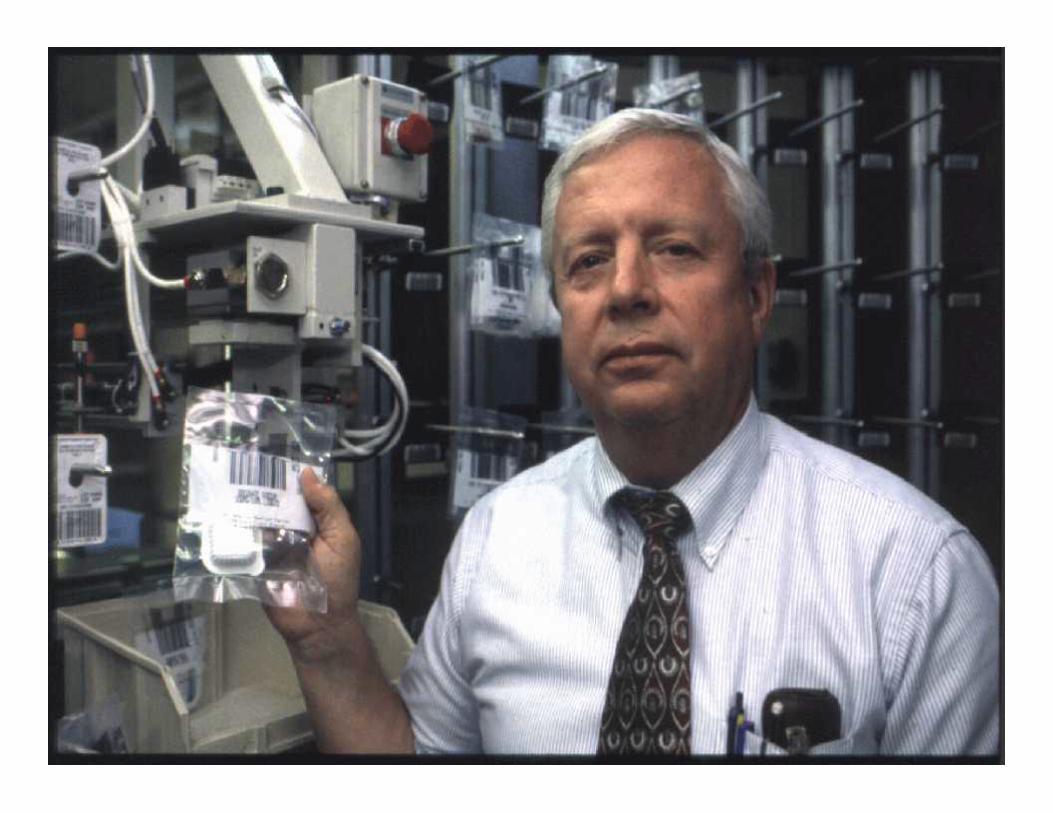
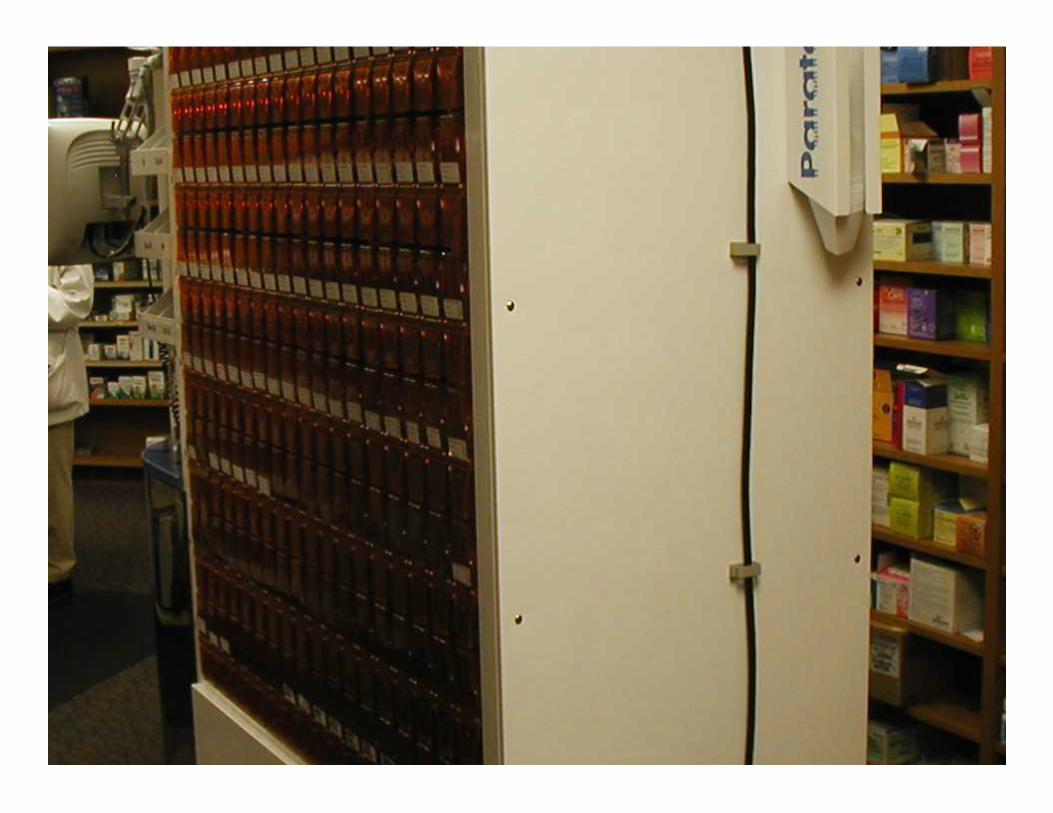
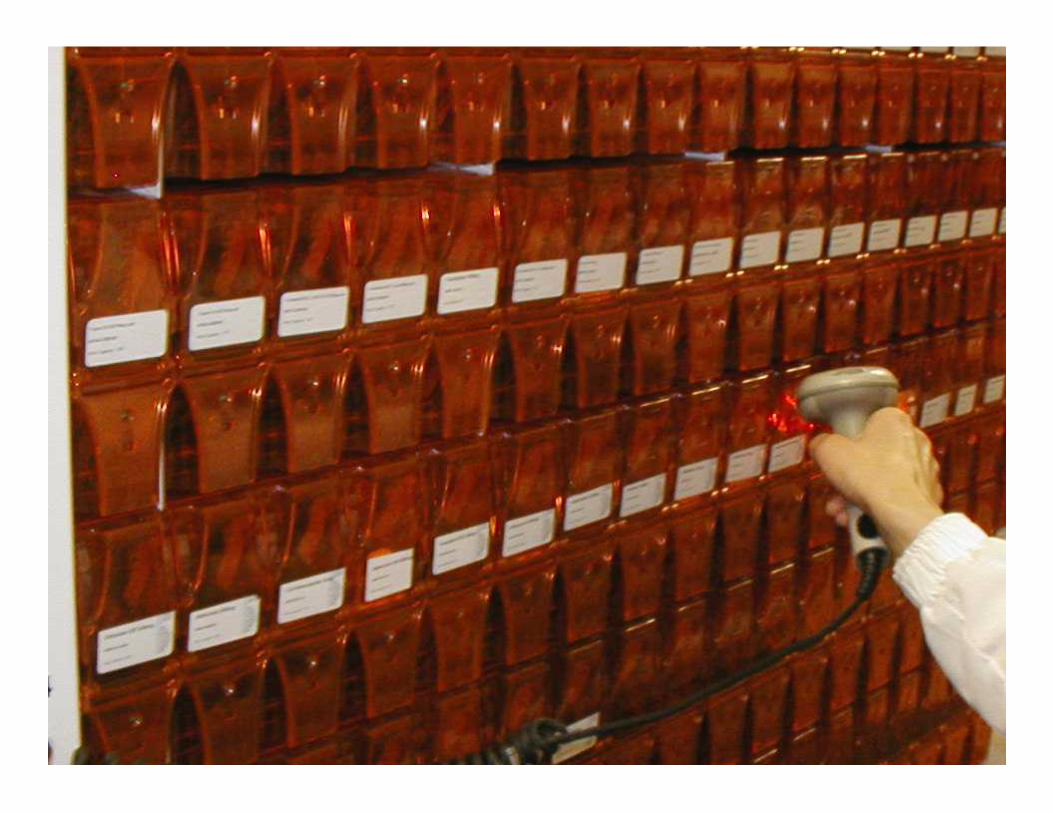
State-Of-The-Art Robotics Dispensing System
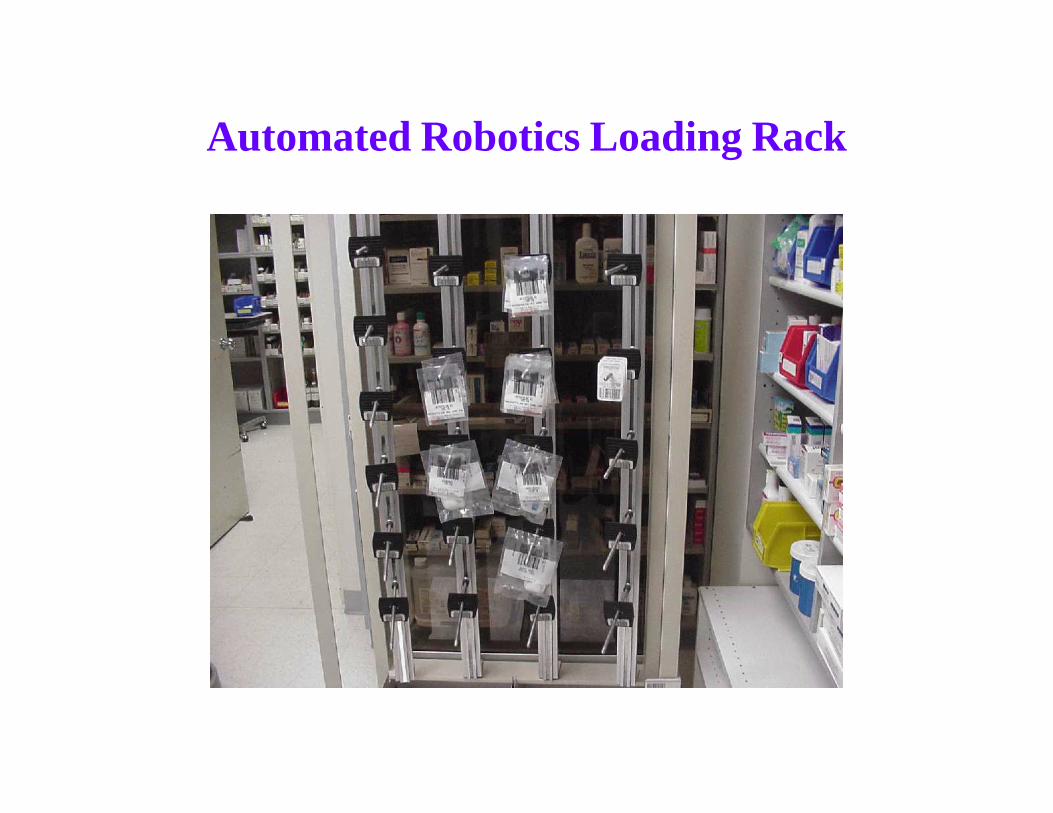
Automated Robotics Loading Rack
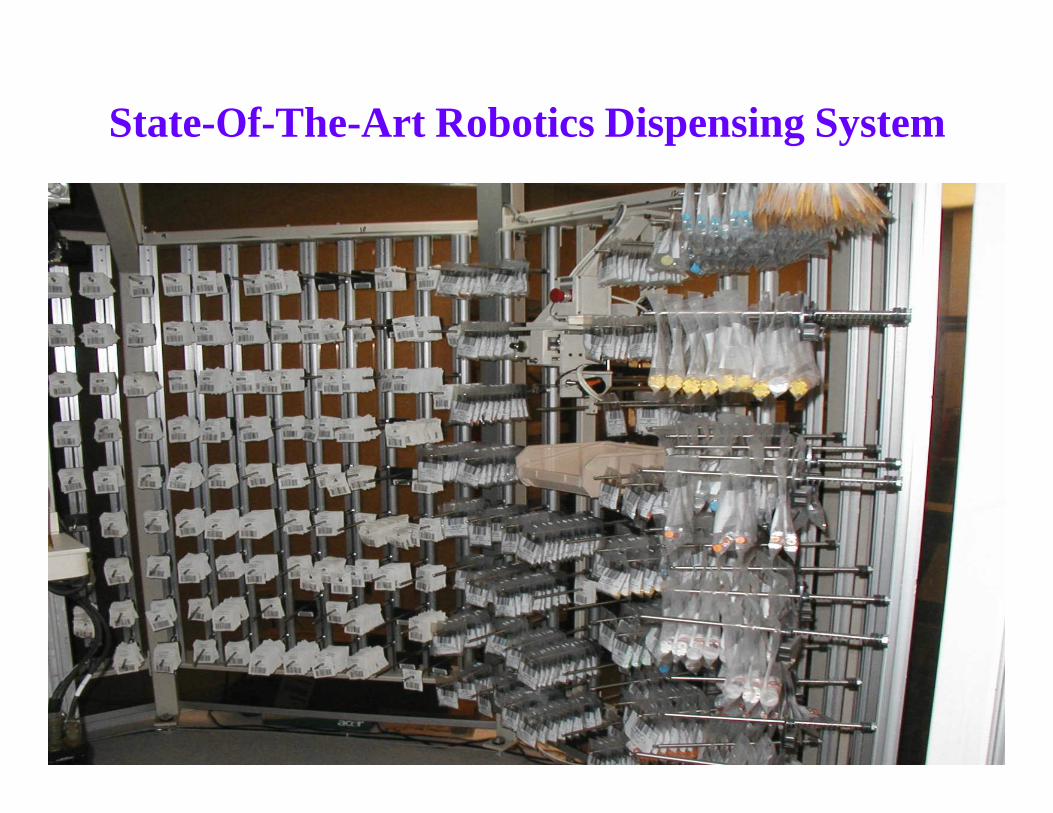
State-Of-The-Art Robotics Dispensing System
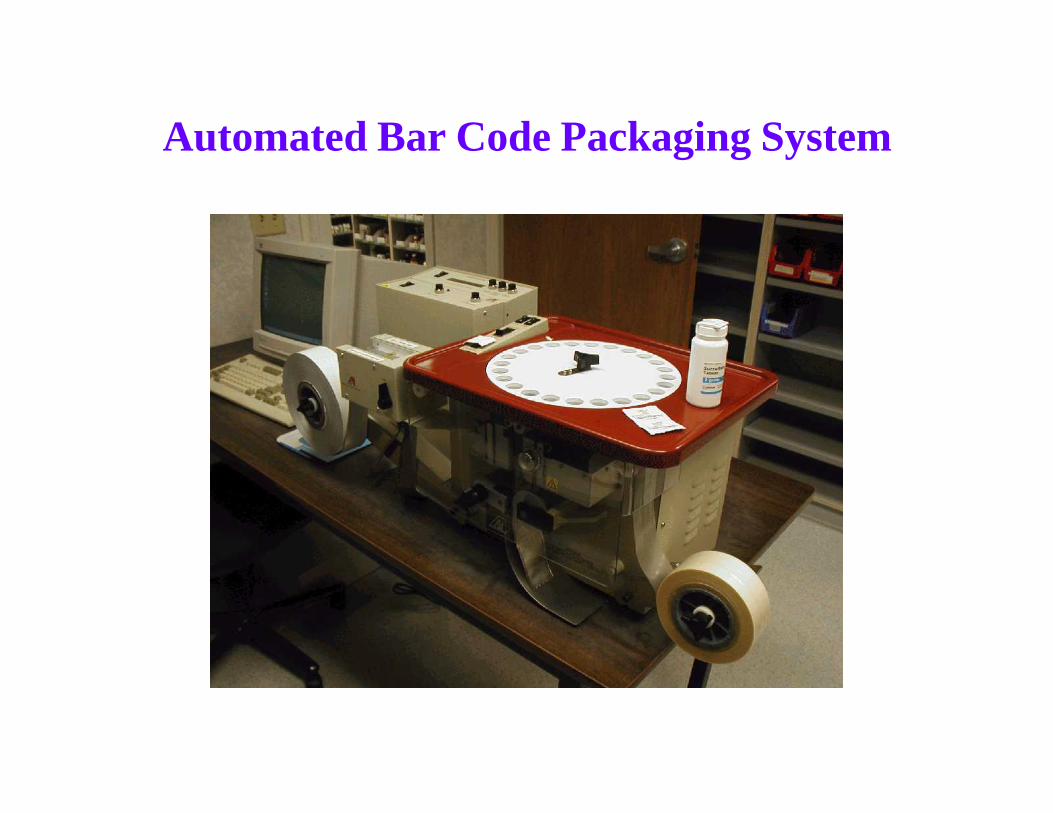
Automated Bar Code Packaging System
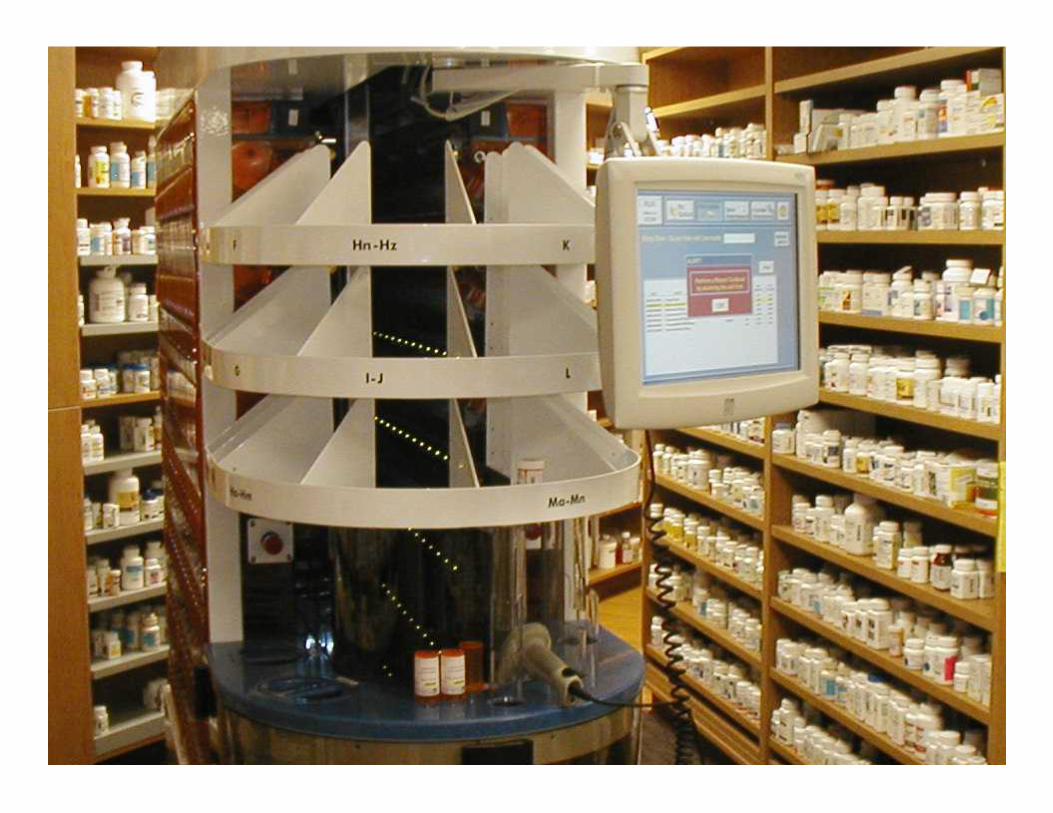
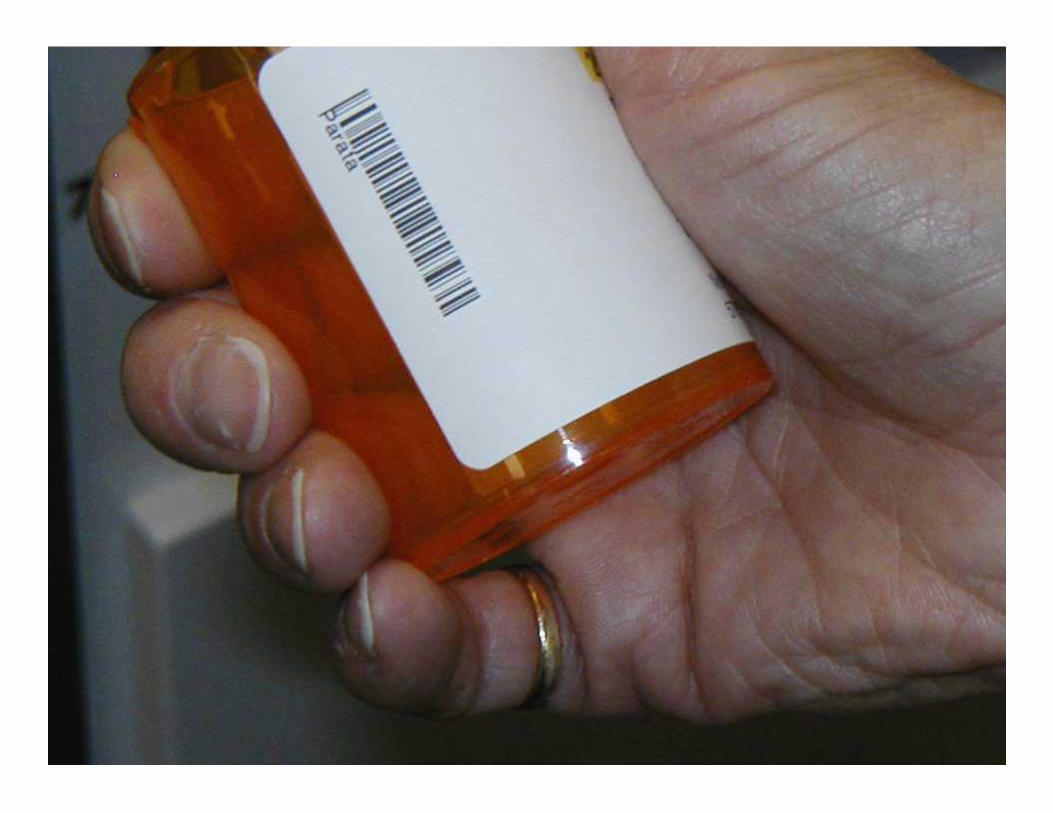
Parata Robot
• 235 highest volume tablets and capsules
• Bar code on vial to prevent filling incorrectly
• Scan bin / Scan vial – Robot accurately dispenses medication
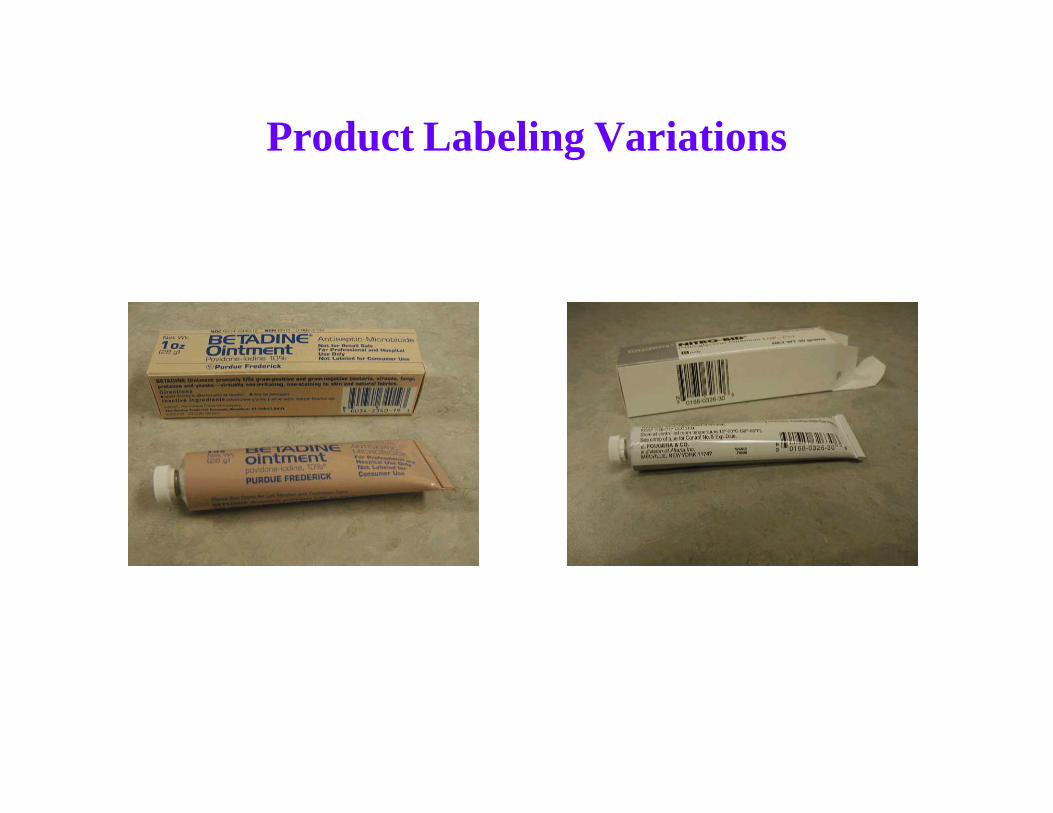
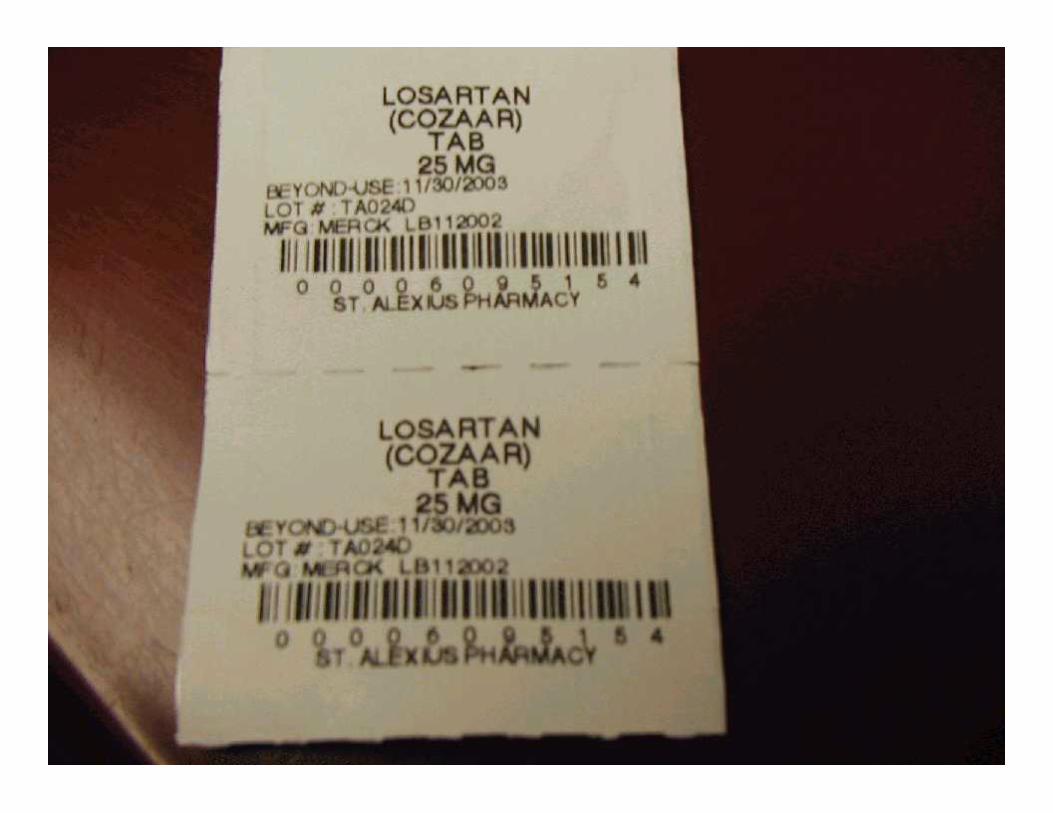
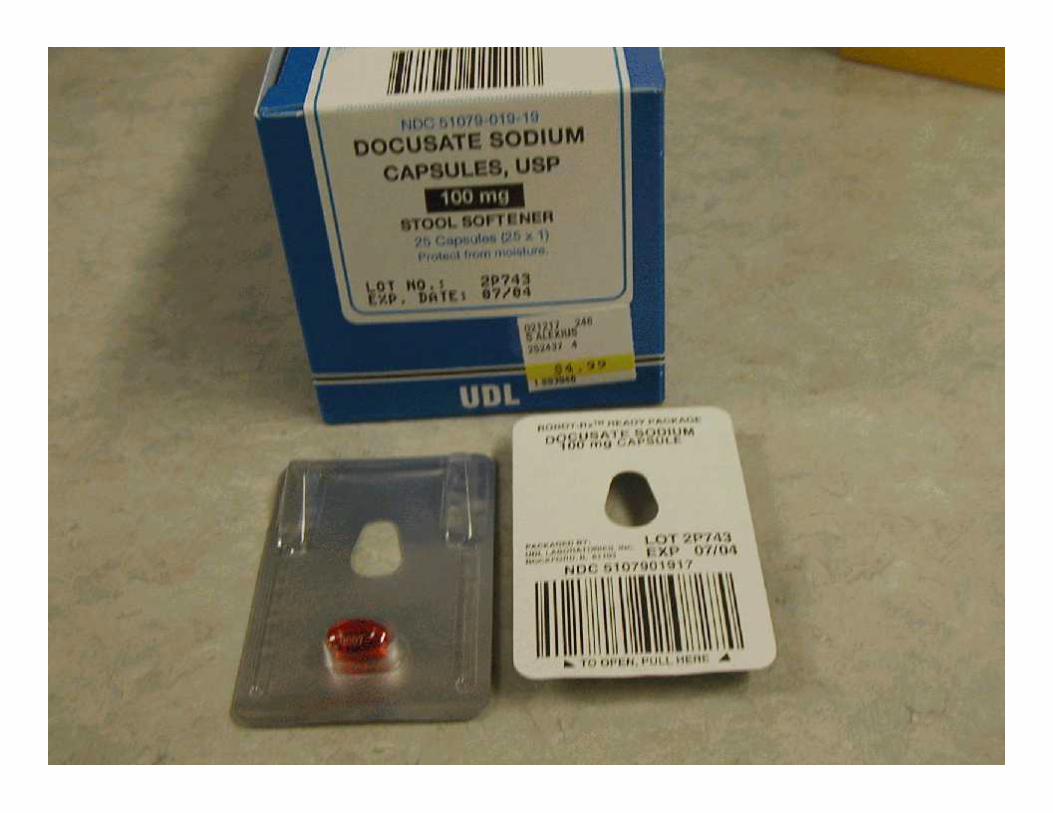
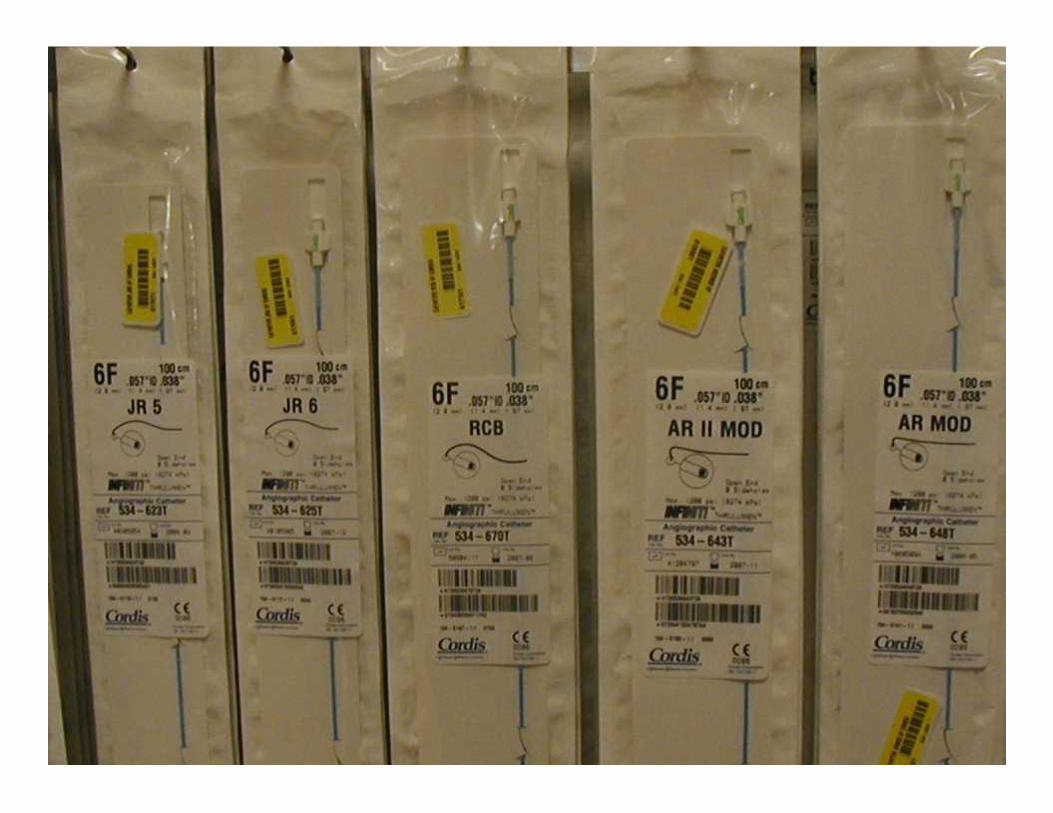
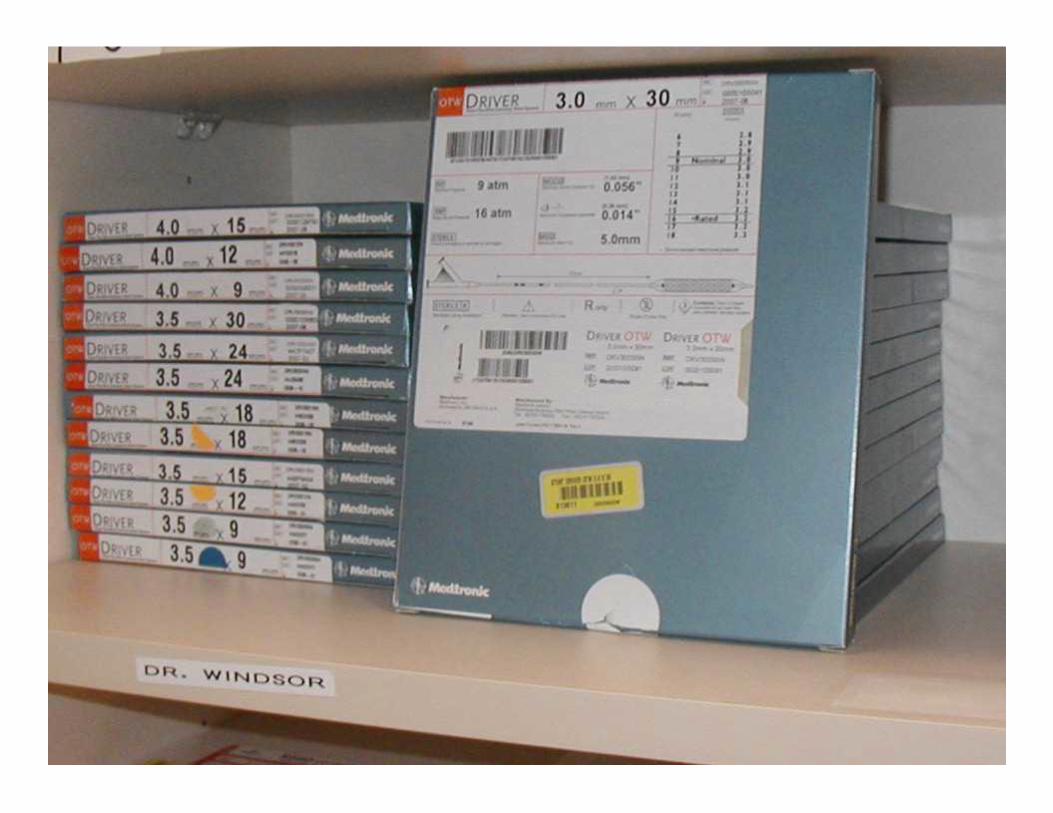
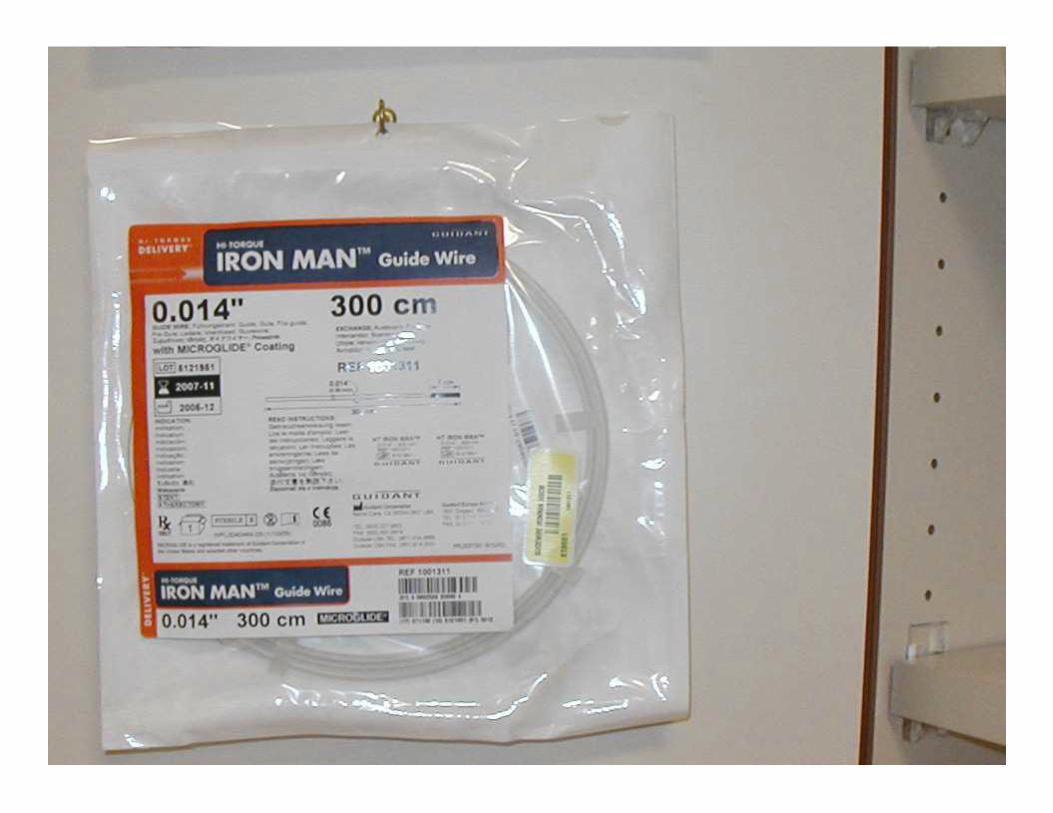
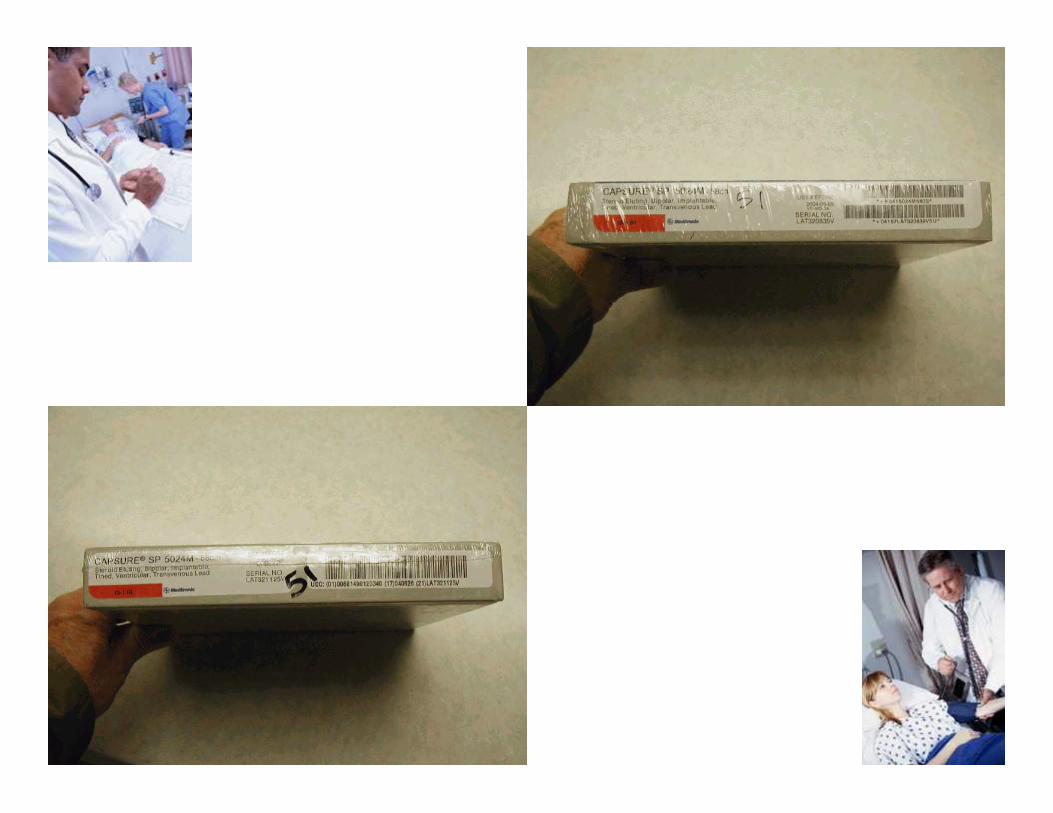
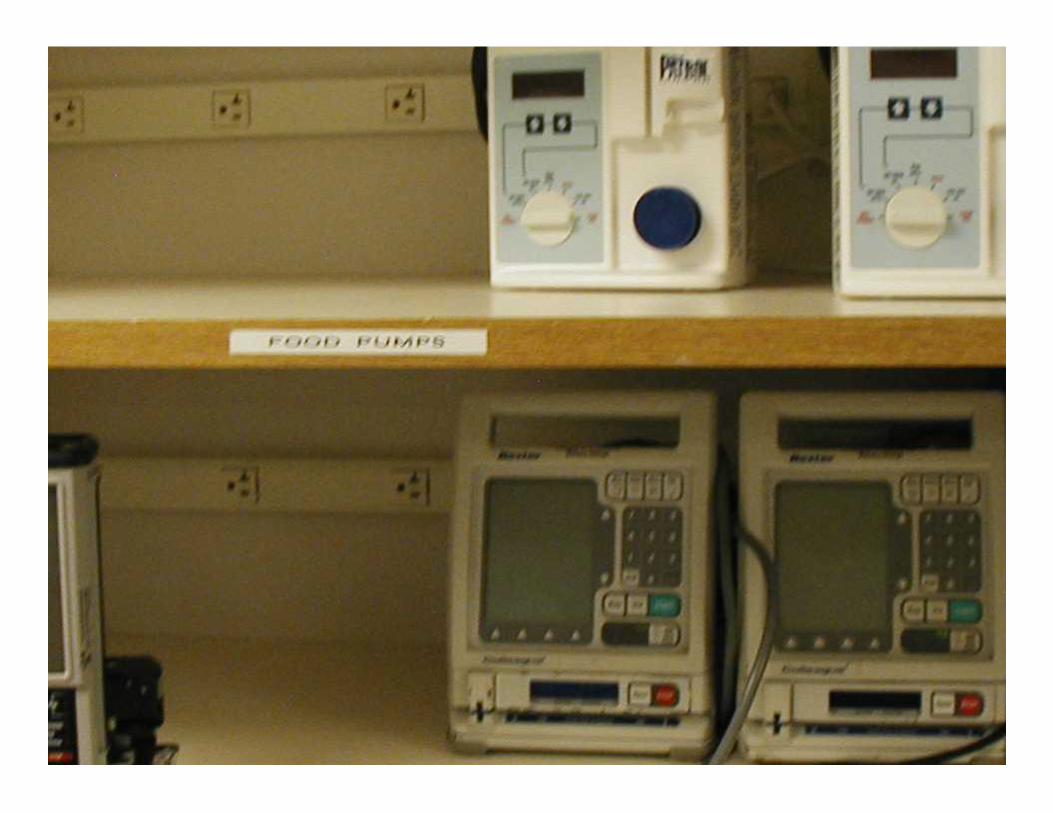
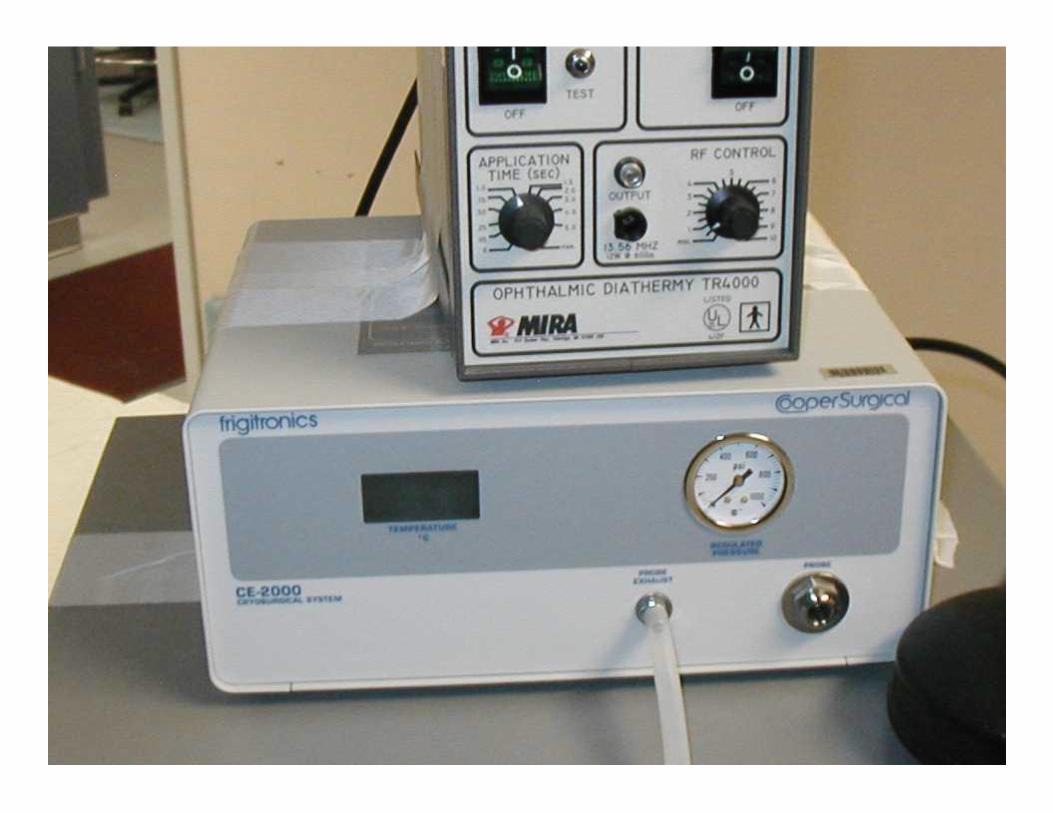
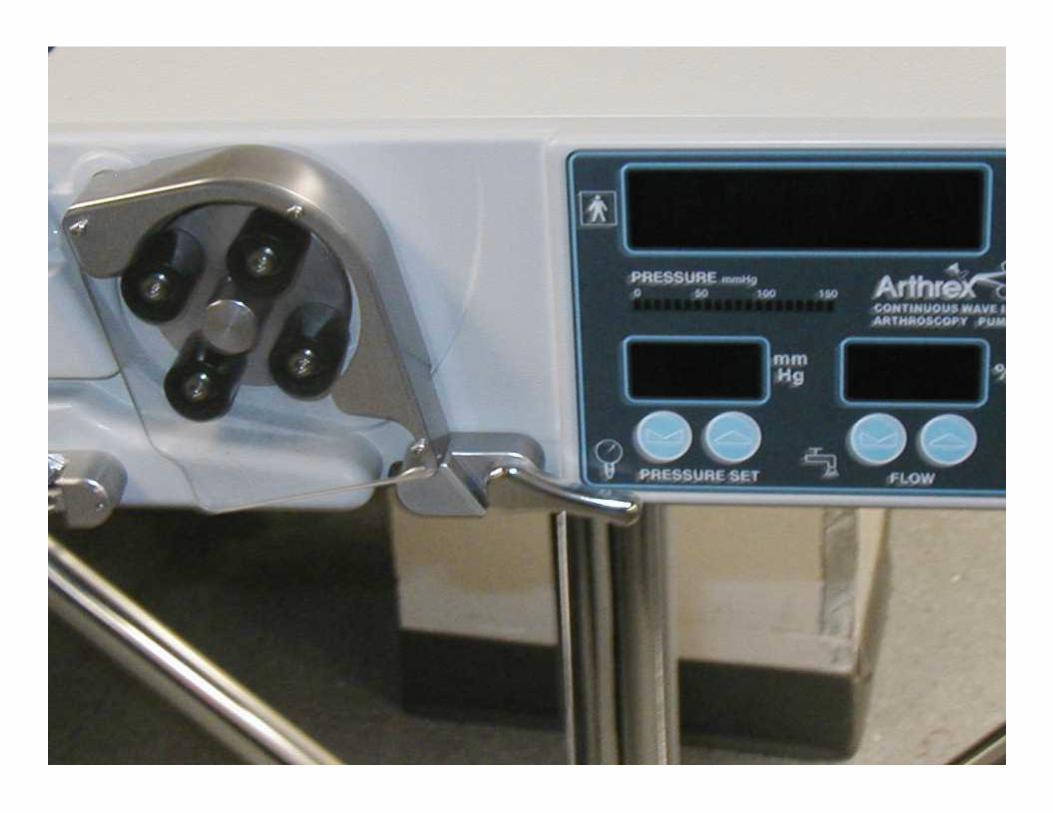
Product Labeling Variations
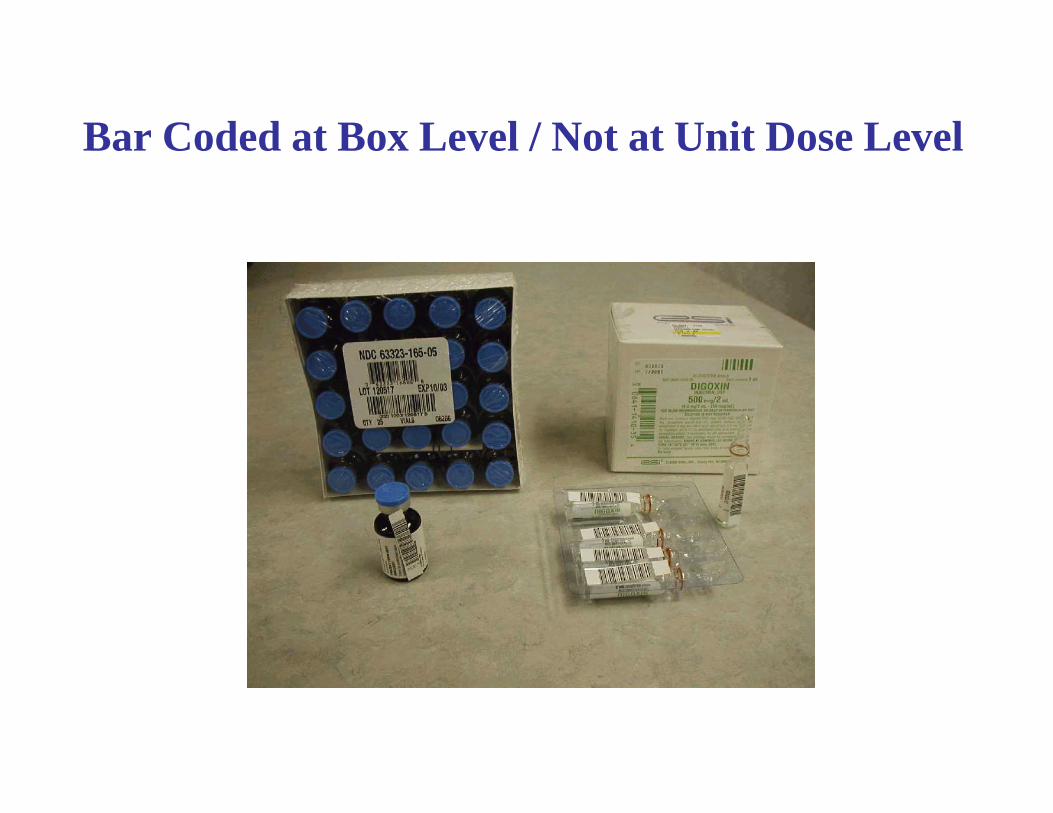
Bar Coded at Box Level / Not at Unit Dose Level
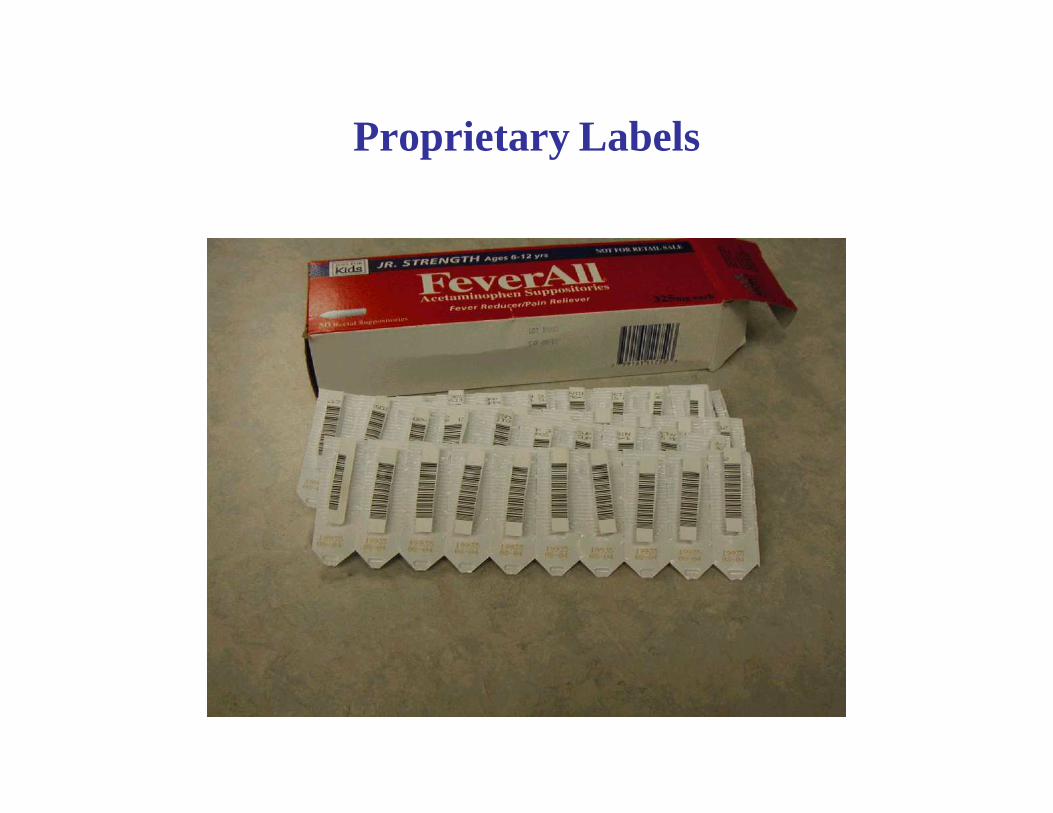
Proprietary Labels
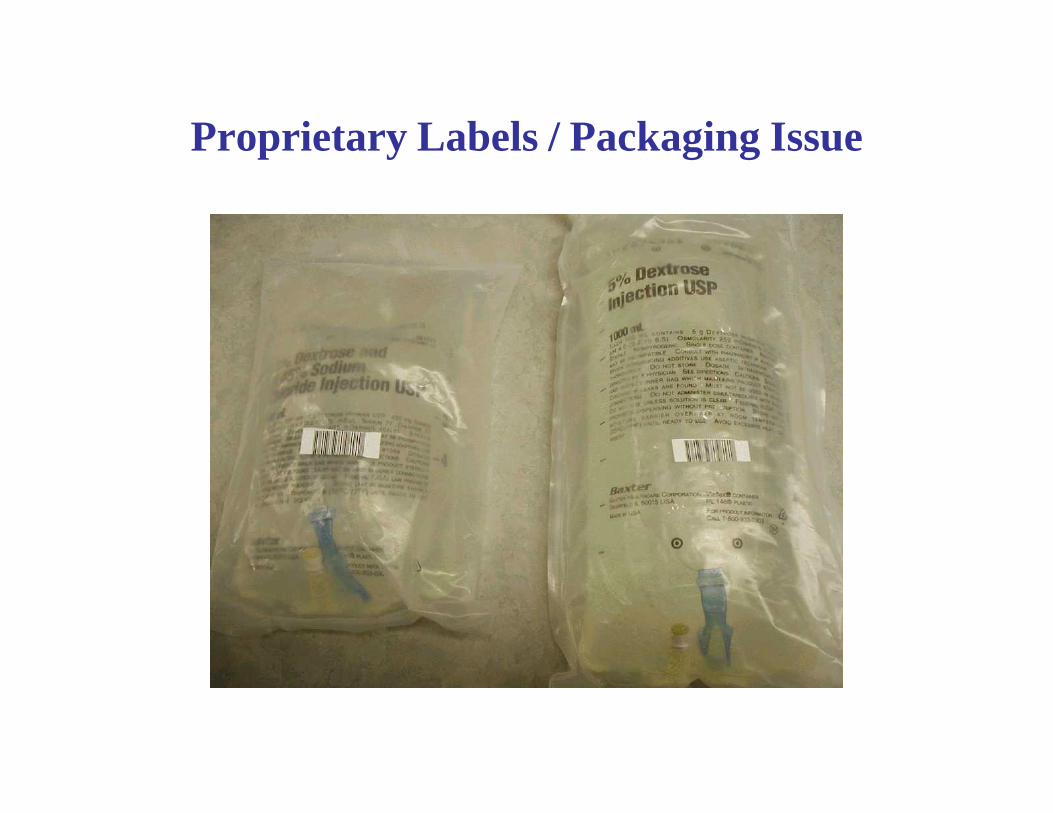
Proprietary Labels / Packaging Issue

Capture Data and Generate Reports (ACM & FBI) to Manage Supply and Implant Costs
• Identify total spend by vendor
• Track consumption by department
• Sort cost by surgeon
• Determine total cost & charge by DRG/Procedure
• Consider direct and indirect costs
• Analyze reimbursement – Net revenue
• Involve GPO
• Test supply costs against industry benchmarks
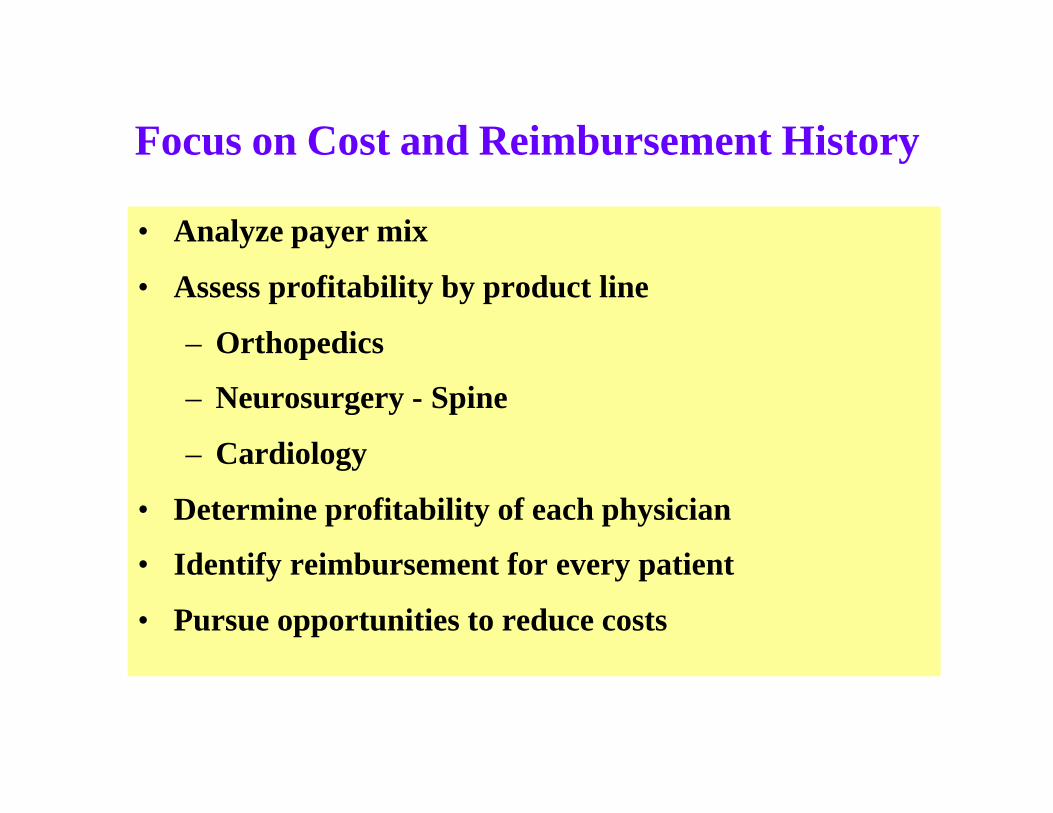
Focus on Cost and Reimbursement History
• Analyze payer mix
• Assess profitability by product line
– Orthopedics
– Neurosurgery - Spine
– Cardiology
• Determine profitability of each physician
• Identify reimbursement for every patient
• Pursue opportunities to reduce costs
Today’s reasons for why standards and technology are needed
• Improve the safety and quality of patient care • Eliminate Risk and Save lives • Monitor the Quality of Care patients receive• Control Medication and Supply Utilization• Identify Cost to Every Episode of Care• Compare Cost to Outcome• Reduce the Cost of Health Care• Manage Inventories (device costs are increasing)• Access to More Data• Strive to Achieve the EHCR Vision Goals
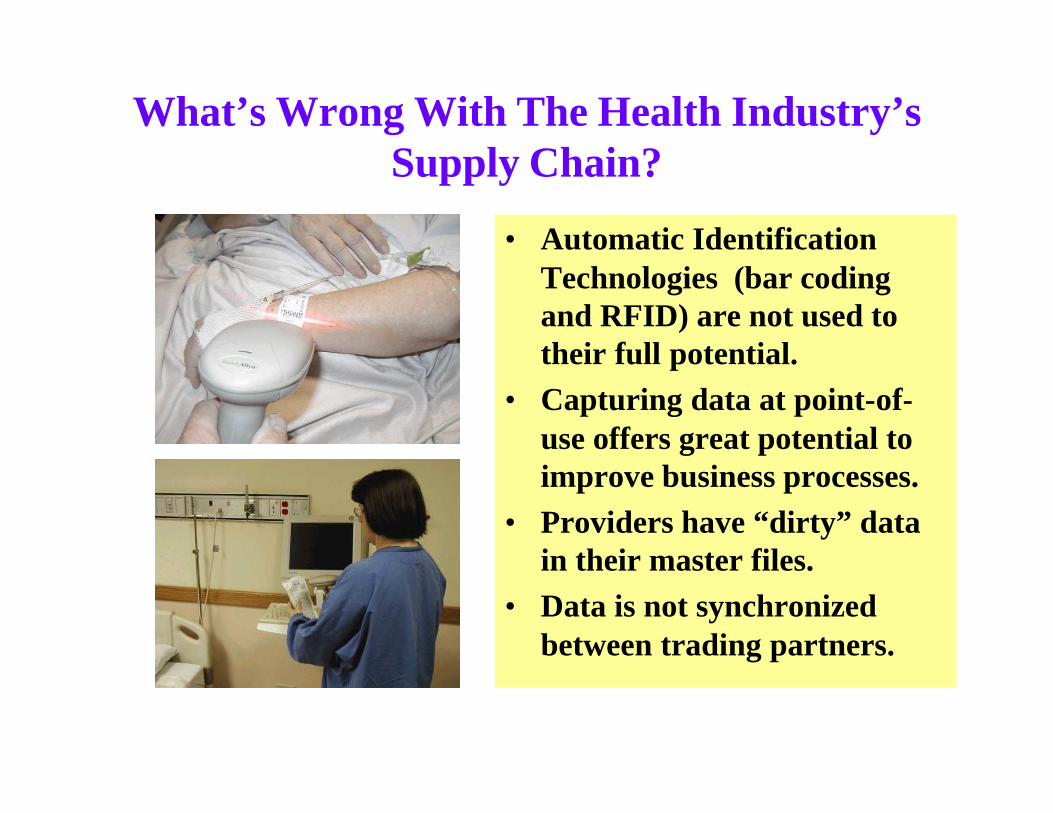
What’s Wrong With The Health Industry’s Supply Chain?
• Automatic Identification Technologies (bar coding and RFID) are not used to their full potential.
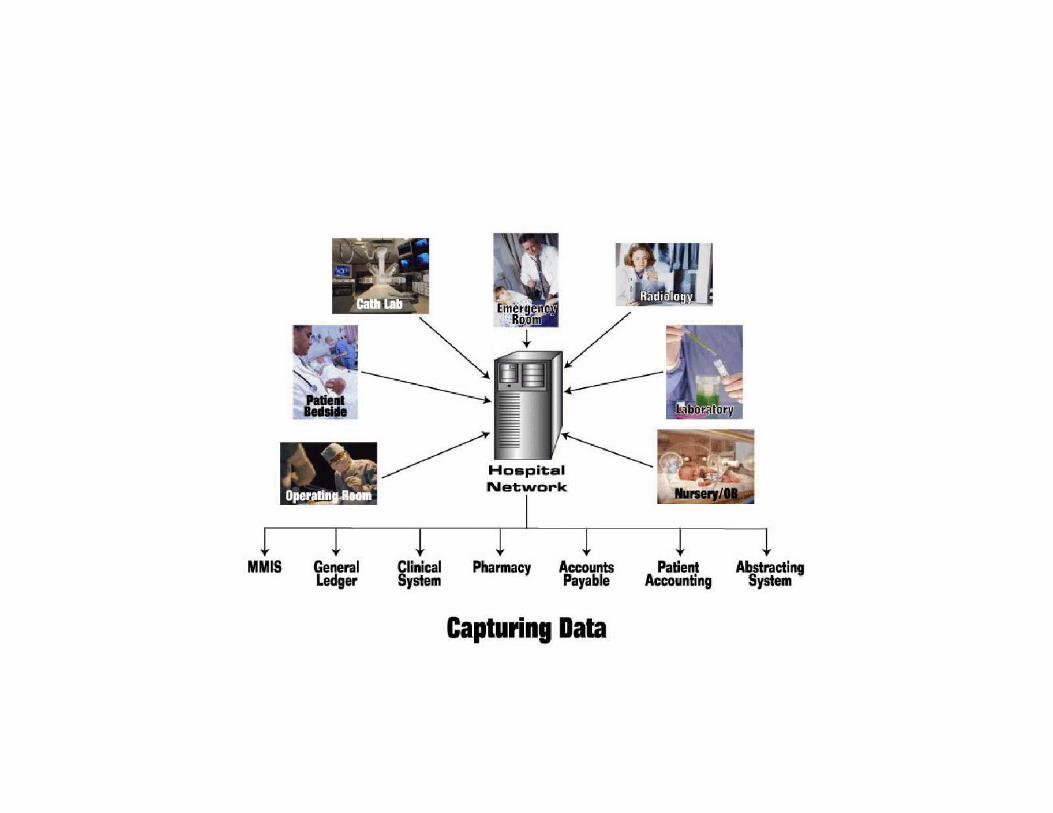
• Capturing data at point-of-use offers great potential to improve business processes.
• Providers have “dirty” data in their master files.
• Data is not synchronized between trading partners.
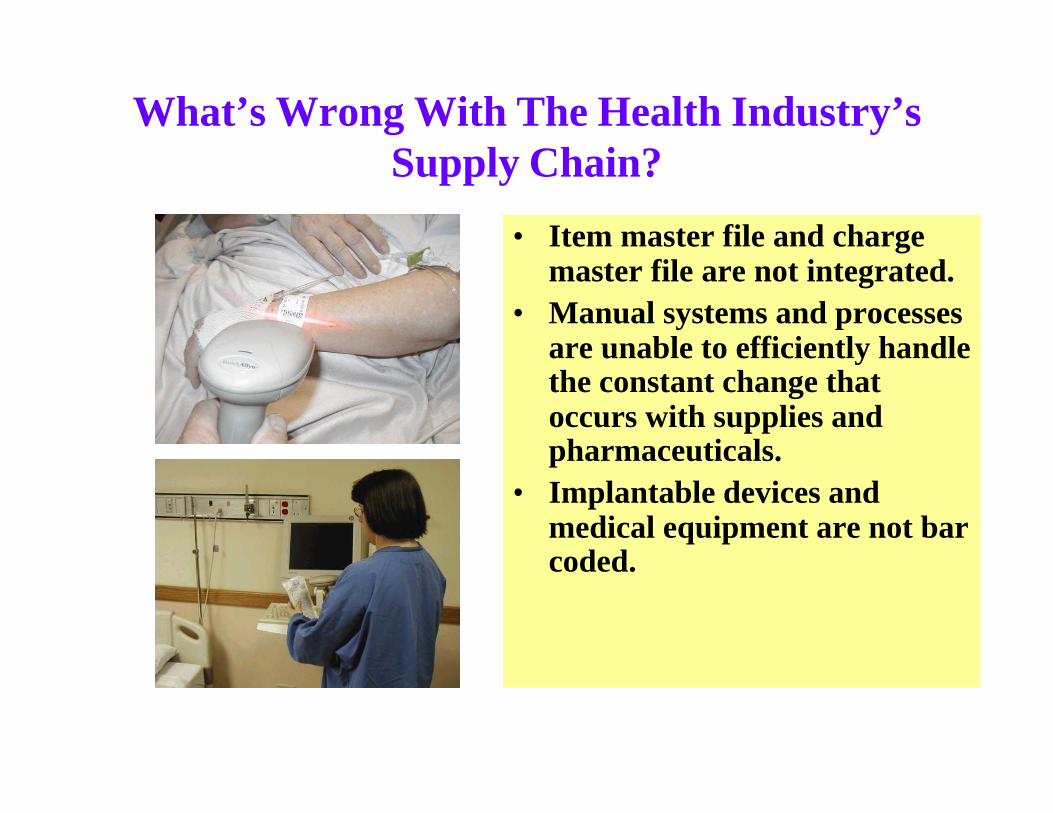
What’s Wrong With The Health Industry’s Supply Chain?
• Item master file and charge master file are not integrated.
• Manual systems and processes are unable to efficiently handle the constant change that occurs with supplies and pharmaceuticals.
• Implantable devices and medical equipment are not bar coded.
ENABLING TECHNOLOGY BENEFITS
• Quality of Patient Care
• Resource Utilization
• -Staffing -Medications & Supplies -Facilities
• Financial Performance
• Supply Chain and Benchmarking -Staff Productivity -Medication and Supply Utilization and Costs
QUALITY OF PATIENT CARE BENEFITS
• Nurses have more time to spend with patients• Nurses are no longer involved in supply logistics • They play a vital role in managing supply costs and there are
no cumbersome processes• Patient services aren’t delayed• Risk Management is improved - Medication errors reduced• Length of stay reduced• Patient outcomes linked to cost • Staff morale is improved
RESOURCE UTILIZATION BENEFITS
• Professional staff not involved in supply logistics
• Supply distribution tasks assigned to appropriate job classification
• Redundant manual tasks eliminated
• - 7 FTEs transitioned to other responsibilities
• Benchmarks established to measure performance
• Work activity tied to staff productivity
• Improved employee morale
RESOURCE UTILIZATION BENEFITS
• Track medication and supply expense and consumption data for patient, department and par location
• Reduce inventories
• Reduce labor costs
• Eliminate product outdates
• Fewer supplies require less space
SUPPLY CHAIN EFFICIENCY BENEFITS
• Increased productivity of receiving staff -Performed more work with less staff -Improved service levels from off-site warehouse -Decreased receiving errors -Provided greater flexibility in receiving process with RF technology
• Increased access to more data without additional staff• Improved management reports• Eliminated manual keyboarding and manual charting of
medical record• Access to inventory values at every nurses station
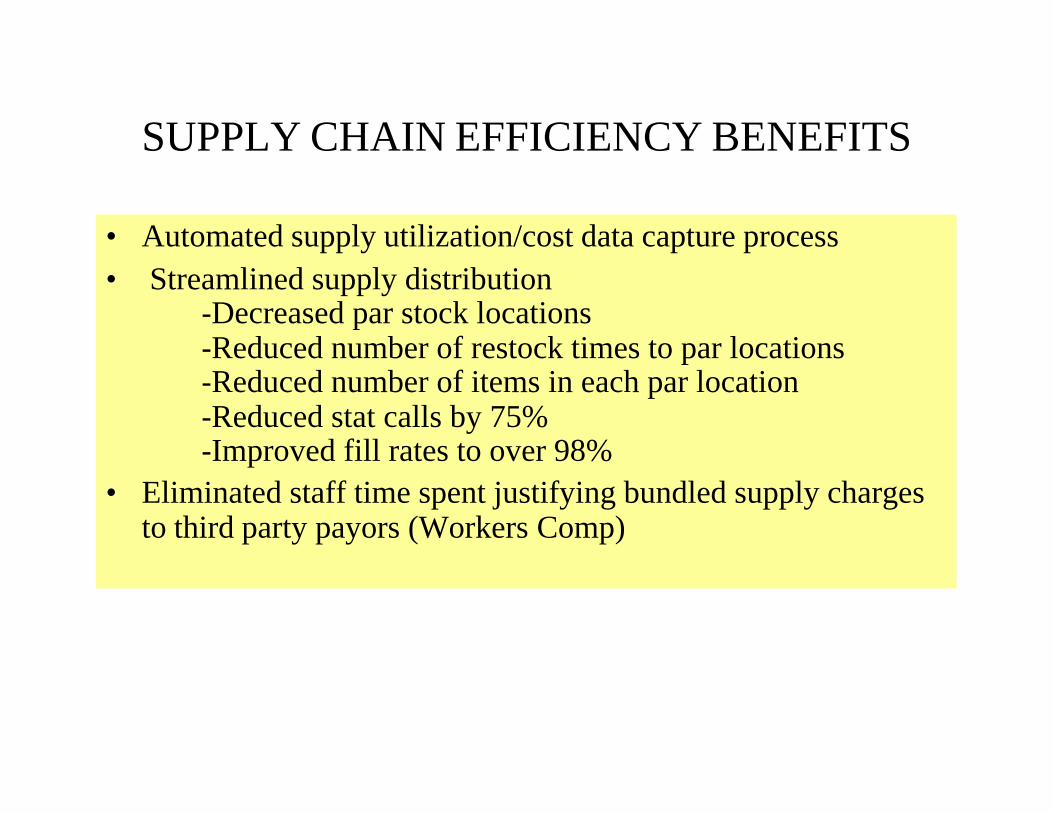
SUPPLY CHAIN EFFICIENCY BENEFITS
• Automated supply utilization/cost data capture process
• Streamlined supply distribution -Decreased par stock locations -Reduced number of restock times to par locations -Reduced number of items in each par location -Reduced stat calls by 75% -Improved fill rates to over 98%
• Eliminated staff time spent justifying bundled supply charges to third party payors (Workers Comp)
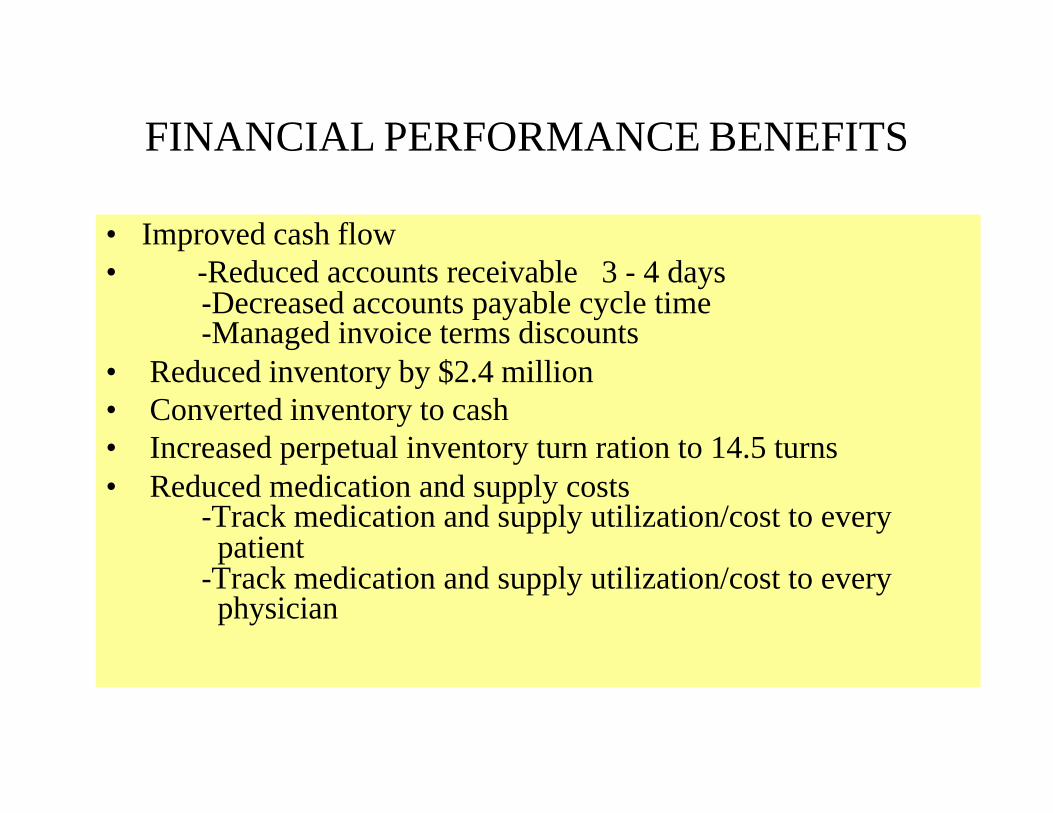
FINANCIAL PERFORMANCE BENEFITS
• Improved cash flow• -Reduced accounts receivable 3 - 4 days
-Decreased accounts payable cycle time -Managed invoice terms discounts
• Reduced inventory by $2.4 million• Converted inventory to cash• Increased perpetual inventory turn ration to 14.5 turns• Reduced medication and supply costs
-Track medication and supply utilization/cost to every patient
-Track medication and supply utilization/cost to every physician

“Most of what we call management consists of making it difficult for people to get their work done”
Tom Peters, Author In Search of Excellence
When you discover you are riding a dead horse, the best strategy is to dismount. That’s a no brainer. . .
However, in business, we often try other strategies with dead horses. . .
Harvey Mackay
Star Tribune “Outswimming the Sharks”Jan. 17, 2001
• Buying a stronger whip
• Changing riders
• Declaring that “This is the way we have always ridden this horse.”
Harvey Mackay
Star Tribune
“Outswimming the Sharks”
Jan. 17, 2001
• Appointing a committee to study the horse.
• Arranging to visit other sites to see how they ride dead horses.
• Appointing a team to revive the dead horse.
Harvey Mackay
Star Tribune
“Outswimming the Sharks”Jan. 17, 2001
• Creating a training session to improve employees’ riding skills
• Changing the requirements, declaring “This horse is not dead.”
• Outsourcing contractors to ride the dead horse.
Harvey Mackay
Star Tribune “Outswimming the Sharks”Jan. 17, 2001
• Harnessing several dead horses together for increased speed.
• Providing additional funding to increase the horse’s performance.
Harvey Mackay Star Tribune “Outswimming the Sharks”Jan. 17, 2001

Mackay’s Moral:
• Don’t horse around when you’re dealing with mistakes. Get back in the saddle and grab the reins.
Harvey Mackay
Star Tribune “Outswimming the Sharks”Jan. 17, 2001
We are on a journey to improve the safety and efficiency of the health industry supply chain.
Let’s work together and make it happen.

General Wrap Up Discussion Questions & Answers
Thank You