Embed Size (px)
Citation preview

- 1 -L
NASA CONTRACTOR REPORT 177490
* eivaN: A Forward--king Interactive Orbital Trajectory Plotting -1 for U s e with proximity operations ( P m OPS) and other Mmeuvers Description and U s e r ' s Manual
AdamR. Brody
(hASA-CK-177490) IkE eivaN: E N118-3C327 E LEMA G L - L C C K I BG I hI EE P C I I V E C I El IAi IbAJ.kCTC6Y P L C ' I l I k G T C C L IC& LSE LIT9 € E C X I E I T Y C E E F i A I I C N S ( P b O X Cf:) A L D CTHEE U n c l a E I
B A A E U Y E B S : C L 5 C E I E T I C E A N T C ; € B * S RASUABL e3161 0157141 I
CONTRACT NAS2- 11555 June 1988
https://ntrs.nasa.gov/search.jsp?R=19880020943 2019-12-27T14:30:21+00:00Z

NASA CONTRACTOR REPORT 177490
eivaN: A Forward--king Interactive Orbital Trajectory Plotting Tbol for U s e with Proximity Operations (PIOX 0s) and Other Maneuvers Description and User's Manual
Prepared for Anaes Research center Under Contract NAS2-11555
National Aeronautics and Space Administration
Ames Research Center Moffett Field, California 94035

Table of Contents
List of Figures.. ....................................................................................... .1 Symbols and Abbreviations. ........................................................................ ..l
Introduction.. .......................................................................................... .1 eivaN Installation.. .................................................................................... .2 eivaN Operation ....................................................................................... .3
Conclusions.. .......................................................................................... .9 References ............................................................................................... 9
summary. ............................................................................................. ..l
Advanced User Technique and Options ............................................................ .5
List of Figures
Figure 1 : Combined eivaN InpuVOutput Window Figure 2: eivaN Input Spreadsheet Figure 3: eivaN Output Figure 4: eivaN POP Figure 5: Modification of Category Axis
Symbols and Abbreviations
Av LVL
n
change in velocity imparted to a space vehicle in meters per second Local Vertical Local Horizontal, a configuration in which the orbiting body rotates
once an orbital period to maintain the same orientation with respect to the Earth mean orbital mohon, average angular velocity in radians per second
Perpendicular to the Orbital Plane proximity operations, those operations occurring within a 1 kilometer sphere of
,H
t time in seconds POP PROX OPS
the space station V-bar the velocity vector
Summary
Inspired by observed visualization and comprehension difficulties associated with motions due to orbital mechanics effects, the author developed an interactive computer graphics device to assist the user with the planning of orbital missions. This device, eivaN, runs with Microsoft@ Excel on a Macintosh computer. EivaN provides a forward-looking display: bum parameters in the three orthogonal axes in addition to time are inputted, and the resultant trajectory is then plotted. Position and velocity components for any bum at any user-specified time are readily available. A new area of research related to the human factors of real time, on-orbit mission planning has been identified and is currently being investigated.
Introduction
The result of vehicle burns on-orbit is very difficult to anticipate because of non-linearities in the equations of motion governing orbiting bodies. This confusion was noticed firsthand in prior experimentation. [Brody, 19871 Out of plane motion is relatively simple as it is uncoupled from the other two degrees of freedom and is defined as the sinusoidal path of simple harmonic motion with a period equal to the orbital period. However, thrusts along the other two orthdgond axes are more complex because the motions resulting from these inputs are coupled. For example, a
1

downward thrust yields fore and aft relative motion. An interactive planning device, eivaN, was developed to plot resulting trajectories, to provide a better comprehension of orbital mechanics effects, and to help the user to develop heuristics for on-orbit mission planning.
EivaN comprises a worksheet and a chart from Microsofm Excel and runs on a Macintosh computer. The orbital path for a user-specified time interval is plotted given operator burn inputs. A number of software shortcuts were taken to speed this process. Fuel use is also calculated as total Av. Starting location with respect to any convenient stationary location such as the Space Station may be readily inserted. The value for mean orbital motion, n, is also easily accessible making eivaN readily adaptable to moon and Mars simulations as well as to any Earth orbital altitude.
After the thrust parameters (magnitude, direction, and time) are inputted, eivaN plots the resulting trajectory. Up to five burns may be inserted at any time in the mission in an unlimited time frame. Twenty data points are plotted for each burn and the time interval can be varied to accommodate any desired time frame or degree of resolution. Since the number of data points for each burn is constant, the mission duration can be increased or decreased by increasing or decreasing the time interval.
A working knowledge of Excel is helpful, but not imperative, for interacting with eivaN. A user with this understanding can easily increase (or decrease) the number of burns available for input and the number of points plotted for each thrusting maneuver. Both of these parameters should be kept to a minimum, however, as they significantly increase the computation and plotting time required for each iteration regardless of whether the additional burns are actually used.
eivaN Installation
1. Double-click on the "eivaN Input" icon to load the input spreadsheet. (You must have a copy of Microsoft@ Excel on your machine for this to work.)
2. Open the chart "eivaN Output". 3. Adjust window size to personal taste. You should probably maximize the area of the chart.
The computer screen should appear as in Figure 1.
2

r 6 File Edit Formula Format Data Options Macro Window
818 I I 0.5 a-E eiuaN Inpsmi eiuaN Output
eivaN Output
Range ahead, me?erz
-e- Burn 1 -0- Burn 2 a- Burn 3 -0- Burn 4 * Burn 5
Figure 1: Combined eivaN Input/Output Window
eivaN Operation
Initial conditions are inputted in "Up", "Forward", and "Left" directions as defined by an observer in an LVLH configuration facing forward along the +V-bar. These values are set relative to any convenient "stationary" origin such as the center of mass of the space station and appear in boxes B2:B4. (See Figure 2.) The units are meters. In proposed Space Station reference axes, these directions correspond to -Z, +X, and -Y. To prevent confusion among the various conflicting and non-compatible coordinate systems which include, but are not limited to, Greenwich True of Date, Geodetic, Space Station Reference, Orbiter Body Axis, Orbiter Structural Body, and Orbital Element, (see JSC 30219) the Up, Forward, Left system is emphasized for input.
3

r * 6 File Edit Formula Format Data ODtions Macro Window
AS I I interval (min) go eiuaN Input ’ pJg - -
Figure 2: eivaN Input Spreadsheet
EivaN plots twenty points for each thrust with a user-definable time interval which is entered in B5 in minutes. Fractional minutes are allowed for increased resolution. The first point appears at the instant of bum and twenty successive marks appear after the designated interval regardless of whether subsequent burns are: made. Since twenty points resulting from bum 1 are plotted regardless of when and if there is a burn 2, the effect of each inputted thrust can be readily assessed and compared with the single burn condition. The type of mark for each bum is distinct to facilitate this interpretation.
The thrust parameters for Burn 1 are inserted in boxes B7:B9. This maneuver occurs at mission initiation so no time value is required Thrust values for Burn 2 are placed in boxes B 12:B 14 and time of bum initiation (from mission beginning) in seconds is inserted in B15. One interesting visualization technique involves specifying the time of a bum but omitting the magnitude parameters. In this way, twenty data points for a trajectory can be drawn anywhere in m e without altering the path. This method may be used to plot points after the time span of an orbital period, for example, or to continue the plot of a bum after twenty points. Input values for successive burns are installed in the same manner further down column B. Note: it is important to keep burns in chronological order as the calculations may get disturbed otherwise.
4

The rest of the worksheet contains the values for the data points as well as a l l intermdate data. Actual position locations can be read from the spreadsheet in addition to the velocity components just prior to each burn. A knowledge of Excel is helpful for advanced interpretation of the worksheet.
Box B35 indicates the total Av for all of the maneuvers. This value is echoed in B 1 for added visibility. Column U provides the relative time, t, in seconds of each data point. Column V shows the product oft and mean orbital motion, n, in radians. The values in this column and every other instance of n in the spreadsheet must be altered to account for a new n resulting from a different altitude or planet. These include the nt products in row 3, the Left Pre-burn velocity components, and the preliminary calculation values in rows 6-9. Although this is much more tedious than merely inputting a new value for mean orbital motion in one location, this saves iterative computation time by eliminating the repeated calculation of nt each loop as well as reducing lookup time. Those users whose needs require them to routinely vary n can modify the spreadsheet to accept n as an input. This would increase the time required for each iteration but would reduce the chance of error in changing every value of n in the spreadsheet. It might be useful to prepare a separate eivaN input worksheet for each value of n needed and just identify the appropriate worksheet when a graph is required. Nothing need be changed on the graph. (The current value of n is that corresponding to a 250 n mi orbit around the Earth which is what is proposed for the international space station.)
Advanced User Technique and Options
Since graphical presentation is the most important output of eivaN, it is essential that the user ..I udclwxiib .......a
is where a working knowledge of Excel is useful. The following will discuss the user's graphical options.
Lulu --AL,,.,,,. mwulc fz.r~dizi with tlk 3j.'~im1's ~zipzibi i i i~ zs WZU &e cpiiciis it p i ~ i d z s . IIei.2
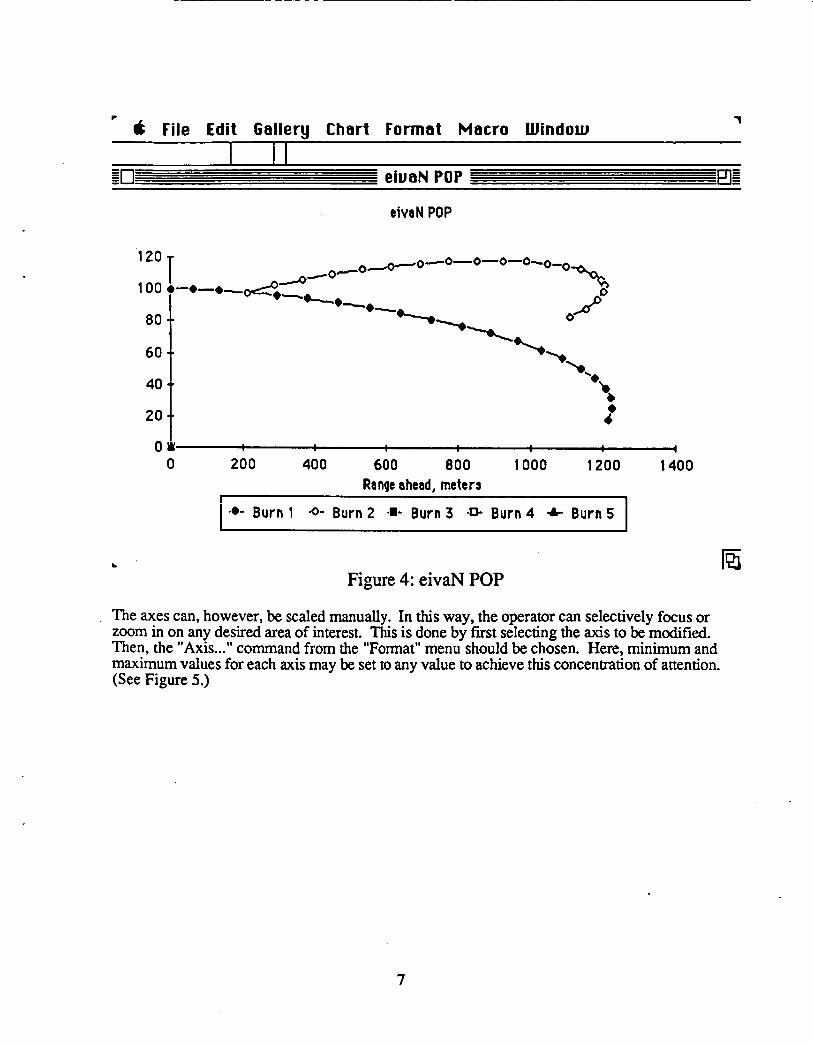
EivaN plots data points connected by lines in the Up-Forward an Left-Forward planes. (See Figures 3,4.) Generally, only the Up-Forward plot will be used as the motion perpendicular to the orbital plane (POP) constitutes an independent problem that is usually solved before the initiation of PROX OPS. Twenty points are plotted for each burn and the graph and axes are automatically scaled in order to accommodate all of the data points.
5

r 1 6 File Edit Gallery Chart Format Macro Window
q-J - eiuaN Output rn pJ: T
eivaN Output
100
I .-e--.-. - 300 -200 300 .= -100
i 4 I - 300 ..
Range ahead, meters
-0- Burn 1 -0- Burn 2 -I- B u r n 3 -0- Burn 4 -A- B u r n 5
Figure 3 eivaN Output
6
la
1 6 File Edit Gallery Chart Format Macro Window
I I I g-J - eiuaN POP
eivaN POP
2o t Oh I
0 200 40 0 600 800 1000 1200 1400 Range ahead, meters
I
.e- Burn 1 -0- Burn 2 a- Burn 3 -0- Burn 4 .C Burn 5
b
Figure 4: eivaN POP la
The axes can, however, be scaled manually. In this way, the operator can selectively focus or zoom in on any desired area of interest. This is done by frrst selecting the axis to be modified. Then, the "Axis ..." command from the "Format" menu should be chosen. Here, minimum and maximum values for each axis may be set to any value to achieve this concentration of attention. (See Figure 5.)
7

I 6 File Edit Gallery Chart I Macro Window I I I
0 None 0 Low 0 High @ Next to Axis i
Category Axis
Ranae (Cancel J "
Minimum: 1-1 IxI Maximum:
Major Unit:
Minor Unit: Ualue Axis
Crosses At:
~ 0 logarithmic Scale
~
0 Categories in Reuerse Order
Another advanced operating technique involves the rapid input of several data. In some instances, multiple inputs (such as time and burn magnitude parameters) may have to be made before a calculation and subsequent plot will be meaningful. The program will pause for approximately three seconds after data input before calculating new data points. To inhibit plotting until all
entering successive values. This will greatly reduce the time required to plot a trajectory. Also, intermediate calculations concerning burn magnitudes are meaningless without the time parameter. Similarly, if a combined Up and Forward burn is desired, the user should not pause long enough between inputs for calculations to commence. Note: even if calculations do start, they will pause upon interruption for a new entry and restart afterwards.
A macro was developed which provides position and velocity information to the user for any user- specified bum at any user-specified time. To operate this macro, the worksheet "eivaN macros'' must be opened. It should then be sent to the background by selecting all documents. which it is blocking. To operate the macro, press option-command-v. Upon request, enter the bum number and time for which data is desired. EivaN will compute the six values and present them in a small spreadsheet near the top of the screen. These values will change when bum parameters which affect them are altered. This process may be repeated for as many different burns and times as desired, however, each open spreadsheet will cumulatively increase the computation,time. Any and all of them may be closed at any time. The data may also be graphed.
I desired entries have been made, the operator should not wait for calculations to commence befcre
8

Since instruction is only partially helpful without hands on experience, the reader is encouraged to use eivaN to design and plan orbital missions of her own. Upon completion of this manual, she is capable of doing so.
Conclusions
Preliminary investigations reveal eivaN to be useful in the illustrating of orbital mechanics effects. Also, utility as an interactive, real time planning device is foreseen and experiments are in progress to further evaluate its use in this role. A necessary device has been developed and is now available for use and examination.
References
Brody, Adam Randall. Spacecrsfr Flight Simulation: A Human Factors Investigation into the Man- Machine Interface Between an Astronaut and a Spacecrajl Performing Docking Maneuvers and Other Proximity Operations, S . M. Thesis, Massachusetts Institute of Technology, April, 1987.
Kaplan, Marshall H. Modern Spacecraft Dynamics & Control, New York: John Wiley & Sons, 1976.
Microsofta. Excel User's Guide, 1985.
Space Station Program Office. Space Station Reference Coordinate Systems, JSC 30219,1986.
9
1. Repat No. 2. cormmnt - No. 3. Rripianr's -tog No. NASA CR-177490 _ _ I
4. TlllI md subtlth eivaN: A Forward--king Interactive Orbital Trajec- tory plotting -1 for U s e with Proximity Operations
&mX OPS) and other Maneuvers Description and U s e r ' E
1. nopotl RtI
6. orQnimion Q6 June 1988
- 7. AurhorIaJ
M m R . Brody ,
0. Rrfaming Orgmnirrtion Name and Mdron
Sterling Software 1121 San Antonio Road Palo Alto, CA 94303
6. Worming Ol~nirnion R~pat No.
10. Work Unit No.
11. Contract M h n t No. NAS 2- 1155 5
9 *why oarif . (of this r0-t)
Unclassified
13. T y p of RIport .nd hid Covrrd
Contractor Report I2 Smnrmlng Apmcv Name md Abdresa
National Aeronautics and Space Administration Washington, DC 20546
15 Suoplementary Notes Robert A. Carlson
14. Sponsoring Agmq bdc
Point of Contact: MS 233-15 FTS 448-6036 Ames Research center 415-694-6036 Wffe t t Field, CA 94035
16 Abstract
The results of vehicle burns on-orbit are very d i f f icu l t to anticipate because of nonlinearities in the equations of mt ion governing orbiting bodies. confusion was noticed firsthand i n prior e x p e r k t a t i o n . Out of plane mt ion is relatively simple as it is uncoupled fran the other t m degrees of freedom. However, i n plane thrusts are mre ccanplex because the mtions resulting from these inputs are coupled. to plot resulting trajectories, to provide a better comprehension of orbi ta l mechanics effects, and to help the user to develop heuristics for on-orbit mission planning. EivaN runs with Microsoft Excel on a Macintosh computer. provides a forward-looking display: bum parameters i n the three orthogonal axes i n addition to tirrae are inputted, and the resultant trajectory is then plotted. t i m e are readily available. factors of real t i r e , on-orbit mission planning has been identified and is currently being investigated.
m i s
An interactive planning device, eivaN, was developed
It
Position and velocity cCBl(p0nents for any bum a t any user-specified A new area of research related to the human
'
20. s.Writy W f . (of this poi) 21. NO. of 22. Rice'
Unclassified 9 A02
7 K ~ v War* ( S w t e d by Aurhor(c1) 18. Oitniknion Sutrmtnt
PmX OPS; Interactive; Trajectory; Unclassified, unlimited Orbital