Embed Size (px)
Citation preview
A HYBRID SWARM INTELLIGENCE BASED PARTICLE BEE ALGORITHM FOR BENCHMARK FUNCTIONS AND CONSTRUCTION SITE LAYOUT
OPTIMIZATION
Min-Yuan Cheng and Li-Chuan Lien*
Department of Construction Engineering, National Taiwan University of Science and Technology, Taiwan
* Corresponding author ([email protected])
ABSTRACT: The construction site layout (CSL) design presents a particularly interesting area of study because of its
relatively high level of attention to usability qualities, in addition to common engineering objectives such as cost and
performance. However, it is difficult combinatorial optimization problem for engineers. Swarm intelligence (SI) was very
popular and widely used in many complex optimization problems which was collective behavior of social systems such as
honey bees (bee algorithm, BA) and birds (particle swarm optimization, PSO). In order to integrate BA global search ability
with the local search advantages of PSO, this study proposes a new optimization hybrid swarm algorithm – the particle bee
algorithm (PBA) which imitates the intelligent swarming behavior of honeybees and birds. This study compares the
performance of PBA with that of genetic algorithm (GA), differential evolution (DE), bee algorithm (BA) and particle
swarm optimization (PSO) for multi-dimensional benchmark numerical problems. Besides, this study compares the
performance of PBA with that of BA and PSO for practical construction engineering of CSL problem. The results show that
the performance of PBA is comparable to those of the mentioned algorithms in the benchmark functions and can be
efficiently employed to solve a hypothetical CSL problem with high dimensionality.
Keywords: Construction Site Layout, Swarm Intelligence, Bee Algorithm, Particle Swarm Optimization, Particle Bee
Algorithm
1. INTRODUCTION
Construction site layout (CSL) problems are particularly
interesting because in addition to common engineering
objectives such as cost and performance, facility design is
especially concerned with aesthetics and usability qualities
of a layout [1]. The CSL problem identifies a feasible
location for a set of interrelated objects that meet all design
requirements and maximizes design quality in terms of
design preferences while minimizing total cost associated
with interactions between these facilities. Pairwise costs
usually reflect transportation costs and/or inter-facility
adjacency preferences [1, 2]. CSL problems arise in the
design of hospitals, service centers and other facilities [3].
However, all such problems are known as “NP-hard” and
because of the combinatorial complexity, it cannot be
solved exhaustively for reasonably sized layout problems
[3].
In the past, Elbeitagi and Hegazy [4] used a hybrid neural
network to identify optimal site layout. Yeh [3] applied
annealed neural networks to solve construction site-level
CSL problems. Gero and Kazakov [5] incorporated the
concept of genetic engineering into the GA system for
solving building space layout problems. Li and Love [6]
and Osman et al. [7] used GA to solve site layout problems
in unequally sized facilities. The objective functions of the
above-mentioned algorithms were to optimize the
interaction between facilities, such as total inter-facility
transportation costs and frequency of inter-facility trips.
Those previous research focused on solving different
optimization problems by applying those algorithms under
different constraints which quality of solutions were
limited by the capability of the algorithms.
Swarm intelligence (SI) has been of increasing interest to
research scientists in recent years. SI was defined by
Bonabeau et al. as any attempt to design algorithms or
S26-4
898
distributed problem-solving devices based on the collective
behavior of social insect colonies or other animals [8].
Bonabeau et al. focused primarily on the social behavior of
ants [9], fish [10], birds [11] and bees [12] etc. However,
the term “swarm” can be applied more generally to refer to
any restrained collection of interacting agents or
individuals. Although bees swarming around a hive is the
classical example of “swarm”, swarms can easily be
extended to other systems with similar architectures.
A few models have been developed to model the intelligent
behaviors of honeybee swarms and applied to solve
combinatorial type problems. Karaboga et al. [13]
presented an artificial bee colony (ABC) algorithm and
expanded its experimental results [14]. It has been pointed
out that the ABC algorithm outperforms GA for functions
exhibiting multi-modality or uni-modality. Pham et al. [12]
presented an original bee algorithm (BA) and applied to
two standard functional optimization problems with two
and six dimensions. Results demonstrated BA able to find
solutions very close to the optimum, showing that BA
generally outperformed GA. However, while BA [12]
offers the potential to conduct global searches and uses a
simpler mechanism in comparison with GA, it dependence
on random search makes it relatively weak in local search
activities and does not records past searching experiences
during the optimization search process. For instance, a
flock of birds may be thought of as a swarm whose
individual agents are birds. Particle swarm optimization
(PSO), which has become quite popular for many
researchers recently, models the social behavior of birds
[12]. PSO potentially used in local searching, and records
past searching experiences during optimization search
process. However, it converges early in highly discrete
problems [15].
Hence, in order to improve BA and PSO, this study
proposed an improved optimization hybrid swarm
algorithm called the particle bee algorithm (PBA) that
imitates a particular intelligent behavior of bird and honey
bee swarms and integrates their advantages. In addition,
this study also proposed a neighborhood-windows (NW)
technique for improving PBA search efficiency and
proposed a self-parameter-updating (SPU) technique for
preventing trapping into a local optimum in high
dimensional problems. This study compares the
performance of PBA algorithm with that of BA [12] and
PSO for a hypothetical construction engineering of CSL
problem.
2. HYBRID SWARM PARTICLE BEE ALGORITHM
For improved BA local search ability, PSO global search
ability and to seek records past experience during
optimization search process, this study reconfigures the
neighborhood dance search [12] as a PSO search [11].
Based on cooperation between bees (BA) and birds (PSO),
the proposed algorithm improves BA neighborhood search
using PSO search. Therefore, PBA employs no recruit bee
searching around “elite” or ”best” positions (as BA does).
Instead, a PSO search is used for all elite and best bees. In
other words, after PSO search, the number of “elite”,
“best” and “random” bees equals the number of scout bees.
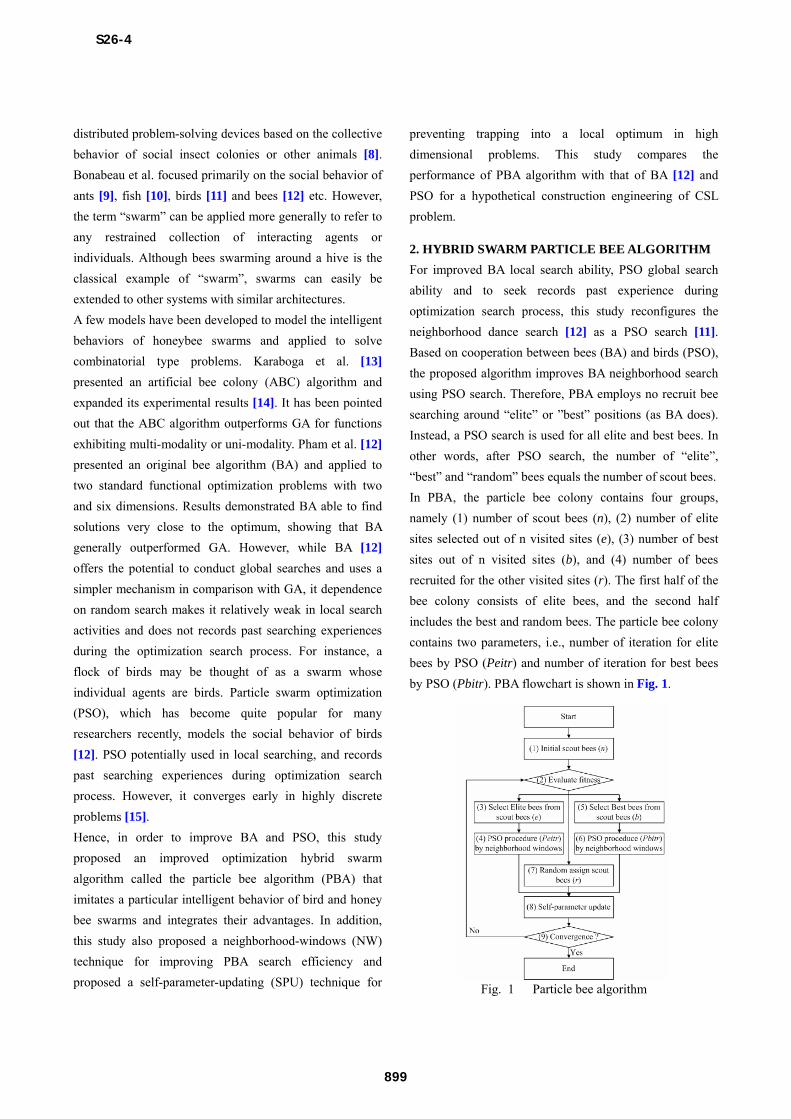
In PBA, the particle bee colony contains four groups,
namely (1) number of scout bees (n), (2) number of elite
sites selected out of n visited sites (e), (3) number of best
sites out of n visited sites (b), and (4) number of bees
recruited for the other visited sites (r). The first half of the
bee colony consists of elite bees, and the second half
includes the best and random bees. The particle bee colony
contains two parameters, i.e., number of iteration for elite
bees by PSO (Peitr) and number of iteration for best bees
by PSO (Pbitr). PBA flowchart is shown in Fig. 1.
Fig. 1 Particle bee algorithm
S26-4
899
Step (1) Initialize scout bees: PBA starts with n scout bees
being randomly placed with respective positions and
velocities in the search space.
Step (2) Evaluate fitness: Start the loop and evaluate scout
bee fitness.
Step (3) Select elite sites (e) from scout bees: Elite sites
are selected for each elite bee, whose total number is equal
to half the number of scout bees.
Step (4) Elite bees initiate the PSO procedure by Peitr
iteration for neighborhood-windows (NW): In this step,
new particle bees from elite and best bees are produced
using Eq. (1). Elite and best bee velocity updates are
performed as indicated in Eq. (2). This study further
proposed a neighborhood-windows (NW) technique to
improve PSO searching efficiency as show in Eq. (3). Thus,
after xid(t+1) is substituted into Eq. (1) and Eq. (2), the
NW ensures PSO searching within the designated xidmin and
xidmax. In other word, if the sum of xid(t+1) exceeds xidmin or
xidmax then xid(t+1) is limited to xidmin or xidmax.
11 tvtxtx ididid …..………....……………………..(1) where xi is ith x and i = 1 to n; vi is ith v; d is dimension in xi or v and d = 1
to D; t is iteration; xid(t) is dth dimension in ith x and in t iteration; vid(t+1)
is dth dimension in ith v and in t+1 iteration; xid(t+1) is dth dimension in ith x
and in t+1 iteration; n is number of particles.
)]()([)]()([)()1( 21 txtGRandctxtPRandctvwtv iddidididid
....................................................................................…..(2) where vid(t) is dth dimension in ith v and in t iteration; w is inertia weight
and controls the magnitude of the old velocity vid(t) in the calculation of
the new velocity; Pid (t)is dth dimension in ith local best particle and in t
iteration; Gd(t) is dth dimension global best particle in t iteration; c1 and c2
determine the significance of Pid(t) and Gd(t); Rand is a uniformly
distributed real random number within the range 0 to 1.
maxmin )1( ididid xtxx ………………..………………….…(3) where xi is ith x and i = 1 to n; d is dimension in xi and d = 1 to D; t is
iteration; xid(t+1) is dth dimension in ith x and in t+1 iteration; n is number
of particles.
Step (5) Select best sites (b) from scout bees: Best sites
are selected for each best bee, the total number of which
equals one-quarter of the number of scout bees.
Step (6) Best bees start the PSO procedure using the
NW Pbitr iteration: In this step, new particle bees from
elite and best bees are produced using Eq. (1). Elite and
best bee velocity updates are acquired using Eq. (2). The
NW technique improves PSO search efficiency, as show in
Eq. (3).
Step (7) Recruit random bees (r) for other visited sites:
The random bees in the population are assigned randomly
around the search space scouting for new potential
solutions. The total number of random bees is one-quarter
of the number of scout bees.
Step (8) Self-parameter-updating (SPU) for elite, best
and random bees: Furthermore, in order to prevent being
trapped into a local optimum in high dimensional problems,
this study proposed a solution, i.e., the self-parameter-
updating (SPU) technique, the idea for which came from
Karaboga [13]. Eq. (4) shows the SPU equation.
xid(new )= xid(cur)+ 2×(Rand-0.5)×(xid(cur) – xjk)………………... (4)
j = int (Rand × n) + 1…………...….…………...…………....(5)
k = int (Rand × d) + 1……………….…...……...…...……....(6) where xi is ith x and i = 1 to n; d is dimension in xi and d = 1 to D; xid(cur)
is dth dimension in ith x and in current solution; xid(new) is dth dimension in
ith x and in new solution; Rand is a uniformly distributed real random
number within the range 0 to 1; j is the index of the solution chosen
randomly from the colony as shows in Eq. (5), k is the index of the
dimension chosen randomly from the dimension as shows in Eq. (6); n is
number of scout bees.
In step (8), after elite, best and random bees have been
distributed based on finesse, finesses are checked to
determine whether they are to be abandoned or memorized
using Eq. (4). Therefore, if finesses of elite, best or random
bees are both improved using Eq. (4) and improved over
previous finesses, the new finesses are memorized. In step
(3) through step (8), this differential recruitment is a key
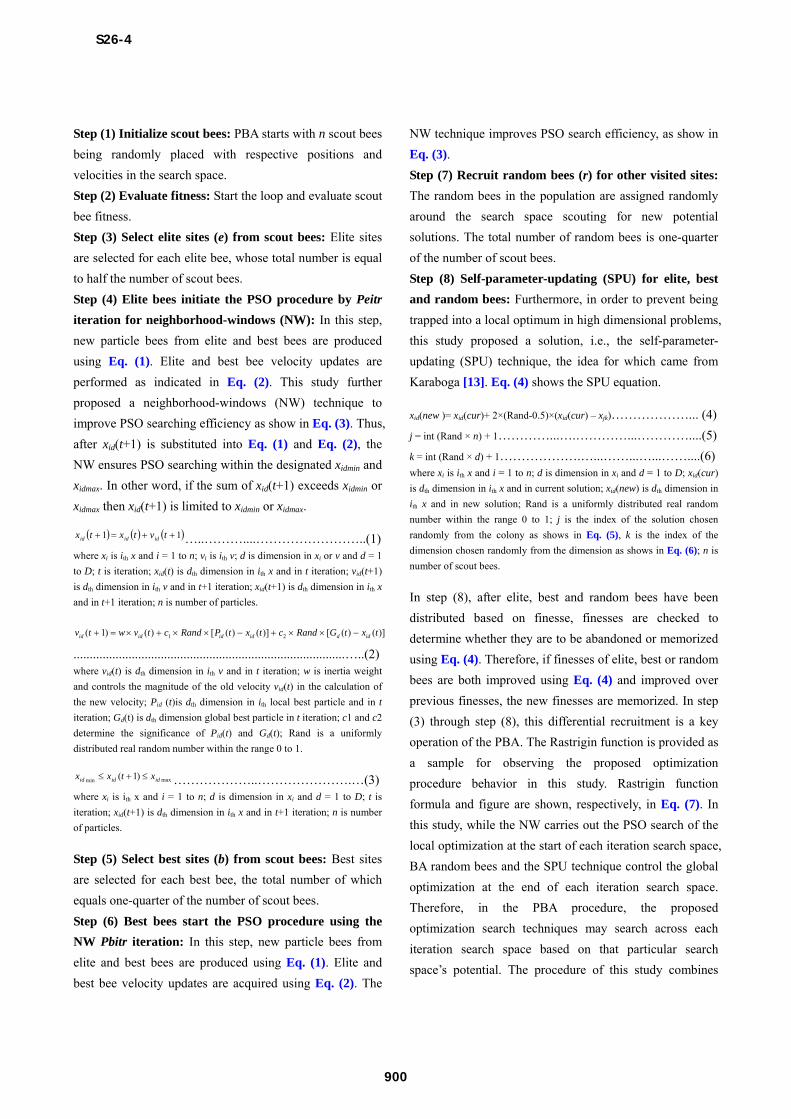
operation of the PBA. The Rastrigin function is provided as
a sample for observing the proposed optimization
procedure behavior in this study. Rastrigin function
formula and figure are shown, respectively, in Eq. (7). In
this study, while the NW carries out the PSO search of the
local optimization at the start of each iteration search space,
BA random bees and the SPU technique control the global
optimization at the end of each iteration search space.
Therefore, in the PBA procedure, the proposed
optimization search techniques may search across each
iteration search space based on that particular search
space’s potential. The procedure of this study combines
S26-4
900
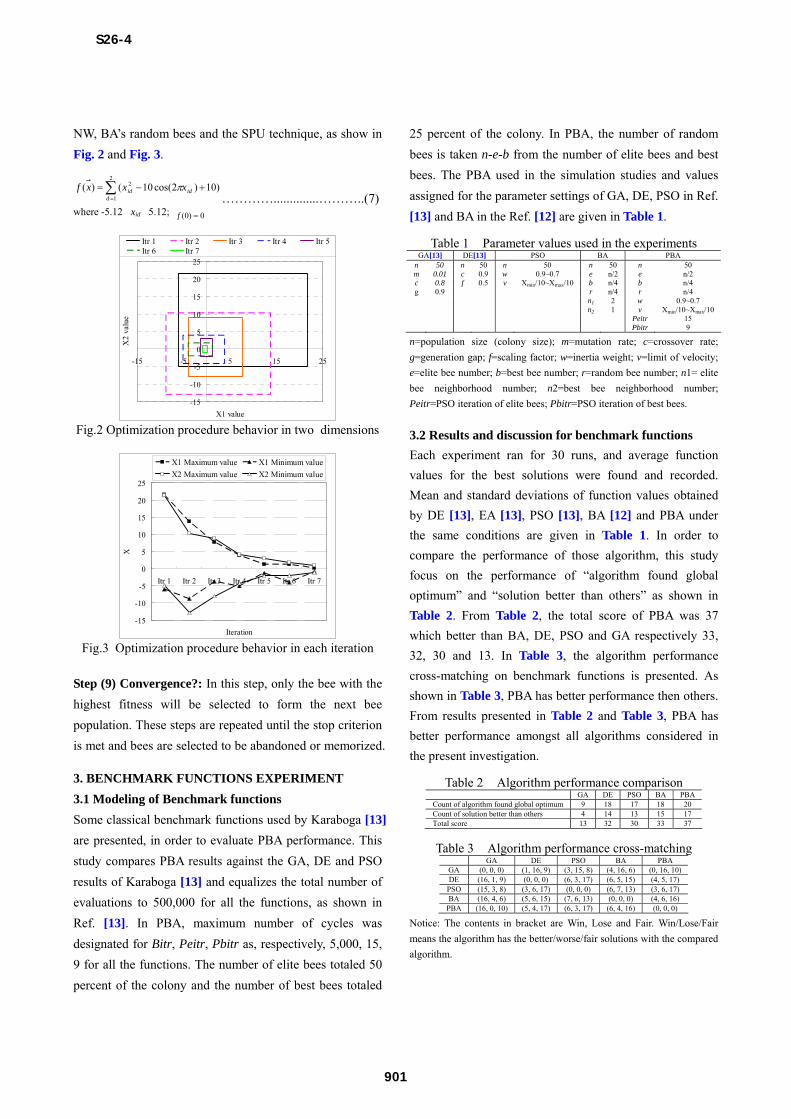
NW, BA’s random bees and the SPU technique, as show in
Fig. 2 and Fig. 3.
2
1
2 )10)2cos(10()(d
idid xxxf …………..............………..(7)
where -5.12�xid�5.12; 0)0( f
-15
-10
-5
0
5
10
15
20
25
-15 -5 5 15 25
X1 value
X2
valu
e
Itr 1 Itr 2 Itr 3 Itr 4 Itr 5Itr 6 Itr 7
Fig.2 Optimization procedure behavior in two dimensions
-15
-10
-5
0
5
10
15
20
25
Itr 1 Itr 2 Itr 3 Itr 4 Itr 5 Itr 6 Itr 7
Iteration
X
X1 Maximum value X1 Minimum value
X2 Maximum value X2 Minimum value
Fig.3 Optimization procedure behavior in each iteration
Step (9) Convergence?: In this step, only the bee with the
highest fitness will be selected to form the next bee
population. These steps are repeated until the stop criterion
is met and bees are selected to be abandoned or memorized.
3. BENCHMARK FUNCTIONS EXPERIMENT
3.1 Modeling of Benchmark functions
Some classical benchmark functions used by Karaboga [13]
are presented, in order to evaluate PBA performance. This
study compares PBA results against the GA, DE and PSO
results of Karaboga [13] and equalizes the total number of
evaluations to 500,000 for all the functions, as shown in
Ref. [13]. In PBA, maximum number of cycles was
designated for Bitr, Peitr, Pbitr as, respectively, 5,000, 15,
9 for all the functions. The number of elite bees totaled 50
percent of the colony and the number of best bees totaled
25 percent of the colony. In PBA, the number of random
bees is taken n-e-b from the number of elite bees and best
bees. The PBA used in the simulation studies and values
assigned for the parameter settings of GA, DE, PSO in Ref.
[13] and BA in the Ref. [12] are given in Table 1.
Table 1 Parameter values used in the experiments GA[13] DE[13] PSO BA PBA
n 50 n 50 n 50 n 50 n 50 m 0.01 c 0.9 w 0.9~0.7 e n/2 e n/2 c 0.8 f 0.5 v Xmin/10~Xmax/10 b n/4 b n/4 g 0.9 r n/4 r n/4 n1 2 w 0.9~0.7 n2 1 v Xmin/10~Xmax/10 Peitr 15 Pbitr 9
n=population size (colony size); m=mutation rate; c=crossover rate;
g=generation gap; f=scaling factor; w=inertia weight; v=limit of velocity;
e=elite bee number; b=best bee number; r=random bee number; n1= elite
bee neighborhood number; n2=best bee neighborhood number;
Peitr=PSO iteration of elite bees; Pbitr=PSO iteration of best bees.
3.2 Results and discussion for benchmark functions
Each experiment ran for 30 runs, and average function
values for the best solutions were found and recorded.
Mean and standard deviations of function values obtained
by DE [13], EA [13], PSO [13], BA [12] and PBA under
the same conditions are given in Table 1. In order to
compare the performance of those algorithm, this study
focus on the performance of “algorithm found global
optimum” and “solution better than others” as shown in
Table 2. From Table 2, the total score of PBA was 37
which better than BA, DE, PSO and GA respectively 33,
32, 30 and 13. In Table 3, the algorithm performance
cross-matching on benchmark functions is presented. As
shown in Table 3, PBA has better performance then others.
From results presented in Table 2 and Table 3, PBA has
better performance amongst all algorithms considered in
the present investigation.
Table 2 Algorithm performance comparison GA DE PSO BA PBACount of algorithm found global optimum 9 18 17 18 20 Count of solution better than others 4 14 13 15 17 Total score 13 32 30 33 37
Table 3 Algorithm performance cross-matching
GA DE PSO BA PBA GA (0, 0, 0) (1, 16, 9) (3, 15, 8) (4, 16, 6) (0, 16, 10)DE (16, 1, 9) (0, 0, 0) (6, 3, 17) (6, 5, 15) (4, 5, 17)
PSO (15, 3, 8) (3, 6, 17) (0, 0, 0) (6, 7, 13) (3, 6, 17) BA (16, 4, 6) (5, 6, 15) (7, 6, 13) (0, 0, 0) (4, 6, 16)
PBA (16, 0, 10) (5, 4, 17) (6, 3, 17) (6, 4, 16) (0, 0, 0)
Notice: The contents in bracket are Win, Lose and Fair. Win/Lose/Fair
means the algorithm has the better/worse/fair solutions with the compared
algorithm.
S26-4
901
4. CONSTRUCTION SITE LAYOUT PROBLEM
4.1 Modeling of a construction site layout problem
4.1.1 A hypothetical construction site layout
A medium-sized project is adopted as a hypothetical
construction site [16] to determine optimal site layout
through PSO, BA and PBA.
4.1.2 Number and type of facilities
This study considers some common site facilities, such as a
site office, a labor hut, a materials storage area, a main gate
and a refuse storage area [16]. The numbered site facilities
are listed in Table 4.
Table 4 Facilities used on the case study Facility no. Facility name Note
A Site office - B Debris storage area - C Reinforcement bending/storage yard - D Carpentry workshop and store - E Labor hut - F Materials storage area - G Main gate (fixed) Fixed H Materials hoist (fixed) Fixed I Refuse chute (fixed) Fixed
4.1.3 Travel distance between site locations
The travel distance between locations is measured using
the rectangular distance representing the actual operations
and resource movements on site. Table 5 shows the travel
distances between the possible facility locations [16].
Table 5 Travel distance between facilities
Location Distance
1 2 3 4 5 6 7 8 9 10 11 12 13 1 0 1 2 6 7 9 12 14 16 17 13 4 9 2 1 0 1 5 6 8 11 13 15 16 12 3 8 3 2 1 0 4 5 7 10 12 14 15 11 2 7 4 6 5 4 0 1 3 7 9 11 12 9 2 5 5 7 6 5 1 0 2 6 8 10 11 8 3 4 6 9 8 7 3 2 0 3 5 7 8 8 5 4 7 12 11 10 7 6 3 0 2 4 5 7 6 3 8 14 13 12 9 8 5 2 0 2 3 5 8 3 9 16 15 14 11 10 7 4 2 0 1 3 11 6
10 17 16 15 12 11 8 5 3 1 0 2 12 7 11 13 12 11 9 8 8 7 5 3 2 0 9 5 12 4 3 2 2 3 5 6 8 11 12 9 0 4
Location
13 9 8 7 5 4 4 3 3 6 7 5 4 0
4.1.4 Trip frequency between facilities
Trip frequency between facilities influences site layout
planning and the proximity of predetermined site facilities.
Therefore, the frequency of trips made between facilities in
a single day are assumed [16] as shown in Table 6.
4.1.5 Objective function
This study is based on Ref. [16] that gives the total
objective function as follows Eq. (8):
Minimize
n
i
n
j
n
kikikij dfx
1 1 1
1…………….…...……..………..……(8)
Subject to
If no reasonable solutions exist that the value of results is 150
If i=j then xij=0; If i=k then fik=dik=0
where n is the number of facilities; xij is the permutation
matrix variable such that when facility i is assigned to
location j; fik is the proximity relationship between facilities
i and k; and dik is the distance between locations i and k.
Table 6 Frequencies of trips between facilities
Facility Frequency
A B C D E F G H I A 0 3.11 4.79 4.94 5.15 5.41 6.34 3.48 2.55B 3.11 0 3.69 3.71 3.7 3.36 4.42 3.07 5.85C 4.79 3.69 0 4.27 4 4.4 5.65 6.26 2.03D 4.94 3.71 4.27 0 4.51 4.58 5.14 6.2 2.24E 5.15 3.7 4 4.51 0 4.99 4.39 4.13 2.48F 5.41 3.36 4.4 4.58 4.99 0 5.24 6.2 2.65G 6.34 4.42 5.65 5.14 4.39 5.24 0 4.62 3.75H 3.48 3.07 6.26 6.2 4.13 6.2 4.62 0 2.37
Facility
I 2.55 5.85 2.03 2.24 2.48 2.65 3.75 2.37 0
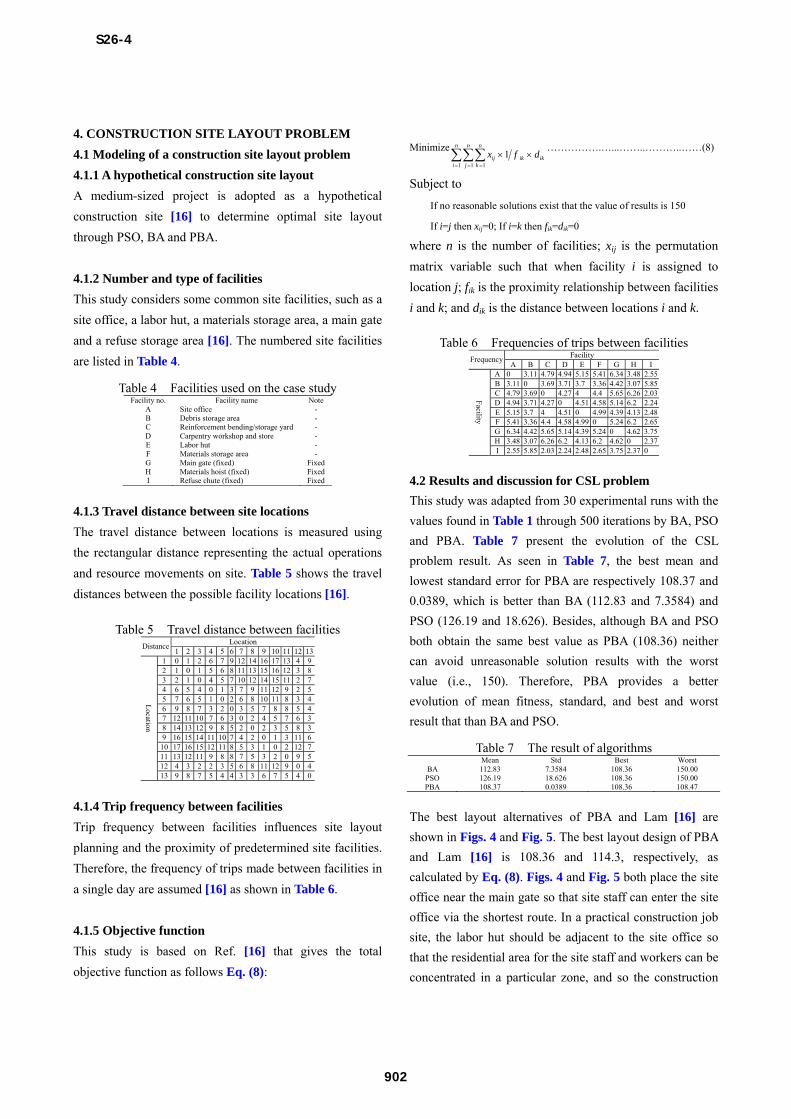
4.2 Results and discussion for CSL problem
This study was adapted from 30 experimental runs with the
values found in Table 1 through 500 iterations by BA, PSO
and PBA. Table 7 present the evolution of the CSL
problem result. As seen in Table 7, the best mean and
lowest standard error for PBA are respectively 108.37 and
0.0389, which is better than BA (112.83 and 7.3584) and
PSO (126.19 and 18.626). Besides, although BA and PSO
both obtain the same best value as PBA (108.36) neither
can avoid unreasonable solution results with the worst
value (i.e., 150). Therefore, PBA provides a better
evolution of mean fitness, standard, and best and worst
result that than BA and PSO.
Table 7 The result of algorithms Mean Std Best Worst
BA 112.83 7.3584 108.36 150.00 PSO 126.19 18.626 108.36 150.00 PBA 108.37 0.0389 108.36 108.47
The best layout alternatives of PBA and Lam [16] are
shown in Figs. 4 and Fig. 5. The best layout design of PBA
and Lam [16] is 108.36 and 114.3, respectively, as
calculated by Eq. (8). Figs. 4 and Fig. 5 both place the site
office near the main gate so that site staff can enter the site
office via the shortest route. In a practical construction job
site, the labor hut should be adjacent to the site office so
that the residential area for the site staff and workers can be
concentrated in a particular zone, and so the construction
S26-4
902
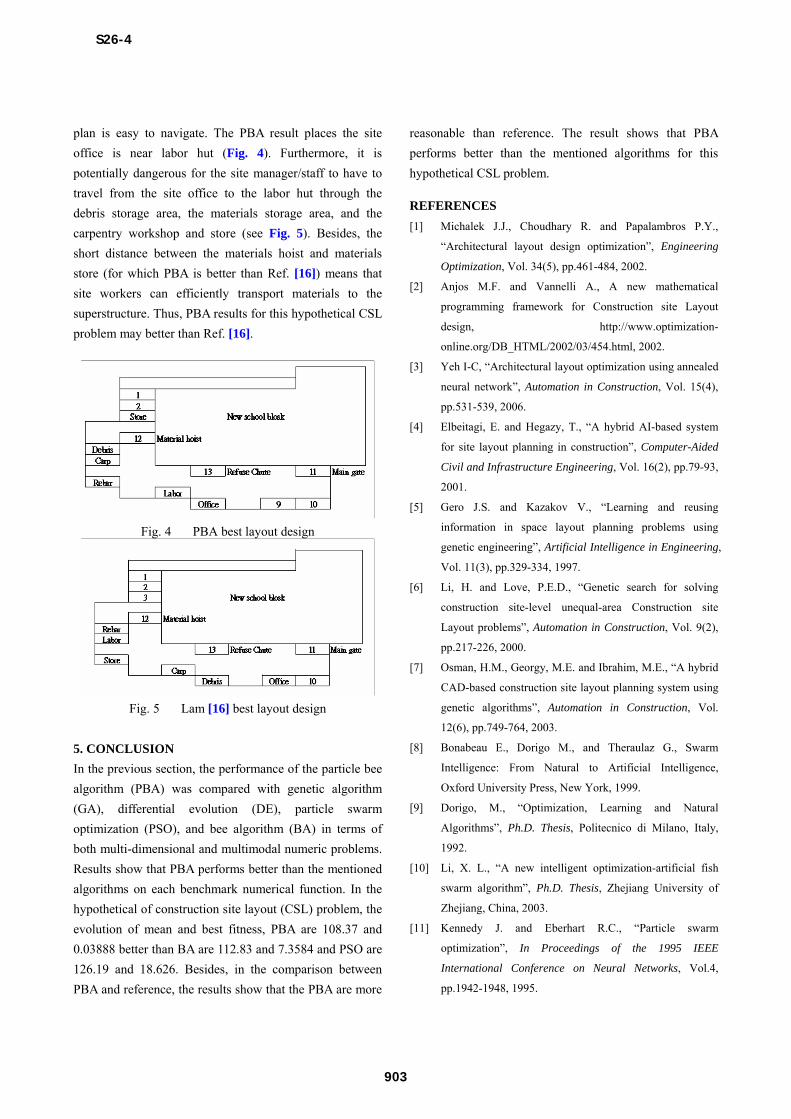
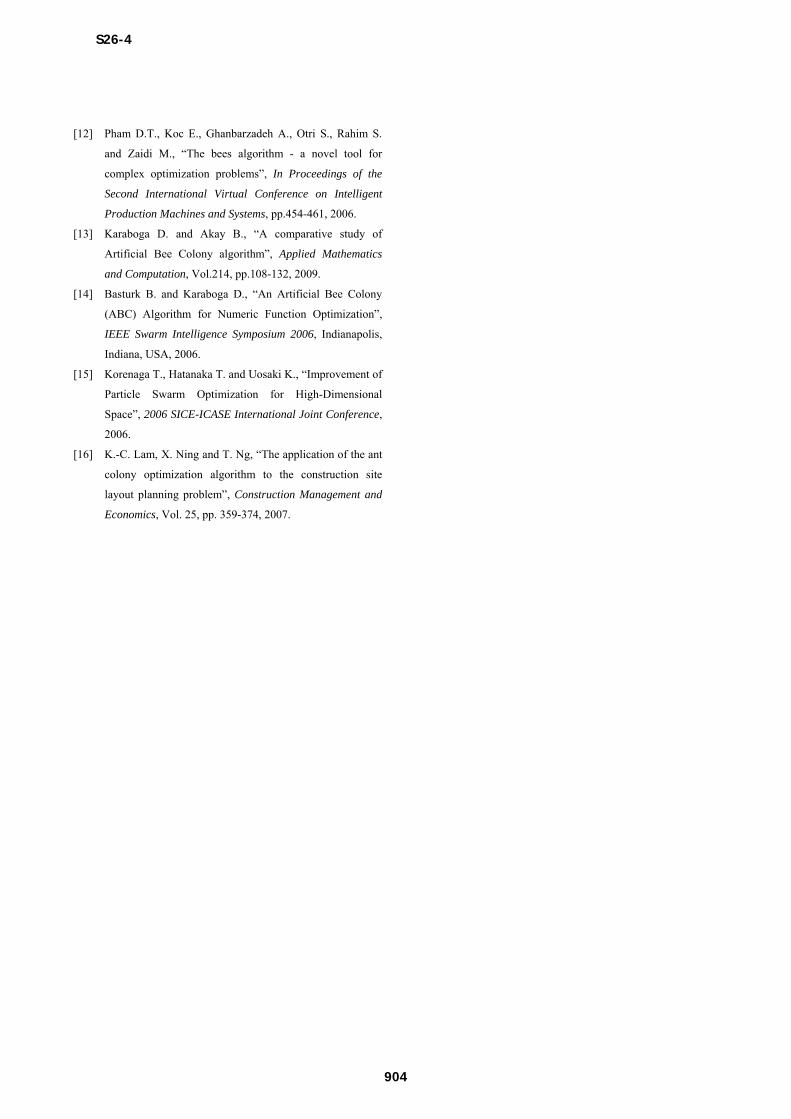
plan is easy to navigate. The PBA result places the site
office is near labor hut (Fig. 4). Furthermore, it is
potentially dangerous for the site manager/staff to have to
travel from the site office to the labor hut through the
debris storage area, the materials storage area, and the
carpentry workshop and store (see Fig. 5). Besides, the
short distance between the materials hoist and materials
store (for which PBA is better than Ref. [16]) means that
site workers can efficiently transport materials to the
superstructure. Thus, PBA results for this hypothetical CSL
problem may better than Ref. [16].
Fig. 4 PBA best layout design
Fig. 5 Lam [16] best layout design
5. CONCLUSION
In the previous section, the performance of the particle bee
algorithm (PBA) was compared with genetic algorithm
(GA), differential evolution (DE), particle swarm
optimization (PSO), and bee algorithm (BA) in terms of
both multi-dimensional and multimodal numeric problems.
Results show that PBA performs better than the mentioned
algorithms on each benchmark numerical function. In the
hypothetical of construction site layout (CSL) problem, the
evolution of mean and best fitness, PBA are 108.37 and
0.03888 better than BA are 112.83 and 7.3584 and PSO are
126.19 and 18.626. Besides, in the comparison between
PBA and reference, the results show that the PBA are more
reasonable than reference. The result shows that PBA
performs better than the mentioned algorithms for this
hypothetical CSL problem.
REFERENCES
[1] Michalek J.J., Choudhary R. and Papalambros P.Y.,
“Architectural layout design optimization”, Engineering
Optimization, Vol. 34(5), pp.461-484, 2002.
[2] Anjos M.F. and Vannelli A., A new mathematical
programming framework for Construction site Layout
design, http://www.optimization-
online.org/DB_HTML/2002/03/454.html, 2002.
[3] Yeh I-C, “Architectural layout optimization using annealed
neural network”, Automation in Construction, Vol. 15(4),
pp.531-539, 2006.
[4] Elbeitagi, E. and Hegazy, T., “A hybrid AI-based system
for site layout planning in construction”, Computer-Aided
Civil and Infrastructure Engineering, Vol. 16(2), pp.79-93,
2001.
[5] Gero J.S. and Kazakov V., “Learning and reusing
information in space layout planning problems using
genetic engineering”, Artificial Intelligence in Engineering,
Vol. 11(3), pp.329-334, 1997.
[6] Li, H. and Love, P.E.D., “Genetic search for solving
construction site-level unequal-area Construction site
Layout problems”, Automation in Construction, Vol. 9(2),
pp.217-226, 2000.
[7] Osman, H.M., Georgy, M.E. and Ibrahim, M.E., “A hybrid
CAD-based construction site layout planning system using
genetic algorithms”, Automation in Construction, Vol.
12(6), pp.749-764, 2003.
[8] Bonabeau E., Dorigo M., and Theraulaz G., Swarm
Intelligence: From Natural to Artificial Intelligence,
Oxford University Press, New York, 1999.
[9] Dorigo, M., “Optimization, Learning and Natural
Algorithms”, Ph.D. Thesis, Politecnico di Milano, Italy,
1992.
[10] Li, X. L., “A new intelligent optimization-artificial fish
swarm algorithm”, Ph.D. Thesis, Zhejiang University of
Zhejiang, China, 2003.
[11] Kennedy J. and Eberhart R.C., “Particle swarm
optimization”, In Proceedings of the 1995 IEEE
International Conference on Neural Networks, Vol.4,
pp.1942-1948, 1995.
S26-4
903
[12] Pham D.T., Koc E., Ghanbarzadeh A., Otri S., Rahim S.
and Zaidi M., “The bees algorithm - a novel tool for
complex optimization problems”, In Proceedings of the
Second International Virtual Conference on Intelligent
Production Machines and Systems, pp.454-461, 2006.
[13] Karaboga D. and Akay B., “A comparative study of
Artificial Bee Colony algorithm”, Applied Mathematics
and Computation, Vol.214, pp.108-132, 2009.
[14] Basturk B. and Karaboga D., “An Artificial Bee Colony
(ABC) Algorithm for Numeric Function Optimization”,
IEEE Swarm Intelligence Symposium 2006, Indianapolis,
Indiana, USA, 2006.
[15] Korenaga T., Hatanaka T. and Uosaki K., “Improvement of
Particle Swarm Optimization for High-Dimensional
Space”, 2006 SICE-ICASE International Joint Conference,
2006.
[16] K.-C. Lam, X. Ning and T. Ng, “The application of the ant
colony optimization algorithm to the construction site
layout planning problem”, Construction Management and
Economics, Vol. 25, pp. 359-374, 2007.
S26-4
904