Embed Size (px)
Citation preview
Information Sciences 179 (2009) 3505–3519
Contents lists available at ScienceDirect
Information Sciences
journal homepage: www.elsevier .com/locate / ins
A hybrid of sequential rules and collaborative filteringfor product recommendation
Duen-Ren Liu *, Chin-Hui Lai, Wang-Jung LeeInstitute of Information Management, National Chiao Tung University, 1001 Ta Hseuh Road, Hsinchu 30050, Taiwan
a r t i c l e i n f o
Article history:Received 27 June 2007Received in revised form 13 May 2009Accepted 5 June 2009
Keywords:Collaborative filteringCustomer segmentationProduct recommendationSequential rule
0020-0255/$ - see front matter � 2009 Elsevier Incdoi:10.1016/j.ins.2009.06.004
* Corresponding author.E-mail address: [email protected] (D.-R. Liu)
a b s t r a c t
Customers’ purchase behavior may vary over time. Traditional collaborative filtering (CF)methods make recommendations to a target customer based on the purchase behaviorof customers whose preferences are similar to those of the target customer; however,the methods do not consider how the customers’ purchase behavior may vary over time.In contrast, the sequential rule-based recommendation method analyzes customers’ pur-chase behavior over time to extract sequential rules in the form: purchase behavior in pre-vious periods) purchase behavior in the current period. If a target customer’s purchasebehavior history is similar to the conditional part of the rule, then his/her purchase behav-ior in the current period is deemed to be the consequent part of the rule. Although thesequential rule method considers the sequence of customers’ purchase behavior over time,it does not utilize the target customer’s purchase data for the current period. To resolve theabove problems, this work proposes a novel hybrid recommendation method that com-bines the segmentation-based sequential rule method with the segmentation-basedKNN-CF method. The proposed method uses customers’ RFM (Recency, Frequency, andMonetary) values to cluster customers into groups with similar RFM values. For each groupof customers, sequential rules are extracted from the purchase sequences of that group tomake recommendations. Meanwhile, the segmentation-based KNN-CF method providesrecommendations based on the target customer’s purchase data for the current period.Then, the results of the two methods are combined to make final recommendations. Exper-iment results show that the hybrid method outperforms traditional CF methods.
� 2009 Elsevier Inc. All rights reserved.
1. Introduction
Customer Relationship Management (CRM) has become a crucial strategy in today’s highly competitive business environ-ment. The core ideas of CRM activities involve (1) understanding customer profitability, and (2) retaining profitable customers[15]. Many companies try to evaluate customers’ information as part of their management activities and develop strategies toretain profitable customers [7,14,21,32,41]. Thus, managers not only have to apply CRM, but must also allocate resources stra-tegically in order to maintain good relationships with customers and enhance their companies’ competitiveness.
Market segmentation, which groups customers with similar needs and purchase behavior together [12], is critical to thesuccessful management of customer relationships and the development of suitable marketing strategies. Companies canbenefit significantly by analyzing the segmentation of customers in order to determine each group’s preferences and therebyimprove marketing decision support. In other words, based on the analysis results, companies can provide appropriate prod-ucts, services, and resources to build and maintain relationships with target customers.
. All rights reserved.
.
3506 D.-R. Liu et al. / Information Sciences 179 (2009) 3505–3519
Recommender systems are a specific type of information filtering technology that allows a company to filter unnecessaryinformation, and then proactively recommend products to its customers based on their interests. Supporting product recom-mendation services can strengthen the relationship between the buyer and seller, and thus increase profits [45]. Recom-mender systems have been applied in many application domains, such as movies [31], books [29], web pages [20],products [34,38], and music [36]. Schafer et al. [35] presented a detailed taxonomy of recommender systems in E-commerce,and elucidated how they can be used to provide personalized service in order to establish and strengthen customer loyalty. Anumber of methods have been proposed for use in recommender systems; for example, collaborative filtering (CF), content-based filtering (CBF), and hybrid approaches. Collaborative filtering, the most widely used method, predicts a target cus-tomer’s preferences based on the opinions of customers with similar tastes. A typical CF method employs the K-nearestneighbors (KNN) approach to derive Top-N recommendations [34]. For example, the Siteseer system [33] uses a KNN-basedCF method to provide Web page recommendations, while the GroupLens system [23] uses CF to recommend Usenet Newsand movies. However, one limitation of traditional CF methods is that they do not consider the sequence of a customer’s pur-chases, which can identify the customer’s preferences over time. Although CF methods may use all the purchase data aboutcustomers’ preferences to make recommendations, most of them neglect the effect of the time factor. Some CF methods usethe target customer’s purchase data for the latest period, T, to make recommendations, but they too neglect his/her purchasehistory prior to period T.
To overcome the limitations of traditional CF methods, Cho et al. [10] proposed a sequential rule-based recommendationmethod that considers the evolution of customers’ purchase sequences. The method applies sequential rules to keep track ofcustomers’ preferences during l periods, with T as the current (latest) period. A sequential rule is expressed in the formCT�l+1, . . . ,CT�1) CT, where CT represents the customers’ purchase behavior in period T. If a target customer’s purchase behav-ior prior to period T was similar to the conditional part of the rule, then it is predicted that his/her purchase behavior in per-iod T will be CT. Accordingly, CT is used to recommend products to the target customer in T.
Although the sequential rule method considers customers’ purchase sequences over time to improve the quality of rec-ommendations, it does not make use of the target customer’s purchase data for period T. A target customer may have madepurchases in period T already, i.e., the latest purchase behavior represents the customer’s current purchase preferences;hence, the purchase data could be used to improve the quality of recommendations. Note that the sequential rule methoddoes not consider customer segmentation profiles either. However, this information could be used to make suggestionsbased on the preferences of different customer groups, which would further improve the quality of recommendations.
To take advantage of the merits of typical CF and sequential rule-based recommendation methods, we propose a novel hy-brid recommendation approach that combines the segmentation-based sequential rule (SSR) method with the segmentation-based KNN-CF (SKCF) method. The hybrid approach considers customer segmentation information, sequential rules over time,and the target customer’s purchase data for period T in order to improve the quality of product recommendations. The SSRmethod attempts to improve sequential rule-based recommendations by making suggestions based on the purchase historyof customer groups. After grouping customers into distinct customer segments according to their purchase information, themethod detects sequential rules over time, and then recommends products to target customers in period T. We also use theSKCF method to make recommendations in period T based on customers’ purchase data. As mentioned earlier, the SSR methodignores purchases made by the target customer in period T, while the SKCF method does not consider the sequence of custom-ers’ purchases over time. Thus, we propose a hybrid method, a linear combination of the SSR and SKCF methods, to resolvethese problems and predict which products the target customer will buy in period T. In other words, to enhance the qualityof recommendations, the hybrid method considers customers’ purchase sequences over time as well as their purchase data forperiod T. In this way, our hybrid method solves the important recommender system issues mentioned above, and improvesthe performance of product recommendation. The major contribution of the proposed method is that it considers how thetime factor may affect customers’ preferences, and thereby resolves the limitations of typical CF and SR methods.
We conducted experiments to evaluate the recommendation quality of the proposed hybrid method compared to that ofthe SSR, SKCF, and KNN-based CF methods. The experiment results demonstrate that the hybrid approach outperforms theother methods.
The remainder of this paper is organized as follows. In Section 2, we review the literature on customer segmentation, RFMevaluation, clustering, and recommender systems. The proposed hybrid method is described in Section 3. In Section 4, wedetail and analyze our experiment results. Then, in Section 5, we present our conclusions and discuss future researchavenues.
2. Literature review
In this section, we review related works on customer segmentation and RFM evaluation, clustering techniques, associa-tion rules for product recommendation, and recommender systems.
2.1. Customer segmentation and RFM evaluation
Customer segmentation divides a market into discrete customer groups that share similar characteristics, such as age,gender, interests, or spending habits. Companies are able to develop appropriate marketing strategies based on the
D.-R. Liu et al. / Information Sciences 179 (2009) 3505–3519 3507
segmentation information about various customer groups. Traditional segmentation methods organize customers by somekey variables, such as demographic, psychographic, and behavioral variables, while value-based segmentation methodsidentify groups of customers by the amount of revenue they generate and the customers’ lifetime value. The customer life-time value (CLV) metric is typically used to identify profitable customers and develop strategies to target potential custom-ers [18,27].
The Recency–Frequency–Monetary (RFM) variable is one of the most important metrics for determining a customer’slifetime value. The components of RFM [5] are defined as follows. (1) R (Recency): the period since the last purchase; a lowervalue corresponds to a higher probability that the customer will make repeat purchases. (2) F (Frequency): the numberof purchases made during a certain period; a higher frequency indicates stronger customer loyalty. (3) M (Monetary):the amount of money spent during a certain period; if a customer has a higher monetary value, the company should focusmore resources on retaining that customer. Customers are segmented into various target markets according to their RFMvalues.
2.2. Clustering
Clustering, a technique widely used for the statistical analysis of data, is one of the important unsupervised learningmethods. To identify interesting data distributions and patterns, clustering techniques classify physical or abstract objectsinto classes such that the objects in each class share some common attribute. Depending on the characteristics of the distinctclusters, companies can make independent decisions about each cluster. Clustering is used in many application domains,such as biology [16], market research [17,26], social network analysis [11], image segmentation [37], and data mining.
The clustering techniques used to segment markets [8,30] try to maximize the variance between groups, while minimiz-ing the variance within groups. Many clustering algorithms have been developed for this purpose; for example, the K-means,SOM, hierarchical, and fuzzy c-means algorithms. To segment customers in this study, we use the K-means algorithm [28]and the SOM algorithm [22], which are described in the next two subsections.
2.2.1. K-meansThe K-means algorithm, proposed by MacQueen [28], is one of the simplest unsupervised clustering methods. The algo-
rithm starts by creating singleton clusters around k randomly sampled points, and then assigns each point to the cluster withthe closest centroid. It continues to re-assign points and shift centroids until the centroids no longer move. K-means parti-tions n samples into k clusters by minimizing the sum of the squared distances of the cluster centers. The algorithm is widelyused because of its ability to process large amounts of data rapidly; however, it has certain limitations in terms of initializingthe mean and determining the value of k.
2.2.2. Self-organizing map (SOM)The self-organizing map (SOM) [22] is an unsupervised neural network model [13] comprised of two layers: an input
layer and an output layer. Points in the two layers are fully connected to each other, and each input node contributes aweight to each output node. Input nodes are clustered such that samples in the same output node are similar. A set of pro-totype vectors is created to represent the data set, and a topology preserving projection of the prototypes from the d-dimen-sional input space onto a low-dimensional grid is performed [19,42]. Since the SOM method is more suitable for processinghigh-dimensional data, we apply SOM clustering to group transaction data efficiently. A transaction is regarded as high-dimensional data because it covers a number of products bought by a customer.
2.3. Association rule mining
Association rule mining [1,6,24,39,44] is a widely used data mining technique that generates recommendations in recom-mender systems. More specifically, the method tries to discover the relationships between product items based on patternsof co-occurrence across customer transactions [43], i.e., find an association between two sets of products in a transactiondatabase.
Agrawal et al. [1] formalized the problem of finding association rules that satisfy minimum support and minimum con-fidence requirements. Let I be a set of product items, and let D be a set of transactions, each of which includes a number ofproducts that are purchased together. An association rule is an implication of the form X) Y, where X � I, Y � I, andX \ Y = U. X is the antecedent (body) and Y is the consequent (head) of the following rule. Two measures, namely supportand confidence, are used to indicate the quality of an association rule. The support of a rule is the percentage of transactionsthat contain both X and Y, while the confidence is the fraction of transactions containing X that also contain Y.
The support of an association rule indicates how frequently that rule applies to the data. A higher level of support for arule corresponds to a stronger correlation between the product items. Confidence, on the other hand, is a measure ofthe reliability of the rule. Thus, the higher the confidence of a rule, the more significant the correlation between the prod-uct items will be. The Apriori algorithm [1,39] is typically used to find association rules by identifying frequent itemsets(sets of product items). An itemset is considered frequent if its support exceeds a user-specified minimum support thresh-old. Association rules that satisfy a user-specified minimum confidence threshold can be generated from the frequentitemsets.
3508 D.-R. Liu et al. / Information Sciences 179 (2009) 3505–3519
2.4. Typical KNN-based collaborative filtering
A typical KNN-based collaborative filtering (CF) method [31,34,36] employs the nearest-neighbor algorithm to recom-mend products to a target customer u based on the preferences of the neighbors of u; that is, customers with similar pref-erences to u. Note that preferences are generally defined in terms of the customer’s purchase behavior. Preferences arederived by binary choice (purchased/not-purchased) analysis of shopping basket data, or tastes with a preference rating(e.g., on a rating scale of 1–5) for items. In this work, we focus on product recommendations derived from retail transactiondata based on binary choice analysis of shopping basket data.
The typical KNN-based CF method is implemented as follows. Customers’ preferences, i.e., customers’ purchase histories,are represented as a customer-item matrix R in which rij is equal to 1 if the ith customer purchased the jth product; other-wise, it is equal to 0. The similarity of customer preferences can be measured in various ways [2]. A common method com-putes Pearson’s correlation coefficient, which is defined as follows:
corrPðci; cjÞ ¼P
s2Iðrci ;s � �rciÞðrcj ;s � �rcj
ÞffiffiffiffiffiffiffiffiffiffiffiffiffiffiffiffiffiffiffiffiffiffiffiffiffiffiffiffiffiffiffiffiffiffiffiffiffiffiffiffiffiffiffiffiffiffiffiffiffiffiffiffiffiffiffiffiffiffiffiffiffiffiffiffiffiffiPs2Iðrci ;s � �rci
Þ2P
s2Iðrcj ;s � �rcjÞ2
q ; ð1Þ
where �rciand �rcj
denote the average number of products purchased by customers ci and cj respectively; I denotes the set ofproducts; and rci,s and rcj,s indicate whether customers ci and cj purchased product item s.
Customers are ranked by their similarity measures in relation to the target customer u, as determined by Pearson’s cor-relation coefficient, and the k most similar (highest ranked) customers are selected as the k-nearest neighbors of customer u.Then, the Top-N recommended products are determined according to the preferences of the k-nearest neighbors as follows.The frequency count of products is calculated by scanning the purchase data of the k-nearest neighbors, after which theproducts are sorted based on the frequency count. Finally, the N most frequent products not yet purchased by the target cus-tomer u are selected as the Top-N recommendations.
2.5. Sequential rule-based recommendation
The sequential rule method [10], which considers the evolution of customers’ purchase sequences in order to improve thequality of traditional CF, involves two phases: a model building phase and a recommendation phase.
2.5.1. Model building phaseThis phase is comprised of three steps: transaction clustering, identification of cluster sequences, and extraction of
sequential cluster rules. The SOM technique is used to group transactions with similar patterns. The result of transactionclustering is a set of q transaction clusters C = {C1,C2, . . . ,Cq}, where each Cj is a subset of transactions. Each customer’s trans-actions over l periods are then transformed into a sequence of transaction clusters. Let Li be the behavior locus of customer i.This represents the sequence of clusters of customer i over l periods, and is defined as follows: Li = hCi,T�l�1, . . . ,Ci,T�l,Ci,Ti,i = 1,2, . . . ,m, where Ci,T�k 2 C, k = 1,2, . . . , l � 1,l = 2.
Finally, sequential purchase patterns are extracted from the behavior loci of customers by time-based association rulemining. The conditional part of the sequential rule is hrj,T�l+1, . . . ,rj,T�1i, and the consequent part is rj,T. The form of a sequen-tial rule Rj is Rj: rj,T�l+1, . . . ,rj,T�1) rj,T (Supportj, Confidencej), where ri,T�k 2 C or /, and rj,T 2 C. Here, Rj means that if the locusof a customer is rj,T�l+1, . . . ,rj,T�1, then that customer’s behavior cluster in period T will be rj,T.
2.5.2. Recommendation phaseThe recommendation phase is comprised of two steps: cluster sequence matching and recommending Top-N products.
The best-matching locus of a target customer is determined by comparing the cluster locus and the sequential rules derivedfrom purchase sequences. The similarity measure is necessary to determine the degree of match between the behavior locusof a target customer and the conditional part of the sequential rule. Let LC
i ¼ hCi;T�lþ1; . . . ;Ci;T�1i be the behavior locus of targetcustomer i during l � 1 periods, and let RC
j ¼ hrj;T�lþ1; . . . ; rj;T�1i be the conditional part of sequential rule j. The similarity be-tween LC
i and RCj is defined as follows:
SMji ¼
Xl�1
k¼1
Sji;T�k; where Sj
i;T�k ¼1; if Ci;T�k ¼ rj;T�k
0; otherwise:
�ð2Þ
Next, the similarity measure is multiplied by the support and confidence of the rule to derive the fitness measure, whichindicates the goodness-of-fit between the behavior locus of customer i and the sequential rule j. The transaction clusterof the target customer in period T is determined by the consequential part, rj,T, of the sequential rule j that has the maximumfitness measure.
Let C* denote the predicted transaction cluster of a target customer in period T in the first step. Then, the Top-N products,i.e., the products listed in the customer transactions of C*, are selected to generate a recommendation list for the targetcustomer.
D.-R. Liu et al. / Information Sciences 179 (2009) 3505–3519 3509
3. The hybrid recommendation method
In this section, we describe the proposed hybrid method, which combines the segmentation-based sequential rule (SSR)method and the collaborative filtering (CF) method. Section 3.1 provides an overview of the hybrid approach. Sections 3.2and 3.3 describe the SSR method and the SKCF method respectively, and Section 3.4 describes the hybrid method in detail.
3.1. Overview of the hybrid approach
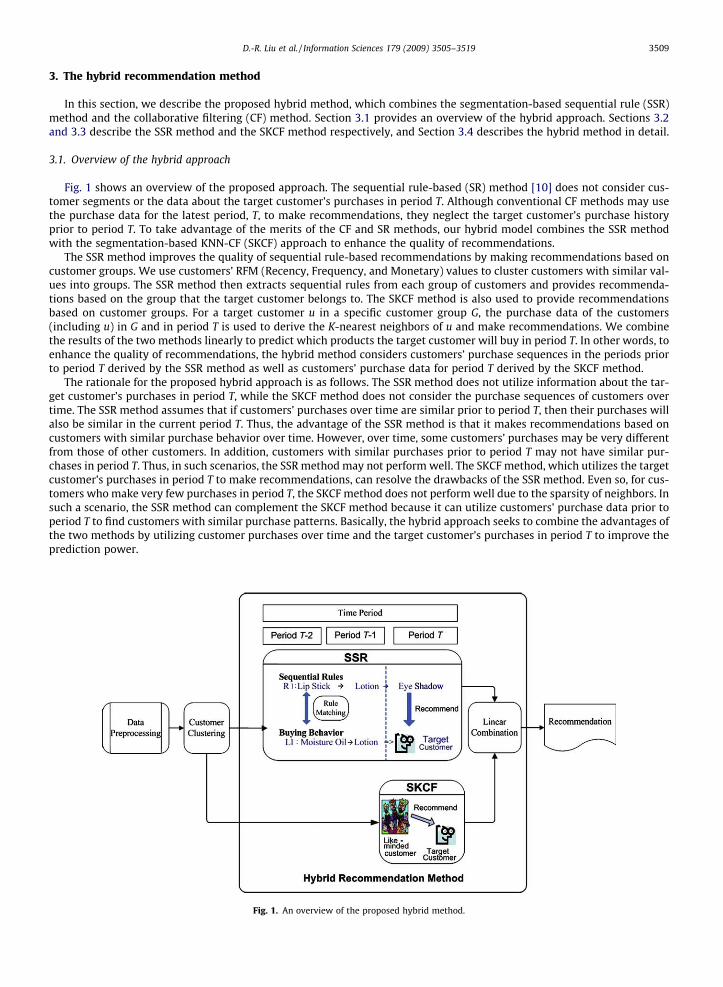
Fig. 1 shows an overview of the proposed approach. The sequential rule-based (SR) method [10] does not consider cus-tomer segments or the data about the target customer’s purchases in period T. Although conventional CF methods may usethe purchase data for the latest period, T, to make recommendations, they neglect the target customer’s purchase historyprior to period T. To take advantage of the merits of the CF and SR methods, our hybrid model combines the SSR methodwith the segmentation-based KNN-CF (SKCF) approach to enhance the quality of recommendations.
The SSR method improves the quality of sequential rule-based recommendations by making recommendations based oncustomer groups. We use customers’ RFM (Recency, Frequency, and Monetary) values to cluster customers with similar val-ues into groups. The SSR method then extracts sequential rules from each group of customers and provides recommenda-tions based on the group that the target customer belongs to. The SKCF method is also used to provide recommendationsbased on customer groups. For a target customer u in a specific customer group G, the purchase data of the customers(including u) in G and in period T is used to derive the K-nearest neighbors of u and make recommendations. We combinethe results of the two methods linearly to predict which products the target customer will buy in period T. In other words, toenhance the quality of recommendations, the hybrid method considers customers’ purchase sequences in the periods priorto period T derived by the SSR method as well as customers’ purchase data for period T derived by the SKCF method.
The rationale for the proposed hybrid approach is as follows. The SSR method does not utilize information about the tar-get customer’s purchases in period T, while the SKCF method does not consider the purchase sequences of customers overtime. The SSR method assumes that if customers’ purchases over time are similar prior to period T, then their purchases willalso be similar in the current period T. Thus, the advantage of the SSR method is that it makes recommendations based oncustomers with similar purchase behavior over time. However, over time, some customers’ purchases may be very differentfrom those of other customers. In addition, customers with similar purchases prior to period T may not have similar pur-chases in period T. Thus, in such scenarios, the SSR method may not perform well. The SKCF method, which utilizes the targetcustomer’s purchases in period T to make recommendations, can resolve the drawbacks of the SSR method. Even so, for cus-tomers who make very few purchases in period T, the SKCF method does not perform well due to the sparsity of neighbors. Insuch a scenario, the SSR method can complement the SKCF method because it can utilize customers’ purchase data prior toperiod T to find customers with similar purchase patterns. Basically, the hybrid approach seeks to combine the advantages ofthe two methods by utilizing customer purchases over time and the target customer’s purchases in period T to improve theprediction power.
Fig. 1. An overview of the proposed hybrid method.
3510 D.-R. Liu et al. / Information Sciences 179 (2009) 3505–3519
Generally, customers’ buying behavior is quite diverse. The rationale for customer segmentation-based on RFM is that ifcustomers have exhibited similar buying behavior or made similar purchases in the past, they are very likely to have similarRFM values. However, customers’ RFM values could be similar even if they purchase different products. We use two mech-anisms to identify customers with similar purchase patterns and make recommendations. Customer segmentation is used toidentify customer groups with a coarse-grained level of similar buying behavior; while the sequential rule or K-NN based CFmethod is employed to identify a fine-grained level of similar purchases in each customer segment. As a result, the recom-mendation quality can be improved. From a business perspective, companies can analyze the purchase behavior of differentcustomer segments, and then recommend appropriate products and services to retain profitable customers or target poten-tial customers.
3.2. The segmentation-based sequential rule (SSR) method
The segmentation-based sequential rule (SSR) method improves the quality of the sequential rule-based (SR) method [10]by making recommendations based on customer groups. The method is comprised of two parts: a model building phase,which creates a model of sequential rules; and a recommendation phase, which selects products for recommendation to tar-get customers.
The model building phase involves three steps: customer clustering, transaction clustering, and mining customer behav-ior. For customer clustering, the K-means method is used to cluster customers into distinct groups based on their RFM values(discussed in Section 2.1). Each group represents a specific market segment, and the customers in each group have similarRFM values. The recommendation phase consists of two phases: similarity computing and recommendation of Top-N prod-ucts. We use similarity measures to compare the purchase sequences of the target customer with the sequential rules toidentify the most similar sequential rule. Products listed in the predicted transaction cluster of the consequent part of theselected sequential rule are the candidates for recommendation. Finally, the products with the Top-N frequency count inthe predicted transaction cluster are recommended to the target customer.
3.2.1. Customer clusteringCustomer clustering generates customer groups based on customers’ RFM values, which are used to measure a customer’s
lifetime value [27]. The RFM values derived from the transaction data identify the purchasing behavior of customers. Therationale behind customer segmentation is that if customers exhibited similar purchasing behavior or made similar pur-chases in previous periods, they are very likely to have similar RFM values in the present period.
In customer clustering, the RFM values of each customer are extracted and normalized, after which customer groups arederived by the K-means clustering method based on the normalized RFM values. The RFM patterns of each cluster are iden-tified by assigning " or ; according to whether the average R(F,M) value of a cluster is larger than or smaller than the overallaverage R(F,M) value. Because each R(F,M) value has two possible results, customers are divided into eight (2 � 2 � 2) groupsbased on their RFM values. Finally, clusters with the same RFM patterns are combined into one cluster, which is defined asone customer segment.
Table 1 shows the results of customer clustering. The first column shows eight customer clusters (segments), while thesecond column indicates the number of customers in each cluster. We compare the R(F,M) value of each cluster with theaverage R(F,M) value set in the last row. If a segment’s R(F,M) value is higher than the overall average R(F,M) value, an up-ward arrow " is assigned to it; otherwise, a downward arrow ; is assigned. The RFM pattern of each cluster is shown in thelast column.
From the cluster’s RFM patterns in the last column of Table 1, we can identify four major RFM patterns: R;F"M", R"F;M;,R;F;M;, and R"F"M". Clusters with the same pattern are combined into one cluster. For example, Clusters 3, 4 and 5 in thetable have the same pattern, i.e., R;F"M", so they are combined. Clusters 2, 7 and 8 can also be merged. Therefore, eight cus-tomer clusters can be reduced to four clusters based on their RFM patterns.
Based on the four major RFM patterns, Table 2 shows the number of customers in different customer segments, their RFMpatterns, and four customer segments, i.e., loyal, potential, uncertain, and valueless. Customers with the R;F"M" pattern areconsidered loyal because they purchase products frequently and have done so recently. The R"F"M" pattern represents those
Table 1The clusters generated by K-means clustering based on the normalized RFM values.
Number of customers R (Recency) F (Frequency) M (Monetary) Patterns
Cluster1 104 72.260 19.587 40797.23 R" F" M"Cluster2 43 119.558 3.791 7342.326 R" F; M;Cluster3 17 64.294 67.2351 147315.6 R; F" M"Cluster4 214 56.696 19.832 40279.53 R; F" M"Cluster5 78 57.192 37.846 74045.92 R; F" M"Cluster6 367 58.335 9.632 18677.27 R; F; M;Cluster7 126 92.246 7.286 14853.89 R" F; M;Cluster8 240 73.892 8.496 16109.99 R" F; M;Average 68.216 14.324 28638.3
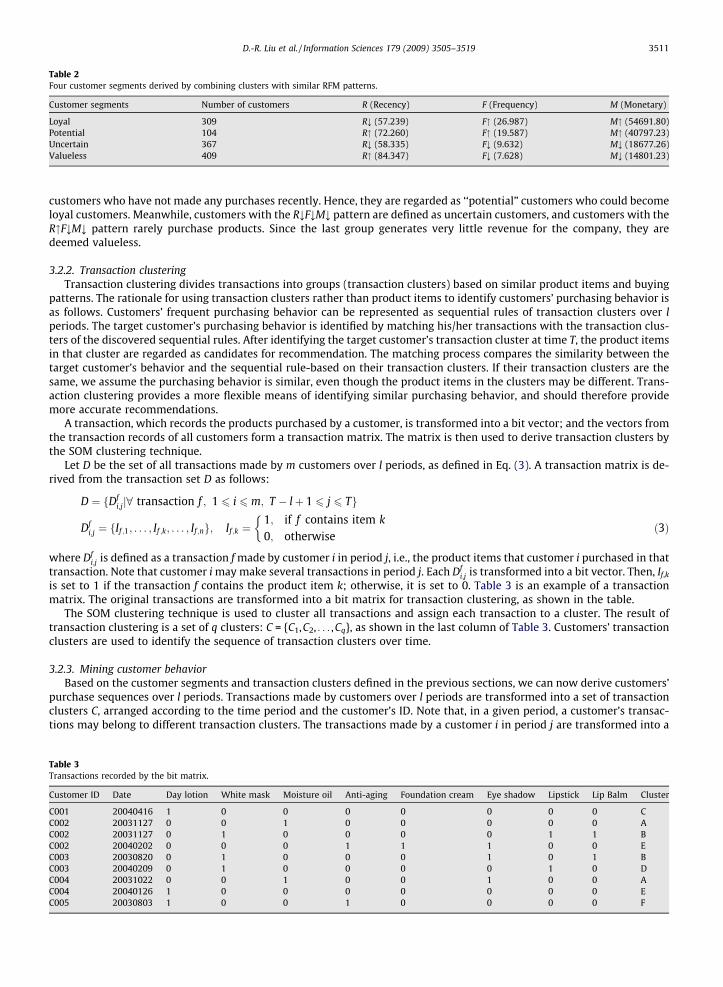
Table 2Four customer segments derived by combining clusters with similar RFM patterns.
Customer segments Number of customers R (Recency) F (Frequency) M (Monetary)
Loyal 309 R; (57.239) F" (26.987) M" (54691.80)Potential 104 R" (72.260) F" (19.587) M" (40797.23)Uncertain 367 R; (58.335) F; (9.632) M; (18677.26)Valueless 409 R" (84.347) F; (7.628) M; (14801.23)
D.-R. Liu et al. / Information Sciences 179 (2009) 3505–3519 3511
customers who have not made any purchases recently. Hence, they are regarded as ‘‘potential” customers who could becomeloyal customers. Meanwhile, customers with the R;F;M; pattern are defined as uncertain customers, and customers with theR"F;M; pattern rarely purchase products. Since the last group generates very little revenue for the company, they aredeemed valueless.
3.2.2. Transaction clusteringTransaction clustering divides transactions into groups (transaction clusters) based on similar product items and buying
patterns. The rationale for using transaction clusters rather than product items to identify customers’ purchasing behavior isas follows. Customers’ frequent purchasing behavior can be represented as sequential rules of transaction clusters over lperiods. The target customer’s purchasing behavior is identified by matching his/her transactions with the transaction clus-ters of the discovered sequential rules. After identifying the target customer’s transaction cluster at time T, the product itemsin that cluster are regarded as candidates for recommendation. The matching process compares the similarity between thetarget customer’s behavior and the sequential rule-based on their transaction clusters. If their transaction clusters are thesame, we assume the purchasing behavior is similar, even though the product items in the clusters may be different. Trans-action clustering provides a more flexible means of identifying similar purchasing behavior, and should therefore providemore accurate recommendations.
A transaction, which records the products purchased by a customer, is transformed into a bit vector; and the vectors fromthe transaction records of all customers form a transaction matrix. The matrix is then used to derive transaction clusters bythe SOM clustering technique.
Let D be the set of all transactions made by m customers over l periods, as defined in Eq. (3). A transaction matrix is de-rived from the transaction set D as follows:
Table 3Transac
Custom
C001C002C002C002C003C003C004C004C005
D ¼ fDfi;jj8 transaction f ; 1 6 i 6 m; T � lþ 1 6 j 6 Tg
Dfi;j ¼ fIf ;1; . . . ; If ;k; . . . ; If ;ng; If ;k ¼
1; if f contains item k0; otherwise
�ð3Þ
where Dfi;j is defined as a transaction f made by customer i in period j, i.e., the product items that customer i purchased in that
transaction. Note that customer i may make several transactions in period j. Each Dfi;j is transformed into a bit vector. Then, If,k
is set to 1 if the transaction f contains the product item k; otherwise, it is set to 0. Table 3 is an example of a transactionmatrix. The original transactions are transformed into a bit matrix for transaction clustering, as shown in the table.
The SOM clustering technique is used to cluster all transactions and assign each transaction to a cluster. The result oftransaction clustering is a set of q clusters: C = {C1,C2, . . . ,Cq}, as shown in the last column of Table 3. Customers’ transactionclusters are used to identify the sequence of transaction clusters over time.
3.2.3. Mining customer behaviorBased on the customer segments and transaction clusters defined in the previous sections, we can now derive customers’
purchase sequences over l periods. Transactions made by customers over l periods are transformed into a set of transactionclusters C, arranged according to the time period and the customer’s ID. Note that, in a given period, a customer’s transac-tions may belong to different transaction clusters. The transactions made by a customer i in period j are transformed into a
tions recorded by the bit matrix.
er ID Date Day lotion White mask Moisture oil Anti-aging Foundation cream Eye shadow Lipstick Lip Balm Cluster
20040416 1 0 0 0 0 0 0 0 C20031127 0 0 1 0 0 0 0 0 A20031127 0 1 0 0 0 0 1 1 B20040202 0 0 0 1 1 1 0 0 E20030820 0 1 0 0 0 1 0 1 B20040209 0 1 0 0 0 0 1 0 D20031022 0 0 1 0 0 1 0 0 A20040126 1 0 0 0 0 0 0 0 E20030803 1 0 0 1 0 0 0 0 F
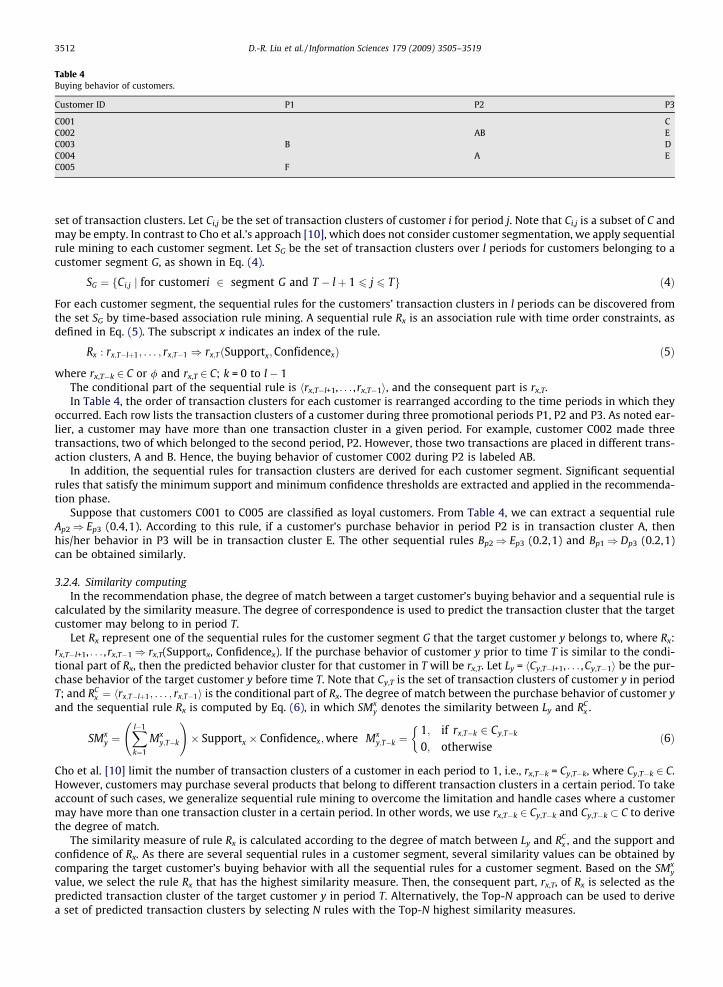
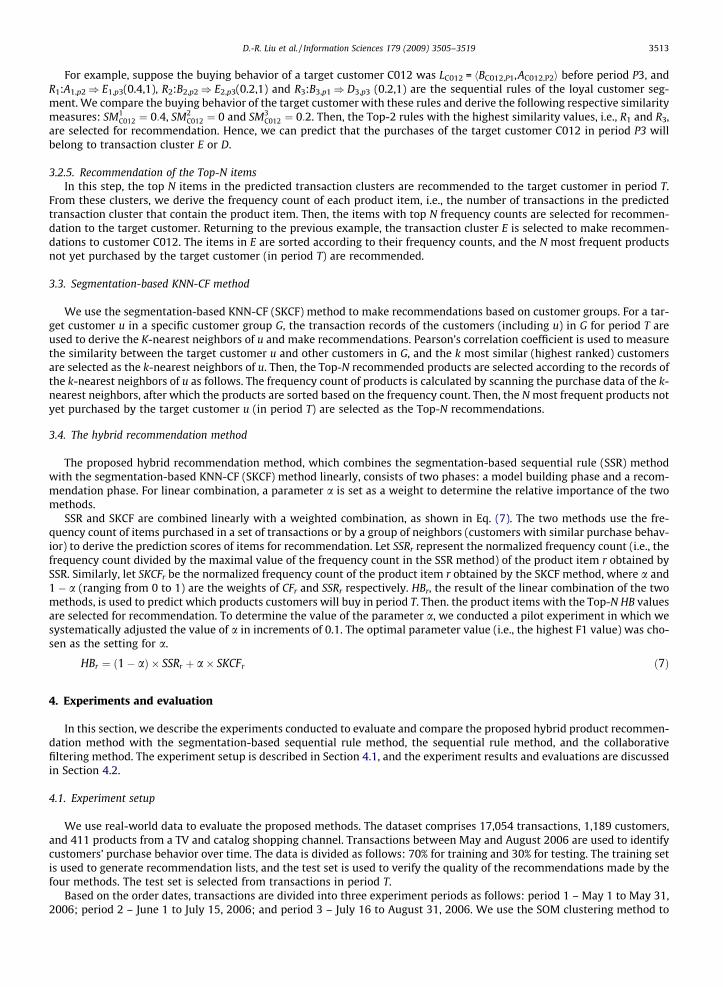
Table 4Buying behavior of customers.
Customer ID P1 P2 P3
C001 CC002 AB EC003 B DC004 A EC005 F
3512 D.-R. Liu et al. / Information Sciences 179 (2009) 3505–3519
set of transaction clusters. Let Ci,j be the set of transaction clusters of customer i for period j. Note that Ci,j is a subset of C andmay be empty. In contrast to Cho et al.’s approach [10], which does not consider customer segmentation, we apply sequentialrule mining to each customer segment. Let SG be the set of transaction clusters over l periods for customers belonging to acustomer segment G, as shown in Eq. (4).
SG ¼ fCi;j j for customeri 2 segment G and T � lþ 1 6 j 6 Tg ð4Þ
For each customer segment, the sequential rules for the customers’ transaction clusters in l periods can be discovered fromthe set SG by time-based association rule mining. A sequential rule Rx is an association rule with time order constraints, asdefined in Eq. (5). The subscript x indicates an index of the rule.
Rx : rx;T�lþ1; . . . ; rx;T�1 ) rx;TðSupportx;ConfidencexÞ ð5Þ
where rx,T�k 2 C or / and rx,T 2 C; k = 0 to l � 1The conditional part of the sequential rule is hrx,T�l+1, . . . ,rx,T�1i, and the consequent part is rx,T.In Table 4, the order of transaction clusters for each customer is rearranged according to the time periods in which they
occurred. Each row lists the transaction clusters of a customer during three promotional periods P1, P2 and P3. As noted ear-lier, a customer may have more than one transaction cluster in a given period. For example, customer C002 made threetransactions, two of which belonged to the second period, P2. However, those two transactions are placed in different trans-action clusters, A and B. Hence, the buying behavior of customer C002 during P2 is labeled AB.
In addition, the sequential rules for transaction clusters are derived for each customer segment. Significant sequentialrules that satisfy the minimum support and minimum confidence thresholds are extracted and applied in the recommenda-tion phase.
Suppose that customers C001 to C005 are classified as loyal customers. From Table 4, we can extract a sequential ruleAp2) Ep3 (0.4,1). According to this rule, if a customer’s purchase behavior in period P2 is in transaction cluster A, thenhis/her behavior in P3 will be in transaction cluster E. The other sequential rules Bp2) Ep3 (0.2,1) and Bp1) Dp3 (0.2,1)can be obtained similarly.
3.2.4. Similarity computingIn the recommendation phase, the degree of match between a target customer’s buying behavior and a sequential rule is
calculated by the similarity measure. The degree of correspondence is used to predict the transaction cluster that the targetcustomer may belong to in period T.
Let Rx represent one of the sequential rules for the customer segment G that the target customer y belongs to, where Rx:rx,T�l+1, . . . ,rx,T�1) rx,T(Supportx, Confidencex). If the purchase behavior of customer y prior to time T is similar to the condi-tional part of Rx, then the predicted behavior cluster for that customer in T will be rx,T. Let Ly = hCy,T�l+1, . . . ,Cy,T�1i be the pur-chase behavior of the target customer y before time T. Note that Cy,T is the set of transaction clusters of customer y in periodT; and RC
x ¼ hrx;T�lþ1; . . . ; rx;T�1i is the conditional part of Rx. The degree of match between the purchase behavior of customer yand the sequential rule Rx is computed by Eq. (6), in which SMx
y denotes the similarity between Ly and RCx .
SMxy ¼
Xl�1
k¼1
Mxy;T�k
!� Supportx � Confidencex;where Mx
y;T�k ¼1; if rx;T�k 2 Cy;T�k
0; otherwise
�ð6Þ
Cho et al. [10] limit the number of transaction clusters of a customer in each period to 1, i.e., rx,T�k = Cy,T�k, where Cy,T�k 2 C.However, customers may purchase several products that belong to different transaction clusters in a certain period. To takeaccount of such cases, we generalize sequential rule mining to overcome the limitation and handle cases where a customermay have more than one transaction cluster in a certain period. In other words, we use rx,T�k 2 Cy,T�k and Cy,T�k � C to derivethe degree of match.
The similarity measure of rule Rx is calculated according to the degree of match between Ly and RCx , and the support and
confidence of Rx. As there are several sequential rules in a customer segment, several similarity values can be obtained bycomparing the target customer’s buying behavior with all the sequential rules for a customer segment. Based on the SMx
y
value, we select the rule Rx that has the highest similarity measure. Then, the consequent part, rx,T, of Rx is selected as thepredicted transaction cluster of the target customer y in period T. Alternatively, the Top-N approach can be used to derivea set of predicted transaction clusters by selecting N rules with the Top-N highest similarity measures.
D.-R. Liu et al. / Information Sciences 179 (2009) 3505–3519 3513
For example, suppose the buying behavior of a target customer C012 was LC012 = hBC012,P1,AC012,P2i before period P3, andR1:A1,p2) E1,p3(0.4,1), R2:B2,p2) E2,p3(0.2,1) and R3:B3,p1) D3,p3 (0.2,1) are the sequential rules of the loyal customer seg-ment. We compare the buying behavior of the target customer with these rules and derive the following respective similaritymeasures: SM1
C012 ¼ 0:4, SM2C012 ¼ 0 and SM3
C012 ¼ 0:2. Then, the Top-2 rules with the highest similarity values, i.e., R1 and R3,are selected for recommendation. Hence, we can predict that the purchases of the target customer C012 in period P3 willbelong to transaction cluster E or D.
3.2.5. Recommendation of the Top-N itemsIn this step, the top N items in the predicted transaction clusters are recommended to the target customer in period T.
From these clusters, we derive the frequency count of each product item, i.e., the number of transactions in the predictedtransaction cluster that contain the product item. Then, the items with top N frequency counts are selected for recommen-dation to the target customer. Returning to the previous example, the transaction cluster E is selected to make recommen-dations to customer C012. The items in E are sorted according to their frequency counts, and the N most frequent productsnot yet purchased by the target customer (in period T) are recommended.
3.3. Segmentation-based KNN-CF method
We use the segmentation-based KNN-CF (SKCF) method to make recommendations based on customer groups. For a tar-get customer u in a specific customer group G, the transaction records of the customers (including u) in G for period T areused to derive the K-nearest neighbors of u and make recommendations. Pearson’s correlation coefficient is used to measurethe similarity between the target customer u and other customers in G, and the k most similar (highest ranked) customersare selected as the k-nearest neighbors of u. Then, the Top-N recommended products are selected according to the records ofthe k-nearest neighbors of u as follows. The frequency count of products is calculated by scanning the purchase data of the k-nearest neighbors, after which the products are sorted based on the frequency count. Then, the N most frequent products notyet purchased by the target customer u (in period T) are selected as the Top-N recommendations.
3.4. The hybrid recommendation method
The proposed hybrid recommendation method, which combines the segmentation-based sequential rule (SSR) methodwith the segmentation-based KNN-CF (SKCF) method linearly, consists of two phases: a model building phase and a recom-mendation phase. For linear combination, a parameter a is set as a weight to determine the relative importance of the twomethods.
SSR and SKCF are combined linearly with a weighted combination, as shown in Eq. (7). The two methods use the fre-quency count of items purchased in a set of transactions or by a group of neighbors (customers with similar purchase behav-ior) to derive the prediction scores of items for recommendation. Let SSRr represent the normalized frequency count (i.e., thefrequency count divided by the maximal value of the frequency count in the SSR method) of the product item r obtained bySSR. Similarly, let SKCFr be the normalized frequency count of the product item r obtained by the SKCF method, where a and1 � a (ranging from 0 to 1) are the weights of CFr and SSRr respectively. HBr, the result of the linear combination of the twomethods, is used to predict which products customers will buy in period T. Then. the product items with the Top-N HB valuesare selected for recommendation. To determine the value of the parameter a, we conducted a pilot experiment in which wesystematically adjusted the value of a in increments of 0.1. The optimal parameter value (i.e., the highest F1 value) was cho-sen as the setting for a.
HBr ¼ ð1� aÞ � SSRr þ a� SKCFr ð7Þ
4. Experiments and evaluation
In this section, we describe the experiments conducted to evaluate and compare the proposed hybrid product recommen-dation method with the segmentation-based sequential rule method, the sequential rule method, and the collaborativefiltering method. The experiment setup is described in Section 4.1, and the experiment results and evaluations are discussedin Section 4.2.
4.1. Experiment setup
We use real-world data to evaluate the proposed methods. The dataset comprises 17,054 transactions, 1,189 customers,and 411 products from a TV and catalog shopping channel. Transactions between May and August 2006 are used to identifycustomers’ purchase behavior over time. The data is divided as follows: 70% for training and 30% for testing. The training setis used to generate recommendation lists, and the test set is used to verify the quality of the recommendations made by thefour methods. The test set is selected from transactions in period T.
Based on the order dates, transactions are divided into three experiment periods as follows: period 1 – May 1 to May 31,2006; period 2 – June 1 to July 15, 2006; and period 3 – July 16 to August 31, 2006. We use the SOM clustering method to
3514 D.-R. Liu et al. / Information Sciences 179 (2009) 3505–3519
cluster all transactions in these periods. The number of SOM clusters required for transaction clustering in the SSR method isdetermined by setting different parameters, such as the learning rate and the grid structure (i.e., 3 � 3, 4 � 4, etc.) and dis-tance normalization. Setting different parameter values yields various numbers of clusters. In our experiments, we try dif-ferent sized neuron grids, namely 3 � 3, 4 � 4, 5 � 5 and 6 � 6. The recommendation quality of the SSR method is betterwhen the learning rate is set at 0.4 and the grid size is 4 � 4. Under this parameter setting, clustering transactions into16 clusters yields a better cluster quality. Thus, we use 16 transaction clusters for the SR, SSR, and hybrid methods in theexperiments.
To compare the proposed hybrid method with the SSR, SKCF and SR methods, we employ the recall and precision metrics,which are widely used in recommender systems to evaluate the quality of recommendations [3,4,25,34]. Product items canbe classified according to whether customers are interested or not interested in purchasing them.
Recall is the fraction of the product items of interest that can be located by a recommendation method, as defined in Eq.(8).
Recall ¼ Number of correctly recommended itemsNumber of interesting items
ð8Þ
Precision is the fraction of recommended product items that are considered interesting, as defined in Eq. (9).
Precision ¼ Number of correctly recommended itemsNumber of recommended items
ð9Þ
Items of interest to a customer u refer to products in the test set that were purchased by u, and correctly recommended itemsare items that match the items of interest. Although these measures are simple to compute and intuitively appealing, theyare in conflict because increasing the size of the recommendation set improves the recall at the expense of reducing the pre-cision [34].
The F1-metric [4,9,34,40], which combines precision and recall, is also widely used to evaluate the quality of recommen-dations. Specifically, this measure balances the trade-off between precision and recall by assigning equal weights to bothmetrics. Therefore, we use the F1-metric in our evaluation, as shown in Eq. (10).
F1 ¼ 2� Recall� PrecisionRecallþ Precision
ð10Þ
4.2. Experiment results
We conducted four experiments to compare the recommendation quality of the SSR, SR, SKCF, and hybrid methods.
4.2.1. Evaluation of the SSR methodThis experiment evaluated the effectiveness of the segmentation-based sequential rule (SSR) method on the four cus-
tomer segments discussed in Section 3.2.1. The method makes recommendations by selecting N rules with the Top-N sim-ilarity measures, as described in Sections 3.2.4 and 3.2.5.
First, we have to determine the number of rules that yield the best performance for the SSR method under different Top-Nproduct recommendations. To do this, we compare the F1 measures under different Top-N product recommendations anddifferent numbers of rules. According to the average F1 values, the quality of recommendations derived by the SSR andSR methods using four sequential rules is better than that of the other methods. Thus, we select four rules to make recom-mendations by the SSR and SR methods in the following experiments.
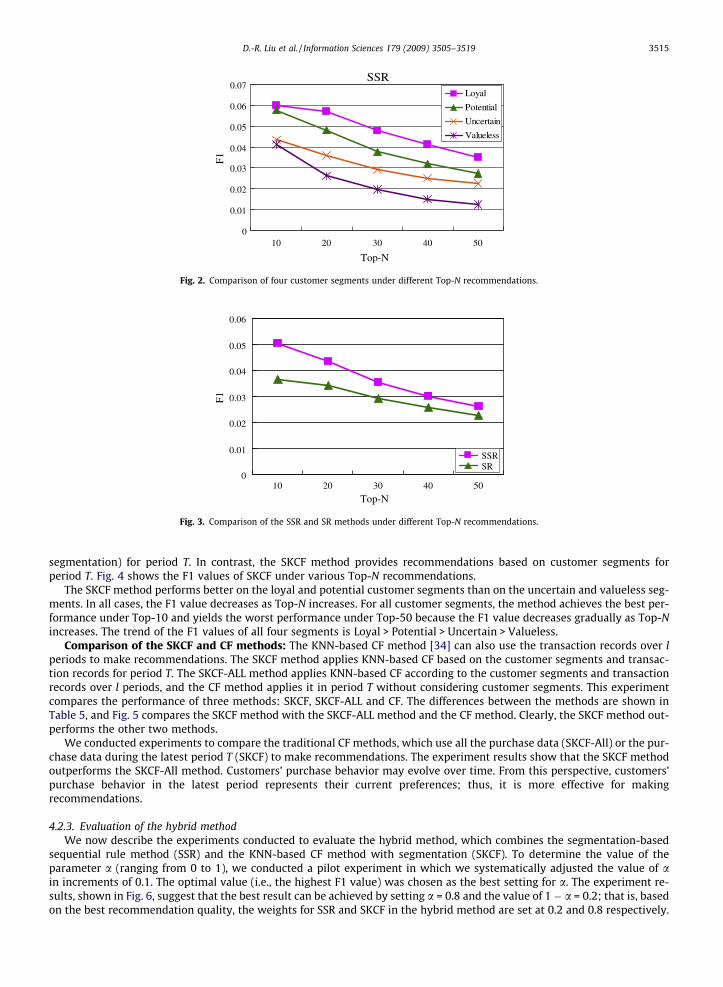
Fig. 2 shows the F1 values of different customer segments under various Top-N recommendations. The quality of recom-mendations for the loyal customer segment is better than for the other segments. The F1 score declines as the number ofTop-N products increases. For each customer segment, the recommendations are the most accurate under Top-10 recom-mendations and the least accurate under Top-50 recommendations. The trend of the average F1 values of the four segmentsis Loyal > Potential > Uncertain > Valueless.
Comparison of the SSR and SR Methods: Next, we compare the performance of the segmentation-based sequential rule(SSR) method and the sequential rule–based (SR) method. Fig. 3 shows the results derived by the two methods under variousTop-N recommendations. The average of the F1 values under different Top-N recommendations is computed for allcustomers.
The F1 values of SSR are higher than those of SR for all Top-N product recommendations. Generally, the quality of recom-mendations declines as Top-N increases. The SSR method achieves the best performance under Top-10 and then decreasesfrom Top-10 to Top-50. The results show that the segmentation-based sequential rule method is more effective than thesequential rule-based method.
4.2.2. Evaluation of the SKCF methodThis experiment evaluates the SKCF method, which does not consider customers’ purchase sequences. Note that when
making recommendations, the KNN-based CF method [34] may use the transaction records of all customers (i.e., without
0
0.01
0.02
0.03
0.04
0.05
0.06
10 20 30 40 50
Top-N
F1
SSRSR
Fig. 3. Comparison of the SSR and SR methods under different Top-N recommendations.
SSR
0
0.01
0.02
0.03
0.04
0.05
0.06
0.07
10 20 30 40 50
Top-N
F1
Loyal
Potential
Uncertain
Valueless
Fig. 2. Comparison of four customer segments under different Top-N recommendations.
D.-R. Liu et al. / Information Sciences 179 (2009) 3505–3519 3515
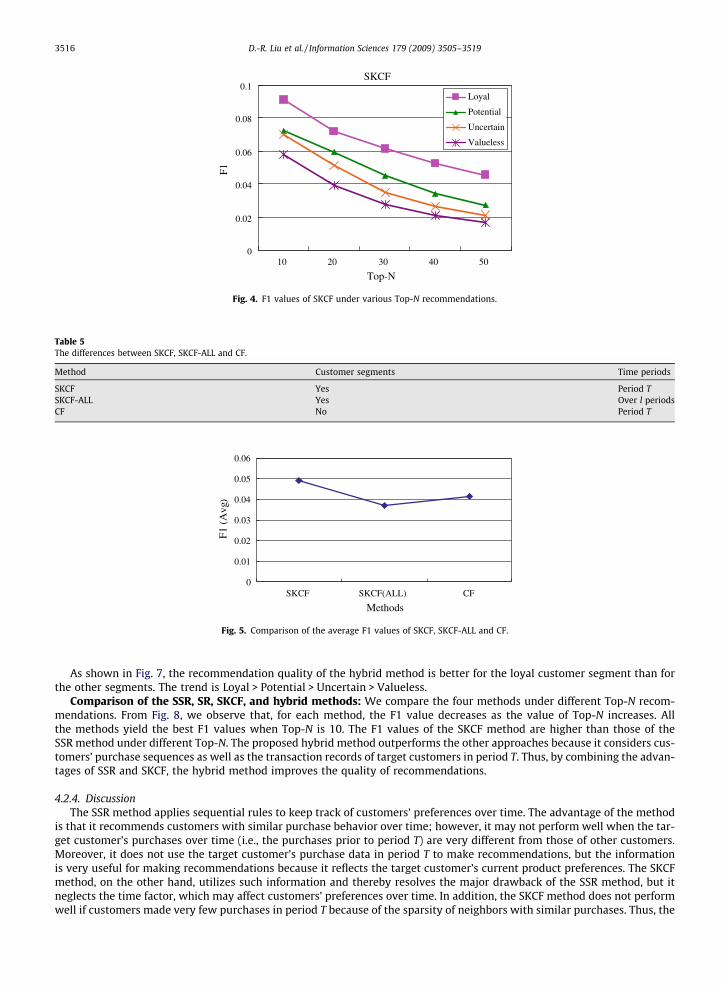
segmentation) for period T. In contrast, the SKCF method provides recommendations based on customer segments forperiod T. Fig. 4 shows the F1 values of SKCF under various Top-N recommendations.
The SKCF method performs better on the loyal and potential customer segments than on the uncertain and valueless seg-ments. In all cases, the F1 value decreases as Top-N increases. For all customer segments, the method achieves the best per-formance under Top-10 and yields the worst performance under Top-50 because the F1 value decreases gradually as Top-Nincreases. The trend of the F1 values of all four segments is Loyal > Potential > Uncertain > Valueless.
Comparison of the SKCF and CF methods: The KNN-based CF method [34] can also use the transaction records over lperiods to make recommendations. The SKCF method applies KNN-based CF based on the customer segments and transac-tion records for period T. The SKCF-ALL method applies KNN-based CF according to the customer segments and transactionrecords over l periods, and the CF method applies it in period T without considering customer segments. This experimentcompares the performance of three methods: SKCF, SKCF-ALL and CF. The differences between the methods are shown inTable 5, and Fig. 5 compares the SKCF method with the SKCF-ALL method and the CF method. Clearly, the SKCF method out-performs the other two methods.
We conducted experiments to compare the traditional CF methods, which use all the purchase data (SKCF-All) or the pur-chase data during the latest period T (SKCF) to make recommendations. The experiment results show that the SKCF methodoutperforms the SKCF-All method. Customers’ purchase behavior may evolve over time. From this perspective, customers’purchase behavior in the latest period represents their current preferences; thus, it is more effective for makingrecommendations.
4.2.3. Evaluation of the hybrid methodWe now describe the experiments conducted to evaluate the hybrid method, which combines the segmentation-based
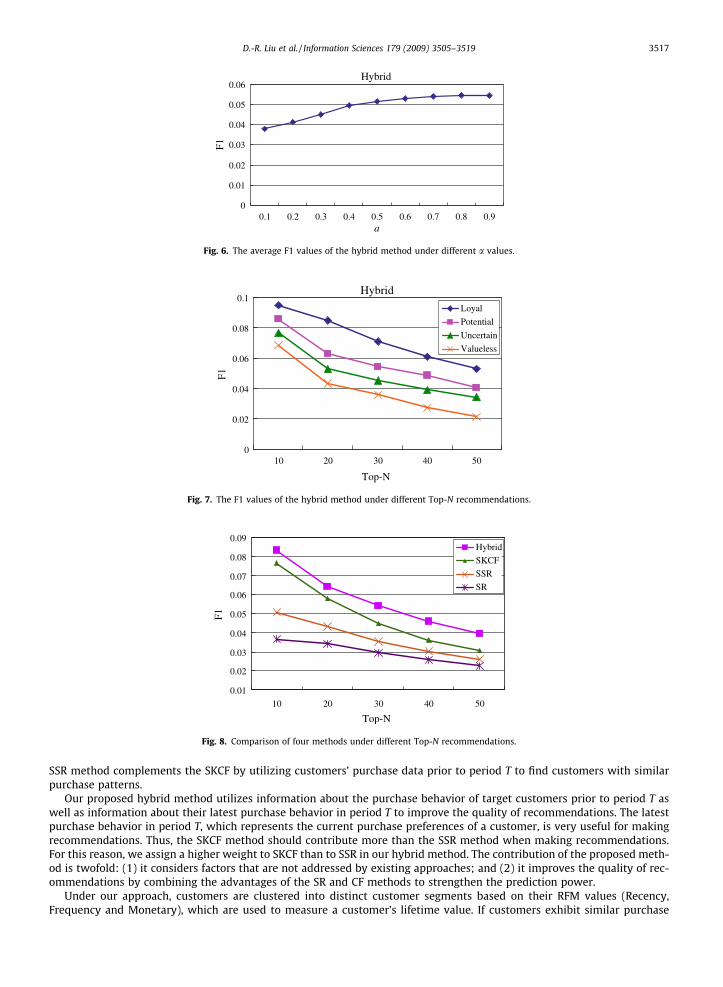
sequential rule method (SSR) and the KNN-based CF method with segmentation (SKCF). To determine the value of theparameter a (ranging from 0 to 1), we conducted a pilot experiment in which we systematically adjusted the value of ain increments of 0.1. The optimal value (i.e., the highest F1 value) was chosen as the best setting for a. The experiment re-sults, shown in Fig. 6, suggest that the best result can be achieved by setting a = 0.8 and the value of 1 � a = 0.2; that is, basedon the best recommendation quality, the weights for SSR and SKCF in the hybrid method are set at 0.2 and 0.8 respectively.
SKCF
0
0.02
0.04
0.06
0.08
0.1
10 20 30 40 50
Top-N
F1
Loyal
Potential
Uncertain
Valueless
Fig. 4. F1 values of SKCF under various Top-N recommendations.
Table 5The differences between SKCF, SKCF-ALL and CF.
Method Customer segments Time periods
SKCF Yes Period TSKCF-ALL Yes Over l periodsCF No Period T
0
0.01
0.02
0.03
0.04
0.05
0.06
SKCF SKCF(ALL) CF
Methods
F1
(Avg
.)
Fig. 5. Comparison of the average F1 values of SKCF, SKCF-ALL and CF.
3516 D.-R. Liu et al. / Information Sciences 179 (2009) 3505–3519
As shown in Fig. 7, the recommendation quality of the hybrid method is better for the loyal customer segment than forthe other segments. The trend is Loyal > Potential > Uncertain > Valueless.
Comparison of the SSR, SR, SKCF, and hybrid methods: We compare the four methods under different Top-N recom-mendations. From Fig. 8, we observe that, for each method, the F1 value decreases as the value of Top-N increases. Allthe methods yield the best F1 values when Top-N is 10. The F1 values of the SKCF method are higher than those of theSSR method under different Top-N. The proposed hybrid method outperforms the other approaches because it considers cus-tomers’ purchase sequences as well as the transaction records of target customers in period T. Thus, by combining the advan-tages of SSR and SKCF, the hybrid method improves the quality of recommendations.
4.2.4. DiscussionThe SSR method applies sequential rules to keep track of customers’ preferences over time. The advantage of the method
is that it recommends customers with similar purchase behavior over time; however, it may not perform well when the tar-get customer’s purchases over time (i.e., the purchases prior to period T) are very different from those of other customers.Moreover, it does not use the target customer’s purchase data in period T to make recommendations, but the informationis very useful for making recommendations because it reflects the target customer’s current product preferences. The SKCFmethod, on the other hand, utilizes such information and thereby resolves the major drawback of the SSR method, but itneglects the time factor, which may affect customers’ preferences over time. In addition, the SKCF method does not performwell if customers made very few purchases in period T because of the sparsity of neighbors with similar purchases. Thus, the
Hybrid
0
0.01
0.02
0.03
0.04
0.05
0.06
0.1 0.2 0.3 0.4 0.5 0.6 0.7 0.8 0.9a
F1
Fig. 6. The average F1 values of the hybrid method under different a values.
Hybrid
0
0.02
0.04
0.06
0.08
0.1
10 20 30 40 50
Top-N
F1
Loyal
Potential
Uncertain
Valueless
Fig. 7. The F1 values of the hybrid method under different Top-N recommendations.
0.01
0.02
0.03
0.04
0.05
0.06
0.07
0.08
0.09
10 20 30 40 50
Top-N
F1
Hybrid
SKCF
SSR
SR
Fig. 8. Comparison of four methods under different Top-N recommendations.
D.-R. Liu et al. / Information Sciences 179 (2009) 3505–3519 3517
SSR method complements the SKCF by utilizing customers’ purchase data prior to period T to find customers with similarpurchase patterns.
Our proposed hybrid method utilizes information about the purchase behavior of target customers prior to period T aswell as information about their latest purchase behavior in period T to improve the quality of recommendations. The latestpurchase behavior in period T, which represents the current purchase preferences of a customer, is very useful for makingrecommendations. Thus, the SKCF method should contribute more than the SSR method when making recommendations.For this reason, we assign a higher weight to SKCF than to SSR in our hybrid method. The contribution of the proposed meth-od is twofold: (1) it considers factors that are not addressed by existing approaches; and (2) it improves the quality of rec-ommendations by combining the advantages of the SR and CF methods to strengthen the prediction power.
Under our approach, customers are clustered into distinct customer segments based on their RFM values (Recency,Frequency and Monetary), which are used to measure a customer’s lifetime value. If customers exhibit similar purchase

3518 D.-R. Liu et al. / Information Sciences 179 (2009) 3505–3519
behavior, it is highly likely that they will have similar RFM values. Thus, each group represents a specific market segment,and the customers in each group have similar RFM values. Customers in the loyal segment bought products more frequentlyand more recently than customers in the other segments. As a result, the proposed hybrid recommendation method is betterable to predict the purchase behavior of loyal customers than that of other types of customers, for example, valueless cus-tomers who make very few purchases. Hence, the quality of product recommendations for customers in the loyal segment isbetter than the quality of recommendations made to customers in other segments, as shown by our experiment results.
5. Conclusion and future work
Traditional CF methods do not consider customers’ purchase sequences, which indicate the customers’ preferences overtime. In contrast, the sequential rule method does consider the sequence of customers’ purchase behavior over time, but itdoes not make use of the target customer’s purchase data for the current period. To enhance the quality of recommendations,we have proposed a hybrid method that considers customers’ purchase sequences over time as well as their purchase datafor the current period. The method leverages the advantages of the SSR and SKCF methods, and also considers the fact thatdifferent customer segments may prefer specific products. Experiments were conducted to compare and evaluate the per-formance of the SSR, SKCF, SR, and hybrid methods. In general, the hybrid method achieves the best recommendation qualityamong the four methods. Furthermore, the quality of recommendations for the loyal customer segment is better than that ofrecommendations for the other customer segments.
In our future work, we will conduct experiments on a larger data set with various kinds of products, and use customers’RFM values to derive customer segments. We assume that if customers exhibit similar purchasing behavior or have madesimilar purchase, their RFM values will probably be similar. In addition to investigate the effect of customer segmentation,we will employ other approaches, such as clustering based on FM values without considering the R (recency) values andclustering based on the product items purchased.
Acknowledgement
This research was supported in part by the National Science Council of the Taiwan under Grant No. NSC 96-2416-H-009-007-MY3.
References
[1] R. Agrawal, T. Imielinski, A. Swami, Mining association rules between sets of items in large databases, ACM SIGMOD Record 22 (2) (1993) 207–216.[2] H.J. Ahn, A new similarity measure for collaborative filtering to alleviate the new user cold-starting problem, Information Sciences 178 (1) (2008)
37–51.[3] C. Basu, H. Hirsh, W. Cohen, Recommendation as classification: using social and content-based information in recommendation, in: Proceedings of the
National Conference on Artificial Intelligence, 1998, pp. 714–720.[4] D. Billsus, M.J. Pazzani, Learning collaborative information filters, in: Proceedings of the Fifteenth International Conference on Machine Learning, 1998,
pp. 46–54.[5] J.R. Bult, T. Wansbeek, Optimal selection for direct mail, Marketing Science 14 (4) (1995) 378–394.[6] H.-J. Chang, L.-P. Hung, C.-L. Ho, An anticipation model of potential customers’ purchasing behavior based on clustering analysis and association rules
analysis, Expert Systems with Applications 32 (3) (2007) 753–764.[7] L.-S. Chen, F.-H. Hsu, M.-C. Chen, Y.-C. Hsu, Developing recommender systems with the consideration of product profitability for sellers, Information
Sciences 178 (4) (2008) 1032–1048.[8] M.S. Chen, J. Han, P.S. Yu, Data mining: an overview from a database perspective, IEEE Transactions on Knowledge and Data Engineering 8 (6) (1996)
866–883.[9] J. Cho, K. Kwon, Y. Park, Collaborative filtering using dual information sources, IEEE Intelligent Systems 22 (3) (2007) 30–38.
[10] Y.B. Cho, Y.H. Cho, S.H. Kim, Mining changes in customer buying behavior for collaborative recommendations, Expert Systems with Applications 28 (2)(2005) 359–369.
[11] J. Clatworthy, D. Buick, M. Hankins, J. Weinman, R. Horne, The use and reporting of cluster analysis in health psychology: a review, British Journal ofHealth Psychology 10 (3) (2005) 329–358.
[12] S. Dibb, Market segmentation: strategies for success, Marketing Intelligence and Planning 16 (7) (1998) 394–406.[13] A. Flexer, On the use of self-organizing maps for clustering and visualization, Intelligent Data Analysis 5 (5) (2001) 373–384.[14] S. Grabner-Kraeuter, G. Moedritscher, M. Waiguny, W. Mussnig, Performance Monitoring of CRM Initiatives, in: 40th Annual Hawaii International
Conference on System Sciences (HICSS 2007), Hawaii, 2007, p. 150a.[15] V.A. Hawkes, The heart of the matter: the challenge of customer lifetime value, CRM Forum Resources 13 (2000) 1–10.[16] L.J. Heyer, S. Kruglyak, S. Yooseph, Exploring expression data: identification and analysis of coexpressed genes, Genome Research 9 (1999) 1106–1115.[17] J.-J. Huang, G.-H. Tzeng, C.-S. Ong, Marketing segmentation using support vector clustering, Expert Systems with Applications 32 (2) (2007) 313–317.[18] S. Irvin, Using lifetime value analysis for selecting new customers, Credit World 82 (3) (1994) 37–40.[19] H. Jin, W.-H. Shum, K.-S. Leung, M.-L. Wong, Expanding self-organizing map for data visualization and cluster analysis, Information Sciences 163 (1-3)
(2004) 157–173.[20] T. Joachims, A probabilistic analysis of the Rocchio algorithm with TFIDF for text categorization, in: ICML’97: Proceedings of the Fourteenth
International Conference on Machine Learning, 1997, pp. 143–151.[21] P. Kazienko, M. Adamski, AdROSA – adaptive personalization of web advertising, Information Sciences 177 (11) (2007) 2269–2295.[22] T. Kohonen, Automatic pattern recognition: a challenge to the computer technology, IFIP Congress, 1980.[23] J.A. Konstan, B.N. Miller, D. Maltz, J.L. Herlocker, L.R. Gordon, J. Riedl, GroupLens: applying collaborative filtering to usenet news, Communications of
the ACM 40 (3) (1997) 77–87.[24] A.J.T. Lee, C.-S. Wang, An efficient algorithm for mining frequent inter-transaction patterns, Information Sciences 177 (17) (2007) 3453–3476.[25] C. Lin, S. Alvarez, C. Ruiz, Collaborative recommendation via adaptive association rule mining, in: Proceedings of the International Workshop on Web
Mining for E-Commerce (WEBKDD2000), 2000.
D.-R. Liu et al. / Information Sciences 179 (2009) 3505–3519 3519
[26] P. Lingras, M. Hogo, M. Snorek, C. West, Temporal analysis of clusters of supermarket customers: conventional versus interval set approach,Information Sciences 172 (1–2) (2005) 215–240.
[27] D.R. Liu, Y.Y. Shih, Integrating AHP and data mining for product recommendation based on customer lifetime value, Information and Management 42(3) (2005) 387–400.
[28] J. MacQueen, Some methods for classification and analysis of multivariate observations, in: Proceedings of the Fifth Berkeley Symposium onMathematical Statistics and Probability, 1967, pp. 281–297.
[29] R.J. Mooney, L. Roy, Content-based book recommending using learning for text categorization, in: Proceedings of the 5th ACM International Conferenceon Digital Libraries, 2000, pp. 195–204.
[30] G. Punj, D.W. Stewart, Cluster analysis in marketing research: review and suggestions for application, Journal of Marketing Research 20 (2) (1983) 134–148.
[31] P. Resnick, N. Iacovou, M. Suchak, P. Bergstrom, J. Riedl, GroupLens: an open architecture for collaborative filtering of netnews, in: Proceedings of the1994 ACM conference on Computer supported cooperative work (CSCW’94), ACM Press, 1994, pp. 175–186.
[32] S. Rosset, E. Neumann, U. Eick, N. Vatnik, Y. Idan, Customer lifetime value modeling and its use for customer retention planning, in: Proceedings of 8thACM SIGKDD International Conference on Knowledge Discovery and Data Mining (KDD-2002), 2002, pp. 175–186.
[33] J. Rucker, M.J. Polanco, Siteseer: personalized navigation for the web, Communications of the ACM 40 (3) (1997) 73–76.[34] B. Sarwar, G. Karypis, J. Konstan, J. Riedl, Analysis of recommendation algorithms for E-commerce, in: Proceedings of the ACM Conference on Electronic
Commerce, ACM Press, New York, NY, USA, 2000, pp. 158–167.[35] J.B. Schafer, J.A. Konstan, J. Riedl, E-commerce recommendation applications, Data Mining and Knowledge Discovery 5 (1) (2001) 115–153.[36] U. Shardanand, P. Maes, Social information filtering: algorithms for automating ‘‘word of mouth”, in: Proceedings of the SIGCHI Conference on Human
Factors in Computing Systems (CHI’95), ACM Press/Addison-Wesley, 1995, pp. 210–217.[37] J. Shi, J. Malik, Normalized cuts and image segmentation, IEEE Transactions on Pattern Analysis and Machine Intelligence 22 (8) (2000) 888–905.[38] Y.-Y. Shih, D.-R. Liu, Product recommendation approaches: Collaborative filtering via customer lifetime value and customer demands, Expert Systems
with Applications 35 (1–2) (2008) 350–360.[39] R. Srikant, R. Agrawal, Mining generalized association rules, Future Generation Computer Systems 13 (2) (1997) 161–180.[40] C.J. Van RijsBergen, Information Retrieval, Butterworth, London, 1979.[41] P.C. Verhoef, B. Donkers, Predicting customer potential value: an application in the insurance industry, Decision Support Systems 32 (2001) 189–199.[42] J. Vesanto, E. Alhoniemi, Clustering of the self-organizing map, IEEE Transactions on Neural Networks 11 (3) (2000) 586–600.[43] C.-H. Yun, M.-S. Chen, Mining mobile sequential patterns in a mobile commerce environment, IEEE Transactions on Systems, Man and Cybernetics, Part
C: Applications and Reviews 37 (2) (2007) 278–295.[44] H. Yun, D. Ha, B. Hwang, K.H. Ryu, Mining association rules on significant rare data using relative support, The Journal of Systems and Software 67 (3)
(2003) 181–191.[45] Y. Zhang, J. Jiao, An associative classification-based recommendation system for personalization in B2C e-commerce applications, Expert Systems with
Applications 33 (2) (2007) 357–367.


![A Novel Approach for Neighbourhood-based Collaborative Filtering · 2017. 4. 18. · tering, collaborative ltering [1], hybrid approach, which combines content-based as well as collaborative](https://img.pdfslide.us/doc/110x75/60903ab519b2a57af6159520/a-novel-approach-for-neighbourhood-based-collaborative-filtering-2017-4-18.jpg)


![H2E: A Privacy Provisioning Framework for Collaborative Filtering … · 2019-09-10 · collaborative filtering, content-based filtering, and hybrid filtering [3]. Content-based filtering,](https://img.pdfslide.us/doc/110x75/5f2811153d39b70bb31af3b8/h2e-a-privacy-provisioning-framework-for-collaborative-filtering-2019-09-10-collaborative.jpg)