Embed Size (px)
Citation preview

© 2012 Macmillan Publishers Limited. All rights reserved.
A high-resolution microchip optomechanicalaccelerometerAlexander G. Krause1†, Martin Winger1†, Tim D. Blasius1†, Qiang Lin2 and Oskar Painter1*
The monitoring of acceleration is essential for a variety ofapplications ranging from inertial navigation to consumerelectronics1,2. Typical accelerometer operation involves thesensitive displacement measurement of a flexibly mountedtest mass, which can be realized using capacitive3,4, piezo-electric5, tunnel-current6,7 or optical8–11 methods. Althoughoptical detection provides superior displacement resolution8,resilience to electromagnetic interference and long-rangereadout7, current optical accelerometers either do not allowfor chip-scale integration or utilize relatively bulky test masssensors of low bandwidth8–10. Here, we demonstrate an opto-mechanical accelerometer that makes use of ultrasensitivedisplacement readout using a photonic-crystal nanocavity12
monolithically integrated with a nanotethered test mass ofhigh mechanical Q-factor13. This device achieves an accelera-tion resolution of 10 mg Hz21/2 with submilliwatt opticalpower, bandwidth greater than 20 kHz and a dynamic rangeof greater than 40 dB. Moreover, the nanogram test massesused here allow for strong optomechanical backaction14–17,setting the stage for a new class of motional sensors.
Owing to the rapid development of silicon micromachining tech-nology, microelectromechanical systems (MEMS) accelerometershave become exceedingly popular over the past two decades1.Evolving from airbag deployment sensors in automobiles to tiltsensors in cameras and consumer electronics products, they cannow be found in a large variety of technological applications withvery diverse requirements for their performance metrics. Forexample, sensors for inertial navigation systems require low noiselevels and superior bias stability18, but large bandwidth is crucialfor sensors in acoustics and vibrometry applications19. However,there is a fundamental tradeoff between noise performance andbandwidth that can be understood from the basic principle ofoperation of an accelerometer (Fig. 1a). When subjected to an acce-leration a(v) at frequency v, a mechanically compliant test massexperiences a displacement x(v)¼ x(v)a(v) proportional tothe mechanical susceptibility x21(v)¼ vm
2 2 v2þ i[(vvm)/Qm].Here, vm¼ 2pfm¼
p(k/m) is the (angular) resonance frequency
of the oscillator and Qm is its mechanical Q-factor (see the plot of|x(v)|¼|x|/a in Fig. 1b for Qm¼ 10). Usually, accelerometers areoperated below their fundamental resonance frequency vm , wherex(v) ≈ 1/vm
2 exhibits an almost flat frequency response. This natu-rally leads to a tradeoff between resolution and bandwidth, becausethe large resonance frequency required for high-speed operationresults in vanishingly small displacements. As a result, the perform-ance of the displacement sensor constitutes a central figure of meritof an accelerometer.
In a cavity optomechanical system, a mechanically compliantelectromagnetic cavity is used to resonantly enhance the readoutof mechanical motion20 (canonically, the motion of the end
mirror of a Fabry–Perot cavity). Such systems have enabledmotion detection measurements with an imprecision at or belowthe standard quantum limit (SQL)21, corresponding to the positionuncertainty in the quantum ground state of the mechanical object.Furthermore, the average optical radiation pressure force can bequite large in micro- and nanoscale optomechanical devices,therefore offering the unique capability of controlling the sensorbandwidth via the optical spring effect16,17 and the effective temp-erature of the sensor by means of passive damping14 or feedbackcold-damping15,22.
In this Letter, we utilize an integrated SiN zipper photonic-crystal optomechanical cavity12 to provide shot-noise-limitedreadout of mechanical motion with imprecision near the SQL,enabling high-bandwidth and high-resolution accelerationsensing. The resolution of an accelerometer can be quantifiedby noise-equivalent acceleration, NEA¼
p(a th
2 þ adet2 þ aadd
2 ), inunits of g Hz21/2 (1 g¼ 9.81 m s22). The first term in the NEAarises from thermal Brownian motion of the test mass(Supplementary Section SVI.a)23 and is given by
ath =���������4kBTvm
mQm
√(1)
The remaining two terms arise from the aforementioned displace-ment readout noise (adet) and added noise (backaction) onto thetest mass due to the act of measurement (aadd; SupplementarySection SVI.b). Fundamental to minimizing the NEA is a reductionin the intrinsic thermal noise ath, which, according to equation (1),requires one to maximize the mass–Q product at a given vm.In most commercial accelerometers, the Q-factor is relatively low,which demands large test masses for high resolution. In contrast,in the zipper cavity devices presented here, we use nanotether sus-pension of a nanogram test mass to yield high intrinsic mechanicalQ-factors (.106), and strong thermo-optomechanical backaction todamp and cool the thermal motion of the test mass.
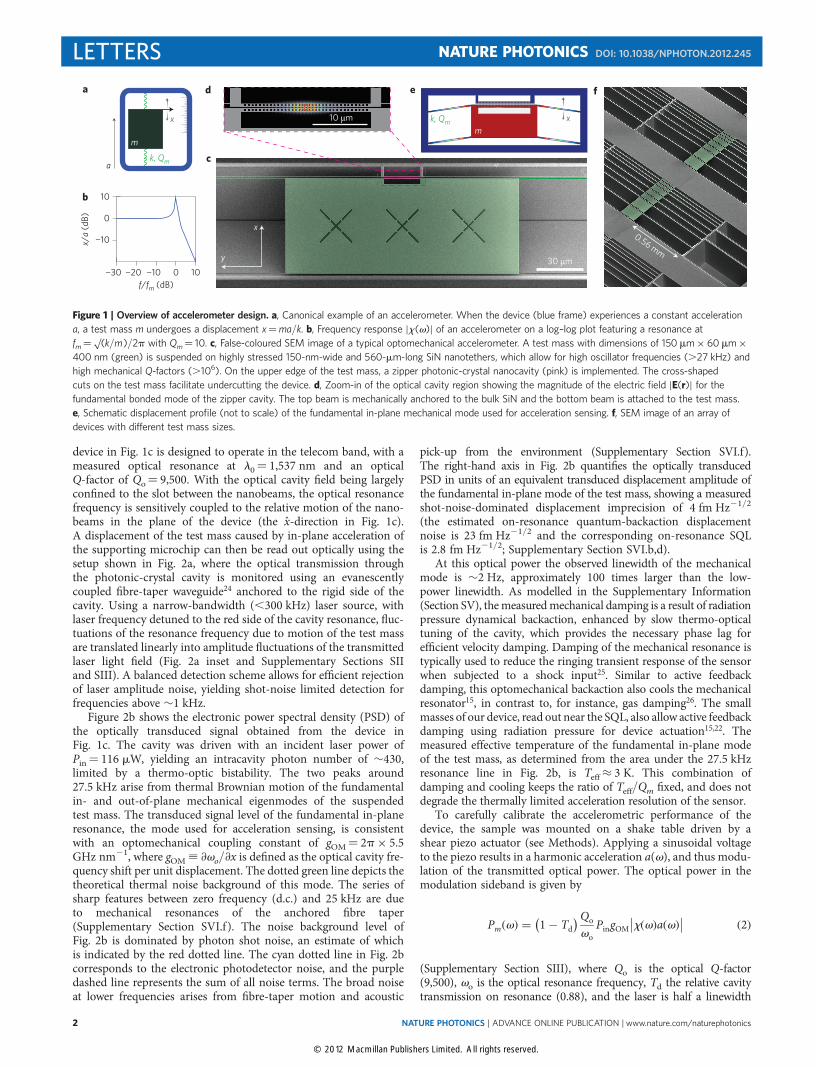
Figure 1c presents a scanning electron microscope (SEM) imageof the device studied here, with the test mass structure and nano-tethers highlighted in green. The fundamental in-plane mechanicalmode of this structure is depicted in Fig. 1e and is measured to havea frequency of fm¼ 27.5 kHz, in good agreement with finite-element method simulations, from which we also extract a motionalmass of m¼ 10 × 10212 kg. The measured mechanical Q-factor isQm¼ 1.4 × 10⁶ in vacuum (see Methods), which results in an esti-mated ath of 1.4 mg Hz21/2. The region highlighted in pink corre-sponds to the zipper optical cavity used for monitoring test massmotion, a zoom-in of which can be seen in Fig. 1d. The cavity con-sists of two patterned photonic-crystal nanobeams, one attached tothe test mass (bottom) and one anchored to the bulk (top). The
1Kavli Nanoscience Institute and Thomas J. Watson, Sr, Laboratory of Applied Physics, California Institute of Technology, Pasadena, California 91125, USA,2School of Engineering and Applied Sciences, University of Rochester, Rochester, New York 14627, USA, †These authors contributed equally to this work.
*e-mail: [email protected]
LETTERSPUBLISHED ONLINE: 14 OCTOBER 2012 | DOI: 10.1038/NPHOTON.2012.245
NATURE PHOTONICS | ADVANCE ONLINE PUBLICATION | www.nature.com/naturephotonics 1
© 2012 Macmillan Publishers Limited. All rights reserved.
device in Fig. 1c is designed to operate in the telecom band, with ameasured optical resonance at l0¼ 1,537 nm and an opticalQ-factor of Qo¼ 9,500. With the optical cavity field being largelyconfined to the slot between the nanobeams, the optical resonancefrequency is sensitively coupled to the relative motion of the nano-beams in the plane of the device (the x̂-direction in Fig. 1c).A displacement of the test mass caused by in-plane acceleration ofthe supporting microchip can then be read out optically using thesetup shown in Fig. 2a, where the optical transmission throughthe photonic-crystal cavity is monitored using an evanescentlycoupled fibre-taper waveguide24 anchored to the rigid side of thecavity. Using a narrow-bandwidth (,300 kHz) laser source, withlaser frequency detuned to the red side of the cavity resonance, fluc-tuations of the resonance frequency due to motion of the test massare translated linearly into amplitude fluctuations of the transmittedlaser light field (Fig. 2a inset and Supplementary Sections SIIand SIII). A balanced detection scheme allows for efficient rejectionof laser amplitude noise, yielding shot-noise limited detection forfrequencies above �1 kHz.
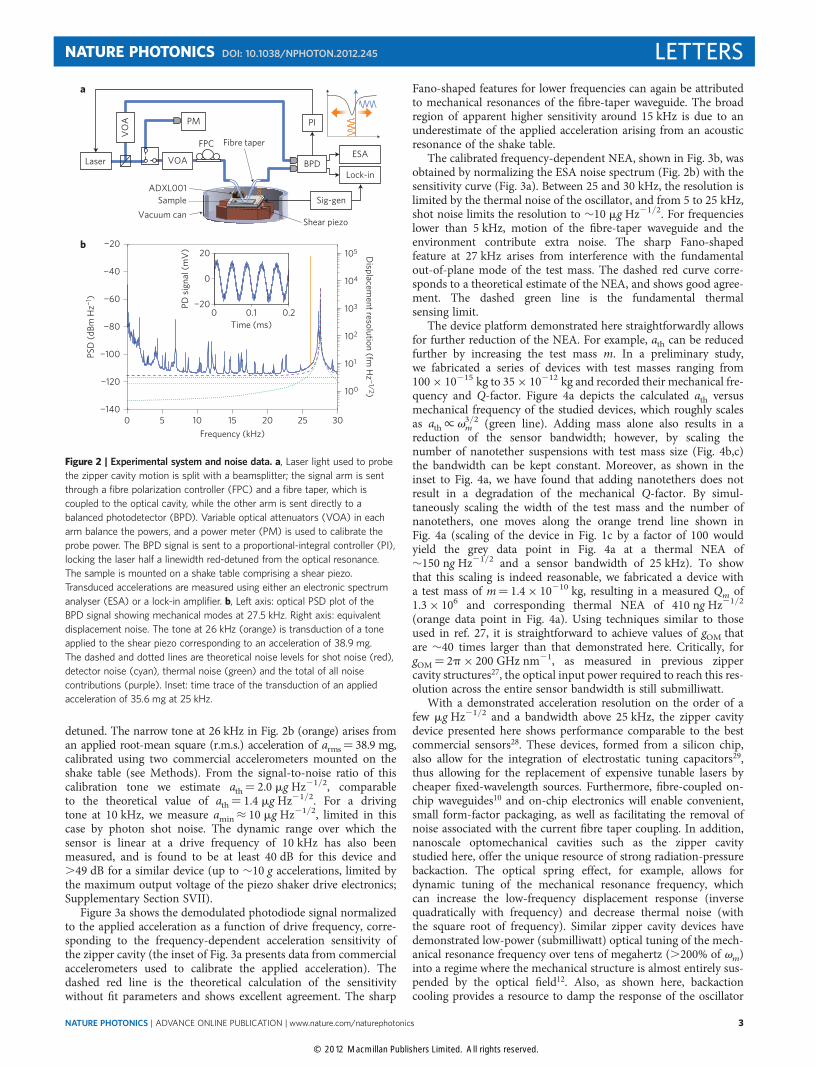
Figure 2b shows the electronic power spectral density (PSD) ofthe optically transduced signal obtained from the device inFig. 1c. The cavity was driven with an incident laser power ofPin¼ 116 mW, yielding an intracavity photon number of �430,limited by a thermo-optic bistability. The two peaks around27.5 kHz arise from thermal Brownian motion of the fundamentalin- and out-of-plane mechanical eigenmodes of the suspendedtest mass. The transduced signal level of the fundamental in-planeresonance, the mode used for acceleration sensing, is consistentwith an optomechanical coupling constant of gOM¼ 2p× 5.5GHz nm21, where gOM ; ∂vo/∂x is defined as the optical cavity fre-quency shift per unit displacement. The dotted green line depicts thetheoretical thermal noise background of this mode. The series ofsharp features between zero frequency (d.c.) and 25 kHz are dueto mechanical resonances of the anchored fibre taper(Supplementary Section SVI.f ). The noise background level ofFig. 2b is dominated by photon shot noise, an estimate of whichis indicated by the red dotted line. The cyan dotted line in Fig. 2bcorresponds to the electronic photodetector noise, and the purpledashed line represents the sum of all noise terms. The broad noiseat lower frequencies arises from fibre-taper motion and acoustic
pick-up from the environment (Supplementary Section SVI.f).The right-hand axis in Fig. 2b quantifies the optically transducedPSD in units of an equivalent transduced displacement amplitude ofthe fundamental in-plane mode of the test mass, showing a measuredshot-noise-dominated displacement imprecision of 4 fm Hz21/2
(the estimated on-resonance quantum-backaction displacementnoise is 23 fm Hz21/2 and the corresponding on-resonance SQLis 2.8 fm Hz21/2; Supplementary Section SVI.b,d).
At this optical power the observed linewidth of the mechanicalmode is �2 Hz, approximately 100 times larger than the low-power linewidth. As modelled in the Supplementary Information(Section SV), the measured mechanical damping is a result of radiationpressure dynamical backaction, enhanced by slow thermo-opticaltuning of the cavity, which provides the necessary phase lag forefficient velocity damping. Damping of the mechanical resonance istypically used to reduce the ringing transient response of the sensorwhen subjected to a shock input25. Similar to active feedbackdamping, this optomechanical backaction also cools the mechanicalresonator15, in contrast to, for instance, gas damping26. The smallmasses of our device, read out near the SQL, also allow active feedbackdamping using radiation pressure for device actuation15,22. Themeasured effective temperature of the fundamental in-plane modeof the test mass, as determined from the area under the 27.5 kHzresonance line in Fig. 2b, is Teff ≈ 3 K. This combination ofdamping and cooling keeps the ratio of Teff/Qm fixed, and does notdegrade the thermally limited acceleration resolution of the sensor.
To carefully calibrate the accelerometric performance of thedevice, the sample was mounted on a shake table driven by ashear piezo actuator (see Methods). Applying a sinusoidal voltageto the piezo results in a harmonic acceleration a(v), and thus modu-lation of the transmitted optical power. The optical power in themodulation sideband is given by
Pm(v) = 1 − Td
( )Qo
voPingOM x(v)a(v)
∣∣ ∣∣ (2)
(Supplementary Section SIII), where Qo is the optical Q-factor(9,500), vo is the optical resonance frequency, Td the relative cavitytransmission on resonance (0.88), and the laser is half a linewidth
30 μm
x
x/a
(dB)
−30 −20 −10 0 10
−10
0
10
a
b
d
c
x
y
e f
mk, Qm
0.56 mm
a
m
k, Qm
x 10 μm
f/fm (dB)
Figure 1 | Overview of accelerometer design. a, Canonical example of an accelerometer. When the device (blue frame) experiences a constant acceleration
a, a test mass m undergoes a displacement x¼ma/k. b, Frequency response |x(v)| of an accelerometer on a log–log plot featuring a resonance at
fm¼p
(k/m)/2p with Qm¼ 10. c, False-coloured SEM image of a typical optomechanical accelerometer. A test mass with dimensions of 150 mm × 60 mm ×400 nm (green) is suspended on highly stressed 150-nm-wide and 560-mm-long SiN nanotethers, which allow for high oscillator frequencies (.27 kHz) and
high mechanical Q-factors (.106). On the upper edge of the test mass, a zipper photonic-crystal nanocavity (pink) is implemented. The cross-shaped
cuts on the test mass facilitate undercutting the device. d, Zoom-in of the optical cavity region showing the magnitude of the electric field |E(r)| for the
fundamental bonded mode of the zipper cavity. The top beam is mechanically anchored to the bulk SiN and the bottom beam is attached to the test mass.
e, Schematic displacement profile (not to scale) of the fundamental in-plane mechanical mode used for acceleration sensing. f, SEM image of an array of
devices with different test mass sizes.
LETTERS NATURE PHOTONICS DOI: 10.1038/NPHOTON.2012.245
NATURE PHOTONICS | ADVANCE ONLINE PUBLICATION | www.nature.com/naturephotonics2
© 2012 Macmillan Publishers Limited. All rights reserved.
detuned. The narrow tone at 26 kHz in Fig. 2b (orange) arises froman applied root-mean square (r.m.s.) acceleration of arms¼ 38.9 mg,calibrated using two commercial accelerometers mounted on theshake table (see Methods). From the signal-to-noise ratio of thiscalibration tone we estimate ath¼ 2.0 mg Hz21/2, comparableto the theoretical value of ath¼ 1.4 mg Hz21/2. For a drivingtone at 10 kHz, we measure amin ≈ 10 mg Hz21/2, limited in thiscase by photon shot noise. The dynamic range over which thesensor is linear at a drive frequency of 10 kHz has also beenmeasured, and is found to be at least 40 dB for this device and.49 dB for a similar device (up to �10 g accelerations, limited bythe maximum output voltage of the piezo shaker drive electronics;Supplementary Section SVII).
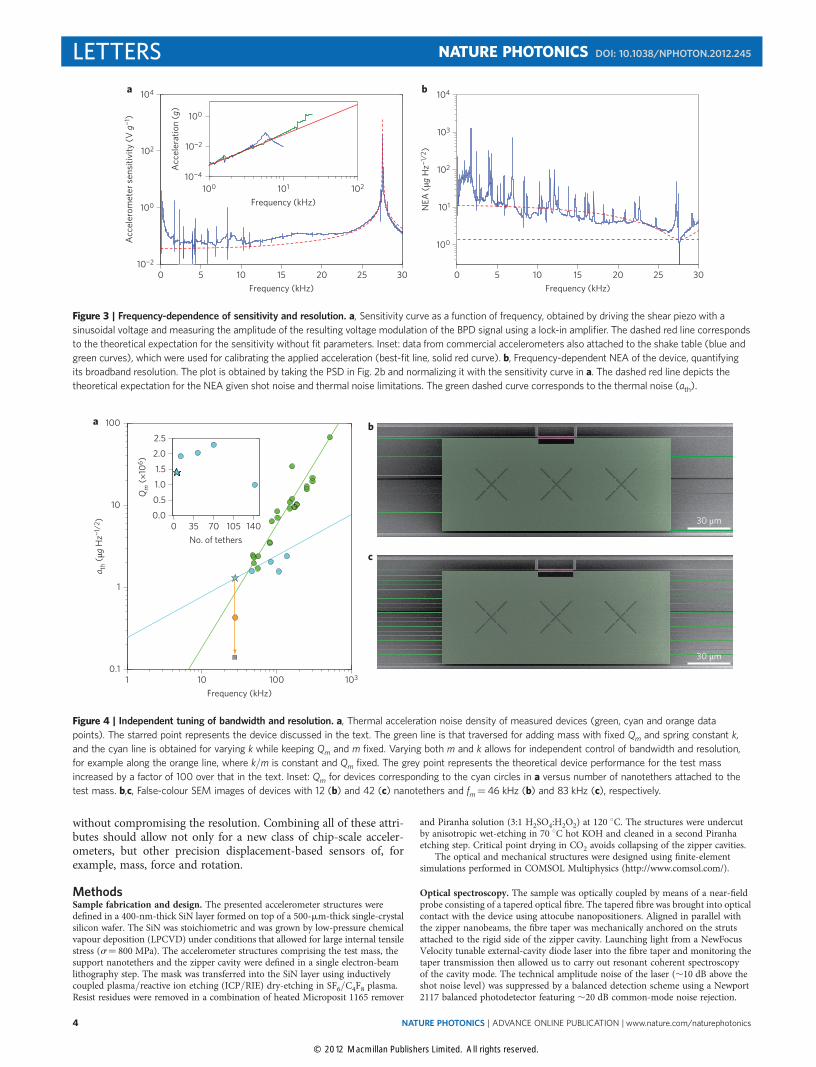
Figure 3a shows the demodulated photodiode signal normalizedto the applied acceleration as a function of drive frequency, corre-sponding to the frequency-dependent acceleration sensitivity ofthe zipper cavity (the inset of Fig. 3a presents data from commercialaccelerometers used to calibrate the applied acceleration). Thedashed red line is the theoretical calculation of the sensitivitywithout fit parameters and shows excellent agreement. The sharp
Fano-shaped features for lower frequencies can again be attributedto mechanical resonances of the fibre-taper waveguide. The broadregion of apparent higher sensitivity around 15 kHz is due to anunderestimate of the applied acceleration arising from an acousticresonance of the shake table.
The calibrated frequency-dependent NEA, shown in Fig. 3b, wasobtained by normalizing the ESA noise spectrum (Fig. 2b) with thesensitivity curve (Fig. 3a). Between 25 and 30 kHz, the resolution islimited by the thermal noise of the oscillator, and from 5 to 25 kHz,shot noise limits the resolution to �10 mg Hz21/2. For frequencieslower than 5 kHz, motion of the fibre-taper waveguide and theenvironment contribute extra noise. The sharp Fano-shapedfeature at 27 kHz arises from interference with the fundamentalout-of-plane mode of the test mass. The dashed red curve corre-sponds to a theoretical estimate of the NEA, and shows good agree-ment. The dashed green line is the fundamental thermalsensing limit.
The device platform demonstrated here straightforwardly allowsfor further reduction of the NEA. For example, ath can be reducedfurther by increasing the test mass m. In a preliminary study,we fabricated a series of devices with test masses ranging from100 × 10215 kg to 35 × 10212 kg and recorded their mechanical fre-quency and Q-factor. Figure 4a depicts the calculated ath versusmechanical frequency of the studied devices, which roughly scalesas ath/vm
3/2 (green line). Adding mass alone also results in areduction of the sensor bandwidth; however, by scaling thenumber of nanotether suspensions with test mass size (Fig. 4b,c)the bandwidth can be kept constant. Moreover, as shown in theinset to Fig. 4a, we have found that adding nanotethers does notresult in a degradation of the mechanical Q-factor. By simul-taneously scaling the width of the test mass and the number ofnanotethers, one moves along the orange trend line shown inFig. 4a (scaling of the device in Fig. 1c by a factor of 100 wouldyield the grey data point in Fig. 4a at a thermal NEA of�150 ng Hz21/2 and a sensor bandwidth of 25 kHz). To showthat this scaling is indeed reasonable, we fabricated a device witha test mass of m¼ 1.4 × 10210 kg, resulting in a measured Qm of1.3 × 106 and corresponding thermal NEA of 410 ng Hz21/2
(orange data point in Fig. 4a). Using techniques similar to thoseused in ref. 27, it is straightforward to achieve values of gOM thatare �40 times larger than that demonstrated here. Critically, forgOM¼ 2p× 200 GHz nm21, as measured in previous zippercavity structures27, the optical input power required to reach this res-olution across the entire sensor bandwidth is still submilliwatt.
With a demonstrated acceleration resolution on the order of afew mg Hz21/2 and a bandwidth above 25 kHz, the zipper cavitydevice presented here shows performance comparable to the bestcommercial sensors28. These devices, formed from a silicon chip,also allow for the integration of electrostatic tuning capacitors29,thus allowing for the replacement of expensive tunable lasers bycheaper fixed-wavelength sources. Furthermore, fibre-coupled on-chip waveguides10 and on-chip electronics will enable convenient,small form-factor packaging, as well as facilitating the removal ofnoise associated with the current fibre taper coupling. In addition,nanoscale optomechanical cavities such as the zipper cavitystudied here, offer the unique resource of strong radiation-pressurebackaction. The optical spring effect, for example, allows fordynamic tuning of the mechanical resonance frequency, whichcan increase the low-frequency displacement response (inversequadratically with frequency) and decrease thermal noise (withthe square root of frequency). Similar zipper cavity devices havedemonstrated low-power (submilliwatt) optical tuning of the mech-anical resonance frequency over tens of megahertz (.200% of vm)into a regime where the mechanical structure is almost entirely sus-pended by the optical field12. Also, as shown here, backactioncooling provides a resource to damp the response of the oscillator
a
b
FPC
SampleADXL001
Laser
VO
A
VOA
PM PI
BPDLock-in
Sig-gena
ESAFibre taper
Vacuum canShear piezo
100
101
102
103
104
105
Frequency (kHz)
PSD
(dBm
Hz−1
)
0 5 10 15 20 25 30−140
−120
−100
−80
−60
−40
−20
Time (ms)
PD s
igna
l (m
V)
0 0.1 0.2−20
0
20 Displacem
ent resolution (fm H
z −1/2)
Figure 2 | Experimental system and noise data. a, Laser light used to probe
the zipper cavity motion is split with a beamsplitter; the signal arm is sent
through a fibre polarization controller (FPC) and a fibre taper, which is
coupled to the optical cavity, while the other arm is sent directly to a
balanced photodetector (BPD). Variable optical attenuators (VOA) in each
arm balance the powers, and a power meter (PM) is used to calibrate the
probe power. The BPD signal is sent to a proportional-integral controller (PI),
locking the laser half a linewidth red-detuned from the optical resonance.
The sample is mounted on a shake table comprising a shear piezo.
Transduced accelerations are measured using either an electronic spectrum
analyser (ESA) or a lock-in amplifier. b, Left axis: optical PSD plot of the
BPD signal showing mechanical modes at 27.5 kHz. Right axis: equivalent
displacement noise. The tone at 26 kHz (orange) is transduction of a tone
applied to the shear piezo corresponding to an acceleration of 38.9 mg.
The dashed and dotted lines are theoretical noise levels for shot noise (red),
detector noise (cyan), thermal noise (green) and the total of all noise
contributions (purple). Inset: time trace of the transduction of an applied
acceleration of 35.6 mg at 25 kHz.
NATURE PHOTONICS DOI: 10.1038/NPHOTON.2012.245 LETTERS
NATURE PHOTONICS | ADVANCE ONLINE PUBLICATION | www.nature.com/naturephotonics 3
© 2012 Macmillan Publishers Limited. All rights reserved.
without compromising the resolution. Combining all of these attri-butes should allow not only for a new class of chip-scale acceler-ometers, but other precision displacement-based sensors of, forexample, mass, force and rotation.
MethodsSample fabrication and design. The presented accelerometer structures weredefined in a 400-nm-thick SiN layer formed on top of a 500-mm-thick single-crystalsilicon wafer. The SiN was stoichiometric and was grown by low-pressure chemicalvapour deposition (LPCVD) under conditions that allowed for large internal tensilestress (s¼ 800 MPa). The accelerometer structures comprising the test mass, thesupport nanotethers and the zipper cavity were defined in a single electron-beamlithography step. The mask was transferred into the SiN layer using inductivelycoupled plasma/reactive ion etching (ICP/RIE) dry-etching in SF6/C4F8 plasma.Resist residues were removed in a combination of heated Microposit 1165 remover
and Piranha solution (3:1 H2SO4:H2O2) at 120 8C. The structures were undercutby anisotropic wet-etching in 70 8C hot KOH and cleaned in a second Piranhaetching step. Critical point drying in CO2 avoids collapsing of the zipper cavities.
The optical and mechanical structures were designed using finite-elementsimulations performed in COMSOL Multiphysics (http://www.comsol.com/).
Optical spectroscopy. The sample was optically coupled by means of a near-fieldprobe consisting of a tapered optical fibre. The tapered fibre was brought into opticalcontact with the device using attocube nanopositioners. Aligned in parallel withthe zipper nanobeams, the fibre taper was mechanically anchored on the strutsattached to the rigid side of the zipper cavity. Launching light from a NewFocusVelocity tunable external-cavity diode laser into the fibre taper and monitoring thetaper transmission then allowed us to carry out resonant coherent spectroscopyof the cavity mode. The technical amplitude noise of the laser (�10 dB above theshot noise level) was suppressed by a balanced detection scheme using a Newport2117 balanced photodetector featuring �20 dB common-mode noise rejection.
30 μm
b
c
a
1 10 100 1030.1
1
10
100
Frequency (kHz)
No. of tethers0 35 70 105 140
0.0
0.5
1.0
1.5
2.0
2.5
a th (μ
g H
z−1/2
)
Qm
(×10
6 )
30 μm
Figure 4 | Independent tuning of bandwidth and resolution. a, Thermal acceleration noise density of measured devices (green, cyan and orange data
points). The starred point represents the device discussed in the text. The green line is that traversed for adding mass with fixed Qm and spring constant k,
and the cyan line is obtained for varying k while keeping Qm and m fixed. Varying both m and k allows for independent control of bandwidth and resolution,
for example along the orange line, where k/m is constant and Qm fixed. The grey point represents the theoretical device performance for the test mass
increased by a factor of 100 over that in the text. Inset: Qm for devices corresponding to the cyan circles in a versus number of nanotethers attached to the
test mass. b,c, False-colour SEM images of devices with 12 (b) and 42 (c) nanotethers and fm¼ 46 kHz (b) and 83 kHz (c), respectively.
a b
Frequency (kHz)
Acc
eler
omet
er s
ensi
tivity
(V g
−1)
0 5 10 15 20 25 3010−2
100
102
104
Frequency (kHz)
Acc
eler
atio
n (g
)
100 101 10210−4
10−2
100
Frequency (kHz)0 5 10 15 20 25 30
100
101
102
103
104
NEA
(μg
Hz−1
/2)
Figure 3 | Frequency-dependence of sensitivity and resolution. a, Sensitivity curve as a function of frequency, obtained by driving the shear piezo with a
sinusoidal voltage and measuring the amplitude of the resulting voltage modulation of the BPD signal using a lock-in amplifier. The dashed red line corresponds
to the theoretical expectation for the sensitivity without fit parameters. Inset: data from commercial accelerometers also attached to the shake table (blue and
green curves), which were used for calibrating the applied acceleration (best-fit line, solid red curve). b, Frequency-dependent NEA of the device, quantifying
its broadband resolution. The plot is obtained by taking the PSD in Fig. 2b and normalizing it with the sensitivity curve in a. The dashed red line depicts the
theoretical expectation for the NEA given shot noise and thermal noise limitations. The green dashed curve corresponds to the thermal noise (ath).
LETTERS NATURE PHOTONICS DOI: 10.1038/NPHOTON.2012.245
NATURE PHOTONICS | ADVANCE ONLINE PUBLICATION | www.nature.com/naturephotonics4

© 2012 Macmillan Publishers Limited. All rights reserved.
Mechanical spectroscopy. Motion of the mechanical oscillator resulted inamplitude-modulation of the laser light transmitted through the fibre taper, whichcould be measured by monitoring the PSD of the detected balanced-photodiodephotocurrent on an electronic spectrum analyser (ESA). Measuring the Q-factors ofthe mechanical modes is challenging because of the presence of slow frequency driftsof the mechanical mode over frequencies larger than the millihertz mechanicallinewidth. To overcome this limitation, we extracted Qm from the autocorrelationfunction of the mechanical motion30. To this end, we detected a time trace of theamplitude of thermal oscillations in a bandwidth of �100 Hz using a lock-inamplifier tuned to the mechanical mode frequency. Computing the autocorrelationof these time traces and fitting them to an exponential decay gave us a reliablemeasure of the mechanical Q-factor. To avoid air-damping, measurements werecarried out in vacuum.
Acceleration sensitivity measurement. To apply a.c. accelerations to our device, weconstructed a shake table comprising a sample holder plate glued on a shear piezoactuator. Applying a sinusoidal a.c. voltage to the piezo created a displacementx0sin(vdt), resulting in an applied acceleration of 2x0vd
2sin(vdt). For calibrationof the shake table assembly, we used commercial accelerometers (Analog Devices)with 5.5 kHz (ADXL103) and 22 kHz (ADXL001) bandwidths. To measurethe frequency response of our optomechanical accelerometer, we applied aconstant-voltage drive to the piezo and tuned its frequency while measuring thephotodetector output on a lock-in amplifier. After normalizing for the vd-dependence of the applied acceleration, this yielded the frequency-dependentsensitivity of the device. Normalizing an optical noise PSD then allowed us tocalibrate the noise floor of the accelerometer in terms of the NEA.
Received 25 March 2012; accepted 6 September 2012;published online 14 October 2012
References1. Krishnan, G., Kshirsagar, C. U., Ananthasuresh, G. K. & Bhat, N.
Micromachined high-resolution accelerometers. J. Indian Inst. Sci.87, 333–361 (2007).
2. Yazdi, N., Ayazi, F. & Najafi, K. Micromachined inertial sensors. Proc. IEEE86, 1640–1659 (1998).
3. Acar, C. & Shkel, A. M. Experimental evaluation and comparative analysis ofcommercial variable-capacitance MEMS accelerometers. J. Micromech.Microeng. 13, 634–645 (2003).
4. Kulah, H., Chae, J., Yazdi, N. & Najafi, K. Noise analysis and characterizationof a sigma-delta capacitive microaccelerometer. IEEE J. Solid-State Circ. 41,352–361 (2006).
5. Tadigadapa, S. & Mateti, K. Piezoelectric MEMS sensors: state-of-the-art andperspectives. Meas. Sci. Technol. 20, 092001 (2009).
6. Liu, C. et al. Characterization of a high-sensitivity micromachined tunnelingaccelerometer with micro-g resolution. J. Microelectromech. Syst. 7,235–244 (1998).
7. Nakstad, H. & Kringlebotn, J. T. Oil and gas applications: probing oil fields.Nature Photon. 2, 147–149 (2008).
8. Krishnamoorthy, U. et al. In-plane MEMS-based nano-g accelerometerwith sub-wavelength optical resonant sensor. Sens. Actuat. A 145–146,283–290 (2008).
9. Zandi, K. et al. in 2010 IEEE 23rd International Conference on Micro ElectroMechanical Systems (MEMS) 839–842 (IEEE, 2010).
10. Noell, W. et al. Applications of SOI-based optical MEMS. IEEE J. Sel. Top.Quantum Electron. 8, 148–154 (2002).
11. Berkoff, T. A. & Kersey, A. D. Experimental demonstration of a fiber Bragggrating accelerometer. IEEE Photon. Technol. Lett. 8, 1677–1679 (1996).
12. Eichenfield, M., Camacho, R., Chan, J., Vahala, K. J. & Painter, O.A picogram- and nanometre-scale photonic-crystal optomechanical cavity.Nature 459, 550–555 (2009).
13. Verbridge, S. S., Parpia, J. M., Reichenbach, R. B., Bellan, L. M. &Craighead, H. G. High quality factor resonance at room temperature withnanostrings under high tensile stress. J. Appl. Phys. 99, 124304 (2006).
14. Kippenberg, T. J. & Vahala, K. J. Cavity opto-mechanics. Opt. Express 15,17172–17205 (2007).
15. Genes, C., Vitali, D., Tombesi, P., Gigan, S. & Aspelmeyer, M. Ground-statecooling of a micromechanical oscillator: comparing cold damping and cavity-assisted cooling schemes. Phys. Rev. A 77, 033804 (2008).
16. Corbitt, T. et al. Optical dilution and feedback cooling of a gram-scale oscillatorto 6.9 mK. Phys. Rev. Lett. 99, 160801 (2007).
17. Lin, Q., Rosenberg, J., Jiang, X., Vahala, K. J. & Painter, O. Mechanicaloscillation and cooling actuated by the optical gradient force. Phys. Rev. Lett.103, 103601 (2009).
18. Zwahlen, P. et al. in 2010 IEEE 23rd International Conference on Micro ElectroMechanical Systems (MEMS) 631–634 (IEEE, 2010).
19. Endevco (2006) Accelerometer Selection Based on Applications, Technical paper291; available at http://www.endevco.com/news/archivednews/2006/2006_08/2006_08_f4.pdf.
20. Braginsky, V. B. Measurement of Weak Forces in Physics Experiments (Universityof Chicago Press, 1977).
21. Anetsberger, G. et al. Measuring nanomechanical motion with an imprecisionbelow the standard quantum limit. Phys. Rev. A 82, 061804(R) (2010).
22. Kleckner, D. & Bouwmeester, D. Sub-kelvin optical cooling of amicromechanical resonator. Nature 444, 75–78 (2006).
23. Yasumura, K. Y. et al. Quality factors in micron- and submicron-thickcantilevers. J. Microelectromech. Syst. 9, 117–125 (2000).
24. Michael, C. P., Borselli, M., Johnson, T. J., Chrystal, C. & Painter, O. An opticalfiber-taper probe for wafer-scale microphotonic device characterization.Opt. Express 15, 4745–4752 (2007).
25. Li, Y. T., Lee, S. Y. & Pastan, H. L. Air damped capacitance accelerometersand velocimeters. IEEE Trans. Indust. Electron. Control Instrum. IECI-17,44–48 (1970).
26. Allen, H. V., Terry, S. C. & De Bruin, D. W. Accelerometer systems withself-testable features. Sens. Actuat. 20, 153–161 (1989).
27. Camacho, R. M., Chan, J., Eichenfield, M. & Painter, O. Characterization ofradiation pressure and thermal effects in a nanoscale optomechanicalcavity. Opt. Express 17, 15726–15735 (2009).
28. Endevco, Model 752A13 ISOTRON accelerometer; available at http://www.endevco.com/datasheets/752A1.pdf.
29. Winger, M. et al. A chip-scale integrated cavity-electro-optomechanics platform.Opt. Express 19, 24905–24921 (2011).
30. Stipe, B. C., Mamin, H. J., Stowe, T. D., Kenny, T. W. & Rugar, D. Noncontactfriction and force fluctuations between closely spaced bodies. Phys. Rev. Lett.87, 096801 (2001).
AcknowledgementsThis work was supported by the Defense Advanced Research Projects AdministrationQuASaR program through a grant from the Army Research Office. T.D.B. acknowledgessupport from the National Science Foundation Graduate Research Fellowship Program(grant no. 0703267).
Author contributionsA.G.K., M.W. and T.D.B. performed sample design, fabrication, optical measurements anddata analysis. O.P. and Q.L. developed the device concept and supervised measurementsand analysis. All authors worked together on writing the manuscript.
Additional informationSupplementary information is available in the online version of the paper. Reprints andpermission information is available online at http://www.nature.com/reprints. Correspondenceand requests for materials should be addressed to O.P.
Competing financial interestsThe authors declare no competing financial interests.
NATURE PHOTONICS DOI: 10.1038/NPHOTON.2012.245 LETTERS
NATURE PHOTONICS | ADVANCE ONLINE PUBLICATION | www.nature.com/naturephotonics 5