Embed Size (px)
Citation preview
Kristoffer Robin [email protected]
A High-Precision GPU, CPU and Memory Power Model for the Tegra K1 SoC
Learning Outcome
3/24/2016 2
• Deep, low-level knowledge of the Tegra K1– GK20A GPU, ARM Cortex-A15 CPU, DDR3 RAM
• Accurate, generic power modelling for the Tegra K1– Method, model training and evaluation
• Hardware-software codesign for power-aware computing– Analysing power usage of joint GPU-CPU execution– Optimising kernels for power
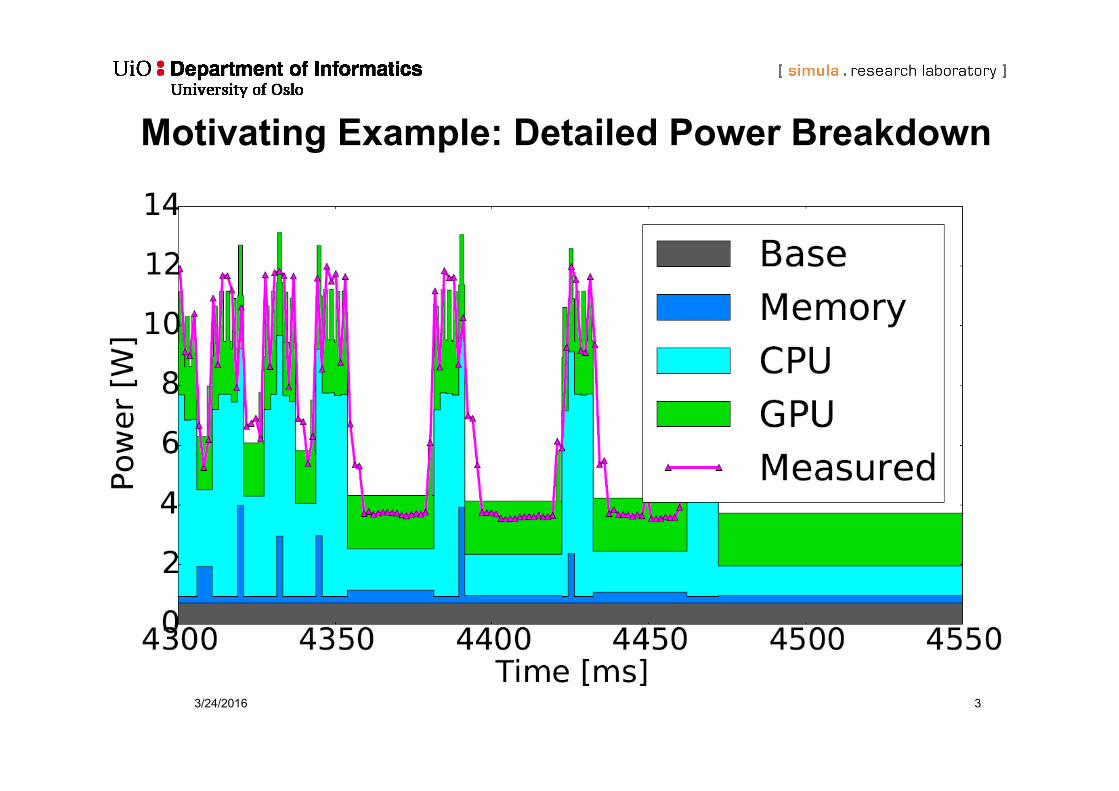
Motivating Example: Detailed Power Breakdown
3/24/2016 3
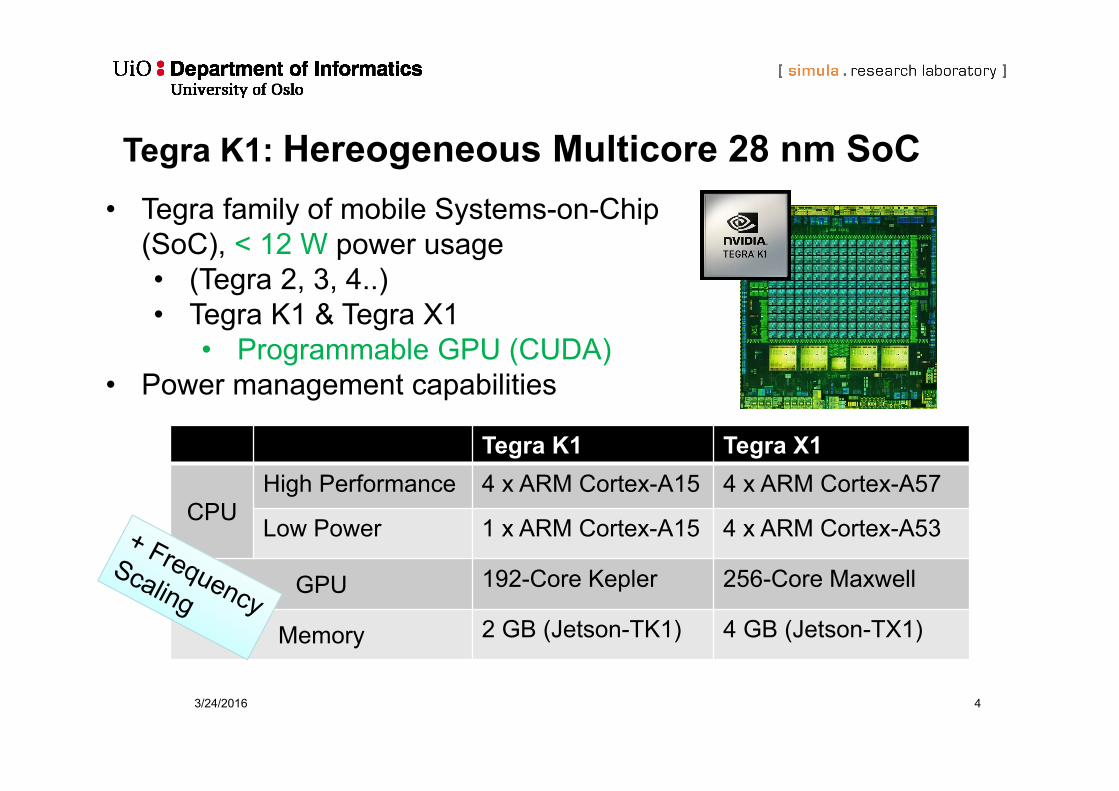
Tegra K1: Hereogeneous Multicore 28 nm SoC• Tegra family of mobile Systems-on-Chip
(SoC), < 12 W power usage• (Tegra 2, 3, 4..)• Tegra K1 & Tegra X1
• Programmable GPU (CUDA)• Power management capabilities
3/24/2016 4
Tegra K1 Tegra X1
CPUHigh Performance 4 x ARM Cortex-A15 4 x ARM Cortex-A57
Low Power 1 x ARM Cortex-A15 4 x ARM Cortex-A53
GPU 192-Core Kepler 256-Core Maxwell
Memory 2 GB (Jetson-TK1) 4 GB (Jetson-TX1)
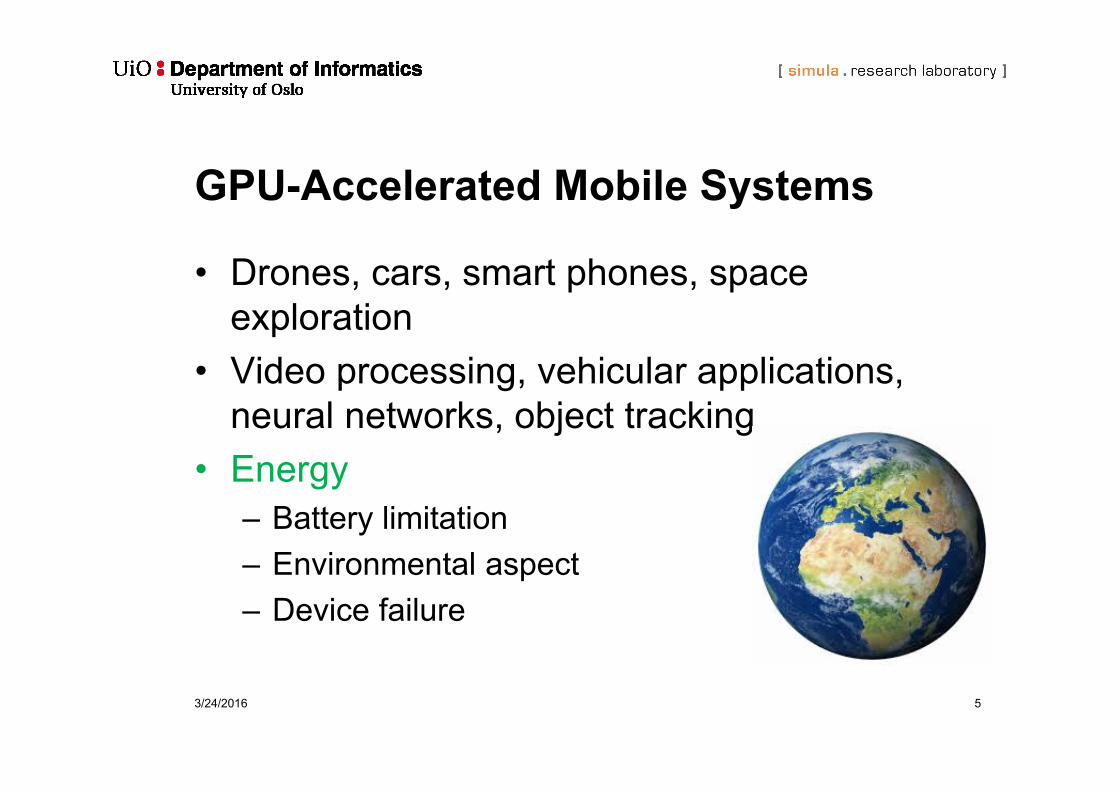
GPU-Accelerated Mobile Systems
• Drones, cars, smart phones, space exploration
• Video processing, vehicular applications, neural networks, object tracking
• Energy – Battery limitation– Environmental aspect– Device failure
3/24/2016 5
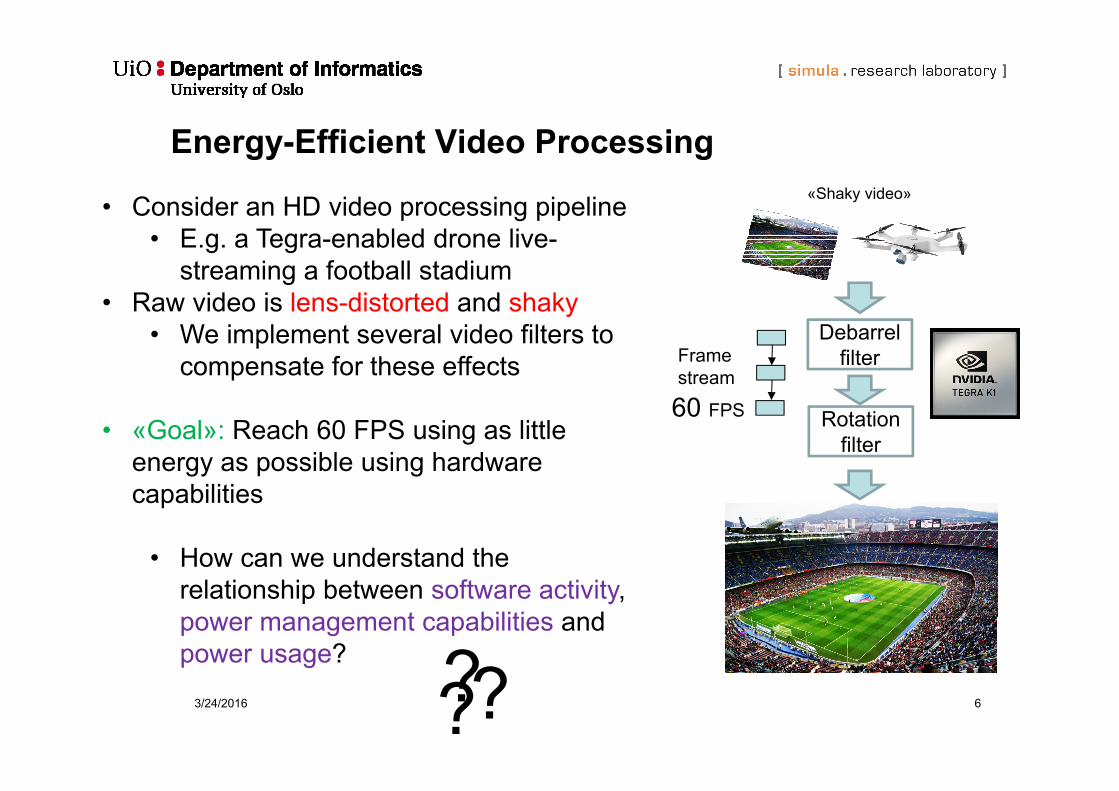
Energy-Efficient Video Processing
• Consider an HD video processing pipeline• E.g. a Tegra-enabled drone live-
streaming a football stadium• Raw video is lens-distorted and shaky
• We implement several video filters to compensate for these effects
• «Goal»: Reach 60 FPS using as little energy as possible using hardware capabilities
• How can we understand the relationship between software activity, power management capabilities and power usage?
Rotationfilter
60 FPS
«Shaky video»
Frame stream
3/24/2016 6???
Debarrel filter
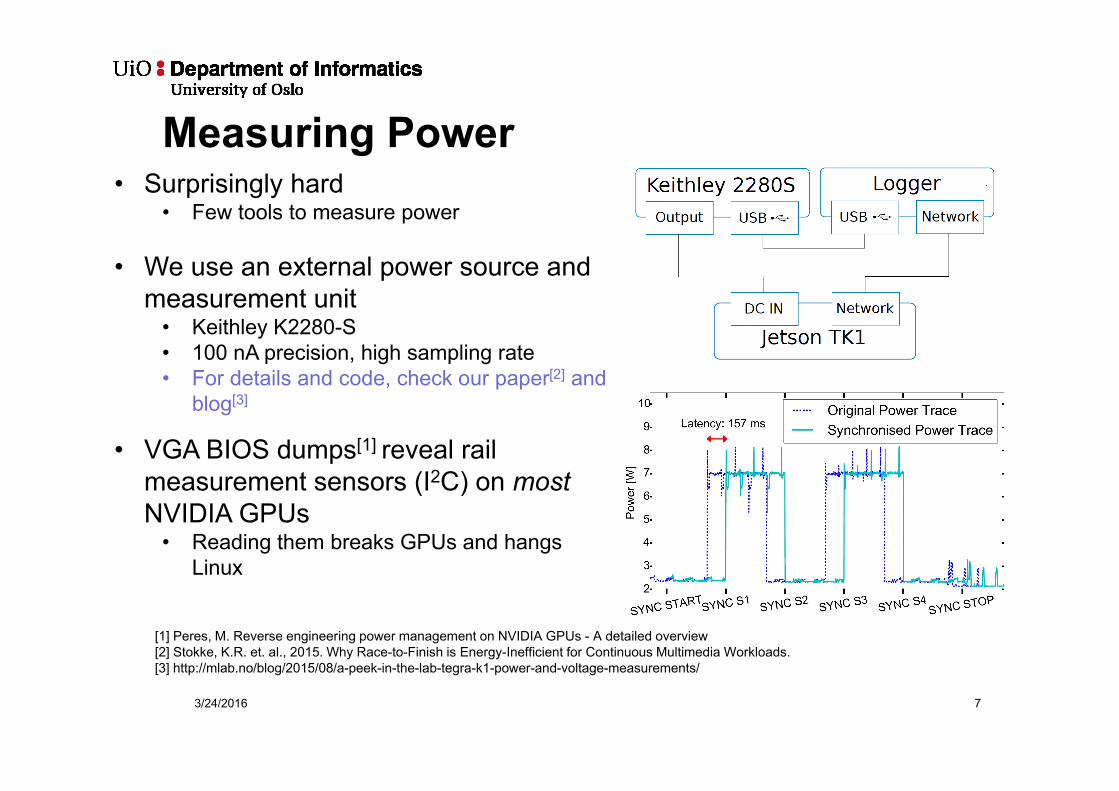
Measuring Power
3/24/2016 7
[1] Peres, M. Reverse engineering power management on NVIDIA GPUs - A detailed overview[2] Stokke, K.R. et. al., 2015. Why Race-to-Finish is Energy-Inefficient for Continuous Multimedia Workloads.[3] http://mlab.no/blog/2015/08/a-peek-in-the-lab-tegra-k1-power-and-voltage-measurements/
• Surprisingly hard• Few tools to measure power
• We use an external power source and measurement unit
• Keithley K2280-S• 100 nA precision, high sampling rate• For details and code, check our paper[2] and
blog[3]
• VGA BIOS dumps[1] reveal rail measurement sensors (I2C) on mostNVIDIA GPUs
• Reading them breaks GPUs and hangs Linux
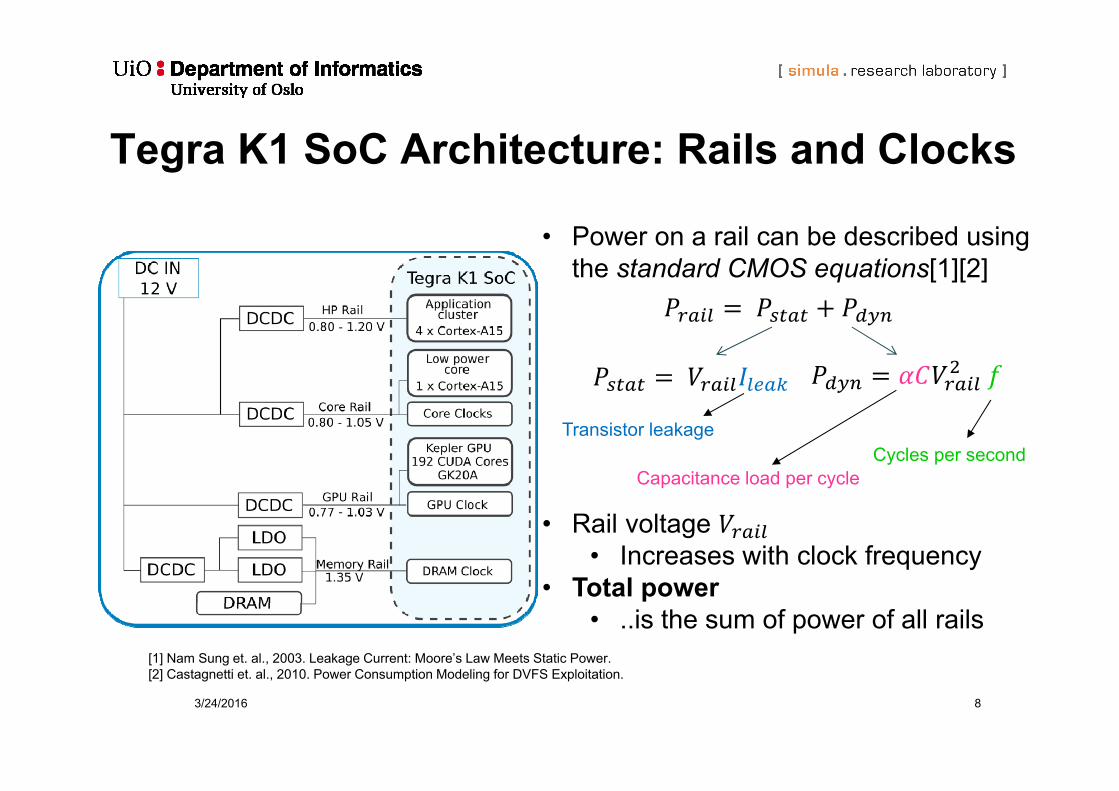
Tegra K1 SoC Architecture: Rails and Clocks
3/24/2016 8
• Power on a rail can be described using the standard CMOS equations[1][2]
• Rail voltage • Increases with clock frequency
• Total power• ..is the sum of power of all rails
Transistor leakage
Capacitance load per cycleCycles per second
[1] Nam Sung et. al., 2003. Leakage Current: Moore’s Law Meets Static Power.[2] Castagnetti et. al., 2010. Power Consumption Modeling for DVFS Exploitation.
Tegra K1 SoC Architecture: Rails and Clocks
3/24/2016 9
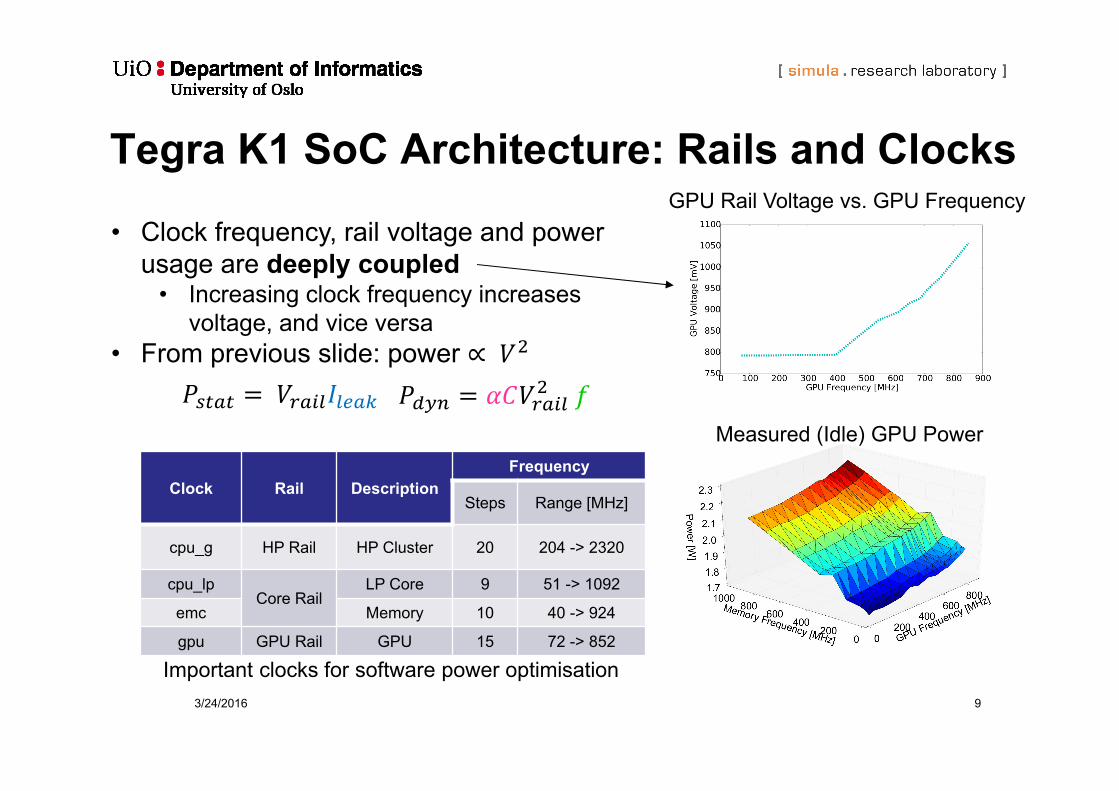
• Clock frequency, rail voltage and power usage are deeply coupled
• Increasing clock frequency increases voltage, and vice versa
• From previous slide: power ∝
Measured (Idle) GPU Power
Clock Rail DescriptionFrequency
Steps Range [MHz]
cpu_g HP Rail HP Cluster 20 204 -> 2320
cpu_lpCore Rail
LP Core 9 51 -> 1092
emc Memory 10 40 -> 924
gpu GPU Rail GPU 15 72 -> 852
Important clocks for software power optimisation
GPU Rail Voltage vs. GPU Frequency
Tegra K1 SoC Architecture: Rails and Clocks
3/24/2016 10
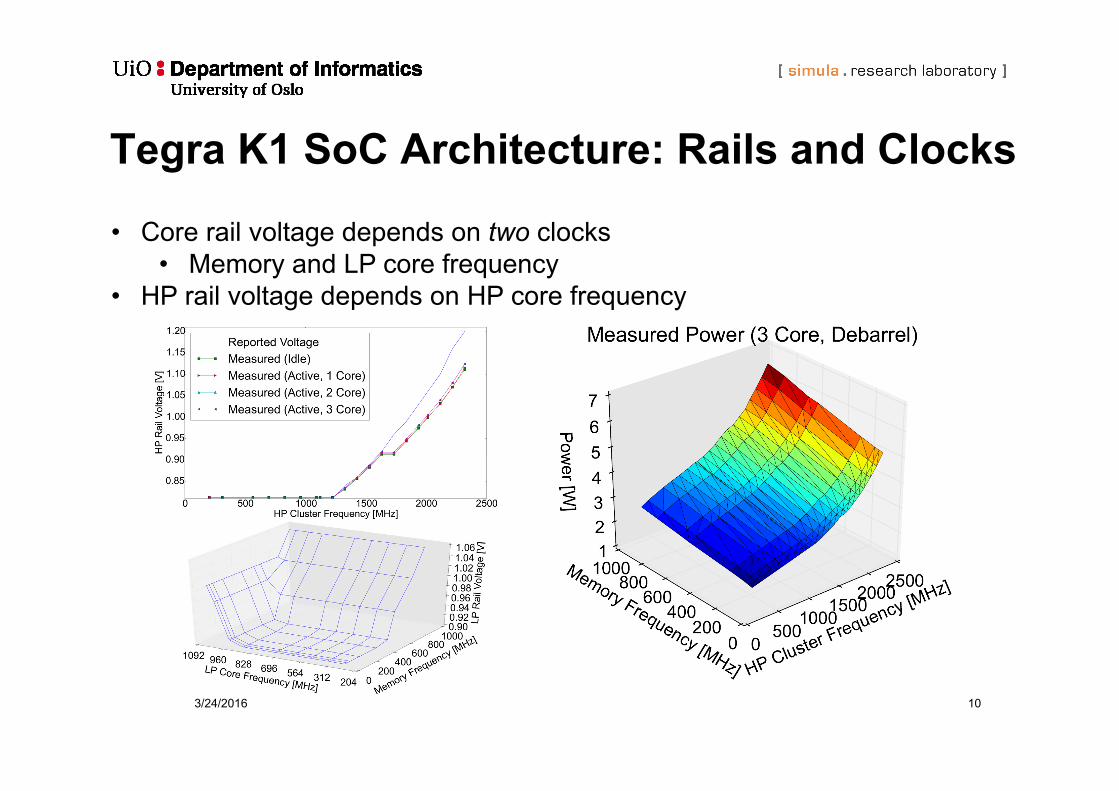
• Core rail voltage depends on two clocks• Memory and LP core frequency
• HP rail voltage depends on HP core frequency
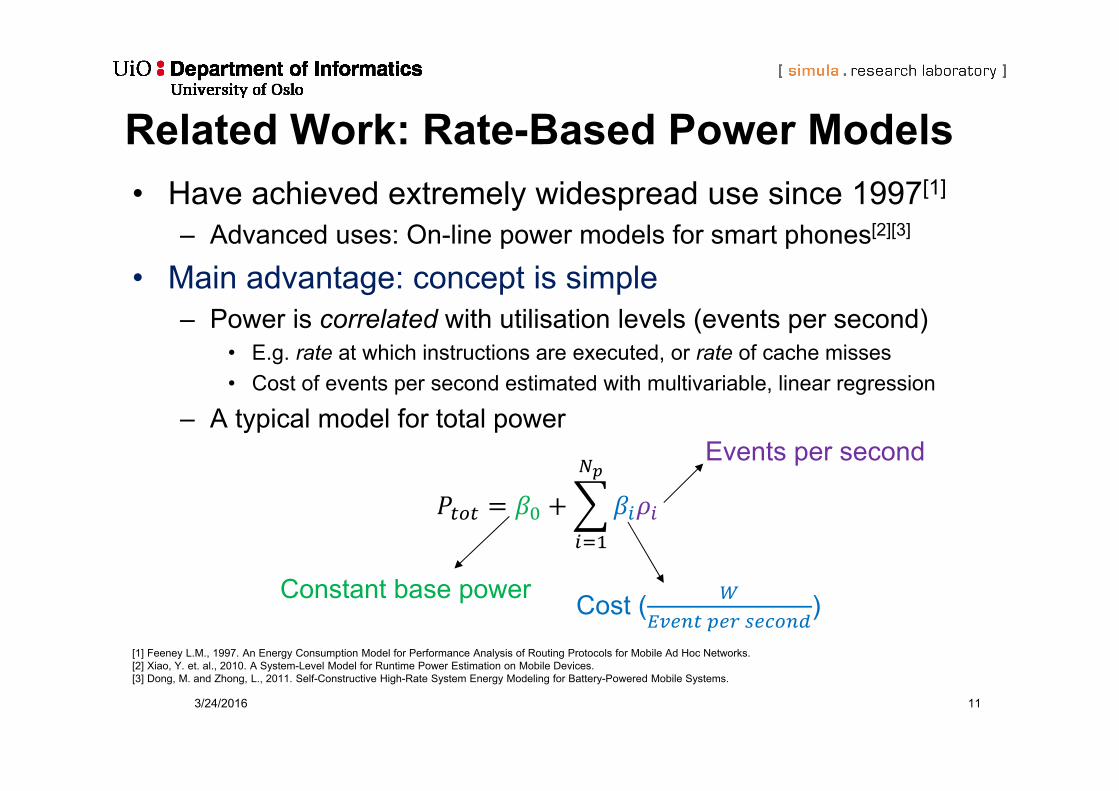
Related Work: Rate-Based Power Models• Have achieved extremely widespread use since 1997[1]
– Advanced uses: On-line power models for smart phones[2][3]
• Main advantage: concept is simple– Power is correlated with utilisation levels (events per second)
• E.g. rate at which instructions are executed, or rate of cache misses• Cost of events per second estimated with multivariable, linear regression
– A typical model for total power
3/24/2016 11
[1] Feeney L.M., 1997. An Energy Consumption Model for Performance Analysis of Routing Protocols for Mobile Ad Hoc Networks.[2] Xiao, Y. et. al., 2010. A System-Level Model for Runtime Power Estimation on Mobile Devices.[3] Dong, M. and Zhong, L., 2011. Self-Constructive High-Rate System Energy Modeling for Battery-Powered Mobile Systems.
Events per second
Cost (
)Constant base power
A Rate-Based Power Model for the Tegra K1
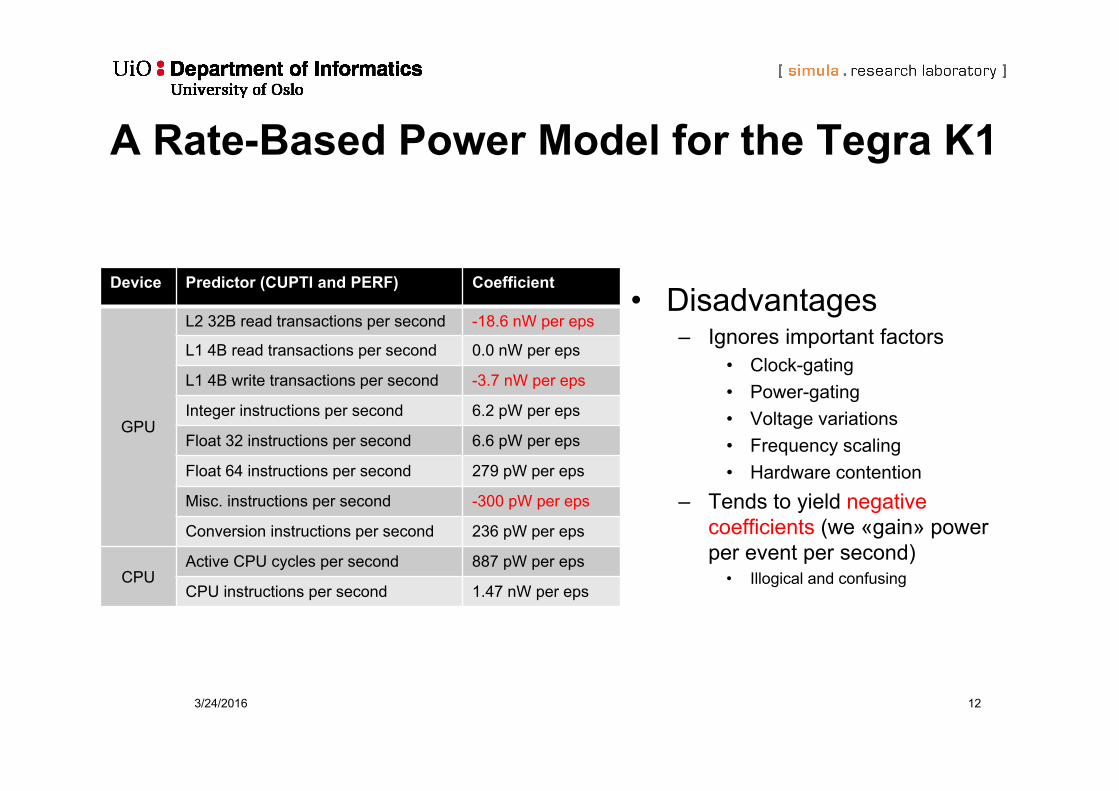
• Disadvantages– Ignores important factors
• Clock-gating• Power-gating• Voltage variations• Frequency scaling• Hardware contention
– Tends to yield negative coefficients (we «gain» power per event per second)
• Illogical and confusing
3/24/2016 12
Device Predictor (CUPTI and PERF) Coefficient
GPU
L2 32B read transactions per second -18.6 nW per eps
L1 4B read transactions per second 0.0 nW per eps
L1 4B write transactions per second -3.7 nW per eps
Integer instructions per second 6.2 pW per eps
Float 32 instructions per second 6.6 pW per eps
Float 64 instructions per second 279 pW per eps
Misc. instructions per second -300 pW per eps
Conversion instructions per second 236 pW per eps
CPUActive CPU cycles per second 887 pW per eps
CPU instructions per second 1.47 nW per eps
A Rate-Based Power Model for the Tegra K1
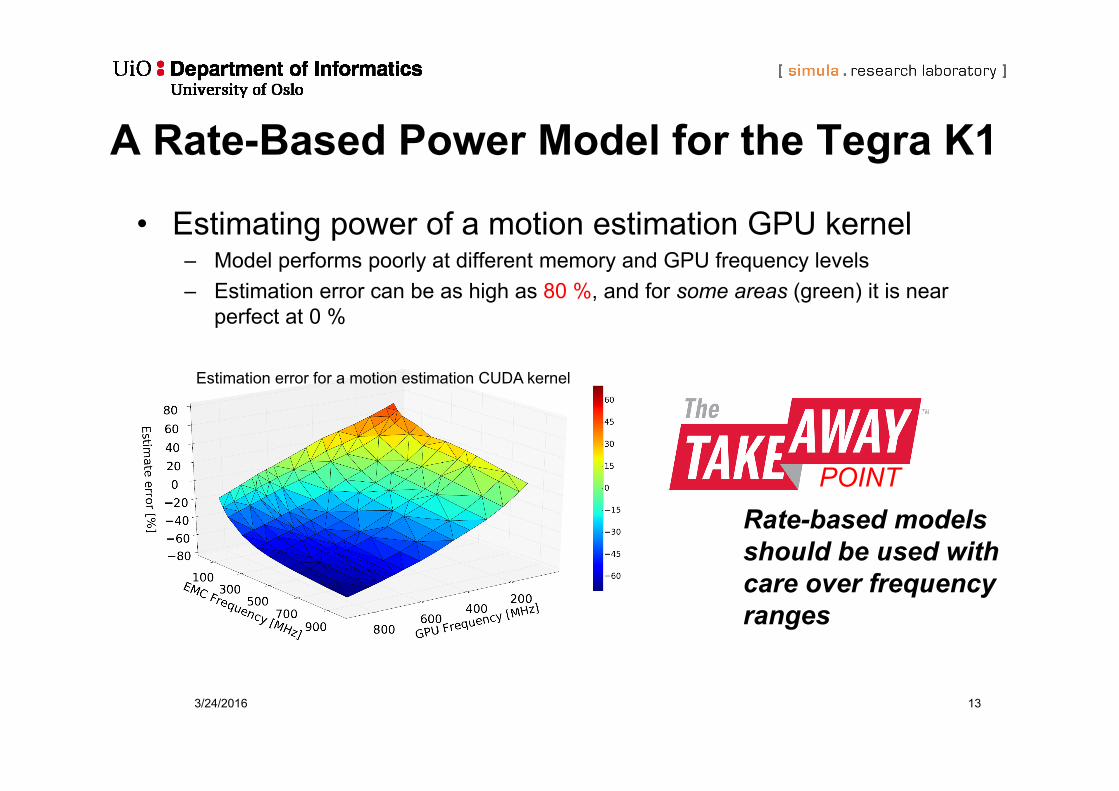
• Estimating power of a motion estimation GPU kernel– Model performs poorly at different memory and GPU frequency levels– Estimation error can be as high as 80 %, and for some areas (green) it is near
perfect at 0 %
3/24/2016 13
POINTRate-based models should be used with care over frequency ranges
Estimation error for a motion estimation CUDA kernel
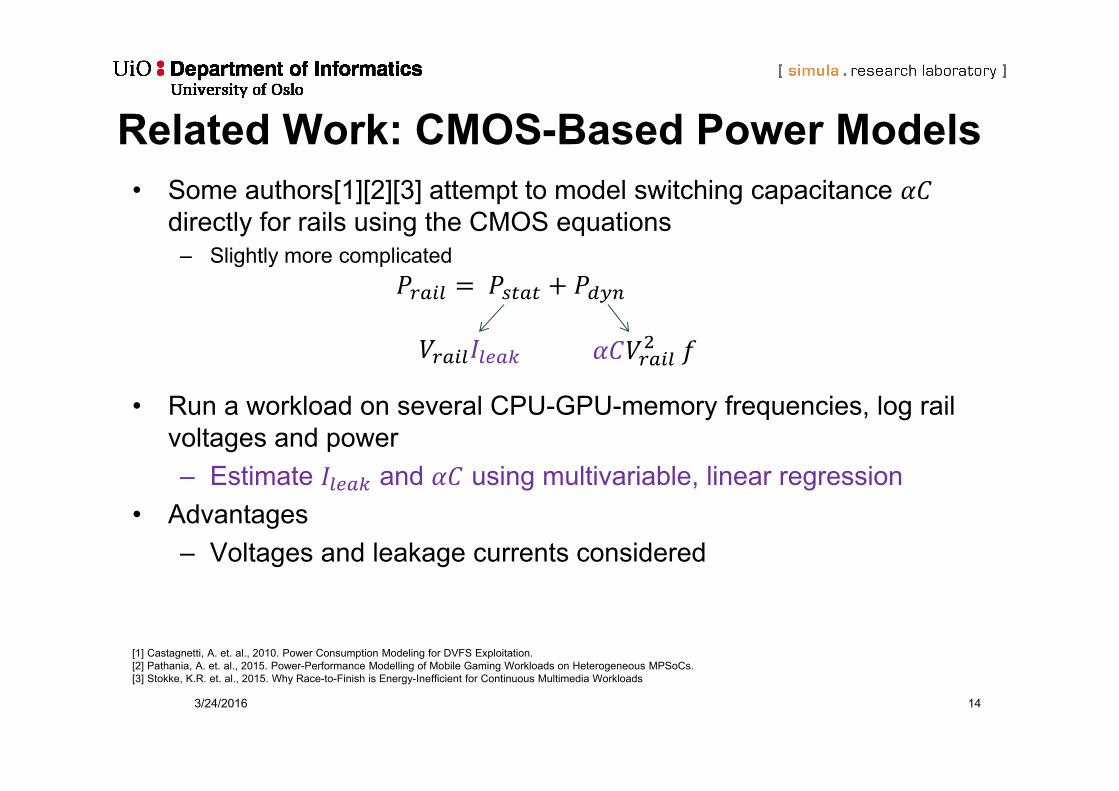
Related Work: CMOS-Based Power Models• Some authors[1][2][3] attempt to model switching capacitance
directly for rails using the CMOS equations– Slightly more complicated
• Run a workload on several CPU-GPU-memory frequencies, log rail voltages and power– Estimate and using multivariable, linear regression
• Advantages– Voltages and leakage currents considered
3/24/2016 14
[1] Castagnetti, A. et. al., 2010. Power Consumption Modeling for DVFS Exploitation.[2] Pathania, A. et. al., 2015. Power-Performance Modelling of Mobile Gaming Workloads on Heterogeneous MPSoCs.[3] Stokke, K.R. et. al., 2015. Why Race-to-Finish is Energy-Inefficient for Continuous Multimedia Workloads
Modelling Switching Capacitance
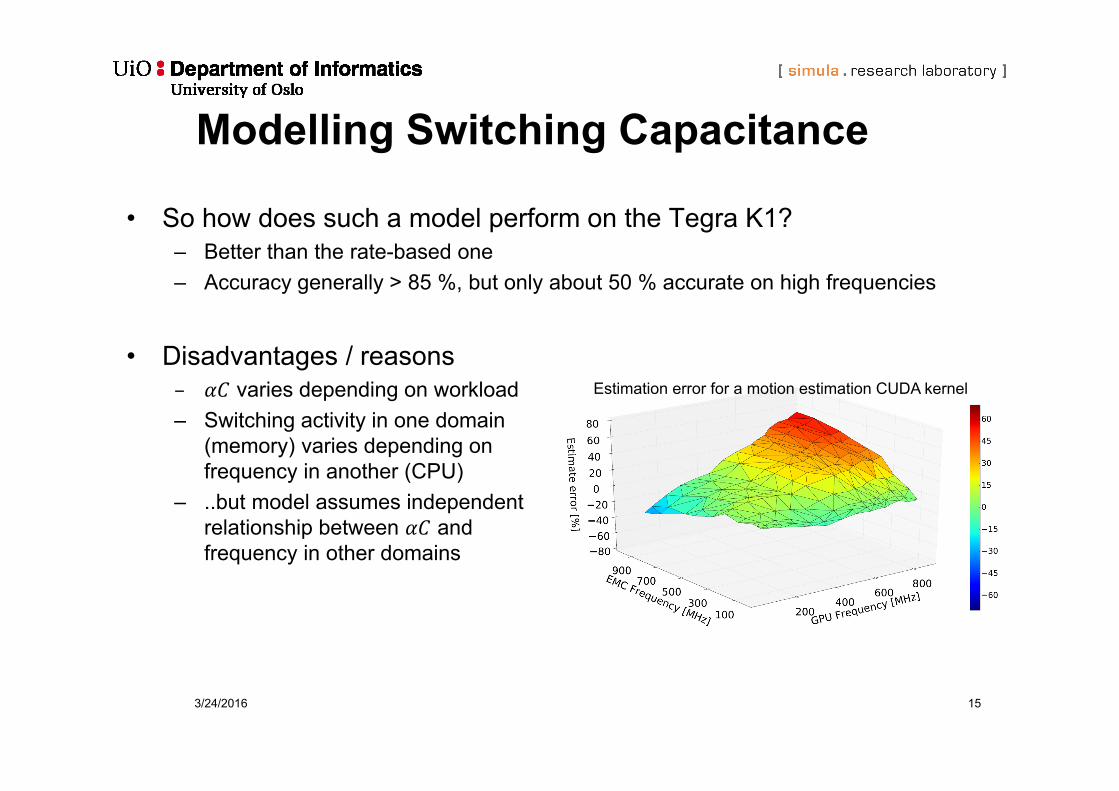
• So how does such a model perform on the Tegra K1?– Better than the rate-based one– Accuracy generally > 85 %, but only about 50 % accurate on high frequencies
• Disadvantages / reasons– varies depending on workload– Switching activity in one domain
(memory) varies depending on frequency in another (CPU)
– ..but model assumes independentrelationship between andfrequency in other domains
3/24/2016 15
Estimation error for a motion estimation CUDA kernel
Building High-Precision Power Models
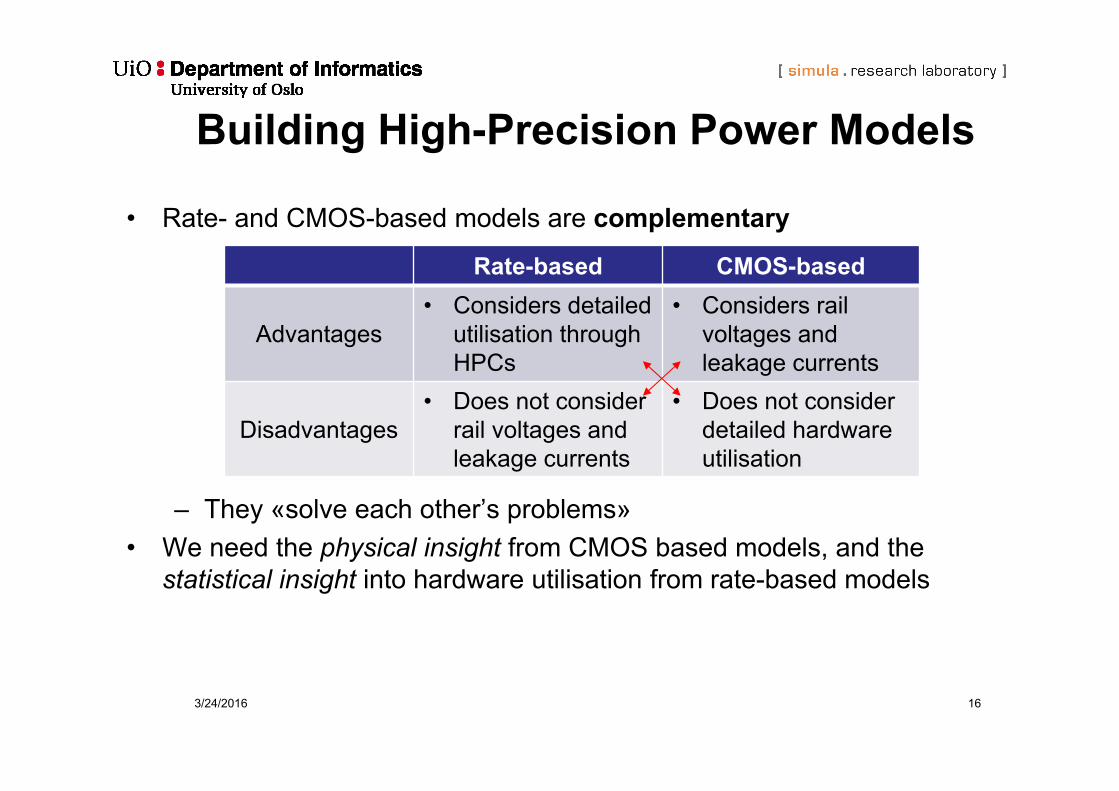
• Rate- and CMOS-based models are complementary
– They «solve each other’s problems»• We need the physical insight from CMOS based models, and the
statistical insight into hardware utilisation from rate-based models
3/24/2016 16
Rate-based CMOS-based
Advantages• Considers detailed
utilisation through HPCs
• Considers rail voltages and leakage currents
Disadvantages• Does not consider
rail voltages and leakage currents
• Does not consider detailed hardware utilisation
Building High-Precision Power Models
3/24/2016 17
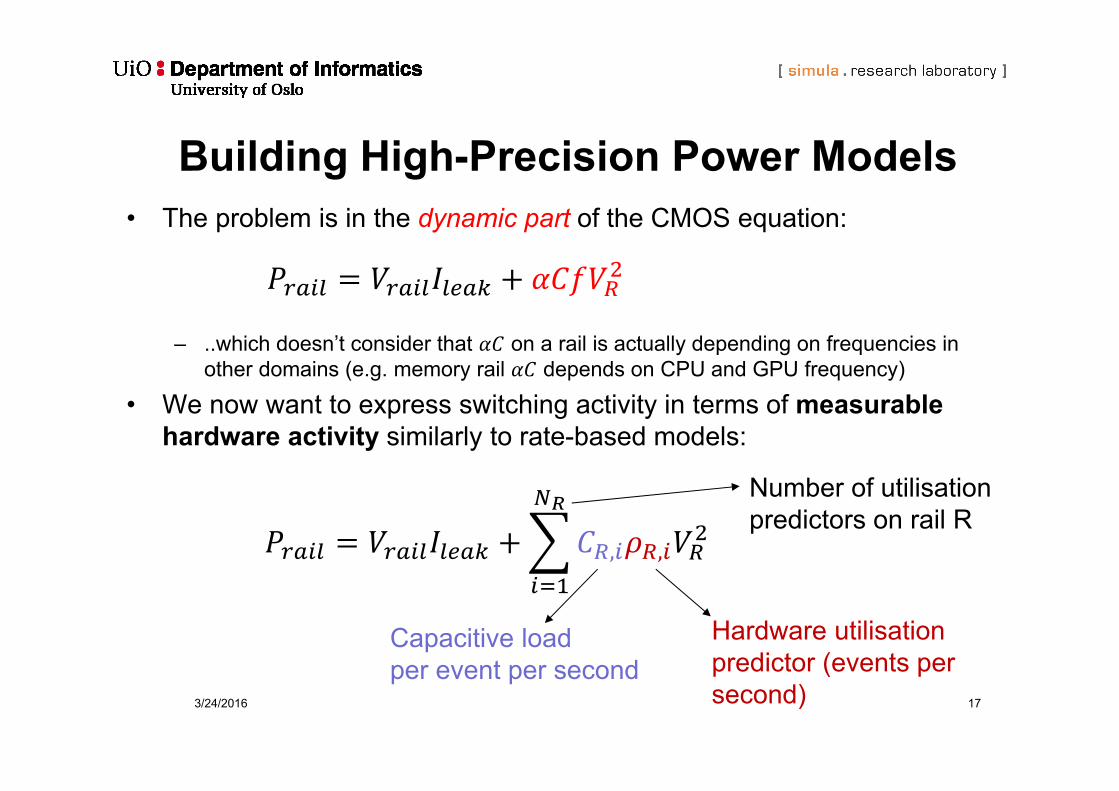
• The problem is in the dynamic part of the CMOS equation:
– ..which doesn’t consider that on a rail is actually depending on frequencies in other domains (e.g. memory rail depends on CPU and GPU frequency)
• We now want to express switching activity in terms of measurable hardware activity similarly to rate-based models:
, ,
Number of utilisationpredictors on rail R
Capacitive loadper event per second
Hardware utilisation predictor (events per second)
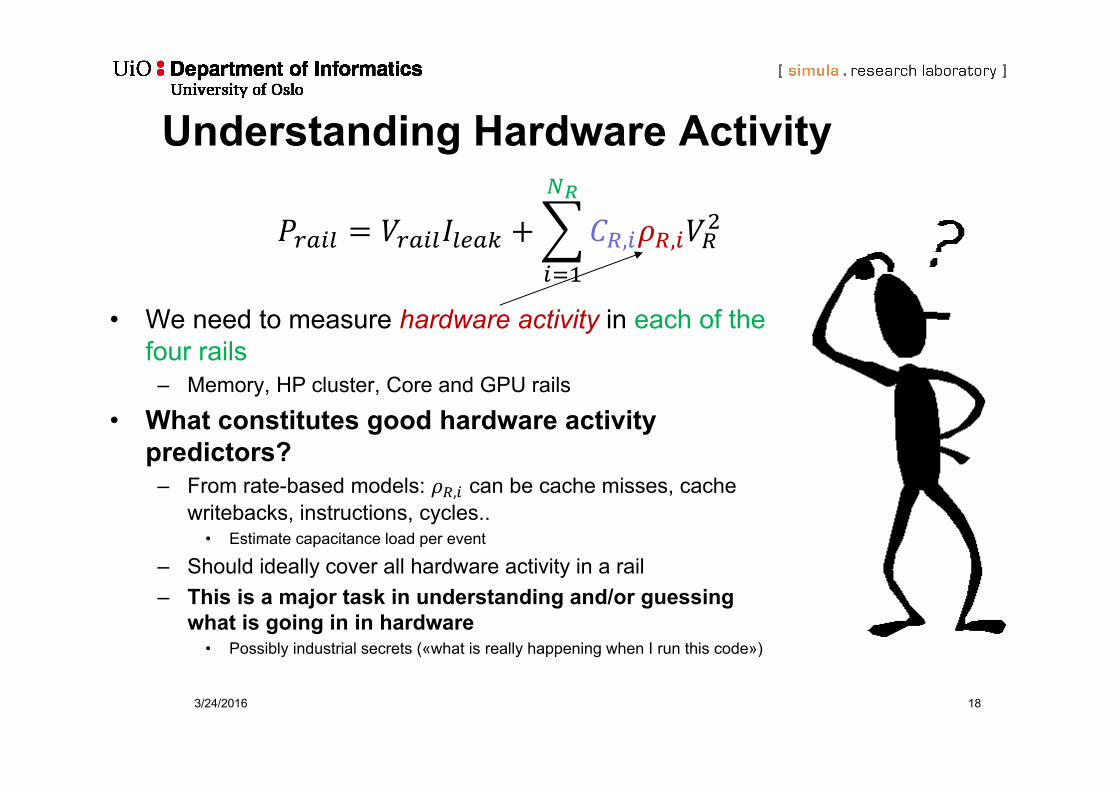
• We need to measure hardware activity in each of the four rails
– Memory, HP cluster, Core and GPU rails
• What constitutes good hardware activity predictors?
– From rate-based models: , can be cache misses, cache writebacks, instructions, cycles..
• Estimate capacitance load per event
– Should ideally cover all hardware activity in a rail– This is a major task in understanding and/or guessing
what is going in in hardware• Possibly industrial secrets («what is really happening when I run this code»)
3/24/2016 18
Understanding Hardware Activity
, ,
• In addition to switching activity, there are a number of power management mechanisms that must be taken into account– Clock gating effectively shuts off («gates») clock distribution into circuits or
parts of the circuits– Power gating shuts of supply to circuits within rails (clock gating often implied
but not always)– Rail gating shuts off power to entire rails, for example
• GPU rail is gated when inactive for more than 500 ms• CPU HP rail is gated when kernel driver detects inactivity
• «THE» challenge: To understand when and how circuits are being gated– GPU is the hardest. No technical details about internal workings– Hard to trace gating duration (we come back to this)
3/24/2016 19
Understanding Hardware Activity
3/24/2016 20
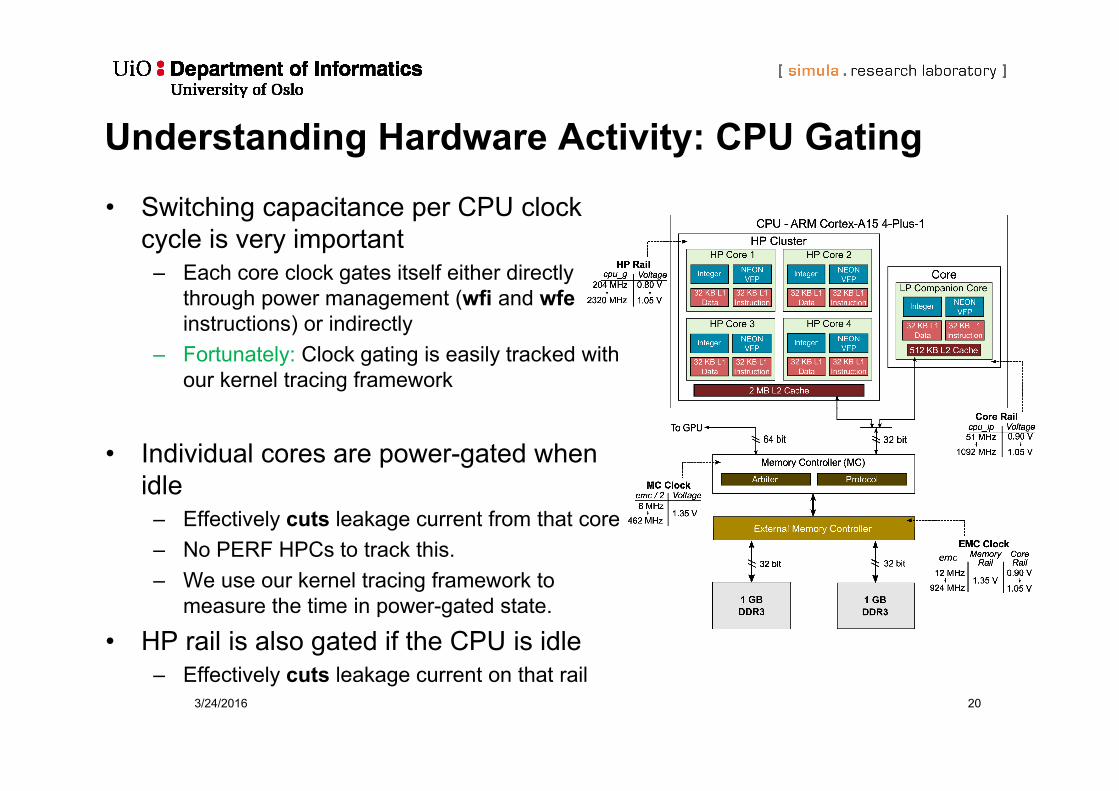
Understanding Hardware Activity: CPU Gating
• Switching capacitance per CPU clock cycle is very important
– Each core clock gates itself either directly through power management (wfi and wfeinstructions) or indirectly
– Fortunately: Clock gating is easily tracked with our kernel tracing framework
• Individual cores are power-gated when idle
– Effectively cuts leakage current from that core– No PERF HPCs to track this. – We use our kernel tracing framework to
measure the time in power-gated state.
• HP rail is also gated if the CPU is idle– Effectively cuts leakage current on that rail
3/24/2016 21
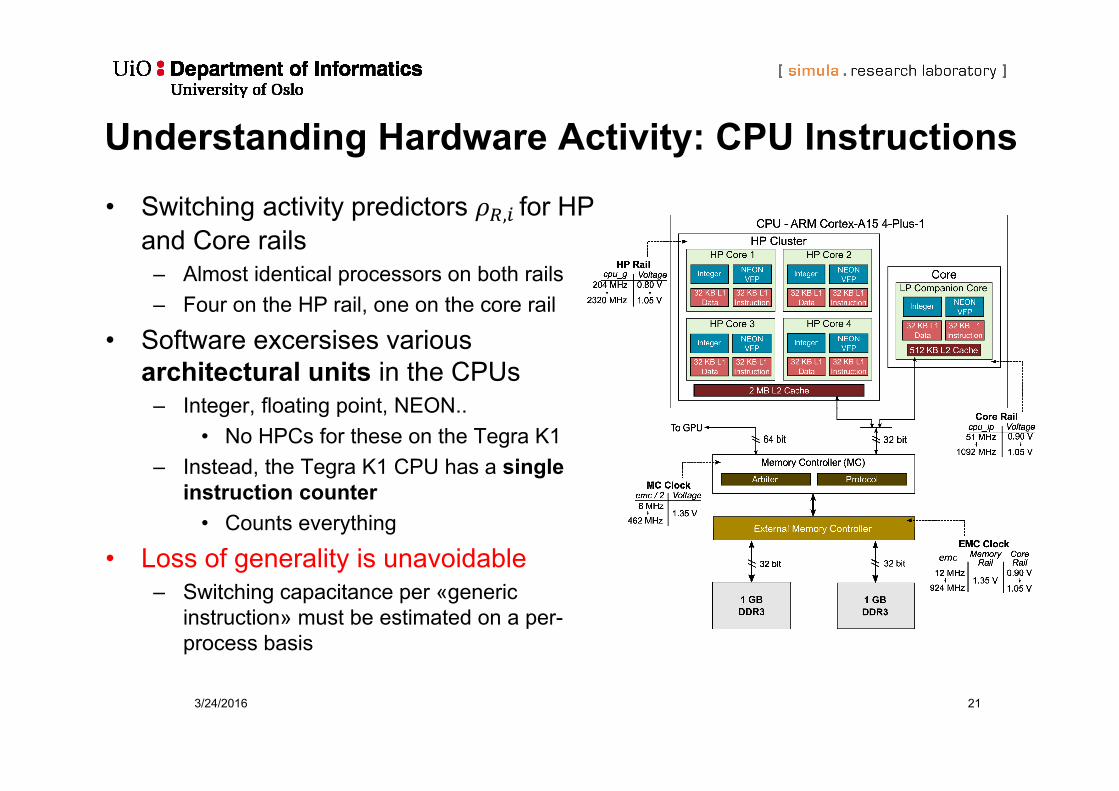
Understanding Hardware Activity: CPU Instructions
• Switching activity predictors , for HP and Core rails
– Almost identical processors on both rails– Four on the HP rail, one on the core rail
• Software excersises various architectural units in the CPUs
– Integer, floating point, NEON..• No HPCs for these on the Tegra K1
– Instead, the Tegra K1 CPU has a single instruction counter
• Counts everything
• Loss of generality is unavoidable– Switching capacitance per «generic
instruction» must be estimated on a per-process basis
3/24/2016 22
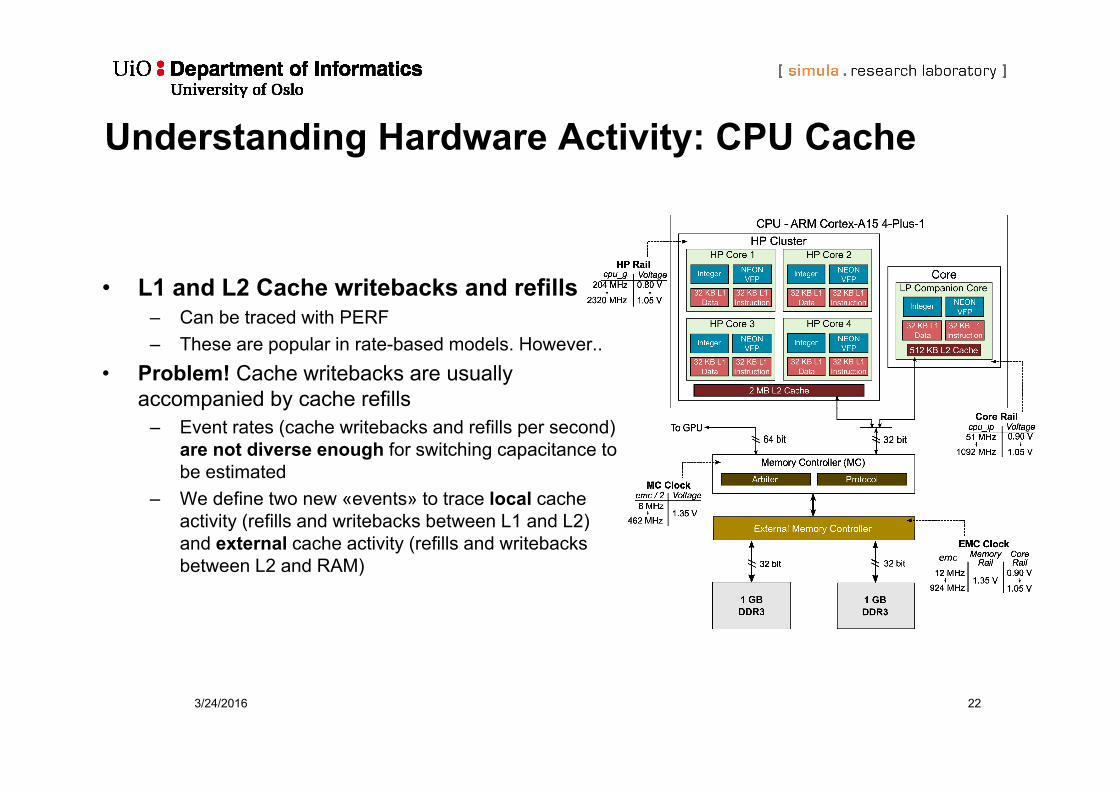
Understanding Hardware Activity: CPU Cache
• L1 and L2 Cache writebacks and refills– Can be traced with PERF– These are popular in rate-based models. However..
• Problem! Cache writebacks are usually accompanied by cache refills
– Event rates (cache writebacks and refills per second)are not diverse enough for switching capacitance to be estimated
– We define two new «events» to trace local cache activity (refills and writebacks between L1 and L2) and external cache activity (refills and writebacks between L2 and RAM)
3/24/2016 23
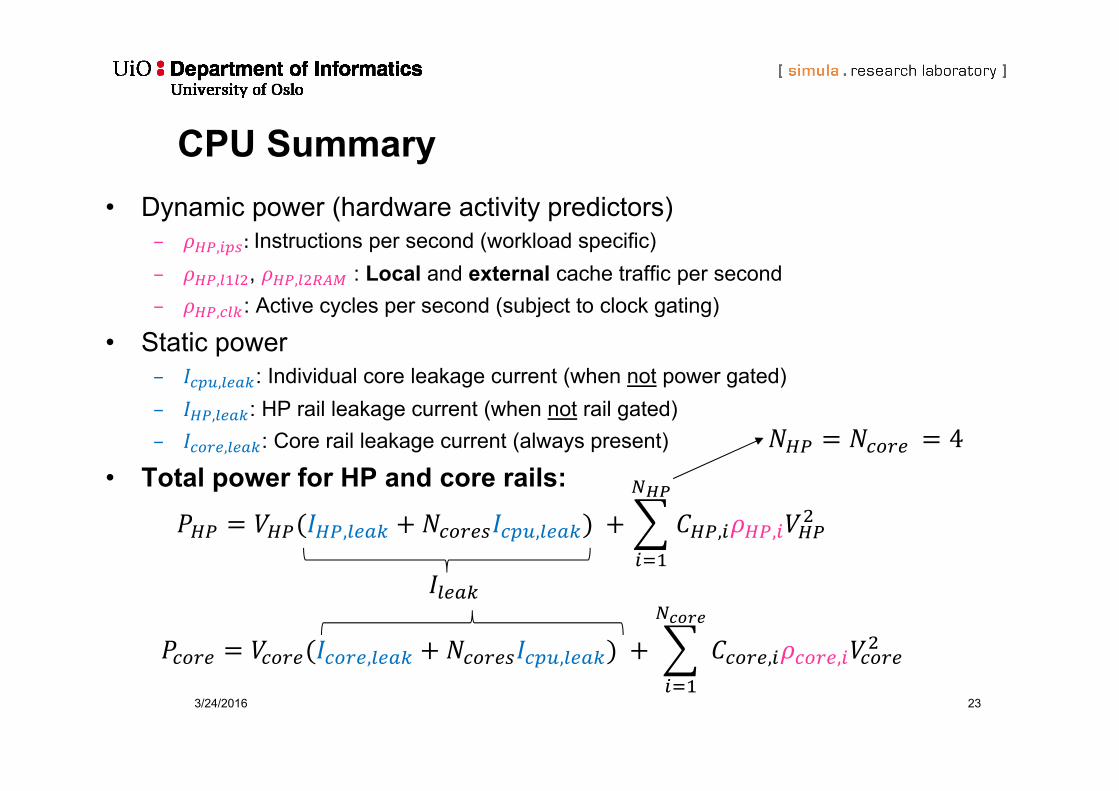
CPU Summary• Dynamic power (hardware activity predictors)
– , :Instructions per second (workload specific)– , , , : Local and external cache traffic per second– , : Active cycles per second (subject to clock gating)
• Static power– , : Individual core leakage current (when not power gated)– , : HP rail leakage current (when not rail gated)– , : Core rail leakage current (always present)
• Total power for HP and core rails:
, , , ,
, , , ,
4
3/24/2016 24
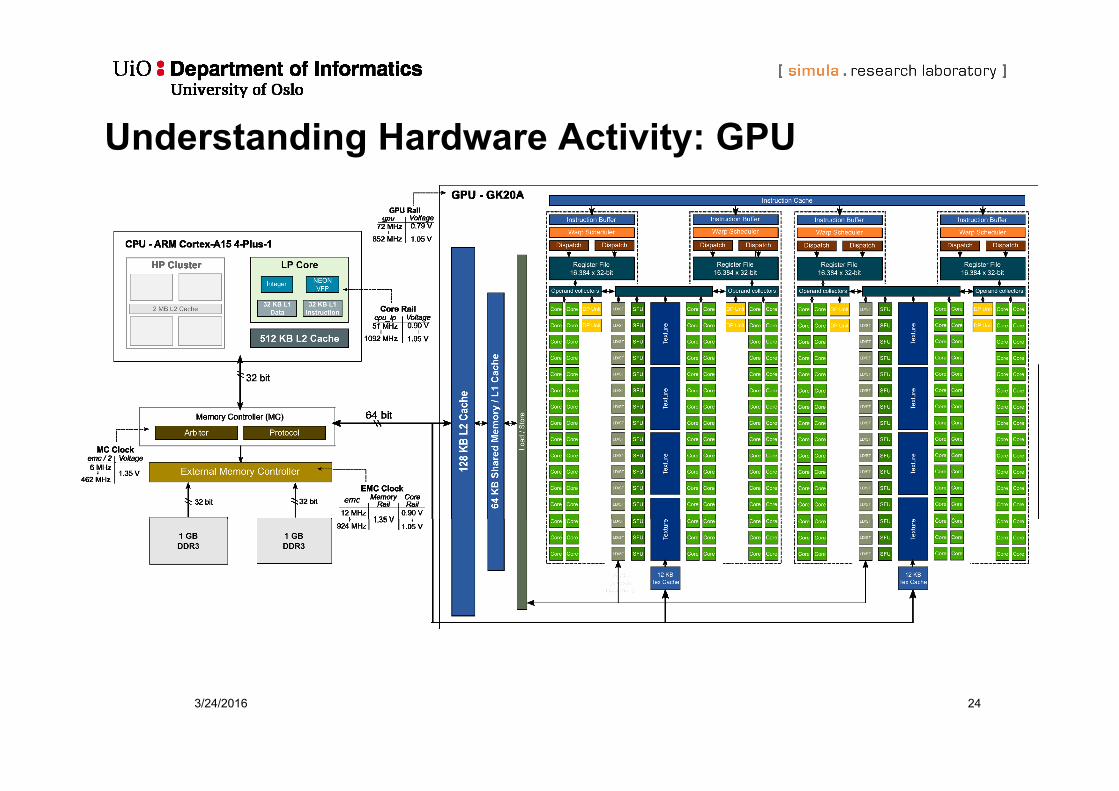
Understanding Hardware Activity: GPU
3/24/2016 25
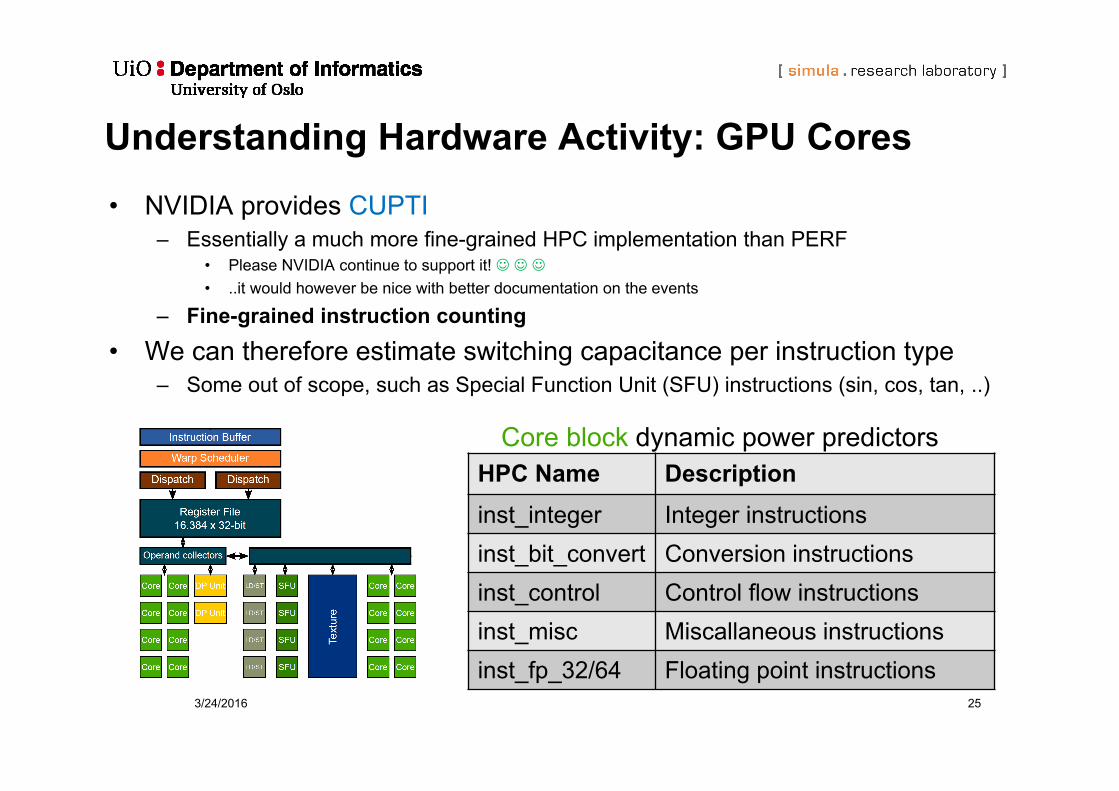
Understanding Hardware Activity: GPU Cores• NVIDIA provides CUPTI
– Essentially a much more fine-grained HPC implementation than PERF• Please NVIDIA continue to support it! • ..it would however be nice with better documentation on the events
– Fine-grained instruction counting• We can therefore estimate switching capacitance per instruction type
– Some out of scope, such as Special Function Unit (SFU) instructions (sin, cos, tan, ..)
HPC Name Descriptioninst_integer Integer instructionsinst_bit_convert Conversion instructionsinst_control Control flow instructionsinst_misc Miscallaneous instructionsinst_fp_32/64 Floating point instructions
Core block dynamic power predictors
3/24/2016 26
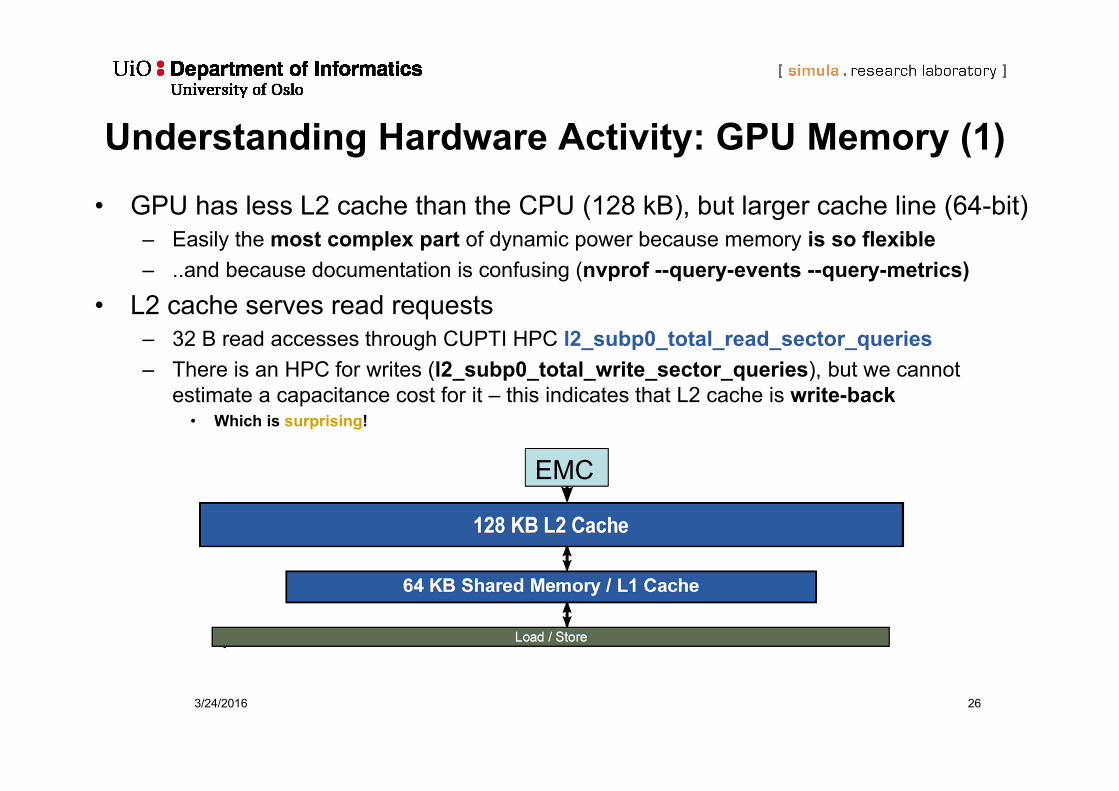
Understanding Hardware Activity: GPU Memory (1)• GPU has less L2 cache than the CPU (128 kB), but larger cache line (64-bit)
– Easily the most complex part of dynamic power because memory is so flexible– ..and because documentation is confusing (nvprof --query-events --query-metrics)
• L2 cache serves read requests– 32 B read accesses through CUPTI HPC l2_subp0_total_read_sector_queries– There is an HPC for writes (l2_subp0_total_write_sector_queries), but we cannot
estimate a capacitance cost for it – this indicates that L2 cache is write-back• Which is surprising!
EMC
3/24/2016 27
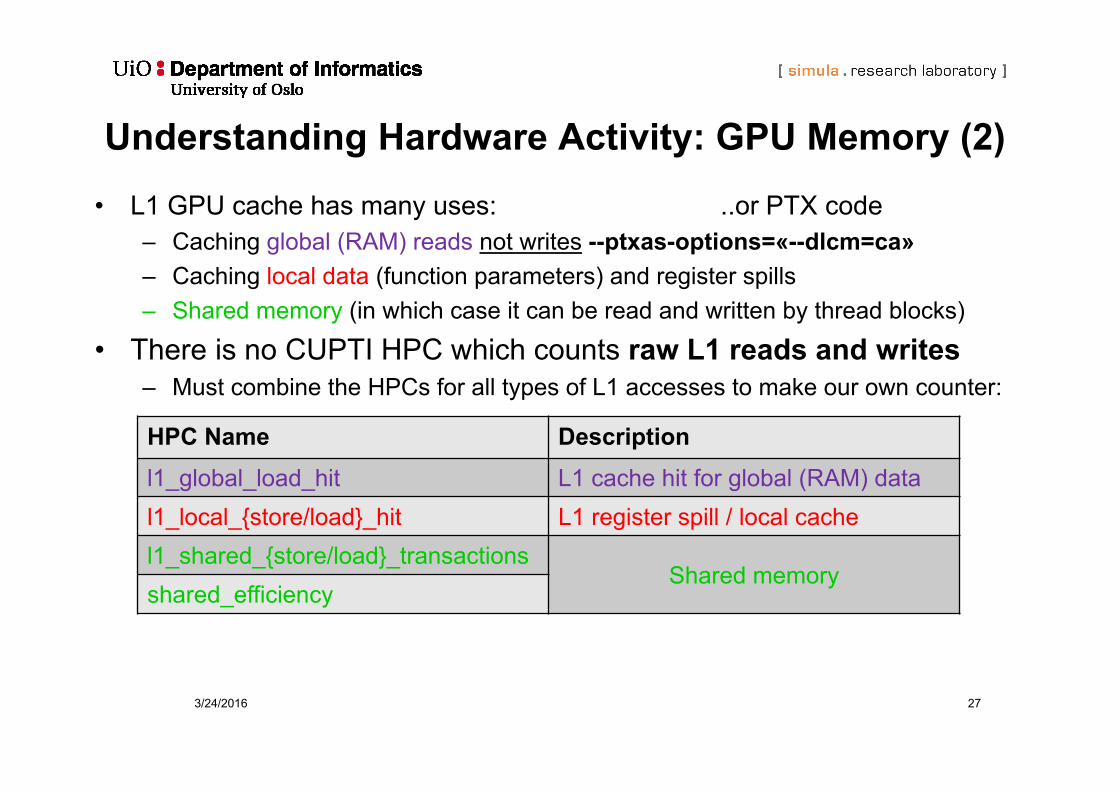
Understanding Hardware Activity: GPU Memory (2)• L1 GPU cache has many uses:
– Caching global (RAM) reads not writes --ptxas-options=«--dlcm=ca»– Caching local data (function parameters) and register spills– Shared memory (in which case it can be read and written by thread blocks)
• There is no CUPTI HPC which counts raw L1 reads and writes– Must combine the HPCs for all types of L1 accesses to make our own counter:
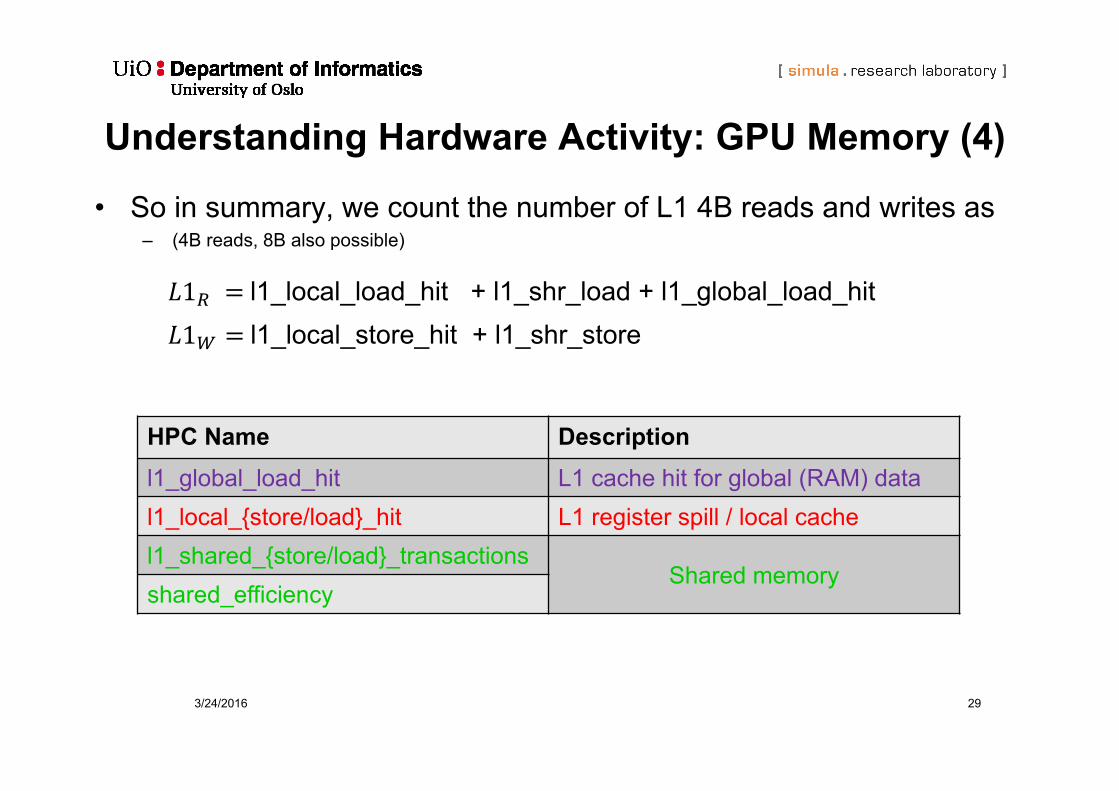
HPC Name Descriptionl1_global_load_hit L1 cache hit for global (RAM) datal1_local_{store/load}_hit L1 register spill / local cachel1_shared_{store/load}_transactions
Shared memoryshared_efficiency
..or PTX code
3/24/2016 28
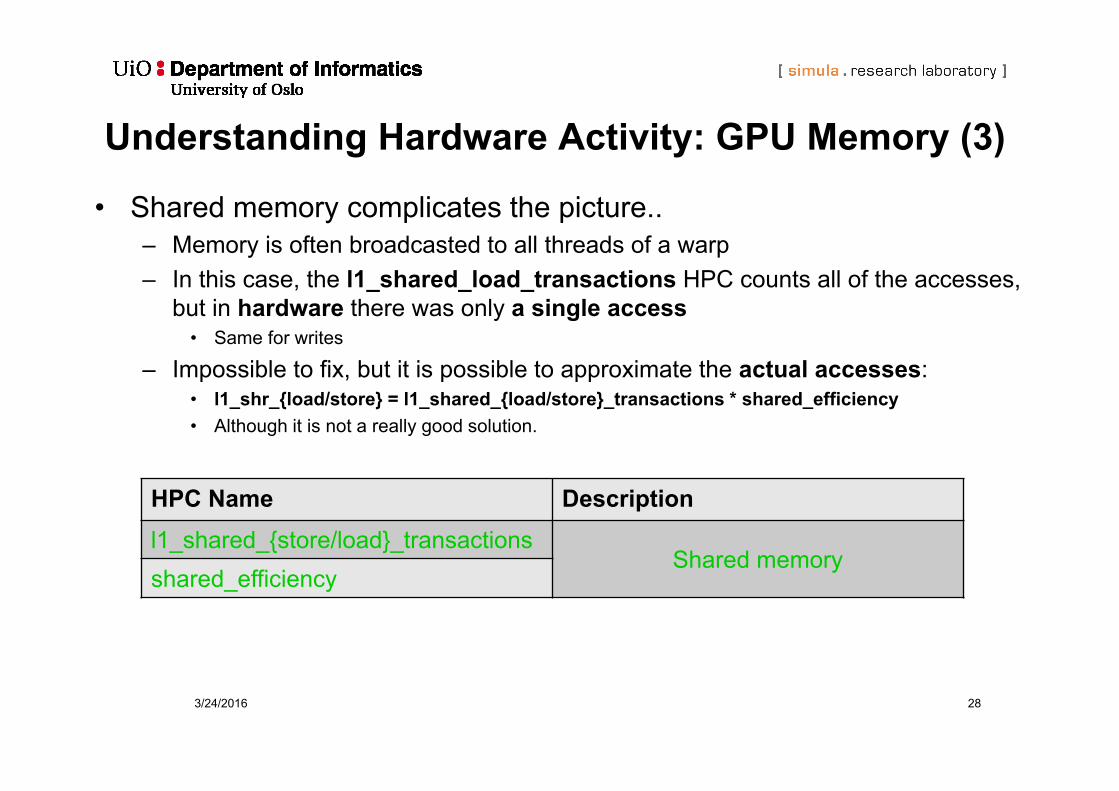
Understanding Hardware Activity: GPU Memory (3)
• Shared memory complicates the picture..– Memory is often broadcasted to all threads of a warp– In this case, the l1_shared_load_transactions HPC counts all of the accesses,
but in hardware there was only a single access• Same for writes
– Impossible to fix, but it is possible to approximate the actual accesses:• l1_shr_{load/store} = l1_shared_{load/store}_transactions * shared_efficiency• Although it is not a really good solution.
HPC Name Descriptionl1_shared_{store/load}_transactions
Shared memoryshared_efficiency
3/24/2016 29
Understanding Hardware Activity: GPU Memory (4)
• So in summary, we count the number of L1 4B reads and writes as– (4B reads, 8B also possible)
1 l1_local_load_hit + l1_shr_load + l1_global_load_hit1 l1_local_store_hit + l1_shr_store
HPC Name Descriptionl1_global_load_hit L1 cache hit for global (RAM) datal1_local_{store/load}_hit L1 register spill / local cachel1_shared_{store/load}_transactions
Shared memoryshared_efficiency
3/24/2016 30
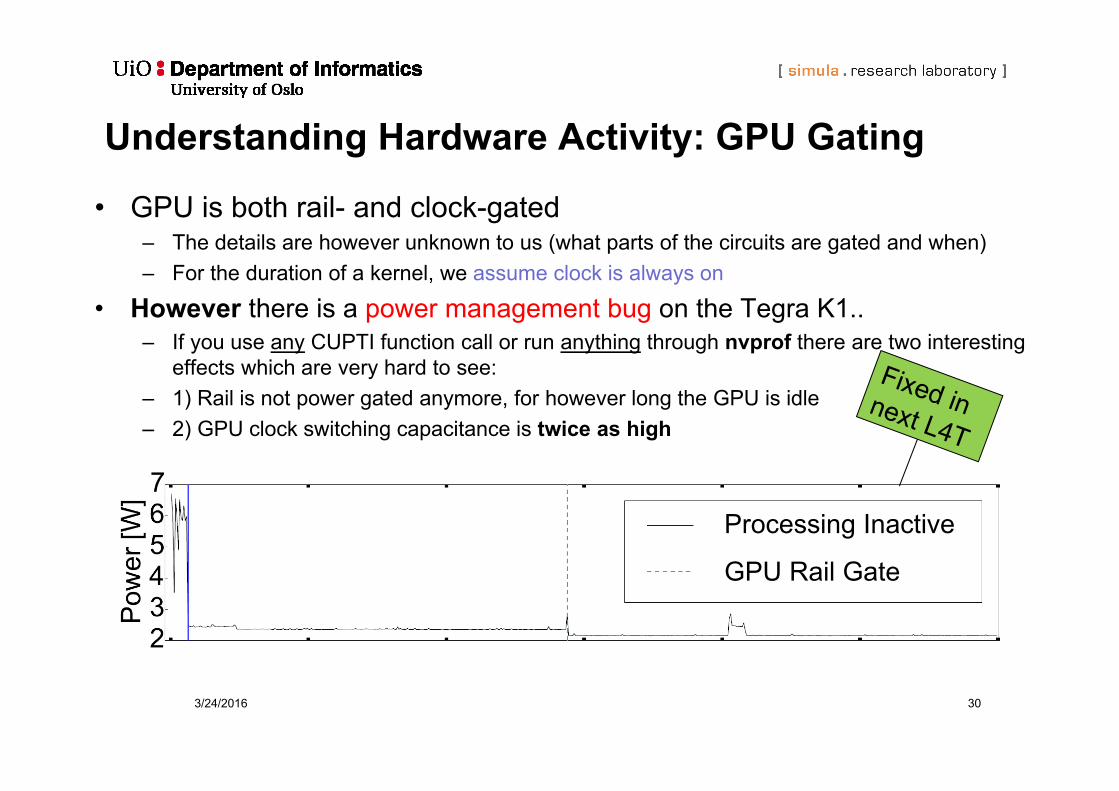
Understanding Hardware Activity: GPU Gating
• GPU is both rail- and clock-gated– The details are however unknown to us (what parts of the circuits are gated and when)– For the duration of a kernel, we assume clock is always on
• However there is a power management bug on the Tegra K1..– If you use any CUPTI function call or run anything through nvprof there are two interesting
effects which are very hard to see:– 1) Rail is not power gated anymore, for however long the GPU is idle– 2) GPU clock switching capacitance is twice as high
Processing Inactive
GPU Rail Gate
3/24/2016 31
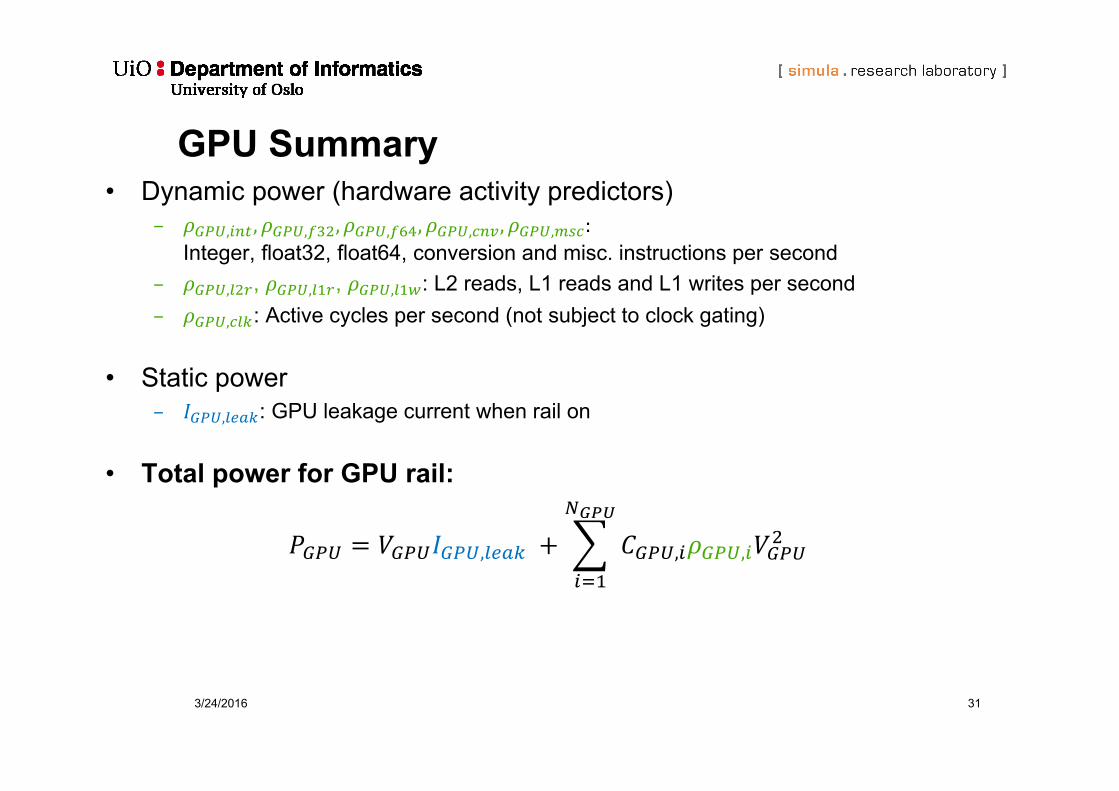
GPU Summary• Dynamic power (hardware activity predictors)
– , , , , , , , , , :Integer, float32, float64, conversion and misc. instructions per second
– , , , , , : L2 reads, L1 reads and L1 writes per second– , : Active cycles per second (not subject to clock gating)
• Static power– , : GPU leakage current when rail on
• Total power for GPU rail:
, , ,
3/24/2016 32
Understanding Hardware Activity: Memory
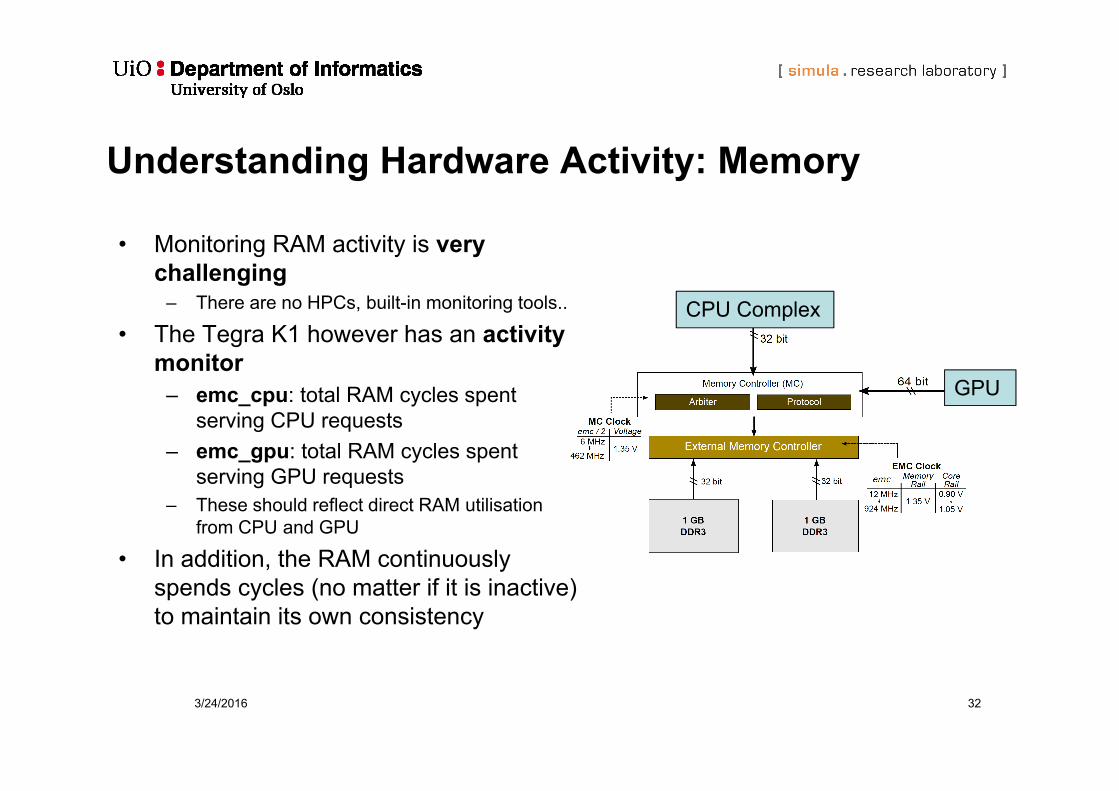
• Monitoring RAM activity is very challenging
– There are no HPCs, built-in monitoring tools..
• The Tegra K1 however has an activity monitor
– emc_cpu: total RAM cycles spent serving CPU requests
– emc_gpu: total RAM cycles spent serving GPU requests
– These should reflect direct RAM utilisation from CPU and GPU
• In addition, the RAM continuously spends cycles (no matter if it is inactive) to maintain its own consistency
CPU Complex
GPU
3/24/2016 33
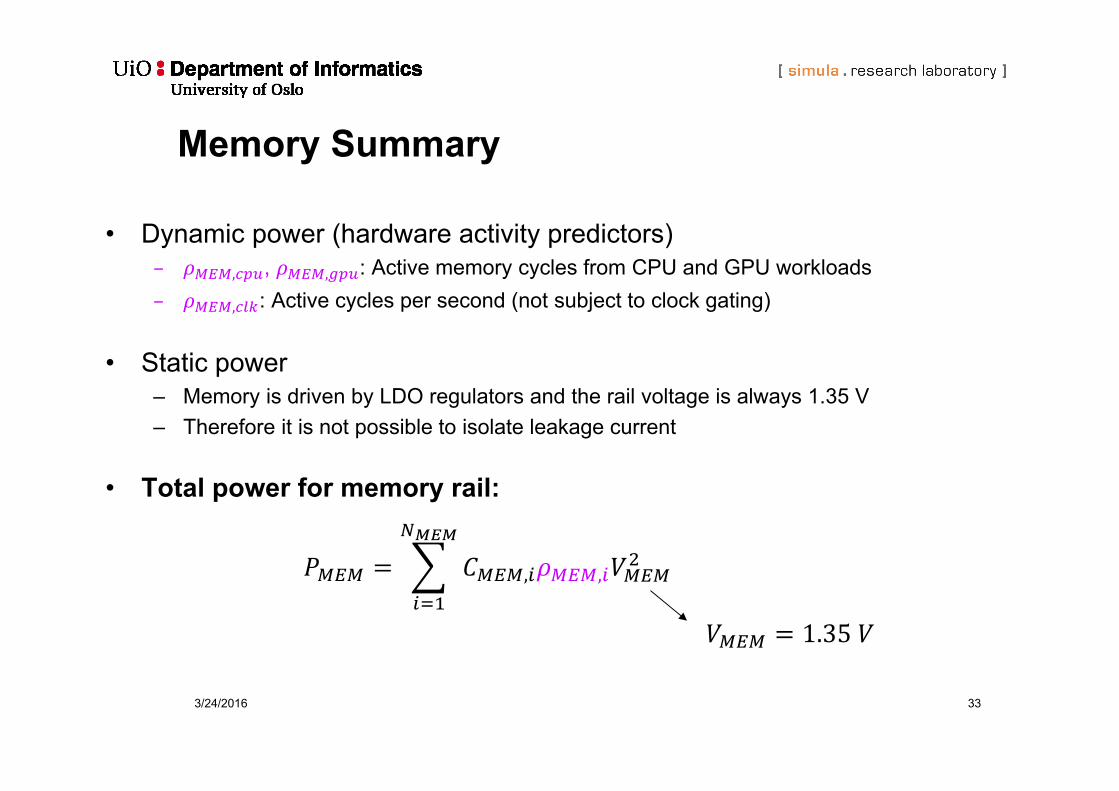
Memory Summary
• Dynamic power (hardware activity predictors)– , , , : Active memory cycles from CPU and GPU workloads– , : Active cycles per second (not subject to clock gating)
• Static power– Memory is driven by LDO regulators and the rail voltage is always 1.35 V– Therefore it is not possible to isolate leakage current
• Total power for memory rail:
, ,
1.35
3/24/2016 34
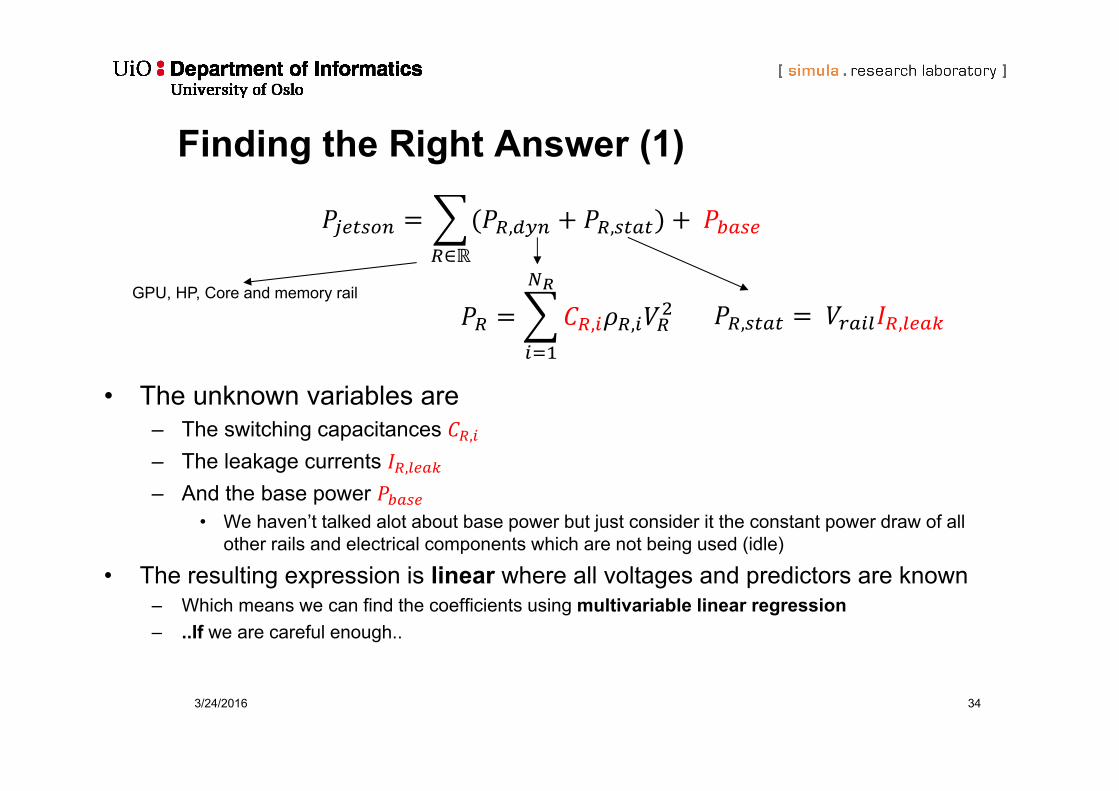
Finding the Right Answer (1)
• The unknown variables are – The switching capacitances ,
– The leakage currents ,
– And the base power • We haven’t talked alot about base power but just consider it the constant power draw of all
other rails and electrical components which are not being used (idle)
• The resulting expression is linear where all voltages and predictors are known– Which means we can find the coefficients using multivariable linear regression– ..If we are careful enough..
, ,∈
GPU, HP, Core and memory rail
, ,, ,
3/24/2016 35
Finding the Right Answer (2)
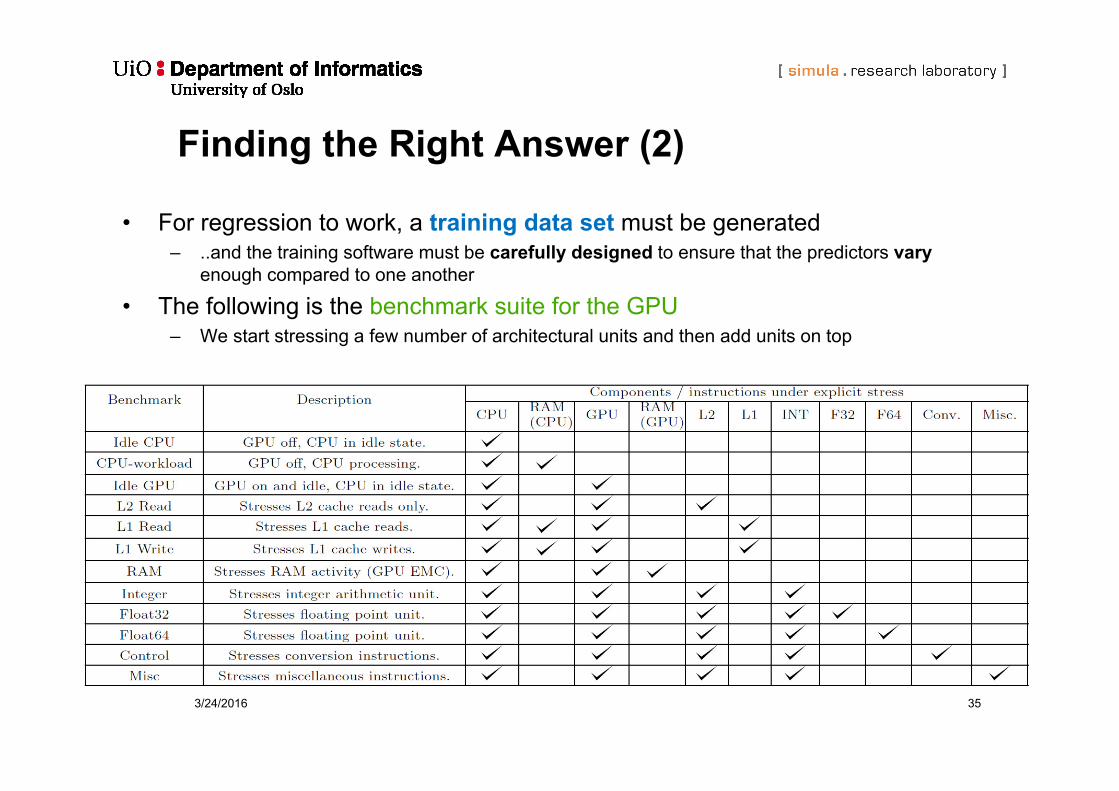
• For regression to work, a training data set must be generated– ..and the training software must be carefully designed to ensure that the predictors vary
enough compared to one another
• The following is the benchmark suite for the GPU – We start stressing a few number of architectural units and then add units on top
3/24/2016 36
Finding the Right Answer (3)
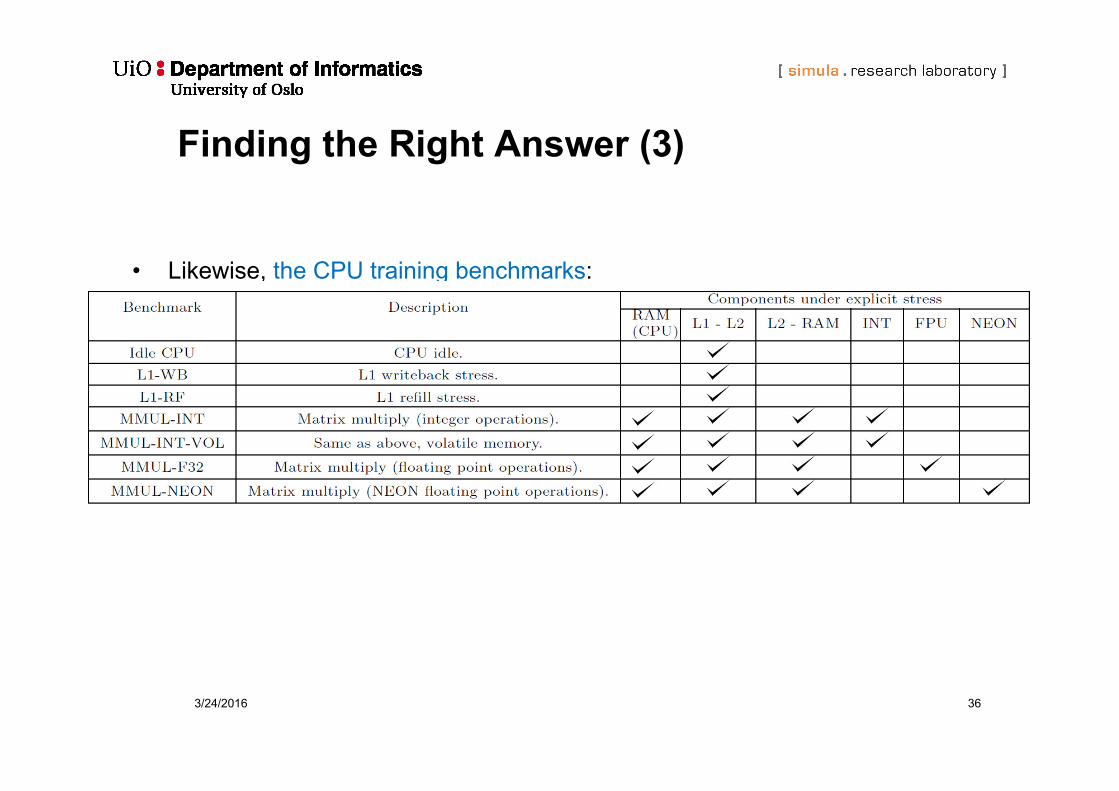
• Likewise, the CPU training benchmarks:
3/24/2016 37
Finding the Right Answer (4)
• All benchmarks are now run over all possible frequency combinations– GPU benchmarks: LP core at 1 GHz, vary GPU and memory
frequences– CPU benchmarks: For all CPU configurations (LP or any number of
HP cores on), vary all CPU and memory frequencies– All predictors are logged
• This is necessary to force variation in rail voltages, which has several advantages:
– It makes it possible to predict leakage currents– It helps create diversity in predictors
• Resulting datasets are quite large (about 2-3000)– But they can be reduced (it is not necessary to run over absolutely all frequencies)
3/24/2016 38
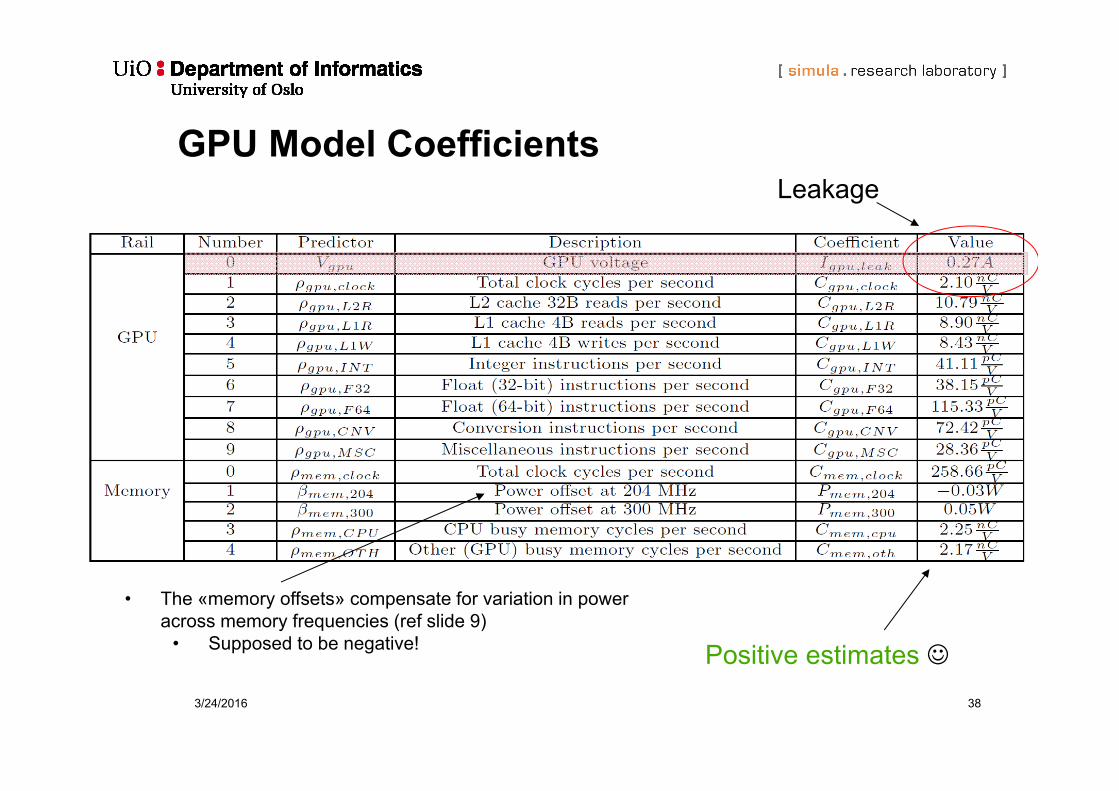
GPU Model Coefficients
Positive estimates
Leakage
• The «memory offsets» compensate for variation in power across memory frequencies (ref slide 9)
• Supposed to be negative!
3/24/2016 39
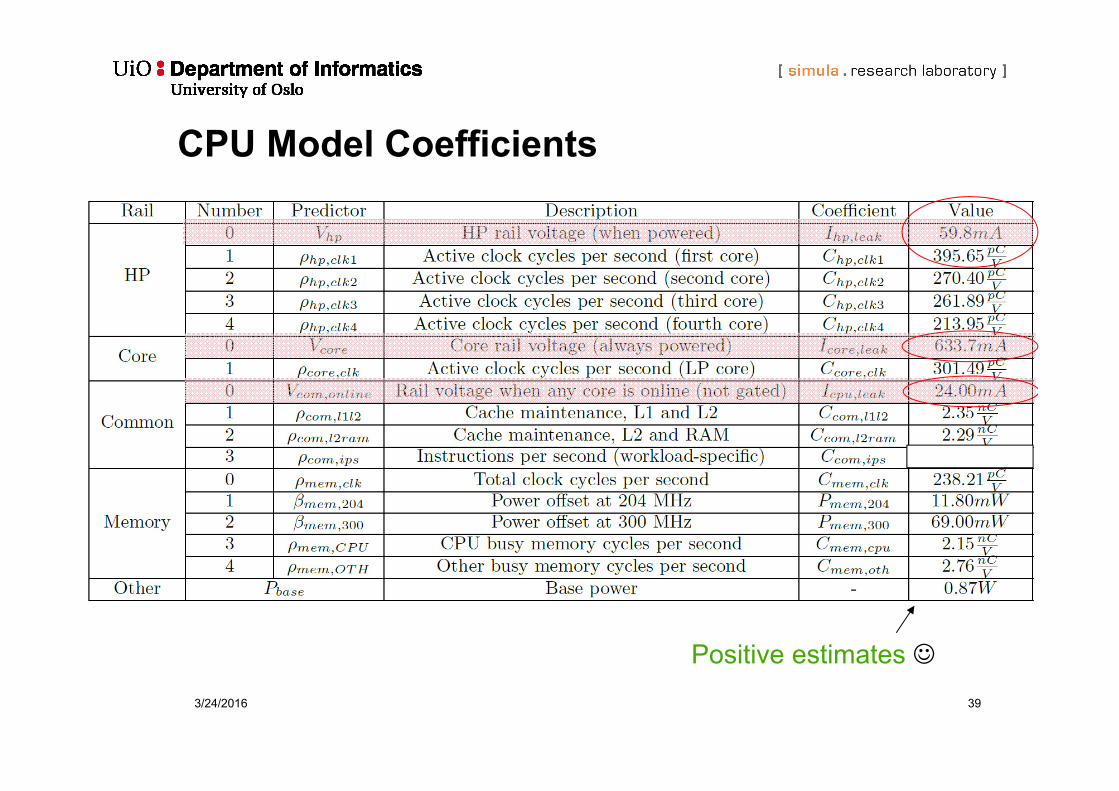
CPU Model Coefficients
Positive estimates
3/24/2016 40
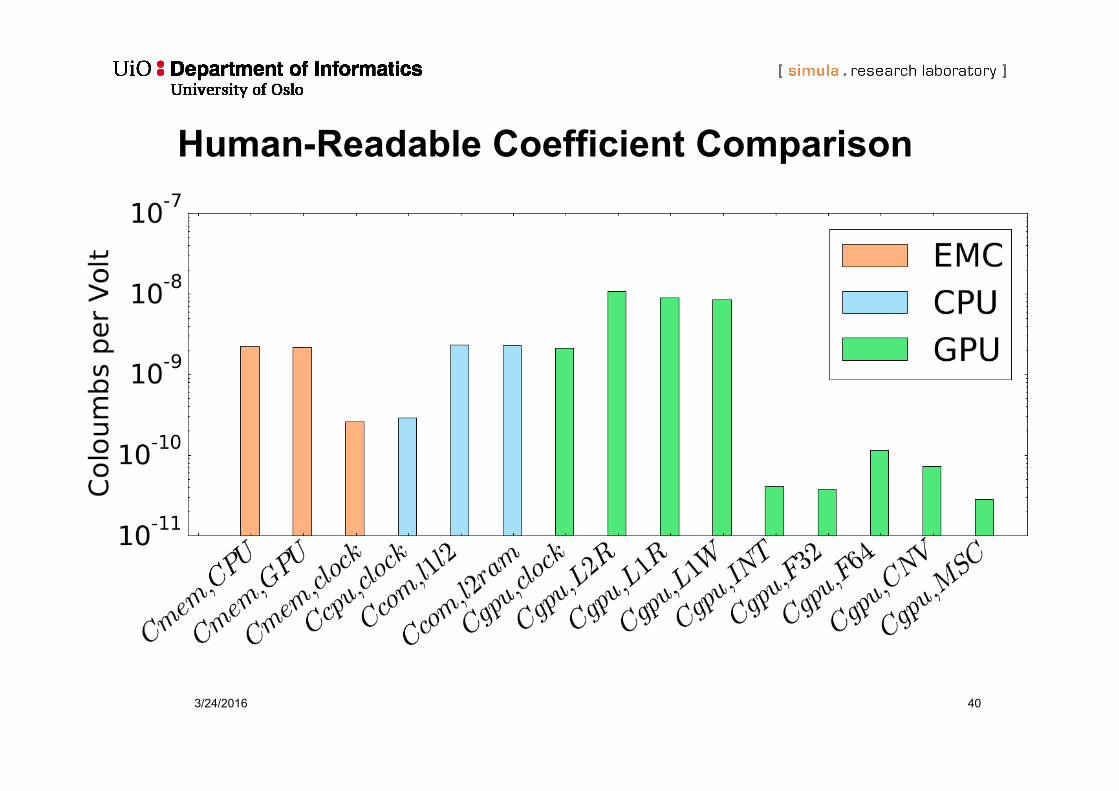
Human-Readable Coefficient Comparison
3/24/2016 41
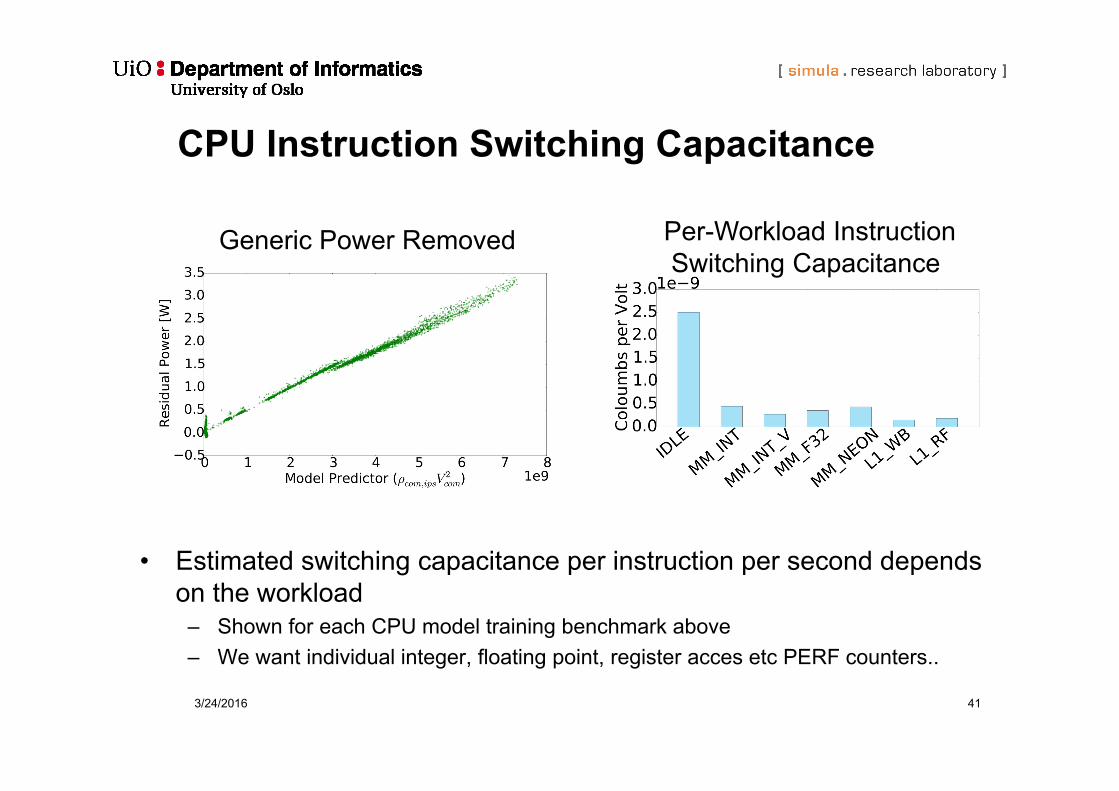
CPU Instruction Switching Capacitance
• Estimated switching capacitance per instruction per second depends on the workload
– Shown for each CPU model training benchmark above– We want individual integer, floating point, register acces etc PERF counters..
Per-Workload InstructionSwitching Capacitance
Generic Power Removed
3/24/2016 42
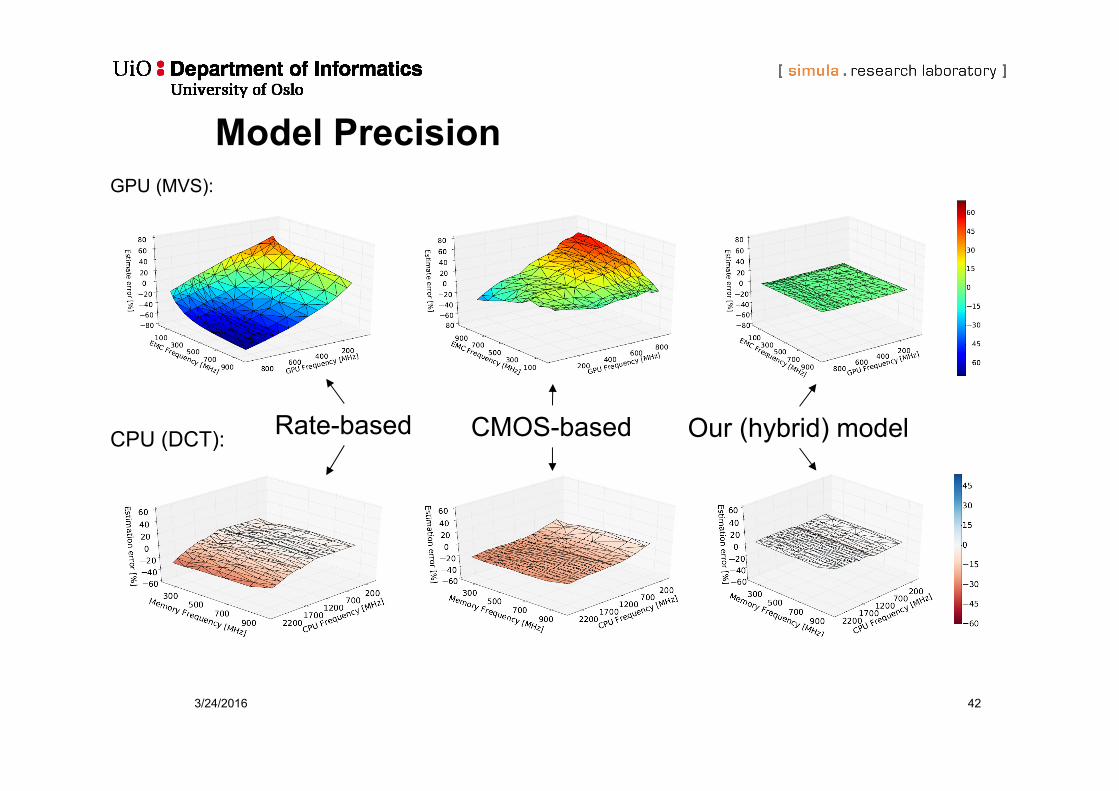
Model Precision
CPU (DCT):
GPU (MVS):
Rate-based CMOS-based Our (hybrid) model
3/24/2016 43
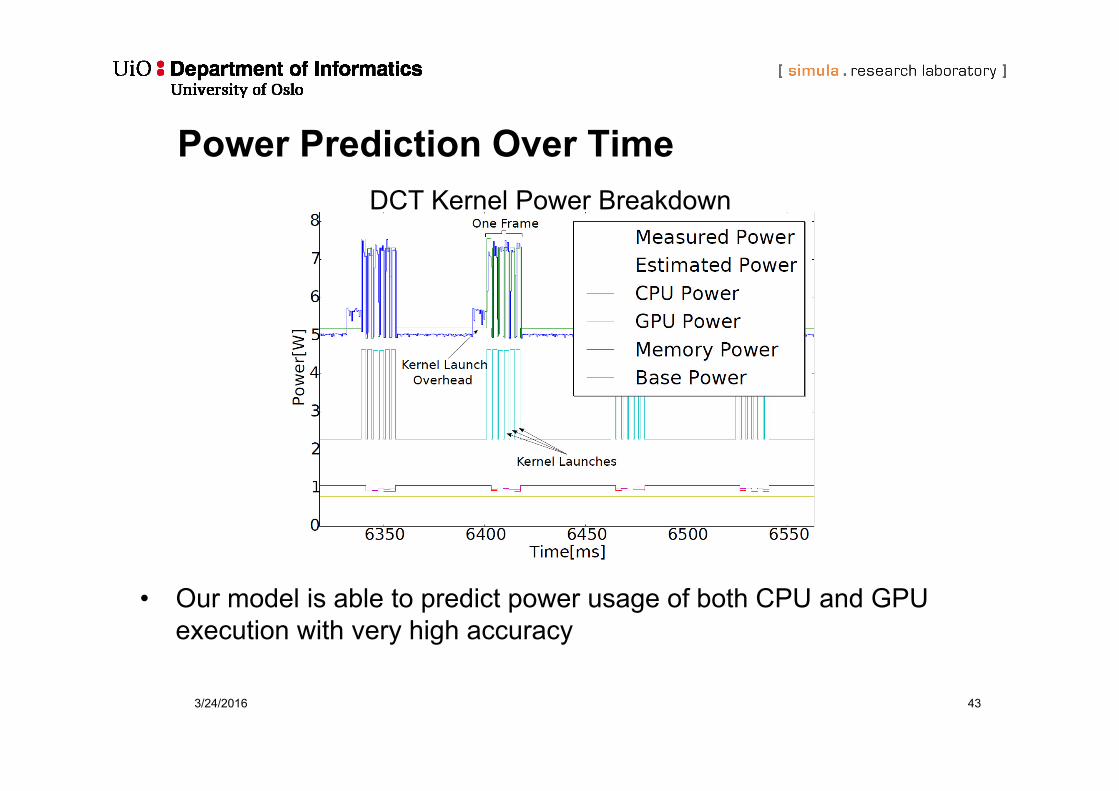
Power Prediction Over Time
• Our model is able to predict power usage of both CPU and GPU execution with very high accuracy
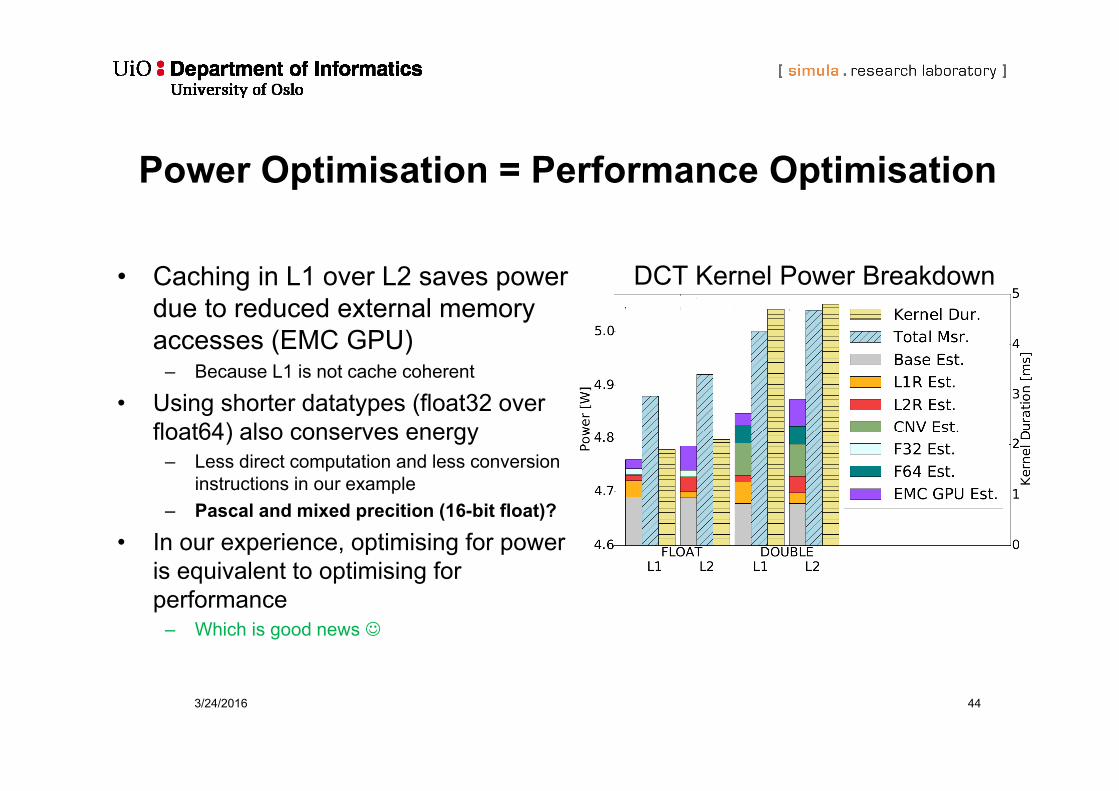
DCT Kernel Power Breakdown
3/24/2016 44
Power Optimisation = Performance Optimisation
• Caching in L1 over L2 saves power due to reduced external memory accesses (EMC GPU)
– Because L1 is not cache coherent
• Using shorter datatypes (float32 over float64) also conserves energy
– Less direct computation and less conversion instructions in our example
– Pascal and mixed precition (16-bit float)?
• In our experience, optimising for power is equivalent to optimising for performance
– Which is good news
DCT Kernel Power Breakdown
3/24/2016 45
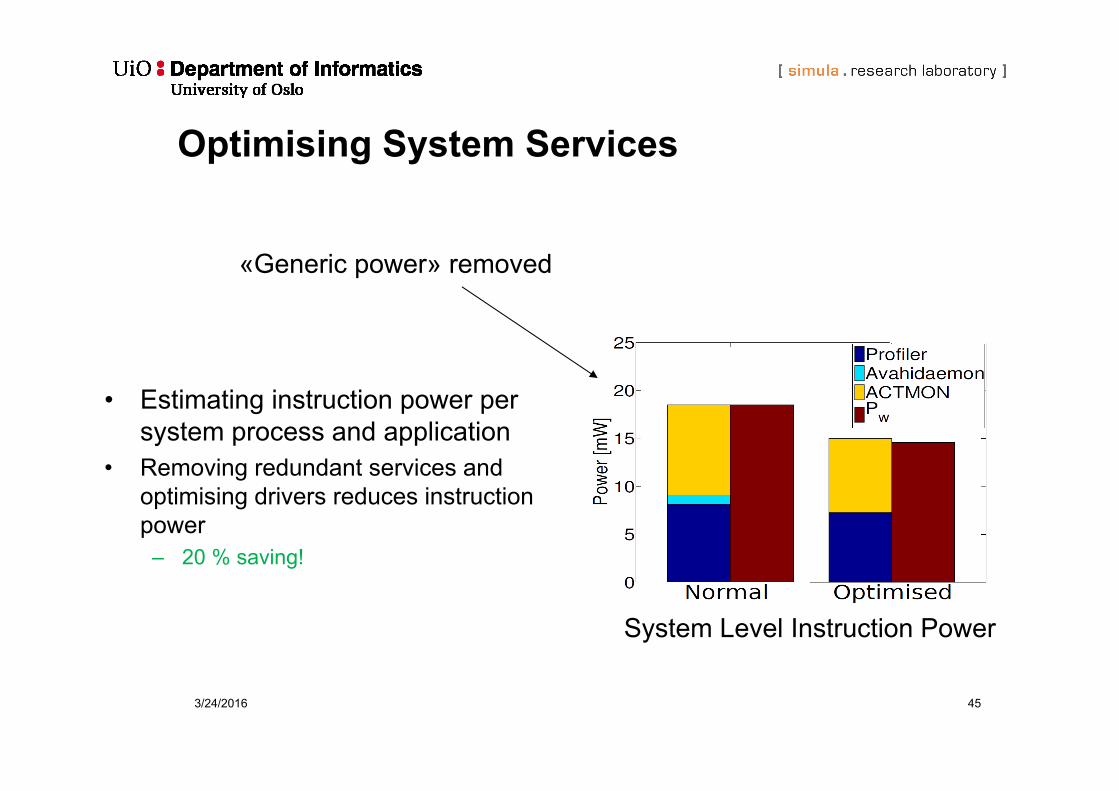
Optimising System Services
• Estimating instruction power per system process and application
• Removing redundant services and optimising drivers reduces instruction power
– 20 % saving!
System Level Instruction Power
«Generic power» removed
3/24/2016 46
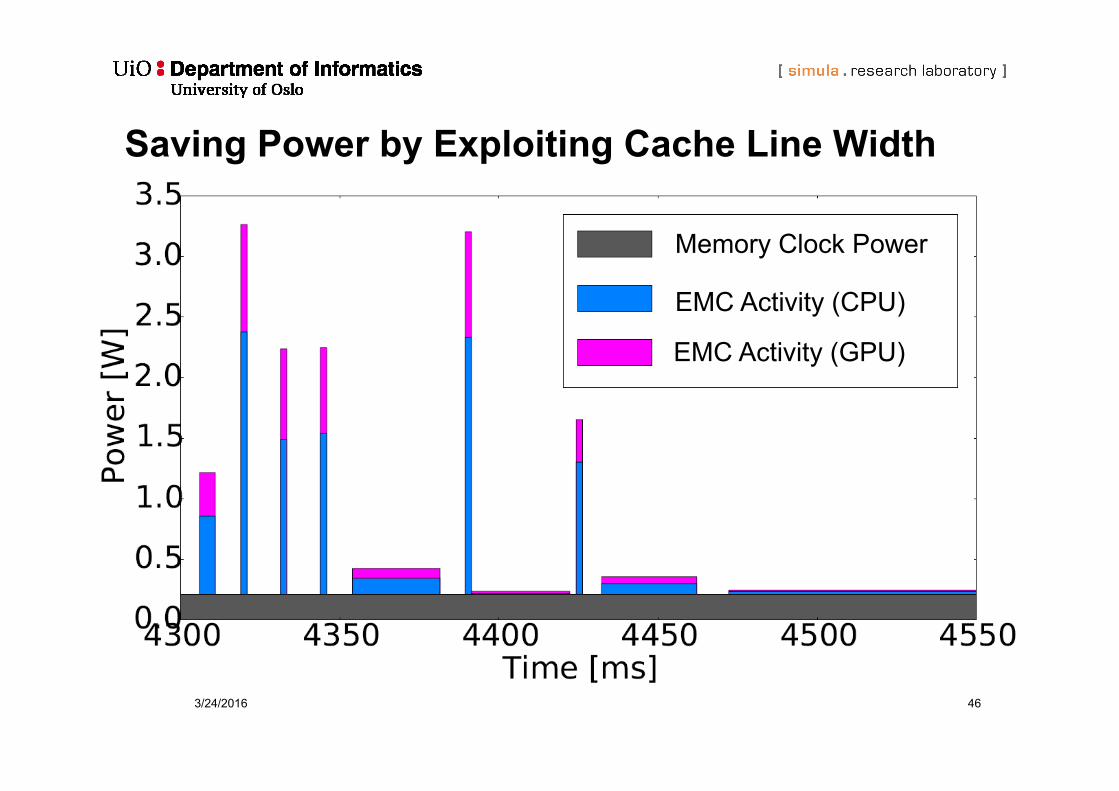
Saving Power by Exploiting Cache Line Width
Memory Clock Power
EMC Activity (CPU)
EMC Activity (GPU)
3/24/2016 47
Conclusion
• In this presentation, we have shown how we can understand the power usage of complex, heterogeneous multicore architectures
• Evaluating a system for power efficiency requires deep insight into architectures and their internal workings
– In this context, our method provides good pointers for modelling power on other SoCs
• We have demonstrated how we can analyse energy consumption of software worklods
– Optimised both CPU and GPU workloads
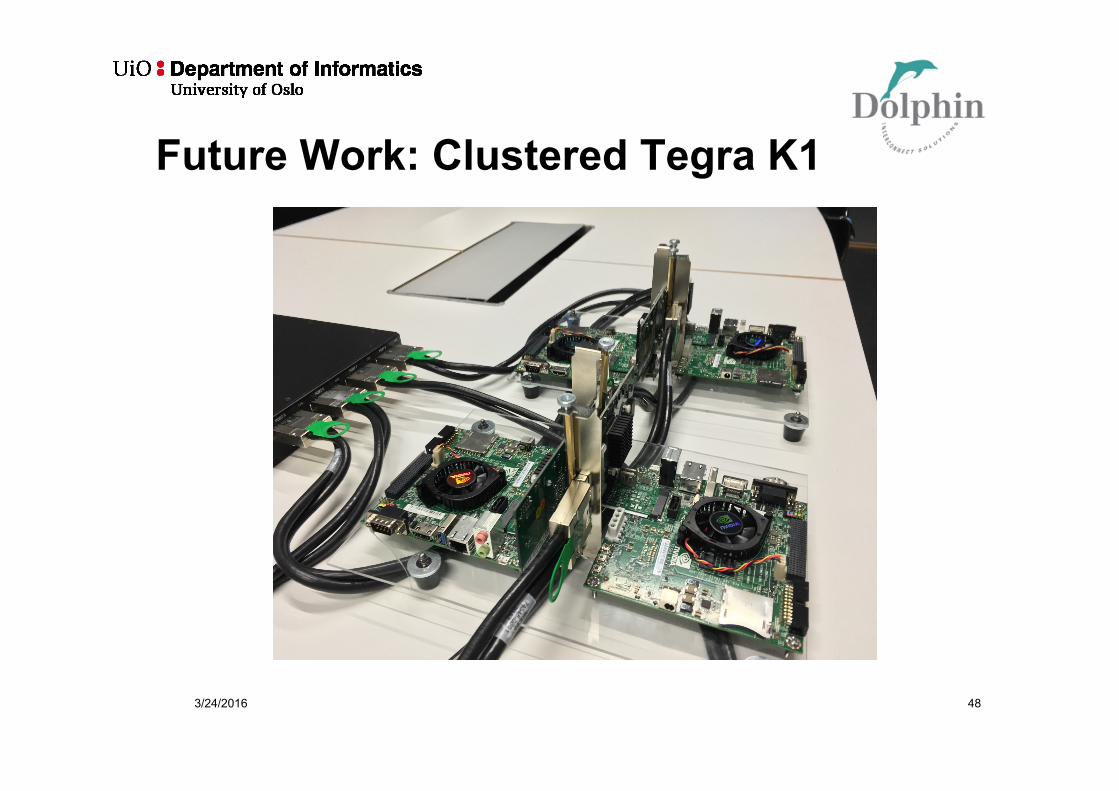
Future Work: Clustered Tegra K1
3/24/2016 48


![P-CAD EDA - [CPU and GPU control]](https://img.pdfslide.us/doc/110x75/623f014534be070aa278ab09/p-cad-eda-cpu-and-gpu-control.jpg)