Embed Size (px)
Citation preview
A HEALTH RISK COMPARISON OF LANDFILL DISPOSAL
AND WASTE-TO-ENERGY (WTE) TREATMENT OF MUNICIPAL SOLID WASTES
IN NEW YORK CITY (NYC)
Pearl Moy
Thesis advisors: Professor Paul Brandt-Rauf, Environmental Health Sciences
Professor Nicholas Themelis, Earth Environmental Engineering
Research submitted for partial fulfillment of an M.P.H. at the Mailman
School of Public Health at Columbia University
Research sponsored by: Earth Engineering Center, Columbia University
JUNE 2005
ABSTRACT Waste is an inevitable byproduct of our economy and must be managed in an environmentally sound and health protective manner. Few studies have compared and evaluated the health risks of landfills and waste combustion. Furthermore, experts continue to debate whether landfill disposal or waste combustion poses less risk to human health and the environment. As most of New York City’s (NYC) municipal solid wastes are sent to landfills and some to waste-to-energy (WTE) facilities, it is of interest to assess the health risks of these two waste management options. The present study attempts to compare the inhalation health risks of landfill disposal and WTE combustion in a NYC setting using principles of risk assessment and on the basis of a critical review of the literature on the respective emissions of these two methods. In addition to landfill and WTE combustor emissions, this study considers the health impacts from transporting wastes to waste transfer stations (WTS) and landfills. Both of these technologies have been improved in the last twenty years, landfills by means of the EPA Subtitle D rules and WTE facilities through the implementation of EPA Maximum Achievable Control Technology (MACT) standards. Therefore, this study assumes the use of modern landfills and WTE combustors. In addition to the health impacts from landfill and WTE combustor emissions, this study also considers the impacts from waste-transfer stations for landfill disposal and truck transportation of both MSW and WTE ash to landfills. The overall individual non-cancer and cancer risks for landfill disposal and WTE combustion were 1.18E+01, 4.14E-05, 2.30E+00, and 8.33E-06, respectively. Impacts from truck transportation were found to be an important contributor to increased health risk. These results suggest that WTE combustion may pose less health impacts than landfill disposal and provide an initial estimation of the relative inhalation health risks from landfill disposal and WTE combustion. Further investigation is needed to validate or modify the findings of this study.
i

ACKNOWLEDGMENTS The world is connected in complex ways and this work would not be possible without the help and support of many people. First, I would like to thank my advisors, Professor Paul Brandt-Rauf and Professor Nicholas Themelis for proposing this project, choosing me to write it, and their support and guidance throughout. The invaluable insights, advice, and support of Dr. Nikhil Krishnan and Ms. Priscilla Ulloa are also greatly appreciated. Also, I would like to thank Masato Nakamura, Shang-hsui Lee, Professor Patrick Kinney, Professor Vasilis Fthenakis, Brian Bahor of Covanta Energy, Ramon Cruz of Environmental Defense, Alex Whitworth, Barbara Beshers, Kimberley Labor, Lilliana Themelis, Hanwei Zhang, and Scott Kaufman for their input and support, as well as the Earth Engineering Center at Columbia University for funding this work and me. I am also extremely grateful to my friends, near and far, who have kept me grounded and lent me many ears and words of advice and encouragement. Last but not least, I’d like to express my gratitude to my family for their support and confidence, especially to my dad for his patience, guidance, and unrelenting encouragement.
ii
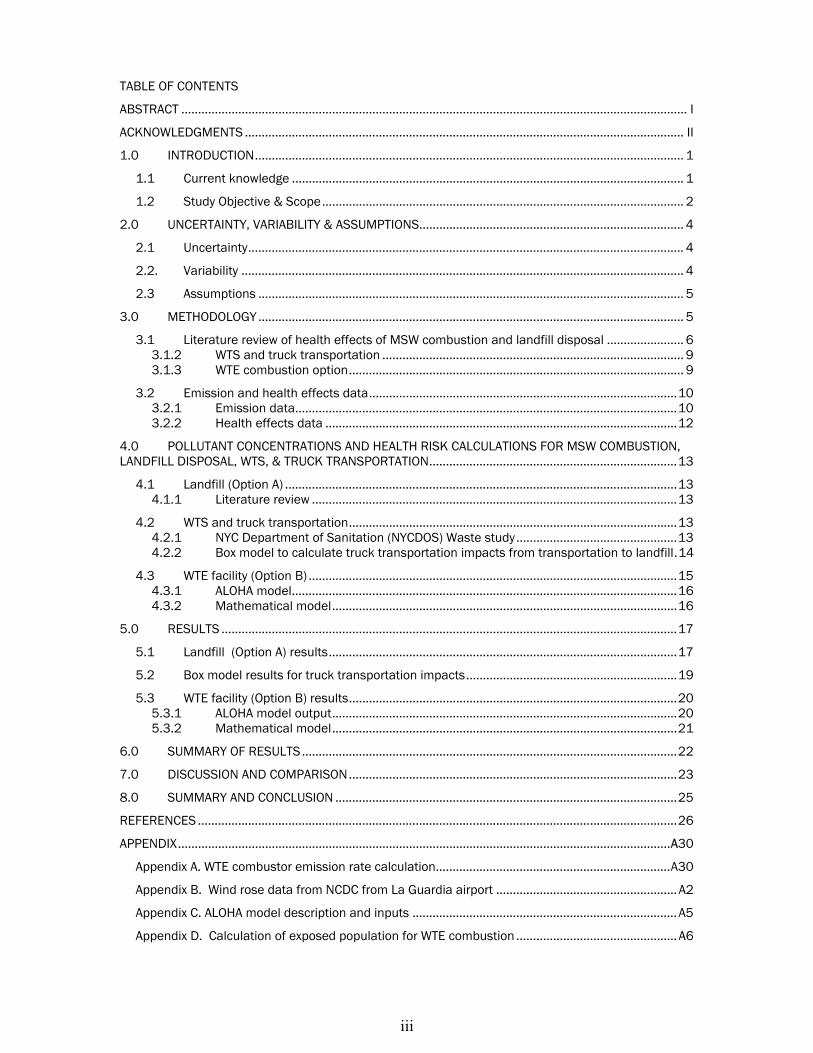
TABLE OF CONTENTS
ABSTRACT ....................................................................................................................................................... I
ACKNOWLEDGMENTS ................................................................................................................................... II
1.0 INTRODUCTION................................................................................................................................ 1
1.1 Current knowledge ..................................................................................................................... 1
1.2 Study Objective & Scope............................................................................................................ 2
2.0 UNCERTAINTY, VARIABILITY & ASSUMPTIONS............................................................................... 4
2.1 Uncertainty.................................................................................................................................. 4
2.2. Variability .................................................................................................................................... 4
2.3 Assumptions ............................................................................................................................... 5
3.0 METHODOLOGY ............................................................................................................................... 5
3.1 Literature review of health effects of MSW combustion and landfill disposal ....................... 6 3.1.2 WTS and truck transportation .......................................................................................... 9 3.1.3 WTE combustion option.................................................................................................... 9
3.2 Emission and health effects data............................................................................................10 3.2.1 Emission data..................................................................................................................10 3.2.2 Health effects data .........................................................................................................12
4.0 POLLUTANT CONCENTRATIONS AND HEALTH RISK CALCULATIONS FOR MSW COMBUSTION, LANDFILL DISPOSAL, WTS, & TRUCK TRANSPORTATION..........................................................................13
4.1 Landfill (Option A) .....................................................................................................................13 4.1.1 Literature review .............................................................................................................13
4.2 WTS and truck transportation..................................................................................................13 4.2.1 NYC Department of Sanitation (NYCDOS) Waste study................................................13 4.2.2 Box model to calculate truck transportation impacts from transportation to landfill.14
4.3 WTE facility (Option B) ..............................................................................................................15 4.3.1 ALOHA model...................................................................................................................16 4.3.2 Mathematical model.......................................................................................................16
5.0 RESULTS ........................................................................................................................................17
5.1 Landfill (Option A) results........................................................................................................17
5.2 Box model results for truck transportation impacts...............................................................19
5.3 WTE facility (Option B) results..................................................................................................20 5.3.1 ALOHA model output.......................................................................................................20 5.3.2 Mathematical model.......................................................................................................21
6.0 SUMMARY OF RESULTS................................................................................................................22
7.0 DISCUSSION AND COMPARISON..................................................................................................23
8.0 SUMMARY AND CONCLUSION ......................................................................................................25
REFERENCES ...............................................................................................................................................26
APPENDIX...................................................................................................................................................A30
Appendix A. WTE combustor emission rate calculation......................................................................A30
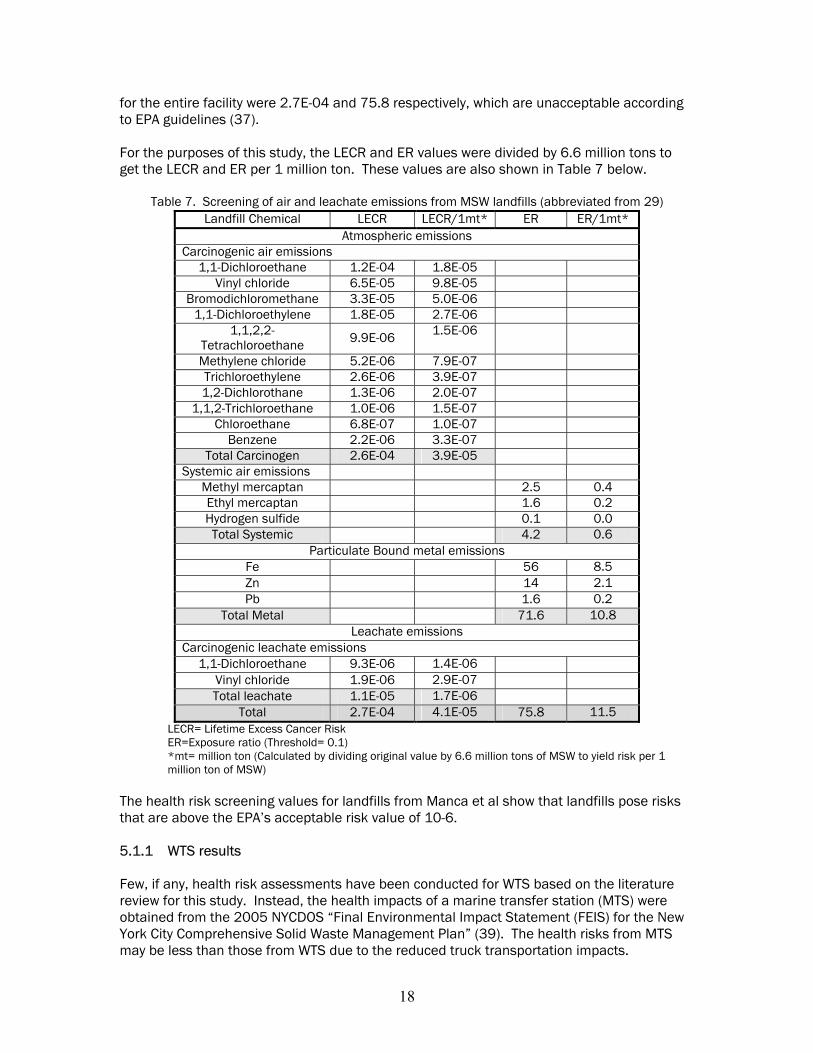
Appendix B. Wind rose data from NCDC from La Guardia airport ...................................................... A2
Appendix C. ALOHA model description and inputs ............................................................................... A5
Appendix D. Calculation of exposed population for WTE combustion ................................................ A6
iii
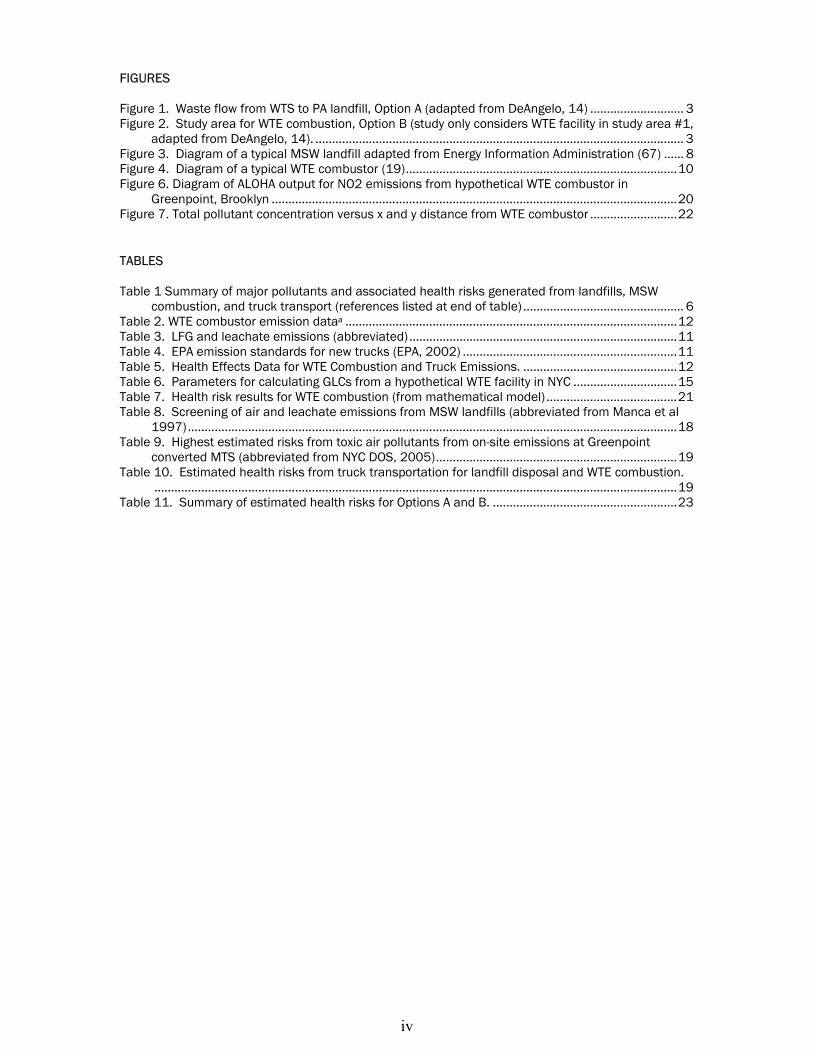
FIGURES Figure 1. Waste flow from WTS to PA landfill, Option A (adapted from DeAngelo, 14) ............................ 3 Figure 2. Study area for WTE combustion, Option B (study only considers WTE facility in study area #1,
adapted from DeAngelo, 14). .............................................................................................................. 3 Figure 3. Diagram of a typical MSW landfill adapted from Energy Information Administration (67) ...... 8 Figure 4. Diagram of a typical WTE combustor (19).................................................................................10 Figure 6. Diagram of ALOHA output for NO2 emissions from hypothetical WTE combustor in
Greenpoint, Brooklyn .........................................................................................................................20 Figure 7. Total pollutant concentration versus x and y distance from WTE combustor ..........................22 TABLES Table 1 Summary of major pollutants and associated health risks generated from landfills, MSW
combustion, and truck transport (references listed at end of table) ................................................ 6 Table 2. WTE combustor emission dataa ...................................................................................................12 Table 3. LFG and leachate emissions (abbreviated)................................................................................11 Table 4. EPA emission standards for new trucks (EPA, 2002) ................................................................11 Table 5. Health Effects Data for WTE Combustion and Truck Emissions. ..............................................12 Table 6. Parameters for calculating GLCs from a hypothetical WTE facility in NYC ...............................15 Table 7. Health risk results for WTE combustion (from mathematical model) .......................................21 Table 8. Screening of air and leachate emissions from MSW landfills (abbreviated from Manca et al
1997)..................................................................................................................................................18 Table 9. Highest estimated risks from toxic air pollutants from on-site emissions at Greenpoint
converted MTS (abbreviated from NYC DOS, 2005)........................................................................19 Table 10. Estimated health risks from truck transportation for landfill disposal and WTE combustion.
............................................................................................................................................................19 Table 11. Summary of estimated health risks for Options A and B. .......................................................23
iv
1.0 INTRODUCTION Municipal solid waste (MSW) continues to be an unwanted byproduct of our economy despite efforts to minimize, reduce and recycle. Non-recycled wastes must be managed in a sanitary and environmentally conscious manner. Currently there are two principle options for managing non-recycled MSW- landfill disposal or mass burn in waste-to-energy (WTE) facilities (21, 22, 46). However, some studies suggest that certain substances emitted from landfills and combustors lead to birth defects, respiratory problems, and increased risk of cancer (15, 28,), while other studies have found no significant health impacts (46, 48). These conflicting findings may be due to the difficulty involved in relating emissions to exposure and exposure to adverse health outcome (46). Also, it should be noted that both of these technologies have been improved in the last twenty years. Modern landfills are required by Subtitle D rules to include a non-permeable liner at the bottom, be capped at the top, and contain and treat gaseous aqueous emissions as much as possible. Also, WTE facilities, through the implementation of EPA Maximum Achievable Control Technology (MACT) standards, have reduced heavy metal and dioxin emissions by a factor of nearly one hundred (17, 50). Therefore, this study considers the health impacts from emissions from modern regulated landfills and WTE facilities. Notwithstanding these improvements, there is a continuing debate over which option, landfill disposal or waste combustion, poses less risk to the environment and human health (21, 49). Regardless of these issues, policymakers and health professionals have an obligation to examine and protect the public from these potential health risks (48). This work seeks to quantify and compare the health risks from landfills or WTE facilities using the principles of risk assessment. The study focuses on MSW management in New York City (NYC), a city that generates large amounts of waste and is searching for more effective methods to manage its MSW. NYC currently exports most of its MSW to out-of-state landfills that are constrained by decreasing capacity and charge increasing tipping fees (13). 1.1 Current knowledge The National Research Council defines human health risk assessments as “the evaluation of scientific information on the hazardous properties of environmental agents and on the extent of human exposure to those agents” (37). Comparative health risk assessments are useful when comparing the impacts of waste landfills and waste-to-energy facilities. A recent study in the UK completed a comparative health risk assessments of various waste management options, including recycling, landfill disposal, and combustion and found that waste management practices in their entirety resulted in five excess hospital admissions and one excess death due to air emissions in the UK (16). Due to data uncertainties, however, the investigators could not make a definitive statement on the ‘best’ waste management option (16). The Canadian Ministry of the Environment also compared the risks of landfill disposal and waste combustion. They estimated that the combined cancer risk ranged from 4 x 10⁻⁶ to 1 x 10⁻⁵ for landfills and 4.7 x 10⁻⁸ to 2.3 x 10⁻⁷ for combustion facilities (10). Although the health risks of both options are considered insignificant, the study suggests that landfills pose a 100-fold increased risk to human health and the environment. The study concluded that “no significant human health effects (those being cancer, lung disease nerve damage or reproductive effects) are likely…” in communities living near an incinerator or landfill (10). These studies illustrate the difficulty in making a definitive statement on the comparative risks of landfills and waste combustors.
1

The ambiguity of these findings is due to a variety of factors including different study design, methodology, data, and variability (37). Based on literature searches performed for this study, few comparative health risk assessments on waste management options have been conducted in the U.S. Eschenroeder and Stackelback compared the health risks of landfills and combustors and concluded that the cancer risk from landfills was approximately 100 times higher than for waste combustors (21). Most U.S. based risk assessments focus separately on the risks of landfills and combustion. To date, no health risk assessment has been conducted to study and compare the impacts of landfills and waste-to-energy combustion in New York City. The present study attempts to provide a rough estimation of the pollutant ground level concentrations (GLCs) and associated health risks from a hypothetical waste-to-energy (WTE) facility in New York City and compare those health risks with the use of waste-transfer-stations (WTS) and transport to out-of-state landfills, as mostly practiced in NYC. 1.2 Study Objective & Scope Given that over 82 percent of NYC’s waste is disposed in a landfill or combusted, it would be of interest to assess the health risks of these waste management options (50). The objective of the present study is to use the principles of risk assessment to estimate and compare the human health impacts of inhalation exposure to emissions from out-of-state landfill disposal (including WTS) with WTE treatment in NYC. This study considers the health impacts from managing 1 million tons of municipal solid waste (MSW) in one year in NYC and
a) Transporting the MSW to a waste transfer station (WTS) for further transport via diesel trucks and final disposal in a Pennsylvania landfill (Option A), or
b) Transporting the MSW to a WTE facility in NYC for combustion and electricity
generation, including impacts from landfill disposal of WTE ash (Option B). Option A represents the predominant method of MSW disposal in New York City. An estimated three million tons of MSW are deposited by collection trucks at various WTSs where they are loaded onto larger trucks for further transportation to landfills in Pennsylvania, Virginia, and Ohio (20). This study builds upon earlier research conducted the Earth Engineering Center (EEC) of Columbia University. Figure 1 below from DeAngelo’s thesis illustrates the scenario described as Option A (landfill disposal) (14). The present study only considers the impacts of one hypothetical WTE facility located in Greenpoint, Brooklyn, described as study area #1 in Figure 2 below. This study only calculates the health risks from the WTE facility and truck transport. The health risk for landfills and WTS were not calculated due to lack of data and models. Instead, this study estimates health risk values from landfills and WTSs from other studies (29, 39).
2

Figure 1 from DeAngelo illustrates the scenario described as Option A, where waste is transported to a WTS in Greenpoint, Brooklyn for further transport to a Pennsylvania landfill via diesel trucks.
Figure 1. Waste flow from WTS to PA landfill, Option A (adapted from DeAngelo, 14)
Figure 2. Study area for WTE combustion, Option B (study only considers WTE facility in study area #1, adapted from DeAngelo, 14).
3

2.0 UNCERTAINTY, VARIABILITY & ASSUMPTIONS Like all risk assessments, this study contains uncertainty, variability, and assumptions that should be identified in order to understand how accurately the assessment estimates actual risks (23, 37, 57). To ensure a more complete risk characterization, the following sections describe the uncertainties, variabilities, and assumptions of this study. 2.1 Uncertainty The National Research Council classifies uncertainty into two categories: parameter (measurement error, use of generic/surrogate data, exposure misclassification, etc.) and model uncertainty (gaps in scientific theory, model variables and parameters) (37, 57). Below is a list of the major parameter and model uncertainties of this study. Parameter Uncertainties
Data. The present study estimates exposures and risks from surrogate emission data for the WTE facility, landfill, and trucks from the EPA. Most of this data is based on average measurements (not actual data) taken from a pool of facilities or vehicles. This data represents the most accurate estimate available given the lack of an actual WTE facility in NYC.
Equipment limitations. There is also inherent uncertainty in the efficiency of
monitoring and measuring devices that were used to obtain emission data (37). Characterization of pollutants. Despite new monitoring technologies, a full
characterization of the pollutants generated by landfill disposal, WTE combustion, and truck transportation may not be complete. In addition, this study only considers the pollutants listed in Tables 2 & 3, which may represent an underestimation of the actual health risks. The pollutants listed in Tables 2 & 3 were chosen based on public health concern and significance to human health with respect to the pollutant sources (36, 54).
Model Uncertainties
Toxicological data. Toxicological data contains uncertainties, such as species and
dose extrapolation, which may introduce uncertainty in risk calculations (37, 23).
Modeling exposures and risks. This study mostly used non-computer models to provide a rough estimation of the exposure and health risks generated from Options A and B, which may not accurately represent true pollutant concentrations or exposures and risks to the study populations.
Dose-response and population. Uncertainty also exists in estimating the dose-
response for the study population due to different susceptibilities, genetic predispositions, and pollutant fate, transport, and reactivity (29).
2.2. Variability Variability exists in many scientific studies and occurs when more than one answer may be exist for a particular scenario (37). The main sources of variability in this study are (16,37):
4

Emissions variability. Emissions vary according to temperature, time, pressure, atmospheric conditions, and waste composition, which lead to variability in pollutant concentrations (36, 37).
Pollutant transport and fate. Pollutant transport and fate varies with atmospheric
conditions, which may lead to variability in pollutant concentrations (37).
Interindividual variability. Humans vary in their breathing rates, food consumption, metabolism, and susceptibilities, which introduces variability into risk estimates (37).
2.3 Assumptions Several assumptions were made in this study, which may also introduce uncertainty into the risk assessment.
Uniformly distributed population. For the WTE facility risk assessment, a uniformly distributed population was assumed for the NYC area based on Census 2000 data for NY, NJ, PA, and NYC. This study used the average Census 2000 population densities for NY, NJ, and PA to estimate population health risks.
Waste generated. The study assessed the increased risk of landfill disposal,
combustion, and the respective transport of 1 million tons of MSW in one year. Truck route. The study assumed that the trucks transported waste to a
Pennsylvania landfill located approximately 190 miles outside from NYC.
Sitting of WTE facility. Emissions from the WTE facility were estimated based on processing 1 million tons of waste for 330 days of operation in one year. Greenpoint, Brooklyn was chosen as the site for the hypothetical WTE facility (13, 14). Other boroughs, such as Manhattan, use WTE facilities and rail transportation, whereas all of Brooklyn’s MSW is transported to PA and VA landfills via trucks (13). Greenpoint, Brooklyn in particular has high concentration of WTS and dependence on truck transportation (14). A hypothetical WTE facility at Greenpoint, Brooklyn may therefore have a greater impact on the waste management methods in the borough.
Meteorology. The average wind speed using wind rose data for LaGuardia Airport
was used to estimate the WTE and truck emission concentration calculations.
Exposure. Human exposure to pollutant concentrations was assumed to be 100%. This is a conservative estimate since actual exposures may vary.
3.0 METHODOLOGY The following sections describe the methodology used in this study to assess the health risks of Options A & B. A literature review of the health effects of the two options was first completed. Next, emissions and health data were gathered for each pollutant of interest. Finally, the pollutant concentrations and associated health risks were calculated for the WTE facility and truck transportation. The health effects from landfill emissions were summarized from the literature review.
5

3.1 Literature review of health effects of MSW combustion and landfill disposal
A literature search was conducted to characterize the potential health hazards of disposing MSW in landfills and of WTE combustion. This section summarizes the major findings of the research.
Although few comparative health risk assessments been conducted on landfills and incinerators, several U.S. studies have looked separately at the health impacts of the two waste management options. In general, these studies suggest that increased morbidity, adverse birth outcomes, and cancer risk may be associated with both landfills and waste incinerators, although most remain inconclusive in proving a causal association (1, 36, 53, 55, 53). Table 1 summarizes the major pollutants and health risks from landfills, waste combustion, and truck transport.
Table 1 Summary of major pollutants and associated health risks generated from landfills, MSW combustion, and truck transport (references listed at end of table)
Activity Compound* Health effects from inhalation exposure*
Ammonia Irritant (eye, nose, throat)
Carbon monoxide Visual impairment, headache, reduced work capacity Death at high doses
Chloroform
Skin (sores) Neurological (CNS depression, dizziness, fatigue, headache) Liver and kidney damage Reproductive/developmental (animals: miscarriage, birth
defects, abnormal sperm) Cancer (Group B2: probable)
Methane Odor
Acrylonitrile
Irritant (eyes, nose, throat, skin) Reproductive/developmental (mice: decreased sperm count,
rats: fetal malformations) Cancer (Group B1)
Benzene
Neurological (CNS depression: drowsiness, tremors) Respiratory and eye irritant Hematologic (blood disorders- aplastic anemia) Reproductive/developmental (animals: low birth weight, bone
marrow damage) Cancer (Group A; leukemia)
1,1-Dichloroethane
Cardiovascular (arrhythmia) Neurological (CNS depression) Reproductive/developmental (animals- fetal malformations) Possible carcinogen (Group C)
Dichloromethane
Neurological (CNS depression: dizziness, nausea, memory loss)
Liver, kidney, cardiovascular effects Cancer (Group B2: liver and lung in animals)
Carbonyl sulfide Eye, skin irritation Narcotic effects
Ethylbenzene Respiratory (throat irritation, chest constriction) Kidney, liver, eye effects Neurological (CNS toxicity)
Landfill
NMOCs**
Hexane Eye, skin, throat irritation Neurological (CNS depression: dizziness, headache) Reproductive (rats: testicular damage)
6

Methyl ethyl ketone
Irritant (eye, nose, throat) Highest toxicity via dermal exposure Reproductive (low birth weight via inhalation in rats) Neurological, kidney, liver damage (rats)
Tetrachloroethylene
Respiratory (upper respiratory tract, throat irritation) Neurological (headache, dizziness) Liver, kidney damage Possible carcinogen (Group C)
Toluene Neurological (CNS depression: drowsiness, tremors) Kidney, liver impairment Reproductive/developmental affects
Trichloroethylene Neurological (CNS depression: drowsiness, tremors) Kidney, liver impairment
Vinyl chloride
Neurological (CNS depression: drowsiness, tremors) Kidney, liver irritation Cardiovascular effects (arrhythmia, blood clots) Reproductive/developmental (rats: testicular damage, low
birth weight, birth defects) Cancer (Group A)
Xylene Eye, nose, skin, throat irritation Neurological (dizziness, memory loss, headache) Gastrointestinal (nausea, vomiting)
Hydrogen sulfide Odor Sulfides Dimethyl sulfide Odor
Particulate matter
Respiratory (aggravation of asthma, Chronic Obstructive Pulmonary Disease (COPD))
Increased mortality Potential carcinogen
Dioxin, TEQ
Reproductive (reduced fertility in rodent studies) Developmental (malformations cleft palate in mice, facial
abnormalities in humans and mice) Cancer (Group B2)
Lead (Pb)
Neurodevelopment (decreased IQ) Reproductive (lower birth weight, stillbirth) Neurological (encephalopathy, decreased nerve function,
convulsion and death at high doses) Cancer (Group B2; inconclusive in humans)
Mercury (Hg)
Cardiovascular (increased blood pressure, hypertension) Developmental (malformations) Gastrointestinal (abdominal pain, nausea, diarrhea) Reproductive (increased spontaneous abortion) Respiratory (edema, fibrosis, cough) Neurological (abnormal behavior) Death at high doses
Cadmium (Cd) High exposure- anemia, gastric irritation Impaired lung function Cancer (Group B1; via inhalation)
Hydrogen chloride (HCl) Respiratory effects Increased mortality (rats)
Nitrogen oxides (NOx) Respiratory (NO2: reduced pulmonary function, lung inflammation, aggravation of respiratory diseases)
WTE combustion
Sulfur dioxide (SO2) Respiratory (upper airway irritation, long-term exposure associated with increased heart and lung mortality)
Carbon monoxide Visual impairment, headache, reduced work capacity Hydrocarbon Key component of smog; ozone precursor
Truck transport
Nitrogen oxide Key component of smog; ozone precursor
7

Particulate matter
Respiratory (aggravates asthma, coughing, chronic bronchitis, decreased lung function)
Increased morbidity (premature death) Increased hospital admissions Potential carcinogen (also diesel exhaust)
Ozone Respiratory (aggravates asthma, decreases lung function,
lung inflammation) Increased hospital admissions
Air toxics (benzene, formaldehyde,
acetaldehyde, etc) Cancer (benzene- Group A)
*Sources: 1, 2,15,36, 43, 55, 56, 58, 64. **NMOC=Non-methane organic compounds, CNS= central nervous system
The compounds listed in Table 1 are emitted from landfills and waste combustors at very low levels that may or may not result in the described health effects (36, 45).
3.1.1 Landfill option (Option B)
Landfill disposal is the dominant method of solid waste disposal in the U.S. (68). By definition, a MSW landfill is an area of land that accepts household waste (68). Modern landfills contain liners, leachate collection systems, and monitoring wells to prevent the leakage of landfill gases (LFG), which often carry health risks as listed in Table 1 (63, 68). The health risks of landfills are generally less quantifiable than WTE facilities due to uncertainties in the level of air emissions and leachate, which is largely due to the design of landfills (9). Figure 4 below is a diagram of a typical MSW landfill. In landfills, waste is deposited in a specific section or cell of the facility, covered with soil, and capped when the cell is full. As the landfill is formed, the MSW is subjected to bioreaction that generates methane and other contaminants that are often difficult to capture (12). Once capped, landfill gases are measured and monitored. LFG is often not measured prior to capping and contributes to the uncertainty in quantifying human exposures (9). In addition, landfill leachate is also difficult to quantify. Leachate occurs when rainwater travels through percolated landfill liners and can contaminate ground and surface waters, which may or may not lead to human exposures and elevated health risks (25). Furthermore, landfills continue to emit gases and leachate long after closure, which adds to the uncertainties in quantifying emissions and potential for exposure (25).
Figure 3. Diagram of a typical MSW landfill adapted from Environmental Protection Agency (67)
8

The primary health risks of landfills are derived from inhalation, ingestion, and dermal exposure to landfill gases (LFG), leachate contaminated water and soils, and dietary intake of contaminated plants or livestock (16). The composition of LFG and leachate vary widely according to the composition of waste, the age of waste, and the type of landfill (12). Major LFG components are methane, carbon dioxide, and small amounts of nitrogen, oxygen, ammonia, and nonmethane organic compounds (NMOCs) (1). Although the leachate composition varies, it can be categorized into 4 pollutant groups: dissolved organic matter (methane), inorganics (Ca, Mg, Na, NH4+), heavy metals (Cd, Cr, Pb, Ni), and xenobiotic organic compounds (hydrocarbons, phenols) (12). As mentioned in Table 1, animal studies suggest a link between adverse birth outcomes and proximity to landfills (18, 45). Christensen et al suggested that groundwater supplies up to 1000 m from the landfill site may be affected by leachate. However, these studies have yet to link chemical exposures from landfills to the observed adverse health outcomes. The current study does not calculate the health risks associated with landfills. Instead, this study will compile data from other studies and compare them with the findings for WTE treatment option. It is important to note that the landfill emissions from MSW (Option A) may vary from WTE ash (Option B). This study only uses health risk values from MSW disposal based on available data. 3.1.2 WTS and truck transportation
Impacts from the WTS and truck transportation are also important to consider when comparing the health risks of landfill disposal and waste combustion. Waste combustion reduces the volume of waste transported to landfills by up to 90%, which results in fewer truck trips to landfills (19). Due to increased transportation of wastes to out-of-state landfills and the use of waste transfer stations in NYC’s current waste management program, air pollutants may be greater for landfill disposal than WTE combustion of municipal waste due to increased truck travel to transport wastes. The health implications of increased human exposure to air pollutants generated during landfill disposal and WTE combustion may be significant in NYC since over 67% of NYC’s MSW is exported to out-of-state facilities (5). Furthermore, these health impacts are particularly applicable to Brooklyn, where all MSW is first transported to a WTS in Greenpoint and finally to out-of-state landfills via diesel trucks (13). 3.1.3 WTE combustion option
WTE facilities use solid waste as fuel to generate electricity (19). The heat generated by the WTE combustor is converted into high-pressure steam, which is used to turn a turbine to generate electricity as shown in Figure 3. WTE treatment of solid wastes can reduce the volume of waste by up to 90% (19). The resulting fly ash generated is then disposed in a landfill.
9
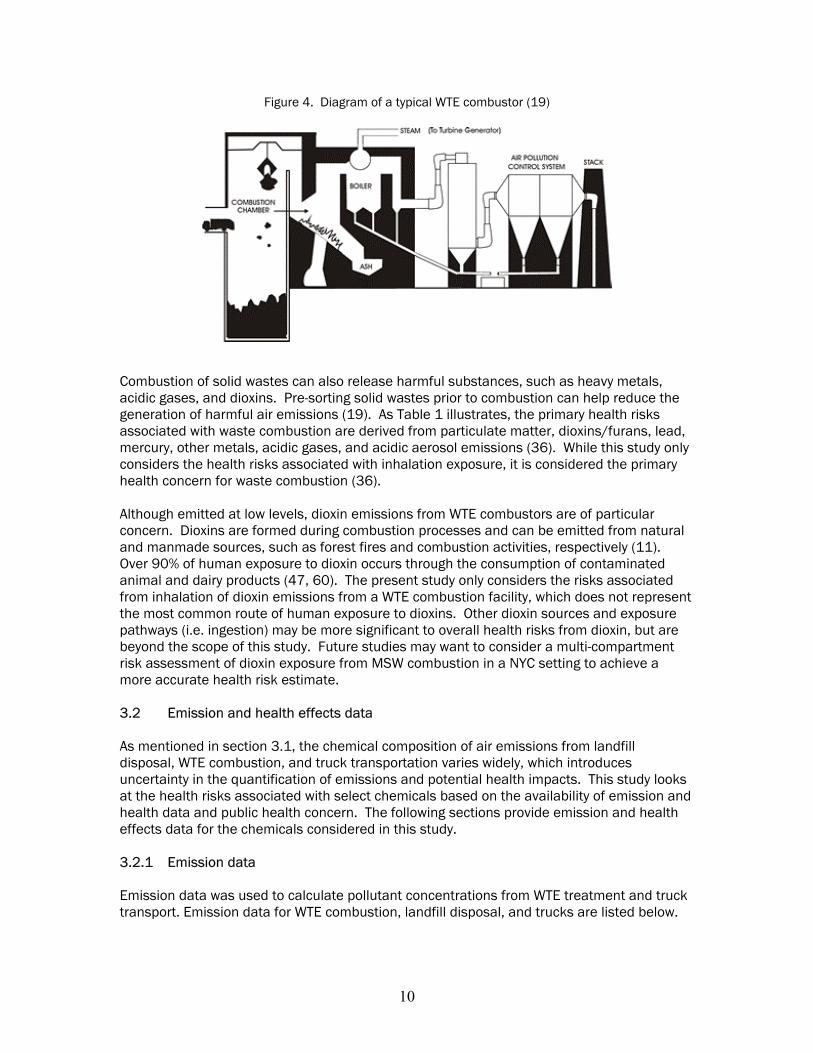
Figure 4. Diagram of a typical WTE combustor (19)
Combustion of solid wastes can also release harmful substances, such as heavy metals, acidic gases, and dioxins. Pre-sorting solid wastes prior to combustion can help reduce the generation of harmful air emissions (19). As Table 1 illustrates, the primary health risks associated with waste combustion are derived from particulate matter, dioxins/furans, lead, mercury, other metals, acidic gases, and acidic aerosol emissions (36). While this study only considers the health risks associated with inhalation exposure, it is considered the primary health concern for waste combustion (36).
Although emitted at low levels, dioxin emissions from WTE combustors are of particular concern. Dioxins are formed during combustion processes and can be emitted from natural and manmade sources, such as forest fires and combustion activities, respectively (11). Over 90% of human exposure to dioxin occurs through the consumption of contaminated animal and dairy products (47, 60). The present study only considers the risks associated from inhalation of dioxin emissions from a WTE combustion facility, which does not represent the most common route of human exposure to dioxins. Other dioxin sources and exposure pathways (i.e. ingestion) may be more significant to overall health risks from dioxin, but are beyond the scope of this study. Future studies may want to consider a multi-compartment risk assessment of dioxin exposure from MSW combustion in a NYC setting to achieve a more accurate health risk estimate. 3.2 Emission and health effects data As mentioned in section 3.1, the chemical composition of air emissions from landfill disposal, WTE combustion, and truck transportation varies widely, which introduces uncertainty in the quantification of emissions and potential health impacts. This study looks at the health risks associated with select chemicals based on the availability of emission and health data and public health concern. The following sections provide emission and health effects data for the chemicals considered in this study.
3.2.1 Emission data
Emission data was used to calculate pollutant concentrations from WTE treatment and truck transport. Emission data for WTE combustion, landfill disposal, and trucks are listed below.
10

3.2.1.1 Landfill
In this study, we did not calculate landfill pollutant concentrations. However, landfill gas and leachate emissions from the EPA’s AP42 (67), Manca et al (29), and Christensen et al (12) are listed in Table 2 to give the reader a general sense of the magnitude and variability of landfill emissions. The variability of emissions may be due to the variations in waste composition, age, and landfill design (12).
Table 2. LFG and leachate emissions (abbreviated from 12, 29, 67, 70)
Compound
Default LFG Concentration (ug/m3) [67,
70]
LFG concentration (ug/m3) from Manca et al 1997 [29]
Leachate concentration
range (ug/l) from Christensen et al
2001 [12]
Leachate concentration from Manca (ug/l) et al
1997 [29]
1,1-Dichloroethane 9502 38912 ND 670 1,2-Dichloroethane 1658 445 ND 20 1,1,2,2-Tetrachloroethane 7612 1374 ND 17 Bromodichloromethane 20950 13803 ND 25 Benzene 6095 2180 1.0-1630 25 Carbon monoxide 161354 ND ND ND Carbonyl sulfide 1203 20700 ND ND Chloroform 146 190 1.0-7.0 20 Dichloromethane 49625 91780 ND 4000 Dimethyl sulfide 19850 8710 ND ND Ethyl benzene 19994 11800 1.0-1280 290 Ethyl mercaptan 16677 13693 ND ND Hydrogen sulfide 49428 840 ND ND Methyl mercaptan 13936 20476 ND ND Tetrachloroethylene 25271 21600 0.1-250 55 Toluene 147925 46900 1.0-12300 1200 Trichloroethylene 15139 10716 ND 80 Vinyl chloride 18742 6467 ND 120 Xylenes 52480 10950 4.0-3500 ND
ND= no data a Converted using ug/m3= (ppmv*12.181*1000*Molecular Weight)/298.15K 3.2.1.2 Truck transport This study considers the truck transportation risks from inhalation of NOx and PM on the population surrounding the truck route from a WTS in Brooklyn to a landfill in PA (approximately 92.2 km2 with a population density of 232 people per km2). Heavy-duty truck emission factors for PM and NOx were obtained from the 1998 EPA emission standards for new trucks as listed in Table 3 below (54, 55).
Table 3. EPA emission standards for new trucks (54)
Compound EPA Emission standard for new trucks, 1998 (g/bhp-hr)
EPA Emission standard for new trucks, 2004 (g/bhp-hr)
NOx 4 2 PM 0.1 0.01
11

3.2.1.3 WTE combustion
For WTE combustion, this study considers the health risks associated with inhalation of dioxins (TEQ), mercury, cadmium, lead, PM, hydrogen chloride, sulfur dioxide, and nitrogen oxides. Emission data for the WTE combustor is listed in Table 2 below. The emission rate was calculated using Year 2000 EPA post MACT data for large municipal waste combustors (MWC) and was based on 1 million tons of MSW treated in the MWC in one year.
Table 4. WTE combustor emission dataa
Compound Emission factor a (kg/Mg MSW fired)
Emission rate of hypothetical WTE combustor b (ug/s)
Dioxin/ Furan (TEQ) 4.72 E-10 1.50 E-02 Mercury 7.86 E-05 2.50 E+03
Cadmium 1.19 E-05 3.79 E+02 Lead 1.70 E-04 5.41 E+03
Particulate Matter 2.53 E-02 8.05 E+05 HCl 9.55 E-02 3.04 E+06 SO2 1.46 E-01 4.65 E+06 NOx 2.00 6.36 E+07
Total 2.27 7.21 E+07 a DATA SOURCE: EPA Docket A-90-45, Performance Data for Large MWC at MACT (Year 2000)59 b Per 1 million tons, see Appendix A for calculation
3.2.2 Health effects data
Health effects data for WTE combustion and truck emissions were obtained from multiple sources as listed in Table 5. These values were used to estimate health risks from WTE treatment and truck transportation.
Table 5. Health Effects Data for WTE Combustion and Truck Emissions.
Emission source Compound Non-cancer health value
(ug/m3)
Inhalation Unit Cancer Risk
Factor (m3/ug)
Dioxin (TEQ) 4.50E-05 [7] 3.30 E-11 [61] Mercury 3.00E-01 [62] NA
Cadmium 1.00E-02 [7] 1.80 E-03 [62] Lead 1.50E+00 [56] 1.20 E-05 [6] PM 5.00E+01 [56] ND HCl 9.00E+00 [7] NA SO2 7.80E+01 [56] NA
WTE combustion
NO2 1.00E+02 [56] NA NO2 1.00E+02 [56] NA
Truck transportation
Diesel Exhaust
Emissions 5.00 E+00 [7] 3.0 E-04 [62]
NA= Not applicable; ND= No data
12

4.0 POLLUTANT CONCENTRATIONS AND HEALTH RISK CALCULATIONS FOR MSW COMBUSTION, LANDFILL DISPOSAL, WTS, & TRUCK TRANSPORTATION
The following sections describe the methods used to estimate the pollutant concentrations for Options A (WTE facility) and B (WTS and landfill) and truck transportation. 4.1 Landfill (Option A) Most of NYC’s MSW enters landfills (40, 68). As discussed in section 3.1.1, the estimation of health risks from landfills is difficult due to the lack of monitoring and collection devices for landfill gases and leachates (25). The present study did not calculate the health risks for landfills due to the fact that landfills are dispersed sources over large areas and the lack of data on landfill emissions, particularly for leachates, and accessibility/availability of an appropriate dispersion model. 4.1.1 Literature review Numerous studies have been conducted on the health effects of landfill sites. Most of these studies were epidemiological and often did not supply quantitative values along with the study findings. The health risks of landfills were evaluated through literature reviews of several landfill health studies. Table 7 in section 5.1 compiles data from numerous studies on the health risks of landfills. 4.2 WTS and truck transportation
Diesel-emitting vehicles are a significant source of environmental particulate matter and play a large role in the exacerbation of respiratory diseases such as asthma and COPD (20). A study by Environmental Defense suggested that the high concentration of waste transfer stations in Greenpoint, Brooklyn leads to increased traffic from diesel emitting trucks that carry waste to transfer stations and may be a major aggravator of respiratory illnesses in the region (20).
4.2.1 NYC Department of Sanitation (NYCDOS) Waste study In 2005, the NYCDOS published the “Final Environmental Impact Statement (FEIS) for the New York City Comprehensive Solid Waste Management Plan,” which assessed the impacts of WTS in various regions in NYC. Of interest to this study was the environmental impact statement (EIS) on the proposed marine transfer station (MTS) in Greenpoint, Brooklyn. Greenpoint is a mixed-use neighborhood and contains multiple industrial facilities and residential dwellings (38). As mentioned previously, the area also houses a high number of WTS and transports all its MSW to PA and VA landfills via trucks (13). A summary of the results from the study is presented in Table 8 in section 5.1.1. The values in Table 8 summarize the acute and chronic health impacts of air emissions from processing activities within the MTS facility (wheel loaders, cranes, sweepers, etc) and outside the facility (tugboats, moving and queuing vehicles) according to the guidelines specified in the Council on Environmental Quality Review (CEQR) 2001 Technical Manual (39). The study also examined impacts from odor and noise and concluded that the air quality health impacts from the proposed MTS “are not considered to be significant” (39).
13

4.2.2 Box model to calculate truck transportation impacts from transportation to landfill A box model approach was used to estimate the health impacts of transportation to the PA landfill, as illustrated in Figure 5 (26). The box model assumes a uniform distribution of pollutants over a certain height and horizontal distance of approximately 387 km (51). These parameters were derived from the projected distance traveled by a truck during transport through NY, NJ, and PA to the landfill (approximately 387,305 m) from a WTS in Greenpoint, Brooklyn (24, 4). Vertical and horizontal dispersions of 1000m and 300m, respectively, were chosen based on estimates from a study on mixing depths over the Northeastern United States and correspondences with air pollution experts (4, 24). An average wind speed for NY, NJ, and PA was estimated from the 1996 Wind Energy Resource Atlas of the United States published by the National Renewable Energy Laboratory (35). The truck pollutant concentrations for one hour were then calculated using the following box model equation (26):
C(t)= x/Q[1- e -Qt/V] where,
C= concentration (ug/m3) t= time (seconds) x= distance traveled (meters) Q= wind speed (m/s)/ height (m)*width (m) V= volume (m3)
Figure 5. Box model diagram for calculating pollutant concentrations from trucks (26)
Q.C(t) kg/s pollutant mass out
C(t) pollutant conc.
s m/s wind
Area, A
x kg/s
Road
The emission factors in Table 3 were used to calculate the NOx and PM concentrations using the following equation adapted from DeAngelo (14):
Gram emissions/ton MSW = [g/bhp-hr x bhp x hours ] / [20 tons MSW/truck]
From this equation, the grams per second of NOx and PM concentrations were calculated for each option using the following parameters:
Option A: 1,000,000 tons of MSW is sent to PA landfill by truck
14
Option B: 20,000 tons of WTE ash is sent to PA landfill by truck (based on estimated 80% reduction in volume of waste, 51)
The individual and population inhalation health risks for these compounds were then calculated. The population health risks were calculated by multiplying the area of interest (approximately 92.2 km2 or 0.3 km x 232 km) by the population density (approximately 232 per km2) to yield the total affected population in the area (approximately 21,413 people). Population density was calculated using the average of the Census 2000 population densities for NY, NJ, and PA states (52). The results for the box model are presented in Table 9 in section 5.2. 4.3 WTE facility (Option B)
Ground level concentrations (GLCs) for the seven WTE generated air pollutants considered in this study were calculated using two approaches: (1) the Area Locations of Hazardous Atmospheres (ALOHA) and (2) a mathematical model using the Gaussian plume dispersion equation.
ALOHA is a computer-based air dispersion model designed by the National Oceanic and Atmospheric Administration (NOAA) for emergency responders (33). The model calculates GLCs using a continuous point source Gaussian plume dispersion. MARPLOT was used in conjunction with ALOHA to generate a graphical output of WTE emissions (33).
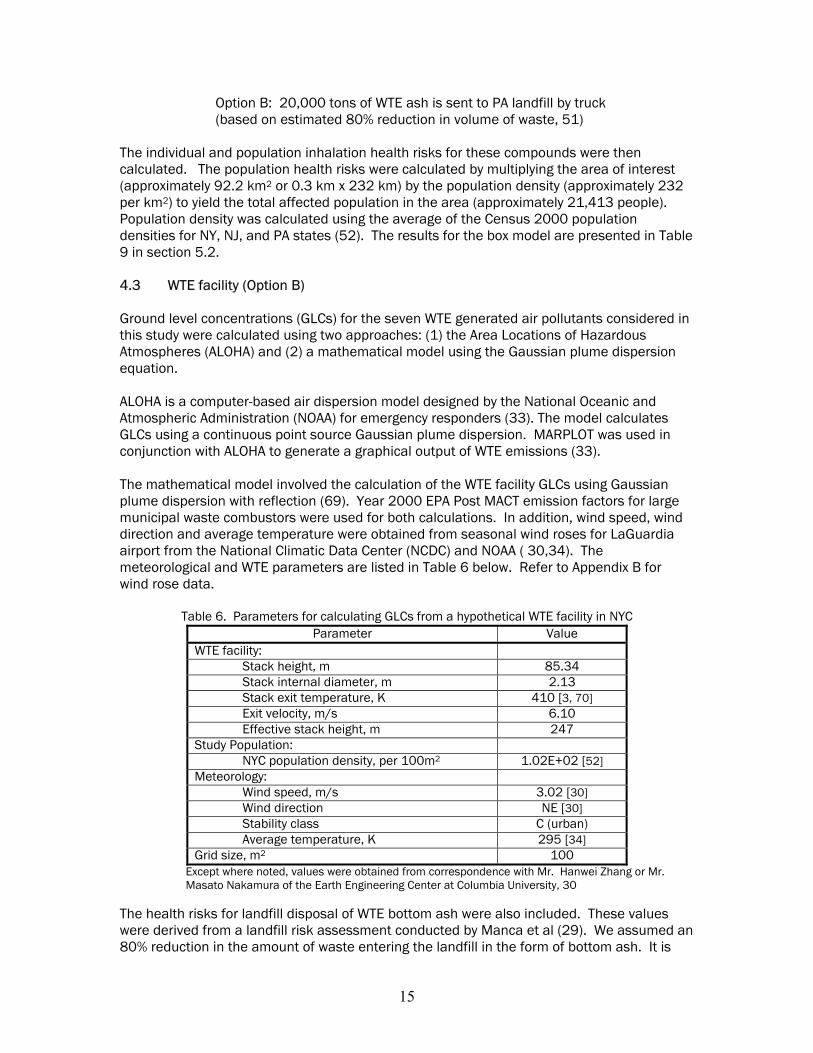
The mathematical model involved the calculation of the WTE facility GLCs using Gaussian plume dispersion with reflection (69). Year 2000 EPA Post MACT emission factors for large municipal waste combustors were used for both calculations. In addition, wind speed, wind direction and average temperature were obtained from seasonal wind roses for LaGuardia airport from the National Climatic Data Center (NCDC) and NOAA ( 30,34). The meteorological and WTE parameters are listed in Table 6 below. Refer to Appendix B for wind rose data.
Table 6. Parameters for calculating GLCs from a hypothetical WTE facility in NYC Parameter Value
WTE facility: Stack height, m 85.34 Stack internal diameter, m 2.13 Stack exit temperature, K 410 [3, 70] Exit velocity, m/s 6.10 Effective stack height, m 247
Study Population: NYC population density, per 100m2 1.02E+02 [52]
Meteorology: Wind speed, m/s 3.02 [30] Wind direction NE [30] Stability class C (urban) Average temperature, K 295 [34]
Grid size, m2 100 Except where noted, values were obtained from correspondence with Mr. Hanwei Zhang or Mr. Masato Nakamura of the Earth Engineering Center at Columbia University, 30
The health risks for landfill disposal of WTE bottom ash were also included. These values were derived from a landfill risk assessment conducted by Manca et al (29). We assumed an 80% reduction in the amount of waste entering the landfill in the form of bottom ash. It is
15
important to note that the composition and thus landfill emissions from WTE ash and MSW disposal differ. Due to lack of data on the composition of WTE ash leachate and air emissions in landfills, however, this study uses the same risk values for both WTE treatment (Option B) and landfill disposal of MSW (Option B). The risk value for landfill disposal of WTE ash in Option B was calculated by multiplying the risk value for landfill disposal in Option A by 0.2 (or 20% of total risk from landfill disposal to account for the 80% reduction in volume after WTE treatment) (51). 4.3.1 ALOHA model
The ALOHA model generates a concentration plot or footprint for a user-specified emission source and strength. The model only plots concentration values that exceed the Level of Concern (LOC) as specified by established health guidelines or the user. Since the pollutants emitted from the WTE facility in the present study were considerably lower than the LOC, the user specified the concentration levels for the concentration plot. See Appendix C for a description of the ALOHA model and required inputs. MARPLOT was used to generate a graphical output for the ALOHA model. Greenpoint Brooklyn was chosen as the hypothetical site for the WTE facility due to the area’s high dependency on truck transportation and concentration of WTS (13). A sample output is given in section 5.3.1.
4.3.2 Mathematical model
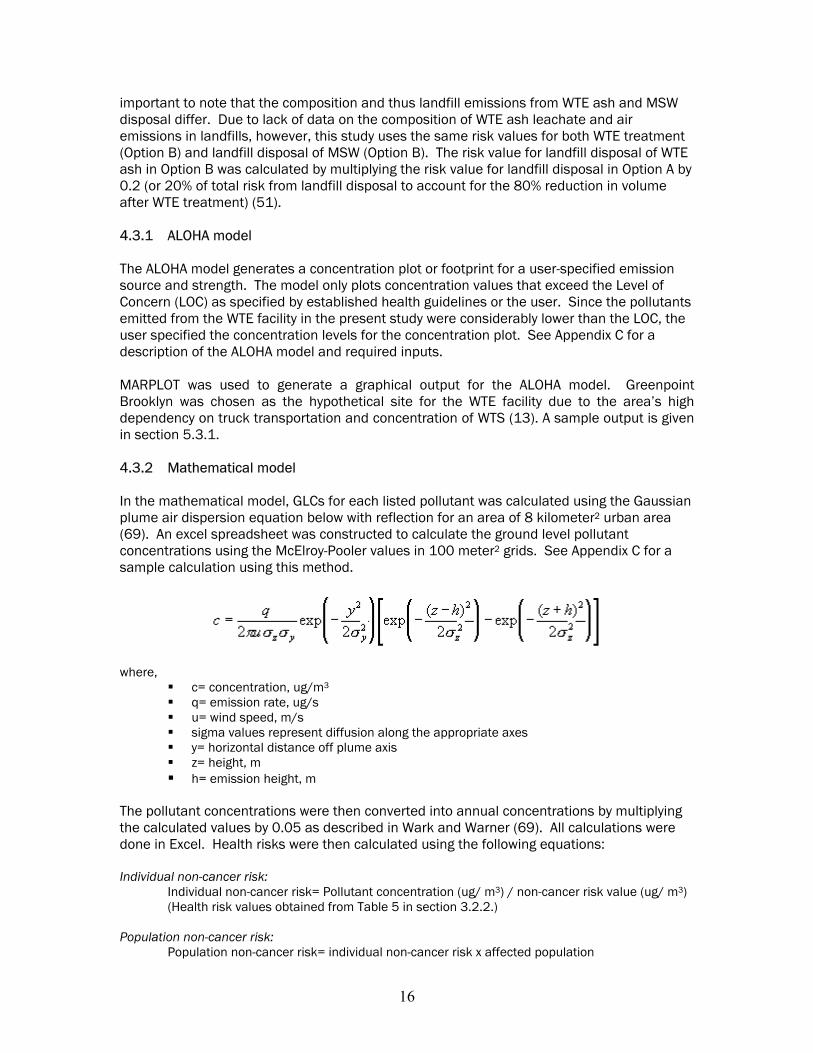
In the mathematical model, GLCs for each listed pollutant was calculated using the Gaussian plume air dispersion equation below with reflection for an area of 8 kilometer2 urban area (69). An excel spreadsheet was constructed to calculate the ground level pollutant concentrations using the McElroy-Pooler values in 100 meter2 grids. See Appendix C for a sample calculation using this method.
where, c= concentration, ug/m3 q= emission rate, ug/s u= wind speed, m/s sigma values represent diffusion along the appropriate axes y= horizontal distance off plume axis z= height, m h= emission height, m
The pollutant concentrations were then converted into annual concentrations by multiplying the calculated values by 0.05 as described in Wark and Warner (69). All calculations were done in Excel. Health risks were then calculated using the following equations: Individual non-cancer risk:
Individual non-cancer risk= Pollutant concentration (ug/ m3) / non-cancer risk value (ug/ m3) (Health risk values obtained from Table 5 in section 3.2.2.) Population non-cancer risk: Population non-cancer risk= individual non-cancer risk x affected population
16
Individual cancer risk: Individual cancer risk= Pollutant concentration (ug/ m3) / cancer unit risk value (m3/ug) Population cancer risk: Population cancer risk= individual cancer risk x affected population The exposed population was determined as follows: Exposed NYC population = 101.94 people/100m2 x 11660 100m2 exposed grid cells
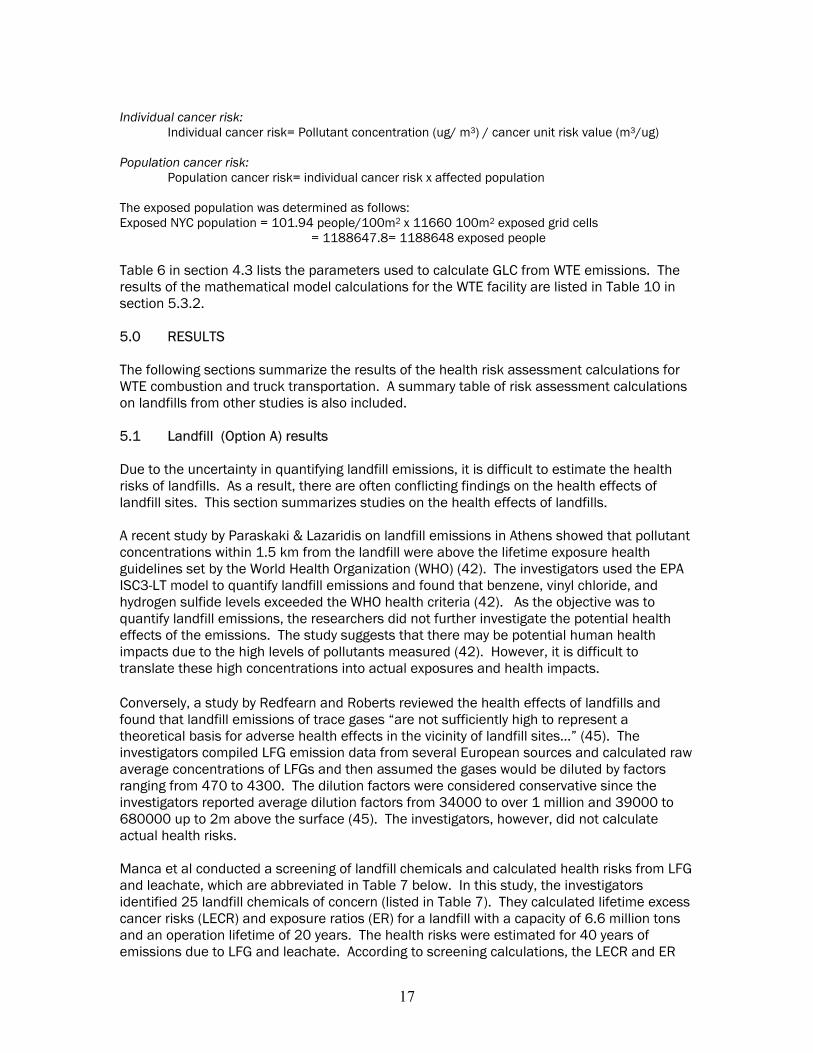
= 1188647.8= 1188648 exposed people Table 6 in section 4.3 lists the parameters used to calculate GLC from WTE emissions. The results of the mathematical model calculations for the WTE facility are listed in Table 10 in section 5.3.2. 5.0 RESULTS The following sections summarize the results of the health risk assessment calculations for WTE combustion and truck transportation. A summary table of risk assessment calculations on landfills from other studies is also included. 5.1 Landfill (Option A) results Due to the uncertainty in quantifying landfill emissions, it is difficult to estimate the health risks of landfills. As a result, there are often conflicting findings on the health effects of landfill sites. This section summarizes studies on the health effects of landfills. A recent study by Paraskaki & Lazaridis on landfill emissions in Athens showed that pollutant concentrations within 1.5 km from the landfill were above the lifetime exposure health guidelines set by the World Health Organization (WHO) (42). The investigators used the EPA ISC3-LT model to quantify landfill emissions and found that benzene, vinyl chloride, and hydrogen sulfide levels exceeded the WHO health criteria (42). As the objective was to quantify landfill emissions, the researchers did not further investigate the potential health effects of the emissions. The study suggests that there may be potential human health impacts due to the high levels of pollutants measured (42). However, it is difficult to translate these high concentrations into actual exposures and health impacts. Conversely, a study by Redfearn and Roberts reviewed the health effects of landfills and found that landfill emissions of trace gases “are not sufficiently high to represent a theoretical basis for adverse health effects in the vicinity of landfill sites…” (45). The investigators compiled LFG emission data from several European sources and calculated raw average concentrations of LFGs and then assumed the gases would be diluted by factors ranging from 470 to 4300. The dilution factors were considered conservative since the investigators reported average dilution factors from 34000 to over 1 million and 39000 to 680000 up to 2m above the surface (45). The investigators, however, did not calculate actual health risks. Manca et al conducted a screening of landfill chemicals and calculated health risks from LFG and leachate, which are abbreviated in Table 7 below. In this study, the investigators identified 25 landfill chemicals of concern (listed in Table 7). They calculated lifetime excess cancer risks (LECR) and exposure ratios (ER) for a landfill with a capacity of 6.6 million tons and an operation lifetime of 20 years. The health risks were estimated for 40 years of emissions due to LFG and leachate. According to screening calculations, the LECR and ER
17
for the entire facility were 2.7E-04 and 75.8 respectively, which are unacceptable according to EPA guidelines (37). For the purposes of this study, the LECR and ER values were divided by 6.6 million tons to get the LECR and ER per 1 million ton. These values are also shown in Table 7 below.
Table 7. Screening of air and leachate emissions from MSW landfills (abbreviated from 29) Landfill Chemical LECR LECR/1mt* ER ER/1mt*
Atmospheric emissions Carcinogenic air emissions
1,1-Dichloroethane 1.2E-04 1.8E-05 Vinyl chloride 6.5E-05 9.8E-05
Bromodichloromethane 3.3E-05 5.0E-06 1,1-Dichloroethylene 1.8E-05 2.7E-06
1,1,2,2-Tetrachloroethane 9.9E-06 1.5E-06
Methylene chloride 5.2E-06 7.9E-07 Trichloroethylene 2.6E-06 3.9E-07 1,2-Dichlorothane 1.3E-06 2.0E-07
1,1,2-Trichloroethane 1.0E-06 1.5E-07 Chloroethane 6.8E-07 1.0E-07
Benzene 2.2E-06 3.3E-07 Total Carcinogen 2.6E-04 3.9E-05
Systemic air emissions Methyl mercaptan 2.5 0.4 Ethyl mercaptan 1.6 0.2 Hydrogen sulfide 0.1 0.0 Total Systemic 4.2 0.6
Particulate Bound metal emissions Fe 56 8.5 Zn 14 2.1 Pb 1.6 0.2
Total Metal 71.6 10.8 Leachate emissions
Carcinogenic leachate emissions 1,1-Dichloroethane 9.3E-06 1.4E-06
Vinyl chloride 1.9E-06 2.9E-07 Total leachate 1.1E-05 1.7E-06
Total 2.7E-04 4.1E-05 75.8 11.5 LECR= Lifetime Excess Cancer Risk ER=Exposure ratio (Threshold= 0.1) *mt= million ton (Calculated by dividing original value by 6.6 million tons of MSW to yield risk per 1 million ton of MSW)
The health risk screening values for landfills from Manca et al show that landfills pose risks that are above the EPA’s acceptable risk value of 10-6. 5.1.1 WTS results Few, if any, health risk assessments have been conducted for WTS based on the literature review for this study. Instead, the health impacts of a marine transfer station (MTS) were obtained from the 2005 NYCDOS “Final Environmental Impact Statement (FEIS) for the New York City Comprehensive Solid Waste Management Plan” (39). The health risks from MTS may be less than those from WTS due to the reduced truck transportation impacts.
18

Nevertheless, the MTS study represents the best available data for a WTS facility in Greenpoint. The study presents the acute, chronic, and cancer risks of operating an MTS in Greenpoint as shown in Table 8. The DOS study did not associate these risks with the amount of waste handled at the MTS. The full chronic and cancer risks values were incorporated into Option A for this study.
Table 8. Highest estimated risks from toxic air pollutants from on-site emissions at Greenpoint converted MTS (abbreviated from 39)
Air Pollutant Acute Non Cancer Risk Chronic Non Cancer Risk Cancer Risk Carcinogens Benzene Formaldehyde 1,3 Butadiene
Total Cancer Risk 1.34E-07
Acetaldehyde Benzo(a)pyrene
Cancer Risk Threshold 1.0E-06
Non-carcinogens Propylene Acrolein Toluene Xylenes Anthracene Benzo(a)anthracene Chrysene Napthalene Pyrene Phenanthrene Dibenz (a,h) anthracene
Total Acute Hazard Index
2.83E-01 (Threshold= 1.00E+00)
Total Chronic Hazard Index
1.72E-01 (Threshold= 1.00E+00)
From NYC DOS FEIS of SWMP, April 2005. 5.2 Box model results for truck transportation impacts Table 9 below lists the results from the box model for calculating the health impacts from truck transportation. The health risks were calculated using the same equations as for health risk calculations for the mathematical model of the WTE facility as described in section 4.3.2. Table 9. Estimated health risks from truck transportation for landfill disposal and WTE combustion.
Non-Cancer Risk Cancer Risk Waste Mgmt Option Compound Conc.,
ug/m3 Individual HI
Population HI Individual Population
NOx* 2.57E-02 2.61E-04 5.58E+00 NA NA PM** 1.28E-03 2.61E-04 5.58E+00 3.91E-07 8.38E-03 A Total 2.74E-02 5.22E-04 1.16E+01 3.91E-07 8.38E-03 NOx 5.22E-03 5.22E-05 1.12E+01 NA NA PM 2.61E-04 5.22E-05 1.12E+01 7.82E-08 1.68E-03 B
Total 5.47E-03 1.04E-04 2.24E+00 7.82E-08 1.68E-03 Ratio
(Option A / Option B) 5.00E+00 5.00E+00 5.00E+00 5.00E+00
*NOx health effects assumed to be from NO2 **PM health effects were assumed to be from diesel exhaust particles (DEP) HI= Hazard Index (Threshold = 1.00E+00), NA= Not applicable Population= 21,412
19

Table 10 shows the health impacts of truck transportation and the difference in health risks between Option A and B. The total non-cancer individual risks for both options are within acceptable health limits, but the population risk for Option A (landfill) may be significant. Overall, the results of the box model suggest that the health risks from truck transport in Option A (landfill) are greater than Option B (WTE combustion). This is consistent with the fact that WTE combustion reduces the amount of truck trips required to transport waste to landfills. 5.3 WTE facility (Option B) results The results for the health risk assessment for Option B, WTE treatment in NYC are described below. 5.3.1 ALOHA model output Figure 6 below is an example of a graphical output or footprint of NO2 emissions from the WTE facility using ALOHA and MARPLOT. The footprint illustrates the dispersion pattern of a typical NO2 plume using NYC specific meteorological data and user specified concentrations for NO2 emissions from the WTE facility. The user specified concentrations at 1.00e-02 and 1.00e-03 mg/m3 because ALOHA does not plot footprints for concentrations that do not exceed the LOC. Thus, the footprint below does not represent any health risks to nearby populations since the user specified concentration values were below the LOC for NO2 (NAAQS for NO2= 1.00E-01 mg/m3).
Figure 6. Diagram of ALOHA output for NO2 emissions from hypothetical WTE combustor in Greenpoint, Brooklyn
N S
1.00E
1.00E-03
Inner ring
Outer ring
MANHATTA
-02 mg/m3
mg/m3
Greenpoint
N
Y
20
QUEEN
BROOKLY
NEW YORK CIT

The inner ring illustrates the plume’s centerline and the outer ring represents all potential plume directions. According to this Figure, an NO2 concentration of 1.00E-02, which is 100 times less than the NAAQS would only impact populations residing in the waterway. As ALOHA creates footprints using real-time NYC weather data, the footprint may change according weather conditions. Nonetheless, exposure to WTE emissions in air remains insignificant to human health according to this model. An NO2 concentration of 1.00E-03, which is 1000 times below the NAAQS, would impact populations living in the lower east portion of Manhattan. Thus, the impact of NO2 emissions from the WTE facility is not likely to pose health risks to nearby populations based on the ALOHA model. However, a major weakness of ALOHA for the current application is the lack of chemical data in its database. The ALOHA model does not estimate heavy metal emissions or dioxins, which are important pollutants of concern in WTE facilities. Therefore, ALOHA had limited applications to the scope of this study. 5.3.2 Mathematical model Although it represents a rough approximation, the mathematical model provides quantitative values, which can be used to estimate health risks from the WTE facility. Table 7 below shows the results of the health risk calculations for WTE treatment (Option B) using the pollutant concentrations calculated from the mathematical model. The health risk values are listed in Table 5 in section 3.2.2.
Table 10. Health risk results for WTE combustion (from mathematical model) Non-Cancer Risk Cancer Risk
Compound
Annual Average
GLC (ug/m3)
Individual Non-Cancer Risk
Population risk Individual
risk Population
risk
Dioxin (TEQ) 1.90E-11 4.22E-07 5.02E-01 6.35E-08 7.54E-02 Mercury 3.16E-06 1.05E-05 1.25E+01 NA NA
Cadmium 4.79E-07 4.79E-05 5.69E+01 2.01E-09 2.39E-03 Lead 6.84E-06 4.56E-06 5.42E+00 8.21E-11 9.76E-05 PM 1.02E-03 2.04E-05 2.42E+01 ND ND HCl 3.84E-03 4.27E-04 5.08E+02 NA NA SO2 5.88E-03 7.53E-05 8.96E+01 NA NA
NO2* 4.03E-03 4.02E-05 4.78E+01 NA NA Totals 9.12E-02 Total HI 6.26E-04 Total HI 7.45E+02 6.55E-08 7.79E-02
GLC= Ground level concentration, HI=Hazard Index (Threshold=1.00E+00) *NO2 concentration was calculated by multiplying the NOx concentration by 0.05 (27). Population exposed= 1188648, See Appendix D for Calculation As Table 10 illustrates, the health risks associated with WTE combustion using the mathematical model range from 4.22E-07 to 4.27E-04 and 5.02E-05 to 5.08E-02 for non-cancer individual and population risks, respectively. The total individual and population risk or Hazard Index for non-cancer health effects from WTE combustion is 6.26E-04 and 7.45E+02, respectively. The individual non-cancer risk is well below the threshold value of 1.0E+00 for non-cancer health effects (37, 39). However, the population risk shows that approximately 744 people may experience non-cancer health effects (i.e. respiratory symptoms) due primarily to hydrogen chloride emissions. Table 10 shows that the emissions from the hypothetical WTE facility would pose no significant non-cancer health risks to individuals, but slight health effects in exposed populations according to the results from the mathematical model.
21

Cancer risk is also represented in both individual and population risk. From Table 10 we see that the cancer risk range is from 8.21E-11 to 6.35E-08 for individual risk and 9.76E-05 to 7.54E-02 for population risk. The total cancer risk values for individuals and exposed populations are 6.55E-08 and 7.79E-02, respectively. This translates to a 6.5 in 100 million chance of an individual developing cancer over a lifetime or an excess of 0.078 cancers in the exposed population over a lifetime. These risks are well below the EPA cancer threshold of 1.0E-06 (37, 62). The individual and population cancer risks from the hypothetical WTE facility are not considered significant based on the results of the mathematical model. The total GLC profile is shown graphically in Figure 7. This graph depicts the x and y dispersions for total emissions from the WTE facility using the values listed in Table 6. Maximum GLCs are reached at approximately 4300 m away from the facility along the centerline.
Figure 7. Total pollutant concentration versus x and y distance from WTE combustor
100
1700
3300
4900
6500
8000
4400
800
-2800
-6400
00.20.40.60.81
1.21.41.61.82
Concentration, ug/m3
X distance, m
Y distance, m
Total Ground Level Concentration (ug/m3) Profile for WTE Emissions vs. Distance (m)
1.8-2
1.6-1.8
1.4-1.6
1.2-1.4
1-1.2
0.8-1
0.6-0.8
0.4-0.6
0.2-0.4
0-0.2
Concentration, ug/m3
6.0 SUMMARY OF RESULTS The total health risks for Options A and B are summarized in Table 11 below. Table 11 also lists the risk difference for the two options.
22

Table 11. Summary of estimated health risks for Options A and B.
Option Activity Individual Non-cancer risk HI
Population Non-cancer risk HI
Individual Cancer risk
Population Cancer risk
MTS* 2.83E-01 ND 1.34E-07 ND Truck Transport 5.22E-04 1.16E+01 3.91E-07 8.38E-03
Landfill** 1.15E+01 ND 4.09E-05 ND A
Total 1.18E+01 1.16E+01 4.14E-05 8.38E-03 WTE facility 6.26E-04 7.45E+02 6.55E-08 7.79E-02
Truck Transport 1.03E-04 2.24E+00 7.82E-08 1.68E-03 Landfill* 2.30E+00 ND 8.18E-06 ND
B
Total 2.30E+00 7.47E+02 8.33E-06 7.96E-02 Ratio
(Option A/Option B) 5.12E+00 ND 4.98E+00 ND
ND= No data * Data from NYCDOS FEIS 2005 (39). Individual non cancer HI was calculated by taking the average of the acute and chronic HI ([2.83E-01+1.73E-01]/2) ** Data from Manca et al 1997 (29). For WTE, the risk values per 1 million ton of waste from Table 8 were multiplied by 0.2 to account for the 80% volume reduction of landfill waste after WTE treatment. According to Table 11, the health risks of both Option A and B are within the EPA’s acceptable health risk guidelines of 10-6 to 10-4 (37). The results also suggest that the overall health risks from Option A (landfill) are greater than those for Option B (WTE combustion). Landfill emissions are responsible for a majority of the health risks for both options. However, it is important to note that the health risks from landfills may differ for MSW and WTE ash due to different waste compositions. The population risks were not compared in landfills due to lack of data. Note that when the impacts of landfills are removed from the total values, landfill disposal (Option A) continues to pose higher cancer risk than WTE combustion (Option B) due to the health impacts from truck transportation. 7.0 DISCUSSION AND COMPARISON Both WTE combustion and landfills emit pollutants into the environment that may impact human health. According to the findings of this study, the cancer risks from landfills (Option A) and WTE combustion (Option B) are within EPA’s acceptable limits (4.14E-05 and 8.33E-06, respectively) of 1.0E-04 to 1.0E-06 (37). Non-cancer risks (i.e. respiratory symptoms) for these waste management options, however, may be more significant. Landfill emissions are responsible for the majority of health impacts for both options. In particular, landfills constitute approximately 99.8 and 89.6% of the total individual non-cancer and cancer risks in Option B, respectively. Irrespective of landfills, the cancer risk for Option A continues to exceed that for Option B due to the impact of increased truck transportation. Since most of NYC’s waste is transported to out-of-state landfills by trucks, these transportation impacts may present significant health risks in a NYC setting. These transportation impacts are particularly relevant to Greenpoint, Brooklyn, which, unlike other NYC boroughs, relies solely on out-of-state truck transport of their MSW. Based on other studies, the estimated WTE combustion risks presented in this paper are not unreasonable. For example, a multiple pathway health risk assessment on a WTE facility in Montgomery County, MD estimated cancer risks ranging from 1.07E-07 to 2.41E-08 based on actual emission data (44). The WTE combustion cancer risk from this study, 6.55E-08 falls closely in this range. In addition, the cancer risks for Montgomery County for cadmium and dioxin further validates the results from this study (Montgomery- Cd: 1.57E-09 to 1.11E-07, Dioxin: 1.45E-08 to 5.08E-07; Present study- Cd: 2.01E-09, Dioxin: 6.35E-08). Non-cancer risks for cadmium and mercury between the two studies were also compared
23

(Montgomery- Cd: 6.80E-08 to 5.26E-07, Hg: 1.62E-07 to 1.33E-06; Present study: Cd: 4.79E-05, Hg: 1.05E-05). It is important to note that this study considers the impact of treating approximately 3000 tons of MSW per day, which is nearly 1.5 times the amount of MSW treated in the Montgomery facility. Other studies on landfill health risk values were also in agreement with those derived in this study from Manca et al. For example, Redfearn and Roberts reported a cancer risk of 2x10⁻⁵ for an individual living 100 meters from the edge of a landfill (45). The estimated individual cancer risk for Option B was 4.09E-05. This value is slightly more conservative and within range of the value reported by Redfearn and Roberts. However, without actual emissions data on LFG and leachate, it is difficult to assess the accuracy of the reported risk values. The comparative health impacts of Options A and B were also evaluated. In their paper, Eschenroeder and von Stackelback compared the health risks from landfills and WTE facilities and found that landfills resulted in both significantly increased non-cancer and cancer risks and that the bulk of the risk from landfills was due to groundwater contamination from leachate, as is also suggested by the current study (21). Eschenroeder and von Stackelback estimated that the overall cancer risks from landfill and MACT combustor emissions were 1.1E-05 and 4.0E-06, respectively, which are within the ranges reported in this study (4.09E-05 for landfill and 6.55E-08 for the WTE facility) (21). The cancer risk from landfill disposal and WTE combustion were approximately 4-fold greater and 20–fold lower, respectively, in this study than the Eschenroeder and von Stackelback paper. This may be explained by the fact that the Eschenroeder and von Stackelback study was conducted before the year 2000 MACT WTE combustor retrofit standards, which may result in higher pollutant concentrations and cancer risks. The present study used post MACT 2000 data to calculate pollutant concentrations and health risks for WTE combustion. For landfill disposal, the discrepancy may be due to the inherently large variability of LFG and leachate emissions as illustrated in Table 3 in section 3.2.1.2. Another comparative study by the Canadian Ministry of the Environment was again within agreement with the findings of this study. The Canadian study estimated that the combined cancer risk range of 4 x 10⁻⁶ to 1 x 10⁻⁵ and 4.7 x 10⁻⁸ to 2.3 x 10⁻⁷ for landfills and combustion facilities, respectively (10). For combustion, the majority of the non-cancer risk was derived from nitrogen oxide and hydrogen chloride emissions, while particle bound iron was responsible for the bulk of non-cancer risks for landfills (10). In this study, the primary non-cancer risks from WTE combustion were derived from hydrogen chloride and iron contributed to almost all of the non-cancer risks from landfills. Although the results are in agreement with other studies, the methodology and models used in this study also require evaluation. As mentioned in section 5.1.1, the ALOHA model did not provide sufficient quantitative data to estimate health risks. The mathematical model was an alternate approach to using EPA computer models, which were being updated during this study. While the mathematical model provided a rough estimate, the emission rates were reasonable as described above (10, 21). The box model was also a rough approximation of transportation impacts and did not incorporate the impact of chemical properties, meteorological conditions (besides wind speed), and terrain type, which may significantly alter the concentration of pollutants. However, the box model was sufficient for the scope of this project. The MOBILE6 model developed by the EPA may be a more accurate method of estimating pollutant concentrations from mobile sources and its application may be a potential area of future research should this study be expanded (65).
24

The socioeconomic and community impacts of landfills and WTE facilities are also important to consider but were beyond the scope of this work (36). Issues such as environmental justice and equity are central issues in sitting waste management facilities should be assessed in future studies. 8.0 SUMMARY AND CONCLUSION The present study provides a rough estimation and comparison of the health impacts from landfill disposal and WTE treatment. Although there may be uncertainties in the models and assumptions used in this study, other studies support the conclusion that the health risks from the use of landfills may be greater than WTE treatment. A major source of uncertainty and variability in assessing the risks of landfills is attributed to the identification and quantification of LFG and leachate emissions, which may significantly influence the results this assessment. In particular, this study showed that the health risks from landfills dominate in both scenarios. Impacts from truck transportation were also an important contributor to overall health risks. In fact, truck emissions led up to a ten-fold increased risk in landfill disposal alone. The results of this work, however, should be interpreted as a first attempt in assessing the relative health risks of the two waste management options. Further investigations are necessary to expand and validate or modify the findings of this study. Future studies may want to consider multi-compartment and/or scenario analyses and the use of emissions data from actual facilities and EPA dispersion models, such as MOBILE6 for truck emissions and AERMOD for WTE and landfill emissions (65, 66). Statistical analyses (e.g. Monte Carlo) may also be used to evaluate the uncertainty of future study results. In addition, landfill emissions from both MSW and WTE ash should also be quantified further to ensure a more accurate estimation and characterization of health risks. Finally, the socioeconomic and environmental justice issues of landfills and WTE facilities should also be examined.
25

REFERENCES
1. Agency for Toxic Substances and Disease Registry (ATSDR). Landfill gas primer: An overview for environmental health professionals. Chapters 2-4. 2001. http://www.atsdr.cdc.gov/HAC/landfill/html/intro.html Accessed 3/7/2005.
2. Agency for Toxic Substances and Disease Registry (ATSDR). Final Toxicological Profiles. 1998. http://www.atsdr.cdc.gov/toxpro2.html#Final Accessed 2/22/05.
3. Bahor, B. Email correspondence with Mr. Brian Bahor of Covanta Energy regarding stack exit temperature of a typical WTE facility. 6/05.
4. Berman S, Ku J-Y, Rao ST. Spatial and Temporal Variation in the Mixing Depth over the Northeastern United States during the Summer of 1995. 1999. J of App Meteorology. 38(12): 1661-1673.
5. Boyd, C for City of New York Office of the Comptroller Office of Policy Management. No room to move: New York City’s solid impending solid waste crisis, October 2004. Also online at: http://www.comptroller.nyc.gov/bureaus/opm/reports/Oct06-04_No-room-to-move.pdf
6. California Environmental Protection Agency (Cal EPA). Findings of the Scientific Review Panel on The Report on Diesel Exhaust as adopted at April 22, 1998 meeting. http://www.arb.ca.gov/toxics/dieseltac/de-fnds.htm?PF=Y Accessed 5/27/05.
7. California Office of Environmental Health Hazard Assessment (CA OEHHA). Toxicity Criteria Database. http://www.oehha.ca.gov/risk/ChemicalDB/index.asp, Accessed 3/22/05.
8. California Office of Environmental Health Hazard Assessment (CA OEHHA). September 2004- Cancer Potency Factors. http://www.oehha.ca.gov/risk/pdf/092204cpf_alpha.pdf, Accessed 4/12/05.
9. Camobreco V, Ham R, Barlaz M, Repa E, Felker M, Rousseay C, Rathle J. Life-cycle inventory of a modern municipal solid waste landfill. Waste management and research. 1999 17:394-408.
10. Canada Ministry of the Environment. Environmental risks of municipal non-hazardous waste landfilling and incineration- Technical report summary. July 1999. p.11.
11. Charnley G and J Doull. Human exposure to dioxins from food, 1999-2002. Food and Chemcial Tox. 43 (2005) 671-679.
12. Christensen TH, Kjelsen P, Bjerg PL, Jensen DL, Christensen JB, Baun A, Albrechtsen H-J, Heron G. Review: Biogeochemistry of landfill leachate plumes, 2001. Applied Geochemistry. 16: 659-718.
13. Columbia University Earth Institute, Earth Engineering Center and Urban Habitat Project at Center for Urban Research and Policy of School of International and Public Affairs. Life after Fresh Kills: Moving beyond New York City’s current waste management plan. Policy, technical and environmental considerations. Dec 2001. http://www.seas.columbia.edu/earth/EEC-SIPA-report-NYC-Dec11.pdf Accessed 6/9/05.
14. DeAngelo, M. Siting of waste-to-energy facilities in New York City using GIS technology. M.S. thesis for Department of Earth and Environmental Engineering, Columbia University. May 2004. Available online at http://www.seas.columbia.edu/earth/wtert/sofos/DeAngelo_Thesis_final.pdf
15. deFur P, Shelley S. Landfill and other waste sites in Virginia- Threats to health and the environment. Environmental Stewardship Concepts. Nov 2002. http://www.deq.state.va.us/waste/pdf/landfillsVA.pdf, Accessed 4/15/05.
16. Department for Environment, Food and Rural Affairs. Review of environmental and health effects of waste management: municipal solid waste and similar wastes. May 2004. http://www.defra.gov.uk/environment/waste/research/health/, accessed 2/7/05.
26

17. Deriziotis PG. Substance and perceptions of environmental impacts of dioxin emissions. M.S. thesis for Department of Earth and Environmental Engineering, Columbia University. May 2004. Available online at http://www.seas.columbia.edu/earth/wtert/sofos/Deriziotis_thesis_final.pdf
18. Elliott P, Briggs D, Morris S, de Hough C, Hurt C, Kold Jense T, Maitland I, Richardson S, Wakefield J, and Jarup L. Risk of adverse birth outcomes in populations living near landfill sites, Aug 2001. BMJ 323:363-368.
19. Energy Information Administration (EIA), Department of Energy (DOE). Waste-to-energy. http://www.eia.doe.gov/kids/energyfacts/saving/recycling/solidwaste/wastetoenergy.html Accessed 6/1/05.
20. Environmental Defense (Cruz R, Outerbridge T, Tripp J). Trash and the City. Executive Summary. Available at http://www.environmentaldefense.org/documents/4185_TrashAndTheCity_ExecSumm.pdf
21. Eschenroeder A, von Stackelberg K. Health risks of landfilling versus combustion of municipal solid waste: An Illinois comparison. Paper 99-57 Air and Waste Management Assoc. 92nd annual meeting, June 20-24, 1999, St. Louis, Missouri.
22. European Union (EU). Council Directive 1999/31/EC of 26 April 1999 on the landfill of waste Official Journal L 182 , 16/07/1999 P. 0001 – 0019. http://europa.eu.int/smartapi/cgi/sga_doc?smartapi!celexapi!prod!CELEXnumdoc&lg=EN&numdoc=31999L0031&model=guichett, Accessed 3/21/05.
23. Kelly, KE. Health risk assessment of hazardous waste incinerator stack emissions, 1985. Doctoral thesis for DrPH at Columbia University School of Public Health.
24. Kinney P. Discussions and emails with Dr. Patrick Kinney of the Environmental Health Sciences Department at the Mailman School of Public Health at Columbia University. 2005.
25. Kjelsen P, Barlaz M, Rooker AP, Baun A, Ledin A, and Christensen TH. Present and long-term composition of MSW landfill leachate: A Review, 2002. Critical Reviews in Environmental Science and Technology, 32(4):297-336.
26. Krishnan, N. Meetings to discuss thesis, models, calculations, etc with Dr. Nikhil Krishnan, a fellow at the Earth Engineering Center at Columbia University. 2005.
27. Lee S. Discussion with Mr. Shang-hsui Lee, a PhD candidate at the Earth Engineering Center at Columbia University on composition of NOx emissions from WTE facility. Mar 2005.
28. Lee, FG and A Jones-Lee. Municipal landfill post-closure care funding: The “30-year post-closure care” myth. G. Fred Lee & Assoc. July 1992. http://www.gfredlee.com/lfclos.htm, accessed 3/22/05.
29. Manca D, Birmingham B, Raha D. Toxicological screening of chemical emissions from Municipal Solid Waste Landfills. Application of a predictive framework to a state of the art facility. Human and Ecological Risk Assessment. 3(2): 257-286. (1997)
30. Nakamura M, Zhang H. Meetings and email correspondence with Masato Tominaga and Hanwei Zhang, both PhD candidates at the Department of Environmental Engineering at Columbia University to discuss WTE combustion. Feb to June 2005.
31. National Climactic Data Center (NCDC). New York La Guardia Airport WMO No. 725030. Record 1973-1995. Courtesy of Mr. Scott Stephens from NCDC.
32. National Park Service (NPS) Sources of air pollution. 1/2001. http://www2.nature.nps.gov/air/AQBasics/sources.cfm Accessed 5/19/05.
33. National Oceanic Atmospheric Administration (NOAA). CAMEO. November 2004. http://response.restoration.noaa.gov/cameo/intro.html Accessed 3/2/05.
34. National Oceanic Atmospheric Administration (NOAA). Climate report Upton NY for NY La Guardia airport. 2005
27

http://www.srh.noaa.gov/fwd/productviewnation.php?pil=OKXCLILGA&version=7 Accessed4/7/05.
35. National Renewable Energy Laboratory (NREL), U.S. Department of Energy. Prepared by Elliott DL, Holladay CG, Barchet WR, Foote HP and Sandusky WF. 1996 Wind Energy Resource Atlas of the United States. DOE/CH 10093-4 http://rredc.nrel.gov/wind/pubs/atlas/titlepg.html Accessed 5/4/05.
36. National Research Council (NRC), Commission on Life Sciences (CLS). Waste incineration and public health. 2000. National Academy Press, Washington DC.
37. National Research Council (NRC), Commission on Life Sciences. Science and Judgment in Risk Assessment (1994). National Academy Press. Washington DC.
38. NYC Planning. Brooklyn community district 1 profile. Nov 2004. http://www.nyc.gov/html/dcp/pdf/lucds/bk1profile.pdf Accessed 6/12/05.
39. NYC Department of Sanitation (NYC DOS). Final Environmental Impact Statement (FEIS) for the New York City Comprehensive Solid Waste Management Plan. April 2005. http://www.nyc.gov/html/dos/html/pubnrpts/swmp-5apr-feis.html Accessed May 4, 2005.
40. NYC DOS. Comprehensive solid waste management plan- Attachment II. October 2004. http://www.nyc.gov/html/dos/html/pubnrpts/swmp-4oct.html, Accessed 3/9/05
41. Ontario Ministry of the Environment. Environmental risks of municipal non-hazardous waste landfilling and incineration. July 1999. http://www.ene.gov.on.ca/envision/techdocs/3795e.pdf Accessed 3/3/05.
42. Paraskaki I, Lazaridis M. Quantification of landfill emissions to air: a case study of the Ano Liosia landfill site in the greater Athens area. Waste Management & Research 2005: 199-204.
43. Pope III, CA, Burnett, RT, Thun, MJ, Calle, EE, Krewski, D, Ito, k, and G Thurston. Lung cancer, cardiopulmonary mortality and long-term exposure to fine particulate air pollution. JAMA. 2002; 287, 9: 1132-1141.
44. Rao RK, Chadhuri I, Stormwind B, Ruffle B. Multiple pathway health risk assessment of a municipal waste resource recovery facility in Maryland. August 2003. EM.
45. Redfearn A, Roberts D. Health effects and landfill sites. Issues on Environmental Science and Technology. 2002, 18: 103-140.
46. Rushton L. Health hazards and waste management. BMB. 2003; 68: 183-197. 47. Schecter A, Papke I, Tung KC, Joseph J, Harris TR, and J Dahlgren. Polybrominated
diphenyl ether flame retardants in the US population: Current levels, temporal trends, and comparison with dioxins, dibenzofurans, and polychlorinated biphenyls. JOEM (2005) 47:3: 199-211.
48. Snary C. Health risk assessment for planned waste incinerators: Getting the right science and the science right. 2002. Risk analysis. 22(6): 1095-1105.
49. Themelis NJ, Karsten M. The case for WTE as a renewable source of energy. 12th North American WTE conference (NAWTEC 12). 2004.
50. Themelis, NJ. Integrated management of solid wastes for New York City. American Society of Mechanical Engineers Proceedings of NAWTEC. May 10, 2002. p.69-86.
51. Ulloa P. Meetings with Ms. Priscilla Ulloa, M.S. candidate at the Department of Environmental Engineering at Columbia University. Feb to June 2005.
52. U.S. Census Bureau. USA Quickfacts 2000 for NY, NJ, PA. Updated Feb 2005. http://quickfacts.census.gov Accessed 5/27/05.
53. U.S. EPA Office of transportation and air quality (OTAQ). Mobile source emissions- Past, present, future. Pollutants. 2005. http://www.epa.gov/otaq/invntory/overview/pollutants/index.htm, Accessed 5/20/05
28

54. U.S. EPA fact sheet. Diesel exhaust in the United States. EPA 420-F-02-048, September 2002. http://www.epa.gov/otaq/retrofit/documents/420f03022.pdf The unit of measure used by the EPA for diesel emissions, g/bhp-hr= grams pollutant released per brake horsepower hour. Accessed 4/19/05.
55. U.S. EPA Office of transportation and air quality (OTAQ). Environmental fact sheet: Air toxics from motor vehicles. 1994. http://www.epa.gov/otaq/f02004.pdf, Accessed 5/20/05
56. U.S. EPA National Ambient Air Quality Standards (NAAQS). Updated 2005. http://epa.gov/air/criteria.html Accessed 6/10/05.
57. U.S. EPA Region 6. Chapter 8 Uncertainty interpretation for human health risk assessment. http://support.lakes-environmental.com/Protocols/HHRAP/Volume1/Chpt8-hh.PDF, Accessed 5/1/05.
58. U.S. EPA Technology transfer network (TTN). Air Toxics Website. http://www.epa.gov/ttnatw01/hlthef/, Accessed 5/25/05.
59. U.S. EPA. EPA Docket A-90-45, Performance Data for Large MWC at MACT (Year 2000). Obtained from EPA docket center 2/2005.
60. U.S. EPA. Exposure and human health risk assessment of 2,3,7,8 tetrachlorodibenzo-p-dioxin and related compounds. NAS review draft. Nat’l Ctr for Env Assessmt, Off Research and Dev. Washington, DC. http://www.epa/gov/ncea/pdfs/dioxin/nas-review/, Accessed 4/13/05.
61. U.S. EPA. Health Effects Assessment Summary Tables. 1997. 62. U.S. EPA. Integrated Risk Information System (IRIS) database.
http://www.epa.gov/iris/, Accessed 2/22/05. 63. U.S. EPA. RCRA Orientation Manual. Section II. Managing solid waste- RCRA Subtitle
D. Jan 2003. http://www.epa.gov/epaoswer/general/orientat/rom2.pdf Accessed 3/22/05.
64. U.S. EPA. Six common air pollutants. Dec 2004. http://www.epa.gov/air/urbanair/6poll.html Accessed 5/19/05.
65. U.S. EPA. Modeling and inventories. MOBILE6 vehicle emission modeling software. Update 5/05. http://www.epa.gov/otaq/m6.htm Accessed 5/19/05.
66. U.S. EPA. Technology Transfer Network. Support center for regulatory air models. Update 5/05. http://www.epa.gov/scram001/tt26.htm Accessed 3/10/05.
67. U.S. EPA. RCRA Orientation Manual- Section II: Managing Solid Waste- RCRA Subtitle D. October 2003. http://www.epa.gov/epaoswer/general/orientat/rom2.pdf , Accessed 2/9/05.
68. U.S. EPA. Basic facts- Municipal landfills. http://www.epa.gov/epaoswer/non-hw/muncpl/facts.htm, Accessed 3/21/05.
69. Wark K, Warner CF, Davis W. Air pollution- Its origin and control, 3rd Ed. Addison Wesley Longman, Inc.: CA. 1998.
70. Yaws CL. Chemical properties handbook. McGraw-Hill. 1999. Electronic resource from Columbia Library. Accessed 6/5/05.
29

APPENDIX
Appendix A. WTE combustor emission rate calculation
The emission rate for the WTE combustor was calculated as follows:
Assume: 1 million tons of MSW combusted 330 days of operation per year
Emission factors from Table 2 Emission rate (ug/s)= [Emission Factor (kg/Mg MSW fired) x 1 million tons MSW x 10 E+09 ug/kg] / [1.1023113 Mg/ton x 330 days/year x 24 hours/day x 3600 seconds/hour
30
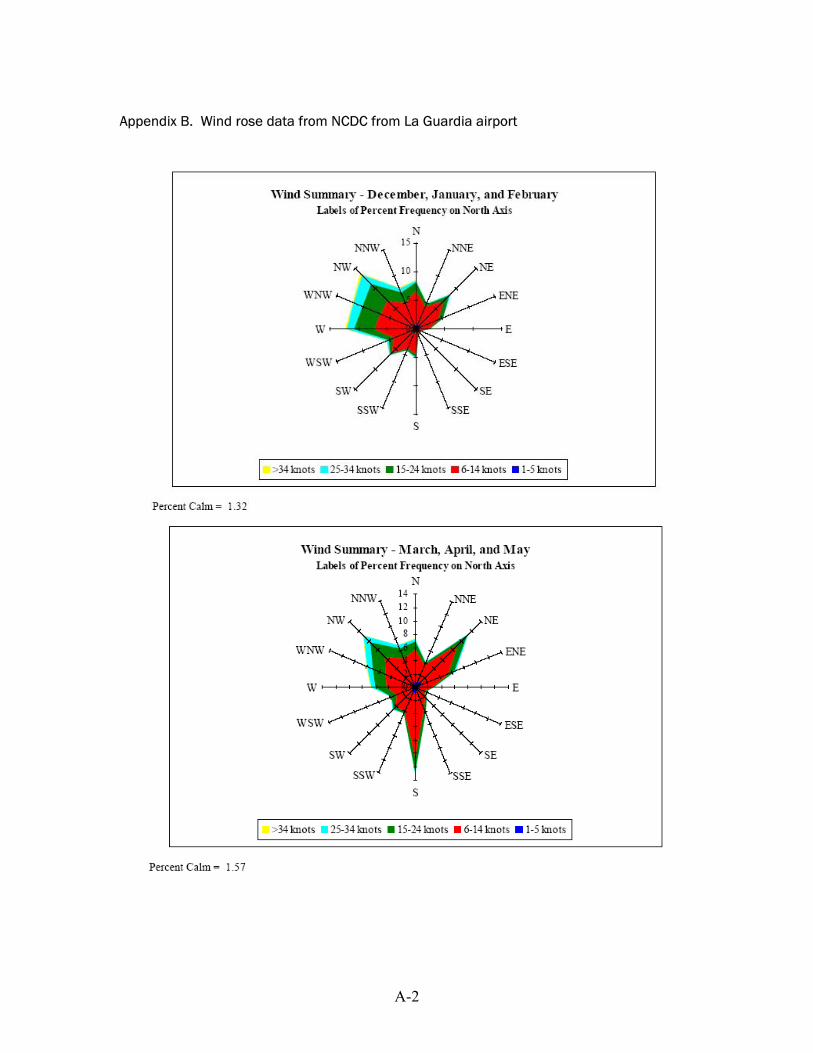
Appendix B. Wind rose data from NCDC from La Guardia airport
A-2

A-3

NYC Wind Direction and Speed
-2.5
-2.0
-1.5
-1.0
-0.5
0.0
0.5
1.0
1.5
2.0
2.5
-3.0 -2.0 -1.0 0.0 1.0 2.0 3.0
m/s
m/s
Dec-FebMar-May
June-AugSept-Nov
Annual
N
A-4

Appendix C. ALOHA model description and inputs The ALOHA model uses Gaussian plume dispersion to calculate the concentrations of pollutants from a given emission source. The advantage of ALOHA is its ease of use, ability to link to mapping programs, and incorporation of variables, such as wind speed, temperature, terrain, humidity, and chemical properties. The ALOHA model presents results in two forms- a plot diagram and a concentration profile. The concentration profile depicts the concentration at a given point from the emission source as a function of time, while the plot diagram illustrates the pollutant concentrations at a given distance from the emission source. The model contains default concentrations based on the standards such as Immediately Dangerous to Life and Health (IDLH) or Permissible Exposure Limits (PELs) as well as an option for the user to specify the concentration levels for the plot. The model only plots concentration values that exceed the Level of Concern (LOC) as specified by established health guidelines or the user. The following is a list of inputs required for the ALOHA model: INPUT DATA Site Data Location Building parameters
Building type: single story, double stories, enclosed office building, or air exchanges Building surroundings: sheltered/unsheltered
Setup Chemical: select chemical from drop down list Atmospheric input Wind speed: knots, MPH, m/s Wind direction Measurement height above ground: ground level, meteorological station, or value (ft/m) Ground roughness: open country, urban/forest, or input roughness (inch/cm) Cloud cover: select complete, partial clear, or enter value (0-10) Air Temperature: degrees F or C Stability class: select A through F Inversion height: select none or inversion height present (enter value in ft/m) Humidity: select wet, medium, dry, or enter value (0-100%) Source (select direct) Source strength units of mass or volume: g, m#, kg, L, lb, ft#, tons, gallons Select instantaneous or continuous source Amount of pollutant entering atmosphere: m3/sec, m3/min, m3/hr for 0-60 min Source height: ft, m Volume input Chemical storage: gas or liquid Temperature at which chemical is stored: ambient or enter chemical temperature in (F/C) If gas, enter gas pressure: ambient or enter value (atm, mmHg, psi)
A-5

Appendix D. Calculation of exposed population for WTE combustion Data from U.S. Census 2000 (52) NYC population= 8008278 NYC area, 100m2= 78556.93 NYC population per 100m2= 101.94 Total number of 100m2 grid cells= 12880 Number of unexposed 100m2 grid cells= 1220 Number of exposed 100m2 grid cells= 11660 Exposed NYC population = 101.94 people/100m2 x 11660 100m2 exposed grid cells = 1188647.8= 1188648 exposed people
A-6