Embed Size (px)
Citation preview
A GUIDEBOOK FOR RURAL
SOLID WASTE MANAGEMENT SERVICES
by
Gerald A. DoeksenExtension Economist and Regents Professor
Oklahoma State University
Joseph F. SchmidtExtension Community Development Specialist Economist
Mississippi State University
Kyle GoodwinExtension Associate
Oklahoma State University
Gordon SloggettSenior Research SpecialistOklahoma State University
and
Dave CumminsExtension Associate
Mississippi State University
Document prepared for Grant from Southern Rural Development Center
June 1993
Table of Contents
Introduction
Objectives and Data
Estimating Solid Waste VolumeExample
Subtitle "D" Landfill CostsOklahoma EstimatesTennessee Estimates
Transfer Station Vs. Direct HaulTransfer Station CostsExampleDirect Haul CostsExampleTransfer Station Vs. Direct Haul
Rural Community Convenience CenterConvenience Center Costs Convenience Center Design and OperationExample
Rural Solid Waste Collection AlternativesGreen Box SystemRural Convenience CentersDoor to DoorAnnual CostsExample
Waste Stream ReductionSolid Waste RecyclingYard Waste Composting
References
Appendix - Blank Forms
1
A GUIDEBOOK FOR RURAL SOLID WASTE MANAGEMENT SERVICES
Gerald A. Doeksen, Joseph F. Schmidt, Kyle Goodwin, Gordon Sloggett and Dave Cummins
INTRODUCTION
Environmental and public health concerns in the U.S. have resulted in Federal and State
legislation concerning solid waste. The most recent Federal action by the Environmental Protection
Agency was the adoption of Subtitle "D", which will have a major impact on how landfills must be
designed, operated, and closed. Also, many states have adopted legislation mandating waste
reduction to extend the life of their landfills. Government officials responsible for solid waste
collection and disposal, particularly in rural Oklahoma and Mississippi, have limited resources at their
disposal to meet these requirements. Consequently, rural government officials and community leaders
will benefit from a knowledge of the solid waste collection and disposal alternatives that may be
available to them.
It is estimated that an average American disposes of nearly one ton of solid waste a year.
Clearly, collecting and disposing of that volume of material is a major problem. This is especially true
in rural areas where collection and disposal is most often left up to the individual household. A result
is often illegal rural roadside dumps which create environmental and health hazards.
Disposal of solid waste after it is collected is, and will become, an even bigger problem in rural
areas. Most small community landfills will not be able to meet stringent Subtitle "D" requirements
for new landfills. This will lead to the establishment of large regional landfills. Local decision makers
will need to investigate solid waste management alternatives that will be economically feasible given
2
certain local physical and political conditions.
OBJECTIVES AND DATA
The primary objective of this study is to develop information useful to decisionmakers in
evaluating the economic feasibility of various alternative solid waste systems in small communities
and rural areas in the South. Specific objectives of the study include:
1. develop a procedure to estimate the amount of solid waste generated in a specificarea;
2. summarize life cycle costs of a Subtitle "D" landfill;
3. provide data which will enable local decisionmakers to evaluate costs of directlyhauling waste to a landfill verses operation of a transfer station;
4. provide data which will enable local decisionmakers to estimate capital and operatingcosts of community convenience centers;
5. develop a methodology to estimate capital and operating costs of rural collectionsystems; and
6. summarize community waste stream reduction options which include recycling andyard waste composting.
Data for the guidebook were gathered from national and regional sources as well as specific
data for solid waste systems in Oklahoma and Mississippi. The authors have worked with numerous
systems within these states to collect solid waste generation data, and capital and operating (cost)
data. Included in this guidebook is a procedure to evaluate various solid waste management options
which can be used in rural locations throughout the South.
3
ESTIMATING SOLID WASTE VOLUME
Basic to the evaluation of any solid waste management system is the amount of solid waste
that will be generated in the area under consideration. Major factors in the amount of solid waste
generated include: population of the area; and the area in which the residents are located.
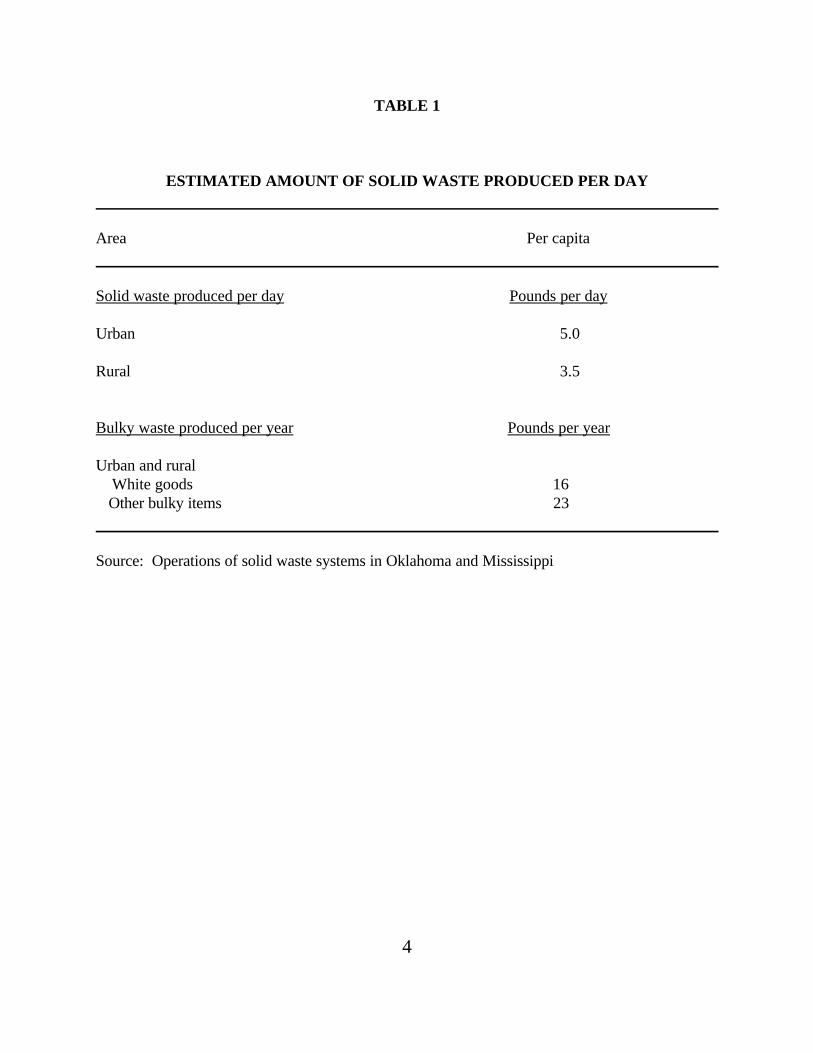
Most national data suggests that the solid waste produced per capita ranges from 2 to 8
pounds per day (Franklin Associates, 1986). In this guidebook it is assumed that residents of cities
and communities produce an average of 5 pounds per day per capita, including solid waste produced
from businesses and institutions. Although no comprehensive data exists for rural Oklahoma and
Mississippi, data from the Delaware County Oklahoma rural green box systems suggests that each
rural resident produces about 3.5 pounds of solid waste per day, (Table 1).
The weekly amount of solid waste collected in an area can be estimated by using the data in
Table 1 in the following formula.
VOLW = [5 (cusers) + 3.5 (rusers)] ÷ 2,000 where:
VOLW = total volume (tons) of solid waste collected per day;
CUSERS = users living in communities;
RUSERS = users living in rural areas.
Residents also generate a quantity of bulky items such as furniture, mattresses, home
appliances, car tires, and other items not usually picked up with packer trucks. Delaware County,
Oklahoma data suggests that each resident will produce about 16 pounds of white goods
4
TABLE 1
ESTIMATED AMOUNT OF SOLID WASTE PRODUCED PER DAY
Area Per capita
Solid waste produced per day Pounds per day
Urban 5.0
Rural 3.5
Bulky waste produced per year Pounds per year
Urban and rural White goods 16
Other bulky items 23
Source: Operations of solid waste systems in Oklahoma and Mississippi
5
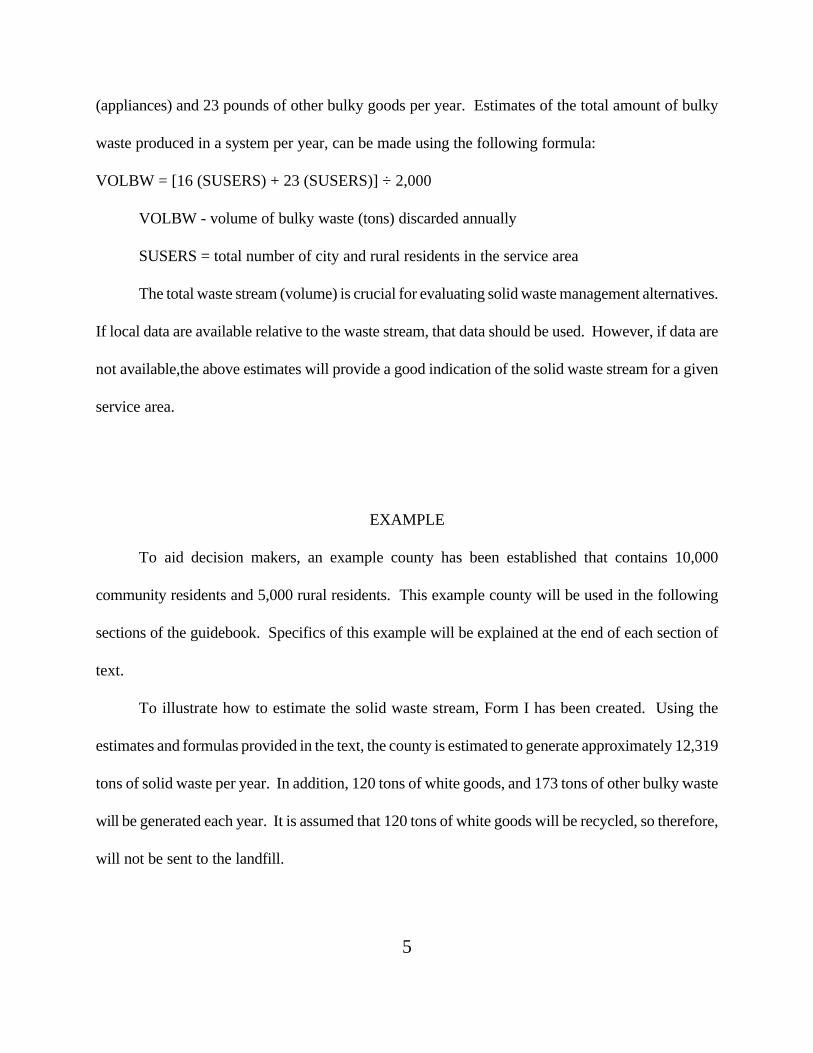
(appliances) and 23 pounds of other bulky goods per year. Estimates of the total amount of bulky
waste produced in a system per year, can be made using the following formula:
VOLBW = [16 (SUSERS) + 23 (SUSERS)] ÷ 2,000
VOLBW - volume of bulky waste (tons) discarded annually
SUSERS = total number of city and rural residents in the service area
The total waste stream (volume) is crucial for evaluating solid waste management alternatives.
If local data are available relative to the waste stream, that data should be used. However, if data are
not available,the above estimates will provide a good indication of the solid waste stream for a given
service area.
EXAMPLE
To aid decision makers, an example county has been established that contains 10,000
community residents and 5,000 rural residents. This example county will be used in the following
sections of the guidebook. Specifics of this example will be explained at the end of each section of
text.
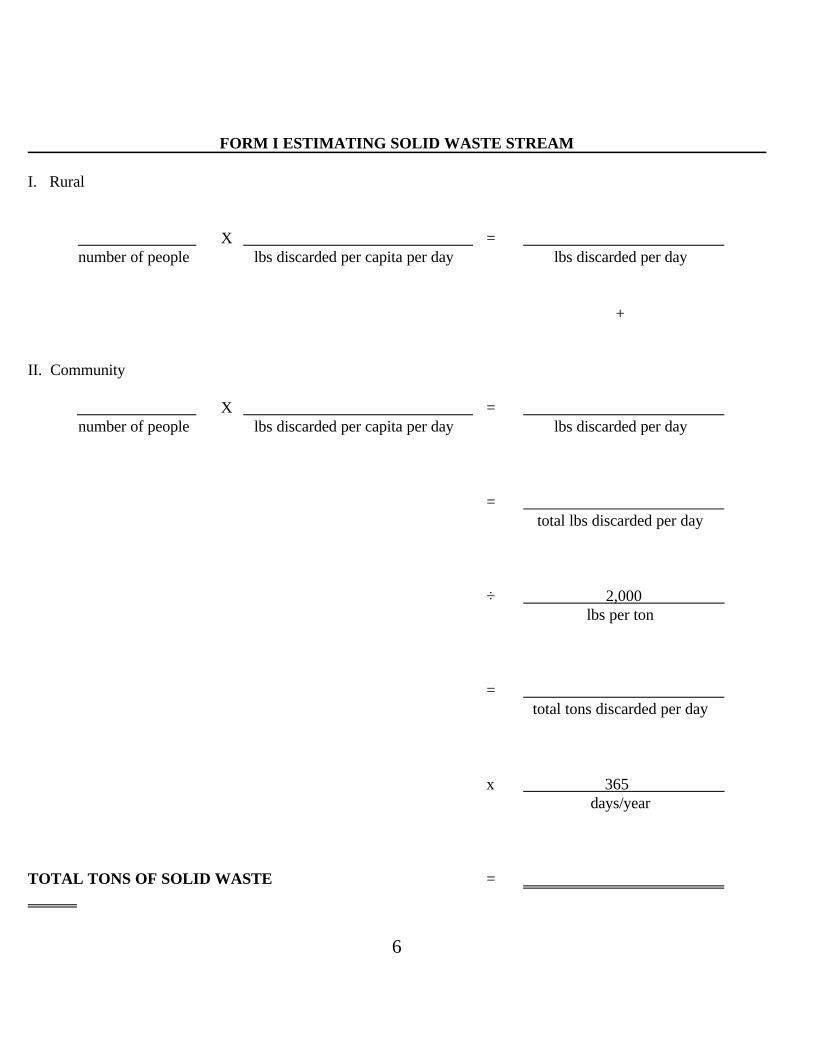
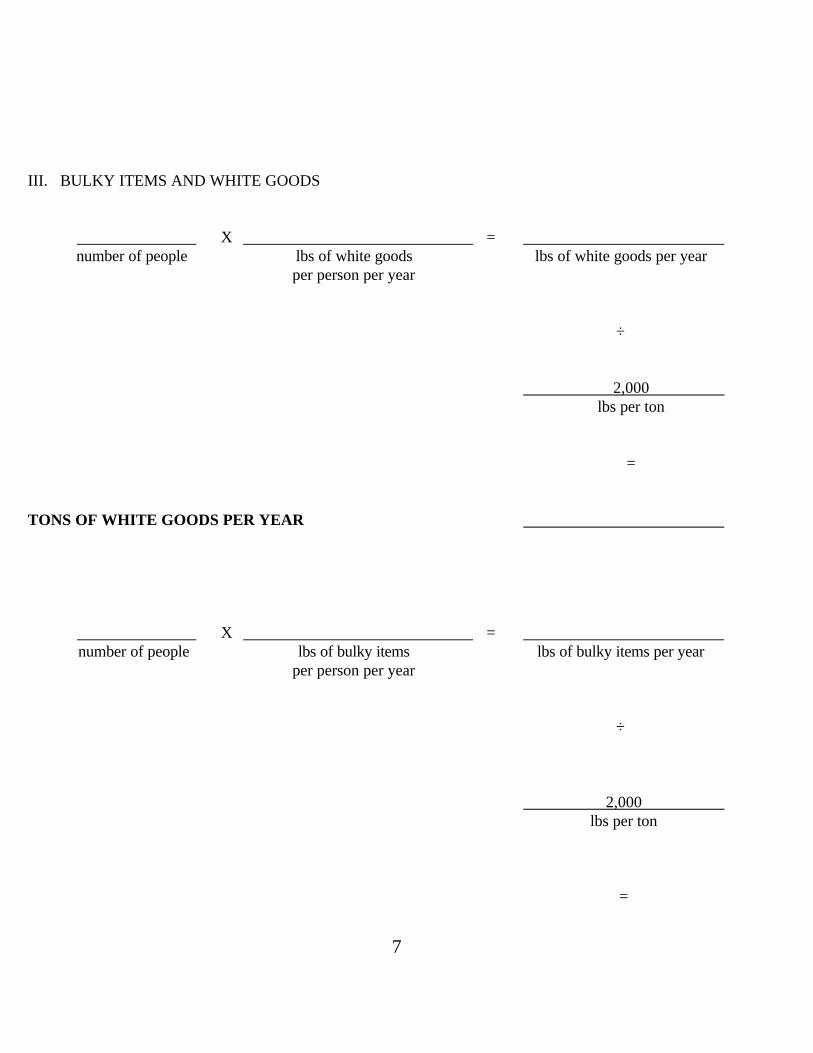
To illustrate how to estimate the solid waste stream, Form I has been created. Using the
estimates and formulas provided in the text, the county is estimated to generate approximately 12,319
tons of solid waste per year. In addition, 120 tons of white goods, and 173 tons of other bulky waste
will be generated each year. It is assumed that 120 tons of white goods will be recycled, so therefore,
will not be sent to the landfill.
6
FORM I ESTIMATING SOLID WASTE STREAM
I. Rural
X =number of people lbs discarded per capita per day lbs discarded per day
+
II. Community
X =number of people lbs discarded per capita per day lbs discarded per day
=total lbs discarded per day
÷ 2,000lbs per ton
=total tons discarded per day
x 365days/year
TOTAL TONS OF SOLID WASTE =
7
III. BULKY ITEMS AND WHITE GOODS
X =number of people lbs of white goods lbs of white goods per year
per person per year
÷
2,000lbs per ton
=
TONS OF WHITE GOODS PER YEAR
X =number of people lbs of bulky items lbs of bulky items per year
per person per year
÷
2,000lbs per ton
=
8
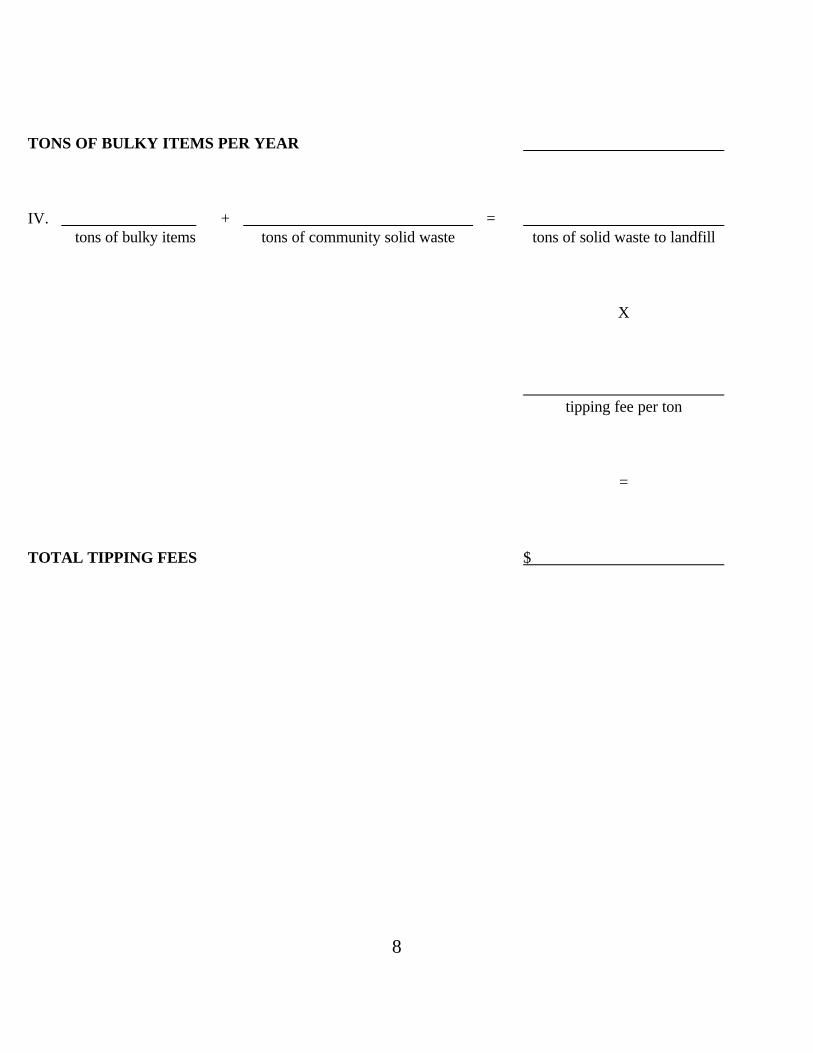
TONS OF BULKY ITEMS PER YEAR
IV. + =tons of bulky items tons of community solid waste tons of solid waste to landfill
X
tipping fee per ton
=
TOTAL TIPPING FEES $
9
SUBTITLE "D" LANDFILL COSTS
Landfills will be a part of solid waste management in the future. Recycling, composting, and
in some cases incineration, have the potential to reduce the solid waste stream, but they do not
eliminate the need for landfills. Given that fact, and the new Federal and state regulations designed
to make landfills environmentally safe, it is imperative that community leaders responsible for solid
waste management become aware of the impact of new landfill requirements on landfill costs.
Landfill costs are very site specific, depending on topography, soil type, geologic and
hydrologic features, ground water condition, geographic location, and other factors. Landfill costs
also are greatly affected by the daily volume of material they receive, that is, there are significant
economies of size associated with landfills. These economies of size will become much more
pronounced because Subtitle "D" municipal solid waste (MSW) landfill requirements significantly
increase costs--much more expensive construction, and higher operating, closure, and post-closure
costs.
Life cycle costs are defined as all costs incurred from the time the landfill is conceived,
through the 30 year post-closure period as required by Subtitle "D". These costs include: pre-
construction--planning, engineering, legal, licensing, and land acquisition; construction; operating;
closure; and post-closure. Life cycle costs are the basis for tipping fees. Profit must also be included
for privately operated landfills.
Three factors included in life cycle costs must be noted. First, a large amount of capital is
needed to construct and operate a landfill, so the cost of that capital (interest) must be included in life
cycle costs. Second, closure and post-closure costs are significant, so some type of fund (and/or
financial assurance) must be established to take care of those costs when they come due. And third,
10
inflation over the life of the landfill, including the post-closure period, needs to be a part of life cycle
cost estimates. Responsible landfill management will include all of the above when establishing
charges for solid waste services and/or tipping fees.
Since there are so many variables that can affect the costs of a specific landfill, the estimates
to be discussed should not be considered as "the costs" that any given landfill will incur. Rather, the
estimated costs should be thought of as being a guide for decision makers as they begin to think about
constructing and operating a Subtitle "D" MSW landfill. Estimates from Oklahoma and Tennessee
are presented.
OKLAHOMA ESTIMATES
No comprehensive landfill "life cycle" cost data were available for Oklahoma in relation to the
new Subtitle "D" requirements. However, discussions with Oklahoma State Department of Health
personnel responsible for solid waste management produced some estimates based on experience, and
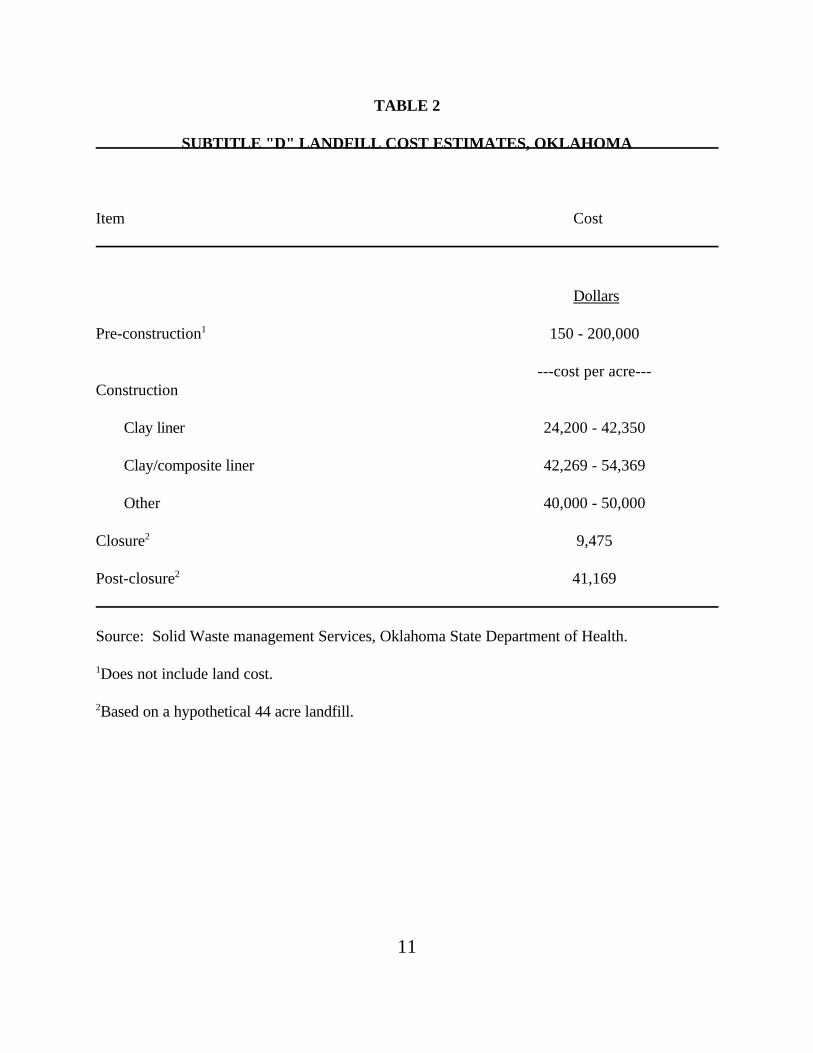
some estimates based on data they have developed (Table 2). Pre-construction cost is based on
experience and includes: engineering and design; geologic and hydrologic studies, legal fees, and
licensing. Construction, closure, and post-closure costs are based on a study of a hypothetical 44
acre Subtitle "D" landfill. (Solid Waste Management Services, 1992) These data are only presented
to show the magnitude of the investment required for Subtitle "D" MSW landfills. It should be noted
that Oklahoma construction cost estimates per acre are consistent with those in Tennessee (Table 3).
11
TABLE 2
SUBTITLE "D" LANDFILL COST ESTIMATES, OKLAHOMA
Item Cost
Dollars
Pre-construction1 150 - 200,000
---cost per acre---Construction
Clay liner 24,200 - 42,350
Clay/composite liner 42,269 - 54,369
Other 40,000 - 50,000
Closure2 9,475
Post-closure2 41,169
Source: Solid Waste management Services, Oklahoma State Department of Health.
1Does not include land cost.
2Based on a hypothetical 44 acre landfill.
1For complete details of Tennessee cost data, see Dunsmore, 1991.
12
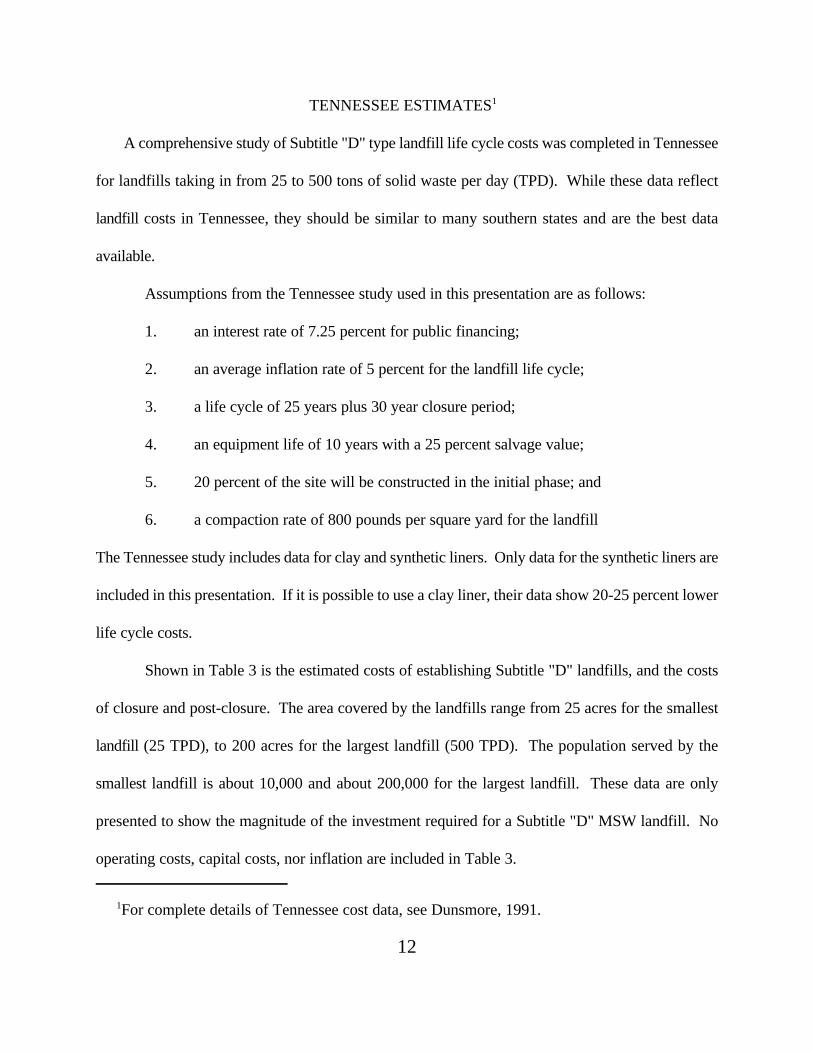
TENNESSEE ESTIMATES1
A comprehensive study of Subtitle "D" type landfill life cycle costs was completed in Tennessee
for landfills taking in from 25 to 500 tons of solid waste per day (TPD). While these data reflect
landfill costs in Tennessee, they should be similar to many southern states and are the best data
available.
Assumptions from the Tennessee study used in this presentation are as follows:
1. an interest rate of 7.25 percent for public financing;
2. an average inflation rate of 5 percent for the landfill life cycle;
3. a life cycle of 25 years plus 30 year closure period;
4. an equipment life of 10 years with a 25 percent salvage value;
5. 20 percent of the site will be constructed in the initial phase; and
6. a compaction rate of 800 pounds per square yard for the landfill
The Tennessee study includes data for clay and synthetic liners. Only data for the synthetic liners are
included in this presentation. If it is possible to use a clay liner, their data show 20-25 percent lower
life cycle costs.
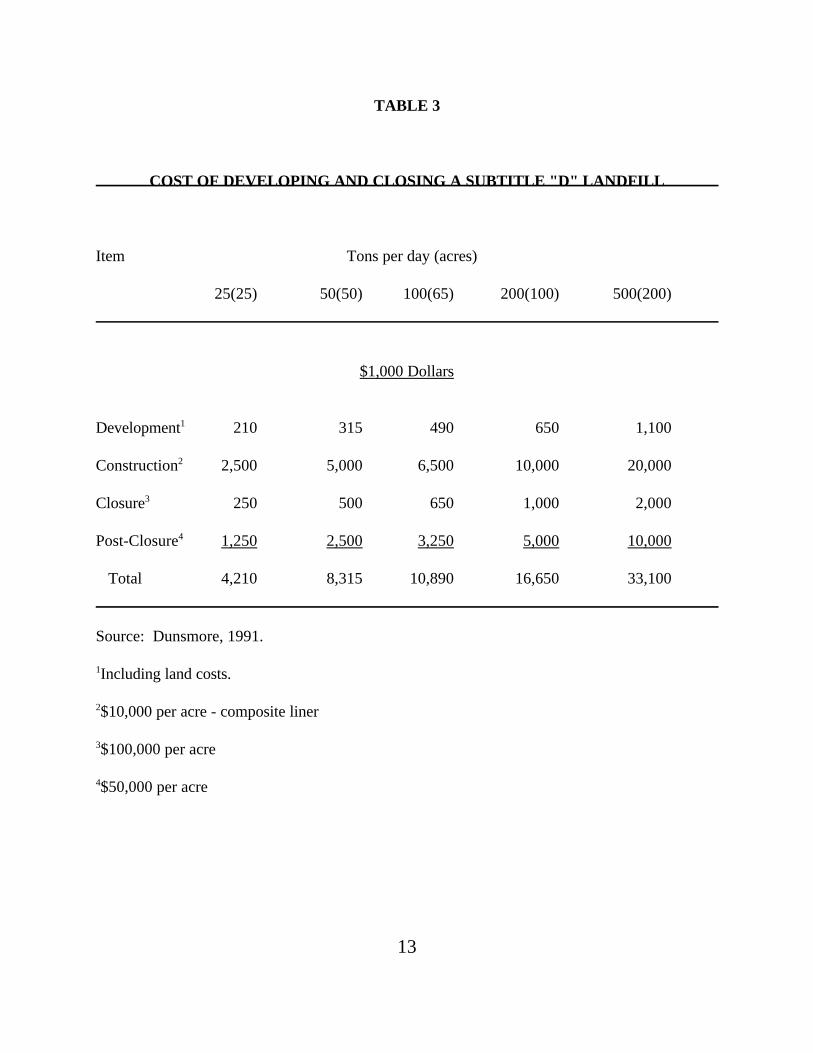
Shown in Table 3 is the estimated costs of establishing Subtitle "D" landfills, and the costs
of closure and post-closure. The area covered by the landfills range from 25 acres for the smallest
landfill (25 TPD), to 200 acres for the largest landfill (500 TPD). The population served by the
smallest landfill is about 10,000 and about 200,000 for the largest landfill. These data are only
presented to show the magnitude of the investment required for a Subtitle "D" MSW landfill. No
operating costs, capital costs, nor inflation are included in Table 3.
13
TABLE 3
COST OF DEVELOPING AND CLOSING A SUBTITLE "D" LANDFILL
Item Tons per day (acres)
25(25) 50(50) 100(65) 200(100) 500(200)
$1,000 Dollars
Development1 210 315 490 650 1,100
Construction2 2,500 5,000 6,500 10,000 20,000
Closure3 250 500 650 1,000 2,000
Post-Closure4 1,250 2,500 3,250 5,000 10,000
Total 4,210 8,315 10,890 16,650 33,100
Source: Dunsmore, 1991.
1Including land costs.
2$10,000 per acre - composite liner
3$100,000 per acre
4$50,000 per acre
14
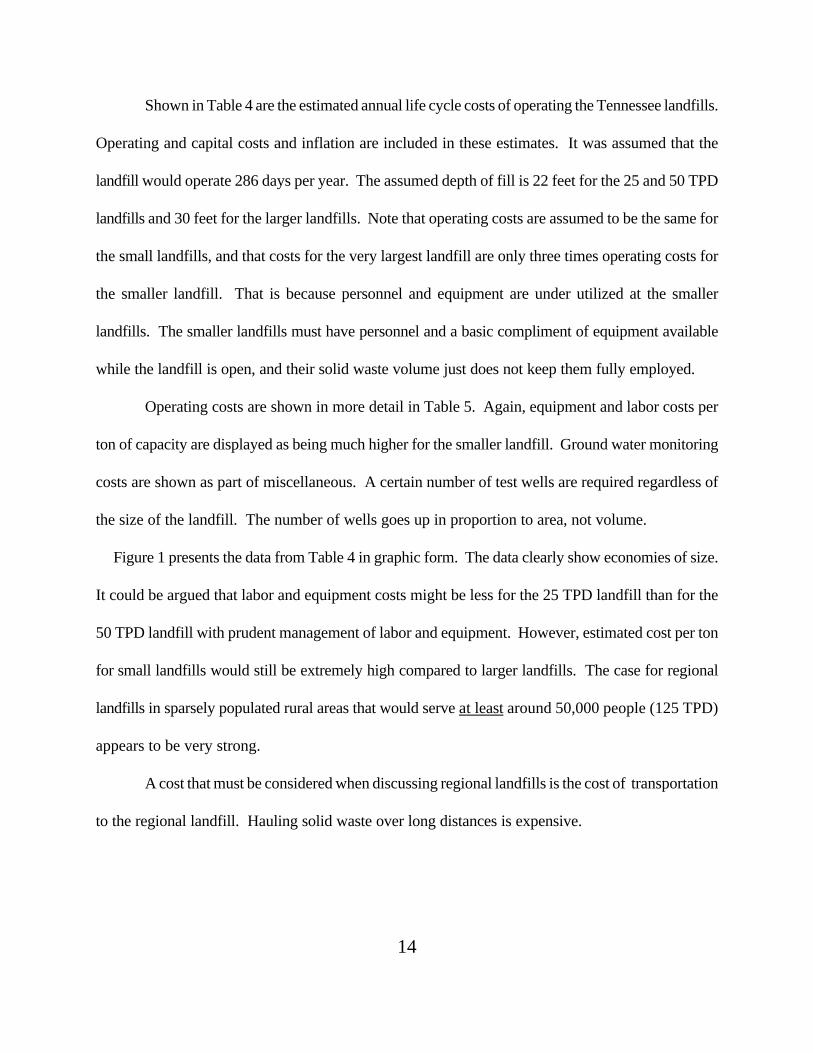
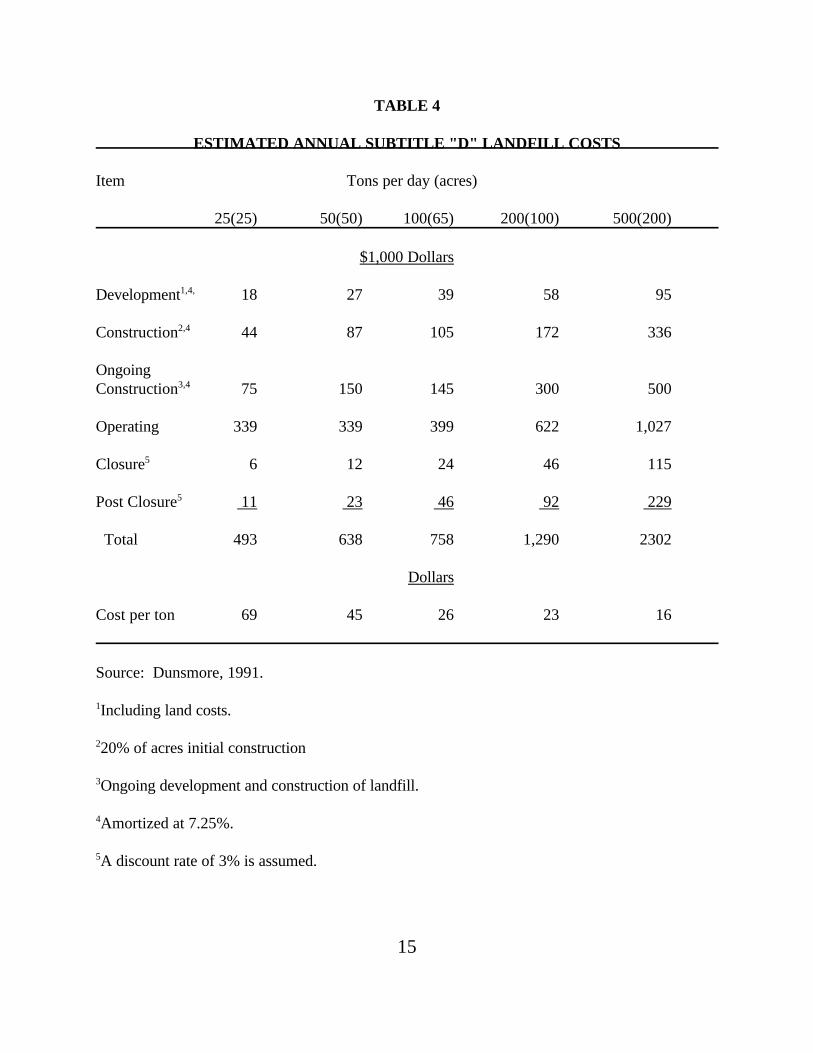
Shown in Table 4 are the estimated annual life cycle costs of operating the Tennessee landfills.
Operating and capital costs and inflation are included in these estimates. It was assumed that the
landfill would operate 286 days per year. The assumed depth of fill is 22 feet for the 25 and 50 TPD
landfills and 30 feet for the larger landfills. Note that operating costs are assumed to be the same for
the small landfills, and that costs for the very largest landfill are only three times operating costs for
the smaller landfill. That is because personnel and equipment are under utilized at the smaller
landfills. The smaller landfills must have personnel and a basic compliment of equipment available
while the landfill is open, and their solid waste volume just does not keep them fully employed.
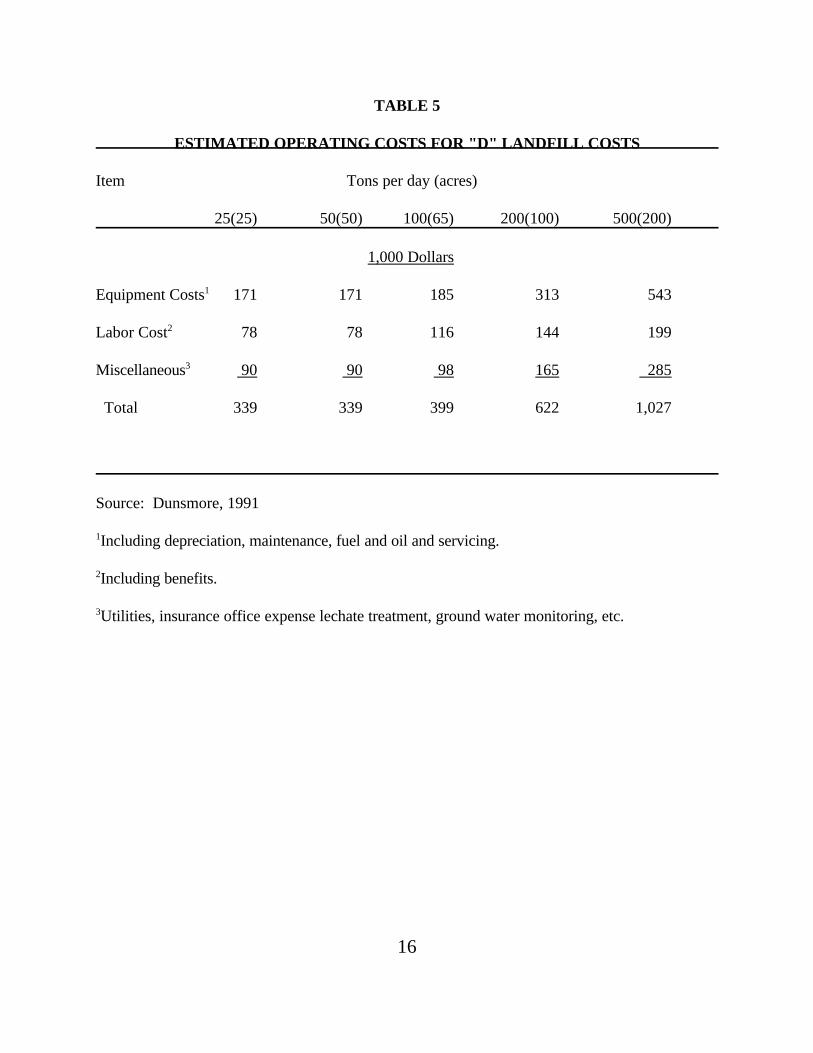
Operating costs are shown in more detail in Table 5. Again, equipment and labor costs per
ton of capacity are displayed as being much higher for the smaller landfill. Ground water monitoring
costs are shown as part of miscellaneous. A certain number of test wells are required regardless of
the size of the landfill. The number of wells goes up in proportion to area, not volume.
Figure 1 presents the data from Table 4 in graphic form. The data clearly show economies of size.
It could be argued that labor and equipment costs might be less for the 25 TPD landfill than for the
50 TPD landfill with prudent management of labor and equipment. However, estimated cost per ton
for small landfills would still be extremely high compared to larger landfills. The case for regional
landfills in sparsely populated rural areas that would serve at least around 50,000 people (125 TPD)
appears to be very strong.
A cost that must be considered when discussing regional landfills is the cost of transportation
to the regional landfill. Hauling solid waste over long distances is expensive.
15
TABLE 4
ESTIMATED ANNUAL SUBTITLE "D" LANDFILL COSTS
Item Tons per day (acres)
25(25) 50(50) 100(65) 200(100) 500(200)
$1,000 Dollars
Development1,4, 18 27 39 58 95
Construction2,4 44 87 105 172 336
OngoingConstruction3,4 75 150 145 300 500
Operating 339 339 399 622 1,027
Closure5 6 12 24 46 115
Post Closure5 11 23 46 92 229
Total 493 638 758 1,290 2302
Dollars
Cost per ton 69 45 26 23 16
Source: Dunsmore, 1991.
1Including land costs.
220% of acres initial construction
3Ongoing development and construction of landfill.
4Amortized at 7.25%.
5A discount rate of 3% is assumed.
16
TABLE 5
ESTIMATED OPERATING COSTS FOR "D" LANDFILL COSTS
Item Tons per day (acres)
25(25) 50(50) 100(65) 200(100) 500(200)
1,000 Dollars
Equipment Costs1 171 171 185 313 543
Labor Cost2 78 78 116 144 199
Miscellaneous3 90 90 98 165 285
Total 339 339 399 622 1,027
Source: Dunsmore, 1991
1Including depreciation, maintenance, fuel and oil and servicing.
2Including benefits.
3Utilities, insurance office expense lechate treatment, ground water monitoring, etc.
17
FIgure 1
Source: Dunsmore, 1991
18
The waste can be hauled directly to the landfill with the collection trucks, or a transfer station can be
built. These costs must be added to landfill costs (tipping fees) for those communities having to
transfer and/or haul their waste to a landfill. They need to weigh that cost against the cost of
operating their own landfill.
It has been estimated that transfer station and transportation costs, for a one way distance of
50 miles, range from about $10 per ton for a transfer station serving a population 30,000, to about
$15-20 per ton for a population of 5-10,000 (Sloggett, et. al., 1992). Costs would be somewhat less
for shorter transfer distances. However, for distances of less than 20-25 miles--depending on volume
and collection equipment, it may be cheaper to use the collection vehicles to haul directly to the
landfill rather than to utilize a transfer station.
19
TRANSFER STATION VS. DIRECT HAUL
When a local landfill closes, community leaders are faced with two options. They can directly
haul their solid waste to a regional landfill with their collection trucks, or they can construct a transfer
station. A transfer station is a place where solid waste picked up by collection trucks is unloaded into
larger transfer vehicles for delivery to the disposal site. The choice of whether to direct haul or build
a transfer station depends upon such factors as type of collection equipment, distance to the landfill,
and the amount of solid waste to be handled.
TRANSFER STATION COSTS
Transfer vehicles have the capacity to hold several loads of solid waste from collection
vehicles, thereby saving numerous trips by the collection vehicles to the landfill. This process saves
time and reduces operating costs for communities with larger solid waste volumes and/or long hauling
distances. The cost of a transfer station may be divided between capital costs and annual costs.
Capital cost is the cost of purchasing the items needed to construct and operate a transfer station.
Annual costs are the costs that occur each year to insure the continual operation of the transfer
station.
TRANSFER STATION CAPITAL COSTS
Many factors influence the capital cost of a transfer station including location, distance from
the landfill, equipment used, and the volume and type of material handled. The capital cost estimates
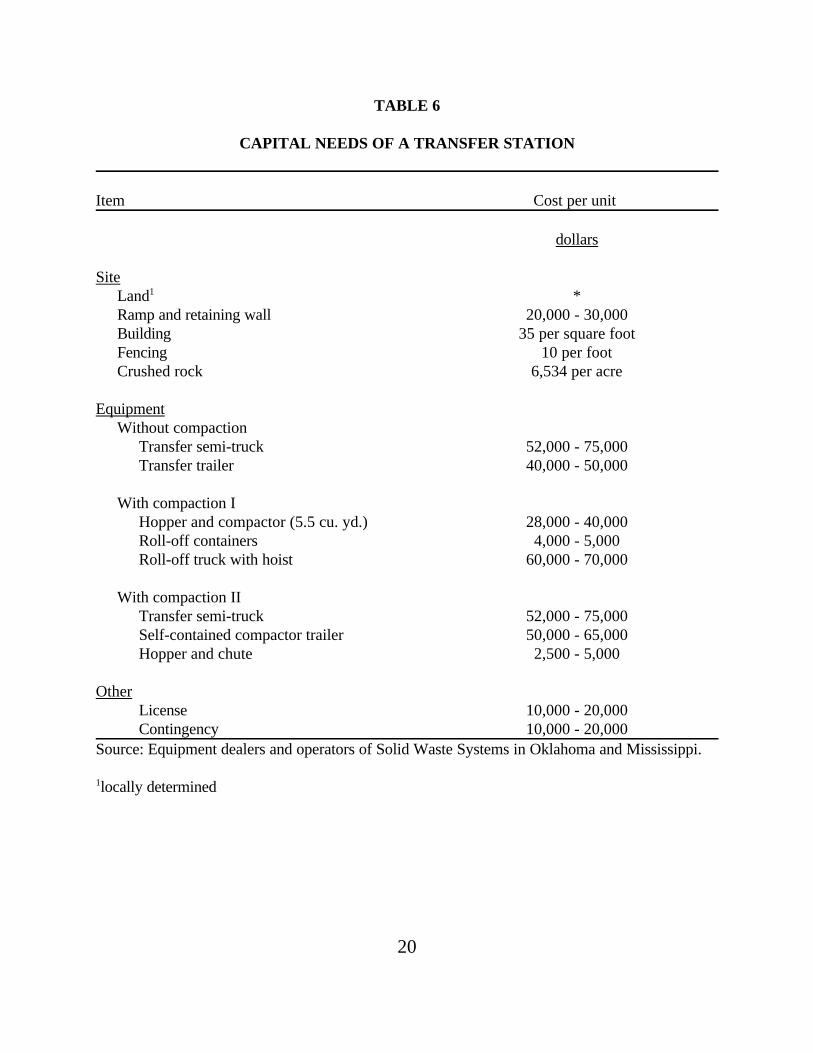
discussed in this section are listed in Table 6.
20
TABLE 6
CAPITAL NEEDS OF A TRANSFER STATION
Item Cost per unit
dollars
SiteLand1 *Ramp and retaining wall 20,000 - 30,000Building 35 per square footFencing 10 per footCrushed rock 6,534 per acre
EquipmentWithout compaction
Transfer semi-truck 52,000 - 75,000Transfer trailer 40,000 - 50,000
With compaction IHopper and compactor (5.5 cu. yd.) 28,000 - 40,000Roll-off containers 4,000 - 5,000Roll-off truck with hoist 60,000 - 70,000
With compaction IITransfer semi-truck 52,000 - 75,000Self-contained compactor trailer 50,000 - 65,000Hopper and chute 2,500 - 5,000
OtherLicense 10,000 - 20,000Contingency 10,000 - 20,000
Source: Equipment dealers and operators of Solid Waste Systems in Oklahoma and Mississippi.
1locally determined
21
Site Cost
The location of the site should be such that the distance collection vehicles and transfer vehicles
must travel is kept to a minimum. The site should be large enough to include a building for collection
vehicles to unload waste into the transfer vehicles and an outside area large enough for trucks to
easily maneuver. If white goods and other bulky items are to be accepted at the transfer station, more
space should be allotted. A reasonable size location should be between 1-5 acres. An example
transfer site layout is presented in Figure 2.
The site must either be located on a sloping tract of land, or a ramp must be built. If a sloping site
is used, then a level floor can be built with a drop-off so the waste can be unloaded into the transfer
vehicle. If a level site is used, a ramp must be built so the collection vehicle will be above the transfer
vehicle to allow the waste to be dumped down into the transfer vehicle.
Cost of the land will vary from region to region. The community or county may own the land,
or it may be donated by a private source. However, in most cases the land will cost at least $1,000
per acre to purchase and, in some instances, much more.
A building on the transfer station site will allow the operation to continue despite inclement
weather, and will provide a place for offices and vehicle storage. The size of the building will depend
on the volume of waste being transferred. The building should at least be large enough to allow the
collection vehicle room to dump the waste into a transfer vehicle. Containers for bulky items may
also be placed inside, but it is not necessary.
Cost of the building will also vary according to the region where it is built. An estimate of $35
per square foot is used in this example and includes a steel building with a concrete floor,
22
figure 2
23
and a retaining wall. This estimate also includes a restroom and office, a roof extending over the
transfer vehicle, and a large overhead door.
If white goods and other bulky items are to be accepted, then a concrete ramp and retaining wall
will be needed to allow waste to be dumped down into a transfer container. The retaining wall should
be high enough to place the transfer container below ramp level. The ramp and retaining wall is
estimated to cost approximately $20,000 to $30,000 depending on the size and regional costs.
It is assumed that the entire perimeter of the transfer station site is fenced and has one or more
lockable entry gates. The fence will provide security, and keep blowing debris from leaving the site.
The fence is estimated to cost $10 per linear foot for an industrial type six foot chain link fence with
barbed wire at the top and one large gate. One acre will require 820 feet of fence, two acres - 1230
feet, three acres - 1640 feet, and so on.
Crushed rock will be used for all roadways and parking lots to allow for all-weather use. The cost
of crushed rock can vary greatly depending on the region and the distance from the quarry. A
reasonable delivery price range to consider is from $3 to $10 per ton. A price of $6 per ton is used
for this estimate. There are approximately 1.35 tons in one cubic yard of 3" crushed rock. A roadbed
and parking area covered with 6" of crushed rock @ $6 per ton will cost $.15 per square foot. One
acre contains 43,560 square feet. It would cost ($.15 x 43.560) $6,534 to cover one acre with 6" of
crushed rock at $6 per ton.
Equipment Costs
There are basically two common types of transfer vehicles, open top or compactable trailers, and
roll off containers. While both perform the same duties, different equipment is utilized with each
system (Table 6).
24
Open top trailers utilize a tractor truck to transfer solid waste without being compacted.
Collection vehicles empty their loads into the open top of the trailer. When the trailer is full, a
hydraulic "walking floor" conveys the material to the end of the trailer. This transfer trailer is
estimated to cost approximately $40,000-$50,000 each with and additional $52,000-$75,000 for a
tractor truck. The trailer may legally hold up to 20 tons of material.
Another type of transfer trailer is the self contained compactor trailer. Collection vehicles dump
waste through a hopper into the front of the trailer, and a blade inside the trailer compacts the
material. The trailer is emptied by opening the end of the trailer and pushing the material out with
the blade. A self contained compactor trailer is estimated to cost $50,000 to $65,000, with a capacity
of about 20 tons. A tractor truck must also be purchased for this trailer.
Roll off containers utilize a stationary compactor, and a special truck with a tilting bed to pick up
large roll off containers to transfer solid waste. Collection vehicles dump waste through a hopper into
the stationary compactor which pushes the material into a roll off container that is clamped to the
end of the compactor. When the roll off box is full, the truck bed is tilted to ground level next to the
roll off box and the truck uses a hoist to pull the box onto the bed. An empty container is then
attached to the compactor. The full box is hauled to the disposal site and is emptied by tilting the bed
and dumping the material by gravity. The hopper and compactor cost approximately $28,000 to
$40,000, with the roll-off containers costing $4,000 to $5,000 each. A roll-off tandum axle straight
truck with a hydraulic bed and hoist cost from $60,000 to $70,000 depending on the size and
features. Roll off boxes can legally hold up to 10 tons of material.
Advantages of using transfer trailers include eliminating the need for a stationary compactor and
higher payloads resulting in fewer trips. However, the roll off box system requires less of an initial
25
capital investment than do transfer trailer systems.
Other capital costs include fees for licensing and a contingency fee. While there is no cost for the
license itself, legal and engineering fees for a transfer station can easily cost from $10,000 to $20,000.
A contingency fee of $10,000 to $20,000 is added to cover unforeseen costs and to allow for cost
variations from region to region.
TRANSFER STATION ANNUAL COSTS
Annual costs are the costs that occur each year to insure the continual operation of the system.
Annual costs can be further divided into annual capital costs and operating costs. Annual capital
costs are the yearly depreciation of capital items, and operating costs are the day to day out of pocket
costs for such things as labor and fuel.
Annual Capital Cost
It is very important that funds be set aside each year for capital items so that money will be
available to replace the item when it is fully depreciated. For this analysis, straight line depreciation
will be used.
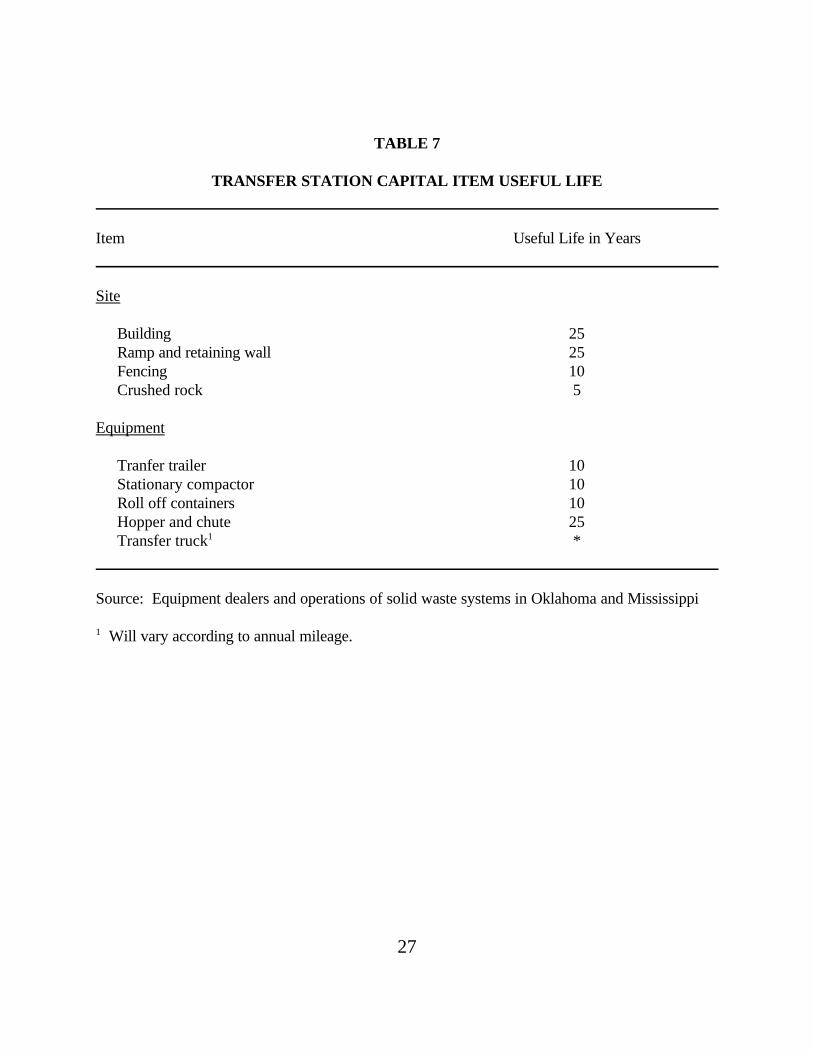
Annual depreciation for transfer station capital items are shown in Table 7. The transfer building,
ramp and retaining wall, and the hopper and chute will be depreciated over a 25 year period. The
transfer trailers, fencing, roll off containers, and compactor will be depreciated over 10 years. The
crushed rock for roadways will need to be replaced after 5 years.
The amount set aside for the transfer trucks will vary according the level of usage. Most transfer
trucks should be good for approximately 200,000 miles. By dividing the annual miles accumulated
into 200,000, the useful life of the vehicle will be estimated. The vehicle should be depreciated in a
26
straight line over the useful life.
Annual Operating Costs
Operating costs are yearly expenditures for items such as fuel, labor, maintenance, and fringe
benefits needed on a daily basis for the operation of the system. The operating costs for a transfer
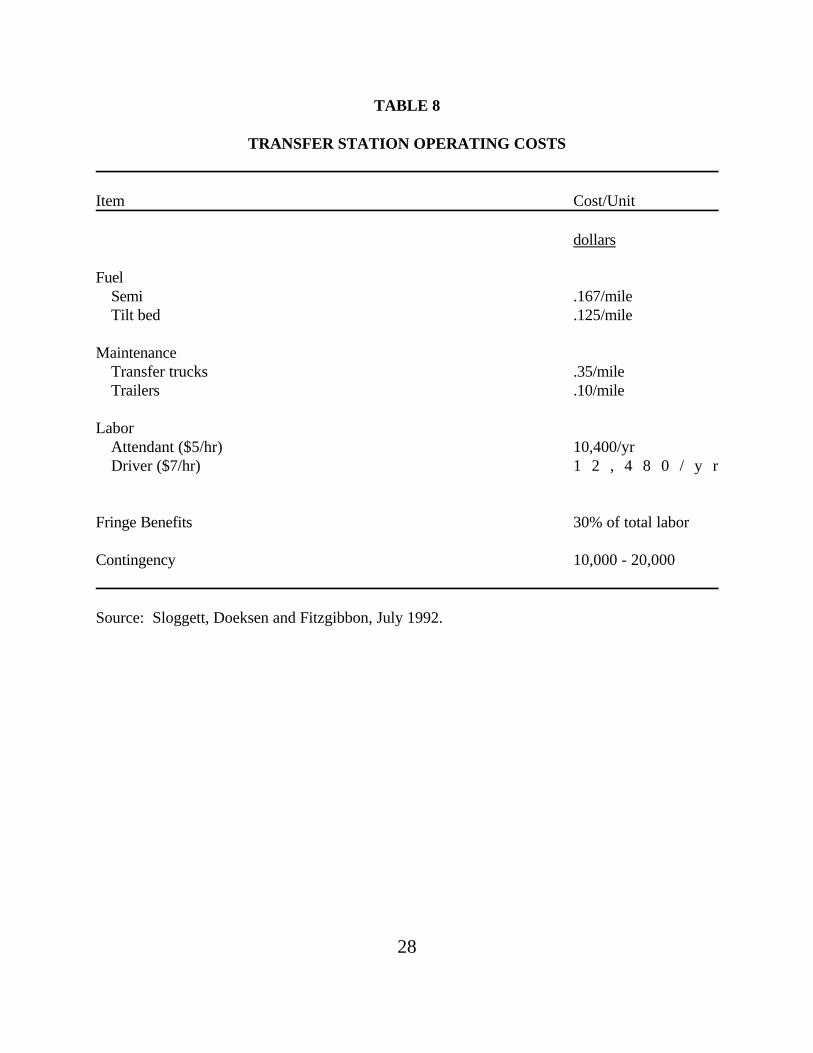
station are listed in Table 8.
Fuel is estimated to cost $1.00 per gallon for diesel. The tractor truck is estimated to get
approximately 6 miles per gallon for a fuel cost of $.167 per mile. The tilt bed truck gets
approximately 8 miles per gallon for a fuel cost of $.125 per mile. Maintenance costs include costs
for repairs, tires, and routine lubrication and servicing. These costs are estimated to be $.35 per mile
for both the tractor and the tilt bed truck. Maintenance for the transfer trailers are estimated to be
$.10 per mile.
A transfer station will need to employ at least one full-time attendant at $5 per hour, or $10,400
per year. A part-time or full-time driver for the transfer vehicles will also be needed at $7 per hour.
If needed full-time, the yearly cost is $14,560. Fringe benefits are estimated to be 30% of total labor
for workman's comprehensive insurance, FICA, unemployment, and other benefits. A contingency
cost of $10,000 is included to cover the cost of utilities and office material as well as other unforeseen
costs.
27
TABLE 7
TRANSFER STATION CAPITAL ITEM USEFUL LIFE
Item Useful Life in Years
Site
Building 25Ramp and retaining wall 25Fencing 10Crushed rock 5
Equipment
Tranfer trailer 10Stationary compactor 10Roll off containers 10Hopper and chute 25Transfer truck1 *
Source: Equipment dealers and operations of solid waste systems in Oklahoma and Mississippi
1 Will vary according to annual mileage.
28
TABLE 8
TRANSFER STATION OPERATING COSTS
Item Cost/Unit
dollars
FuelSemi .167/mileTilt bed .125/mile
MaintenanceTransfer trucks .35/mileTrailers .10/mile
LaborAttendant ($5/hr) 10,400/yrDriver ($7/hr) 1 2 , 4 8 0 / y r
Fringe Benefits 30% of total labor
Contingency 10,000 - 20,000
Source: Sloggett, Doeksen and Fitzgibbon, July 1992.
29
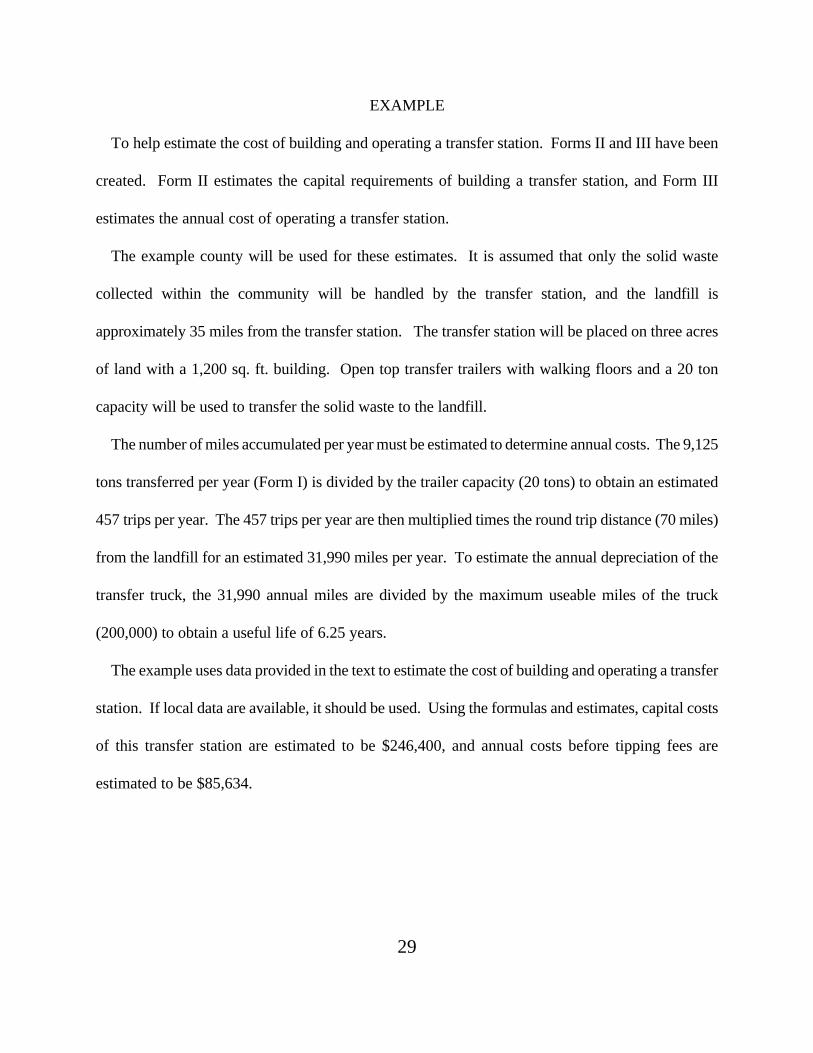
EXAMPLE
To help estimate the cost of building and operating a transfer station. Forms II and III have been
created. Form II estimates the capital requirements of building a transfer station, and Form III
estimates the annual cost of operating a transfer station.
The example county will be used for these estimates. It is assumed that only the solid waste
collected within the community will be handled by the transfer station, and the landfill is
approximately 35 miles from the transfer station. The transfer station will be placed on three acres
of land with a 1,200 sq. ft. building. Open top transfer trailers with walking floors and a 20 ton
capacity will be used to transfer the solid waste to the landfill.
The number of miles accumulated per year must be estimated to determine annual costs. The 9,125
tons transferred per year (Form I) is divided by the trailer capacity (20 tons) to obtain an estimated
457 trips per year. The 457 trips per year are then multiplied times the round trip distance (70 miles)
from the landfill for an estimated 31,990 miles per year. To estimate the annual depreciation of the
transfer truck, the 31,990 annual miles are divided by the maximum useable miles of the truck
(200,000) to obtain a useful life of 6.25 years.
The example uses data provided in the text to estimate the cost of building and operating a transfer
station. If local data are available, it should be used. Using the formulas and estimates, capital costs
of this transfer station are estimated to be $246,400, and annual costs before tipping fees are
estimated to be $85,634.
30
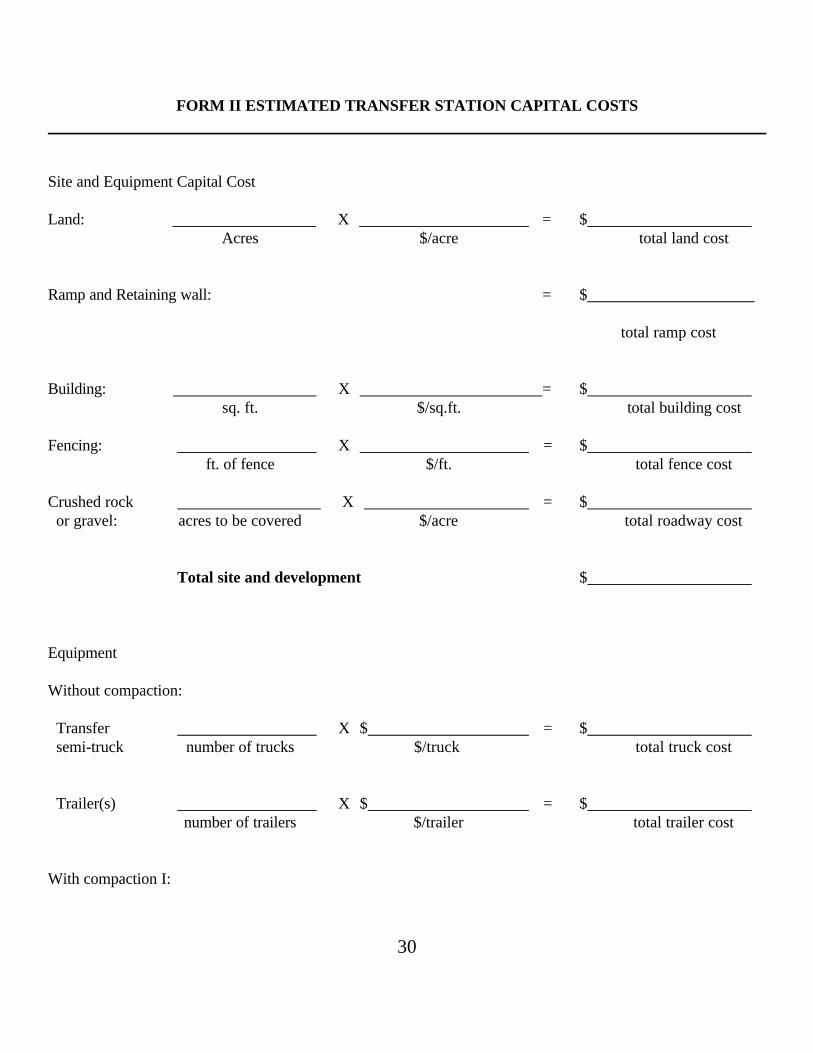
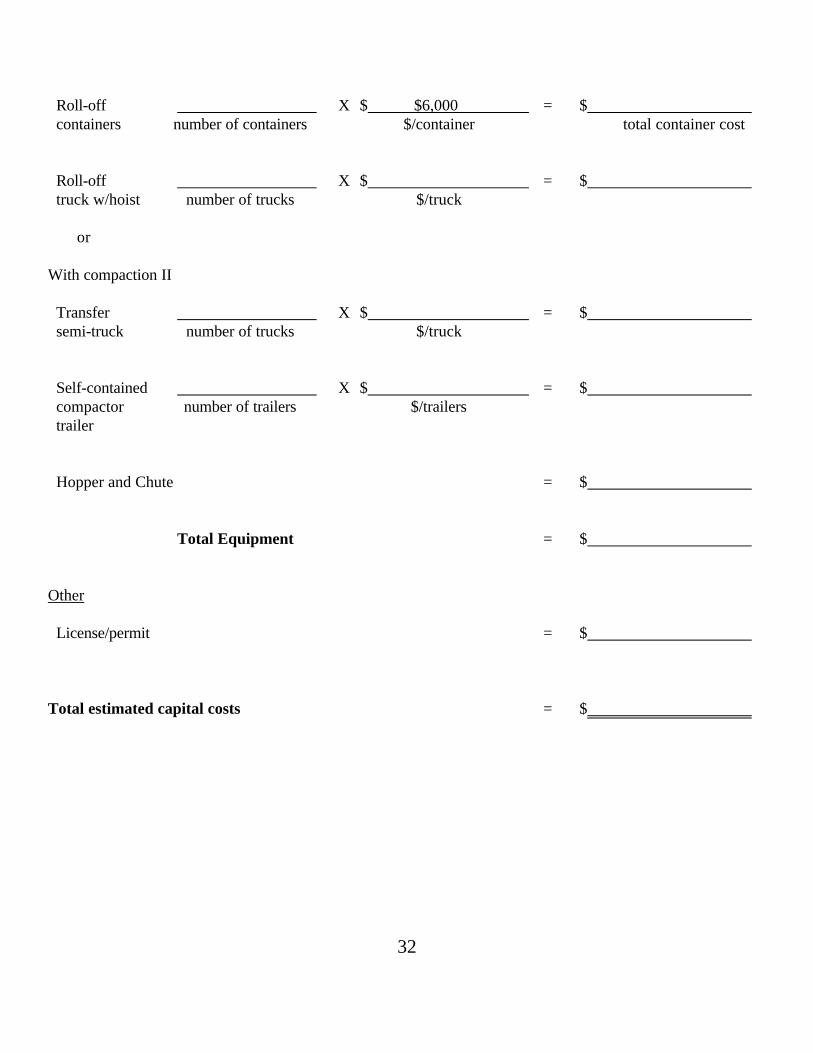
FORM II ESTIMATED TRANSFER STATION CAPITAL COSTS
Site and Equipment Capital Cost
Land: X = $Acres $/acre total land cost
Ramp and Retaining wall: = $
total ramp cost
Building: X = $sq. ft. $/sq.ft. total building cost
Fencing: X = $ft. of fence $/ft. total fence cost
Crushed rock X = $ or gravel: acres to be covered $/acre total roadway cost
Total site and development $
Equipment
Without compaction:
Transfer X $ = $ semi-truck number of trucks $/truck total truck cost
Trailer(s) X $ = $number of trailers $/trailer total trailer cost
With compaction I:
31
Hopper & compactor (5.5 cu. yd.) $
32
Roll-off X $ $6,000 = $ containers number of containers $/container total container cost
Roll-off X $ = $ truck w/hoist number of trucks $/truck
or
With compaction II
Transfer X $ = $ semi-truck number of trucks $/truck
Self-contained X $ = $ compactor number of trailers $/trailers trailer
Hopper and Chute = $
Total Equipment = $
Other
License/permit = $
Total estimated capital costs = $
33
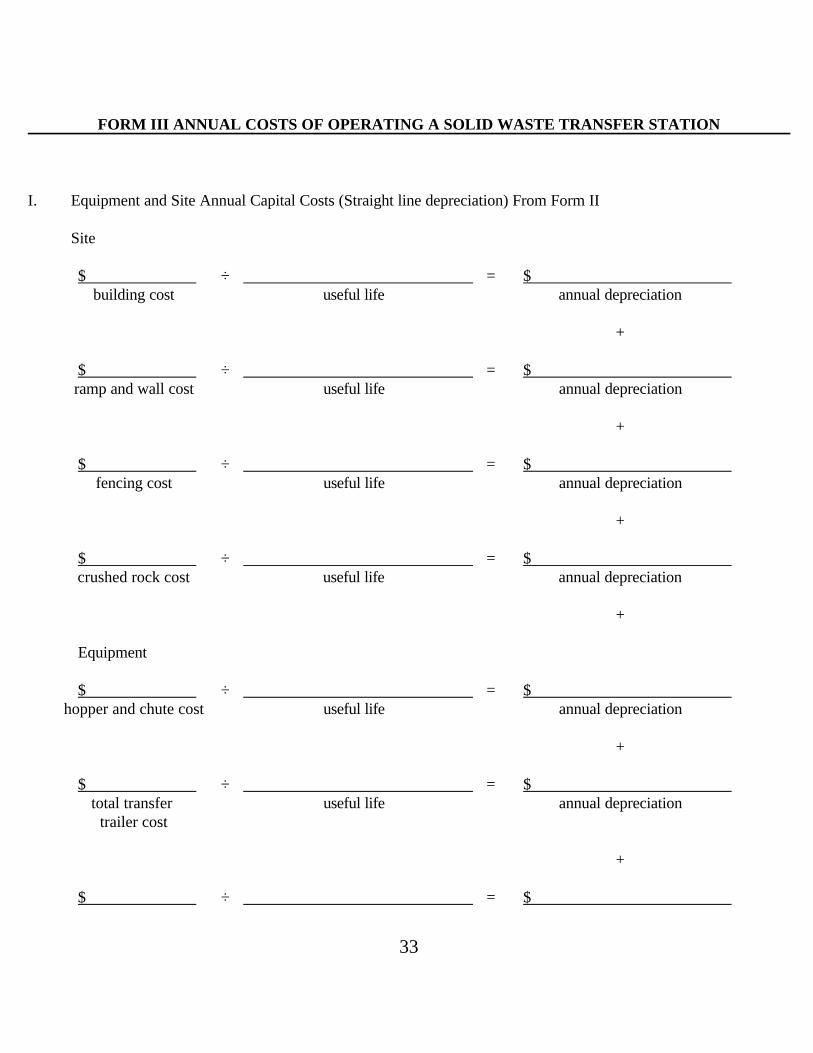
FORM III ANNUAL COSTS OF OPERATING A SOLID WASTE TRANSFER STATION
I. Equipment and Site Annual Capital Costs (Straight line depreciation) From Form II
Site
$ ÷ = $building cost useful life annual depreciation
+
$ ÷ = $ramp and wall cost useful life annual depreciation
+
$ ÷ = $fencing cost useful life annual depreciation
+
$ ÷ = $crushed rock cost useful life annual depreciation
+
Equipment
$ ÷ = $hopper and chute cost useful life annual depreciation
+
$ ÷ = $total transfer useful life annual depreciation
trailer cost
+
$ ÷ = $
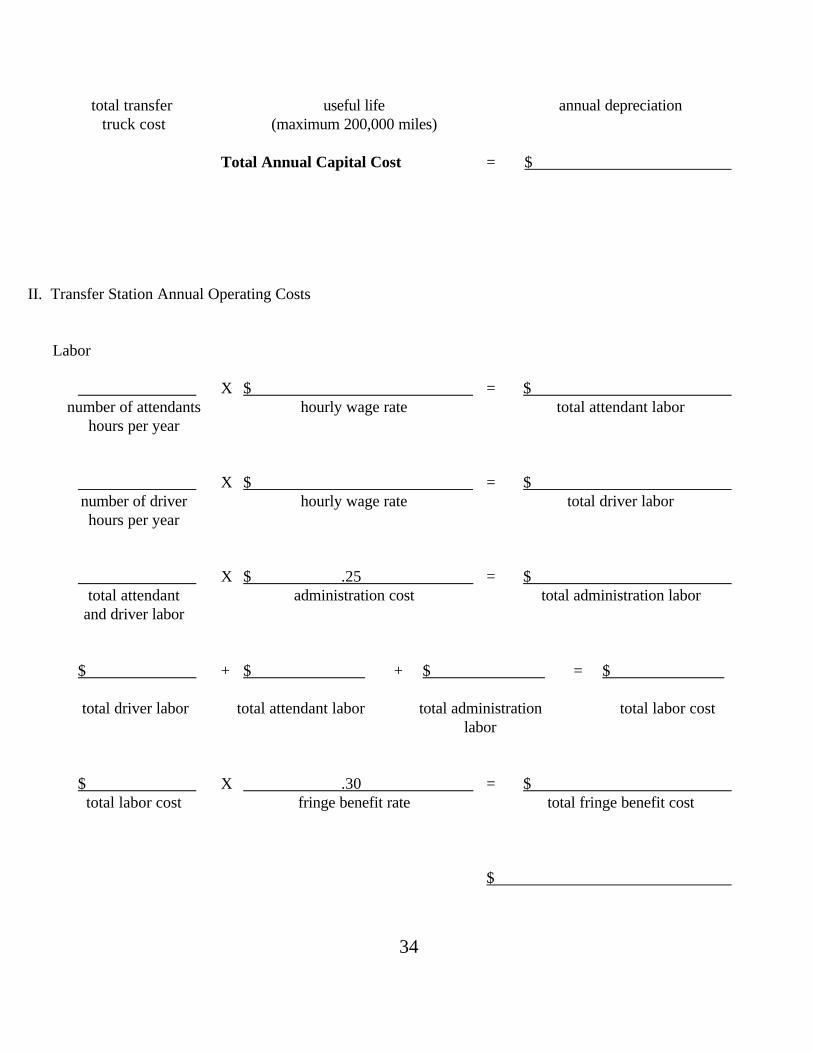
34
total transfer useful life annual depreciationtruck cost (maximum 200,000 miles)
Total Annual Capital Cost = $
II. Transfer Station Annual Operating Costs
Labor
X $ = $number of attendants hourly wage rate total attendant labor
hours per year
X $ = $number of driver hourly wage rate total driver laborhours per year
X $ .25 = $total attendant administration cost total administration labor
and driver labor
$ + $ + $ = $
total driver labor total attendant labor total administration total labor costlabor
$ X .30 = $total labor cost fringe benefit rate total fringe benefit cost
$
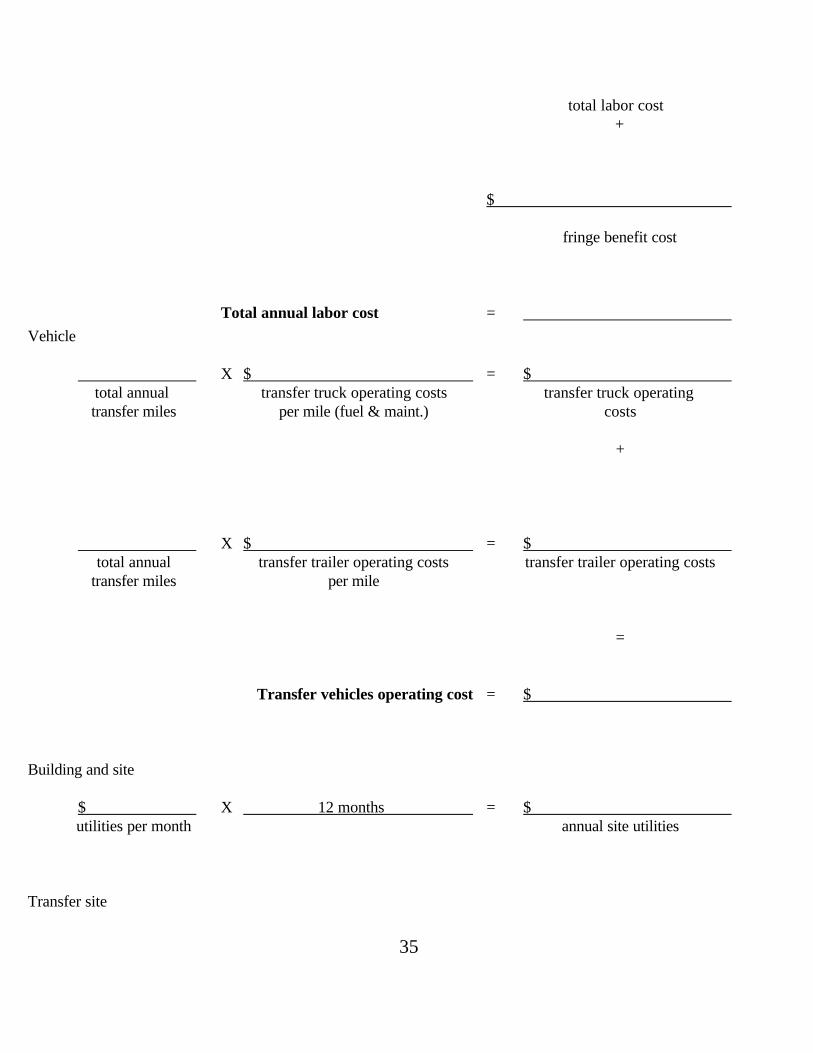
35
total labor cost+
$
fringe benefit cost
Total annual labor cost =
Vehicle
X $ = $total annual transfer truck operating costs transfer truck operating transfer miles per mile (fuel & maint.) costs
+
X $ = $total annual transfer trailer operating costs transfer trailer operating costs
transfer miles per mile
=
Transfer vehicles operating cost = $
Building and site
$ X 12 months = $utilities per month annual site utilities
Transfer site
36
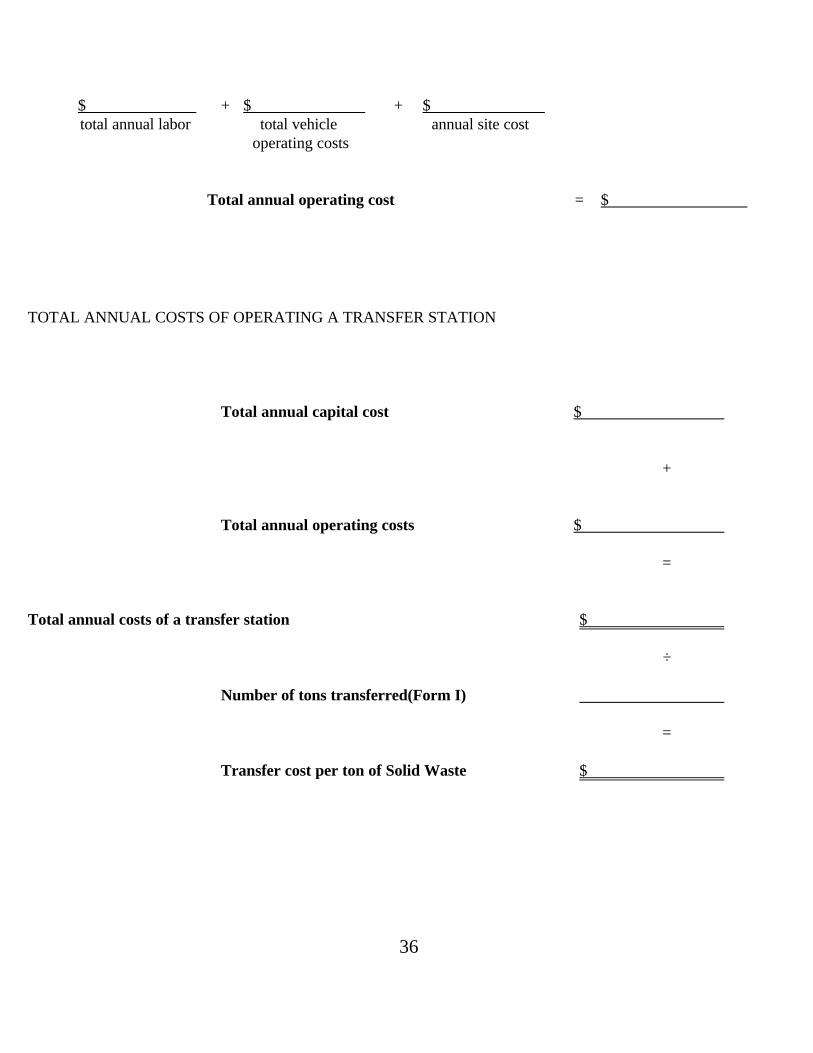
$ + $ + $total annual labor total vehicle annual site cost
operating costs
Total annual operating cost = $
TOTAL ANNUAL COSTS OF OPERATING A TRANSFER STATION
Total annual capital cost $
+
Total annual operating costs $
=
Total annual costs of a transfer station $
÷
Number of tons transferred(Form I)
=
Transfer cost per ton of Solid Waste $
37
DIRECT HAUL COSTS
Another solid waste disposal option is to use the collection trucks to deliver solid waste
directly to a regional landfill. The cost of hauling solid waste directly to a distant landfill depends on
the number and size of collection vehicles, the number of workers on each truck, the distance to the
landfill, and the volume of waste to be transported.
It is assumed that existing collection trucks are used so no capital cost estimates are made.
The annual cost of directly hauling solid waste to a landfill includes: depreciation, fuel, maintenance,
labor, and a contingency fee to allow for unforeseen costs.
Annual capital cost (depreciation) for the collection vehicles is included in direct haul cost
estimates to allow for the replacement of the vehicles when they are worn out. The replacement cost
of each vehicle is divided by the useful life in miles to arrive at a per mile depreciation cost. To
determine the annual capital cost of each vehicle, multiply the depreciation cost times the annual
number of miles driven to the landfill and back.
The collection vehicle is estimated to get approximately 8 miles per gallon. At a cost of $1.00
per gallon, fuel is estimated to cost $.125 per mile. Maintenance cost for tires, lubricants and minor
repairs is estimated at $.375 per mile for a total operating cost of $.50 per mile. Labor is estimated
to be $6.00 per hour per driver. Fringe benefits total 30% labor cost for FICA, workmans
compensation insurance, unemployment insurance, and other benefits. A contingency fee equal to
10 percent of operating costs should be added to pay for insurance, supervision, and other unforeseen
costs.
38
EXAMPLE
To estimate the cost of directly hauling solid waste to the landfill with collection vehicles, Form
IV was created. Only the solid waste collection from the example community will be used to estimate
the direct haul costs.
To estimate annual capital costs, the total annual mileage from the community to the landfill
must be estimated. If we assume that 20 cubic yard collection vehicles will hold approximately 5 tons
per load, it would take about (9,125 tons per year ÷ 5 tons per load) 1,825 trips per year to dispose
of the solid waste. The 1,825 trips per year is multiplied times the round trip miles from the landfill
(70) to obtain an estimate of 127,750 miles per year. To estimate the annual capital costs, the cost
of a 20 cubic yard collection truck (page ) is divided by the estimated vehicle life (150,000 miles) to
obtain a per mile depreciation. Then, the total annual miles is multiplied times the per mile
depreciation to estimate the annual capital costs.
The annual operating costs include vehicle operating costs and labor. Vehicle operating costs
are estimated by multiplying the annual mileage times the per mile cost of fuel and maintenance.
Labor cost is estimated by figuring the amount of time drivers spend in route and back from the
landfill. Dividing the total annual mileage by the average speed of the vehicle gives the total hours
spent in route. The direct haul hours are multiplied times the wage rate to estimate the direct haul
wages. Fringe benefits are also included to estimate the total direct haul labor cost. A contingency
rate of 10% is included to cover unforeseen costs. Using the formulas and estimates provided in the
text, the annual cost before tipping fees of directly hauling waste to the landfills is $161,623.
39
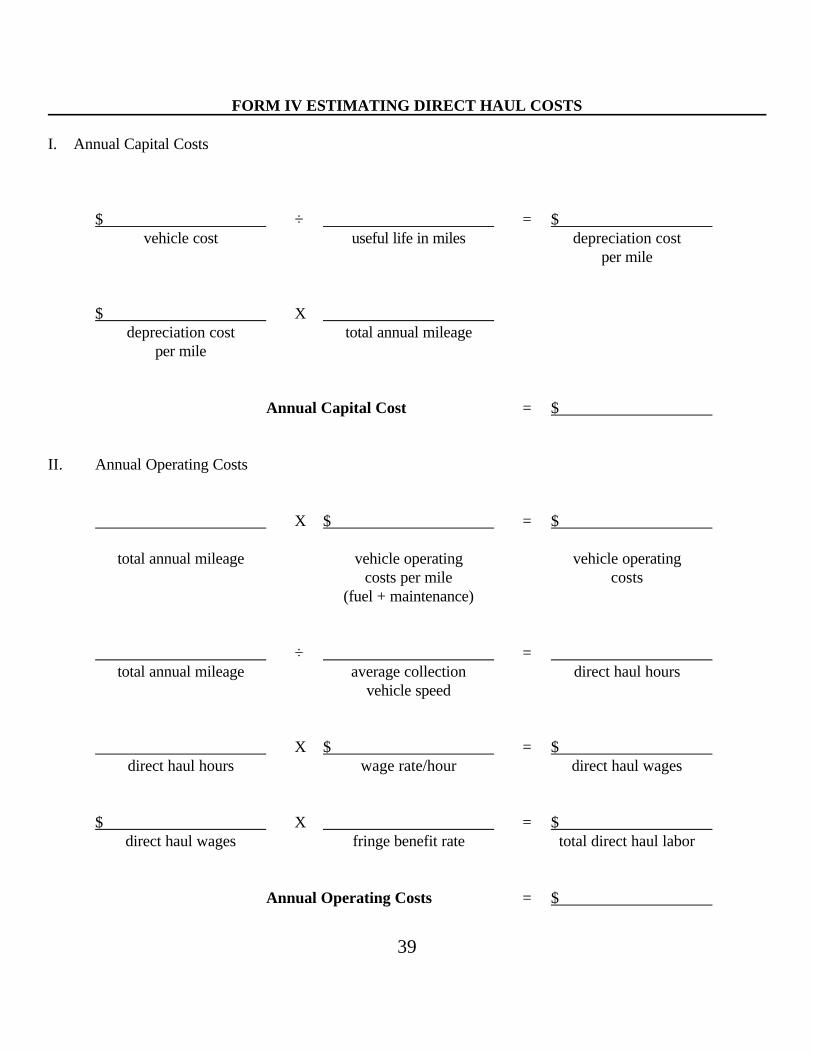
FORM IV ESTIMATING DIRECT HAUL COSTS
I. Annual Capital Costs
$ ÷ = $vehicle cost useful life in miles depreciation cost
per mile
$ Xdepreciation cost total annual mileage
per mile
Annual Capital Cost = $
II. Annual Operating Costs
X $ = $
total annual mileage vehicle operating vehicle operatingcosts per mile costs
(fuel + maintenance)
÷ =total annual mileage average collection direct haul hours
vehicle speed
X $ = $direct haul hours wage rate/hour direct haul wages
$ X = $direct haul wages fringe benefit rate total direct haul labor
Annual Operating Costs = $
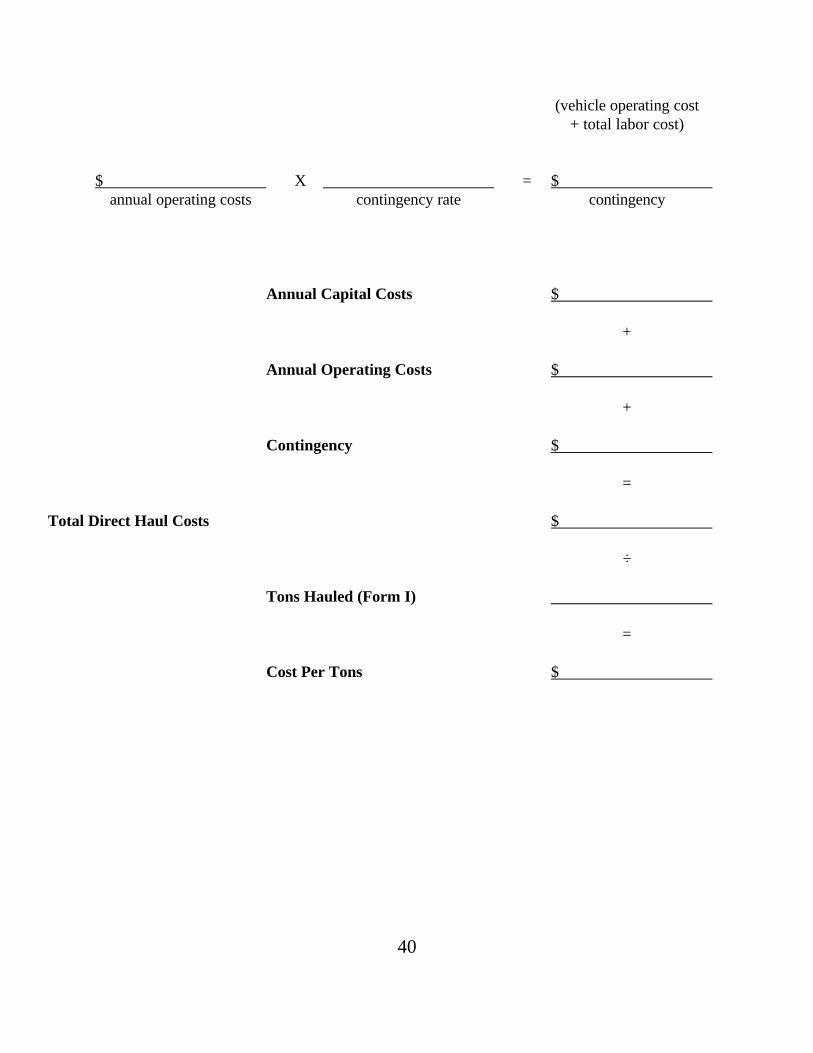
40
(vehicle operating cost+ total labor cost)
$ X = $annual operating costs contingency rate contingency
Annual Capital Costs $
+
Annual Operating Costs $
+
Contingency $
=
Total Direct Haul Costs $
÷
Tons Hauled (Form I)
=
Cost Per Tons $
41
TRANSFER STATION VS. DIRECT HAUL
The choice of the two methods of hauling solid waste to the landfill could be made strictly on
an economic basis using Forms II-IV. The cost of operating a transfer station for the example
community i estimated at $85,634 per year. Directly hauling the solid waste costs approximately
$161,623 The cost of building and operating a transfer station verses delivering the solid waste to
the landfill with collection vehicles is a key consideration in the analysis. However, other factors and
political situations may also influence the final decision.
A transfer station can serve other purposes for the community. In the absence of a local
landfill, a transfer station provides a place for residents to dispose of items not picked up by normal
collection crews. Large items such as appliances and mattresses may be discarded at a transfer
station. Finally, a transfer station provides a facility where a recycling program could be easily
implanted.
42
RURAL COMMUNITY CONVENIENCE CENTERS
As the new Subtitle "D" landfill regulations begin to take effect, many landfills will close,
particularly in rural areas. In the absence of a local landfill or transfer station, residents will more
likely use illegal roadside dumps to dispose of waste not collected by the current system, unless an
alternative disposal site is provided. Illegal dumps are not only an eyesore, but are also a source of
groundwater pollution and potential health problems. Convenience centers provide a place for
citizens to dispose of items not picked up by normal solid waste collection, and they can provide a
space for a recycling program.
A community convenience center is simply a place for residents to bring material that they wish
to dispose of, or to recycle. There is a wide spectrum of convenience center designs. Factors such
as the type of material accepted, location and topography of the center, and the amount of money to
be spent will affect the design of the facility. Minimal requirements for a convenience center include:
1. all weather surfaces on the access road and on the site;
2. easy access by residents to the site and to the solid waste and/or recycling containers on the site;
3. a fence around the perimeter to prevent material from blowing around and forsecurity; and
4. an attendant on duty while the center is open to assist residents, prevent scavenging and vandalism, keep the site neat, and most importantly, to control what is deposited at the site.
43
CONVENIENCE CENTER COSTS
The costs of building and maintaining a rural community convenience center can be divided into
capital costs and annual costs. Capital costs are the costs of purchasing the items needed to
construct and operate a convenience center. Annual costs include the costs of operating the
convenience center.
CAPITAL COSTS
The costs of constructing a convenience center could be as little as a few thousand dollars for a
minimal center, or as much as over $100,000 for a full service convenience center that includes
recycling. The following discussion of cost estimates for the site and equipment includes a list of
many items that could be used for a convenience center (Table 9). However, not all of these items
are necessary. A minimal convenience center may only have a few small containers (dumpsters) and
one or two large roll off boxes. Community leaders must decide what kind of convenience center
services and equipment would best fit the needs of their community.
Site Cost
Location of the convenience center is extremely important. As its' name implies, the center
should be located in a high traffic area so it is convenient for citizens to find and use. A site from one
to three acres should be sufficient. Cost of the land will vary from region to region. In some
instances, land may already be owned by the community, or it may be donated. However, land for a
convenience center may cost up to $1,000 per acre or more.
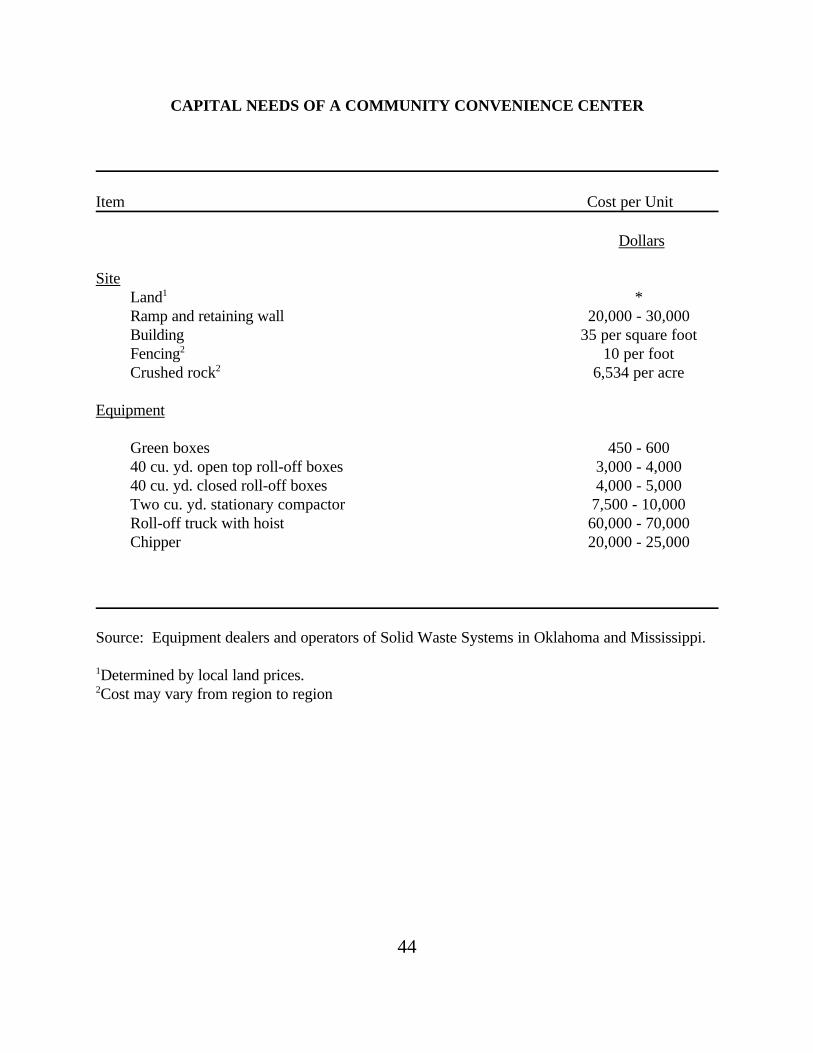
If white goods and other bulky items are to be accepted, then a concrete ramp and retaining TABLE 9
44
CAPITAL NEEDS OF A COMMUNITY CONVENIENCE CENTER
Item Cost per Unit
Dollars
SiteLand1 *Ramp and retaining wall 20,000 - 30,000Building 35 per square footFencing2 10 per footCrushed rock2 6,534 per acre
Equipment
Green boxes 450 - 60040 cu. yd. open top roll-off boxes 3,000 - 4,00040 cu. yd. closed roll-off boxes 4,000 - 5,000Two cu. yd. stationary compactor 7,500 - 10,000Roll-off truck with hoist 60,000 - 70,000Chipper 20,000 - 25,000
Source: Equipment dealers and operators of Solid Waste Systems in Oklahoma and Mississippi.
1Determined by local land prices.2Cost may vary from region to region
45
wall should be constructed to allow citizens to drop heavy items down into large waste containers--
trailers or roll off boxes. The ramp and retaining wall will cost approximately $20,000 to $30,000
depending on the local conditions. A small building should also be constructed to house the
convenience center attendant. A building containing an office and a restroom is estimated to cost $35
per square foot.
The entire perimeter of the convenience center should be fenced to provide security and prevent
blowing material from leaving the site. Fencing is estimated to cost $10 per linear foot for a six foot
chain link fence with barbed wire at the top and one large gate.
Crushed rock will be used for the roadways and parking area to allow for all weather usage.
Assuming the roadways will be covered with 6" of crushed rock at $6 per ton, it will cost
approximately $6,534 per acre for the crushed rock. These prices will vary greatly depending on the
distance from the quarry, and the region it is purchased.
Equipment Cost
The type of equipment needed at the convenience center depends on the services provided and
the type of material to be handled. More equipment will be required if recycling is provided at the
center. Listed in Table 9 are several pieces of equipment that may be used in a rural community
convenience center along with cost estimates for each.
Green boxes are simply a dumpster painted green. Green boxes included in this analysis hold from
6 to 8 cubic yards of waste. Each green box is estimated to cost from $450 to $600. Separate
containers for glass, paper, and other recyclables can be provided if a recycling operation is desired.
Large roll off containers are also used at convenience centers. There are two types of roll off
46
containers, open top and closed top. Open top roll off containers included in this analysis hold up
to 40 cubic yards of material, and are usually used for large items. Residents simply dump their
material into the open top of the container. When the container is full, it is removed by a special truck
with a tilting bed. Each open top roll off container is estimated to cost $3,000 to $4,000.
A closed top roll off container utilizes a stationary compactor to load solid waste. Residents drop
their waste through a hopper into the compactor which pushes the material into the roll off container.
When the container is full, it too is removed by a special truck. Each closed top roll off container is
estimated to cost from $4,000 to $5,000. A two cubic yard stationary compactor is estimated to cost
$7,500 to $10,000.
The special truck to haul roll off boxes tilts its bed down and loads the container onto the bed with
a hydraulic hoist. The material is unloaded by tilting the bed down and allowing gravity to pull the
solid waste out. A roll off truck is estimated to cost approximately $60,000 to $70,000.
A wood chipper may be provided to allow customers to dispose of tree limbs and brush clippings.
The chipper listed in Table 9 is a commercial chipper which can handle limbs up to twelve inches in
diameter and costs $20,000 - $25,000. Smaller chippers may be purchased for much less, but will
have less capacity and durability.
Community leaders must first decide what type of solid waste will be accepted, then choose the
equipment that will best fit their requirements. In some cases, a community may have to purchase
very little equipment. Private solid waste companies will often provide the equipment and dispose
of the solid waste on a cost per load basis. The availability of such an agreement will depend mostly
on the location relative to a private solid waste company. With this arrangement, a community can
save a large amount of money that would be spent on equipment. The cost to dispose of waste
47
on a per load basis will depend on the number of loads, tipping fees, and the distance to the landfill.
In many areas, charges from $100-250 for a 40 cubic yard load are common. In some cases, the cost
may be partially offset by selling recyclable materials.
ANNUAL COSTS
Annual costs are the yearly costs that insure the continual operation of a convenience center.
Annual costs can be further divided between annual capital and operating costs. Annual capital costs
are the yearly depreciation of capital items, and annual operating costs are the daily out of pocket
expenditures for such items as fuel and labor.
Annual Capital Costs
It is important that funds be set aside each year so that money will be available to replace the
capital items when they wear out. Straight line depreciation is a simple method of estimating annual
capital costs.
The capital items shown in Table 9 are assumed to have the following approximate useful life:
Years
Ramp and retaining wall 25
Building 25
Fencing 10
Crushed Rock 5
Roll off containers 10
Green Boxes 5
Stationary Compactor 10
48
Chipper 10
A roll off truck should be depreciated according to its' level of usage. Each truck should be able
to accumulate up to 200,000 miles before being replaced. To calculate the useful life of the roll off
truck, divide the annual milage into 200,000. Then, depreciate the truck over its useful life to allow
for replacement of the vehicle.
By contracting with a private company to provide equipment and remove all of the solid waste,
annual capital costs will be avoided. However, community leaders must decide which option best fits
their community.
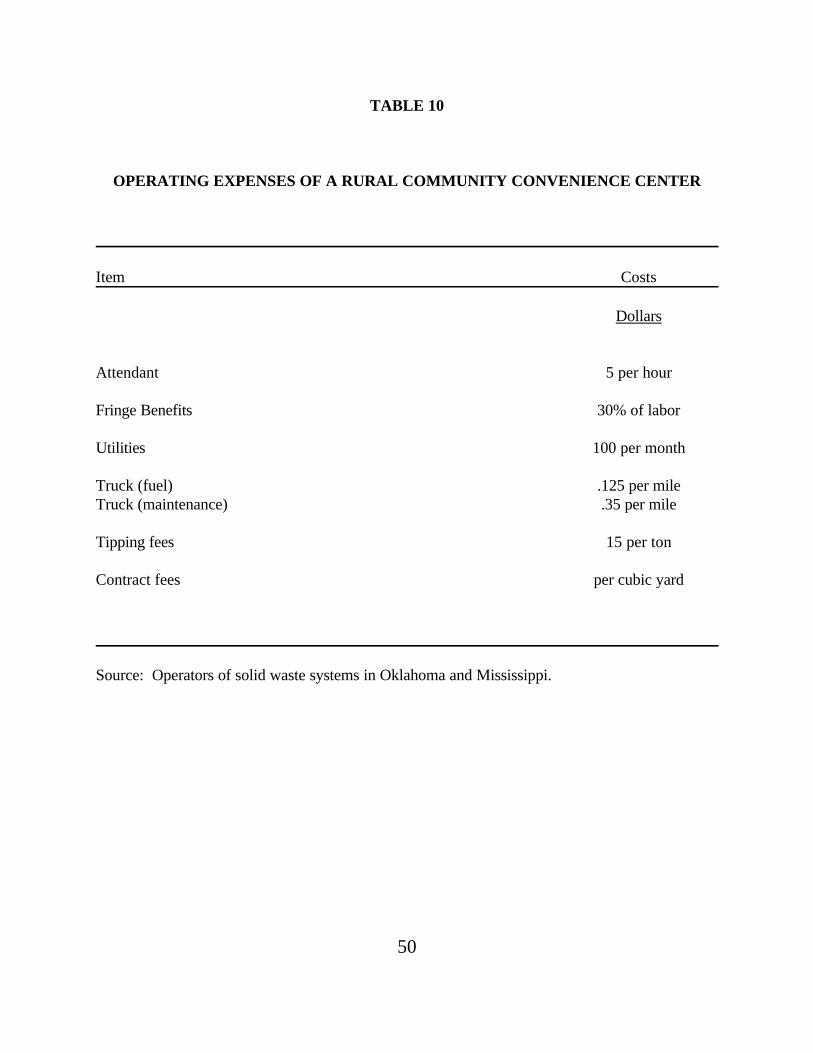
Operating Costs
The operating costs for a rural community convenience center include expenditures for labor,
equipment maintenance, fuel, utilities, and tipping fees. (Table 10)
An attendant will be needed for the convenience center. Retired persons or other part-time help
may be hired at $5.00 per hour. The attendant would be responsible for helping citizens, keeping the
site clean, and, if recycling is implemented, making sure that materials are properly separated. The
attendant can also prevent any hazardous material from being deposited at the center. Fringe benefits
are estimated to be 30 percent of total labor for items such as unemployment insurance, FICA, and
workmans compensation.
Utilities for the convenience center may run from $100 to $200 per month for electricity and
phone. If a stationary compactor is used, utilities may be substantially higher.
The roll off truck is estimated to get 8 miles per gallon. With diesel estimated to cost $1.00 per
gallon, fuel costs would be approximately $.125 per mile. Maintenance on the roll off truck is
estimated to cost approximately $.35 per mile to pay for tires and minor repairs.
49
Tipping fees for solid waste will vary, but are estimated at approximately $15 per ton. Subtitle
"D" regulations could cause tipping fees to increase beyond this estimate.
CONVENIENCE CENTER DESIGN AND OPERATION
The design and operation of a rural community convenience center is restricted only by the
imagination of the designer. The design should allow residents to use the center easily and quickly.
The biggest factors in determining the layout of the center are the type of material being handled, and
the containers used to store the materials.
One example of a minimal community convenience center in rural Oklahoma is located on the edge
of town on an unused portion of an old highway. All equipment is provided and emptied by a private
company. It uses a compactor and roll off boxes. The center is open from 20-25 hours per week,
and accepts most types of municipal solid waste and bulky items. This convenience center was
established with very little capital and operating costs are low, while still providing residents with a
useful service.
An example of a community convenience center at the other end of the spectrum is also located
in rural Oklahoma. This site was designed specifically as a convenience center, and is built on a raised
concrete pad with large roll off containers below. Containers for large bulky items are placed on one
side of the pad. On the other side, recyclables--glass, metal, paper--are
50
TABLE 10
OPERATING EXPENSES OF A RURAL COMMUNITY CONVENIENCE CENTER
Item Costs
Dollars
Attendant 5 per hour
Fringe Benefits 30% of labor
Utilities 100 per month
Truck (fuel) .125 per mileTruck (maintenance) .35 per mile
Tipping fees 15 per ton
Contract fees per cubic yard
Source: Operators of solid waste systems in Oklahoma and Mississippi.
51
placed in the appropriate containers. A composting area that accepts community yard waste (grass
clippings) is located at the center, as well as facilities to accept used motor oil, antifreeze, and old
batteries.
The full service convenience center is open 50 hours per week and provides excellent incentives
for its residents. The center pays a slight fee for recyclable materials, and the composting facility
accepts yard waste collected by curbside pickup and yard waste dropped off by residents. The
community has banned the disposal of yard waste in normal curbside collection to help promote the
composting operation.
The city owns very little of the convenience center equipment. It is owned by private companies
that either haul the solid waste or the recyclable materials. The sale of the recyclable material helps
pay for operating costs. However, a large investment was required in preparing the location as a
convenience center.
EXAMPLE
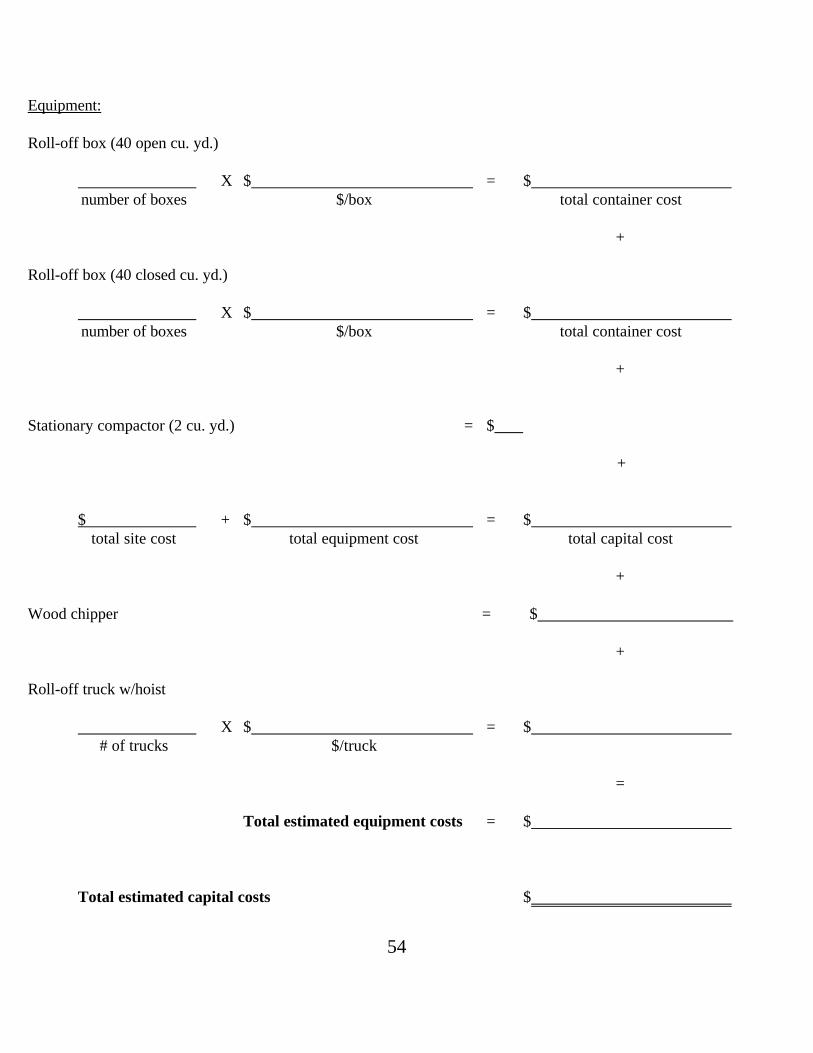
To help estimate the cost of building and operating a rural community convenience center.
Forms V and VI were created. Form V estimates the capital requirements of building a convenience
center. Form VI estimates the annual costs of operating a convenience center. The example county
community will be used for this analysis. It is assumed that a private solid waste company will
provide the equipment. Therefore, the capital and operating costs of the equipment are not included
in this example.
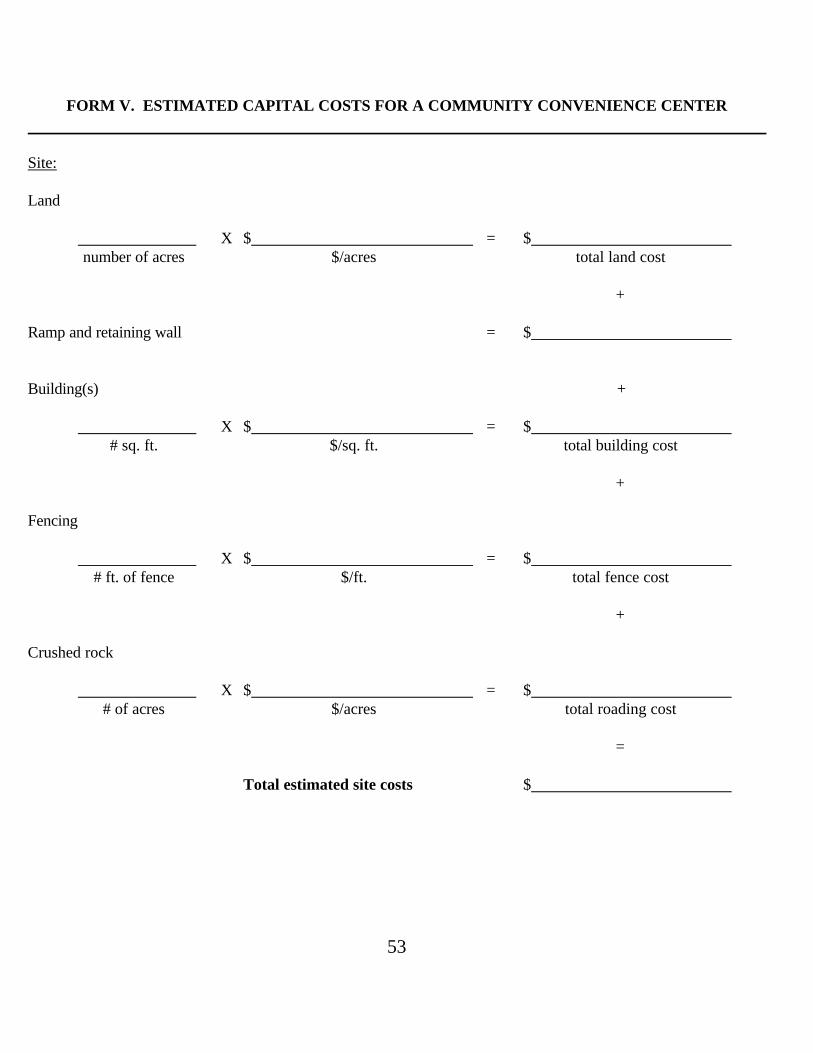
The capital cost include the cost of purchasing land, a building, and site improvements of
fencing and crushed rock for roadways. Using Form V, the estimated capital costs of building a
52
convenience center for the example community is $51,300.
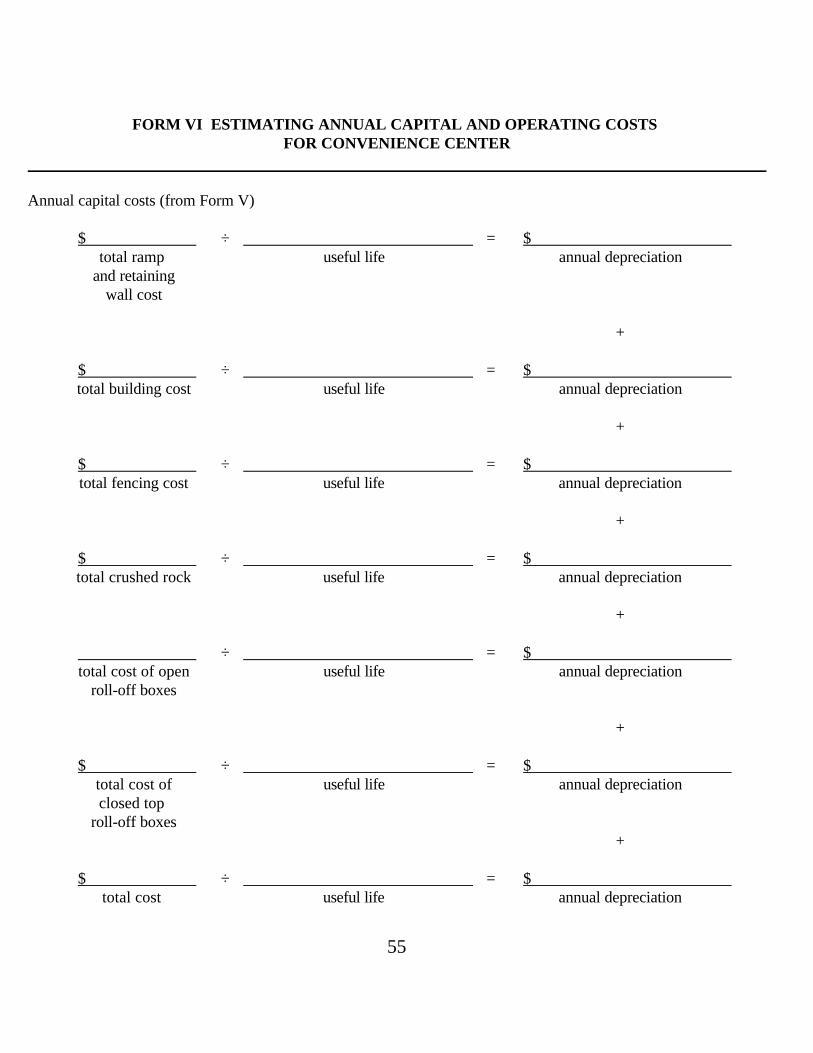
For VI estimates the annual costs of operating the convenience center. Annual capital
costs are the depreciation of capital items. The total cost of the capital item is divided by the useful
life in years to obtain an annual capital cost. Operating costs include labor, utilities, and disposal fees.
It is assumed the center is open 48 hours per week, or 2,496 hours per year. An attendant is paid
$5.00 per hour. Utilities are estimated to cost $100 per month. Disposal fees will be on a per ton
or cubic yard basis. For this example, the contract disposal fees are estimated to be $20 per ton, and
will cover the cost of equipment and disposal.
Using the formulas and estimates provided in the text, the example rural community convenience
center is estimated to cost $203,674 per year. If local estimates are available, they should be used.
53
FORM V. ESTIMATED CAPITAL COSTS FOR A COMMUNITY CONVENIENCE CENTER
Site:
Land
X $ = $number of acres $/acres total land cost
+
Ramp and retaining wall = $
Building(s) +
X $ = $# sq. ft. $/sq. ft. total building cost
+
Fencing
X $ = $# ft. of fence $/ft. total fence cost
+
Crushed rock
X $ = $# of acres $/acres total roading cost
=
Total estimated site costs $
54
Equipment:
Roll-off box (40 open cu. yd.)
X $ = $number of boxes $/box total container cost
+
Roll-off box (40 closed cu. yd.)
X $ = $number of boxes $/box total container cost
+
Stationary compactor (2 cu. yd.) = $
+
$ + $ = $total site cost total equipment cost total capital cost
+
Wood chipper = $
+
Roll-off truck w/hoist
X $ = $# of trucks $/truck
=
Total estimated equipment costs = $
Total estimated capital costs $
55
FORM VI ESTIMATING ANNUAL CAPITAL AND OPERATING COSTS FOR CONVENIENCE CENTER
Annual capital costs (from Form V)
$ ÷ = $total ramp useful life annual depreciation
and retainingwall cost
+
$ ÷ = $total building cost useful life annual depreciation
+
$ ÷ = $total fencing cost useful life annual depreciation
+
$ ÷ = $total crushed rock useful life annual depreciation
+
÷ = $total cost of open useful life annual depreciation
roll-off boxes
+
$ ÷ = $total cost of useful life annual depreciationclosed top
roll-off boxes+
$ ÷ = $total cost useful life annual depreciation
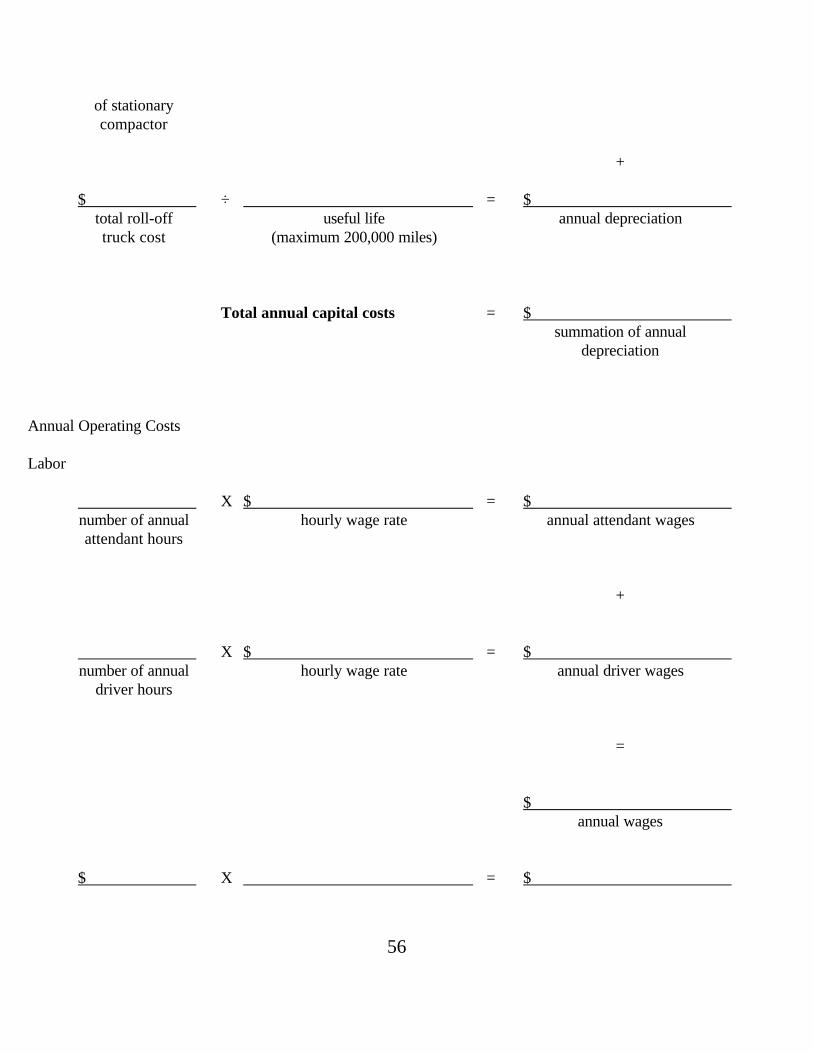
56
of stationarycompactor
+
$ ÷ = $total roll-off useful life annual depreciationtruck cost (maximum 200,000 miles)
Total annual capital costs = $summation of annual
depreciation
Annual Operating Costs
Labor
X $ = $number of annual hourly wage rate annual attendant wagesattendant hours
+
X $ = $number of annual hourly wage rate annual driver wages
driver hours
=
$annual wages
$ X = $
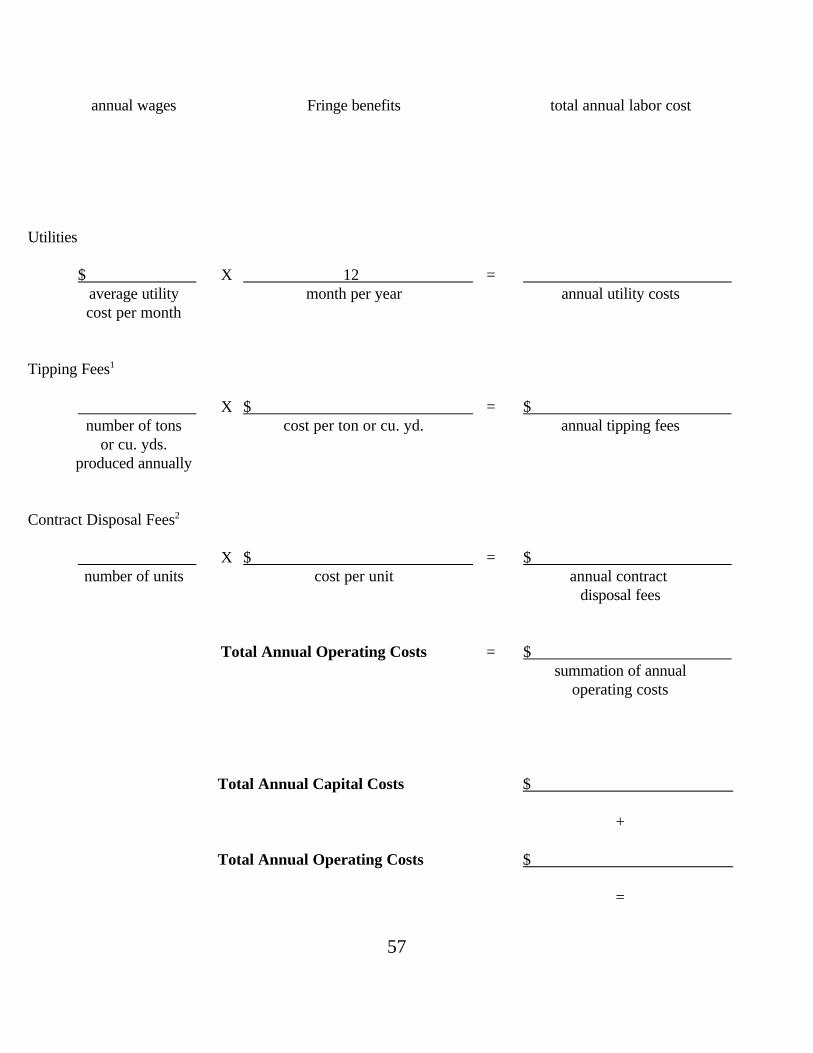
57
annual wages Fringe benefits total annual labor cost
Utilities
$ X 12 =average utility month per year annual utility costscost per month
Tipping Fees1
X $ = $number of tons cost per ton or cu. yd. annual tipping fees
or cu. yds.produced annually
Contract Disposal Fees2
X $ = $number of units cost per unit annual contract
disposal fees
Total Annual Operating Costs = $summation of annual
operating costs
Total Annual Capital Costs $
+
Total Annual Operating Costs $
=
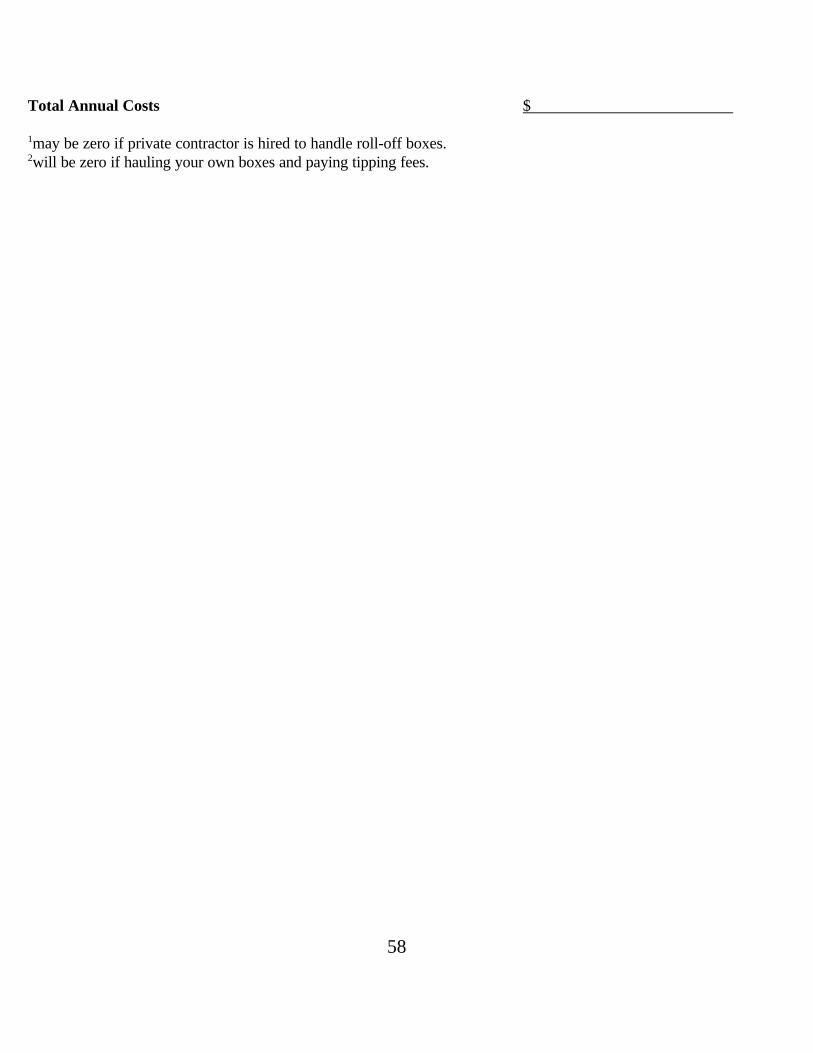
58
Total Annual Costs $
1may be zero if private contractor is hired to handle roll-off boxes.2will be zero if hauling your own boxes and paying tipping fees.
59
RURAL SOLID WASTE COLLECTION ALTERNATIVES
In many rural areas outside of organized communities, rural residents do not have access to
solid waste collection services. With no convenient place to dispose of their waste, some residents
rely on illegal roadside dumps. Illegal dumps are not only an eyesore, but also pose a serious health
and groundwater pollution problem. Roadside dumps have been a problem in the past, and are likely
to increase in the future if action is not taken. Establishing a rural collection system will decrease the
incidence of illegal dumps.
There are three alternatives for rural solid waste collection: green box systems; convenience
centers; and door-to-door service. These three alternatives may be used exclusively or in
combination. Local community decision makers must choose which system or combination of
systems best fit their requirements.
GREEN BOX SYSTEM
A "green box" is a dumpster painted green. A rural green box collection system entails placing
green boxes (eight cubic yard boxes are common) along heavily used rural roads. Rural residents are
encouraged, by easy access, to deposit waste in the green boxes as they pass. The waste is collected
once or twice a week and hauled either to a landfill or transfer station. The number of green boxes
at each rural location depends on the number of persons in the immediate vicinity--generally a three
to five mile radius.
A green box system is attractive to local decisionmakers because the resident bears part of the
responsibility (i.e. costs) of waste collection. Residents must expend time and energy to carry their
60
solid waste to container sites.
However, a green box system affords local decisionmakers with the least control of material
thrown into the containers. Legal responsibility for illegal or hazardous material placed in containers
is often a concern of local decision makers. Persons other than residents of the collection area may
use the containers, resulting in excessive volumes. Additionally, container sites are often difficult to
obtain. Residents want the container convenient to their travel pattern and location, but not in their
back yard (NIMBY)
Once rural leaders have a basic understanding of a green box collection system, the following
guidelines should be considered in setting up a collection system. First, there are at least four possible
location criteria to consider. Containers should be located:
1. Near concentrations of residents.
2. Along frequently traveled roads.
3. Where most residents do not have to travel more than 3 to 5 miles to dispose of their
waste.
4. In sufficient numbers at each location to handle estimated volume.
Second, estimate the number of containers required for the collection system. The number
of containers depends on factors such as population, waste generation rates, container capacity,
seasonability, and frequency of collection. A typical container system will use 8-cubic yard
containers. One cubic yard of uncompacted garbage weighs about 175 lbs. Thus, the total number
of containers required for once a week pickup can be derived from the following
equation:
61
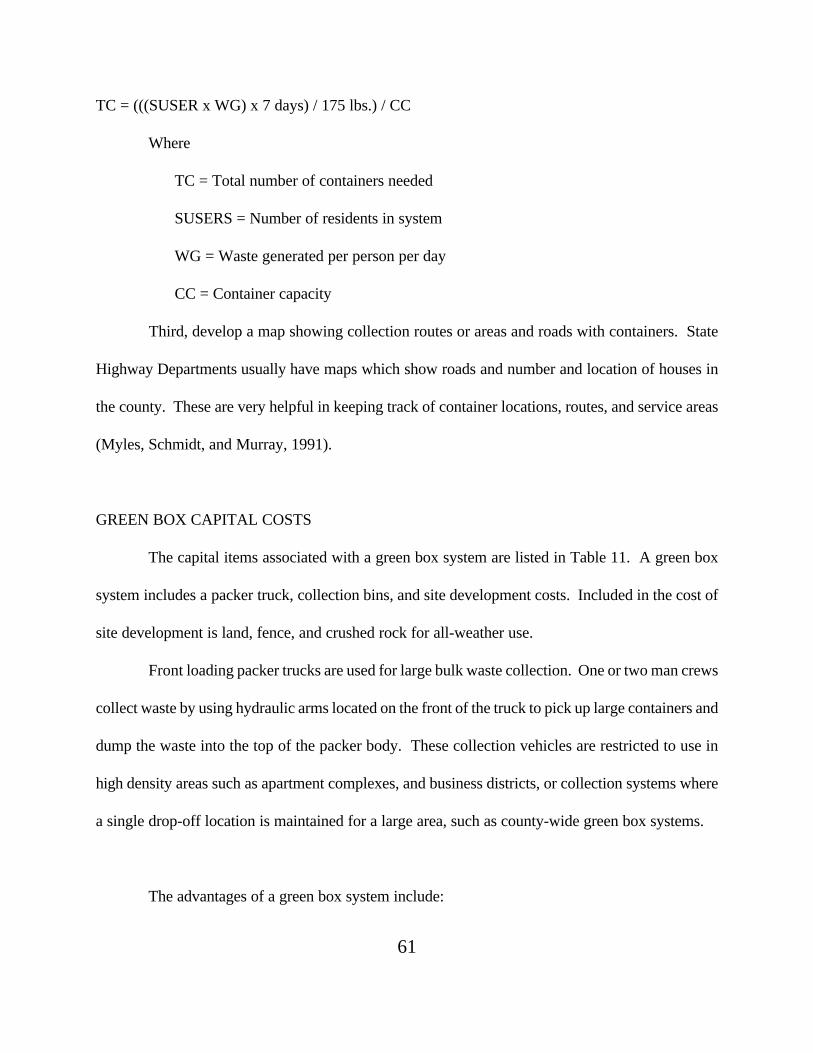
TC = (((SUSER x WG) x 7 days) / 175 lbs.) / CC
Where
TC = Total number of containers needed
SUSERS = Number of residents in system
WG = Waste generated per person per day
CC = Container capacity
Third, develop a map showing collection routes or areas and roads with containers. State
Highway Departments usually have maps which show roads and number and location of houses in
the county. These are very helpful in keeping track of container locations, routes, and service areas
(Myles, Schmidt, and Murray, 1991).
GREEN BOX CAPITAL COSTS
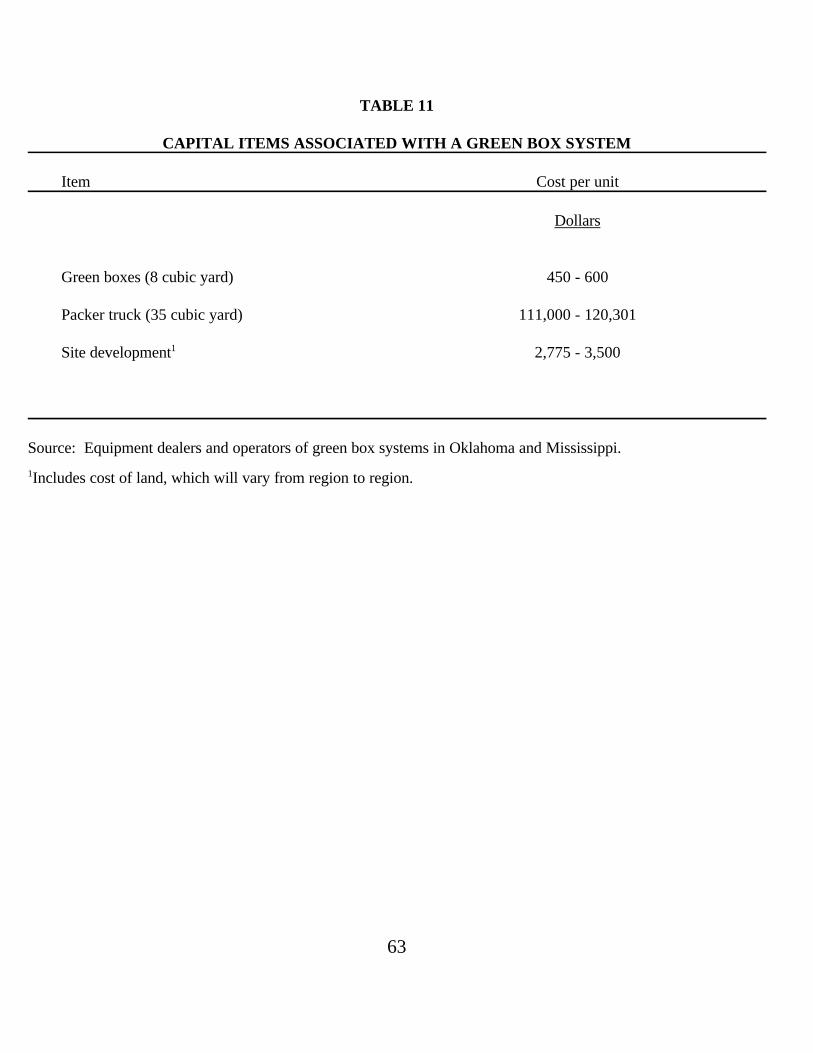
The capital items associated with a green box system are listed in Table 11. A green box
system includes a packer truck, collection bins, and site development costs. Included in the cost of
site development is land, fence, and crushed rock for all-weather use.
Front loading packer trucks are used for large bulk waste collection. One or two man crews
collect waste by using hydraulic arms located on the front of the truck to pick up large containers and
dump the waste into the top of the packer body. These collection vehicles are restricted to use in
high density areas such as apartment complexes, and business districts, or collection systems where
a single drop-off location is maintained for a large area, such as county-wide green box systems.
The advantages of a green box system include:
62
1. Cost--is the least expensive rural collection alternative to
implement and maintain.
2. Convenience--residents are not required to travel far to dispose of their waste.
3. Public Health--controlling illegal dumping helps eliminate pollution problems and
rodents.
63
TABLE 11
CAPITAL ITEMS ASSOCIATED WITH A GREEN BOX SYSTEM
Item Cost per unit
Dollars
Green boxes (8 cubic yard) 450 - 600
Packer truck (35 cubic yard) 111,000 - 120,301
Site development1 2,775 - 3,500
Source: Equipment dealers and operators of green box systems in Oklahoma and Mississippi.
1Includes cost of land, which will vary from region to region.
64
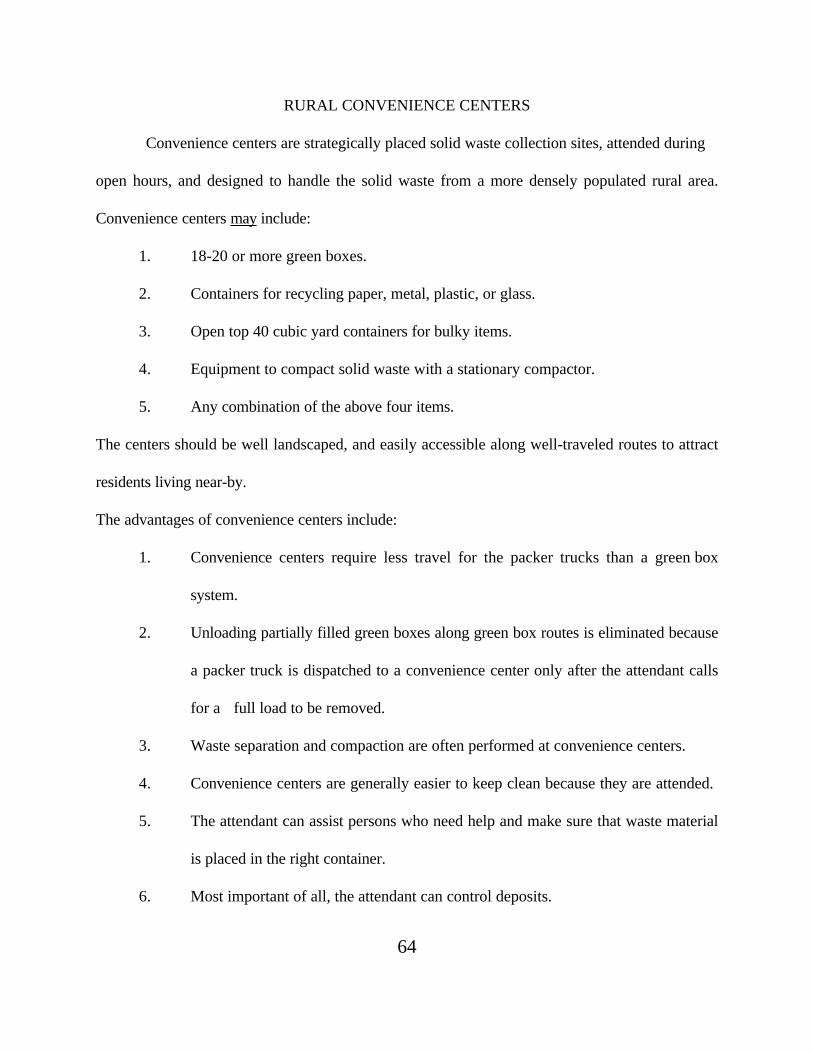
RURAL CONVENIENCE CENTERS
Convenience centers are strategically placed solid waste collection sites, attended during
open hours, and designed to handle the solid waste from a more densely populated rural area.
Convenience centers may include:
1. 18-20 or more green boxes.
2. Containers for recycling paper, metal, plastic, or glass.
3. Open top 40 cubic yard containers for bulky items.
4. Equipment to compact solid waste with a stationary compactor.
5. Any combination of the above four items.
The centers should be well landscaped, and easily accessible along well-traveled routes to attract
residents living near-by.
The advantages of convenience centers include:
1. Convenience centers require less travel for the packer trucks than a green box
system.
2. Unloading partially filled green boxes along green box routes is eliminated because
a packer truck is dispatched to a convenience center only after the attendant calls
for a full load to be removed.
3. Waste separation and compaction are often performed at convenience centers.
4. Convenience centers are generally easier to keep clean because they are attended.
5. The attendant can assist persons who need help and make sure that waste material
is placed in the right container.
6. Most important of all, the attendant can control deposits.
65
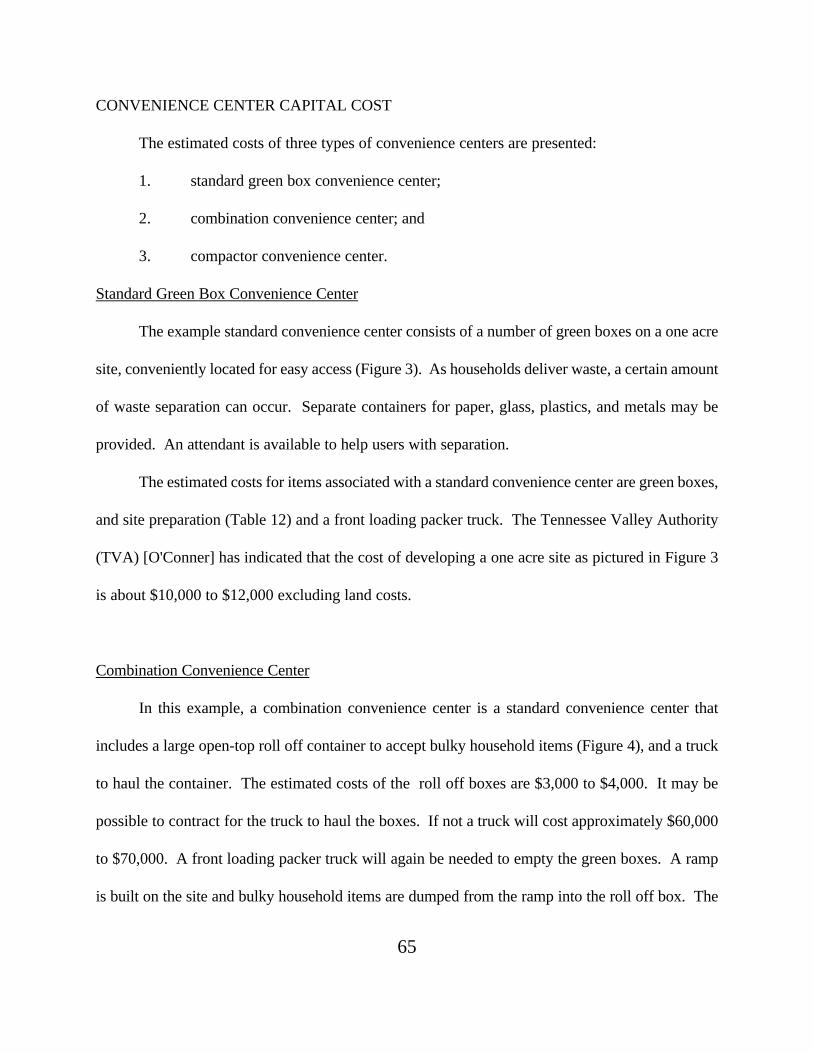
CONVENIENCE CENTER CAPITAL COST
The estimated costs of three types of convenience centers are presented:
1. standard green box convenience center;
2. combination convenience center; and
3. compactor convenience center.
Standard Green Box Convenience Center
The example standard convenience center consists of a number of green boxes on a one acre
site, conveniently located for easy access (Figure 3). As households deliver waste, a certain amount
of waste separation can occur. Separate containers for paper, glass, plastics, and metals may be
provided. An attendant is available to help users with separation.
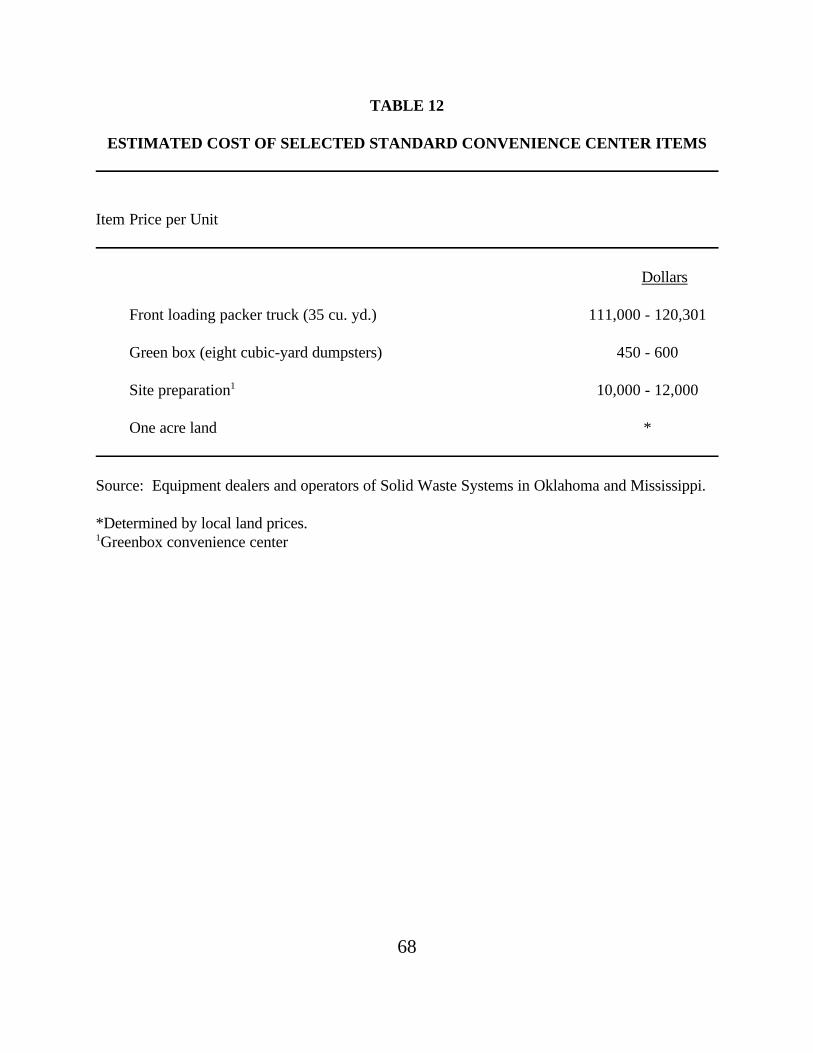
The estimated costs for items associated with a standard convenience center are green boxes,
and site preparation (Table 12) and a front loading packer truck. The Tennessee Valley Authority
(TVA) [O'Conner] has indicated that the cost of developing a one acre site as pictured in Figure 3
is about $10,000 to $12,000 excluding land costs.
Combination Convenience Center
In this example, a combination convenience center is a standard convenience center that
includes a large open-top roll off container to accept bulky household items (Figure 4), and a truck
to haul the container. The estimated costs of the roll off boxes are $3,000 to $4,000. It may be
possible to contract for the truck to haul the boxes. If not a truck will cost approximately $60,000
to $70,000. A front loading packer truck will again be needed to empty the green boxes. A ramp
is built on the site and bulky household items are dumped from the ramp into the roll off box. The
66
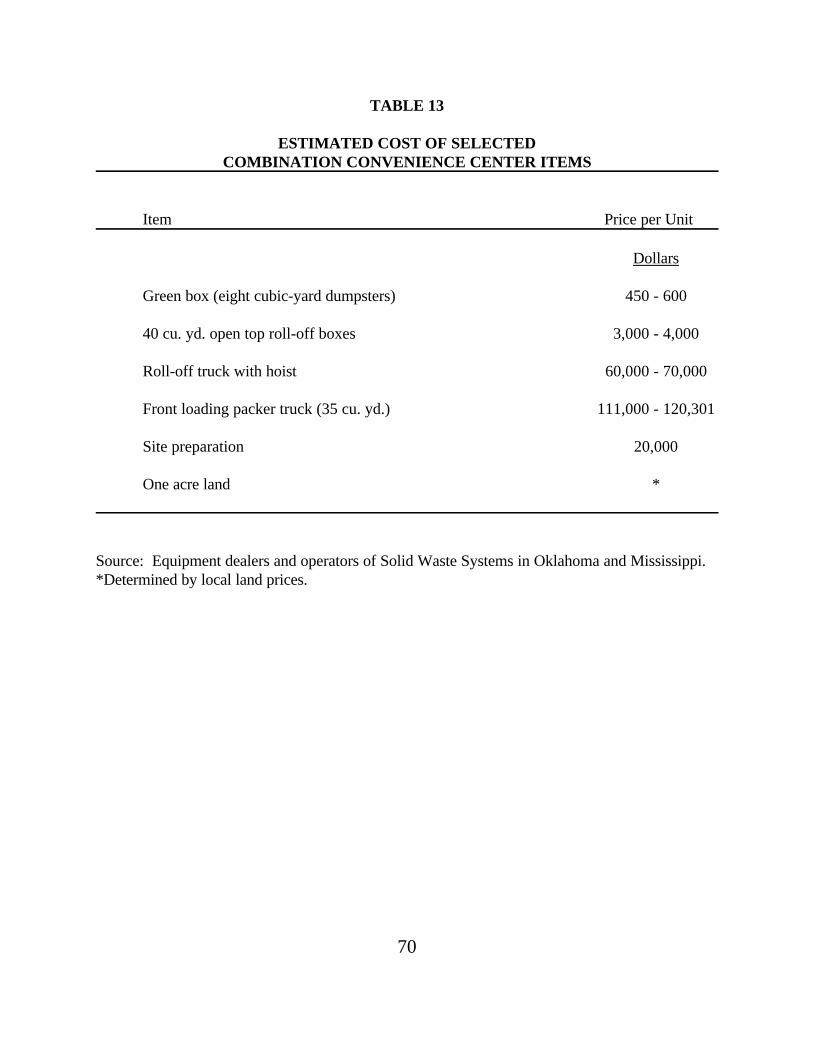
estimated cost for items associated with combination convenience centers are presented in Table 13.

67
figure 3
68
TABLE 12
ESTIMATED COST OF SELECTED STANDARD CONVENIENCE CENTER ITEMS
Item Price per Unit
Dollars
Front loading packer truck (35 cu. yd.) 111,000 - 120,301
Green box (eight cubic-yard dumpsters) 450 - 600
Site preparation1 10,000 - 12,000
One acre land *
Source: Equipment dealers and operators of Solid Waste Systems in Oklahoma and Mississippi.
*Determined by local land prices.1Greenbox convenience center

69
figure 4
70
TABLE 13
ESTIMATED COST OF SELECTEDCOMBINATION CONVENIENCE CENTER ITEMS
Item Price per Unit
Dollars
Green box (eight cubic-yard dumpsters) 450 - 600
40 cu. yd. open top roll-off boxes 3,000 - 4,000
Roll-off truck with hoist 60,000 - 70,000
Front loading packer truck (35 cu. yd.) 111,000 - 120,301
Site preparation 20,000
One acre land *
Source: Equipment dealers and operators of Solid Waste Systems in Oklahoma and Mississippi.*Determined by local land prices.
71
Compactor Convenience Center
The example compactor convenience center uses a two-cubic yard stationary compactor
together with a 42 cubic-yard closed container in place of green boxes. Waste is deposited into the
compactor by the user and then compacted into a closed container by the center attendant. The two
cubic yard compactor has an estimated cost of $7,500 to $10,000. Two open-top roll-off units are
also used in this example (Figure 5). A roll off truck will be required to dispose of the roll off boxes.
A roll off truck will be required to dispose of the roll off boxes. The estimated cost for items
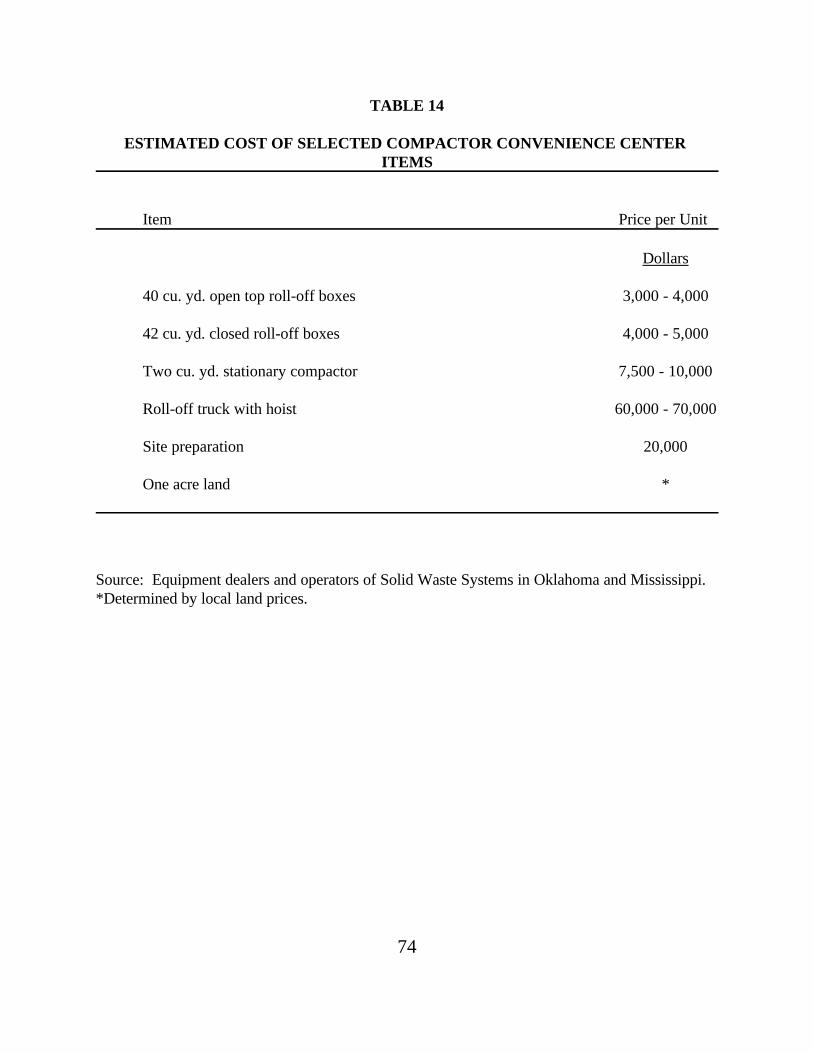
associated with this type of convenience center are presented in Table 14.
In some cases, convenience center equipment may be operated on a rental basis. Private
solid waste management companies will often provide containers and dispose of the waste for a fee.
The only capital cost for the system would be providing the site for the center. Depending on the
type of material being dumped, the cost of disposing of each load will range from $100 to $300 per
load. One major factor affecting the availability of rental equipment is the distance that a community
is from a private solid waste management company.
Convenience centers have several advantages over green box collection systems (O'Connor)
including:
1. Cleanliness--attendants keep the area clean and help residents in unloading trash.
2. Efficiency--attendants call for trucks only when full-loads are available.
3. Cost--after initial start-up costs, they are less expensive to operate due totransportation, routing, site cleaning, and labor savings.
4. Convenience--operating hours are adjustable to user schedules, and centers are locatednear populated areas along major roads.
5. Security--attendants maintain security and help eliminate scavenging, vandalism, stray
72
dogs, and illegal dumping by residential and commercial waste generators.
6. Public Health--controlling illegal dumping helps eliminate pollution problems androdents.

73
figure 5
74
TABLE 14
ESTIMATED COST OF SELECTED COMPACTOR CONVENIENCE CENTER ITEMS
Item Price per Unit
Dollars
40 cu. yd. open top roll-off boxes 3,000 - 4,000
42 cu. yd. closed roll-off boxes 4,000 - 5,000
Two cu. yd. stationary compactor 7,500 - 10,000
Roll-off truck with hoist 60,000 - 70,000
Site preparation 20,000
One acre land *
Source: Equipment dealers and operators of Solid Waste Systems in Oklahoma and Mississippi.*Determined by local land prices.
75
DOOR TO DOOR
The most expensive of the three rural collection systems to operate is the door-to-door,
or mailbox-to-mailbox collection system. As with community solid waste collection, residents simply
place their waste material on the road near their mailbox, and collection vehicles stop at every
residence to collect the waste. The collection routes should be laid out to minimize the total mileage
for the collection vehicles. The types of roads is also important since inclement weather could slow
or halt collection. However, since most mail routes are all-weather, collection vehicles should be able
to travel these roads. If once per week collection is considered then each truck and crew should be
scheduled for only four days per week. This leaves a day per week to allow for holidays and
mechanical break downs.
The major capital requirement for a door-to-door system is the collection vehicle. The
type of truck required depends on the conditions of the system. Rear loading packer trucks are a
common type of collection vehicle. They generally are operated with a two or three man crew. The
rear loading set up allows collection on both sides of the street with one pass. These trucks are best
suited for small residential trash bins, small brush, and other loose waste.
Side loading packer trucks are designed for residential solid waste collection for a one
man crew. The waste is collected by hydraulic arms that pick up uniform size trash containers placed
on the curb. The smaller crew requirements decrease operating expenses. However, a side loader
may only pick up waste on one side of a street. Road and bridge conditions often force the
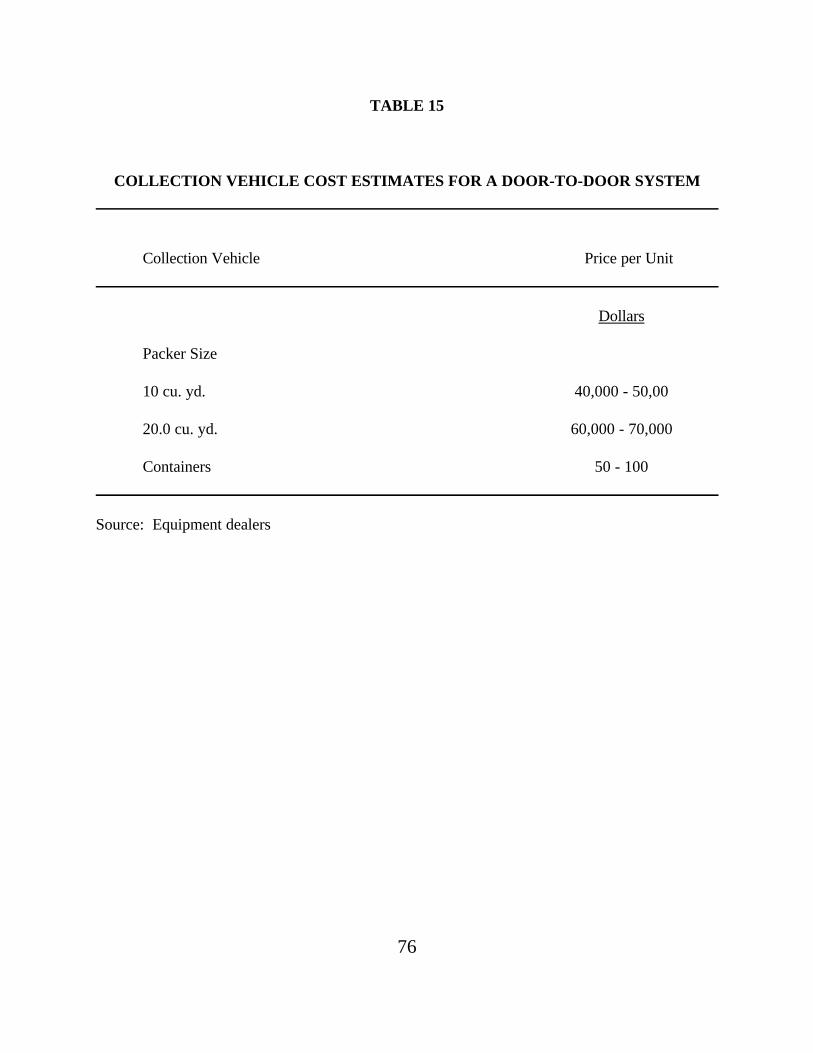
utilization of smaller trucks. Containers may be provided for residents at a cost of $50 to $100 each.
Listed in Table 15 is the estimated cost of two sizes of compactor trucks.
76
TABLE 15
COLLECTION VEHICLE COST ESTIMATES FOR A DOOR-TO-DOOR SYSTEM
Collection Vehicle Price per Unit
Dollars
Packer Size
10 cu. yd. 40,000 - 50,00
20.0 cu. yd. 60,000 - 70,000
Containers 50 - 100
Source: Equipment dealers
77
The advantages of a door to door collection system include:
1. Convenience--most convenient collection system for residents
2. Comprehensive--allows for collection from all residents
3. Public Health--controlling legal dumping helps eliminate pollution problemsand rodents.
ANNUAL COSTS
ANNUAL CAPITAL COSTS
Annual capital costs are the depreciation of the item used in the collection system. Including
depreciation in the annual cost of a collection system allows decision makers to replace capital items
when they have reached the end of their useful life.
Annual capital costs depend directly on the number and type of equipment chosen. In this
analysis, packer trucks are depreciated by the same amount each year over the life of the vehicle.
System operators report that the maximum lifetime of a collection vehicle ranges from 100,000 to
200,000 miles. Green box and convenience center sites are depreciated over 10 years because fencing
and crushed rock must be replaced after extended use. Solid waste collection containers are
depreciated over five years. The large roll off boxes and stationary compactors are estimated to have
a useful life of 10 years. The roll off truck is estimated to last approximately 150,000 miles.
ANNUAL OPERATING COSTS
78
Operating costs are the costs associated with maintaining day-to-day operations of the system.
These costs include expenditures on tires, fuel, maintenance, labor, and other various items. Costs
listed in Table 16 will provide estimates for the cost of operating a collection system. While each
system will have costs unique to itself, the estimates will provide a good indication of the total cost
that decision makers can expect.
Collection vehicles are expected to get approximately 8 miles per gallon. If diesel fuel costs
$1.00 per gallon, fuel is estimated to cost $.125 per mile. Maintenance covers things such as tiers,
repairs, and oil changes and is estimated to cost $.375 per mile. Therefore, fuel and maintenance will
cost approximately $.50 per mile.
Labor costs include drivers, attendants, and administration. Drivers are normally paid
approximately $7 per hour, and attendants are paid $4.35 per hour. Administration of the system is
estimated to cost 25% of the total labor costs. In some cases, the system may be large enough to
warrant a full-time administrator. The annual cost of a full-time administrator is estimated to be
$17,500 to $25,000. However, some rural systems will not be large enough to justify this expense.
Fringe benefits must also be included to cover insurance, workmans compensation, and retirement.
Fringe benefits are estimated to be 30% of total labor.
Utilities for a collection system can cost up to $2,000 per year. Office costs for supplies and
phone are estimated at $2,500 per year. Maintenance on green boxes are included for minor repairs
and paint for the boxes, and are estimated at $6.00 per box per year. Tipping fees are estimated to
cost $15 per ton. Contingency fees are included to cover things such as insurance, and other
unforeseen costs.
TABLE 16
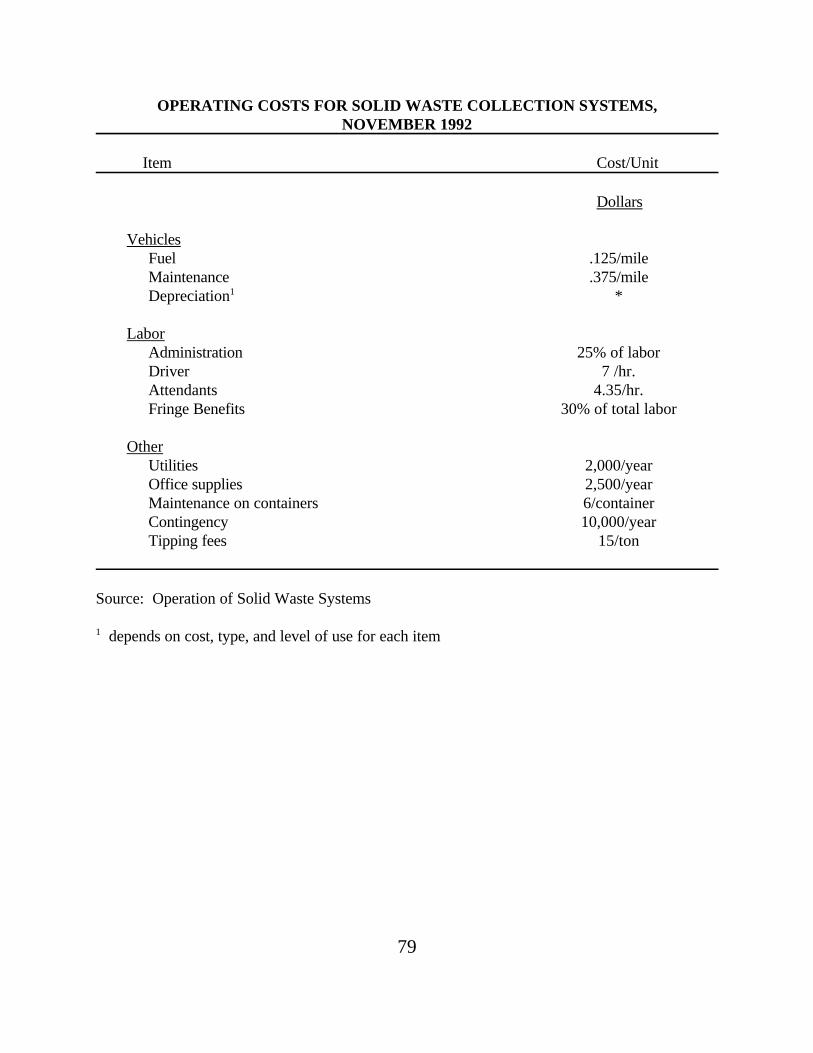
79
OPERATING COSTS FOR SOLID WASTE COLLECTION SYSTEMS,NOVEMBER 1992
Item Cost/Unit
Dollars
VehiclesFuel .125/mileMaintenance .375/mileDepreciation1 *
LaborAdministration 25% of laborDriver 7 /hr.Attendants 4.35/hr.Fringe Benefits 30% of total labor
OtherUtilities 2,000/yearOffice supplies 2,500/yearMaintenance on containers 6/containerContingency 10,000/yearTipping fees 15/ton
Source: Operation of Solid Waste Systems
1 depends on cost, type, and level of use for each item
80
EXAMPLE
To estimate the cost of rural solid waste collection system, Forms VII and VIII were developed.
Form VII estimates the capital cost of a rural collection system, and Form VIII estimates the annual
costs of a rural collection system.
Because door to door system are more complex, forms to estimate cost of establishing a door
to door collection system are not included. The 5,000 rural residents of the example county will be
used for this example. Disposal of the solid waste is assumed to be at the county transfer station.
For this example, we assume that the example county selects a standard convenience center collection
system with four sites located throughout the county.
Form VII shows the capital costs of building and equipping four convenience center sites. Each
site is assumed to be approximately two acres for a total of eight acres of land. Site development is
estimated to cost $12,000 per location. Using the formula provided earlier in the text, it is estimated
that 88 green boxes would be needed for once a week pick up. Half as many green boxes would be
needed for twice a week pick up. One 35 cubic yard packer truck would handle the collection.
Form VIII is used to estimate the annual costs of operating a rural collection system. Annual
cost include annual capital costs and annual operating costs. To estimate the useful life of the
collection vehicle, the maximum miles the vehicle is capable of accumulating (200,000 miles) is
divided by the estimated annual miles. Because the location of the convenience centers are not
known, it is assumed that the collection truck will accumulate 40,000 miles per year. Therefore, the
collection truck will have a useful life of five years. To estimate the annual cost of a standard
convenience center, the total equipment costs and the total site costs are divided by the useful life.
Annual operating costs include expenditures on labor, vehicle operating expenses, and other out
81
of pocket expenses. Labor includes expenditures on a collection crew and attendants for each
convenience center. One crew of two drivers is assumed to work 40 hours per week for a total of
4,160 hours per year. Four attendants will work 40 hours per week for a total of 8,320 hours per
year. Administration is estimated to cost 25 percent of labor. Fringe benefits are included to cover
social security, insurance, and workmans compensation.
Vehicle expenses include fuel and maintenance. To estimate vehicle operating costs, the
estimated annual mileage (40,000) is multiplied times the per mile cost for fuel plus maintenance.
Other operating expenses include utilities and tipping fees. However, in this example, tipping fees
are not included since disposal is at the county transfer station.
Using the formulas and estimates provided in the text, it is estimated the capital cost of building
a standard convenience center collection system is $210,120, and the annual costs total $167,356.
If local data is available, it should be used.
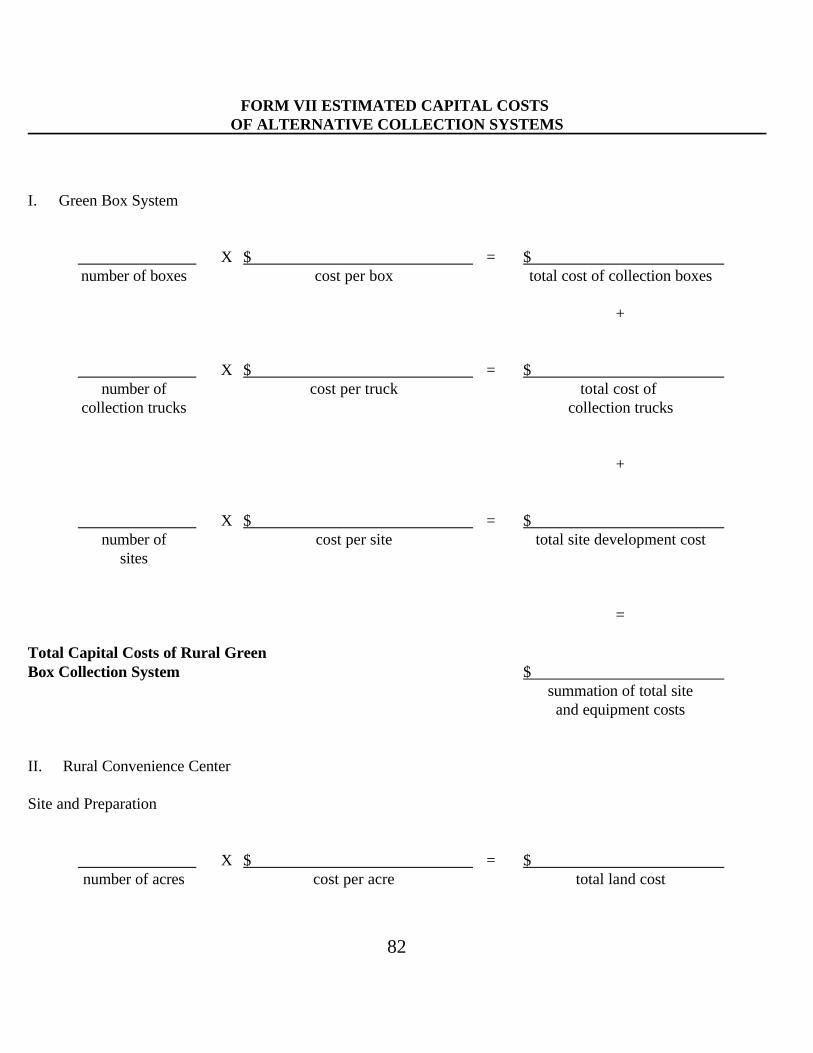
82
FORM VII ESTIMATED CAPITAL COSTS OF ALTERNATIVE COLLECTION SYSTEMS
I. Green Box System
X $ = $number of boxes cost per box total cost of collection boxes
+
X $ = $number of cost per truck total cost of
collection trucks collection trucks
+
X $ = $number of cost per site total site development cost
sites
=
Total Capital Costs of Rural Green Box Collection System $
summation of total siteand equipment costs
II. Rural Convenience Center
Site and Preparation
X $ = $number of acres cost per acre total land cost

83
+
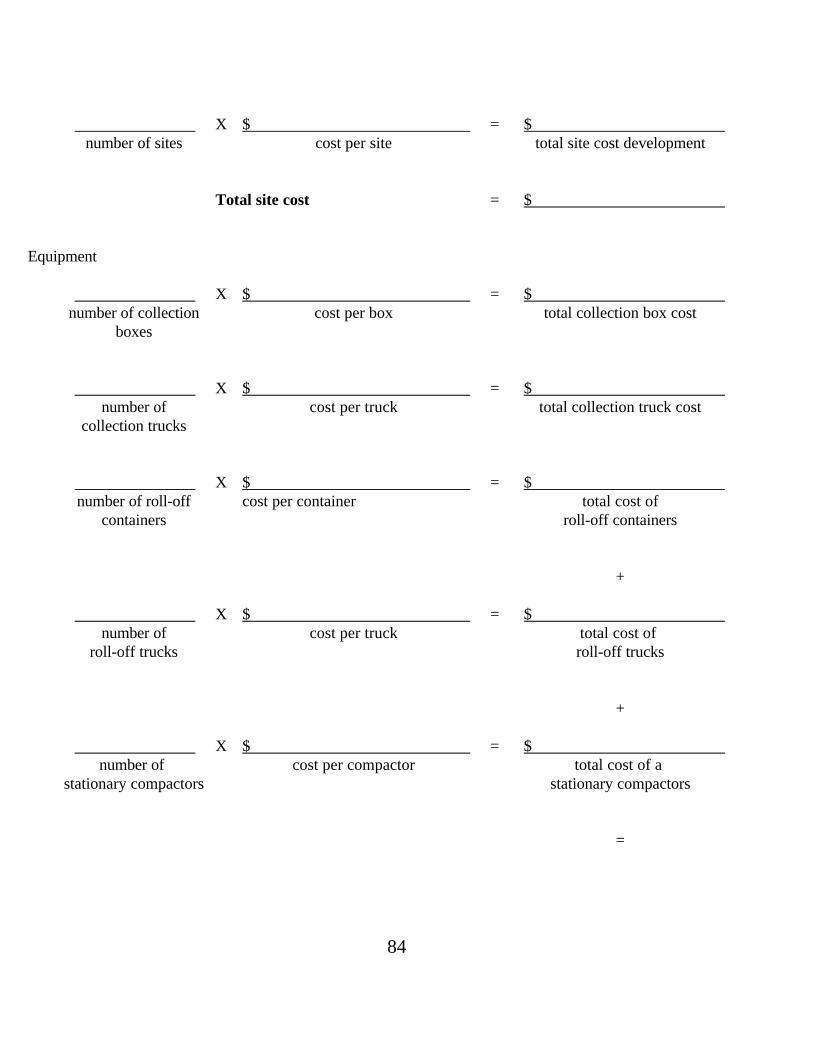
84
X $ = $number of sites cost per site total site cost development
Total site cost = $
Equipment
X $ = $number of collection cost per box total collection box cost
boxes
X $ = $number of cost per truck total collection truck cost
collection trucks
X $ = $number of roll-off cost per container total cost of
containers roll-off containers
+
X $ = $number of cost per truck total cost of
roll-off trucks roll-off trucks
+
X $ = $number of cost per compactor total cost of a
stationary compactors stationary compactors
=
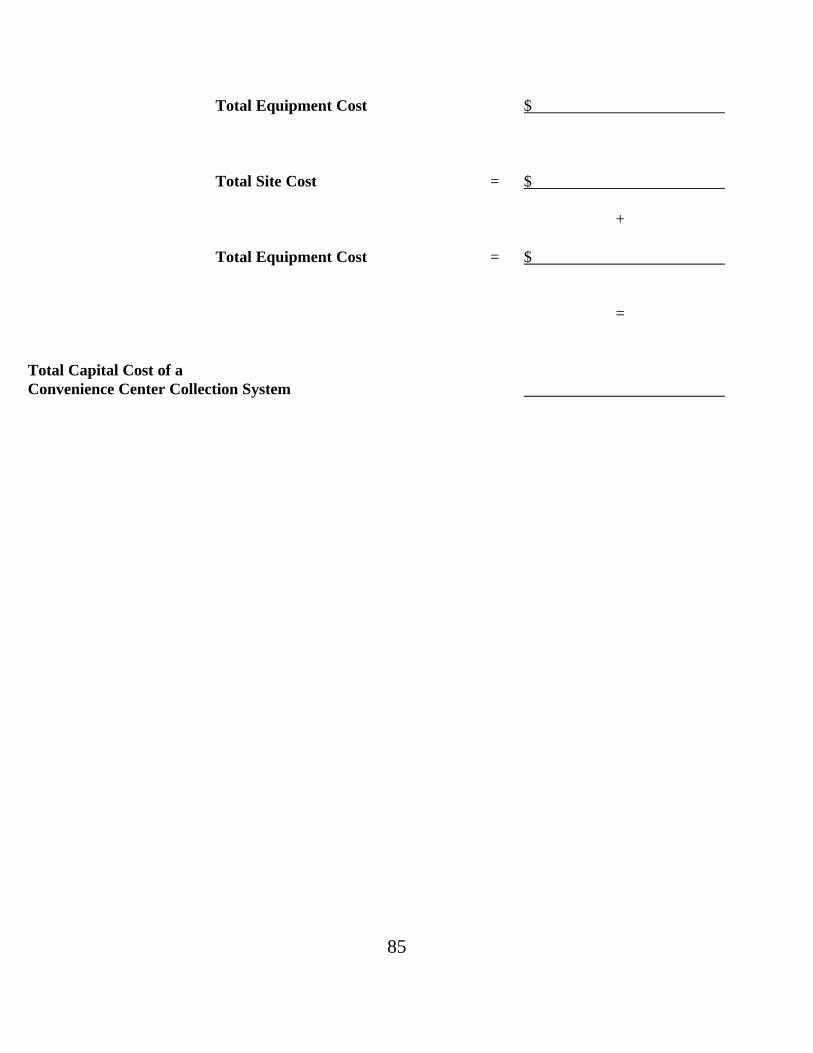
85
Total Equipment Cost $
Total Site Cost = $
+
Total Equipment Cost = $
=
Total Capital Cost of a Convenience Center Collection System
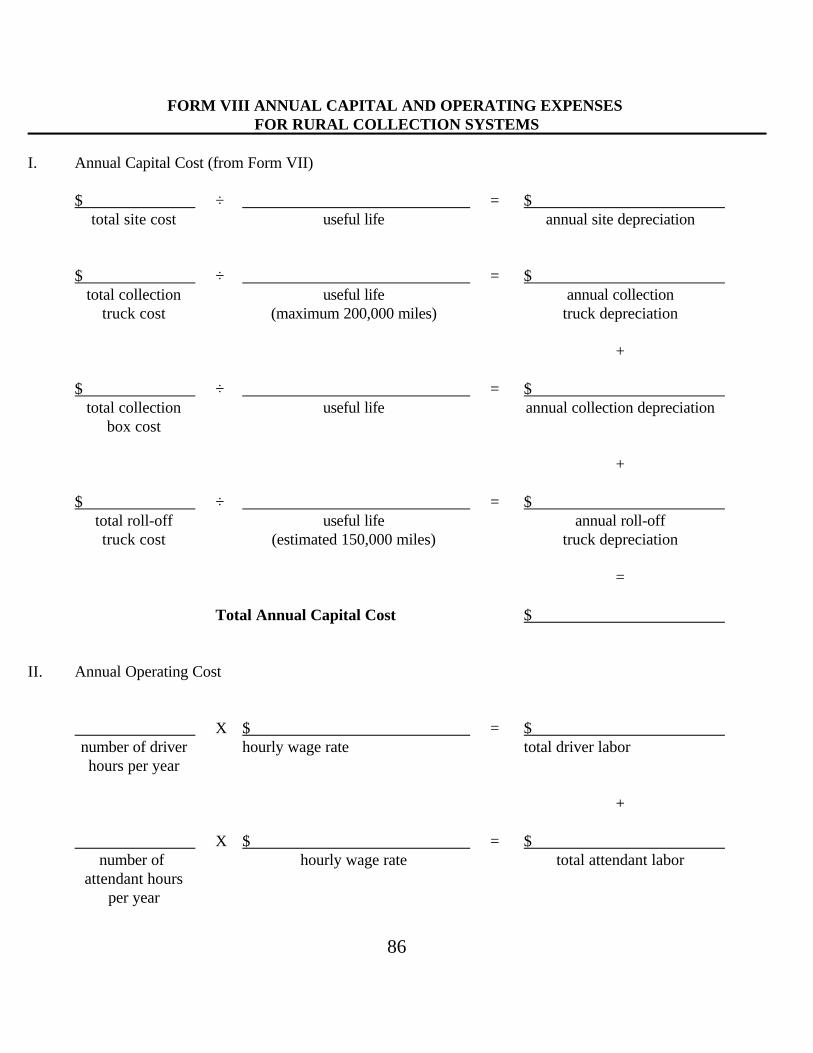
86
FORM VIII ANNUAL CAPITAL AND OPERATING EXPENSES FOR RURAL COLLECTION SYSTEMS
I. Annual Capital Cost (from Form VII)
$ ÷ = $total site cost useful life annual site depreciation
$ ÷ = $total collection useful life annual collection
truck cost (maximum 200,000 miles) truck depreciation
+
$ ÷ = $total collection useful life annual collection depreciation
box cost
+
$ ÷ = $total roll-off useful life annual roll-offtruck cost (estimated 150,000 miles) truck depreciation
=
Total Annual Capital Cost $
II. Annual Operating Cost
X $ = $number of driver hourly wage rate total driver laborhours per year
+
X $ = $number of hourly wage rate total attendant labor
attendant hoursper year
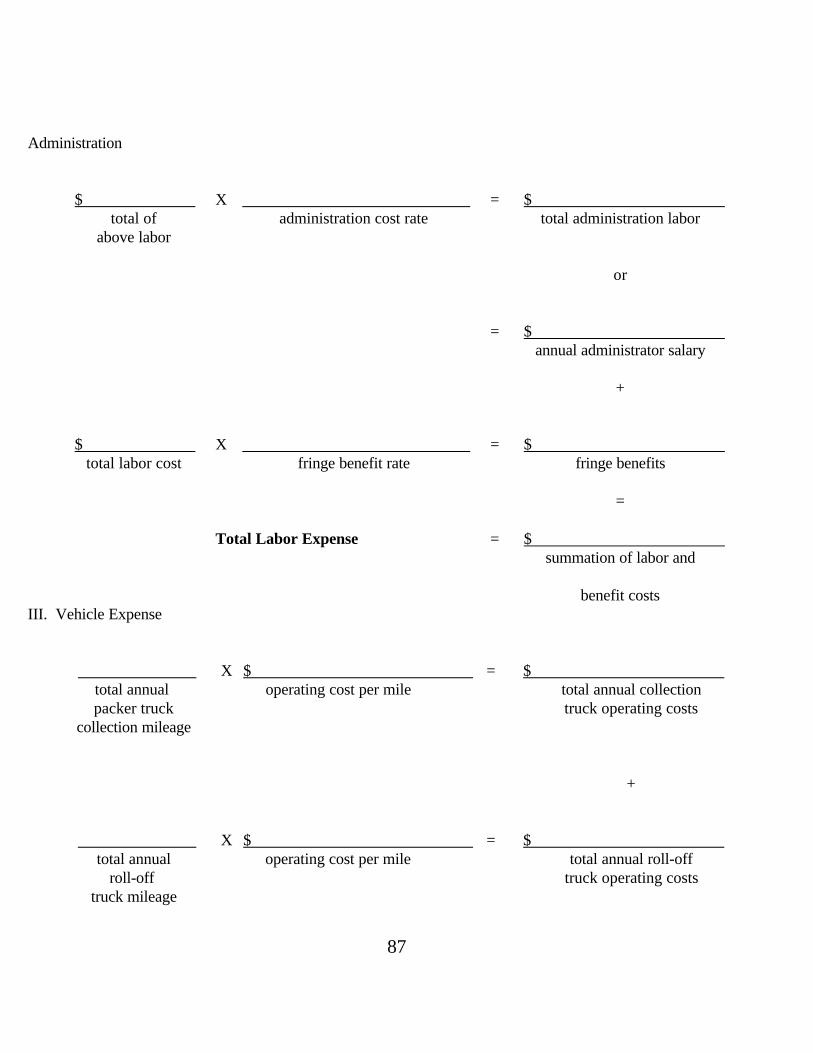
87
Administration
$ X = $total of administration cost rate total administration labor
above labor
or
= $annual administrator salary
+
$ X = $total labor cost fringe benefit rate fringe benefits
=
Total Labor Expense = $summation of labor and
benefit costsIII. Vehicle Expense
X $ = $total annual operating cost per mile total annual collectionpacker truck truck operating costs
collection mileage
+
X $ = $total annual operating cost per mile total annual roll-off
roll-off truck operating coststruck mileage
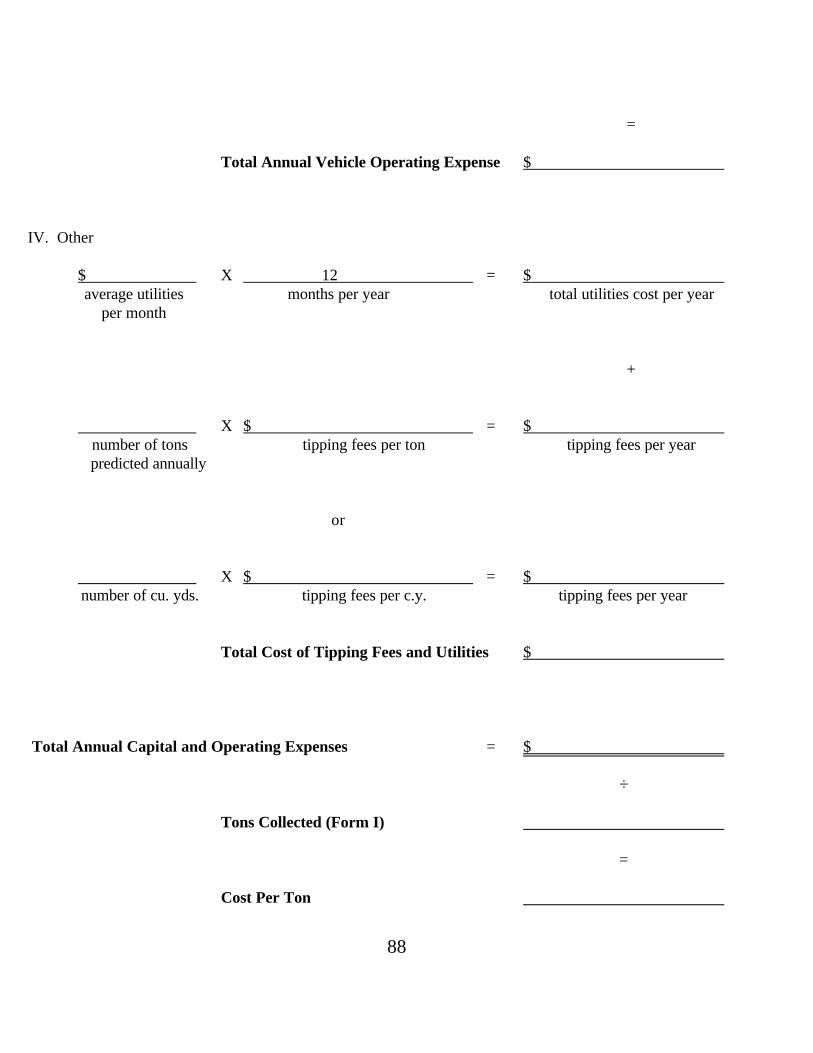
88
=
Total Annual Vehicle Operating Expense $
IV. Other
$ X 12 = $average utilities months per year total utilities cost per year
per month
+
X $ = $number of tons tipping fees per ton tipping fees per yearpredicted annually
or
X $ = $number of cu. yds. tipping fees per c.y. tipping fees per year
Total Cost of Tipping Fees and Utilities $
Total Annual Capital and Operating Expenses = $
÷
Tons Collected (Form I)
=
Cost Per Ton

89
90
WASTE STREAM REDUCTION
Community leaders wishing to reduce the cost of solid waste management may reduce the
amount of material handled by the system. Two options to reduce the amount of waste in their
collection systems are recycling centers and yard waste composting systems. Both options can save
collection and disposal cost as well as extend the life of current landfills.
SOLID WASTE RECYCLING
More stringent landfill regulations imposed by the EPA coupled with an increasing public
concern for the environmental policies have forced communities to re-evaluate the options available
for solid waste disposal. Recycling is an alternative waste management system being considered by
many local governments. Recycling decreases the volume of material deposited in landfills and
provides an additional benefit by lowering the depletion rate of certain natural resources. In addition,
in some areas disposal fees at landfills (tipping fees) have increased dramatically in a relatively short
time (Brown, 1989). Although recycling will not eliminate the need for landfills, a waste management
system that includes recycling will certainly extend the life of existing landfills and decrease the total
amount paid in tipping fees.
RECYCLABLE MATERIALS
Materials which are commonly recycled include steel, aluminum, glass, paper, plastic, and
various other metals. The average distribution of materials present in municipal solid waste is shown
in Figure 6. Only those recyclable materials that can be collected steadily and in a large enough
volume will be in demand by secondary markets. Planners should secure markets

91
figure 6
92
for recyclable materials before a recycling program is implemented to avoid storage and handling
problems.
Buyers will not be interested in an erratic supplier. The quality and quantity of recyclable
materials that can be supplied will be major determinants for finding and securing secondary markets.
Buyers of recyclable materials often ask for contracts specifying volume and quality requirements.
Aluminum is by far the most popular material to be recycled today because it is easy to collect,
sort, and prepare for secondary sale. The largest source of recyclable aluminum comes from beverage
cans. The recycled aluminum goes into making more beverage containers at a much lower cost than
cans produced from virgin metal. Many markets exist for consumers to sell aluminum for recycling.
Even with stiff competition from private collectors, aluminum remains the most profitable material
for a community recycling operation. In some cases, aluminum sales offset losses incurred in the
collection of other materials.
The amount of plastic in everyday waste has increased over the last few years as its popularity
as container material has increased. The most commonly collected types of plastics are large, clear
soft drink containers that are made of polyethylene terephthalate (PET), and gallon and half-gallon
milk and juice containers made from high density polyethylene (HDPE). Most plastic containers may
be separated using the symbol printed on the bottom of the container. Plastics must be carefully
separated and cleaned of contaminants before resale. The market for plastics is small but expanding.
Plastics are recycled for use in insulation, floor tiles and automobile bumpers etc. (Brown, 1989).
Elimination of these plastics from the waste stream is especially important because of the large landfill
volume they require relative to their weight.
Crushed glass is called cullet in the glass industry. Cullet must be separated by color into: 1)
93
clear; 2) brown (amber); and 3) green. Clear cullet is the material most frequently used in the
container industry. The secondary markets for glass fluctuate greatly, and the ability to sell cullet
depends on the location of a community relative to a glass factory due to high transportation costs.
Collection of glass must be closely monitored to completely remove contaminants (bottle caps,
stones, metal) before resale, because secondary purchasers are strict about the amount of
contaminants present in the cullet. A major attribute of cullet is that there is no noticeable difference
between the quality of glass made with or without recycled glass.
Paper comprises the largest single volume of waste sent to landfills. Various types of waste
paper include computer paper, old newspaper (ONP), and corrugated cardboard. Newspapers and
magazines comprise over 27% of the total supply of waste paper and corrugated papers make up 30%
(Franklin, 1986). The paper recycling market is the largest and most price volatile secondary market.
As with glass, the collection of waste paper must also be monitored closely to reduce the amount of
contaminants found in the paper. Recycled paper has many uses including paper towels, tissue,
newsprint and packaging.
Approximately two-thirds of the steel manufactured in the United States is made from scrap
metal. Common sources of scrap metal include; washers, dryers, refrigerators, steel cans, and
automobiles. Other materials such as used oil, car tires, and batteries may also be recycled. The
availability of markets for these goods depends on the location of the community relative to
manufacturers which can utilize them.
COLLECTION SYSTEM ALTERNATIVES
After it is determined which materials will be recycled, a collection system must be chosen.
94
The method by which recyclables are collected may be the most important decision to make to insure
a successful operation. A collection system must be chosen to fit the community's desired level of
investment to make the program work most efficiently. Obtaining the maximum quantity of
recyclable materials should be a goal regardless of which collection system is chosen. Ideally, the
collection system will be tailored to utilize existing collection routes and equipment. The three
methods of collection outlined in this paper are:
1. drop-off centers;
2. buy-back systems
3. curbside collection.
Drop-Off Systems
Drop-off systems offer the most cost-effective recycling option for a community. The system
consists of a number of containers placed around the community where residents can "drop-off" their
recyclable materials. Drop-off systems are often implemented by a community as a stepping stone
towards a more comprehensive recycling system.
The key for a successful drop-off system is accessibility for the community residents. Drop-off
sites that are inconvenient or confusing will have a low participation rate. The sites should be located
where residents frequently visit, such as a shopping mall, city parks, or schools. Reducing the
distance people must travel to utilize the facilities will also have a positive effect on the success of
the system. The drop-off location should be clean and well-lit with clear instructions that are easily
followed.
Although drop-off centers are inexpensive and convenient they are not without disadvantages.
One major drawback to this system is that non-recyclables are often mixed with the recyclable
95
material. Sorting the materials may be necessary by either collection workers or at a Materials
Recovery Facility (MRF) to up-grade the quality of the final products. Another major disadvantage
of the drop-off system is the low participation rate. Making the collection sites convenient and
educating the community may increase usage, but the drop-off system has the lowest participation
rate among the three collection alternatives.
Buy-Back System
A buy-back system also requires that residents deliver their recyclables. The difference is that
buy back locations have an attendant, and residents are paid by weight the current market price for
their recyclables. Being compensated for recycling creates an excellent incentive for residents to
utilize the center. The participation rates for buy-back systems are higher than for drop-off systems
and are comparable to curbside recycling rates. However, the investment required to implement a
buy-back system is significantly greater than for a drop-off system.
Convenience is again important in the selection of a site for the recycling center. The location
should be easily accessible, and contain a large enough area to hold several types of collection
containers, including large roll-off type containers. A separate container is needed for each material
being purchased. After weighing and checking for contaminants, each material is placed in its
respective container.
There are many advantages to a buy-back system. Since the materials are separated and
inspected before being purchased, the quality of the recyclables is generally very good. The
participation rates are high, and the center provides the community an excellent alternative for various
fund-raising events.
The availability and distance to secondary markets will determine which materials can be
96
purchased by the center for resale, and sometimes, in larger cities, there is competition from private
industry for the purchase of recyclables such as aluminum. Community leaders must take these
variables into account before choosing a buy-back system.
Curbside Collection Systems
In this collection system, citizens place their recyclable materials at the curb. Curbside
collection requires a large investment of capital and labor. A pilot program that includes only a small
portion of the community is often a good way to begin a curbside recycling program. Once the
program begins operating efficiently, it can be expanded to include the entire community. There are
many different variations of the system, but residential point collection is utilized in all varieties.
Alternative curbside system include:
1. Residents separating recyclable materials into two or more categories before placing
the recyclables at the curb.
2. Assorted materials are separated by the collection crew at the curb and placed into
different compartments for each material.
3. Co-mingled materials are collected and sent to a Materials Recovery Facility (MRF)
for separation.
Once a system has been chosen, a community must choose how often the recyclables will be
collected. A special day may be set aside weekly or bi-weekly of recyclable collection, or recyclable
collection may replace one day normally reserved for garbage collection. How often to collect is also
debated, but storage time for residents should be kept to a minimum. Whatever system is chosen,
education and convenience should be stressed to insure that residents utilize the service. Participation
rates will be directly related to the simplicity of the program.
97
A curbside recycling system is an option for only those communities willing to make a large
investment. Although it is the most expensive collection system, it generates high participation rates
and is the most convenient for residents.
Plan of Action. The implementation of a community recycling program must be done
effectively to guarantee the success of the program. The keys to success include planning, educating
the public, dedication, and marketing.
A successful recycling program requires that a community have concrete objectives to
overcome any obstacles that may arise. Although the program should be run like a business, it will
not likely return profits like a business. The three systems outlined in this paper will not generate
revenues, but could provide savings through reduced tipping fees at the landfill. A well planned and
efficiently operated recycling program will minimize costs and play a part in conserving scarce
natural resources.
YARD WASTE COMPOSTING
Municipal composting of yard wastes is receiving attention nation-wide as an alternative solid
waste disposal technique. Composting provides a method to decrease the total amount of waste that
is currently being placed in landfills and in some cases, produces a product that can be marketed.
Municipal composting probably will not be profitable based on the market value of the end
product, but it may be feasible based on the reduction of material going to the landfill. Over 24
million tons of yard waste are discarded annually in the municipal waste stream in the United States,
and the vast majority of this total is sent to landfills (Franklin Associates, 1986). This represents
nearly eighteen percent of solid waste deposited in landfills.
98
Composting is a natural form of recycling where organic materials are broken down by micro-
organisms. Oxygen reacts with the micro-organisms to decay the material until it produces humus,
a soil-like substance. The process can take from three months to three years, depending on the type
of material, and the composting technique used. Although nearly any organic material may be
composted, leaves, grass clippings, and small brush are excellent composting materials because of
their ease of collection and handling. Brush and small branches should be shredded to speed the
process.
Although composting yard waste appears to be relatively simple, a successful program requires
intensive management, significant capital investment, a solid plan of action, and community
dedication. A community may choose from a number of different composting alternatives.
COMPOSTING ALTERNATIVES
The different methods of composting available to community planners should meet the needs
of nearly any community. The various composting options rely on different levels of capital and labor
and are referred to as: minimum technology; low technology; intermediate level technology; and high
level technology.
Minimum Level Technology
Minimum level technology uses leaves as its only composting material. The leaves are
collected and piled into large windrows, 12 feet high and 24 feet wide (Strom and Finstein, 1986).
The windrows are turned only once per year, and it takes approximately three years to complete the
process. This operation typically uses only a front loader to make and turn the windrows. A new
front loader of 140 horsepower can be purchased for approximately $70,000. Rent for the
99
composting site and vehicles for employees will vary, and they are properly included in the cost of
the operation.
Because of minimal equipment and labor needs, this process is the lowest cost alternative for
any community. However, the three year time requirement makes this option unattractive for most
cities.
Low Level Technology
Low level technology includes leaves, grass clippings, and brush to make compost. The
material is shredded, wetted, and piled into windrows approximately 6 feet high and 12 to 14 feet
wide (Strom and Finstein, 1986). Enough water is added to maintain a moisture content near 50
percent. After the pile has stood for a week, temperatures within the windrow should reach 140 to
160 degrees F (Frigden and Rahman, 1990). The windrow is then turned once every three to four
months, with a completion time of nine to twelve months, depending on the number of times it is
turned.
Equipment needs for this process include a front loader to make and turn windrows, and a
grinder, which is used to grind brush and limbs into a uniform size and consistency, and a
thermometer with a long probe. The cost of a new grinder ranges from $20,000 to $100,000,
depending on the size and features of the grinder. Planners should be sure to purchase a commercial
quality grinder with enough capacity to handle future volume increases.
This level of composting technology is the most common in the U.S. today, and produces a
quality compost, while maintaining a relatively low cost. Its only major disadvantage is the length
of time it takes to complete the compost.
Intermediate Level Technology
100
The same composting materials and processes are used in this intermediate level technology
as are used in low level composting. The basic difference between intermediate and low level
technology is the introduction of a machine that turns the windrows weekly. The machine straddles
the windrow while turning and mixing the material. This allows more oxygen to infiltrate the
windrow which speeds the composting process.
The completion time with this process is between four to six months and could be a good
alternative for communities with a high volume of yard waste. The disadvantage is the cost of the
turning machine which can cost up to $300,000 depending on the size of the machine (Simpson,
1989).
High Level Technology
The high level process uses leaves, grass clippings, brush and sewage sludge to produce a high
quality compost. The material is put into containers with an in-vessel system, or it is piled inside a
building with air and water continually forced through the mixture with a static pile system to produce
a compost very quickly. The completion time for this process is normally under four months. The
equipment needed for a static pile includes a building, air pipe grid, and a fan. The equipment needed
for an in-vessel system includes a rotating drum or a tank with a mixing system included.
This type of technology is suitable only for those communities that wish to mix sewage sludge
with their compost. The cost of this type of operation is beyond the scope of most rural communities.
COMPOSTING SITE
The space needed for composting depends on the amount and type of material to be
composted, and the type of composting operation chosen. From two to ten acres should be sufficient.
101
In general, the space should be relatively flat with a slope of 2-4%, and have a hard surface with
structures to control run-off. Monitor wells may be required to check for ground contamination. The
site should be placed near the source of the materials to reduce transportation costs. It should be
carefully placed so that potential odor and day-to-day operations do not interfere with residents of
the community. Finally, community leaders should check with the appropriate agency to determine
whether their state requires a license/permit.
102
REFERENCES
[1] Franklin Associates. Characterization of Municipal Solid Waste in the United States 1960to 2000. July 1986.
[2] Benham Group. The Metro Cities Solid Waste Management Plan. Phase I Study Report.December 1991.
[3] Oklahoma State Cooperative Extension. "Records from Existing Rural Oklahoma SolidWaste Disposal Systems". 1986-1992.
[4] Schmidt, Joseph F, Doeksen, Gerald A., Sloggett, Gordon. "Evaluation of Solid WasteCollection Systems for Southern States: Guidelines for Decision Makers". May 1992.
[5] Myles, Albert E, Schmidt, Joseph E., Murray, Steve W. "Establishing Rural Solid WasteCollection: The Container System". Mississippi Cooperative Extension Service. December1991.
[6] O'Connor, Patrick B. Convenience Centers. "Waste Management Program". TennesseeValley Association. 1987.
[7] Goodwin, Kyle, Sloggett, Gordon, Doeksen, Gerald. "Rural Community Solid WasteRecycling Systems". Oklahoma Cooperative Extension Fact Sheet. November 1992.
[8] Goodwin, Kyle, Sloggett, Gordon, Doeksen, Gerald. "Rural Community Solid WasteComposting Systems". Oklahoma Cooperative Extension Fact Sheet. November 1992.
[9] Personal communication with Solid Waste Management Services personnel in the OklahomaState Department of Health. 1992.
[10] Dunsmore, Mary, "Solid Waste Landfills in Tennessee Municipal Solid Waste DisposalSystem", Waste Management Research and Education Institute, University of Tennessee,Knoxville, TN, SW-10-91. September 1991.
[11] "Manager of Landfill Operations, Training and Certification Program", a training handbook,Solid Waste Association of North America (SWANA), Silver Springs, Maryland.
[12] Sloggett, Gordon, et. al., "Solid Waste Transfer Stations for Rural Oklahoma." OSUCooperative Extension Fact Sheet No. 881.
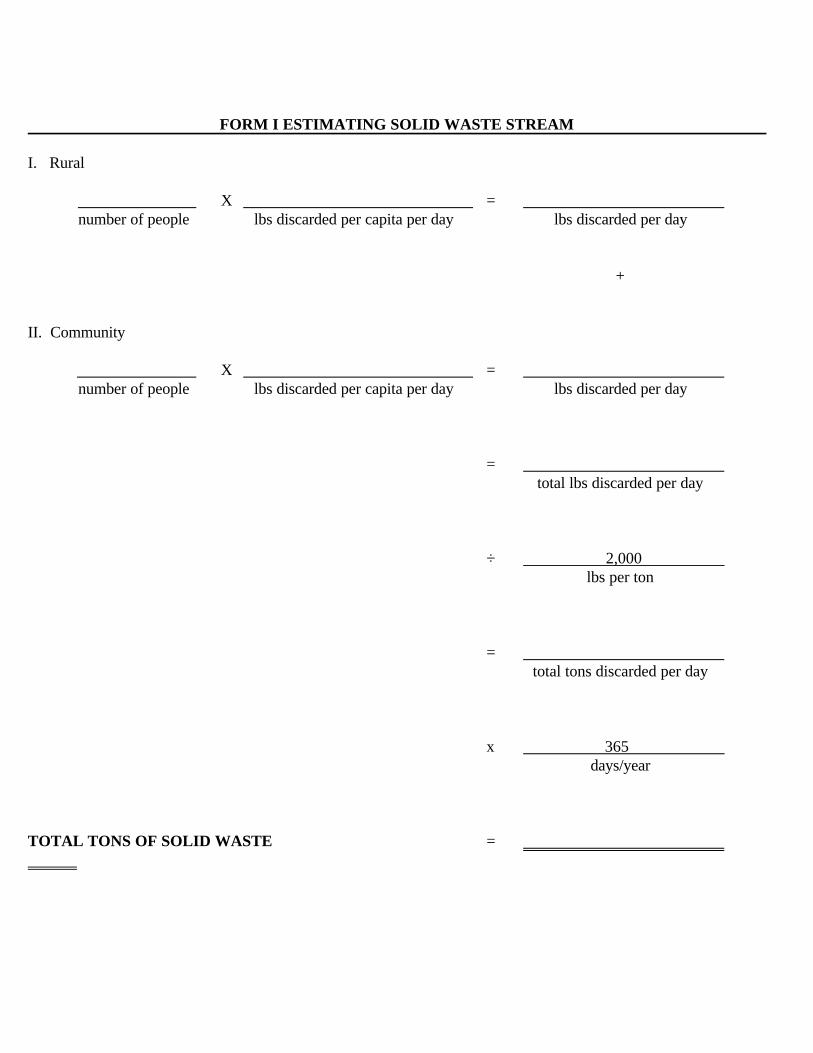
FORM I ESTIMATING SOLID WASTE STREAM
I. Rural
X =number of people lbs discarded per capita per day lbs discarded per day
+
II. Community
X =number of people lbs discarded per capita per day lbs discarded per day
=total lbs discarded per day
÷ 2,000lbs per ton
=total tons discarded per day
x 365days/year
TOTAL TONS OF SOLID WASTE =

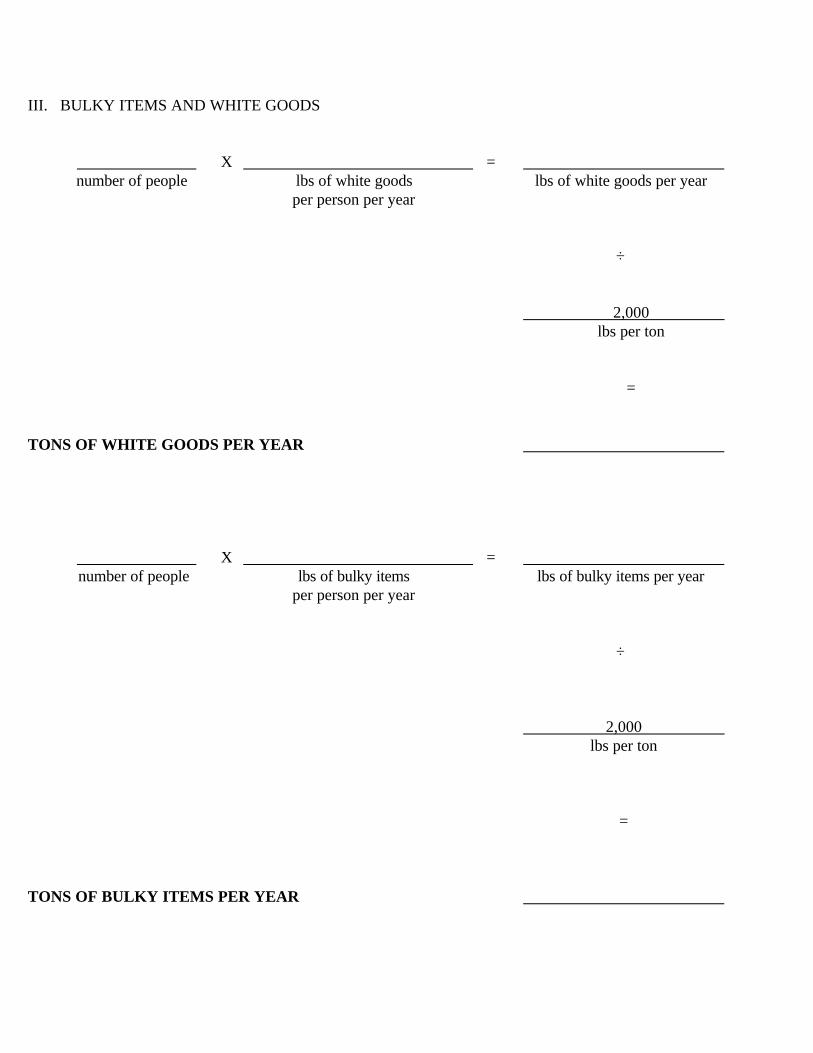
III. BULKY ITEMS AND WHITE GOODS
X =number of people lbs of white goods lbs of white goods per year
per person per year
÷
2,000lbs per ton
=
TONS OF WHITE GOODS PER YEAR
X =number of people lbs of bulky items lbs of bulky items per year
per person per year
÷
2,000lbs per ton
=
TONS OF BULKY ITEMS PER YEAR
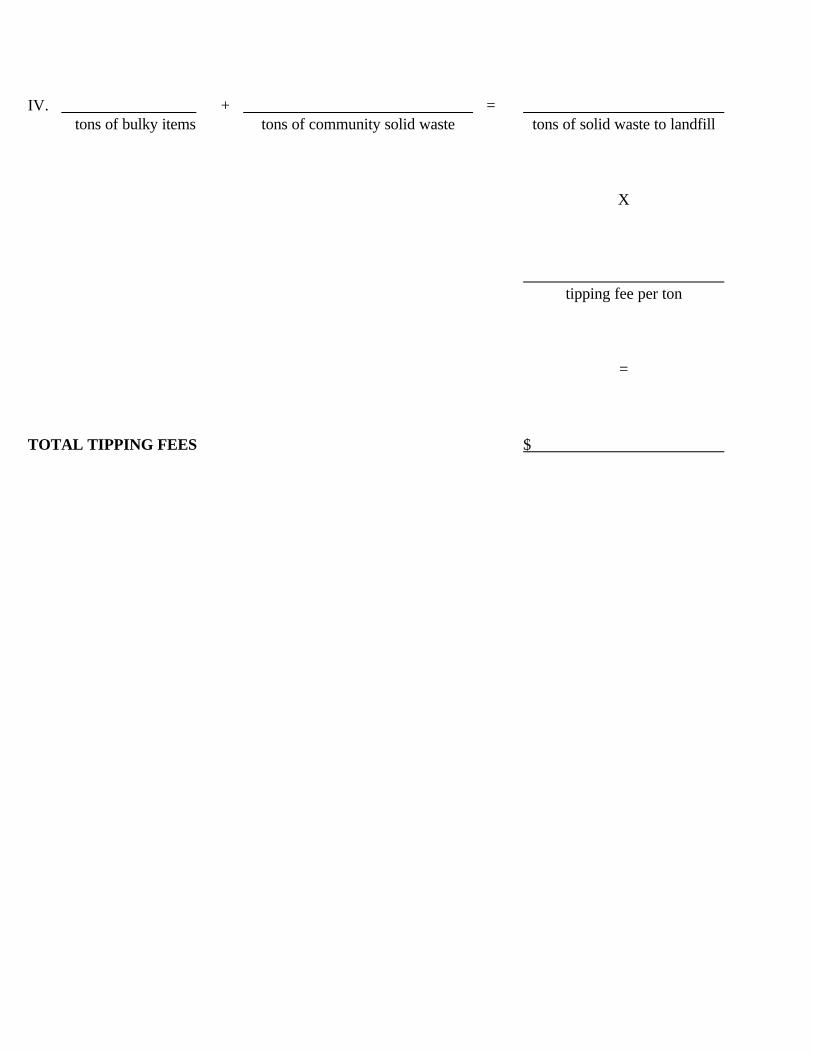
IV. + =tons of bulky items tons of community solid waste tons of solid waste to landfill
X
tipping fee per ton
=
TOTAL TIPPING FEES $
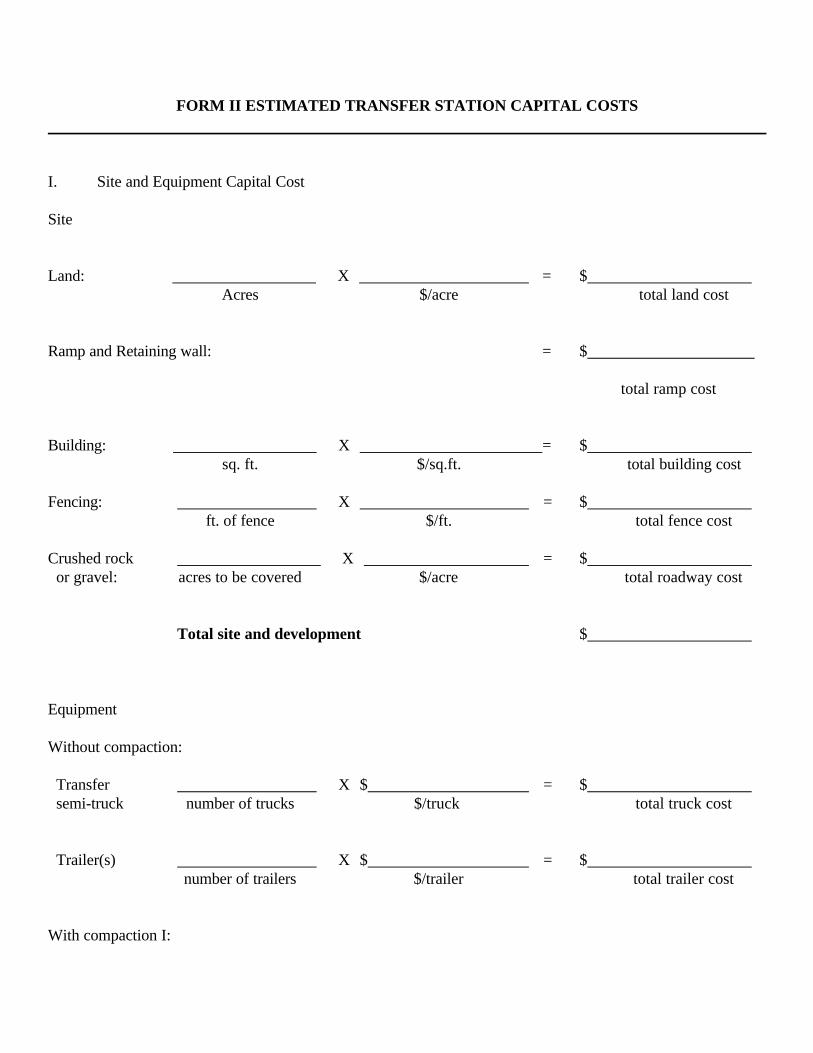
FORM II ESTIMATED TRANSFER STATION CAPITAL COSTS
I. Site and Equipment Capital Cost
Site
Land: X = $Acres $/acre total land cost
Ramp and Retaining wall: = $
total ramp cost
Building: X = $sq. ft. $/sq.ft. total building cost
Fencing: X = $ft. of fence $/ft. total fence cost
Crushed rock X = $ or gravel: acres to be covered $/acre total roadway cost
Total site and development $
Equipment
Without compaction:
Transfer X $ = $ semi-truck number of trucks $/truck total truck cost
Trailer(s) X $ = $number of trailers $/trailer total trailer cost
With compaction I:
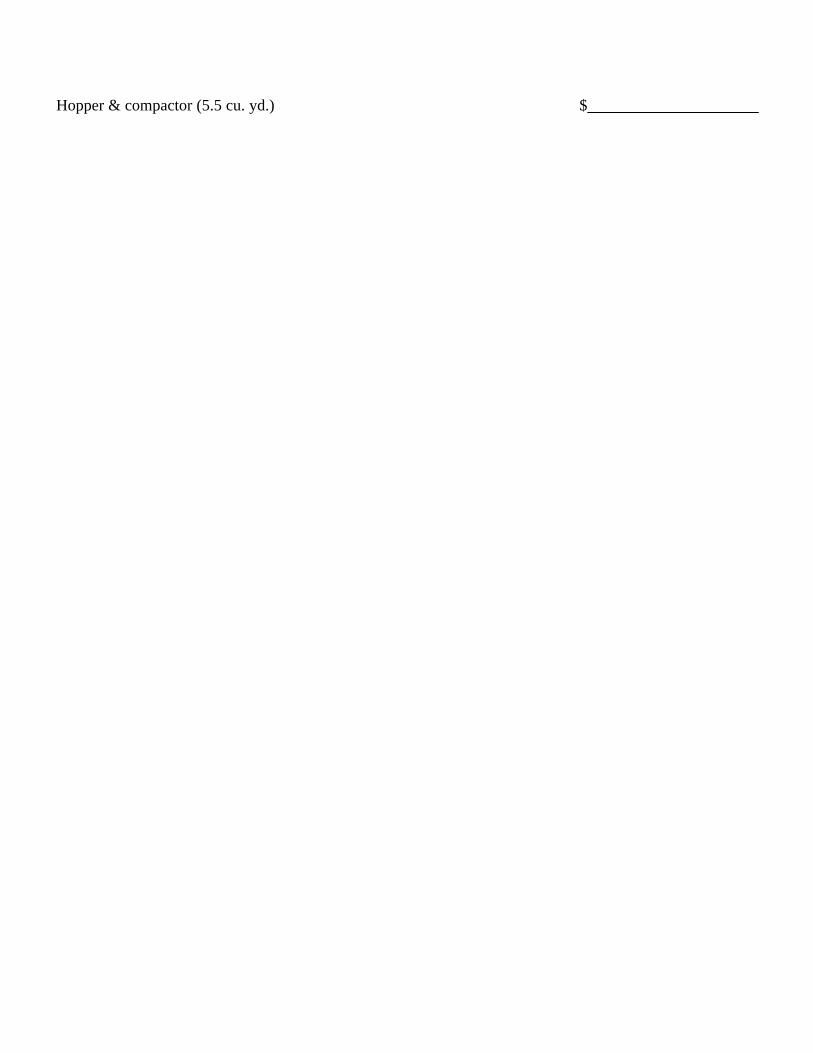
Hopper & compactor (5.5 cu. yd.) $
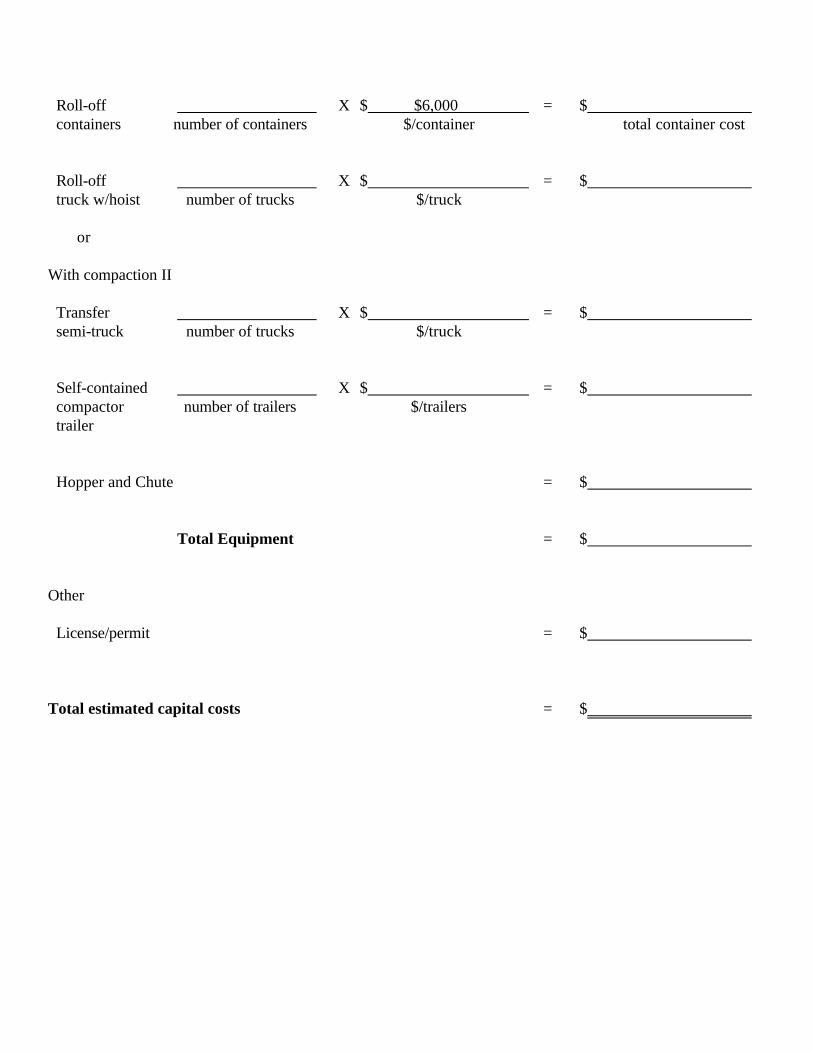
Roll-off X $ $6,000 = $ containers number of containers $/container total container cost
Roll-off X $ = $ truck w/hoist number of trucks $/truck
or
With compaction II
Transfer X $ = $ semi-truck number of trucks $/truck
Self-contained X $ = $ compactor number of trailers $/trailers trailer
Hopper and Chute = $
Total Equipment = $
Other
License/permit = $
Total estimated capital costs = $
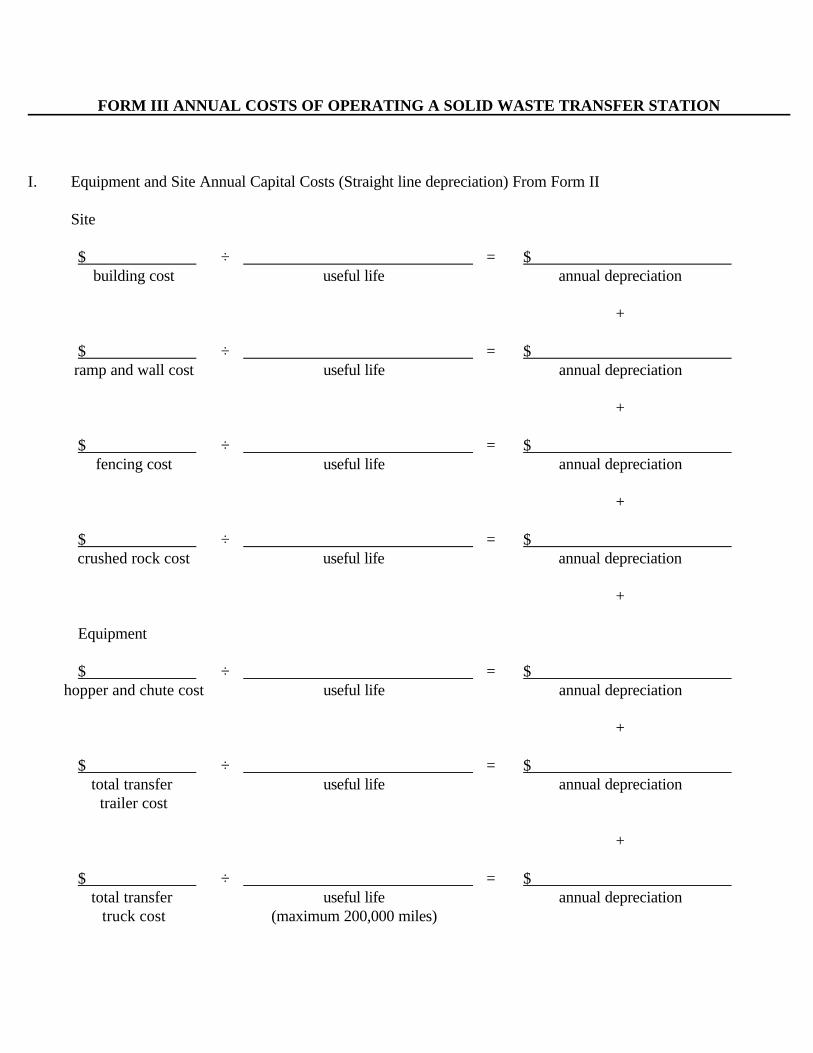
FORM III ANNUAL COSTS OF OPERATING A SOLID WASTE TRANSFER STATION
I. Equipment and Site Annual Capital Costs (Straight line depreciation) From Form II
Site
$ ÷ = $building cost useful life annual depreciation
+
$ ÷ = $ramp and wall cost useful life annual depreciation
+
$ ÷ = $fencing cost useful life annual depreciation
+
$ ÷ = $crushed rock cost useful life annual depreciation
+
Equipment
$ ÷ = $hopper and chute cost useful life annual depreciation
+
$ ÷ = $total transfer useful life annual depreciation
trailer cost
+
$ ÷ = $total transfer useful life annual depreciation
truck cost (maximum 200,000 miles)
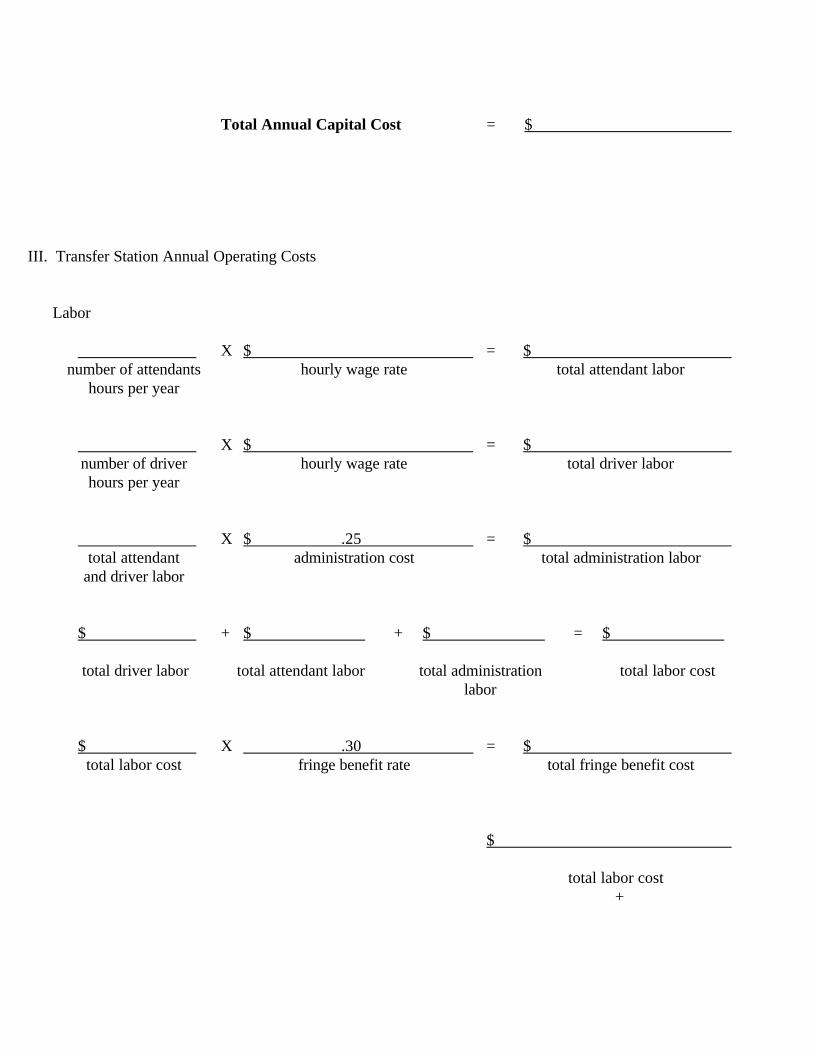
Total Annual Capital Cost = $
III. Transfer Station Annual Operating Costs
Labor
X $ = $number of attendants hourly wage rate total attendant labor
hours per year
X $ = $number of driver hourly wage rate total driver laborhours per year
X $ .25 = $total attendant administration cost total administration labor
and driver labor
$ + $ + $ = $
total driver labor total attendant labor total administration total labor costlabor
$ X .30 = $total labor cost fringe benefit rate total fringe benefit cost
$
total labor cost+
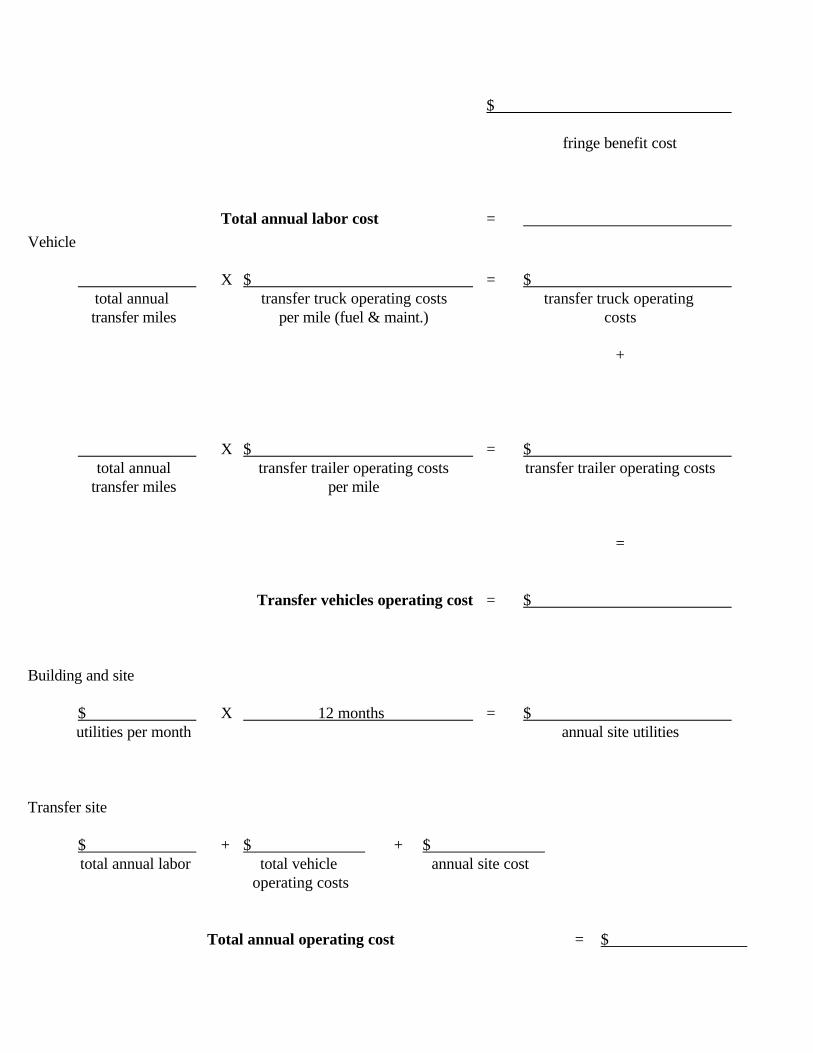
$
fringe benefit cost
Total annual labor cost =
Vehicle
X $ = $total annual transfer truck operating costs transfer truck operating transfer miles per mile (fuel & maint.) costs
+
X $ = $total annual transfer trailer operating costs transfer trailer operating costs
transfer miles per mile
=
Transfer vehicles operating cost = $
Building and site
$ X 12 months = $utilities per month annual site utilities
Transfer site
$ + $ + $total annual labor total vehicle annual site cost
operating costs
Total annual operating cost = $
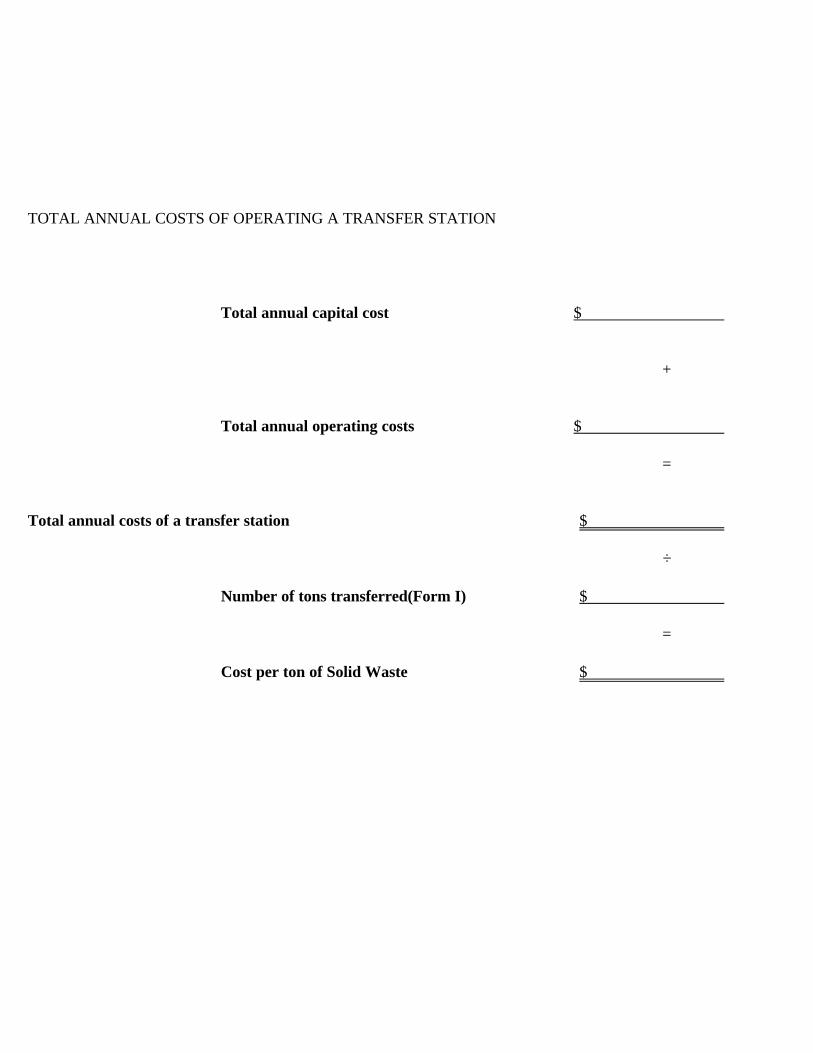
TOTAL ANNUAL COSTS OF OPERATING A TRANSFER STATION
Total annual capital cost $
+
Total annual operating costs $
=
Total annual costs of a transfer station $
÷
Number of tons transferred(Form I) $
=
Cost per ton of Solid Waste $
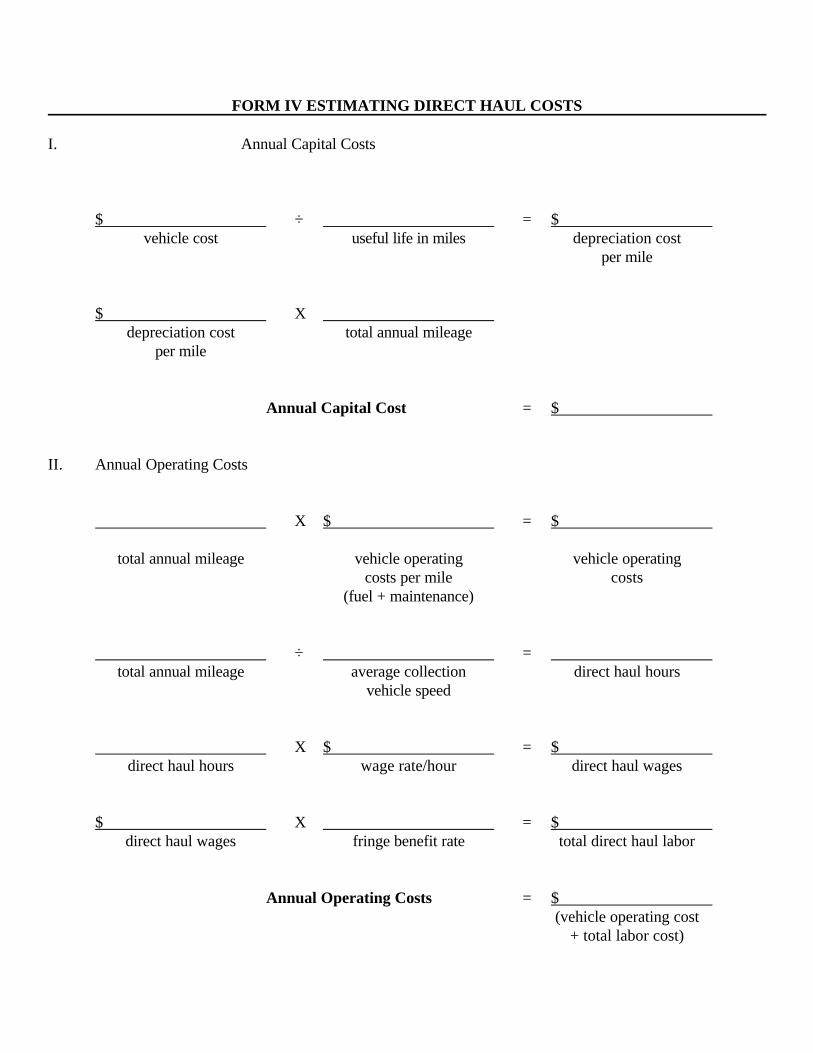
FORM IV ESTIMATING DIRECT HAUL COSTS
I. Annual Capital Costs
$ ÷ = $vehicle cost useful life in miles depreciation cost
per mile
$ Xdepreciation cost total annual mileage
per mile
Annual Capital Cost = $
II. Annual Operating Costs
X $ = $
total annual mileage vehicle operating vehicle operatingcosts per mile costs
(fuel + maintenance)
÷ =total annual mileage average collection direct haul hours
vehicle speed
X $ = $direct haul hours wage rate/hour direct haul wages
$ X = $direct haul wages fringe benefit rate total direct haul labor
Annual Operating Costs = $(vehicle operating cost
+ total labor cost)
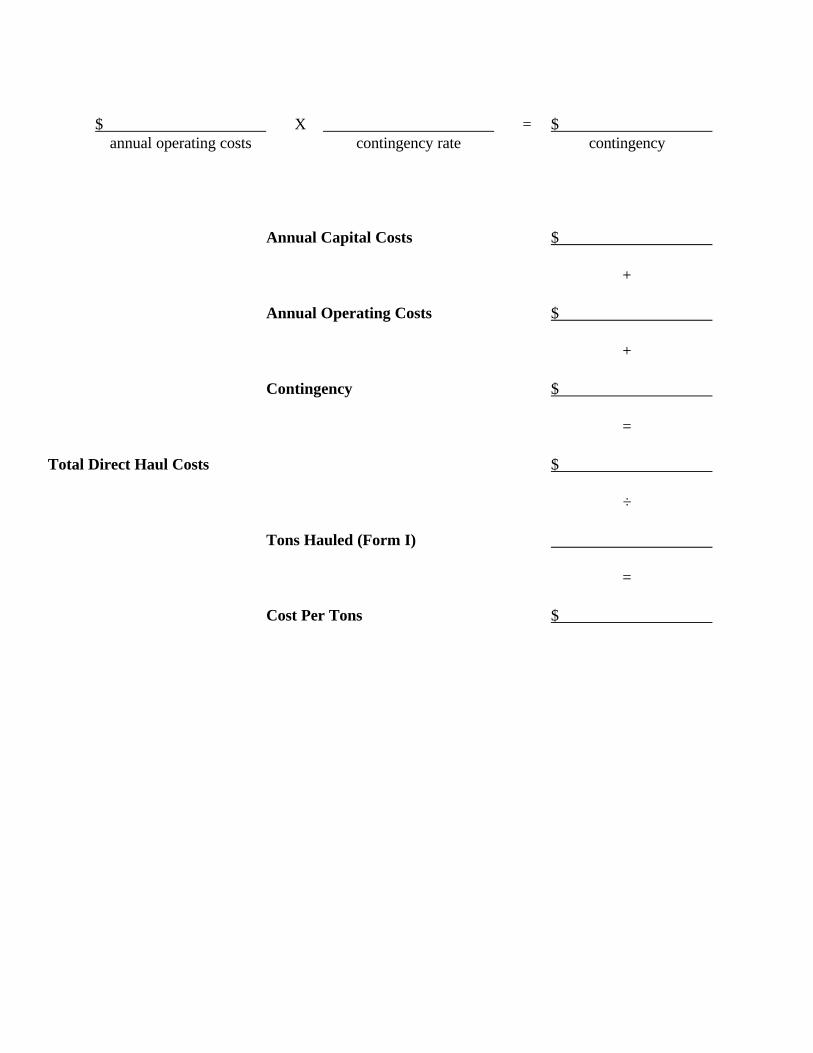
$ X = $annual operating costs contingency rate contingency
Annual Capital Costs $
+
Annual Operating Costs $
+
Contingency $
=
Total Direct Haul Costs $
÷
Tons Hauled (Form I)
=
Cost Per Tons $
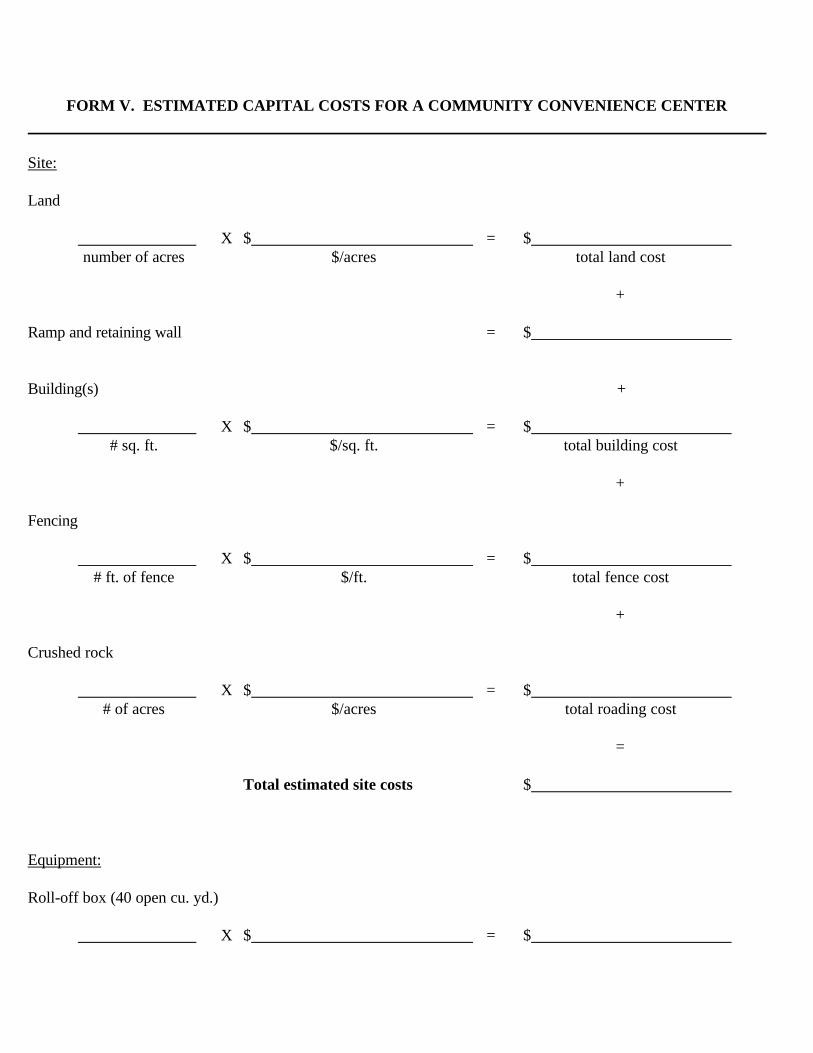
FORM V. ESTIMATED CAPITAL COSTS FOR A COMMUNITY CONVENIENCE CENTER
Site:
Land
X $ = $number of acres $/acres total land cost
+
Ramp and retaining wall = $
Building(s) +
X $ = $# sq. ft. $/sq. ft. total building cost
+
Fencing
X $ = $# ft. of fence $/ft. total fence cost
+
Crushed rock
X $ = $# of acres $/acres total roading cost
=
Total estimated site costs $
Equipment:
Roll-off box (40 open cu. yd.)
X $ = $
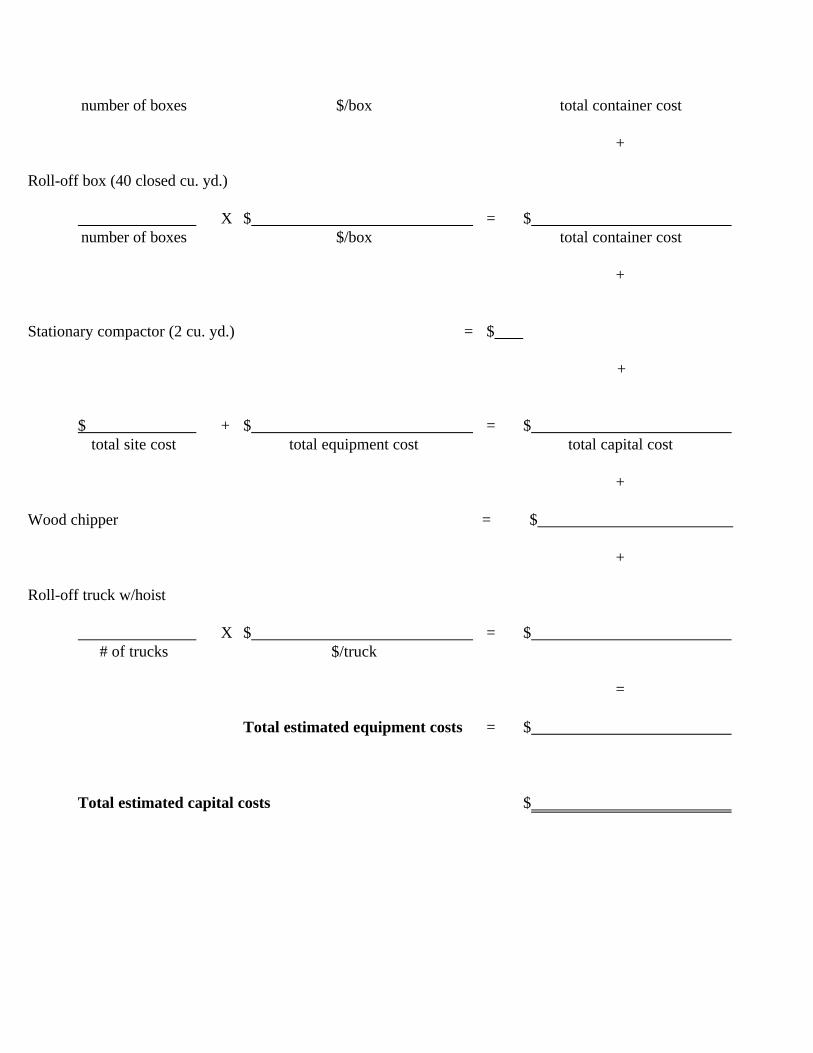
number of boxes $/box total container cost
+
Roll-off box (40 closed cu. yd.)
X $ = $number of boxes $/box total container cost
+
Stationary compactor (2 cu. yd.) = $
+
$ + $ = $total site cost total equipment cost total capital cost
+
Wood chipper = $
+
Roll-off truck w/hoist
X $ = $# of trucks $/truck
=
Total estimated equipment costs = $
Total estimated capital costs $
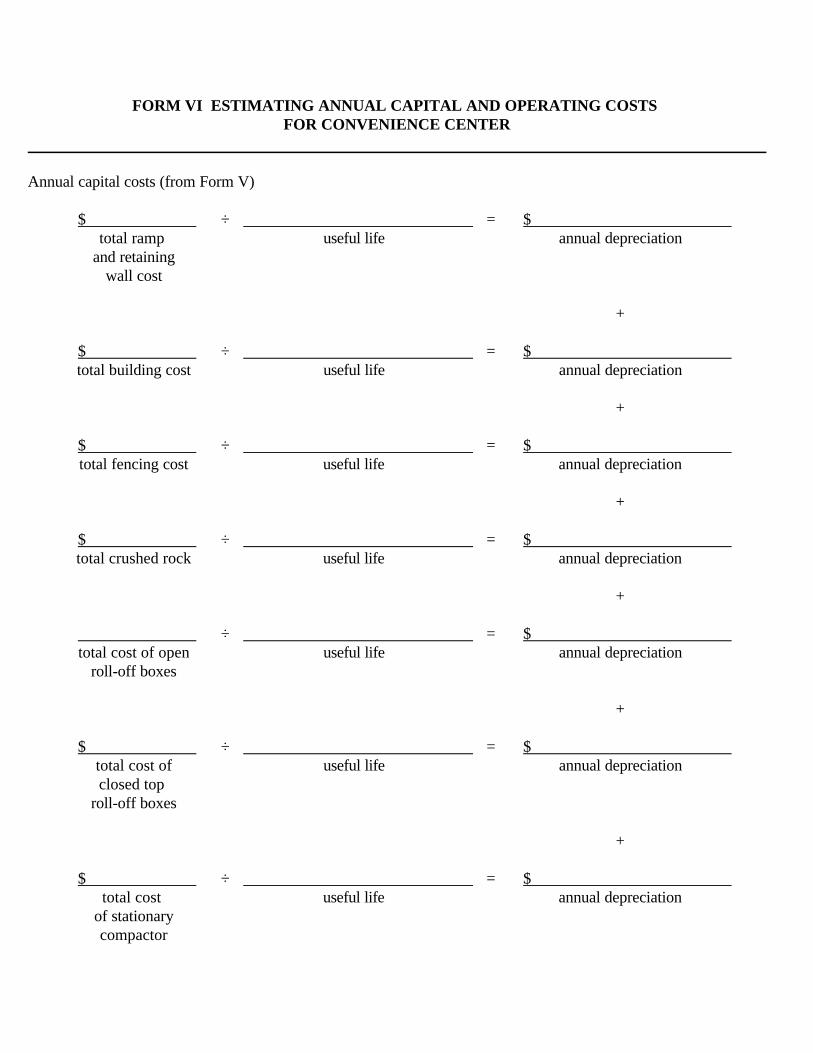
FORM VI ESTIMATING ANNUAL CAPITAL AND OPERATING COSTS FOR CONVENIENCE CENTER
Annual capital costs (from Form V)
$ ÷ = $total ramp useful life annual depreciation
and retainingwall cost
+
$ ÷ = $total building cost useful life annual depreciation
+
$ ÷ = $total fencing cost useful life annual depreciation
+
$ ÷ = $total crushed rock useful life annual depreciation
+
÷ = $total cost of open useful life annual depreciation
roll-off boxes
+
$ ÷ = $total cost of useful life annual depreciationclosed top
roll-off boxes
+
$ ÷ = $total cost useful life annual depreciation
of stationarycompactor
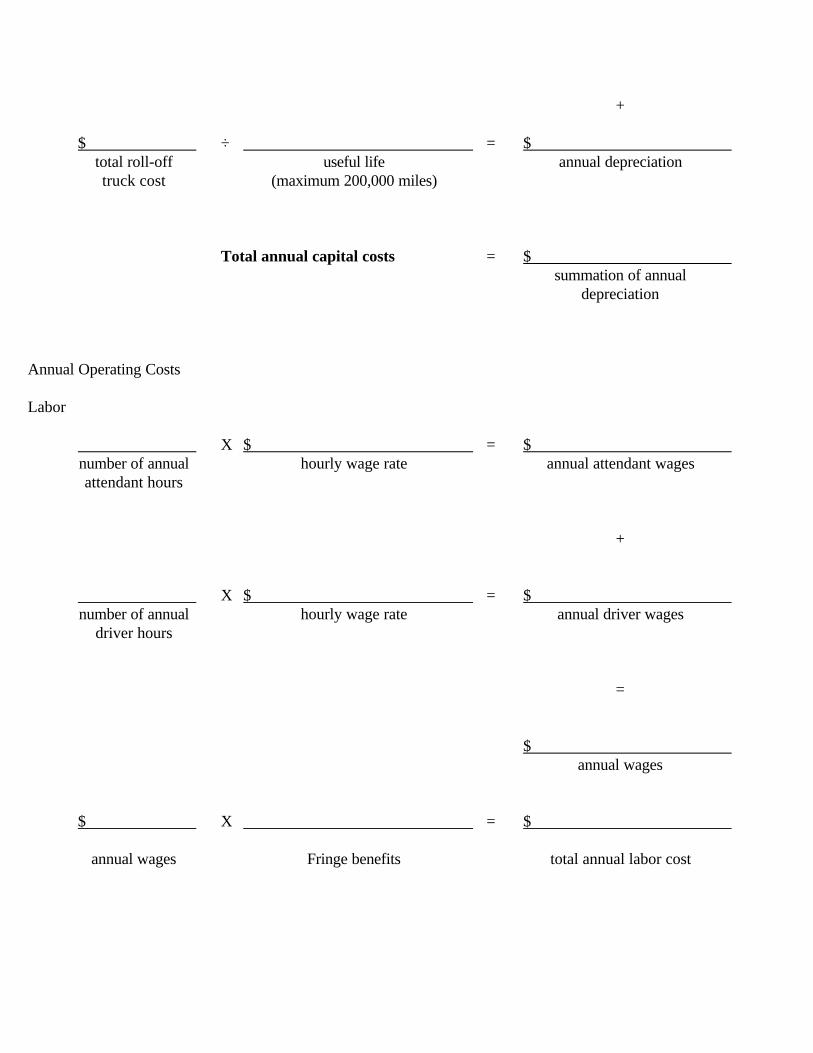
+
$ ÷ = $total roll-off useful life annual depreciationtruck cost (maximum 200,000 miles)
Total annual capital costs = $summation of annual
depreciation
Annual Operating Costs
Labor
X $ = $number of annual hourly wage rate annual attendant wagesattendant hours
+
X $ = $number of annual hourly wage rate annual driver wages
driver hours
=
$annual wages
$ X = $
annual wages Fringe benefits total annual labor cost
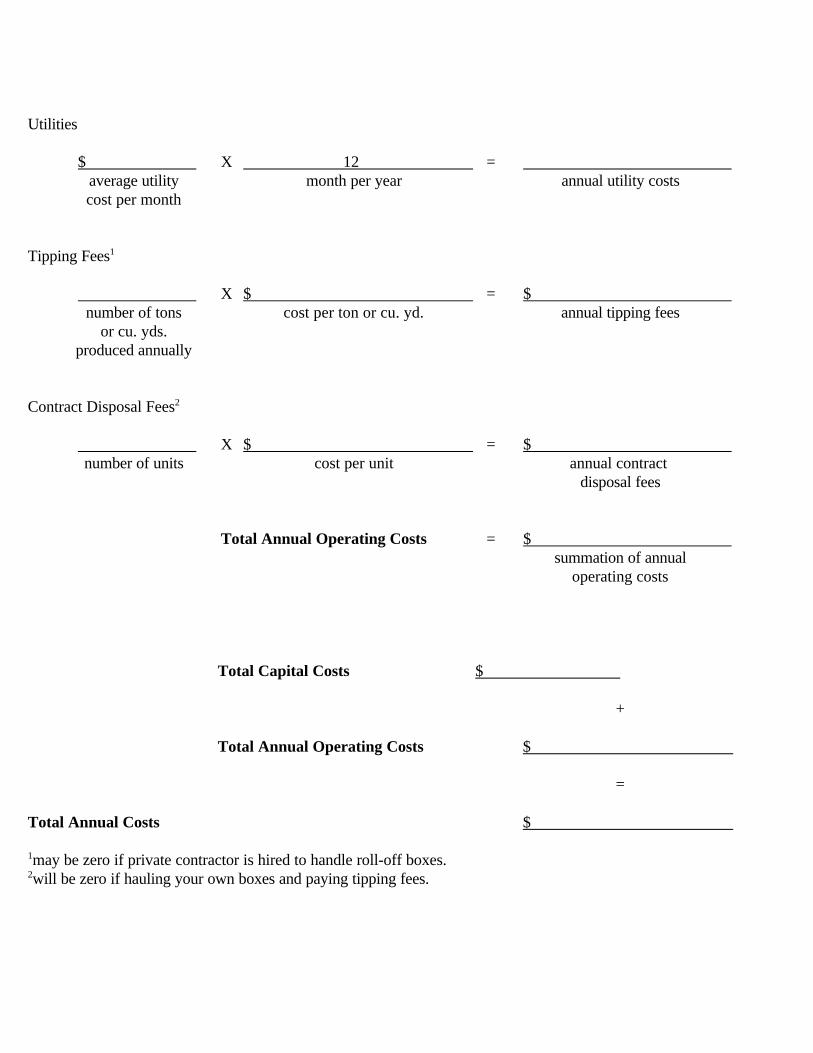
Utilities
$ X 12 =average utility month per year annual utility costscost per month
Tipping Fees1
X $ = $number of tons cost per ton or cu. yd. annual tipping fees
or cu. yds.produced annually
Contract Disposal Fees2
X $ = $number of units cost per unit annual contract
disposal fees
Total Annual Operating Costs = $summation of annual
operating costs
Total Capital Costs $
+
Total Annual Operating Costs $
=
Total Annual Costs $
1may be zero if private contractor is hired to handle roll-off boxes.2will be zero if hauling your own boxes and paying tipping fees.

FORM VII ESTIMATED CAPITAL COSTS OF ALTERNATIVE COLLECTION SYSTEMS
I. Green Box System
X $ = $number of boxes cost per box total cost of collection boxes
+
X $ = $number of cost per truck total cost of
collection trucks collection trucks
+
X $ = $number of cost per site total site development cost
sites
=
Total Capital Costs of Rural Green Box Collection System $
summation of total siteand equipment costs
II. Rural Convenience Center
Site and Preparation
X $ = $number of acres cost per acre total land cost
+
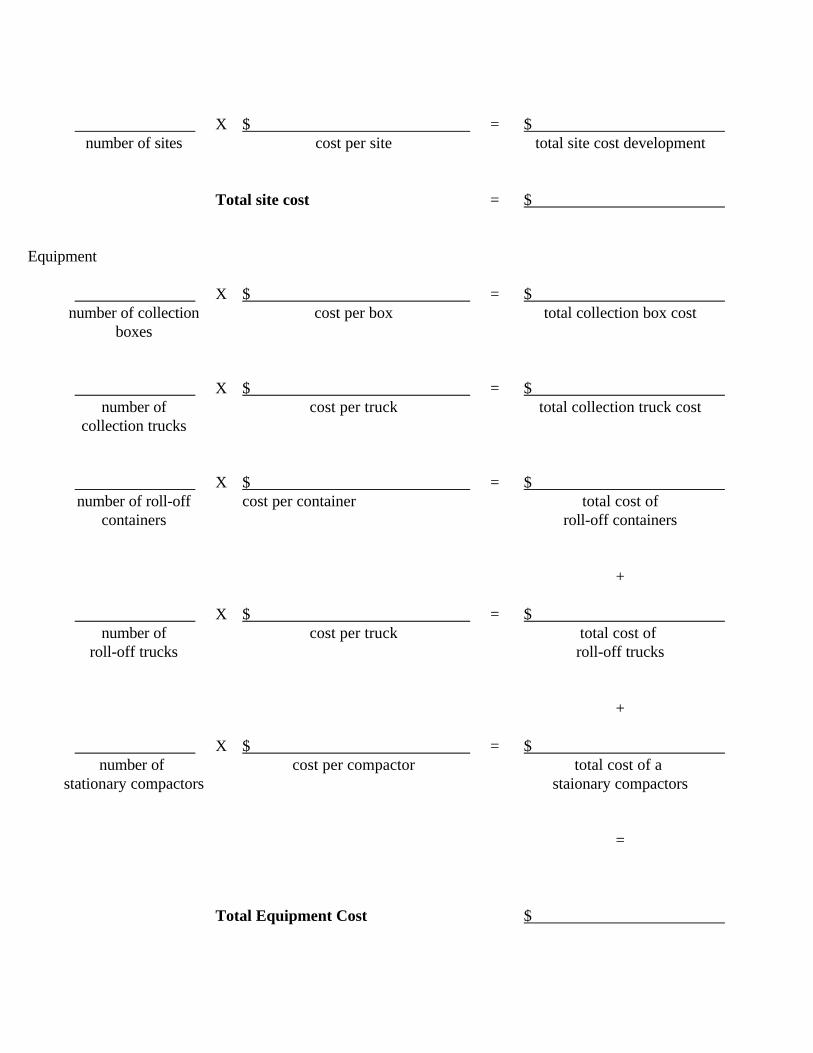
X $ = $number of sites cost per site total site cost development
Total site cost = $
Equipment
X $ = $number of collection cost per box total collection box cost
boxes
X $ = $number of cost per truck total collection truck cost
collection trucks
X $ = $number of roll-off cost per container total cost of
containers roll-off containers
+
X $ = $number of cost per truck total cost of
roll-off trucks roll-off trucks
+
X $ = $number of cost per compactor total cost of a
stationary compactors staionary compactors
=
Total Equipment Cost $
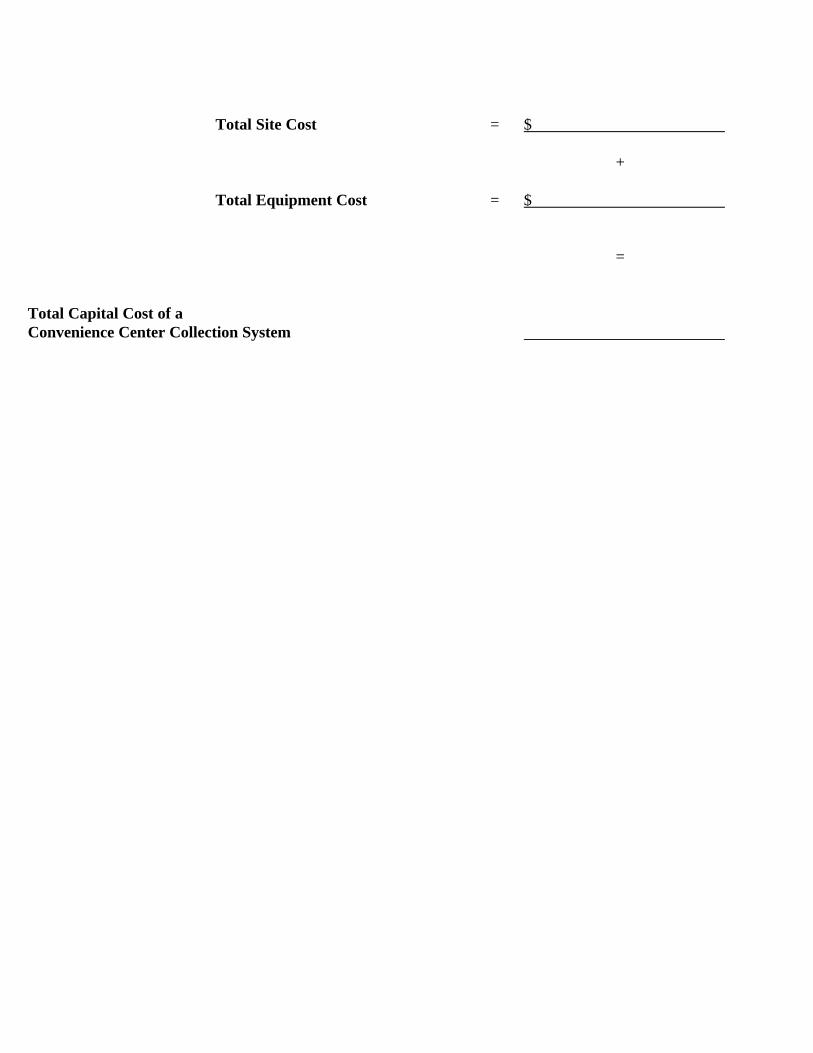
Total Site Cost = $
+
Total Equipment Cost = $
=
Total Capital Cost of a Convenience Center Collection System
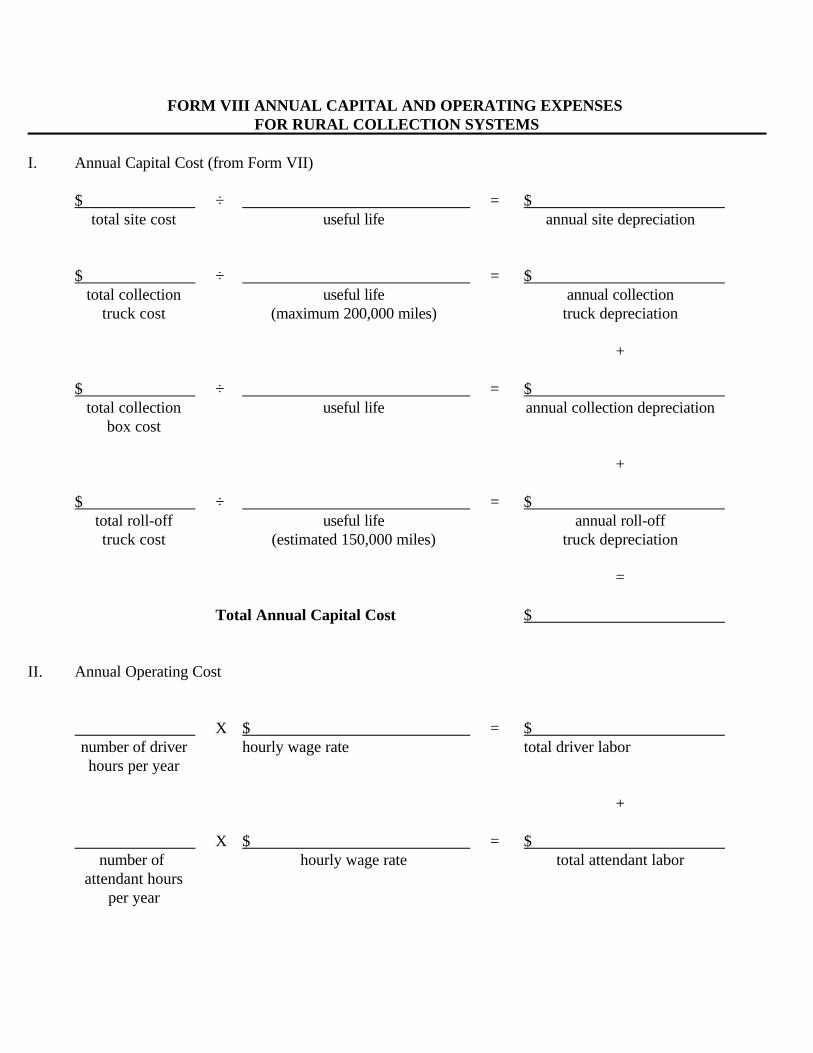
FORM VIII ANNUAL CAPITAL AND OPERATING EXPENSES FOR RURAL COLLECTION SYSTEMS
I. Annual Capital Cost (from Form VII)
$ ÷ = $total site cost useful life annual site depreciation
$ ÷ = $total collection useful life annual collection
truck cost (maximum 200,000 miles) truck depreciation
+
$ ÷ = $total collection useful life annual collection depreciation
box cost
+
$ ÷ = $total roll-off useful life annual roll-offtruck cost (estimated 150,000 miles) truck depreciation
=
Total Annual Capital Cost $
II. Annual Operating Cost
X $ = $number of driver hourly wage rate total driver laborhours per year
+
X $ = $number of hourly wage rate total attendant labor
attendant hoursper year
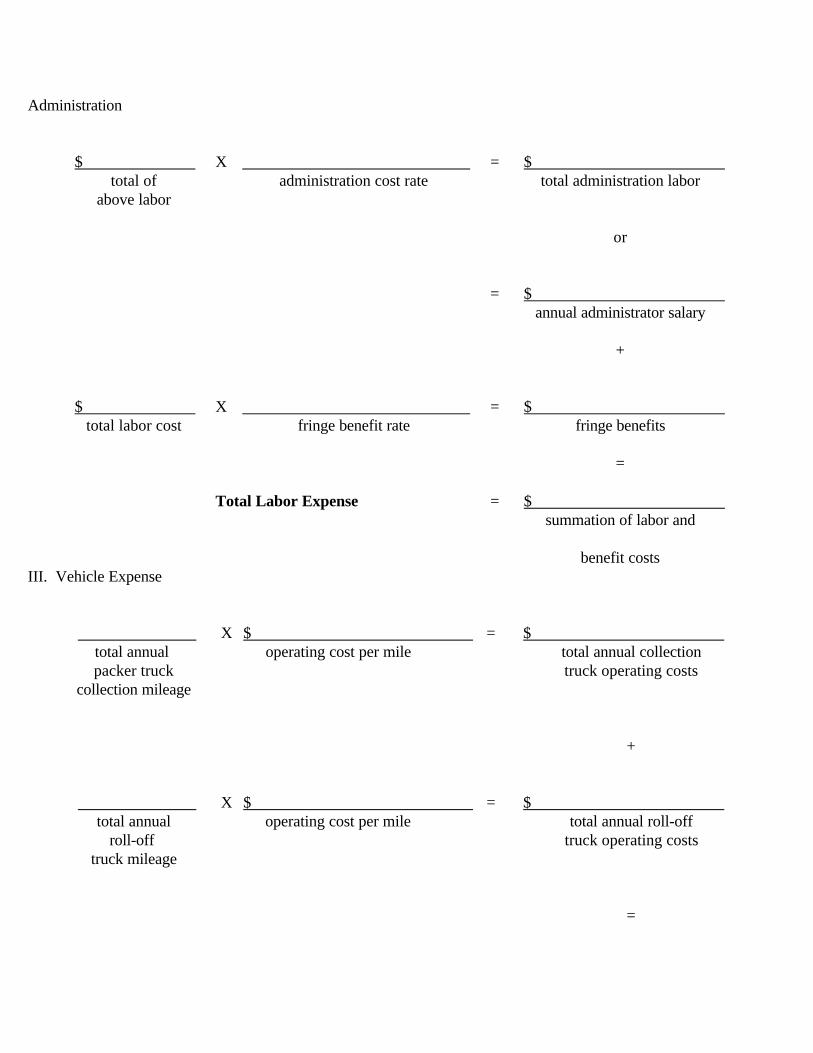
Administration
$ X = $total of administration cost rate total administration labor
above labor
or
= $annual administrator salary
+
$ X = $total labor cost fringe benefit rate fringe benefits
=
Total Labor Expense = $summation of labor and
benefit costsIII. Vehicle Expense
X $ = $total annual operating cost per mile total annual collectionpacker truck truck operating costs
collection mileage
+
X $ = $total annual operating cost per mile total annual roll-off
roll-off truck operating coststruck mileage
=
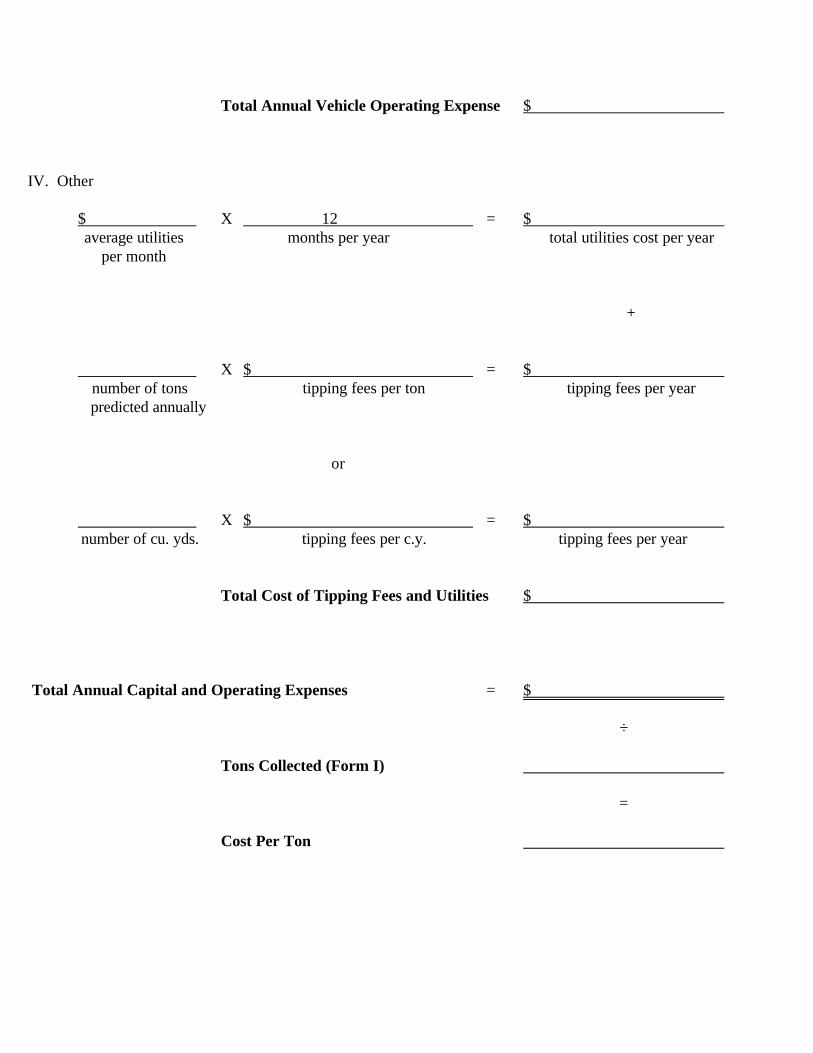
Total Annual Vehicle Operating Expense $
IV. Other
$ X 12 = $average utilities months per year total utilities cost per year
per month
+
X $ = $number of tons tipping fees per ton tipping fees per yearpredicted annually
or
X $ = $number of cu. yds. tipping fees per c.y. tipping fees per year
Total Cost of Tipping Fees and Utilities $
Total Annual Capital and Operating Expenses = $
÷
Tons Collected (Form I)
=
Cost Per Ton