Embed Size (px)
Citation preview

Role of water supply and sanitation in hill area development using GIS techniques: a case study of Shillong urban agglomeration, India
Abstract
People’s lives and livelihoods depend on water. Demand for clean water
increases continually in line with world population growth. People in many areas of
the world lack fresh, drinkable water essential to their survival. Unchecked
population growth and the changing demographic profiles are affecting management
of water resources in the towns and cities since the beginning of the twentieth century.
At the turn of twentieth century only one percent of the population lived in the cities in
most regions of the world. But as the urban population of the world has increased
phenomenally during the century, so has the proportion that lived in the urban areas.
Access to water is a fundamental need and constitutes one of the most
important human rights. But most cities in the developing world and in hilly and
mountainous regions suffer from acute shortage of water both in quantity and quality.
Water supply and sanitation are two most important factors for development of any
urban centre especially in the context of hill area development and in the context of
rapid growth of urban population. Shillong is one of the most important urban centres
in the hilly regions of North-Eastern India. Geographically, it is located in the
Meghalaya plateau which at least surfacially is an extension of North-Eastern
Himalayan range and only 55 km away from Mawsynram, the highest rainfall station
in the world. Shillong is a small (25.4 square km) capital town of Meghalaya,
supporting 267,662 people (Census, 2001) and with a density of 10538 persons per
square kilometre. However, the city has witnessed unprecedented population growth
in recent years largely due to a high fertility rate coupled with a heightened migration
from the neighbouring states of India as well as across the border. The city has been
attracting migrants since colonial times mainly for its congenial climate, better school
infrastructure, jobs and as a tourist spot.
The present paper aims at getting an insight into the effects of rapid growth of
urban population on water supply situation with a particular emphasis on spatial
aspects of hill area development since 1901. The paper examines changing demand
for water and the sanitation system in the context of growth of urban population. The
water supply in the town is mainly controlled by the SMB (Shillong Municipality
Board) through PHE (Public Health Engineering) and Durbar (Local Community).
There has been an unprecedented increase in demand for water (drinking and other
domestic purposes) and the increase in the level of supply has not kept an even pace
creating conditions of acute water shortages. In a large number of cases, the people
are left with no other option but to make their own arrangements to meet their water
requirements either by sending household members to the sources for collecting water
or by hiring the services of private suppliers, who collect water from different springs
and supply them by tins and tanks with very high price. The main sources of water in
the city are controlled by only 9 main natural springs. Most of the springs are
unprotected. The situation worsens in the dry months when the springs too dry up.
The problem of water supply has been investigated with the help of a
household survey. Over 30% of the households were selected by random sampling
technique from each durbar as well as wards during the year 2005. Using remotely
2
sensed data (Aerial Photograph) all households’ structure (Residential and
Institutional), location of springs, roads, rivers, pipelines etc were identified in the
GIS platform (Arc GIS) and the surveyed data were profitably linked using GPS
(Global Positioning System) for the study. A detail analysis was made based on
sources of water, distance from the household, quality, quantity, demand, supply and
cost of expenditure in the households, both for the residential as well as for the
institution population. The study also investigated the situation with regard to
sanitation.
The findings of the study revealed glaring facts about the pathetic water
supply and sanitation situation in this town. Over 80% households in Shillong
received water supply from the SMB, PHE and Durbar while 19 % got it from the
public sector. Over 50% households who used water from the SMB water reported
insufficient supply of water. Interestingly over 60% households using water from the
private sources were not even aware of the source of the water. Less than 30 % of the
households received sufficient or adequate water from the municipality sources
leaving a great majority of the population with grossly inadequate water. The
disparity in mere availability of water was found to be phenomenal. Nearly 69 percent
of the households having sufficient water from the municipality source (SMB and
PHE) have access to safe or treated water from the sources. About 14% of the
households do not use treated water from the sources. Only 54.2 % households have
access to piped drinking water facility. The proportion with access to treated drinking
water through pipes to the household increases with increasing income. Only 30 % of
households in the lowest income quartile have access to safe drinking water sources
compared to 62% in the highest income quintile.
The implications of these findings need to be viewed seriously by policy
makers. If people are to prosper, more secure and low cost water supplies are needed.
The paper makes an attempt to provide policy guidelines in this direction.
Generalities:
Water is essential for life. We are also aware of its necessity, for drinking, for
producing food, for washing. Water is the essence for maintaining our health and
dignity. Water is also required for both domestic and non domestic use in school,
college, institutions, Offices, market etc. The integral role of water in international
development has been recognised over the last two decades; with several international
agreements specifying targets on water supply and sanitation dating back to the
United Nations Children’s fund (UNICEF) 1980 International water supply and
Sanitation Decade (IWSSD), which established the target of universal coverage of
safe water supply and sanitation by 1990. While significant number of people gained
access to improved drinking water supply and better sanitation over the decade, the
target was not fully met due to population growth. It was, however, readopted as a
target for the year 2000 at the World Summit for Children in 1090. More recently
targets have been established by the Water Supply and Sanitation Collaborative
Council (WSSCC) as part of the progress leading to the Second Water forum in The
Hague in March 2000. The target set forth included the following: to reduce by one
half of the proportion of people without access to hygienic sanitation facilities by the
year 2015; to reduce by 2015 one half of the proportion of people without sustainable
access to adequate quantities of affordable and safe water- a goal also endorsed by the
United Millennium Declaration i.e.. to provide water, Sanitation and hygiene for all

3
by 20251. Lack of drinking water and sanitation kills about 4500 children a day and
sentences their siblings, parent and neighbours to sickness, squalor and enduring
poverty. Improvements bring immediate and lasting benefits in health, dignity,
education, productivity and income generation2.
Changes Affecting Water
The world is witnessing rapid changes in the recent times. Many of these
changes are having an impact on how we, as humans, utilize the world’s water. Rapid
growth of the World’s population has been one of the most visible and dramatic
changes over the last hundred years. Population growth has huge implications for all
aspects of resource use including water. Although water is a renewable resource, it is
only renewable within limits; the extent to which increasing demands can be met is
finite. As population increases, freshwater demand too increases and supply per
person inevitably declines3. In addition to general population growth, the changing
demographics are affecting how water resources are managed. At the beginning of the
twentieth century, only one small percentage of population lived in cities in most
regions of the world, but as the world population has increased, so has the proportion
that live in urban areas. The urban population rose greatly throughout the twentieth
century and is projected to reach 58 percent of the world population by 2025
((UNFPA, 2002). In the next thirty years, the greatest urban growth will occur in
Asia. UN (2002) estimates show that in real terms the urban population of the less
developed world is expected to nearly double in size between 2000 and 2030, from a
little fewer than 2 billion to nearly 4 billion people. Between 2015 and 2020, urban
population will exceed rural for the first time, and will only continue to escalate
sharply rural numbers remain more or less static.
Access to water is a fundamental need and constitutes one of the most
important human rights. But most cities in the developing world and in hilly and
mountainous regions suffer from acute shortage of water both in quantity and quality.
Water supply and sanitation are two most important factors for development of any
urban centre especially in the context of hill area development and in the context of
rapid growth of urban population.
The Study Area
Shillong is one of the most important urban centres in the hilly regions of
North-Eastern India. Geographically, it is located in the Meghalaya plateau which
surfacially is an extension of the Himalayan range and only 55 km away from
Mawsynram, the highest rainfall station in the world. Shillong is a small (25.4 square
km) capital town of Meghalaya, supporting 26, 7662 people (Census, 2001) and with
a density of 10538 persons per square kilometre. The city has witnessed
unprecedented population growth in recent years largely due to a high fertility rate
coupled with a heightened migration from the neighbouring states of India as well as
across the border. The city has been attracting migrants since colonial times mainly
for its congenial climate, better school infrastructure, jobs and due to its touristic
attraction.
The present paper aims at getting an insight into the effects of rapid growth of
urban population on water supply situation with a particular emphasis on spatial
aspects of hill area development since 1901. The paper examines changing demand
1. Source: WSSCC, 2000.
2. Water for Life, Making it Happen, WHO, UNICEF, 2005, P.5. 3. Gardner-Outlaw and Engelman, 1997.

4
for water and the sanitation system in the context of rapid growth of urban population
in the city. The water supply in the town is mainly controlled by the SMB (Shillong
Municipality Board) through PHE (Public Health Engineering) and Durbar (Local
Community). There has been an unprecedented increase in demand for water
(drinking and washing) and in comparison the supply is grossly inadequate in the
urban agglomeration. In a large number of cases, the people are left with no other
option but to make their own arrangements to meet their water requirements either by
sending household members to the sources for collecting water or by hiring the
services of commercial suppliers, who collect water from different springs and supply
them by tins and tanks with very high price. The main sources of water in the city are
controlled by only 9 main natural springs i.e. Phud Umshing River, Wah Umiam
River, Wah Umro, Wah Umkrah, Nongrimbah Stream, Phud Raimut, Umshyrpi, Um
Phyrnai and Wah Demthring.
Most of the springs are unprotected. The situation worsens in the dry months
when the springs too dry up.
Data and Methodology
Much of the data required for this research is obtained from both Primary and
Secondary sources particularly those published by successive census enumeration.
Census publications pertaining to urban population data are used to analyse
patterns in the distribution and growth of population at ward level.
The methodology adopted for the present research is outlined below:
Using remotely sensed data (Aerial Photograph) all households’ structure
(Residential and Institutional), location of springs, roads, rivers etc were identified in
the GIS platform (Arc GIS) and the surveyed data were profitably linked using GPS
(Global Positioning System) for the study.
The problem of water supply and sanitation has been investigated with the
help of a household survey. Around 30 percent of all households are chosen on a
random basis from each ward as well as towns to elicit information on the primary
and secondary sources of water, supply and uses of water, availability of water,
frequency and demand and supply of water with households income for both domestic
as well as non domestic users like school, college, offices, hotels, shops, restaurants
etc and Information on available sanitation too has been obtained.
A detail analysis was made based on sources of water, quality, quantity,
demand, supply and cost of expenditure in the households, both for the residential as
well as for the institution population.
Findings
The density of population in Shillong has been increasing phenomenally over the
years. The 2001 Census recorded a population density of 10500 inhabitants per square
kilometer as against 8794 inhabitants per square kilometer only a decade before.
Table-1 reveals the trend in population growth since the beginning of the 20th
century. As is evident from the table, the city experienced fluctuating trend in
population growth throughout the period under review. Rate of population growth has
been extraordinary during 1941-61 decades. However, it may be noted that the density
of population has been registering a continuous rise over the entire period. From a
meager 379 persons per square kilometer at the turn of the 20th century, the city now
supports as many as 10, 538 persons per square kilometer by the turn of 21st century-
in a span of a century. (Table-1 and Fig. 1).

5
Table: 1
Growth and Density of Population Since 1901
Year
Population Growth (in Percentage)/year
Density/
sq. Km Persons Male Female Persons Male Female
1901 9621 5577 4044 - - - 379
1911 13639 7762 5877 4.2 3.9 4.5 537
1921 17203 9512 7691 2.6 2.3 3.1 677
1931 26536 15634 10902 5.4 6.4 4.2 1045
1941 38192 22696 15496 4.4 4.5 4.2 1504
1951 58512 32790 25722 5.3 4.4 6.6 2304
1961 102398 58082 44316 7.5 7.7 7.2 4031
1971 122752 66161 56591 2.0 1.4 2.8 4833
1981 174703 91728 82975 4.2 3.9 4.7 6878
1991 223366 117373 105993 2.8 2.8 2.8 8794
2001 267662 134497 133165 2.0 1.5 2.6 10538 Source: Census of India, 1991 & 2001
Population Change in Shillong UA Since 1901
0
50000
100000
150000
200000
250000
300000
1901 1911 1921 1931 1941 1951 1961 1971 1981 1991 2001
Year
Population
Persons
Male
Female
Fig: 1
Table: 2
Population Growth per Year by Different Category (1991-2001) NAME Total
Population
0-6 Years
Population
Scheduled
Caste
Population
Scheduled
Tribe
Population
Scheduled
Population
Non
Scheduled
Population 1. Shillong (M) 0.1 -2.2 -5.5 0.9 0.7 -0.5
2. Mawlai (CT) 2.4 0.1 163.3 2.6 2.6 -1.0
3. Nongthymmai (CT) 2.7 -0.2 17.5 3.9 3.9 0.9
4. Pynthorumkhrah (CT) 6.2 3.3 6.8 11.9 11.8 2.7
5. Shillong Cantt. (CB) 1.2 0.4 0.7 2.8 1.8 1.1
6. Madanrting (CT) 8.2 4.6 24.3 8.5 8.6 7.5
7. Nongmynsong (CT) 8.7 5.7 143.3 13.1 13.3 6.6
Shillong UA 2.0 -0.2 -3.5 2.9 2.8 1.0
Source: Census of India, 1991 and 2001

6
Table-2 shows an extreme inter locality variation in the rate of population
growth during the 1991-2001 decade. The growth rate has been phenomenal in three
of the seven localities.
Town Level Pattern
This overall pattern however conceals extreme variation that is found when
the data is scrutinised at lower spatial units, i.e. different towns/wards that constitute
the agglomeration. Of the seven towns that constitute the agglomeration, Shillong
Municipality is relatively better placed in terms of improved access to safe drinking
water i.e. piped water through house connection or yard. 72 per cent of the households
enjoy the facility of piped water supply into their households compared to none in
Nongmynsong or only 18 percent in Madanrting town. Nongthymmai has 66 percent
households with an access to piped water supply.
Over three fourths of the households in Shillong Cantonment (CB) and over
half of the households in Mawlai (CT), Pynthorumkhrah (CT) and almost half in
Madanrting (CT) have access to other sources of improved drinking water i.e Public
standpipe, Protected tube well or bore well, protected drug well or protected spring,
rain water etc.
Nongmynsong (CT) is at a great disadvantage in terms of access to other
improved drinking water sources too. Nongmynsong (CT) is the worst in terms of
improved drinking water as over 93 per cent households having little access to any
improved drinking water sources.
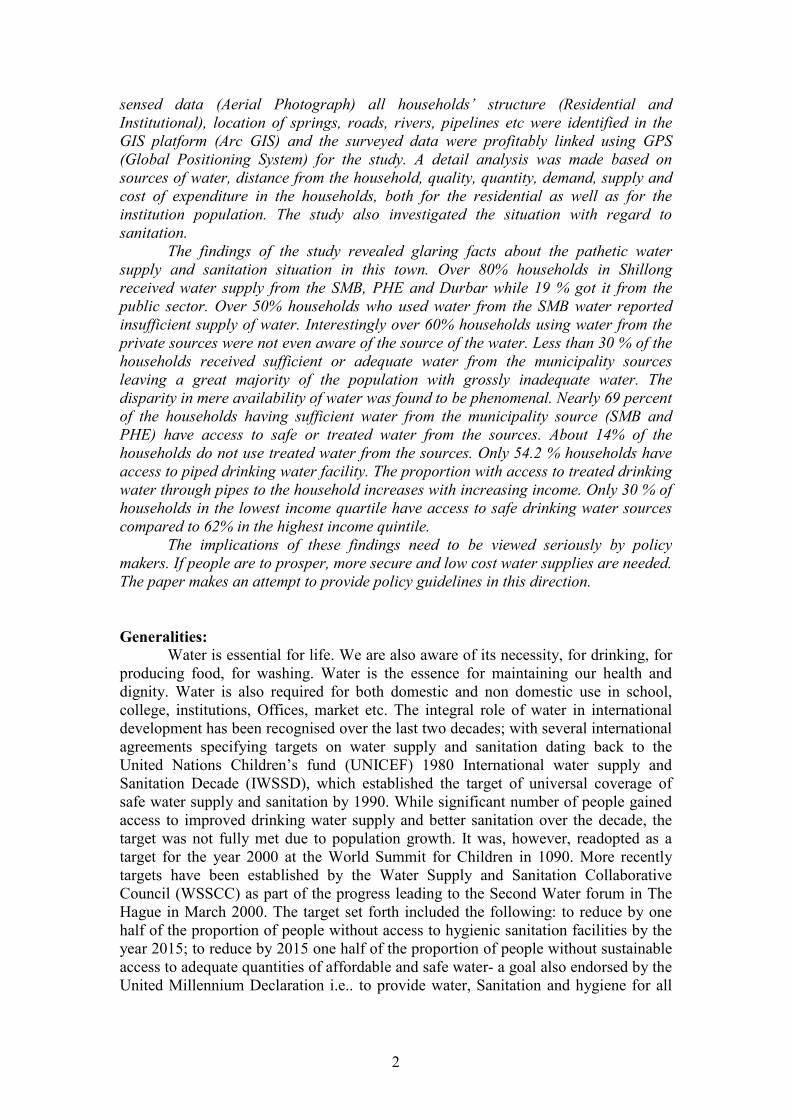
Tables-3, 4 and 5 reveal extreme inequity in the availability of safe drinking
water across the townships and wards distributed over the agglomeration. It is
surprising that around 50-80 per cent of the households in police Bazar and over 80
per cent households in Nongmynsong have no access to safe improved drinking water
facility. Around 30-50 per cent households in Madanrting too do not have access to
safe improved drinking water. Areas like Mawlai,Pynthorumkhrah, Shillong
Cantonment have 50-80 per cent households who depend on other than piped water
supply for drinking purposes.
Table: 3
Households with Access to Improve Drinking Water Sources (in Percent)
Name of the Town Improved
Drinking
Water1
Other Sources of
Improved
Drinking Water2
No Access to
Improved
Drinking Water
Sources3
Total
Respondents
1. Shillong (M) 72.0 22.7 5.3 1698
2. Mawlai (CT) 33.7 57.1 9.2 463
3. Nongthymmai (CT) 66.0 18.6 15.4 483
4. Pynthorumkhrah (CT) 27.7 56.5 15.8 300
5. Shillong Cantt. (CB) 18.8 75.1 6.1 64
6. Madanrting (CT) 18.3 48.8 32.9 218
7. Nongmynsong (CT) 0.0 6.7 93.3 156
1. Shillong (M) 54.2 32.1 13.7 3382
India (Urban)* 55.5 35.1 9.4 2728 Note:
1. Piped water through house connection or yard.
2. Public standpipe, Protected tube well or bore well, protected drug well or protected spring, rain water etc.
3. Unprotected drug well or spring, water taken directly stream, tanker-truck, vendor etc.
* World Health Survey, 2003, India, WHO-India-WR Office, New Delhi, 2006, P-50.

7
Table-4
Ward Level Drinking Water
Improved Drinking Water1
Other Sources of
Improved Drinking
Water2
No Access to
Improved Drinking
Water Sources3
Range No. of Ward & Name No. of Ward & Name No. of Ward & Name
Below 10 (1) Nongmynsong (24)
10-30 (3)Madanrting,
Pythourmukhra, Shillong
Cantonment
(5) Nongthymmai,
Malki, Laithmkhrah,
Pythourmukhra,
European ward 2 W
30-50 (5) Mawprem, S. E.
Mawkhar, Police Bazar,
European Ward, Laban,
Mawlai
(1) Madanrting
50-80 (13) Mawprem, Mawkhar,
Jaiaw 3W, Jail Road 2W,
European Ward,
Laitumkhrah, Nongthymmai,
Malki, Lumparing, Laban
Mawlai,
Pynthorumkhrah,
Shillong Cantonment,
SE. Mawkhar
(1) Police Bazar
80 and Above (11) Mawprem, Mawkhar
2W, Litumkhra 3W, Malki,
Lumparing, Kenches Trace
2W, Laban
No Ward (1) Nongmynsong,
Source: Field Survey, 2005
Table: 5
Households with Access to Improve Drinking Water Sources (in Percent)
Name of the Town Improved
Drinking
Water1
Other Sources of
Improved
Drinking Water2
No Access to
Improved
Drinking Water
Sources3
Total
Respondents
Laitmukhrah 88.4 11 0.7 146 Laitmukhrah2 75.4 10.5 14.0 57 Laitmukhrah3 88.4 8.1 3.5 86 Laitmukhrah4 80.0 15.6 4.4 45 Malki1 74.4 15.4 10.3 78 Malki2 94.2 3.8 1.9 52 European Ward 46.7 42.7 10.7 75 European Ward2 65.5 10.3 24.1 58 Police Bazar 32.0 12.0 56.0 25 Jail Road1 76.4 21.8 1.8 55 Jail Road2 60.0 32.0 8.0 25 Mawkhar1 83.0 10.6 6.4 47 Mawkhar2 80.6 17.7 1.6 63 Jaiaw1 57.1 38.1 4.8 42 Jaiaw2 60.0 37.5 2.5 40 Jaiaw3 67.1 30.4 2.5 79 S.E. Mawkhar 35.7 57.1 7.1 42 Makhar 67.4 30.4 2.2 46 Mawprem 72.7 24.2 3.0 33 Mawprem2 80.2 17.2 2.6 116
8
Mawprem3 46.7 49.5 3.8 105 Kenhes Traces1 86.2 6.9 6.9 29 Kenhes Traces2 94.8 1.0 4.2 96 Laban1 85.7 8.6 5.7 35 Laban2 56.8 42 1.2 81 Lumparing1 58.0 40.7 1.2 81 Lumparing2 80.3 16.4 3.3 61 Mawlai 33.7 57.9 8.4 463 Nongthymmai 66.0 18.6 15.3 483 Shillong Cant 18.8 75 6.3 64 Madanrting 18.3 49.1 32.6 218 Pynthorumkhrah 27.7 56.7 15.7 300 Nongmynsong 0.0 10.3 89.7 156 Shillong UA 88.4 11.0 0.7 3382
Source: Field Survey, 2005
Fig: 2

9
Income level appears to be an important determinant to access to safe drinking
water in the city. Table-6 amply demonstrates the fact that higher household income is
positively associated with increased access to safe drinking water. Going by the two
sources of safe drinking water facility, larger income is associated with greater access
to improved water with a corresponding decline in access to other sources of
improved drinking water. However, over 12 per cent of the households in the higher
income bracket do not have access to any source of improved drinking water-a fact
that defies easy explanation. It may however be easily deduced that access to safe
drinking water is largely a private endeavour indicating failure of public distribution
system and that there are extreme difficulties of physical availability of water that
even prevents some rich households to gain access to safe drinking water. Locational
factors largely explain the failure of some of the relatively rich sections’ inability to
gain such an access. Localities such as Madanriting and Nongmynsong which have
difficult physiographic conditions in relation to water availability are examples of this
kind where a majority of the rich too finds it difficult to obtain safe drinking water
either from piped water supply or through other means (Table-7 and fig. 3).
Table: 6
Households with Access to Improve Drinking Water Sources by Income
Income (in Rupees)
Improved
Water
Other Sources of
Improved Water
No Access to improved
Water Sources
Below 2000 110 (30.1) 178 (48.6) 78 (21.3)
2000-5000 365 (42.7) 367 (42.9) 123 (14.4)
5000 and Above 1358 (62.8) 540 (25.0) 263 (12.2)
Total 1833 (54.2) 1085 (32.10 464 (13.7) Source: Field Survey, 2005
Improved Drinking Water by Households Income (in Rs.)
62.8
25
12.2
42.7
42.9
14.4
30.1
48.6
21.3
0 10 20 30 40 50 60 70
Improved Water
Other Sources of
Improved Water
No Access to
improved Water
Sources
Below 20002000-50005000 and Above
Fig: 3

10
Table: 7
Households with Access to Improve Drinking Water Sources by Income in Towns
Town’s Name Income (in Rupees)
Access to Improved Drinking Water
Improved
Water
Other
Sources of
Improved
Water
No Access to
improved
Water Sources
Total
Respondent
1. Shillong
Municipality
Below 2000 41.6 45.5 12.9 202
2000-5000 64.0 30.7 5.3 417
5000 and Above 80.8 15.4 3.8 1079
Total 72.0 22.7 5.2 1698
2. Mawlai CT2
Below 2000 17.1 65.7 17.1 35
2000-5000 21.4 68.8 9.7 154
5000 and Above 42.7 50.7 6.6 274
Total 33.7 57.9 8.4 463
3. Nongthymmai
Below 2000 37.0 22.2 40.7 27
2000-5000 51.6 27.4 21.0 62
5000 and Above 70.3 17.0 12.7 394
Total 66.0 18.6 15.3 483
4. Pynthorumkhrah
Below 2000 13.2 56.6 30.2 53
2000-5000 23.4 63.8 12.8 94
5000 and Above 35.3 52.3 12.4 153
Total 27.7 56.7 15.7 300
5. Shillong
Cantonment
Below 2000 8.0 76.0 16.0 25
2000-5000 20.0 80.0 0.0 30
5000 and Above 44.4 55.6 0.0 9
Total 18.8 75.0 6.3 64
6. Madanrting
Below 2000 8.3 58.3 33.3 12
2000-5000 11.1 57.8 31.1 45
5000 and Above 21.1 46.0 32.9 161
Total 18.3 49.1 32.6 218
7. Nongmynsong
Below 2000 0.0 8.3 91.7 12
2000-5000 0.0 11.3 88.7 53
5000 and Above 0.0 9.9 90.1 91
Total 0.0 10.3 89.7 156
Shillong UA
Below 2000 30.1 48.6 21.3 366
2000-5000 42.7 42.9 14.4 855
5000 and Above 62.8 25.0 12.2 2161
Total 54.2 32.1 13.7 3382
Source: Field Survey, 2005
Table-8 shows that a little over 8 per cent of water available from all sources
is used for drinking/cooking or washing. Over 90 per cent of the available water is
used for other purposes in Shillong. A greater proportion of the water obtained from
private suppliers is used for drinking, cooking and washing. It is interesting to note
that a greater proportion of the available water from primary sources is used for
cooking, drinking and washing as the income level goes up. Increase of water use for
washing increases phenomenally as the income level of the household increases. This
is largely due the use of washing machines as well as washing at home. The poorer
sections however resort to community washing at common places using spring water,
a sight very common within the city.

11
Sources of Water
The city dwellers are dependent on two main sources of water, viz. Primary as
well as secondary. The SMB and the PHE supply water to nearly 68 per cent city
inhabitants, while the local Durbar, a community level organization takes care of 12.7
per cent city dwellers for their water requirement from primary sources. Private
suppliers too take care of 4.7 per cent of all households using primary source of water
supply. There is a great multiplicity of sources and supply system as far as water
supply to Shillong residents are concerned (Tables-8 to 11). Fewer households use
secondary sources for the water supply. The private suppliers mainly use secondary
sources of water for supplying to the residents in areas of water crisis or in times of
water shortages in other areas.
Table: 8
Primary Sources of Water Supply by Uses (in Percent) Sources of Water Use of Water
All
Uses
Only
Drinking/Cooking
Washing Total
Respondent
SMB 94.8 3.8 1.4 1152 (34.1)
PHE 91.0 4.8 4.2 1164 (34.4)
Durbar 93.5 4.4 2.1 431 (12.7)
Pvt Suppliers 87.4 6.9 5.7 159 (4.7)
Other 85.3 7.1 7.6 289 (14.1)
Total 91.6 4.8 3.5 3382 (100)
Source: Field Survey, 2005
Table: 9
Primary Sources of Water Supply and Uses by Households Income
Income (in Rs.)
Absolute Percentage
Total
Respondent All
Uses
Only
Drinking/
Cooking
Washing All
Uses
Only
Drinking/
Cooking
Washing
Below 2000 332 30 4 10.6 17.9 4.4 366
2001-5000 783 50 22 25.1 29.8 24.4 855
5001 and Above 2009 88 64 64.3 52.4 71.1 2161
Total 3124 168 90 100 100 100 3382 Source: Field Survey, 2005
Table: 10
Primary Sources of Water and Supply System (in Percent)
Primary Sources No of
Household Percent Supply System (in Percent)
SMB 1152 34.1 SL-78.6, S-20.3,
PHE 1164 34.4 SL-58.9, S-40.5, T-.6
Durbar 431 12.7 SL-49.2, S-46.6, T-1.4, DW-2.8
Pvt Suppliers 159 4.7 P-90.6, T-9.4
Other 289 14.1 Sp-60.7, DW-30.0, PC-8, R-1.3
Total Respondent 3382 100 -
SL= Service Line, S=Stand Pipe, T= Tanker, PC= Private Carrier, Pani Walla and Tin RWH= Rain Water
Harvesting, Sp= spring, DW= Deep Well, Tube Well or Bore Well.
12
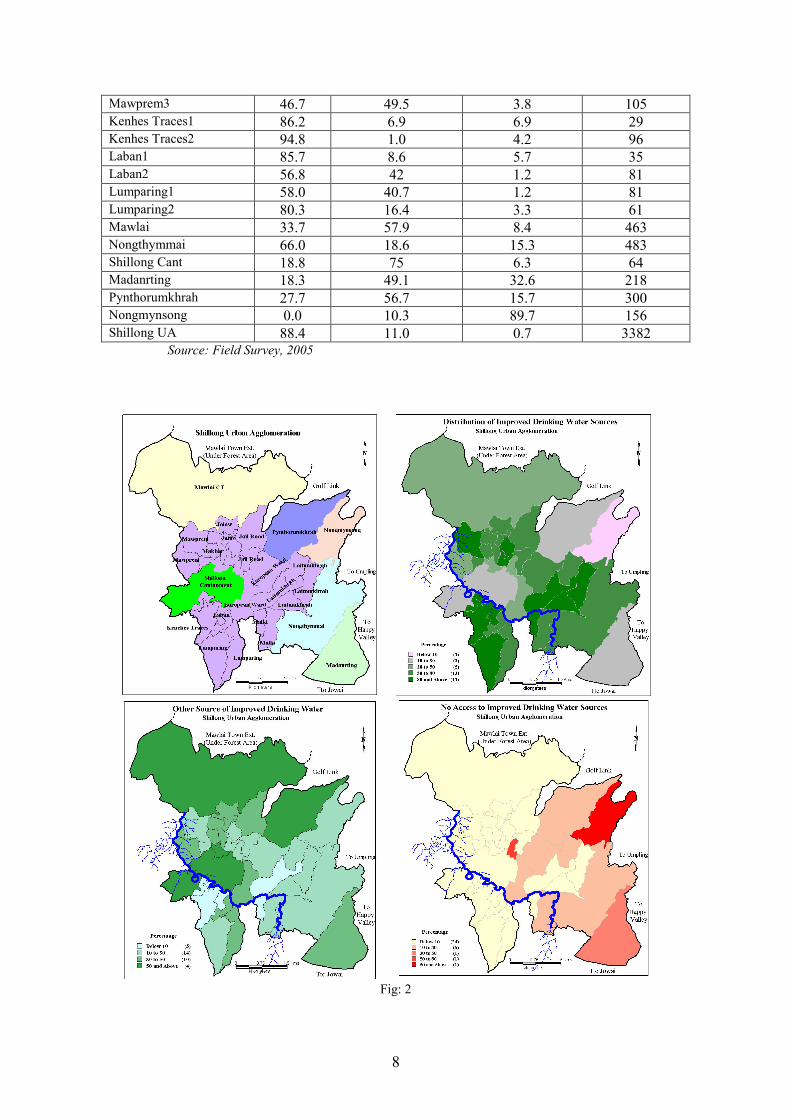
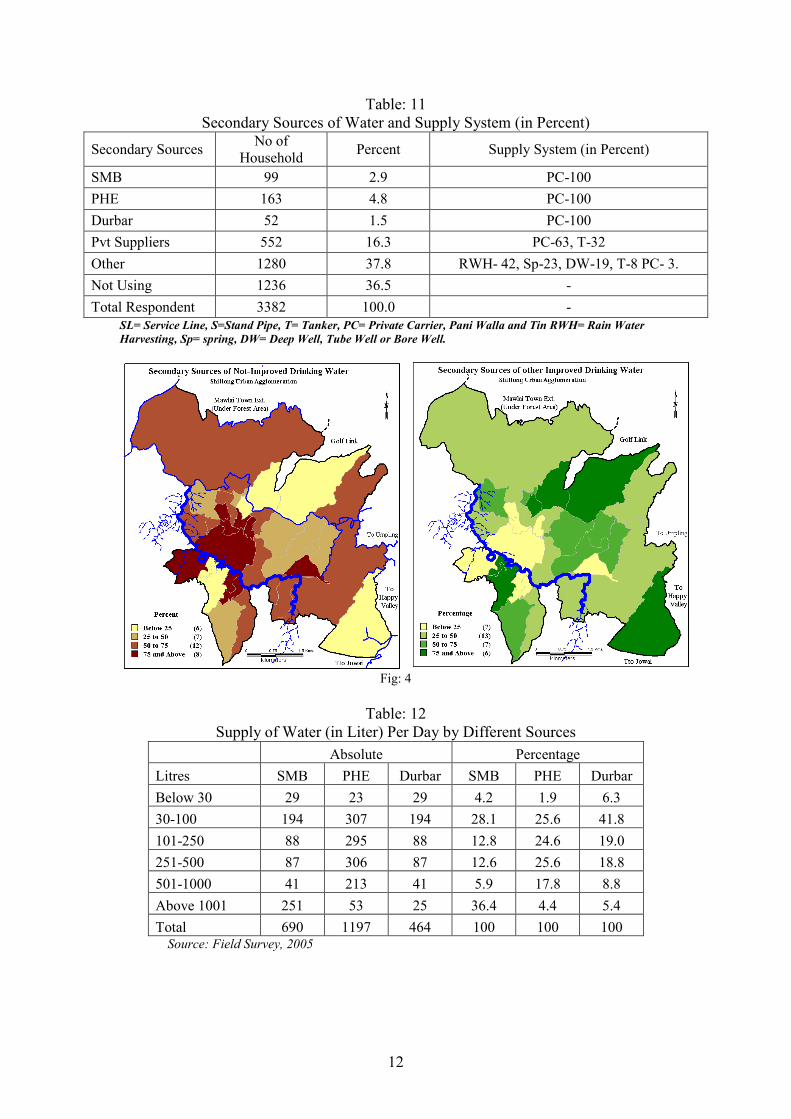
Table: 11
Secondary Sources of Water and Supply System (in Percent)
Secondary Sources No of
Household Percent Supply System (in Percent)
SMB 99 2.9 PC-100
PHE 163 4.8 PC-100
Durbar 52 1.5 PC-100
Pvt Suppliers 552 16.3 PC-63, T-32
Other 1280 37.8 RWH- 42, Sp-23, DW-19, T-8 PC- 3.
Not Using 1236 36.5 -
Total Respondent 3382 100.0 -
SL= Service Line, S=Stand Pipe, T= Tanker, PC= Private Carrier, Pani Walla and Tin RWH= Rain Water
Harvesting, Sp= spring, DW= Deep Well, Tube Well or Bore Well.
Fig: 4
Table: 12
Supply of Water (in Liter) Per Day by Different Sources
Absolute Percentage
Litres SMB PHE Durbar SMB PHE Durbar
Below 30 29 23 29 4.2 1.9 6.3
30-100 194 307 194 28.1 25.6 41.8
101-250 88 295 88 12.8 24.6 19.0
251-500 87 306 87 12.6 25.6 18.8
501-1000 41 213 41 5.9 17.8 8.8
Above 1001 251 53 25 36.4 4.4 5.4
Total 690 1197 464 100 100 100 Source: Field Survey, 2005
13
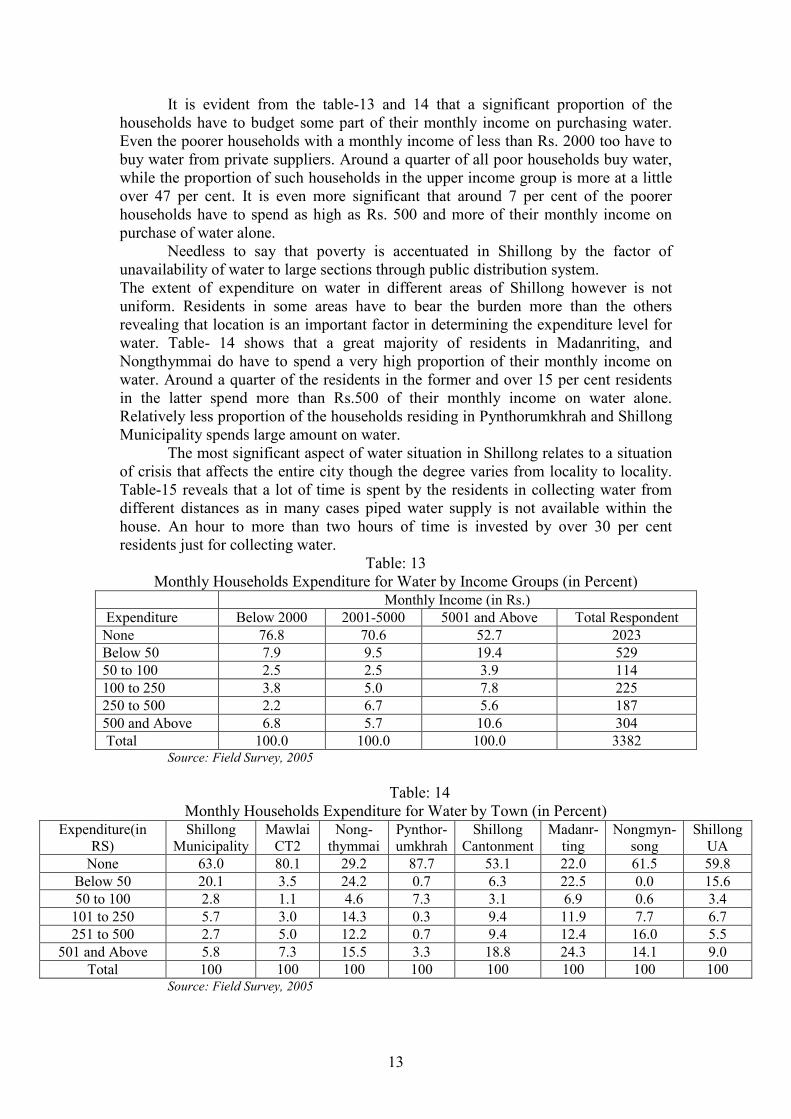
It is evident from the table-13 and 14 that a significant proportion of the
households have to budget some part of their monthly income on purchasing water.
Even the poorer households with a monthly income of less than Rs. 2000 too have to
buy water from private suppliers. Around a quarter of all poor households buy water,
while the proportion of such households in the upper income group is more at a little
over 47 per cent. It is even more significant that around 7 per cent of the poorer
households have to spend as high as Rs. 500 and more of their monthly income on
purchase of water alone.
Needless to say that poverty is accentuated in Shillong by the factor of
unavailability of water to large sections through public distribution system.
The extent of expenditure on water in different areas of Shillong however is not
uniform. Residents in some areas have to bear the burden more than the others
revealing that location is an important factor in determining the expenditure level for
water. Table- 14 shows that a great majority of residents in Madanriting, and
Nongthymmai do have to spend a very high proportion of their monthly income on
water. Around a quarter of the residents in the former and over 15 per cent residents
in the latter spend more than Rs.500 of their monthly income on water alone.
Relatively less proportion of the households residing in Pynthorumkhrah and Shillong
Municipality spends large amount on water.
The most significant aspect of water situation in Shillong relates to a situation
of crisis that affects the entire city though the degree varies from locality to locality.
Table-15 reveals that a lot of time is spent by the residents in collecting water from
different distances as in many cases piped water supply is not available within the
house. An hour to more than two hours of time is invested by over 30 per cent
residents just for collecting water.
Table: 13
Monthly Households Expenditure for Water by Income Groups (in Percent) Monthly Income (in Rs.)
Expenditure Below 2000 2001-5000 5001 and Above Total Respondent
None 76.8 70.6 52.7 2023
Below 50 7.9 9.5 19.4 529
50 to 100 2.5 2.5 3.9 114
100 to 250 3.8 5.0 7.8 225
250 to 500 2.2 6.7 5.6 187
500 and Above 6.8 5.7 10.6 304
Total 100.0 100.0 100.0 3382 Source: Field Survey, 2005
Table: 14
Monthly Households Expenditure for Water by Town (in Percent) Expenditure(in
RS)
Shillong
Municipality
Mawlai
CT2
Nong-
thymmai
Pynthor-
umkhrah
Shillong
Cantonment
Madanr-
ting
Nongmyn-
song
Shillong
UA
None 63.0 80.1 29.2 87.7 53.1 22.0 61.5 59.8
Below 50 20.1 3.5 24.2 0.7 6.3 22.5 0.0 15.6
50 to 100 2.8 1.1 4.6 7.3 3.1 6.9 0.6 3.4
101 to 250 5.7 3.0 14.3 0.3 9.4 11.9 7.7 6.7
251 to 500 2.7 5.0 12.2 0.7 9.4 12.4 16.0 5.5
501 and Above 5.8 7.3 15.5 3.3 18.8 24.3 14.1 9.0
Total 100 100 100 100 100 100 100 100 Source: Field Survey, 2005

14
Table: 15
Time Spent Per Day for Water Collection From Outside Time (in Minutes) Frequency Percent
Below 5 155 10.6
5-10 177 12.1
10-30 275 18.8
30-60 595 40.6
60-120 187 12.8
120 and Above 262 17.9
Total 1464 100.0 Source: Field Survey, 2005
Time Spent Per Day for Water Collection form Outside
17.9
12.8
40.6
18.8
12.1
10.6
0 5 10 15 20 25 30 35 40 45
120 and Above
60-120
30-60
10-30
5-10
Below 5
Tim
e (in
Min
utes)
Percent of Users
Fig: 5
Sanitation
Sanitation facilities too pay a crucial role in health, personal hygiene and the
spread of communicable diseases across a population. Epidemiological evidence
suggests that sanitation is at least as effective in preventing disease as in the case of
improved water supply (WHO, 20034). The Millennium Development Goals aim at
achieving a significant improvement in the lives of at least 100 million slum dwellers
by 2020. The percentage of urban population with access to improved sanitation is
one of the indicators used to measure progress towards this goal (WHO and UNICEF,
2000).
The sanitation survey in Shillong provides data on the proportion of
households with access to a flush toilet to sewage system (a high technology where
sanitation does not take place onsite but municipality and thereby minimizes the risk
of contamination with excreta), the population with access to improved sanitation
facilities, and the population without access to improved sanitation.
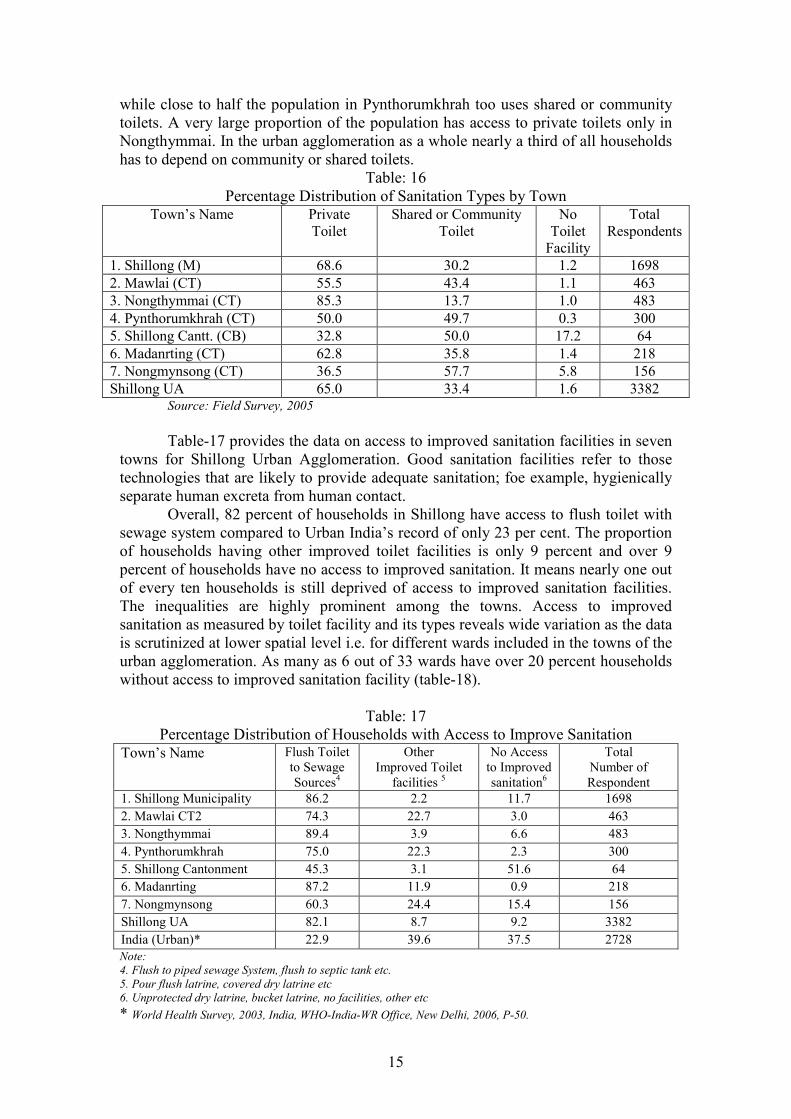
The table-16 shows that 65 per cent of the households have access to private
toilet facility whereas over 33 per cent uses shared or community toilets and about 2
per cent households have no access to toilet facility. Among the towns of Shillong
Cantonment area shows the worst condition in terms of toilet facility. Over 17 per
cent households do not have any mode of toilet facility. Shared or community toilets
are used by a majority of residents in Nongmynsong and Shillong Cantonment areas
4 WHO Manual, 2003: World Health Survey-Data Analysis and Report Writing Guidelines, Geneva.
15
while close to half the population in Pynthorumkhrah too uses shared or community
toilets. A very large proportion of the population has access to private toilets only in
Nongthymmai. In the urban agglomeration as a whole nearly a third of all households
has to depend on community or shared toilets.
Table: 16
Percentage Distribution of Sanitation Types by Town Town’s Name Private
Toilet
Shared or Community
Toilet
No
Toilet
Facility
Total
Respondents
1. Shillong (M) 68.6 30.2 1.2 1698
2. Mawlai (CT) 55.5 43.4 1.1 463
3. Nongthymmai (CT) 85.3 13.7 1.0 483
4. Pynthorumkhrah (CT) 50.0 49.7 0.3 300
5. Shillong Cantt. (CB) 32.8 50.0 17.2 64
6. Madanrting (CT) 62.8 35.8 1.4 218
7. Nongmynsong (CT) 36.5 57.7 5.8 156
Shillong UA 65.0 33.4 1.6 3382 Source: Field Survey, 2005
Table-17 provides the data on access to improved sanitation facilities in seven
towns for Shillong Urban Agglomeration. Good sanitation facilities refer to those
technologies that are likely to provide adequate sanitation; foe example, hygienically
separate human excreta from human contact.
Overall, 82 percent of households in Shillong have access to flush toilet with
sewage system compared to Urban India’s record of only 23 per cent. The proportion
of households having other improved toilet facilities is only 9 percent and over 9
percent of households have no access to improved sanitation. It means nearly one out
of every ten households is still deprived of access to improved sanitation facilities.
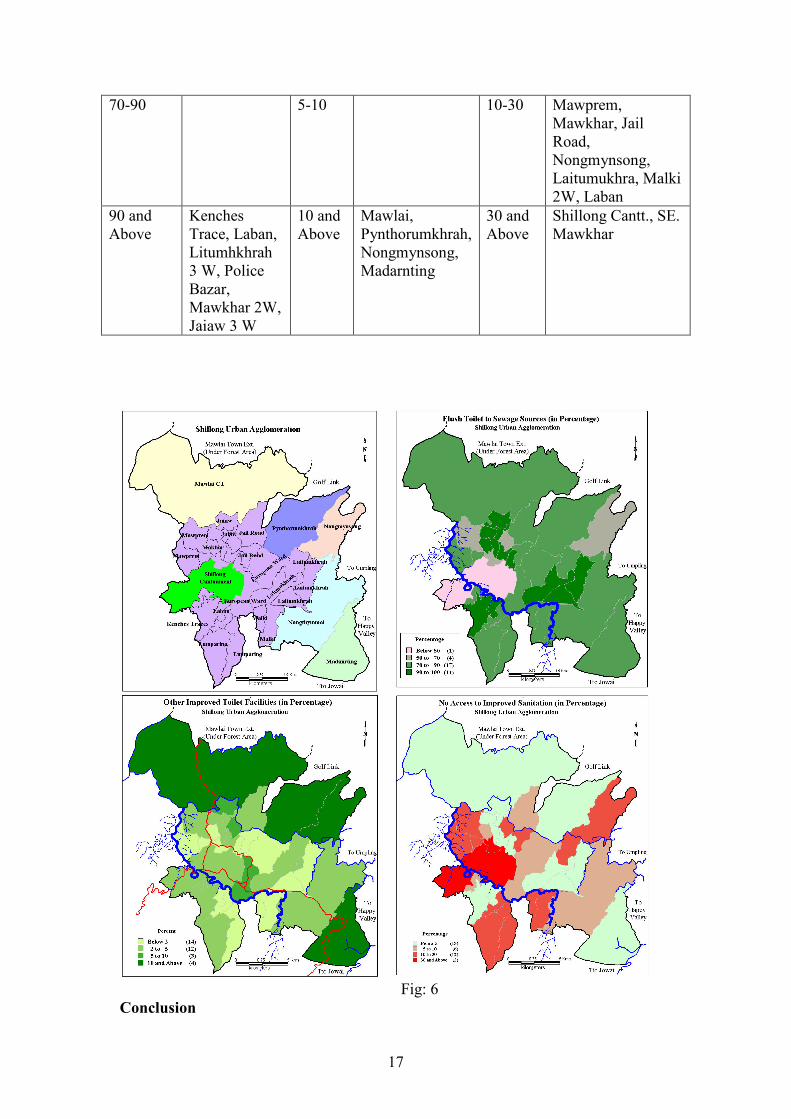
The inequalities are highly prominent among the towns. Access to improved
sanitation as measured by toilet facility and its types reveals wide variation as the data
is scrutinized at lower spatial level i.e. for different wards included in the towns of the
urban agglomeration. As many as 6 out of 33 wards have over 20 percent households
without access to improved sanitation facility (table-18).
Table: 17
Percentage Distribution of Households with Access to Improve Sanitation Town’s Name Flush Toilet
to Sewage
Sources4
Other
Improved Toilet
facilities 5
No Access
to Improved
sanitation6
Total
Number of
Respondent
1. Shillong Municipality 86.2 2.2 11.7 1698
2. Mawlai CT2 74.3 22.7 3.0 463
3. Nongthymmai 89.4 3.9 6.6 483
4. Pynthorumkhrah 75.0 22.3 2.3 300
5. Shillong Cantonment 45.3 3.1 51.6 64
6. Madanrting 87.2 11.9 0.9 218
7. Nongmynsong 60.3 24.4 15.4 156
Shillong UA 82.1 8.7 9.2 3382
India (Urban)* 22.9 39.6 37.5 2728
Note:
4. Flush to piped sewage System, flush to septic tank etc.
5. Pour flush latrine, covered dry latrine etc
6. Unprotected dry latrine, bucket latrine, no facilities, other etc
* World Health Survey, 2003, India, WHO-India-WR Office, New Delhi, 2006, P-50.

16
Table: 18
Percentage Distribution of Households with Access to Improve Sanitation Name of the Ward/town Flush
Toilet to
Sewage
Sources4
Other Improved
Toilet facilities 5
No Access to
Improved
sanitation6
Total Number of
Respondent
1. Laitmukhrah 95.9 0.0 4.1 146
2. Laitmukhrah2 84.2 3.5 12.3 57
3. Laitmukhrah3 94.2 2.3 3.5 86
4. Laitmukhrah4 95.6 0.0 4.4 45
5. Malki1 87.2 0.0 12.8 78
6. Malki2 82.7 0.0 17.3 52
7. European Ward 85.3 8.0 6.7 75
8. European Ward2 89.7 1.7 8.6 58
9. Police Bazar 96.0 0.0 4.0 25
10. Jail Road1 89.1 0.0 10.9 55
11. Jail Road2 88.0 4.0 8.0 25
12. Mawkhar1 93.6 2.1 4.3 47
13. Mawkhar2 65.1 9.5 25.4 63
14. Jaiaw1 95.2 2.4 2.4 42
15. Jaiaw2 95.0 5.0 0.0 40
16. Jaiaw3 97.5 2.5 0.0 79
17. S.E. Mawkhar 59.5 0.0 40.5 42
18. Makhar 91.3 0.0 8.7 46
19. Mawprem 87.9 0.0 12.1 33
20. Mawprem2 69.8 3.4 26.7 116
21. Mawprem3 75.2 1.0 23.8 105
22. Kenhes Traces1 89.7 3.4 6.9 29
23. Kenhes Traces2 94.8 2.1 3.1 96
24. Laban1 100.0 0.0 0.0 35
25. Laban2 82.7 1.2 16.0 81
26. Lumparing1 79.0 1.2 19.8 81
27. Lumparing2 82.0 4.9 13.1 61
28. Mawlai 74.3 22.7 3.0 463
29. Nongthymmai 89.4 3.9 6.6 483
30. Shillong Cant 45.3 3.1 51.6 64
31. Madanrting 87.2 11.9 0.9 218
32. Pynthorumkhrah 75.0 22.3 2.7 300
33. Nongmynsong 60.3 24.4 15.4 156
Shillong UA 82.1 8.7 9.2 3382
Source: Field Survey, 2005
Table-19
Flush Toilet to
Sewage Sources4
Other Improved
Toilet facilities 5
No Access to Improved
sanitation6
Range
(Percent)
No. of Ward
& Name
Range No. of Ward &
Name
Range No. of Ward &
Name
Below 50 Shillong
Cantonment
Below
2
Below
5
50-70 Nongmynsong 2-5 5- 10
17
70-90 5-10 10-30 Mawprem,
Mawkhar, Jail
Road,
Nongmynsong,
Laitumukhra, Malki
2W, Laban
90 and
Above
Kenches
Trace, Laban,
Litumhkhrah
3 W, Police
Bazar,
Mawkhar 2W,
Jaiaw 3 W
10 and
Above
Mawlai,
Pynthorumkhrah,
Nongmynsong,
Madarnting
30 and
Above
Shillong Cantt., SE.
Mawkhar
Fig: 6
Conclusion

18
The overall picture that emerges from the study is that the city needs a better
water management system to meet growing demands for water both in terms of
quantity and quality. Public distribution system of water is not only inadequate but
also inefficient to such an extent that a very large section of the people have to fend
for themselves to meet their water requirement at great costs both financially and in
terms of time.
Locational factors emerge as a great constraining factor-a fact common to
many hilly and mountainous terrain. Efforts are needed for a more realistic urban
planning keeping in mind availability of water in deciding expansion of the city for
residential purposes. A good urban land use map is an urgent need which should
provide guidelines for future development of the city based on the factor of water
availability. The situation calls for a more scientific understanding of the geological
setting of the urban area and its hinterland identifying potential areas for tapping of
water resources. The current expansion of the agglomeration seems to have taken no
notice of these factors and hence may create even worse conditions of water shortage
which even better water management may not be able to ameliorate. Situation with
regard to sanitation however is satisfactory barring a few areas. The implications of
these findings need to be viewed seriously by policy makers. If people are to prosper,
more secure and low cost water supplies are needed.
Reference:
WHO/UNICEF (World Health Organization/ United Nation Children’s Fund), Water
for Life Making it Happen, Geneva, 2005.
The United Nations World Water Development Report, Water for People Water for
Life, UNESCO Publishing, 2003. Soft copy: www.unesco.org/water/wwap
UNFPA (United Nations Population Fund), 2002 The State of World Population,
2001, New York.
WSSCC (Water Supply and Sanitation Collaborative Council), Vision 21: Water for
People- A Shared Vision for Hygiene, Sanitation and Water Supply A framework for
Action, Geneva, 2000.
WHO Manual, 2003: World Health Survey-Data Analysis and Report Writing
Guidelines, Geneva.