Embed Size (px)
Citation preview
J Intell Manuf (2006) 17:597–607DOI 10.1007/s10845-006-0023-3
A general simulator approach to ETC toll traffic congestion
Teruaki Ito · Tomoyuki Hiramoto
Received May 2005 / Revised: January 2006© Springer Science+Business Media, LLC 2006
Abstract This study proposes a process simulation-based approach using a general simulator to offersolutions for Electronic Toll Collection System (ETC)traffic expressway problems at toll plazas. First, the paperdescribes an overview of the ETC system in generalaround the world as well as in Japan, and clarifies theETC traffic problems that occur on Japanese express-ways and hinder the diffusion of the ETC system inJapan. Then the paper describes our approach of pro-cess simulation to this issue, using a general simulator toshow how the basic model in this study has been built andhow its internal procedures are defined. The basic modelhas been reviewed by a mathematical approach withresults shown in the following section. Into this basicmodel, we applied some actual traffic data obtained fromone of the ETC I.C. sites. By using ETC traffic simula-tions, this study verifies the feasibility of the model. Thispaper proposes two kinds of solutions to the ETC trafficissue. One solution is gate management, which coordi-nates ETC/general switching to make the best use ofthe gates. The key issue here is how to find the best timefor gate switching. Another solution is layout redesign,which employs an appropriate new layout for toll plazas.The issue here is to design an effective layout to reducetraffic jams. On-site reviews of either solution repre-sent an unrealistic approach. Therefore, this researchutilizes a simulation-based approach to identify these
T. Ito (B)Institute of Technology and Science, The Universityof Tokushima, 2-1 Minami-Josanjima, Tokushima 770-8506,Japane-mail: [email protected]
T. HiramotoGraduate school of Engineering, The University of Tokushima2-1 Minami-Josanjima, Tokushima 770-8506, Japan
solutions. Using the results of simulation, feasibility ofthis approach is discussed.
Keywords General simulator · Process simulation ·Electronic toll collection system (ETC) · Expresswaytoll plaza · Traffic jams · Gate management ·Toll plaza layout design
Introduction
The problem of traffic congestions has become one ofthe major critical issues around the world. In Japan,traffic problems are very critical, and require effectivesolutions. The idea of the Intelligent Transportation Sys-tem (ITS) has been proposed for future transportationsystems in Japan, and the ETC system was designedand became available as a critical part of ITS. However,the ETC system is still in its initial stage and needs muchmore consideration to provide actual effective solutions.
Historical overview of ETC systems
The Electronic Toll Collection (ETC) system was startedat Tokyo Metropolitan Expressway in 2001, which wasthe beginning of ETC systems in Japan. Since then,the number of toll plazas equipped with ETC gateshas increased gradually and steadily, and some havebeen updated as well. By the end of fiscal year 2003,ETC gates have been available at 1,300 expresswaystoll plazas around the country. As a part of the Intel-ligent Transportation System (ITS) in Japan, the ETCsystem is expected to provide several great advantages,including improvement of the usability of expressways
598 J Intell Manuf (2006) 17:597–607
for vehicle drivers, effective reduction of traffic jams,solutions to environmental issues such as air pollutionand noise pollution, crucial technologies to take advan-tage of integrated toll collection systems, and impor-tant infrastructures at smart intersections to enhanceregional activities.
The advantages of the ETC system are not only appli-cable to Japan, but also to many other countries as well.When we look at the world outside of Japan, more than30 countries have already designed or introduced a cer-tain kind of electrical toll collection system to collectflat fees. In Europe, the ETC system was started first inNorway in 1987, followed by Italy, France, Spain, andPortugal in the 1990s. Even Germany, which is famousfor its free expressway network called “Autobahn”, con-ducted some experimental trials of the ETC systembetween 1994 and 1995 to collect flat fees from largevehicles. In the US, the ETC system called E-ZPass wasfirst introduced in Texas in 1989 and has been intro-duced nationwide known as different names such as“Fast Lane” in Massachusetts or “Smart Tag” in Vir-ginia. Now, most of the toll ways in the US are equippedwith the ETC system. In the New York area, more than70% of vehicles in commuting hours are enjoying thebenefit of the ETC system, eliminating the traffic jams.Canada and Mexico are also introducing the similarETC systems. In Asian countries, the ETC system wasintroduced in Hong Kong in 1993, followed by Malaysiain 1995. Thus, the ETC systems have been popular inmany countries, providing advantageous transportationfeatures.
ETC system complications
In contrast to the ETC systems in these countries, that ofJapan is quite different in one respect. In most countries,the toll fee is flat, which makes the payment very simple.Even though some drivers do not have correct change,the payment procedure of the flat fee is much simplerand less time consuming compared to the non-flat tollfee payment in Japan. This non-flat toll fee is calculatedbased on the distance of travel, which means that the tollfee can be calculated only at the gate where the driversexit the expressways. To do so, drivers receive a tokenticket at the entrance of expressways, and pay the tollfees at the exit. These fees are automatically calculatedby the token ticket at the exit, but the amount of changesis up to the individual drivers. The Japanese highway sys-tem’s toll fees payment is much more time-consumingtask than the flat toll fee payment because drivers mayneed additional time to find token tickets somewherein their pocket. Also the gate staff may need additionaltime to count the change. As a result, traffic jams often
occur at toll plazas, which is one of the major reasonsfor expressway traffic jams.
Under these circumstances, the ETC system was pro-posed to reduce time in toll fee payments and to solvethe expressway traffic jam problems. Because of the non-flat fee of toll payments, design and implementation ofthe ETC system of Japan is quite complicated and diffi-cult, and requires new infrastructures, including ETCtoll gates in every I.C., ETC equipment for each vehicle,and a ETC credit payment system, all of which need tobe integrated so that the whole system works in a verytimely manner. To provide equal highway services toboth the ETC vehicles and the non-ETC vehicles, theexisting infrastructures should also be fully used in anoptimal manner. Therefore, the year 2003 was an historictime as ETC toll booths were installed in all the I.C. ofexpressways in Japan. In spite of these strenuous efforts,however, the efficiency of the ETC system has not beenfully realized because, in some cases, ETC vehicles con-front heavy toll plazas traffic jams. Therefore, effectivecounter measures to take advantage of the ETC systemare strongly required.
Research overview
In theory, the ETC system can reduce toll plaza trafficjams, which should work as an effective countermeasureto expressway congestions. In practice, however, it doesnot work in such a way so far. This section clarifies thereal issue and describes the research approach presentedin this paper.
The ETC solution to expressway traffic jams and itsproblem
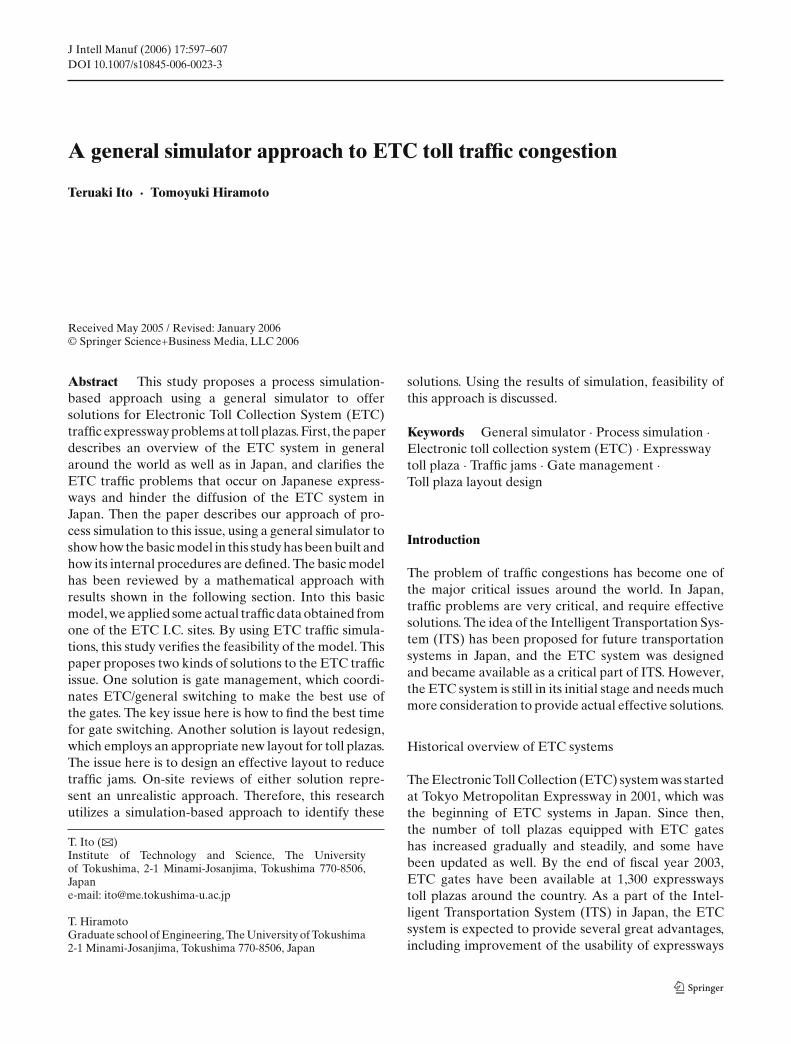
Expressway traffic jams occur for several reasons, includ-ing because of toll gates, slopes, junctions, tunnels, con-structions, narrow of lanes, etc. The conventional tollcollection procedure at toll gates is one of the majorproblems. According to the survey of the Japan High-way Corporation (JH), 30% of expressway traffic jamsoccur around the toll plazas as shown in Fig. 1. Thismeans that the use of the non-stop toll payment pro-cedure could theoretically effectively eliminate express-way traffic jams. However, the reality is often differentfrom what has been expected during the infrastructuresetup efforts.
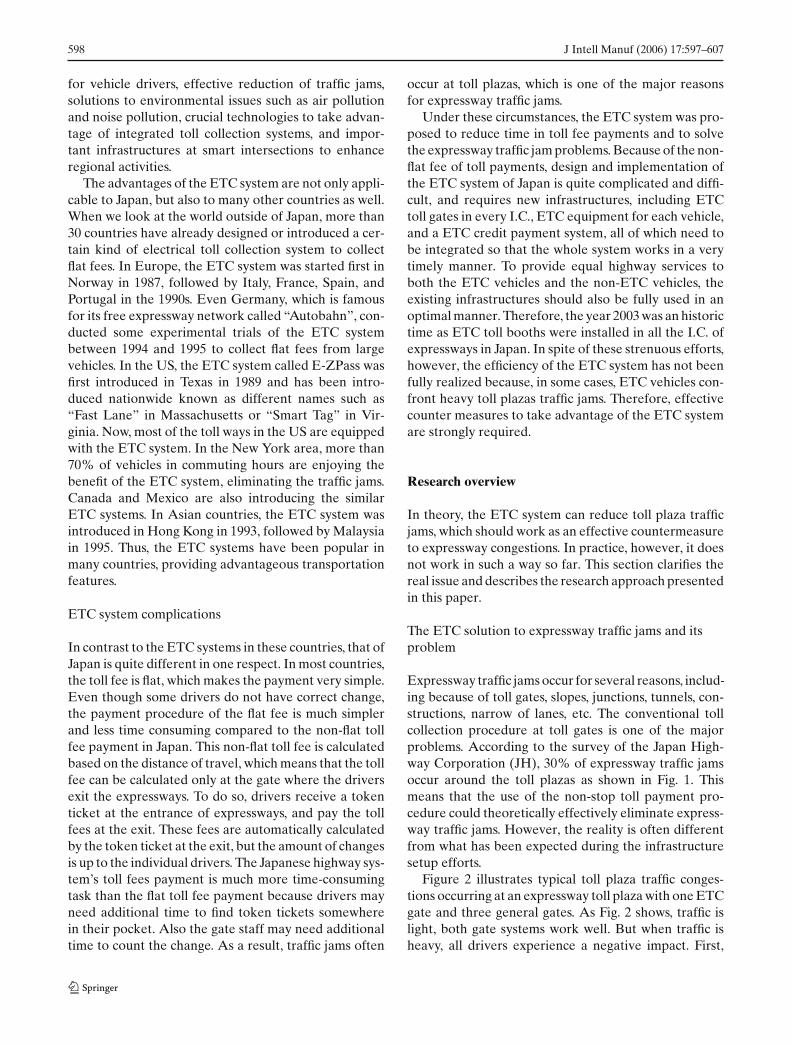
Figure 2 illustrates typical toll plaza traffic conges-tions occurring at an expressway toll plaza with one ETCgate and three general gates. As Fig. 2 shows, traffic islight, both gate systems work well. But when traffic isheavy, all drivers experience a negative impact. First,
J Intell Manuf (2006) 17:597–607 599
30%
29%17%
10%
3%
2%
9%
Toll gate
An uphill or adownward slopeJunction(IC)
Tunnel entrance
Junction(SA,PA)
Reduction oflaneothers
Fig. 1 Traffic jam sites occurring on expressways
Fig. 2 Above, low traffic condition at ETC gate; below, high trafficcondition with congestion around the toll plaza
because the non-stop system is only available to ETCdrivers, it can become relatively congested. Secondly,because the number of non-ETC toll booths has beenreduced as the result of the introduction of the ETCgates, non-ETC drivers experience longer delays.
As a result, the overall total travel time for bothETC and non-ETC vehicles around toll plazas actuallybecome longer by the introduction of the ETC system.The system’s success depends upon the cooperation ofits users. But the congestion occurring at expresswaytoll gates sometimes discourages drivers to start usingthe ETC system.
Obstacles to penetrate the ETC systems in Japan
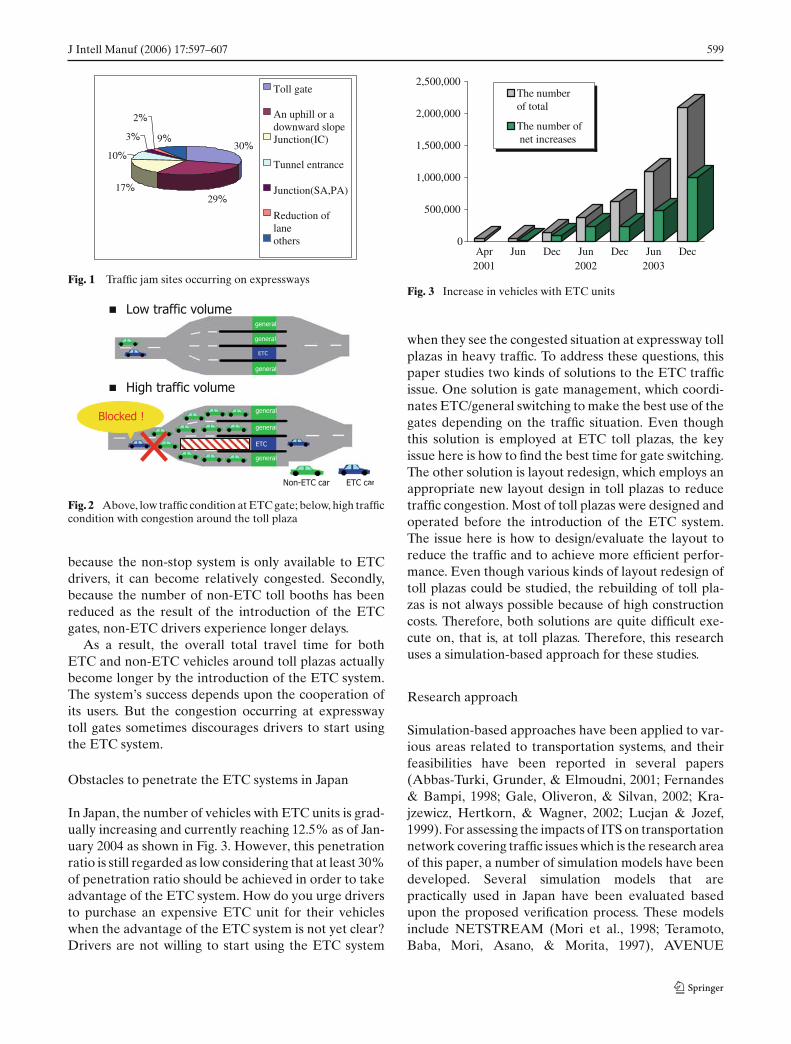
In Japan, the number of vehicles with ETC units is grad-ually increasing and currently reaching 12.5% as of Jan-uary 2004 as shown in Fig. 3. However, this penetrationratio is still regarded as low considering that at least 30%of penetration ratio should be achieved in order to takeadvantage of the ETC system. How do you urge driversto purchase an expensive ETC unit for their vehicleswhen the advantage of the ETC system is not yet clear?Drivers are not willing to start using the ETC system
0
500,000
1,000,000
1,500,000
2,000,000
2,500,000
Apr2001
Jun Dec Jun2002
Dec Jun2003
Dec
The numberof total
The number of net increases
Fig. 3 Increase in vehicles with ETC units
when they see the congested situation at expressway tollplazas in heavy traffic. To address these questions, thispaper studies two kinds of solutions to the ETC trafficissue. One solution is gate management, which coordi-nates ETC/general switching to make the best use of thegates depending on the traffic situation. Even thoughthis solution is employed at ETC toll plazas, the keyissue here is how to find the best time for gate switching.The other solution is layout redesign, which employs anappropriate new layout design in toll plazas to reducetraffic congestion. Most of toll plazas were designed andoperated before the introduction of the ETC system.The issue here is how to design/evaluate the layout toreduce the traffic and to achieve more efficient perfor-mance. Even though various kinds of layout redesign oftoll plazas could be studied, the rebuilding of toll pla-zas is not always possible because of high constructioncosts. Therefore, both solutions are quite difficult exe-cute on, that is, at toll plazas. Therefore, this researchuses a simulation-based approach for these studies.
Research approach
Simulation-based approaches have been applied to var-ious areas related to transportation systems, and theirfeasibilities have been reported in several papers(Abbas-Turki, Grunder, & Elmoudni, 2001; Fernandes& Bampi, 1998; Gale, Oliveron, & Silvan, 2002; Kra-jzewicz, Hertkorn, & Wagner, 2002; Lucjan & Jozef,1999). For assessing the impacts of ITS on transportationnetwork covering traffic issues which is the research areaof this paper, a number of simulation models have beendeveloped. Several simulation models that arepractically used in Japan have been evaluated basedupon the proposed verification process. These modelsinclude NETSTREAM (Mori et al., 1998; Teramoto,Baba, Mori, Asano, & Morita, 1997), AVENUE
600 J Intell Manuf (2006) 17:597–607
(Horiguchi, Katakura, Akahane, & Kuwahara, 1994;Horiguchi, Kuwahara, & Nishikawa 1995), SOUND(Tamamoto et al., 2004; Yoshii & Kuwahara, 1995),tiss-NET (Kubota, Nakajima, Monji, & Sakamoto, 1995;tiss-NET, 2005). All of these models have been devel-oped by the strenuous efforts to achieve the high qualityand to perform the accurate simulation.
This study does not focus on the accuracy of sim-ulation itself, but rather, focuses on how we can use asimulation-based approach to ETC traffic problems.Therefore, our simulation-based analysis is based ona general simulator called Arena, which is commonlyused for various simulation applications, including man-ufacturing, logistics, supply-chain, business process, etc.Based on the simulation-based analysis of traffic jams attoll plazas with ETC gates (Ito, 2004; Ito & Hiramoto,2004), this study focuses on these two issues to considercountermeasures to fully utilize the advantages of theETC system.
Process simulation model by a generalsimulator—ARENA
This study employs a general simulator called “Arena”,which has been widely used in various application areas,including: manufacturing, logistics, supply-chains, andbusiness models (Kelton, Sabowski, & Sabowski, 1998).This section describes how the process simulation modelwas designed and built in this research, and also showshow its internal process works to simulate traffic jams atexpressway toll plazas with ETC gates.
Using the basic modules of ARENA, the toll paymentprocedures of vehicles were defined by basic six proce-dures, including (i) entity generation, (ii) lane selection,(iii) travel time, (iv) gate selection, (v) toll collectionand (vi) entity termination. This section covers the allof these six modules, followed by the overview of thebasic simulation model used in this research. Additionalinformation is available in (Ito, 2005a).
Entity generation
Simulation is initiated by the entity generation, or thegeneration of vehicles to toll gate. An arbitrary tollbooth is the merging point into which the generatedentities should flow under the simulated condition. Fourclasses of entities are defined as small vehicles with/with-out ETC and large vehicles with/without ETC. Therequired time to go through the toll booth is dependentupon the entity classes, which is also set as parameters.
Lane selection
Vehicles take one of the available lanes if there is morethan one lane. The selection is based on the left-handtraffic, which means that vehicles have a tendency toselect the most outer lane. Vehicles basically take thelane in the shortest queue when there are traffics. Con-sidering these facts, the selection of each vehicle iscalculated based on the probability distribution.
Travel time
The travel time from the entity generation point to thetoll gate point is calculated by addition of the followingtwo processes. The first process covers from the entitygeneration point to the merging point where the entitymerges to the waiting queue. The second process cov-ers from the end of the first process to the point wherethe toll payment is finished by the entity. If there is notraffic in the driving lane, these two processes are calcu-lated as a single process. The travel time is defined as inScheme 1.
Td = {L − (Ls − Lt)}VC
+ LS
VS(Scheme 1)
where Td is the travel time [s]; L is the distance fromentity generation to the booth gate; Ls is the distancefrom the merging point to the booth gate; Lt is the trafficlength; VC is the average speed and Vs is the averagespeed in the waiting queue.
Gate selection
The gate selection of each entity is calculated based onthe probability distribution in the same way as the laneselection. ETC vehicles use any gate but non-ETC vehi-cles do not use ETC gates. Therefore, each entity is pro-cessed by one of the subroutines which meet the entityclass.
Toll payment
When entities reach to the toll gates, they stay thereduring the toll payment time and will be released aftera certain time interval. The stay time is defined in theclass definition of entities.
Entity termination
After the vehicles go through the gates, the entities rep-resenting the vehicles are removed from the process. Allof the statistical data calculated during the simulationare recorded at this point.
J Intell Manuf (2006) 17:597–607 601
A
BQueue.i
Queue.j
General General General ETC
C
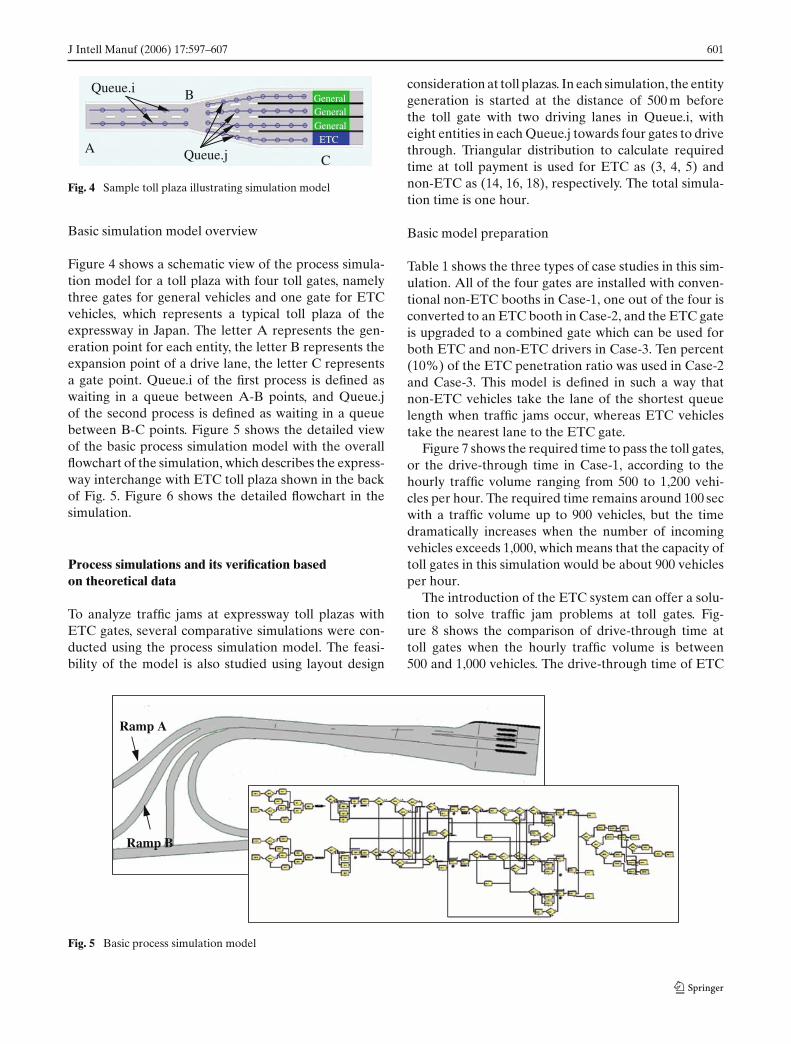
Fig. 4 Sample toll plaza illustrating simulation model
Basic simulation model overview
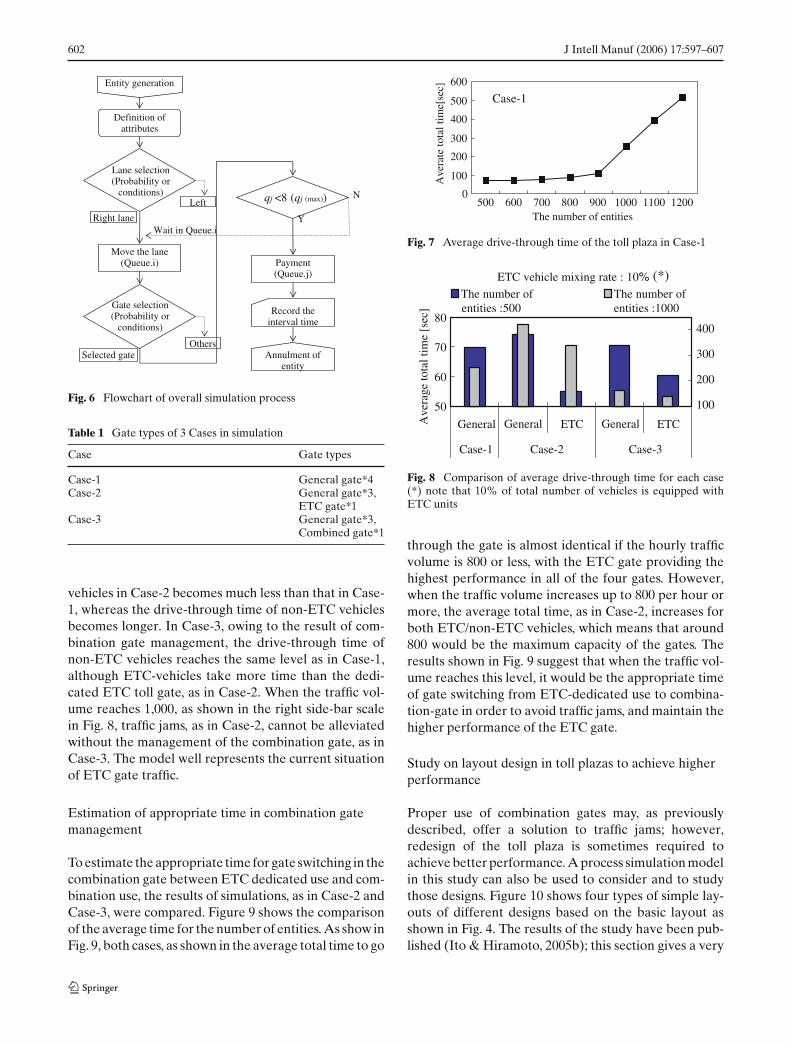
Figure 4 shows a schematic view of the process simula-tion model for a toll plaza with four toll gates, namelythree gates for general vehicles and one gate for ETCvehicles, which represents a typical toll plaza of theexpressway in Japan. The letter A represents the gen-eration point for each entity, the letter B represents theexpansion point of a drive lane, the letter C representsa gate point. Queue.i of the first process is defined aswaiting in a queue between A-B points, and Queue.jof the second process is defined as waiting in a queuebetween B-C points. Figure 5 shows the detailed viewof the basic process simulation model with the overallflowchart of the simulation, which describes the express-way interchange with ETC toll plaza shown in the backof Fig. 5. Figure 6 shows the detailed flowchart in thesimulation.
Process simulations and its verification basedon theoretical data
To analyze traffic jams at expressway toll plazas withETC gates, several comparative simulations were con-ducted using the process simulation model. The feasi-bility of the model is also studied using layout design
consideration at toll plazas. In each simulation, the entitygeneration is started at the distance of 500 m beforethe toll gate with two driving lanes in Queue.i, witheight entities in each Queue.j towards four gates to drivethrough. Triangular distribution to calculate requiredtime at toll payment is used for ETC as (3, 4, 5) andnon-ETC as (14, 16, 18), respectively. The total simula-tion time is one hour.
Basic model preparation
Table 1 shows the three types of case studies in this sim-ulation. All of the four gates are installed with conven-tional non-ETC booths in Case-1, one out of the four isconverted to an ETC booth in Case-2, and the ETC gateis upgraded to a combined gate which can be used forboth ETC and non-ETC drivers in Case-3. Ten percent(10%) of the ETC penetration ratio was used in Case-2and Case-3. This model is defined in such a way thatnon-ETC vehicles take the lane of the shortest queuelength when traffic jams occur, whereas ETC vehiclestake the nearest lane to the ETC gate.
Figure 7 shows the required time to pass the toll gates,or the drive-through time in Case-1, according to thehourly traffic volume ranging from 500 to 1,200 vehi-cles per hour. The required time remains around 100 secwith a traffic volume up to 900 vehicles, but the timedramatically increases when the number of incomingvehicles exceeds 1,000, which means that the capacity oftoll gates in this simulation would be about 900 vehiclesper hour.
The introduction of the ETC system can offer a solu-tion to solve traffic jam problems at toll gates. Fig-ure 8 shows the comparison of drive-through time attoll gates when the hourly traffic volume is between500 and 1,000 vehicles. The drive-through time of ETC
Ramp A
Ramp B
Fig. 5 Basic process simulation model
602 J Intell Manuf (2006) 17:597–607
Entity generation
Definition of attributes
Lane selection (Probability or
conditions) N qj <8 (qj (max)) Left
Right lane Y Wait in Queue.i
Move the lane Payment (Queue.j)
(Queue.i)
Gate selection (Probability or
conditions)
Record the interval time
OthersAnnulment of
entitySelected gate
Fig. 6 Flowchart of overall simulation process
Table 1 Gate types of 3 Cases in simulation
Case Gate types
Case-1 General gate*4Case-2 General gate*3,
ETC gate*1Case-3 General gate*3,
Combined gate*1
vehicles in Case-2 becomes much less than that in Case-1, whereas the drive-through time of non-ETC vehiclesbecomes longer. In Case-3, owing to the result of com-bination gate management, the drive-through time ofnon-ETC vehicles reaches the same level as in Case-1,although ETC-vehicles take more time than the dedi-cated ETC toll gate, as in Case-2. When the traffic vol-ume reaches 1,000, as shown in the right side-bar scalein Fig. 8, traffic jams, as in Case-2, cannot be alleviatedwithout the management of the combination gate, as inCase-3. The model well represents the current situationof ETC gate traffic.
Estimation of appropriate time in combination gatemanagement
To estimate the appropriate time for gate switching in thecombination gate between ETC dedicated use and com-bination use, the results of simulations, as in Case-2 andCase-3, were compared. Figure 9 shows the comparisonof the average time for the number of entities. As show inFig. 9, both cases, as shown in the average total time to go
0
100
200
300
400
500
600
500 600 700 800 900 1000 1100 1200The number of entities
Ave
rate
tota
l tim
e[se
c]
Case-1
Fig. 7 Average drive-through time of the toll plaza in Case-1
ETC vehicle mixing rate : 10%
50
60
70
80
General General General ETCETC
Case-1 Case-2 Case-3
Ave
rage
tota
l tim
e [s
ec]
100
200
300
400
The number ofThe number ofentities :1000entities :500
(*)
Fig. 8 Comparison of average drive-through time for each case(*) note that 10% of total number of vehicles is equipped withETC units
through the gate is almost identical if the hourly trafficvolume is 800 or less, with the ETC gate providing thehighest performance in all of the four gates. However,when the traffic volume increases up to 800 per hour ormore, the average total time, as in Case-2, increases forboth ETC/non-ETC vehicles, which means that around800 would be the maximum capacity of the gates. Theresults shown in Fig. 9 suggest that when the traffic vol-ume reaches this level, it would be the appropriate timeof gate switching from ETC-dedicated use to combina-tion-gate in order to avoid traffic jams, and maintain thehigher performance of the ETC gate.
Study on layout design in toll plazas to achieve higherperformance
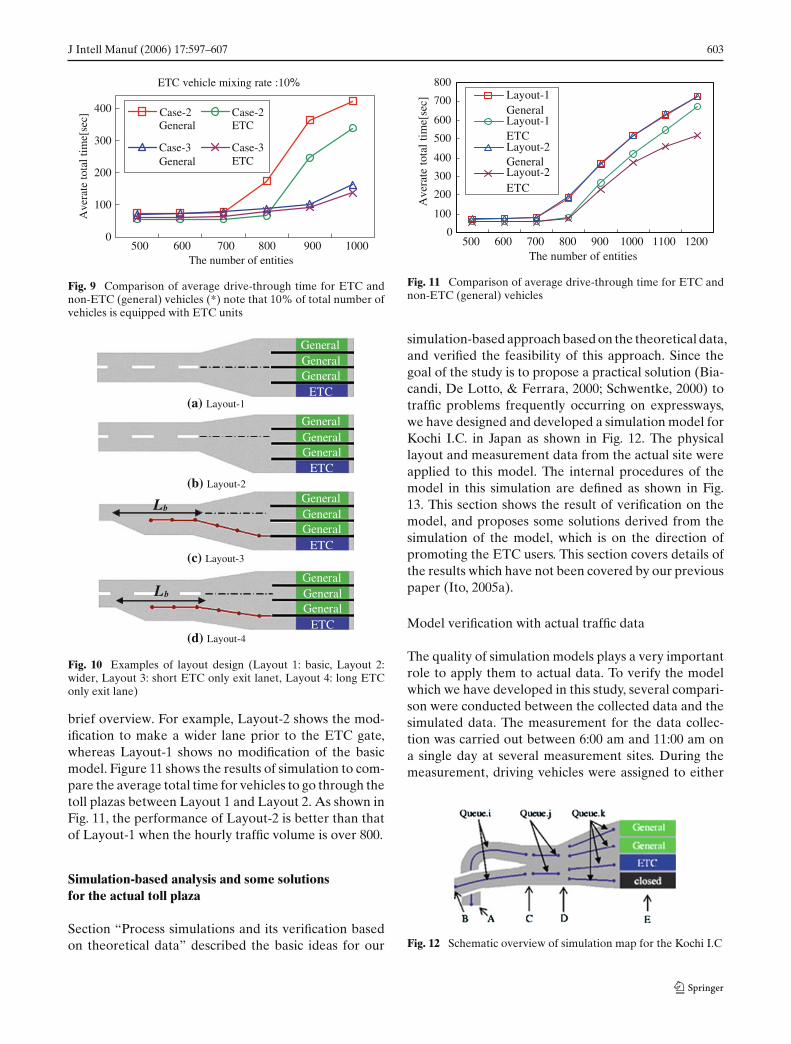
Proper use of combination gates may, as previouslydescribed, offer a solution to traffic jams; however,redesign of the toll plaza is sometimes required toachieve better performance. A process simulation modelin this study can also be used to consider and to studythose designs. Figure 10 shows four types of simple lay-outs of different designs based on the basic layout asshown in Fig. 4. The results of the study have been pub-lished (Ito & Hiramoto, 2005b); this section gives a very
J Intell Manuf (2006) 17:597–607 603
ETC vehicle mixing rate :10%
0
100
200
300
400
500 600 800700 900 1000The number of entities
Ave
rate
tota
l tim
e[se
c]
General
General
ETC
ETCCase-3 Case-3
Case-2Case-2
Fig. 9 Comparison of average drive-through time for ETC andnon-ETC (general) vehicles (*) note that 10% of total number ofvehicles is equipped with ETC units
General General General
ETC
General General General
ETC
General General General
ETC
General General General
ETC
(a) Layout-1
(b) Layout-2
(c) Layout-3
(d) Layout-4
Lb
Lb
Fig. 10 Examples of layout design (Layout 1: basic, Layout 2:wider, Layout 3: short ETC only exit lanet, Layout 4: long ETConly exit lane)
brief overview. For example, Layout-2 shows the mod-ification to make a wider lane prior to the ETC gate,whereas Layout-1 shows no modification of the basicmodel. Figure 11 shows the results of simulation to com-pare the average total time for vehicles to go through thetoll plazas between Layout 1 and Layout 2. As shown inFig. 11, the performance of Layout-2 is better than thatof Layout-1 when the hourly traffic volume is over 800.
Simulation-based analysis and some solutionsfor the actual toll plaza
Section “Process simulations and its verification basedon theoretical data” described the basic ideas for our
0
100
200
300
400
500
600
700
800
500 600 700 800 900 1000 1100 1200The number of entities
Ave
rate
tota
l tim
e[se
c]
Layout-1
Layout-1General
GeneralLayout-2
Layout-2
ETC
ETC
Fig. 11 Comparison of average drive-through time for ETC andnon-ETC (general) vehicles
simulation-based approach based on the theoretical data,and verified the feasibility of this approach. Since thegoal of the study is to propose a practical solution (Bia-candi, De Lotto, & Ferrara, 2000; Schwentke, 2000) totraffic problems frequently occurring on expressways,we have designed and developed a simulation model forKochi I.C. in Japan as shown in Fig. 12. The physicallayout and measurement data from the actual site wereapplied to this model. The internal procedures of themodel in this simulation are defined as shown in Fig.13. This section shows the result of verification on themodel, and proposes some solutions derived from thesimulation of the model, which is on the direction ofpromoting the ETC users. This section covers details ofthe results which have not been covered by our previouspaper (Ito, 2005a).
Model verification with actual traffic data
The quality of simulation models plays a very importantrole to apply them to actual data. To verify the modelwhich we have developed in this study, several compari-son were conducted between the collected data and thesimulated data. The measurement for the data collec-tion was carried out between 6:00 am and 11:00 am ona single day at several measurement sites. During themeasurement, driving vehicles were assigned to either
Fig. 12 Schematic overview of simulation map for the Kochi I.C
604 J Intell Manuf (2006) 17:597–607
Fig. 13 Flowchart of processsimulation
Entity generation
Wait at the ramp
Select a laneRRaammpp
RRaammpp Left lane
Right lane
General vehicle Select a gate type
ETC vehicle
Form a queue ?Form a queue ?
General lane General laneETC lane General lane
Annulmentof entity
0
10
20
30
40
50
6:00 11:00Time
Ent
ities
arr
ival
s on
Ram
p A
and
B
Ramp A(Large-sizecar)Ramp A(Small-sizecar)Ramp B(Large-sizecar)
car)Ramp B(Small-size
Fig. 14 The number of arrivals to the ETC gate from Ramps Aand B
the small category or the large category with or withoutETC equipment. Figure 14 shows the measured data ofentities which arrived at the Kochi I.C. toll gate eitherfrom the Ramp A or from the Ramp B direction.
Even though the most of the parameters in the modelwere calculated based on the measured data, some datacould not be measured. For example, the probabilisticratio of gate selection was calculated from the boothrecords, but the ratio of lane selection of vehicles beforethe toll plazas were not measured. However, this ratio isrequired to define the parameters in the model. There-fore, the ratio was empirically defined and determinedwith the sensitivity analysis. Figure 15 shows the vari-able parameters with sensitivity analysis of traffic flow.
Fig. 15 Variable parameters with sensitivity analysis of traffic flow
Considering various combination of these parameters,the default parameters were determined.
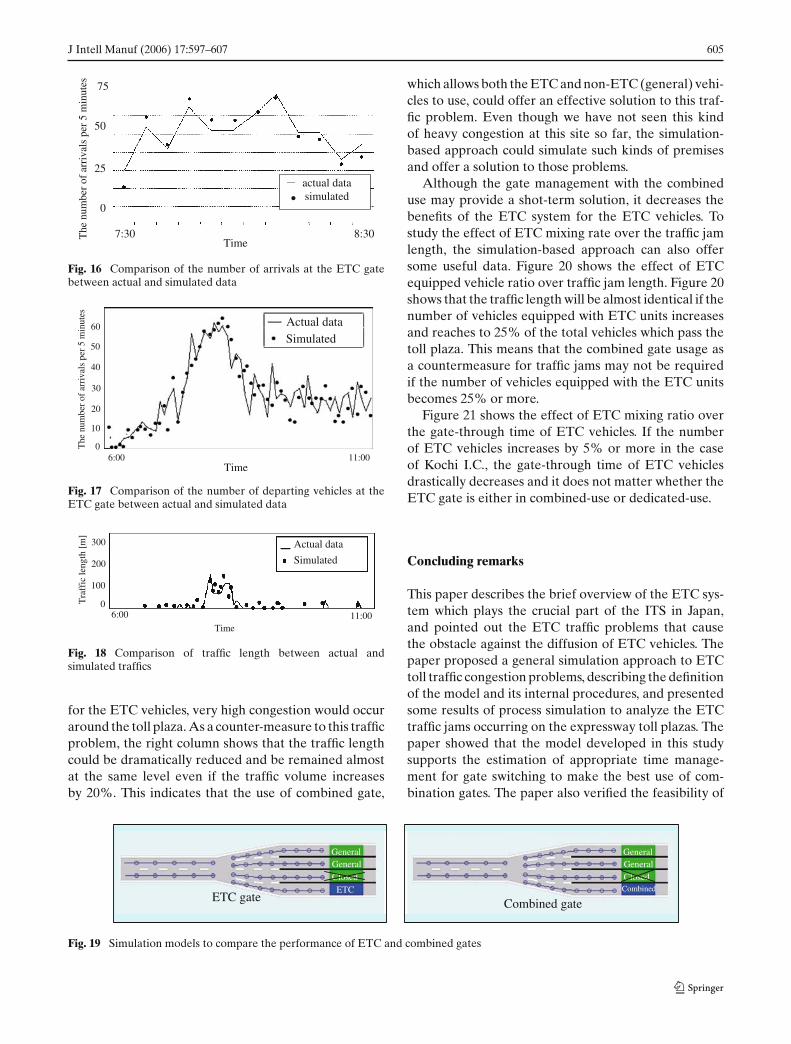
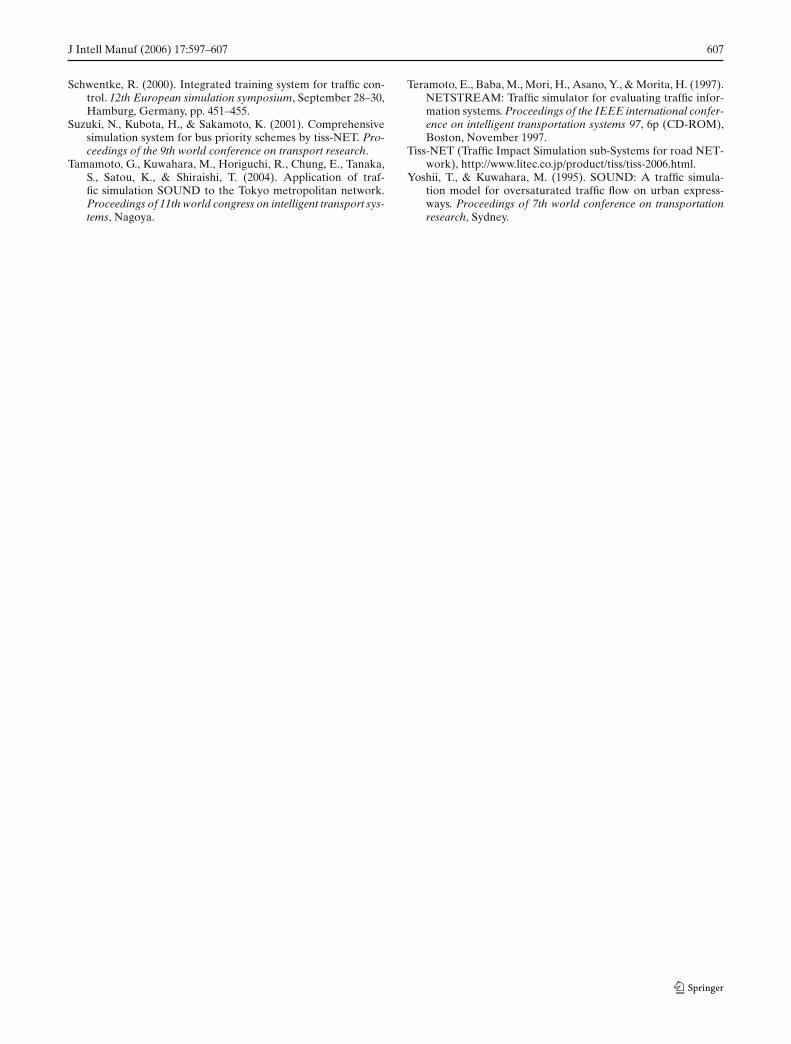
Figure 16 shows the comparison between the mea-sured data and the simulated data for in-coming vehi-cles, and Fig. 17 shows that for out-going vehicles. Bothof these figures show almost identical results. Figure 18shows another comparison between the measured dataand the simulated data for the occurrence of traffic jamsin terms of time and length, and presents almost iden-tical result. According to the results of these compari-sons, the simulation model in this case study shows goodreproducibility.
Solution for actual toll plaza
This section presents some practical solutions which thesimulation model can offer to the traffic jams occurringat Kochi I.C. Figure 19 shows the two simulation mod-els to compare the performance of ETC and combinedgates. Table 2 shows the projection of simulation usingthese two models. The middle column of the Table 2shows that the traffic of 200 vehicles length will reach800 vehicles length if the traffic volume increases by20%. This indicates that if this ETC gate were used only
J Intell Manuf (2006) 17:597–607 605
The
num
ber
of a
rriv
als
per
5 m
inut
es
75
50
25 actual data
simulated0
7:30 8:30Time
Fig. 16 Comparison of the number of arrivals at the ETC gatebetween actual and simulated data
Fig. 17 Comparison of the number of departing vehicles at theETC gate between actual and simulated data
Tra
ffic
leng
th [
m]
Actual data
Simulated
6:00 11:00Time
0
100
200
300
Fig. 18 Comparison of traffic length between actual andsimulated traffics
for the ETC vehicles, very high congestion would occuraround the toll plaza. As a counter-measure to this trafficproblem, the right column shows that the traffic lengthcould be dramatically reduced and be remained almostat the same level even if the traffic volume increasesby 20%. This indicates that the use of combined gate,
which allows both the ETC and non-ETC (general) vehi-cles to use, could offer an effective solution to this traf-fic problem. Even though we have not seen this kindof heavy congestion at this site so far, the simulation-based approach could simulate such kinds of premisesand offer a solution to those problems.
Although the gate management with the combineduse may provide a shot-term solution, it decreases thebenefits of the ETC system for the ETC vehicles. Tostudy the effect of ETC mixing rate over the traffic jamlength, the simulation-based approach can also offersome useful data. Figure 20 shows the effect of ETCequipped vehicle ratio over traffic jam length. Figure 20shows that the traffic length will be almost identical if thenumber of vehicles equipped with ETC units increasesand reaches to 25% of the total vehicles which pass thetoll plaza. This means that the combined gate usage asa countermeasure for traffic jams may not be requiredif the number of vehicles equipped with the ETC unitsbecomes 25% or more.
Figure 21 shows the effect of ETC mixing ratio overthe gate-through time of ETC vehicles. If the numberof ETC vehicles increases by 5% or more in the caseof Kochi I.C., the gate-through time of ETC vehiclesdrastically decreases and it does not matter whether theETC gate is either in combined-use or dedicated-use.
Concluding remarks
This paper describes the brief overview of the ETC sys-tem which plays the crucial part of the ITS in Japan,and pointed out the ETC traffic problems that causethe obstacle against the diffusion of ETC vehicles. Thepaper proposed a general simulation approach to ETCtoll traffic congestion problems, describing the definitionof the model and its internal procedures, and presentedsome results of process simulation to analyze the ETCtraffic jams occurring on the expressway toll plazas. Thepaper showed that the model developed in this studysupports the estimation of appropriate time manage-ment for gate switching to make the best use of com-bination gates. The paper also verified the feasibility of
ETC gate
General General ClosedETC
Combined gate
General General ClosedCombined
Fig. 19 Simulation models to compare the performance of ETC and combined gates

606 J Intell Manuf (2006) 17:597–607
Table 2 Comparison of traffics between ETC and combined gatesunder different traffic volumes
Gate type ETC gate Combined gateProjected (m) (m)Increase oftraffic volume
0 (%) 200 2510 (%) 210 2820 (%) 800 35
0
50
100
150
200
0% 5% 10% 15% 20% 25%Ratio of ETC equipped vehicles [%]
Tra
ffic
jam
leng
th [
m]
Using ETC gate
Using Combineduse gate
Fig. 20 Effect of ETC equipped vehicle ratio (*) over traffic jamlength (*) ETC equipped vehicle ratio: The number of vehiclesequipped with ETC units over the total number of vehicles passingthrough the ETC gates
0
50
100
150
200
250
300
350
400
0% 5% 10% 15% 20% 25%Ratio of ETC equpped vehicles [%]
Max
imum
tota
l tim
e of
ET
C
vehi
cles
[sec
]
Using ETC onlygate
Using Combineduse gate
Fig. 21 Effect of ETC equipped vehicle ratio (*) over the gate-through time of ETC vehicles (*) ETC equipped vehicle ratio:The number of vehicles equipped with ETC units over the totalnumber of vehicles passing through the ETC gates
the model for considering layout redesign of toll plazasto achieve better performance. Using the actual dataobtained from one of the expressway I.C. sites, or KochiI.C., this paper showed what the model can do to offerpractical solutions, which could contribute to increasethe number of ETC vehicles.
By conducting more case studies using actual toll pla-zas, we would like to work on further studies to increasethe quality of the model, and to propose further practicalsolutions to contribute to the progress of the ETC sys-tem development.
Acknowledgements The authors would like to thank ShikokuBranch Office of Japan Highway Public Corporation (JH), orNihon Doro Kodan, for their assistance in data collection andfor their valuable advice to our research.
References
Abbas-Turki, A., Grunder, O., & Elmoudni, A. (2001). Simula-tion and optimization of the public transportation connectionsystem. 13th European simulation symposium, October 18–20,Marseille, France, pp. 435–439.
Biancadi, A., De Lotto, R., & Ferrara, A. (2000). Multi-modaltransport simulation tool to solve urban location problems.12th European simulation symposium, September 28–30,Humburg, Germany, pp. 437–442.
Fernandes, R. J., & Bampi, S. (1998). A software environmentto integrate urban traffic simulation tasks. 10th Europeansimulation symposium, October 26–28, Nottingham, UnitedKingdom, pp. 371–377.
Gale, C., & Oliveron, M. J., & Silvan, G. (2002). Simulation toolfor managing a non-automated distribution warehouse. 14 thEuropean Simulation Symposium, October 23–26, Dresden,Germany, pp. 266–270.
Horiguchi, R., Katakura, M., Akahane, H., & Kuwahara, M.(1994). A development of a traffic simulator for urban roadnetworks: AVENUE. Proceedings of vehicle navigation &information systems, Yokohama, pp. 245–250.
Horiguchi, R., Kuwahara, M., & Nishikawa, I. (1995). The modelvalidation of traffic simulation system for urban road net-works: ‘AVENUE’, Proceedings of the second world con-gress on intelligent transport systems’95, Yokohama, Vol. IV,pp. 1977–1982.
Ito, T., & Hiramoto, T. (2004). Process simulation model towardsanalysis of traffic jams around toll gates, Information Technol-ogy Letters, Forum on Information Technology 2004, LO-002.(in Japanese)
Ito, T. (2005a). Process simulation approach to design and eval-uation of toll plaza with etc gates. International Journal ofSimulation, 6(5), 14–21.
Ito, T., & Hiramoto, (2005b). Layout design and its evaluationon ETC toll plaza based on process simulation, Transactionsof Japan Society of Mechanical Engineer, Vol. 71, No. 708,pp. 2593–2598 (in Japanese).
Kelton, W. D., Sadowski, R. P., & Sadowski, D. A. (1998). Simu-lation with arena, WCB/McGraw-Hill.
Krajzewicz, D., Hertkorn, G., & Wagner, P. (2002). An exampleof microscopic car models validation using the open sourcetraffic simulation SUMO. 14th European simulation sympo-sium, October 23–26, Dresden, Germany, pp. 318–322.
Kubota, H., Nakajima, K., Monji, T., & Sakamoto, K. (1995).TISS-NET: Micro-area traffic assignment simulation systemfor traffic impact study. Proceedings of the 4th Internationalconference on computers in urban planning and urban man-agement, Vol. 1, pp. 289–302.
Lucjan, G., & Jozef, O. (1999). Modeling of public transportcommuters flow at urban interchange centers, 11th Europeansimulation symposium, October 26–28, Erlangen, Germany,pp. 217–219.
Mori, H., Kitaoka, H., Baba, M., Tanahashi, I., Teramoto, E.,Nishimura, Y. et al. (1998). Prediction of traffic conditions forthe Nagano Olympic Winter Games Using Traffic Simulator:NETSTREAM. Proceedings of the 1998 IEEE internationalconference on intelligent vehicles, Stuttgart, Vol. 2, pp. 650–654, October 1998.
J Intell Manuf (2006) 17:597–607 607
Schwentke, R. (2000). Integrated training system for traffic con-trol. 12th European simulation symposium, September 28–30,Hamburg, Germany, pp. 451–455.
Suzuki, N., Kubota, H., & Sakamoto, K. (2001). Comprehensivesimulation system for bus priority schemes by tiss-NET. Pro-ceedings of the 9th world conference on transport research.
Tamamoto, G., Kuwahara, M., Horiguchi, R., Chung, E., Tanaka,S., Satou, K., & Shiraishi, T. (2004). Application of traf-fic simulation SOUND to the Tokyo metropolitan network.Proceedings of 11th world congress on intelligent transport sys-tems, Nagoya.
Teramoto, E., Baba, M., Mori, H., Asano, Y., & Morita, H. (1997).NETSTREAM: Traffic simulator for evaluating traffic infor-mation systems. Proceedings of the IEEE international confer-ence on intelligent transportation systems 97, 6p (CD-ROM),Boston, November 1997.
Tiss-NET (Traffic Impact Simulation sub-Systems for road NET-work), http://www.litec.co.jp/product/tiss/tiss-2006.html.
Yoshii, T., & Kuwahara, M. (1995). SOUND: A traffic simula-tion model for oversaturated traffic flow on urban express-ways. Proceedings of 7th world conference on transportationresearch, Sydney.


![CONGESTION CONTROL AND PACKET REORDERING …nghose/thesis.pdf · CONGESTION CONTROL AND PACKET REORDERING FOR MULTIPATH TRANSMISSION CONTROL ... 1.3 NS-3 Network Simulator-3 [6]](https://img.pdfslide.us/doc/110x75/5b27985b7f8b9ac27d8b49ce/congestion-control-and-packet-reordering-nghosethesispdf-congestion-control.jpg)