Embed Size (px)
Citation preview
1
A further step forward in measuring journals' scientific prestige:
The SJR2 indicator
Vicente P. Guerrero-Botea and Félix Moya-Anegón
b.
aUniversity of Extremadura, Department of Information and Communication, Scimago Group, Spain.
bCSIC, CCHS, IPP, Scimago Group Spain.
Abstract
A new size-independent indicator of scientific journal prestige, the SJR2
indicator, is proposed. This indicator takes into account not only the prestige of the
citing scientific journal but also its closeness to the cited journal using the cosine of the
angle between the vectors of the two journals' cocitation profiles. To eliminate the size
effect, the accumulated prestige is divided by the fraction of the journal's citable
documents, thus eliminating the decreasing tendency of this type of indicator and
giving meaning to the scores. Its method of computation is described, and the results
of its implementation on the Scopus 2008 dataset is compared with those of an ad hoc
Journal Impact Factor, JIF(3y), and SNIP, the comparison being made both overall and
within specific scientific areas. All three, the SJR2 indicator, the SNIP indicator and the
JIF distributions, were found to fit well to a logarithmic law. Although the three metrics
were strongly correlated, there were major changes in rank. In addition, the SJR2 was
distributed more equalized than the JIF by Subject Area and almost as equalized as the
SNIP, and better than both at the lower level of Specific Subject Areas. The
incorporation of the cosine increased the values of the flows of prestige between
thematically close journals.
Keywords
SJR2 indicator, academic journals, journal prestige, eigenvector centrality, citation
networks.
2
1. Introduction
It is accepted by the scientific community that neither all scientific documents
nor all journals have the same value1. Instead of each researcher assigning a subjective
value to each journal, there has always been strong interest in determining objective
valuation procedures. In this regard, it is accepted by the scientific community that, in
spite of different motivations (Brooks, 1985), citations constitute recognition of
foregoing work (Moed, 2005).
One of the first generation of journal metrics based on citation counts
developed to evaluate the impact of scholarly journals is the Impact Factor which has
been extensively used for more than 40 years (Garfield, 2006). Nevertheless, different
research fields have different yearly average citation rates (Lundberg, 2007), and this
type of indicator is almost always lower in the areas of Engineering, Social Sciences,
and Humanities (Guerrero et al., 2007; Lancho-Barrantes, Guerrero-Bote & Moya-
Anegón, 2010a, 2010b).
Since neither all documents nor all journals have the same value, a second
generation of indicators emerged with the idea of assigning them different weights.
Rather than an index of popularity, the concept that it was intended to measure was
prestige in the sense of Bonacich (1987) that the most prestigious journal will be the
one that is most cited by journals also of high prestige. The first proposal in this sense
in the field of Information Science was put forward by Pinski & Narin (1976), with a
metric they called "Journal Influence". With the arrival of the PageRank algorithm
(Page et al., 1998) developed by the creators of Google, there have arisen other
metrics such as the Invariant Method for the Measurement of Intellectual Influence
(Palacios-Huerta & Volij, 2004), the Journal Status (Bollen, Rodríguez & van de Sompel,
2006), the Eigenfactor (Bergstrom, 2007), and the Scimago Journal Rank (González-
Pereira, Guerrero-Bote & Moya-Anegón, 2010).
Despite the progress represented by this second generation of indicators, they
have some features that make them ill-suited for journal metrics:
1 Throughout this work, the term "journal" will be used indistinctly to refer to all the source publications
in Scopus database for which the indices were calculated.
3
The scores obtained by scientific journals typically represent their
prestige, or their average prestige per document, but this score only
makes sense in comparison with the scores of other journals.
The scores are normalized by making them sum to a fixed quantity
(usually, unity). The result is that as the number of journals increases
the scores tend to decrease, which can lead to sets of indicators that all
decrease with time. This characteristic complicates the study of the
temporal evolution of scientific journals.
Different scientific areas have different citation habits, and these are
not taken into account in these indices, so that neither are the values
obtained in different areas comparable (Lancho-Barrantes, Guerrero-
Bote & Moya-Anegón, 2010b). Added to this is that there is no
consensus on the classification of scientific journals into different areas
(Janssens et al., 2009).
In the sciences, it has always been accepted that peer review in a field should
be by experts in that same field (Kostoff, 1997). In this same sense, it seems logical to
give more weight to citations from journals of the same or similar fields, since,
although all researchers may use some given scientific study, they do not all have the
same capacity to evaluate it. Even the weighting itself may not be comparable
between different fields.Given this context, in a process of continuing improvement to
find journal metrics that are more precise and more useful, the SJR2 indicator was
designed to weight the citations according to the prestige of the citing journal, also
taking into account the thematic closeness of the citing and the cited journals. The
procedure does not depend on any arbitrary classification of scientific journals, but
uses an objective informetric method based on cocitation. It also avoids the
dependency on the size of the set of journals, and endows the score with a meaning
that other indicators of prestige do not have.
In the following sections, we shall describe the methodological aspects of the
development of the SJR2 indicator, and the results obtained with its implementation
on Elsevier's Scopus database, for which the data were obtained from the Scimago
4
Journal & Country Rank website, an open access scientometric directory with almost
19,000 scientific journals and other types of publication (2009).
2. Data
We used Scopus as the data source for the development of the SJR2 indicator
because it best represents the overall structure of world science at a global scale.
Scopus is the world's largest scientific database if one considers the period 2000-2011.
It covers most of the journals included in the Thomson Reuters Web of Science (WoS)
and more (Moya-Anegón et al., 2007; Leydesdorff, Moya-Anegón & Guerrero-Bote,
2010). Also, despite its only relatively recent launch in 2004, there are already various
studies of its structure and coverage in the literature (LaGuardia, 2005; Bar-Ilan, 2008;
Jacso 2009). Our choice of database reflects our consideration of four criteria that are
of great importance in the computation of any bibliometric indicator. These are:
Journal coverage.
Relationship between primary (citable items) and total output per
journal of the database.
Assignment criteria for types of documents.
Accuracy of the linkage between references and source records.
Only documents published in 2008 included in the Scopus raw data copy
exported on May 2011 were used for the main part of the study (in number,
1,999,777). All their references to documents present in the database in previous years
were retrieved (in number, 26,036,560).
Documents are classified by area and category. There are 295 Specific Subject
Areas grouped into 26 Subject Areas. In addition, there is the General Subject Area
containing multidisciplinary journals, such as Nature or Science. The Subject Areas are
grouped into four categories on the Scopus "Basic Search" page (see the Scopus
website, www.scopus.com, visited on 20 October 2011).
The four Scopus categories are:
5
Life Sciences (3950 titles): Agricultural & Biological Sciences;
Biochemistry, Genetics & Molecular Biology; Immunology &
Microbiology; Neuroscience, Pharmacology, Toxicology &
Pharmaceutics.
Physical Sciences (6350 titles): Chemical Engineering; Chemistry;
Computer Science; Earth & Planetary Science; Energy; Engineering;
Environmental Science; Materials Science; Mathematics; Physics &
Astronomy.
Social Sciences (5900 titles):Arts & Humanities; Business, Management
& Accounting; Decision Sciences; Economics, Econometrics and Finance;
Psychology; Social Sciences.
Health Sciences (6200 titles, including 100% coverage of Medline titles):
Medicine; Nursing; Veterinary; Dentistry; Health Professions.
3. Method
The SJR2 indicator, as also the SJR indicator (González-Pereira, Guerrero-Bote &
Moya-Anegón, 2010), is computed over a journal citation network in which the nodes
represent the active source journals, and the directed links between the nodes, the
citation relationships among those journals. The main differences with respect to SJR
are:
The SJR2 prestige of the citing journal is distributed among the cited
journals proportionally both to the citations from the former to the
latter (in the three-year citation window) and to the cosine (of the
angle) between the cocitation profiles of the two journals. With the
addition of the cosine here, the intention is that the transfer should be
greater the closer the two journals are thematically.
The transfer of prestige to another journal or to itself is limited to a
maximum of 50% of the prestige of the journal source, and a maximum
of 10% per citation. This avoids problems similar to link farms with
journals with either very few recent references or too specialized.
6
The SJR2 prestige of the dangling nodes is distributed among all the
journals proportionally to what they receive from the citing journals,
which seems more logical than proportionally to the number of citable
documents.
The Prestige SJR2 (PSJR2) is normalized to the proportion of citable
documents (articles, reviews, short surveys and conference papers in
the three-year window), instead of to the total number of citable
documents. With this, one obtain values that do not tend to decrease as
new journals are incorporated and that are endowed with meaning.
Short surveys have been included among the citable documents due to
the non-negligible citation received by them2.
The SJR2 indicator, as also the SJR, is computed in two phases: the computation
of the Prestige SJR2 (PSJR2), a size-dependent measure that reflects the journals'
overall prestige; and the normalization of this measure to give a size-independent
metric, the SJR2 indicator, which can be used to compare journals.
Phase 1
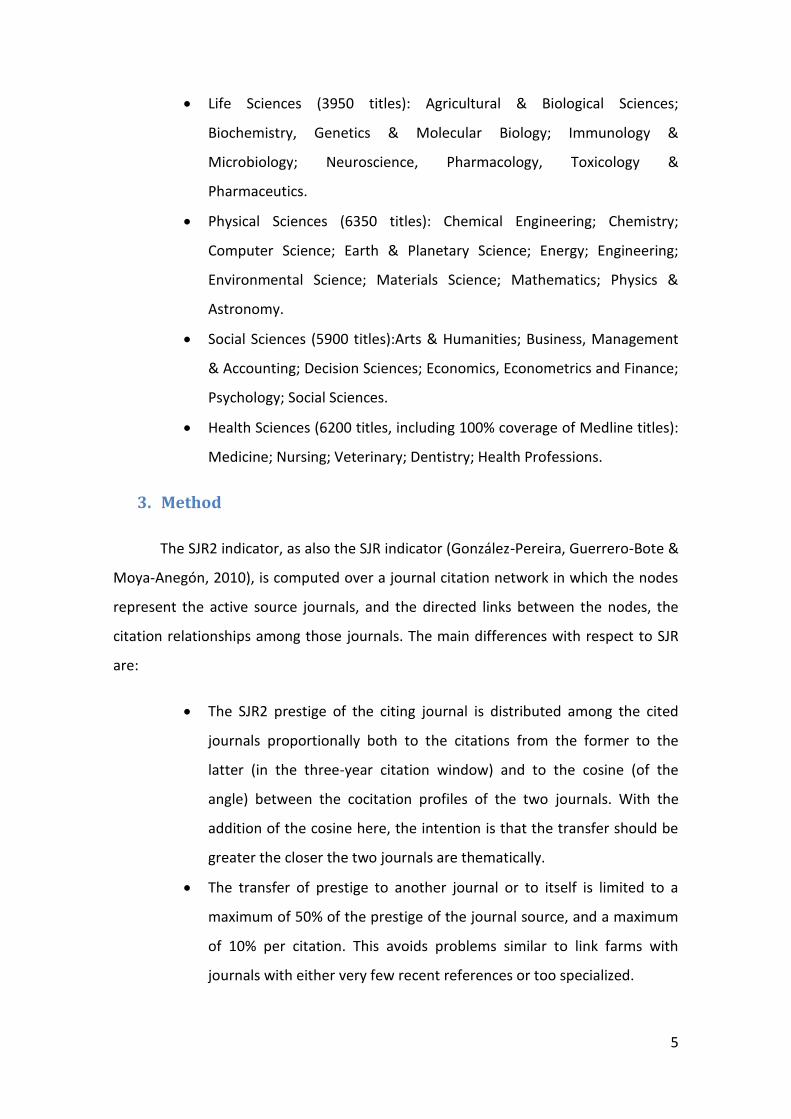
First, each journal is assigned the same initial prestige value 1/N, where N is the
number of journals in the database. Then the iterative procedure begins. Each
iteration modifies the prestige values for each journal in accordance with three
criteria: (1) a minimum prestige value from simply being included in the database; (2) a
journal prestige given by the number of documents included in the database; and (3) a
citation prestige given by the number, "importance", and "closeness" of the citations
received from other journals. The formula used for this calculation is the following:
3
1
2
1
1
22
)1(2
j
N
j
jiN
j
j
ii PSJRCoef
DPSJR
d
Art
Arte
N
edPSJR
2 The types of documents with a significant presence (> 1%) in Scopus in the citation window from 2005
to 2007 are: Article (64%) with 1.94 citations per document in 2008, Conference Papers (17%) with 0.49 c/d, Reviews (9%) with 2.47 c/d, Notes (2.45%) with 0.18 c/d, Editorial Material (2.29%) with 0.31 c/d, Letter (2.28%) with 0.36 c/d and Short Surveys (1.67%) with 0.76 c/d.
7
PSJR2i – Prestige Scimago Journal Rank 2 of the Journal i.
Cji - References from journal j to journal i.
d – Constant: 0.9.
e – Constant: 0.0999.
N - Number of journals in the database.
Artj - Number of citable primary documents (articles, reviews, short
surveys and conference papers) of journal j.
Cosji – Cosine between cocitation profiles of journals j and i (without
components i, j).
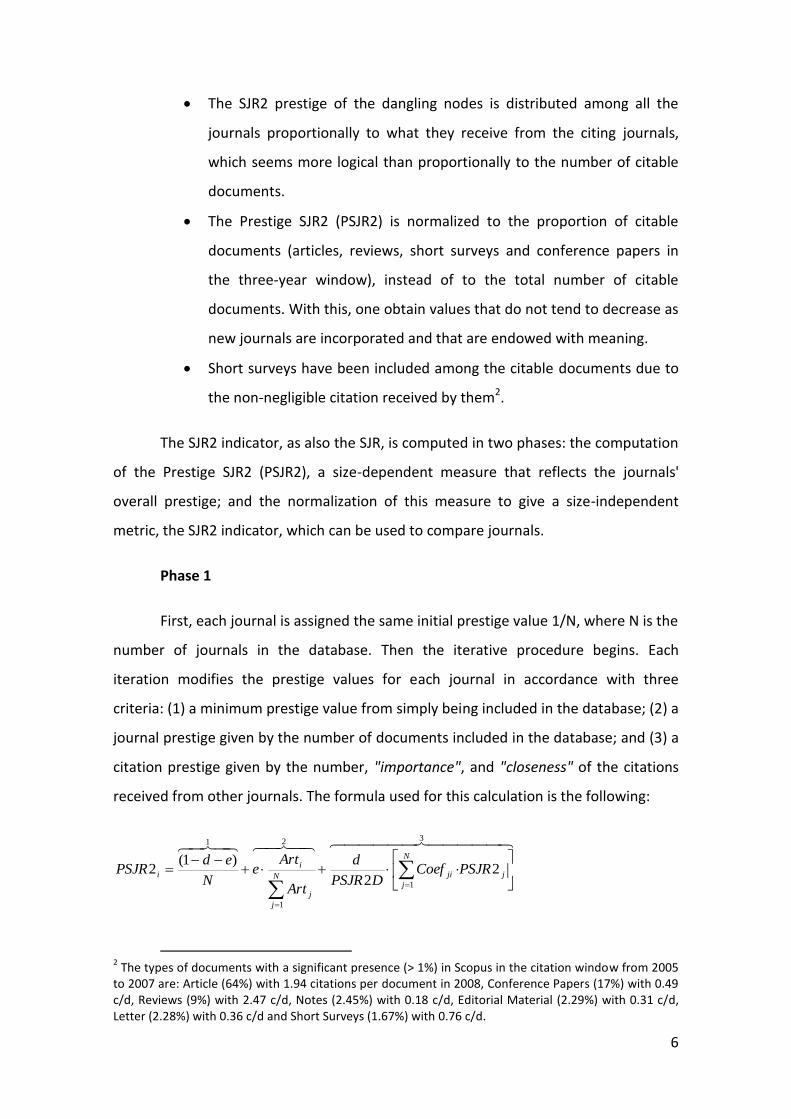
The coefficients:
N
h
jhjh
jiji
ji
CCos
CCosCoef
1
·
·
are calculated before beginning the iterations, and are limited to a maximun of 0.5 or
0.1·Cji. Unlike the SJR, in these coefficients the cosine of the cocitation profiles of the
journals is introduced.
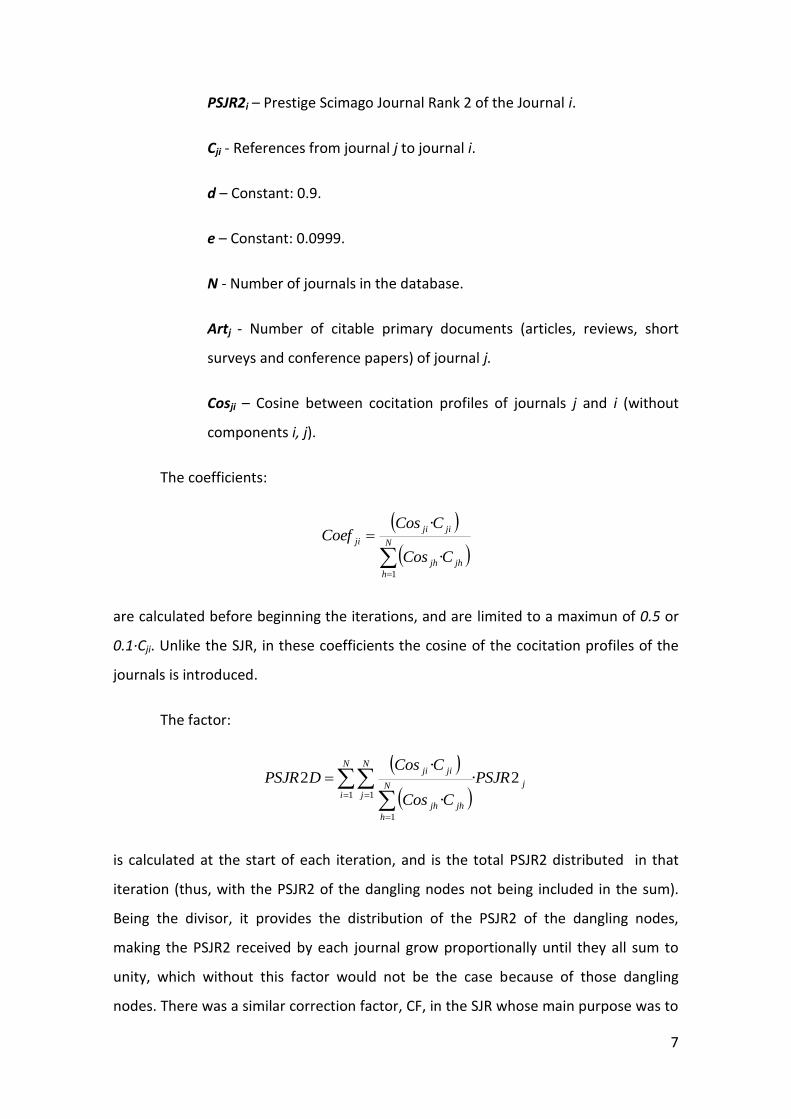
The factor:
N
i
N
j
jN
h
jhjh
jijiPSJR
CCos
CCosDPSJR
1 1
1
2·
·
·2
is calculated at the start of each iteration, and is the total PSJR2 distributed in that
iteration (thus, with the PSJR2 of the dangling nodes not being included in the sum).
Being the divisor, it provides the distribution of the PSJR2 of the dangling nodes,
making the PSJR2 received by each journal grow proportionally until they all sum to
unity, which without this factor would not be the case because of those dangling
nodes. There was a similar correction factor, CF, in the SJR whose main purpose was to
8
eliminate the difference between the active references used in the numerator of the
coefficients and the total references used in the denominator, and which did not
distribute the PSJR of dangling nodes.
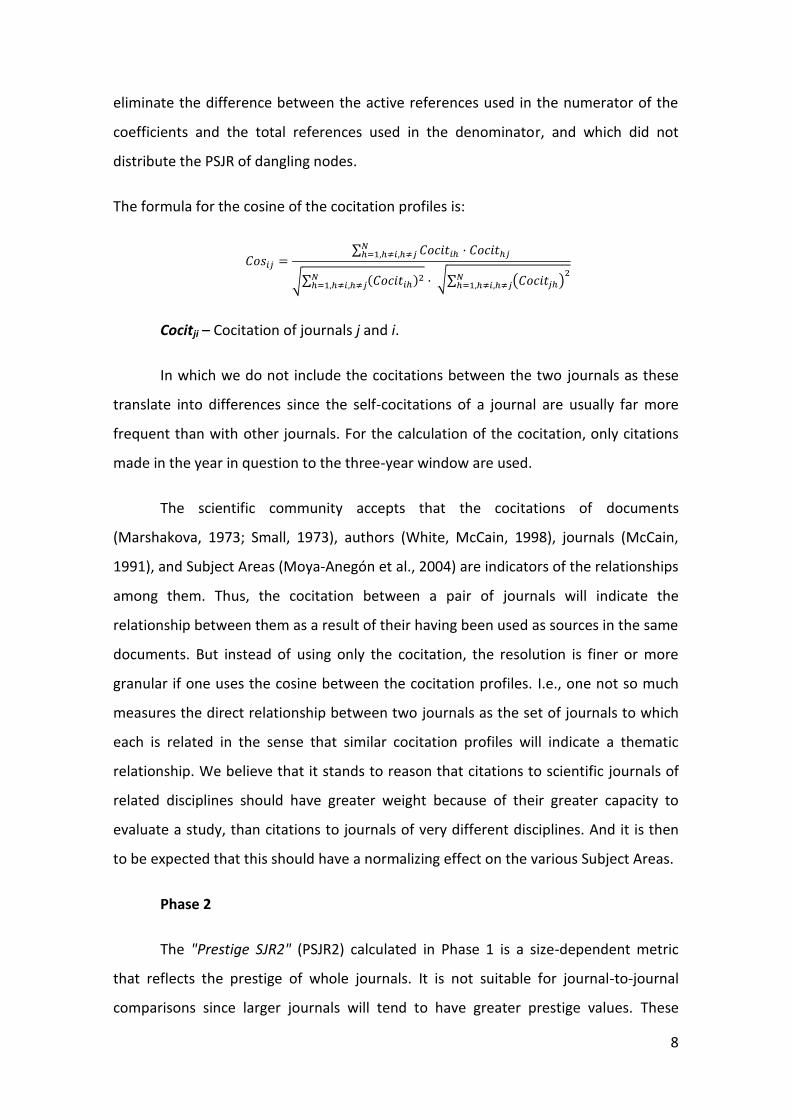
The formula for the cosine of the cocitation profiles is:
∑
√∑ ( )
√∑ ( )
Cocitji – Cocitation of journals j and i.
In which we do not include the cocitations between the two journals as these
translate into differences since the self-cocitations of a journal are usually far more
frequent than with other journals. For the calculation of the cocitation, only citations
made in the year in question to the three-year window are used.
The scientific community accepts that the cocitations of documents
(Marshakova, 1973; Small, 1973), authors (White, McCain, 1998), journals (McCain,
1991), and Subject Areas (Moya-Anegón et al., 2004) are indicators of the relationships
among them. Thus, the cocitation between a pair of journals will indicate the
relationship between them as a result of their having been used as sources in the same
documents. But instead of using only the cocitation, the resolution is finer or more
granular if one uses the cosine between the cocitation profiles. I.e., one not so much
measures the direct relationship between two journals as the set of journals to which
each is related in the sense that similar cocitation profiles will indicate a thematic
relationship. We believe that it stands to reason that citations to scientific journals of
related disciplines should have greater weight because of their greater capacity to
evaluate a study, than citations to journals of very different disciplines. And it is then
to be expected that this should have a normalizing effect on the various Subject Areas.
Phase 2
The "Prestige SJR2" (PSJR2) calculated in Phase 1 is a size-dependent metric
that reflects the prestige of whole journals. It is not suitable for journal-to-journal
comparisons since larger journals will tend to have greater prestige values. These

9
values have the property of always summing to unity, so that they reflect the ratio of
prestige that each scientific journal has accumulated. But, one needs to define a
measure that is suitable for use in evaluation processes. To that end, the prestige
gained by each journal, PSJR2, is divided by the ratio of citable documents that each
journal has relative to the total, i.e.,
N
j
j
i
i
N
j
ji
i
i ArtArt
PSJR
ArtArt
PSJRSJR
1
1
·22
2
The ratios of citable documents also have the characteristic of summing to
unity. Hence this procedure compares the 'portion of the pie' of prestige that a journal
achieves with the portion of citable documents that it includes. A value of unity means
that the prestige per document is the mean. A value of 0.8 is interpreted as 20% less
prestige having been achieved than the mean, and a value of 1.3 corresponds to 30%
more prestige than the mean. Logically, an SJR2 value of 20 means that the prestige is
20 times greater than the mean.
Mathematically, it is easy to deduce that the mean of the SJR2 values for a year
calculated by weighting by the number of citable documents will always be unity. In
the SJR, since the divisor is just the number of articles of the journal, the scores
decreased over time as a result of distributing a given measure of prestige among a
growing number of journals. This was the contrary of the case with the JIF which grew
as a result of the incorporation of ever more citations when further journals were
incorporated.
Scopus distributes both the SJR and the SNIP (Source Impact Normalized per
Paper) indicators. SNIP:
“It measures a journal’s contextual citation impact, taking into account
characteristics of its properly defined subject field, especially the frequency at
which authors cite other papers in their reference lists, the rapidity of maturing
of citation impact, and the extent to which a database used for the assessment
covers the field’s literature” (Moed, 2010).
10
There is great variation from some subject fields to others in the database
citation potential (number of references per document to the database and in the time
period considered). To a large extent, this is the cause of the variation in citation
impact from one subject field to another. One therefore normalizes the
aforementioned citation impact, dividing it by the relative database citation potential
(relative DCP) in the journal's subfield (the quotient between the DCP in the journal's
subfield and the DCP of the database's median journal). Furthermore, to be
classification free, the subject field used for each journal is the set of documents that
cite its papers.
The SNIP indicator will also be used as a comparison point of the subject field
normalization.
We have also constructed an ad hoc JIF(3y) with a 3-year citation window for
comparison, so that any differences observed between the indicator values would be a
consequence of the computation method and not of the time frame, citation window,
etc.
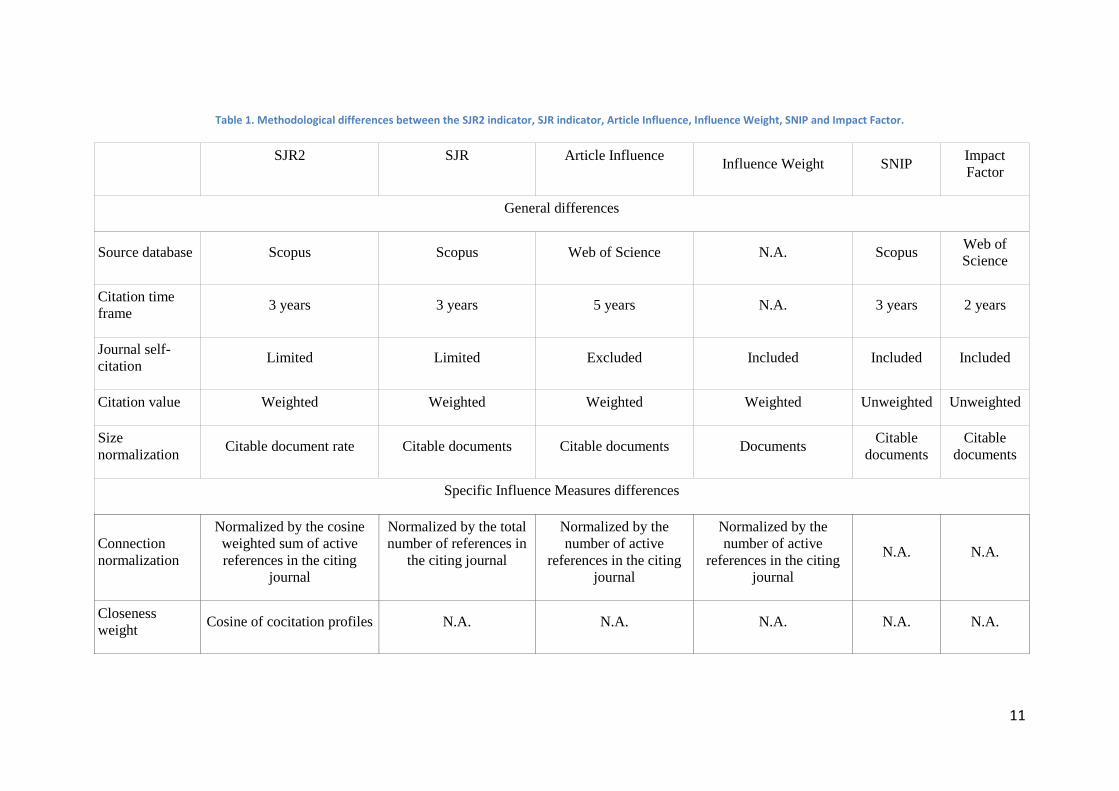
Table 1 presents the main methodological differences with other indicators –
the SNIP (Moed, 2010) and the JIF – and with other second generation prestige
indicators – the Influence Weight (Pinski & Narin, 1976), Article Influence (Bergstrom,
2007), and the SJR itself (González-Pereira, Guerrero-Bote & Moya-Anegón, 2010).
11
Table 1. Methodological differences between the SJR2 indicator, SJR indicator, Article Influence, Influence Weight, SNIP and Impact Factor.
SJR2 SJR Article Influence
Influence Weight SNIP Impact
Factor
General differences
Source database Scopus Scopus Web of Science N.A. Scopus Web of
Science
Citation time
frame 3 years 3 years 5 years N.A. 3 years 2 years
Journal self-
citation Limited Limited Excluded Included Included Included
Citation value Weighted Weighted Weighted Weighted Unweighted Unweighted
Size
normalization Citable document rate Citable documents Citable documents Documents
Citable
documents Citable
documents
Specific Influence Measures differences
Connection
normalization
Normalized by the cosine
weighted sum of active
references in the citing
journal
Normalized by the total
number of references in
the citing journal
Normalized by the
number of active
references in the citing
journal
Normalized by the
number of active
references in the citing
journal
N.A. N.A.
Closeness
weight Cosine of cocitation profiles N.A. N.A. N.A. N.A. N.A.
12
4. Statistical Characterization
As in González-Pereira, Guerrero-Bote & Moya-Anegón (2010), in this section
we shall present a statistical characterization of the SJR2 indicator in order to contrast
its capacity to depict what could be termed "average prestige" with journals' citedness
per document and the SNIP indicator. The study was performed for the year 2008
since its data can be considered stable. The data were downloaded from the Scimago
Journal and Country Rank database (http://www.scimagojr.com) on 20 October 2011.
It needs to be noted that while, due to the periodic SJR updates which include
retrospective data, the data of the present study may not coincide exactly with those
given on the portal, they will basically be the same.
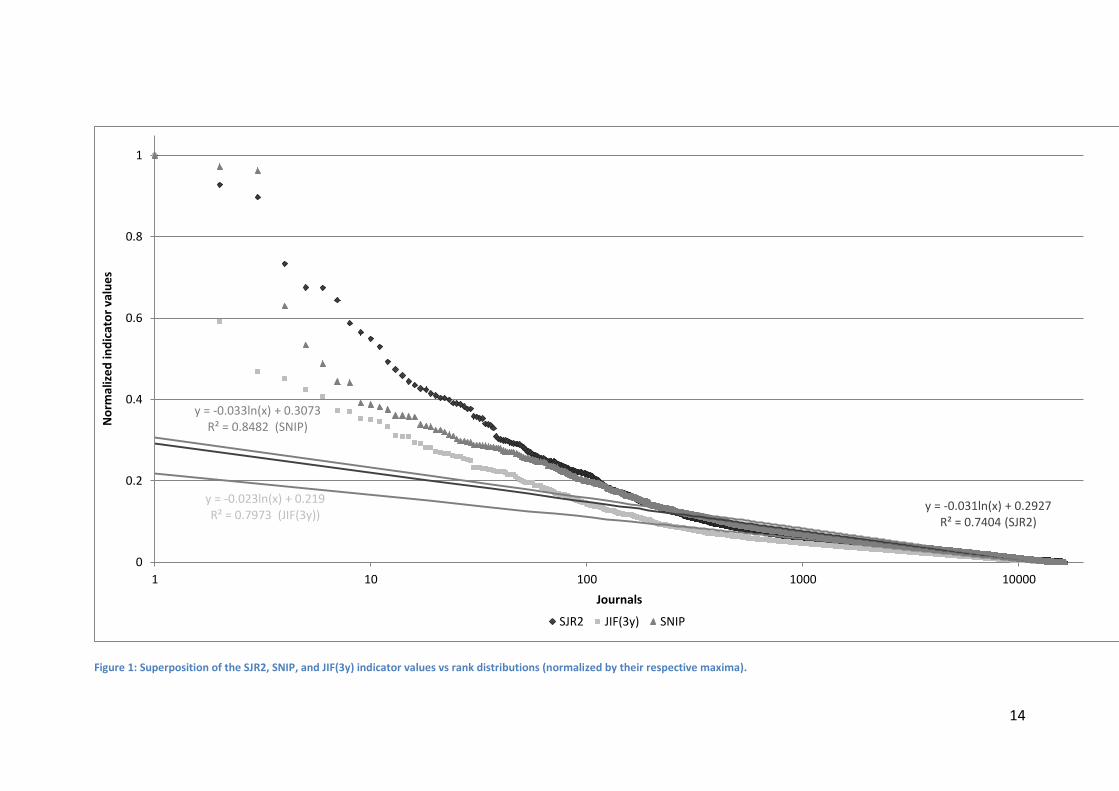
Figure 1 shows a superposition of the overall SJR2, JIF(3y), and SNIP indicator
values vs rank distributions. In order for them to be comparable, the values of the
three indicators are normalized by dividing them by the corresponding maximum
value. They all have a behaviour close to a logarithmic law which would be represented
on this semi-log plot by a descending, although steeper, straight line. Contrary to the
case with the SJR3, SJR2 is now the indicator which has the most gradual fall, less steep
even than the SNIP, with the JIF(3y) showing the sharpest decline. This indicates that
the prestige is less concentrated than the Citation, i.e., that there are fewer
"prestigious" journals than highly cited ones. The three metrics are strongly correlated.
Relative to SJR4, the SJR2 index has higher correlations with JIF(3y) and SNIP. There are
also strong correlations with SNIP which are comparable to those between SNIP and
3 With this set of data, SJR has also a somewhat steeper fall-off. The logarithmic approximation of the
curve is y= -0.017ln(x) + 0.1535 (i.e., smaller slope and closer to the x-axis) and its R² = 0.4345. 4 With this set of data, the overall correlations between the SJR and the SJR2 were 0.794 (Pearson) and
0.863 (Spearman), between the SJR and the JIF(3y) 0.816 (Pearson) and 0.930 (Spearman), and between the SJR and the SNIP 0.454 (Pearson) and 0.731 (Spearman). With this set of data, the mean correlations for Subject Areas between the SJR and the SJR2 were 0.781 (Pearson) and 0.916 (Spearman), between the SJR and the JIF(3y) 0.821 (Pearson) and 0.943 (Spearman), and between the SJR and the SNIP 0.630 (Pearson) and 0.827 (Spearman). With this set of data, the mean correlations for Specific Subject Areas between the SJR and the SJR2 were 0.795 (Pearson) and 0.910 (Spearman), between the SJR and the JIF(3y) 0.815 (Pearson) and 0.917 (Spearman), and between the SJR and the SNIP 0.656 (Pearson) and 0.810 (Spearman).
13
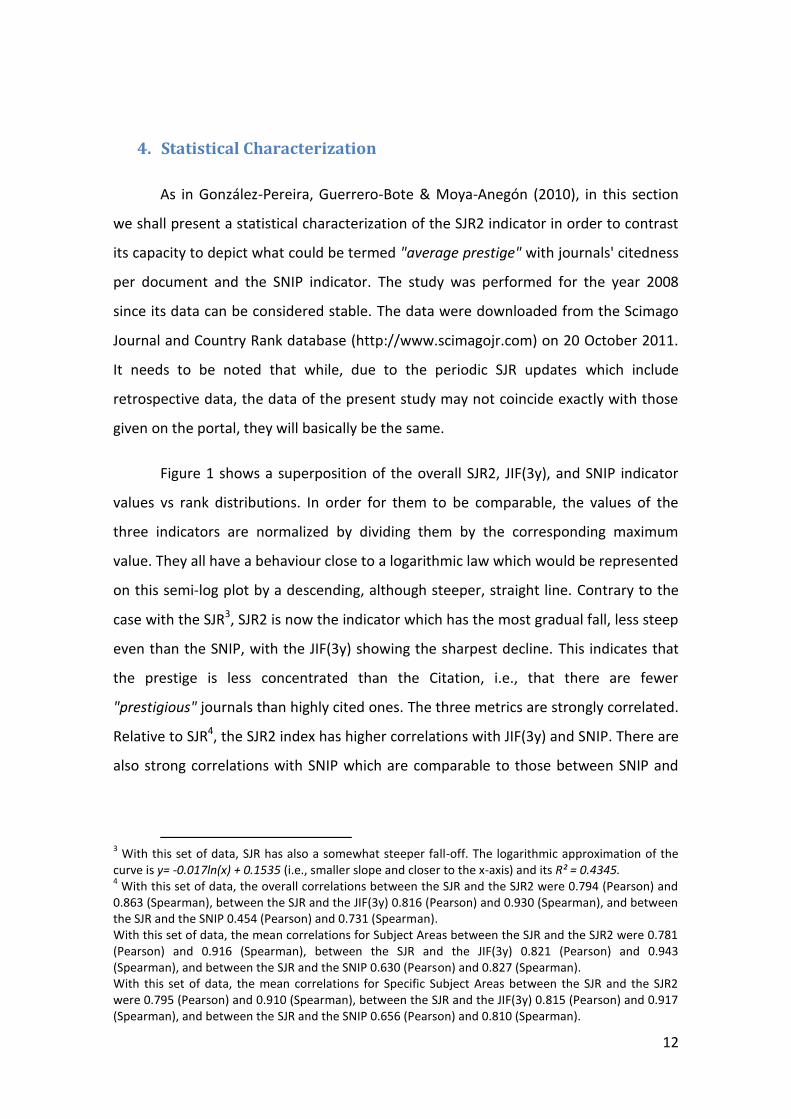
JIF(3y). Table 2 gives details of these statistics, both overall and by Subject Area and
Specific Subject Area.
Table 2: Overall correlations of the SJR2, JIF(3y), and SNIP indicators, and mean correlations by Subject Area and Specific Subject Area.
Global SJR2/JIF(3y) SJR2/SNIP SNIP/JIF(3y)
Pearson 0.882 0.775 0.771
Spearman 0.944 0.906 0.888
Average SD Average SD Average SD
Pearson 0.910 0.072 0.868 0.105 0.912 0.064
Spearman 0.944 0.039 0.910 0.052 0.924 0.026
Average SD Average SD Average SD
Pearson 0.873 0.241 0.842 0.213 0.872 0.208
Spearman 0.917 0.179 0.882 0.144 0.906 0.132
SJR2/JIF(3y) SNIP/JIF(3y)SJR2/SNIPSubject Areas (27)
Specific Subject Areas
(295)
SJR2/JIF(3y) SJR2/SNIP SNIP/JIF(3y)
14
Figure 1: Superposition of the SJR2, SNIP, and JIF(3y) indicator values vs rank distributions (normalized by their respective maxima).
y = -0.031ln(x) + 0.2927 R² = 0.7404 (SJR2)
y = -0.023ln(x) + 0.219 R² = 0.7973 (JIF(3y))
y = -0.033ln(x) + 0.3073 R² = 0.8482 (SNIP)
0
0.2
0.4
0.6
0.8
1
1 10 100 1000 10000
No
rmal
ize
d in
dic
ato
r va
lue
s
Journals
SJR2 JIF(3y) SNIP
15
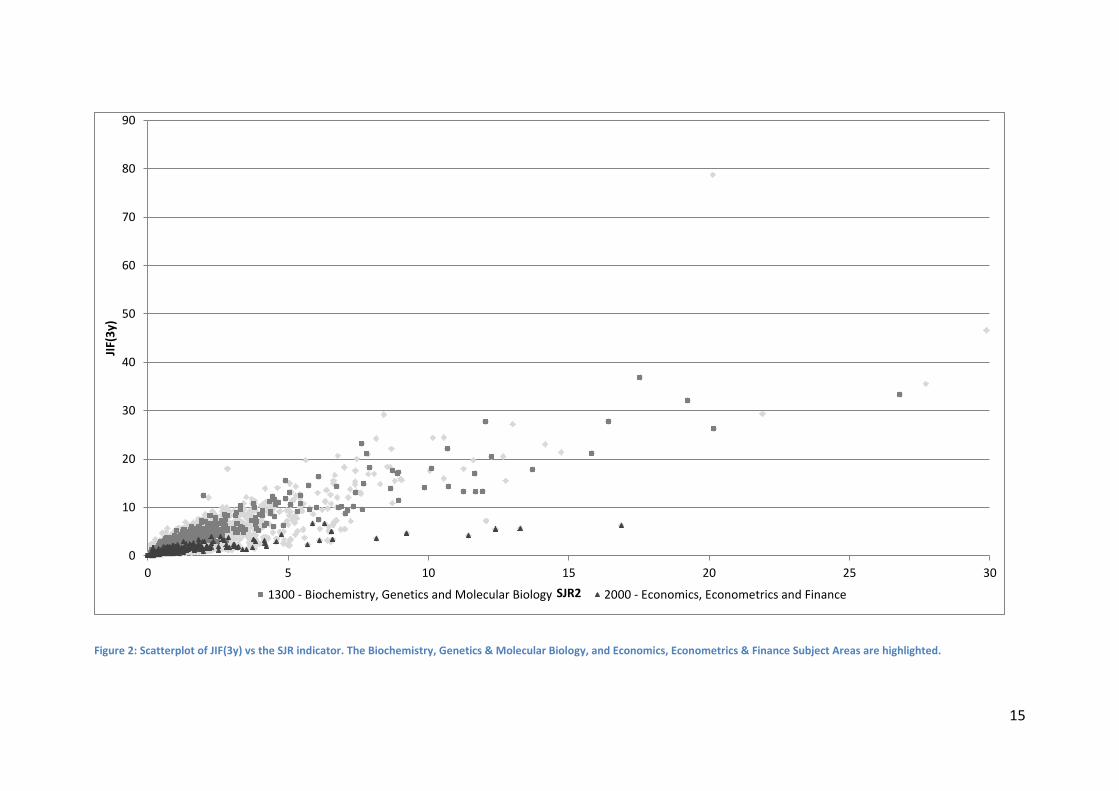
Figure 2: Scatterplot of JIF(3y) vs the SJR indicator. The Biochemistry, Genetics & Molecular Biology, and Economics, Econometrics & Finance Subject Areas are highlighted.
0
10
20
30
40
50
60
70
80
90
0 5 10 15 20 25 30
JIF(
3y)
SJR2 1300 - Biochemistry, Genetics and Molecular Biology 2000 - Economics, Econometrics and Finance
16
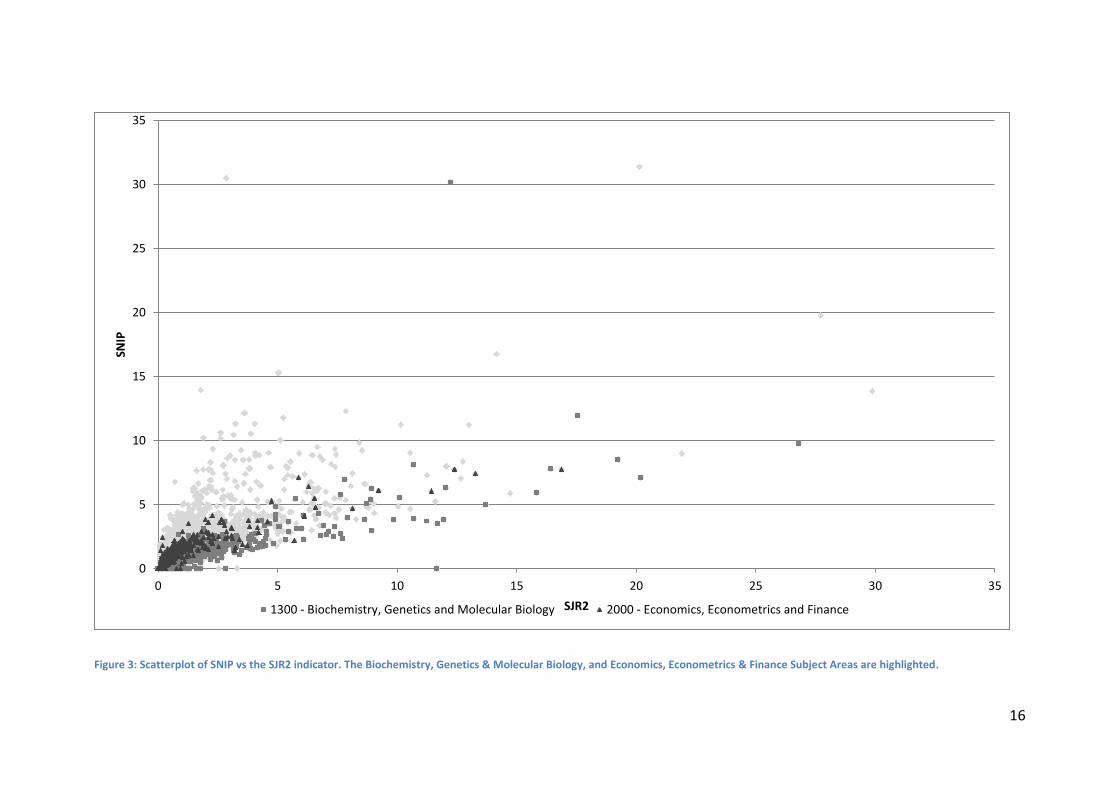
Figure 3: Scatterplot of SNIP vs the SJR2 indicator. The Biochemistry, Genetics & Molecular Biology, and Economics, Econometrics & Finance Subject Areas are highlighted.
0
5
10
15
20
25
30
35
0 5 10 15 20 25 30 35
SNIP
SJR2 1300 - Biochemistry, Genetics and Molecular Biology 2000 - Economics, Econometrics and Finance
17
Figures 2 and 3 are scatter-plots of the same distributions as shown in Figure 1.
They show all the journals for which the SNIP and SJR indicators are currently
estimated, but they also mark as highlighted two Subject Areas of very different
behaviour in terms of the traffic of citations. In the first (Figure 2), which shows SJR2 vs
JIF(3y), one observes the normalizing effect that SJR2 has on the different citation
habits. The journals of the area "1300 - Biochemistry, Genetics and Molecular Biology"
lie above those corresponding to "2000 - Economics, Econometrics and Finance" as a
result of having higher JIF(3y) values. Indeed, one of the journals of the latter Subject
Area with a modest impact of 6.29 obtains an outstanding SJR2 of 16.87.
Figure 3 shows the case to be the inverse with the SNIP, with the journal of
"2000 - Economics, Econometrics and Finance" having SNIP values greater than those
of "1300 - Biochemistry, Genetics and Molecular Biology". This is perhaps because of
an over-normalization of this indicator as a result of the computation being carried out
solely by numerical comparison with citing journals.
This is seen numerically in Table 3 which lists the calculated citation rates in the
different Subject Areas with respect to the cumulative total for each indicator,
weighted by the number of citable documents of each journal. In the case of SJR2, this
is the Prestige SJR2 (PSJR2). These values are divided by the ratio of citable documents
of each Subject Area. Thus a situation of complete equalization should yield unity for
each Subject Area.

18
Table 3: Subject Area distribution of the citation rates of the SJR2, JIF(3y), and SNIP indicators.
Area SJR2 JIF(3y) SNIP
General 4.133 4.367 2.978
Agricultural and Biological Sciences 0.897 0.940 0.981
Arts and Humanities 0.230 0.130 0.344
Biochemistry, Genetics and Molecular Biology 1.683 1.855 1.184
Business, Management and Accounting 0.740 0.491 0.923
Chemical Engineering 0.712 0.802 0.875
Chemistry 1.195 1.369 1.116
Computer Science 0.805 0.606 1.446
Decision Sciences 1.139 0.698 1.690
Earth and Planetary Sciences 1.166 0.976 1.192
Economics, Econometrics and Finance 1.220 0.573 1.283
Energy 0.588 0.554 0.878
Engineering 0.641 0.516 1.067
Environmental Science 0.986 1.029 1.112
Immunology and Microbiology 1.561 1.810 1.241
Materials Science 0.817 0.788 0.917
Mathematics 0.837 0.494 1.003
Medicine 0.875 1.126 0.844
Neuroscience 1.955 2.106 1.357
Nursing 0.637 0.761 0.674
Pharmacology, Toxicology and Pharmaceutics 0.792 1.178 0.774
Physics and Astronomy 1.146 0.942 1.151
Psychology 0.928 0.933 1.094
Social Sciences 0.519 0.389 0.711
Veterinary 0.479 0.488 0.639
Dentistry 0.715 0.837 1.000
Health Professions 0.844 1.066 1.070
As expected, the values that most deviate from unity are those of the "General"
Subject Area. But it must be borne in mind that this is a special Subject Area which
includes multidisciplinary journals that publish work from practically any discipline,
and, as one observes, accumulate a Citation close to four times unity. One also
observes that the journals of this Subject Area obtain a somewhat higher PSJR2,
indicating that their citations come from prestigious journals. The SNIP indicator is the
one that least deviates from unity in this Subject Area.
Here one observes that "1300 - Biochemistry, Genetics and Molecular Biology"
accumulates a greater Citation (1.8) than Prestige SJR2 (1.68) or SNIP (1.18), while
"2000 - Economics, Econometrics and Finance" presents the opposite behaviour.
Table 4 summarizes the average squared deviations from unity for Subject
Areas and for Specific Subject Areas. In neither case was the Subject Area "1000 -
General" taken into account because of its aforementioned special nature. One
observes in this table that the greatest deviation from unity corresponds to JIF(3y). In
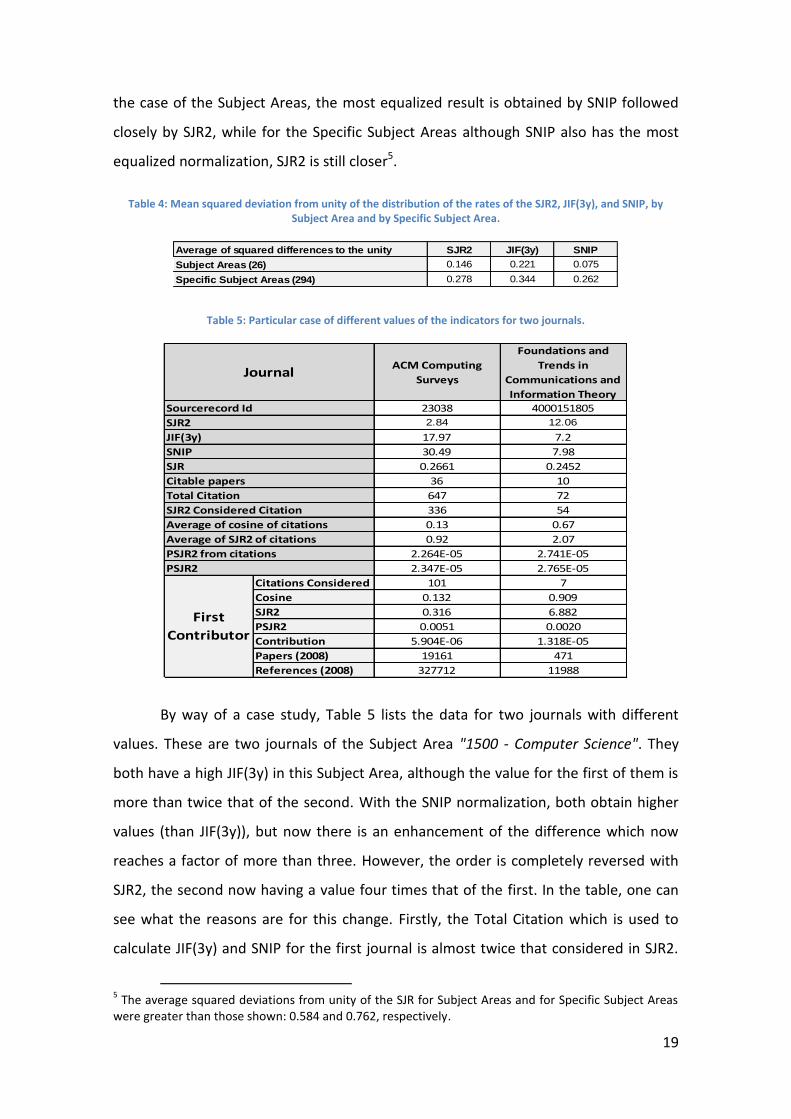
19
the case of the Subject Areas, the most equalized result is obtained by SNIP followed
closely by SJR2, while for the Specific Subject Areas although SNIP also has the most
equalized normalization, SJR2 is still closer5.
Table 4: Mean squared deviation from unity of the distribution of the rates of the SJR2, JIF(3y), and SNIP, by Subject Area and by Specific Subject Area.
Average of squared differences to the unity SJR2 JIF(3y) SNIP
Subject Areas (26) 0.146 0.221 0.075
Specific Subject Areas (294) 0.278 0.344 0.262
Table 5: Particular case of different values of the indicators for two journals.
ACM Computing
Surveys
Foundations and
Trends in
Communications and
Information Theory
23038 4000151805
2.84 12.06
17.97 7.2
30.49 7.98
0.2661 0.2452
36 10
647 72
336 54
0.13 0.67
0.92 2.07
2.264E-05 2.741E-05
2.347E-05 2.765E-05
Citations Considered 101 7
Cosine 0.132 0.909
SJR2 0.316 6.882
PSJR2 0.0051 0.0020
Contribution 5.904E-06 1.318E-05
Papers (2008) 19161 471
References (2008) 327712 11988
SJR
Journal
Sourcerecord Id
SJR2
JIF(3y)
SNIP
PSJR2
First
Contributor
Citable papers
Total Citation
SJR2 Considered Citation
Average of cosine of citations
Average of SJR2 of citations
PSJR2 from citations
By way of a case study, Table 5 lists the data for two journals with different
values. These are two journals of the Subject Area "1500 - Computer Science". They
both have a high JIF(3y) in this Subject Area, although the value for the first of them is
more than twice that of the second. With the SNIP normalization, both obtain higher
values (than JIF(3y)), but now there is an enhancement of the difference which now
reaches a factor of more than three. However, the order is completely reversed with
SJR2, the second now having a value four times that of the first. In the table, one can
see what the reasons are for this change. Firstly, the Total Citation which is used to
calculate JIF(3y) and SNIP for the first journal is almost twice that considered in SJR2.
5 The average squared deviations from unity of the SJR for Subject Areas and for Specific Subject Areas
were greater than those shown: 0.584 and 0.762, respectively.
20
This is because many of the citations obtained by the first journal come from journals
which, although they are included in Scopus, for different reasons are not included in
the calculation of SJR. Secondly, the average cosine of the cocitation profiles of the
source journals of the citations received by the second journal is five times that of the
first journal. And thirdly, the average SJR2 of the source journals of the citations
received by the second journal is more than double the first. Altogether, this leads to
the Prestige SJR2 received from citations and the total Prestige SJR2 being some 20%
higher in the second journal, while the number of citable documents is almost four
times greater in the first journal.
The same table presents the data for the greatest contributor for each of the
two journals. For the first journal, 101 citations are from a journal that has a
considerable PSJR2, but a very low cosine value, and many references among which its
PSJR2 is distributed, being a journal with 19,161 documents in 2008. For the second
journal, there are only 7 citations from a journal with less than half the value of PSJR2,
but a cosine of 0.9 and far fewer references among which to distribute its PSJR2 since
it published only 471 documents in 2008. This leads to the second journal's greatest
contribution being more than twice that of the first journal.
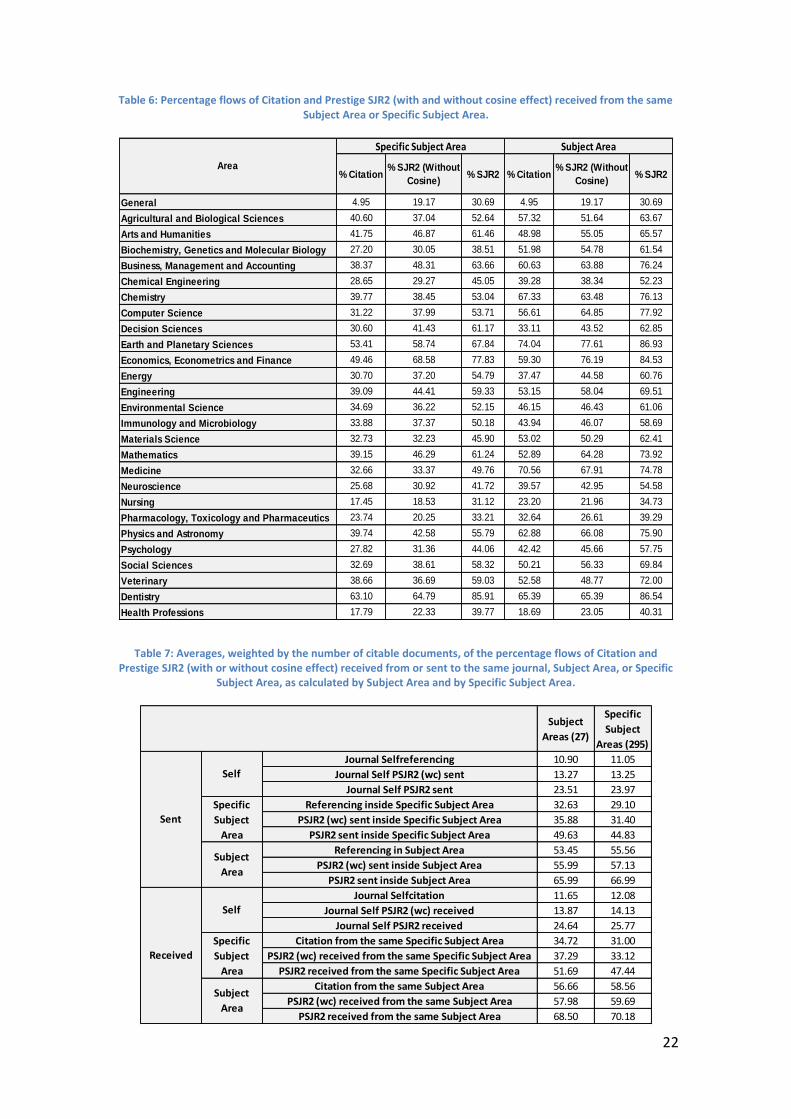
As mentioned above, the effect desired with the cosine between cocitation
profiles is to give greater weight to the prestige from thematically related journals.
This means that greater value will be given to the Citation from the same Subject Area
or Specific Subject Area. This can be seen in Table 6 which lists the citation flow
percentages of Prestige SJR2 with and without the cosine effect. One observes in the
table how the citation habits of different Subject Areas vary from 17% of the Citation
coming from the same Specific Subject Area in "Nursing" to 63% in "Dentistry". One
also observes that the SJR2 (even without the cosine) increases the value of the flow
percentage from the same Subject Area and Specific Subject Area (except in the area
"Agricultural and Biological Sciences", due mainly to the large prestige per citation in
the special subject area "General" and to the large ratio of citation in "Economics,
Econometrics and Finance"). This increase is greater when the cosine is included.
21
The increase in the rate of Subject Areas such as Decision Sciences (Table 3) can
also be explained as due to the almost doubling of the flow within that Subject Area or
its Specific Subject Areas.
The averages of these data are presented in Table 7, which also gives the
percentages of self-citation flows and the percentages of outgoing flows. One sees in
the table that, despite limiting consideration to self-citations, SJR2 increases the
weight of the flow to or from the same journal. The increases are greater when the
cosine is included. This was to be expected, since the cosine of a self-cocitation vector
is unity, the highest possible value. The same is the case with the flows from the same
Subject Area or Specific Subject Area.
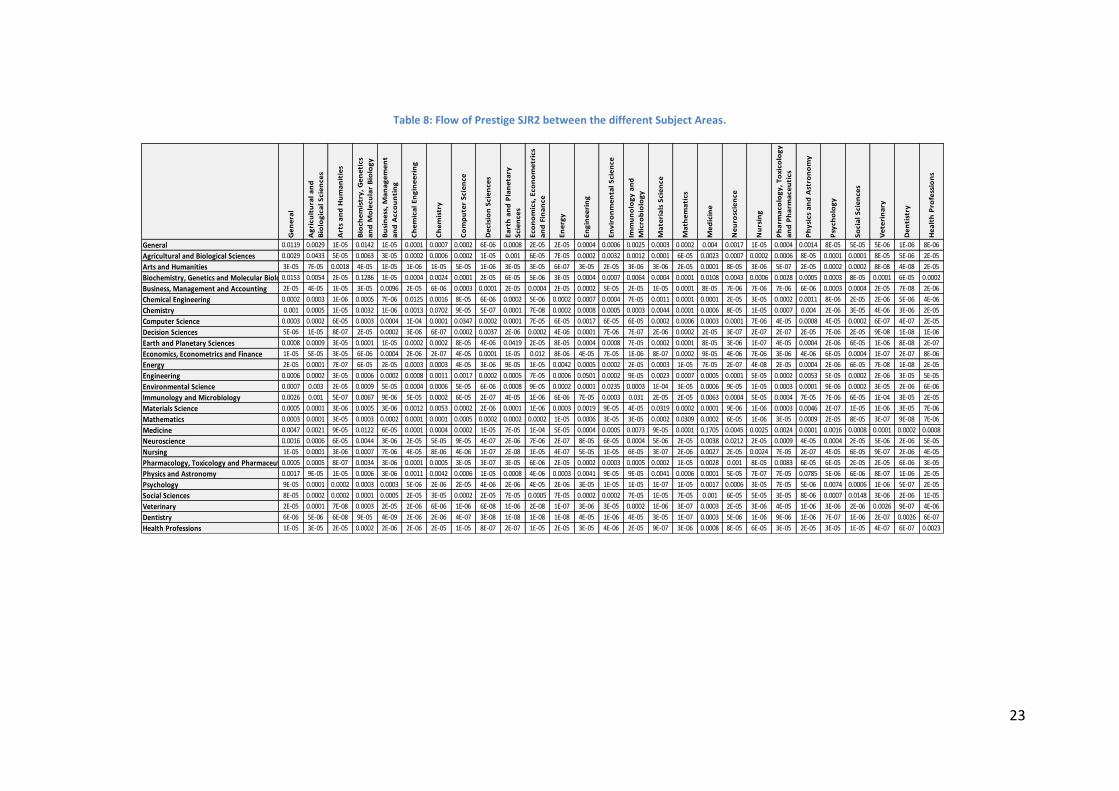
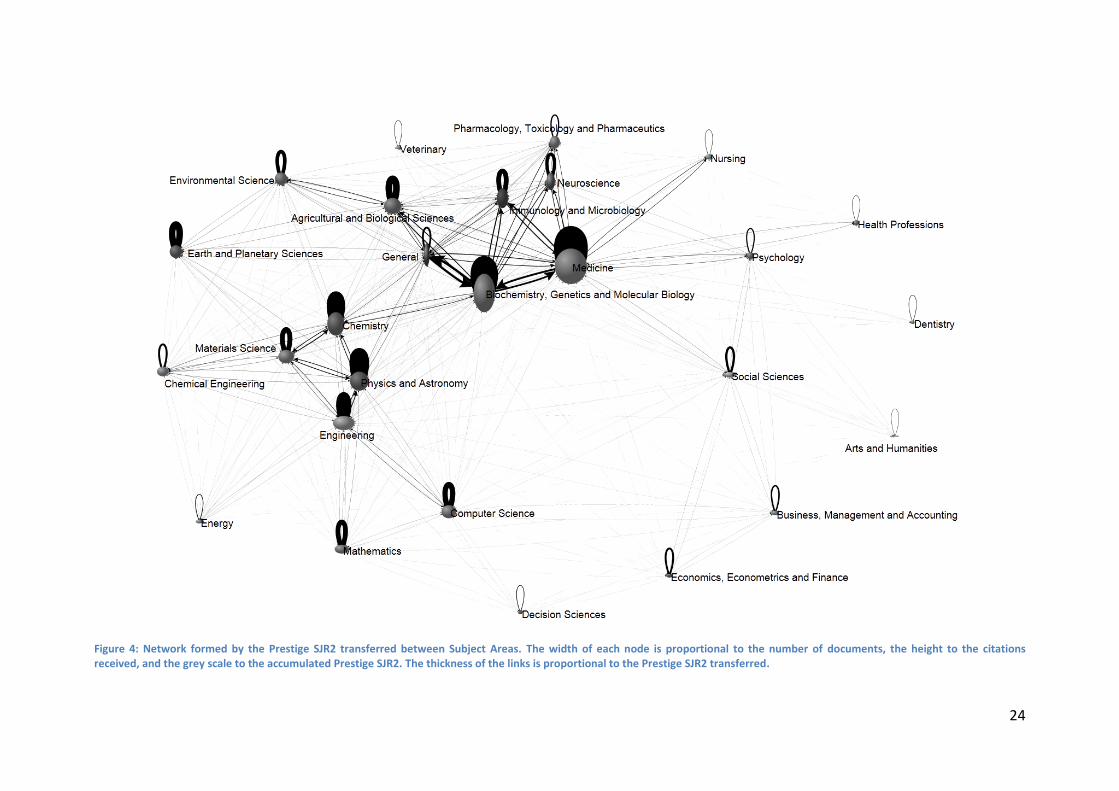
To provide a general overview, the flows of Prestige SJR2 between Subject
Areas are listed in Table 8 and shown graphically in Figure 4. If one were to generate
the corresponding figure for the Citation, as well as the changes in grey levels of the
nodes because the accumulated prestige is different from the accumulated citation,
one would see how the thickness of the loops would decrease, while that of the links
between classes would increase. This is because, in addition to taking into account the
prestige of the source journal, SJR2, through cocitation profiles, it takes into account
the thematic proximity between citing and cited journal.
Two clusters with high traffic of prestige can be distinguished in Figure 4. One
of Biomedicine (includes the general area of multidisciplinary journals) and another of
Physics, Chemistry and Engineering
22
Table 6: Percentage flows of Citation and Prestige SJR2 (with and without cosine effect) received from the same Subject Area or Specific Subject Area.
% Citation% SJR2 (Without
Cosine)% SJR2 % Citation
% SJR2 (Without
Cosine)% SJR2
General 4.95 19.17 30.69 4.95 19.17 30.69
Agricultural and Biological Sciences 40.60 37.04 52.64 57.32 51.64 63.67
Arts and Humanities 41.75 46.87 61.46 48.98 55.05 65.57
Biochemistry, Genetics and Molecular Biology 27.20 30.05 38.51 51.98 54.78 61.54
Business, Management and Accounting 38.37 48.31 63.66 60.63 63.88 76.24
Chemical Engineering 28.65 29.27 45.05 39.28 38.34 52.23
Chemistry 39.77 38.45 53.04 67.33 63.48 76.13
Computer Science 31.22 37.99 53.71 56.61 64.85 77.92
Decision Sciences 30.60 41.43 61.17 33.11 43.52 62.85
Earth and Planetary Sciences 53.41 58.74 67.84 74.04 77.61 86.93
Economics, Econometrics and Finance 49.46 68.58 77.83 59.30 76.19 84.53
Energy 30.70 37.20 54.79 37.47 44.58 60.76
Engineering 39.09 44.41 59.33 53.15 58.04 69.51
Environmental Science 34.69 36.22 52.15 46.15 46.43 61.06
Immunology and Microbiology 33.88 37.37 50.18 43.94 46.07 58.69
Materials Science 32.73 32.23 45.90 53.02 50.29 62.41
Mathematics 39.15 46.29 61.24 52.89 64.28 73.92
Medicine 32.66 33.37 49.76 70.56 67.91 74.78
Neuroscience 25.68 30.92 41.72 39.57 42.95 54.58
Nursing 17.45 18.53 31.12 23.20 21.96 34.73
Pharmacology, Toxicology and Pharmaceutics 23.74 20.25 33.21 32.64 26.61 39.29
Physics and Astronomy 39.74 42.58 55.79 62.88 66.08 75.90
Psychology 27.82 31.36 44.06 42.42 45.66 57.75
Social Sciences 32.69 38.61 58.32 50.21 56.33 69.84
Veterinary 38.66 36.69 59.03 52.58 48.77 72.00
Dentistry 63.10 64.79 85.91 65.39 65.39 86.54
Health Professions 17.79 22.33 39.77 18.69 23.05 40.31
Subject AreaSpecific Subject Area
Area
Table 7: Averages, weighted by the number of citable documents, of the percentage flows of Citation and Prestige SJR2 (with or without cosine effect) received from or sent to the same journal, Subject Area, or Specific
Subject Area, as calculated by Subject Area and by Specific Subject Area.
Subject
Areas (27)
Specific
Subject
Areas (295)
Journal Selfreferencing 10.90 11.05
Journal Self PSJR2 (wc) sent 13.27 13.25
Journal Self PSJR2 sent 23.51 23.97
Referencing inside Specific Subject Area 32.63 29.10
PSJR2 (wc) sent inside Specific Subject Area 35.88 31.40
PSJR2 sent inside Specific Subject Area 49.63 44.83
Referencing in Subject Area 53.45 55.56
PSJR2 (wc) sent inside Subject Area 55.99 57.13
PSJR2 sent inside Subject Area 65.99 66.99
Journal Selfcitation 11.65 12.08
Journal Self PSJR2 (wc) received 13.87 14.13
Journal Self PSJR2 received 24.64 25.77
Citation from the same Specific Subject Area 34.72 31.00
PSJR2 (wc) received from the same Specific Subject Area 37.29 33.12
PSJR2 received from the same Specific Subject Area 51.69 47.44
Citation from the same Subject Area 56.66 58.56
PSJR2 (wc) received from the same Subject Area 57.98 59.69
PSJR2 received from the same Subject Area 68.50 70.18
Sent
Received
Self
Specific
Subject
Area
Subject
Area
Self
Specific
Subject
Area
Subject
Area
23
Table 8: Flow of Prestige SJR2 between the different Subject Areas.
Ge
ne
ral
Ag
ricu
ltu
ral
an
d
Bio
log
ica
l S
cie
nce
s
Art
s a
nd
Hu
ma
nit
ies
Bio
che
mis
try
, G
en
eti
cs
an
d M
ole
cula
r B
iolo
gy
Bu
sin
ess
, M
an
ag
em
en
t
an
d A
cco
un
tin
g
Ch
em
ica
l E
ng
ine
eri
ng
Ch
em
istr
y
Co
mp
ute
r S
cie
nce
De
cisi
on
Sci
en
ces
Ea
rth
an
d P
lan
eta
ry
Sci
en
ces
Eco
no
mic
s, E
con
om
etr
ics
an
d F
ina
nce
En
erg
y
En
gin
ee
rin
g
En
vir
on
me
nta
l S
cie
nce
Imm
un
olo
gy
an
d
Mic
rob
iolo
gy
Ma
teri
als
Sci
en
ce
Ma
the
ma
tics
Me
dic
ine
Ne
uro
scie
nce
Nu
rsin
g
Ph
arm
aco
log
y,
To
xico
log
y
an
d P
ha
rma
ceu
tics
Ph
ysi
cs a
nd
Ast
ron
om
y
Psy
cho
log
y
So
cia
l S
cie
nce
s
Ve
teri
na
ry
De
nti
stry
He
alt
h P
rofe
ssio
ns
General 0.0119 0.0029 1E-05 0.0142 1E-05 0.0001 0.0007 0.0002 6E-06 0.0008 2E-05 2E-05 0.0004 0.0006 0.0025 0.0003 0.0002 0.004 0.0017 1E-05 0.0004 0.0014 8E-05 5E-05 5E-06 1E-06 8E-06
Agricultural and Biological Sciences 0.0029 0.0433 5E-05 0.0063 3E-05 0.0002 0.0006 0.0002 1E-05 0.001 6E-05 7E-05 0.0002 0.0032 0.0012 0.0001 6E-05 0.0023 0.0007 0.0002 0.0006 8E-05 0.0001 0.0001 8E-05 5E-06 2E-05
Arts and Humanities 3E-05 7E-05 0.0018 4E-05 1E-05 1E-06 1E-05 5E-05 1E-06 3E-05 3E-05 6E-07 3E-05 2E-05 3E-06 3E-06 2E-05 0.0001 8E-05 3E-06 5E-07 2E-05 0.0002 0.0002 8E-08 4E-08 2E-05
Biochemistry, Genetics and Molecular Biology0.0153 0.0054 2E-05 0.1286 1E-05 0.0004 0.0024 0.0001 2E-05 6E-05 5E-06 3E-05 0.0004 0.0007 0.0064 0.0004 0.0001 0.0108 0.0043 0.0006 0.0028 0.0005 0.0003 8E-05 0.0001 6E-05 0.0002
Business, Management and Accounting 2E-05 4E-05 1E-05 3E-05 0.0096 2E-05 6E-06 0.0003 0.0001 2E-05 0.0004 2E-05 0.0002 5E-05 2E-05 1E-05 0.0001 8E-05 7E-06 7E-06 7E-06 6E-06 0.0003 0.0004 2E-05 7E-08 2E-06
Chemical Engineering 0.0002 0.0003 1E-06 0.0005 7E-06 0.0125 0.0016 8E-05 6E-06 0.0002 5E-06 0.0002 0.0007 0.0004 7E-05 0.0011 0.0001 0.0001 2E-05 3E-05 0.0002 0.0011 8E-06 2E-05 2E-06 5E-06 4E-06
Chemistry 0.001 0.0005 1E-05 0.0032 1E-06 0.0013 0.0702 9E-05 5E-07 0.0001 7E-08 0.0002 0.0008 0.0005 0.0003 0.0044 0.0001 0.0006 8E-05 1E-05 0.0007 0.004 2E-06 3E-05 4E-06 3E-06 2E-05
Computer Science 0.0003 0.0002 6E-05 0.0003 0.0004 1E-04 0.0001 0.0347 0.0002 0.0001 7E-05 6E-05 0.0017 6E-05 6E-05 0.0002 0.0006 0.0003 0.0001 7E-06 4E-05 0.0008 4E-05 0.0002 6E-07 4E-07 2E-05
Decision Sciences 5E-06 1E-05 8E-07 2E-05 0.0002 3E-06 6E-07 0.0002 0.0037 2E-06 0.0002 4E-06 0.0001 7E-06 7E-07 2E-06 0.0002 2E-05 3E-07 2E-07 2E-07 2E-05 7E-06 2E-05 9E-08 1E-08 1E-06
Earth and Planetary Sciences 0.0008 0.0009 3E-05 0.0001 1E-05 0.0002 0.0002 8E-05 4E-06 0.0419 2E-05 8E-05 0.0004 0.0008 7E-05 0.0002 0.0001 8E-05 3E-06 1E-07 4E-05 0.0004 2E-06 6E-05 1E-06 8E-08 2E-07
Economics, Econometrics and Finance 1E-05 5E-05 3E-05 6E-06 0.0004 2E-06 2E-07 4E-05 0.0001 1E-05 0.012 8E-06 4E-05 7E-05 1E-06 8E-07 0.0002 9E-05 4E-06 7E-06 3E-06 4E-06 6E-05 0.0004 1E-07 2E-07 8E-06
Energy 2E-05 0.0001 7E-07 6E-05 2E-05 0.0003 0.0003 4E-05 3E-06 9E-05 1E-05 0.0042 0.0005 0.0002 2E-05 0.0003 1E-05 7E-05 2E-07 4E-08 2E-05 0.0004 2E-06 6E-05 7E-08 1E-08 2E-05
Engineering 0.0006 0.0002 3E-05 0.0006 0.0002 0.0008 0.0011 0.0017 0.0002 0.0005 7E-05 0.0006 0.0501 0.0002 9E-05 0.0023 0.0007 0.0005 0.0001 5E-05 0.0002 0.0053 5E-05 0.0002 2E-06 3E-05 5E-05
Environmental Science 0.0007 0.003 2E-05 0.0009 5E-05 0.0004 0.0006 5E-05 6E-06 0.0008 9E-05 0.0002 0.0001 0.0235 0.0003 1E-04 3E-05 0.0006 9E-05 1E-05 0.0003 0.0001 9E-06 0.0002 3E-05 2E-06 6E-06
Immunology and Microbiology 0.0026 0.001 5E-07 0.0067 9E-06 5E-05 0.0002 6E-05 2E-07 4E-05 1E-06 6E-06 7E-05 0.0003 0.031 2E-05 2E-05 0.0063 0.0004 5E-05 0.0004 7E-05 7E-06 6E-05 1E-04 3E-05 2E-05
Materials Science 0.0005 0.0001 3E-06 0.0005 3E-06 0.0012 0.0053 0.0002 2E-06 0.0001 1E-06 0.0003 0.0019 9E-05 4E-05 0.0319 0.0002 0.0001 9E-06 1E-06 0.0003 0.0046 2E-07 1E-05 1E-06 3E-05 7E-06
Mathematics 0.0003 0.0001 3E-05 0.0003 0.0002 0.0001 0.0001 0.0005 0.0002 0.0002 0.0002 1E-05 0.0006 3E-05 3E-05 0.0002 0.0309 0.0002 6E-05 1E-06 3E-05 0.0009 2E-05 8E-05 3E-07 9E-08 7E-06
Medicine 0.0047 0.0021 9E-05 0.0122 6E-05 0.0001 0.0004 0.0002 1E-05 7E-05 1E-04 5E-05 0.0004 0.0005 0.0073 9E-05 0.0001 0.1705 0.0045 0.0025 0.0024 0.0001 0.0016 0.0008 0.0001 0.0002 0.0008
Neuroscience 0.0016 0.0006 6E-05 0.0044 3E-06 2E-05 5E-05 9E-05 4E-07 2E-06 7E-06 2E-07 8E-05 6E-05 0.0004 5E-06 2E-05 0.0038 0.0212 2E-05 0.0009 4E-05 0.0004 2E-05 5E-06 2E-06 5E-05
Nursing 1E-05 0.0001 3E-06 0.0007 7E-06 4E-05 8E-06 4E-06 1E-07 2E-08 1E-05 4E-07 5E-05 1E-05 6E-05 3E-07 2E-06 0.0027 2E-05 0.0024 7E-05 2E-07 4E-05 6E-05 9E-07 2E-06 4E-05
Pharmacology, Toxicology and Pharmaceutics0.0005 0.0005 8E-07 0.0034 3E-06 0.0001 0.0005 3E-05 3E-07 3E-05 6E-06 2E-05 0.0002 0.0003 0.0005 0.0002 1E-05 0.0028 0.001 8E-05 0.0083 6E-05 6E-05 2E-05 2E-05 6E-06 3E-05
Physics and Astronomy 0.0017 9E-05 1E-05 0.0006 3E-06 0.0011 0.0042 0.0006 1E-05 0.0008 4E-06 0.0003 0.0041 9E-05 9E-05 0.0041 0.0006 0.0001 5E-05 7E-07 7E-05 0.0785 5E-06 6E-06 8E-07 1E-06 2E-05
Psychology 9E-05 0.0001 0.0002 0.0003 0.0003 5E-06 2E-06 2E-05 4E-06 2E-06 4E-05 2E-06 3E-05 1E-05 1E-05 1E-07 1E-05 0.0017 0.0006 3E-05 7E-05 5E-06 0.0074 0.0006 1E-06 5E-07 2E-05
Social Sciences 8E-05 0.0002 0.0002 0.0001 0.0005 2E-05 3E-05 0.0002 2E-05 7E-05 0.0005 7E-05 0.0002 0.0002 7E-05 1E-05 7E-05 0.001 6E-05 5E-05 3E-05 8E-06 0.0007 0.0148 3E-06 2E-06 1E-05
Veterinary 2E-05 0.0001 7E-08 0.0003 2E-05 2E-06 6E-06 1E-06 6E-08 1E-06 2E-08 1E-07 3E-06 3E-05 0.0002 1E-06 3E-07 0.0003 2E-05 3E-06 4E-05 1E-06 3E-06 2E-06 0.0026 9E-07 4E-06
Dentistry 6E-06 5E-06 6E-08 9E-05 4E-09 2E-06 2E-06 4E-07 3E-08 1E-08 1E-08 1E-08 4E-05 1E-06 4E-05 3E-05 1E-07 0.0003 5E-06 1E-06 9E-06 1E-06 7E-07 1E-06 2E-07 0.0026 6E-07
Health Professions 1E-05 3E-05 2E-05 0.0002 2E-06 2E-06 2E-05 1E-05 8E-07 2E-07 1E-05 2E-05 3E-05 4E-06 2E-05 9E-07 3E-06 0.0008 8E-05 6E-05 3E-05 2E-05 3E-05 1E-05 4E-07 6E-07 0.0023
24
Figure 4: Network formed by the Prestige SJR2 transferred between Subject Areas. The width of each node is proportional to the number of documents, the height to the citations received, and the grey scale to the accumulated Prestige SJR2. The thickness of the links is proportional to the Prestige SJR2 transferred.
25
5. Conclusions
Beyond the metrics of the prestige of scientific journals which weight the
Citation in terms of the prestige of the citing journal, the present SJR2 indicator solves
the problem of the tendency for prestige scores to decrease over time by the use of
stochastic matrices. It endows the resulting scores with meaning, and uses the cosine
between the cocitation profiles of the citing and cited journals to weight the thematic
relationship between the two journals.
The problem of the tendency for the scores to decrease as the calculation
incorporates ever more journals and documents is overcome by dividing a journal's
portion of prestige gained by the portion of citable documents. This means that if the
journal is precisely at the mean, the two portions will be the same and the score will
be unity. A higher score will mean that the portion of prestige is greater than that of
citable documents, and vice versa. At the same time, this makes the weighted average
of the scores obtained by the journals remain constant and equal to unity for every
year, regardless of the number of scientific journals or documents counted in the
calculation.
Using the cosine of the cocitation profiles is equivalent to assigning greater
weight to citations to thematically close journals. For example, it increases the weight
of citations to journals in the same Subject Area, and especially in the same Specific
Subject Area. On the contrary, it decreases the weight of citations to scientific journals
in other areas in which one must presume that the citing journal is of less authority.
This leads to greatly equalizing the distribution by Subject Area, and especially by
Specific Subject Area, and makes scores from different areas more comparable, all
without using any arbitrary classification of journals or weights to apply to the
citations.
While the resulting indicator has high Pearson and Spearman coefficients of
correlation with the SNIP and JIF metrics overall, and by Subject Area and Specific
26
Subject Area, in our opinion it represents a step forward towards the best
representation of the real prestige of scientific journals.
6. Acknowledgments
This work was financed by the Junta de Extremadura e Consejería de Educación
Ciencia & Tecnología and the Fondo Social Europeo as part of Research Group grant
GR10019, and by the Plan Nacional de Investigación Científica, Desarrollo e Innovación
Tecnológica 2008e2011 and the Fondo Europeo de Desarrollo Regional (FEDER) as part
of research projects TIN2008-06514-C02-01 and TIN2008-06514-C02-02.
7. References
Bar-Ilan, J. (2008) Which h-index? — A comparison of WoS, Scopus and Google Scholar.
Scientometrics 74(2), 257-271
Bergstrom, C. (2007) Eigenfactor: Measuring the value and prestige of scholarly
journals. College & Research Libraries News 68(5), 314–316.
Bollen, J., Rodriguez, M.A. & van de Sompel, H. (2006). Journal status, Scientometrics,
69(3), 669–687.
Bonacich, P. (1987), Power and centrality: A family of measures. American Journal of
Sociology, 92(5), 1170–1182.
Brooks, T.A. (1985). Private acts and public objects: an investigation of citer
motivations. Journal of the American Society for Information Science, 36(4):
223-229.
Garfield, E. (2006). The history and meaning of the journal impact factor. JAMA-Journal
of the American Medical Association, 295(1), 90-93.
González-Pereira, B., Guerrero-Bote, V. P., & Moya-Anegón, F. (2010). A new approach
to the metric of journals ’ scientific prestige : The SJR indicator. Journal of
Informetrics, 4(3), 379-391. doi: 10.1016/j.joi.2010.03.002.
27
Guerrero-Bote, V. P., Zapico-Alonso, F., Espinosa-Calvo, M. E., Gómez-Crisóstomo, R., &
Moya-Anegón, F. (2007). The Iceberg Hypothesis: Import-Export of Knowledge
between scientific subject categories. Scientometrics 71(3): 423-441.
Jacso, P. (2009). Péter’s Digital Reference Shelf. Scopus. Available at:
http://www.gale.cengage.com/reference/peter/200906/scopus.html.
[Accessed: 1 October 2009]
Kostoff, R. N. (1997). The principles and practices of peer review. Science and
Engineering Ethics, 3: 19-34.
Moed, H.F. (2005). Citation analysis in research evaluation. Dordrecht; Springer, p. 346.
Moed, H.F. (2010). Measuring contextual citation impact of scientific journals. Journal
of Informetrics, 4(3), 265–277.
Laguardia, C. (2005), E-views and reviews: Scopus vs. Web of Science. Library Journal,
15. Available at: http://www.libraryjournal.com/article/CA491154.html%2522.
[Accessed: 1 October 2009]
Lancho-Barrantes, B.S., Guerrero-Bote, V.P., & Moya-Anegón, F. (2010a). The iceberg
hypothesis revisited. Scientometrics, 85 (2) 443-461.
Lancho-Barrantes, B.S., Guerrero-Bote, V.P., & Moya-Anegón, F. (2010b). What lies
behind the averages and significance of citation indicators in different
disciplines? Journal of Information Science. 36 (3), 371-382.
Leydesdorff, L., Moya-Anegón, F. & Guerrero-Bote, V.P. (2010). Journal maps on the
basis of Scopus data: A comparison with the Journal Citation Reports of the ISI.
Journal of the American Society for Information Science and Technology, 61 (2),
352-369.
28
Janssens, F., Zhang, L., Moor, B. & Glänzel, W. (2009). Hybrid clustering for validation
and improvement of subject-classification schemes. Information Processing and
Management 45, 683–702.
Lundberg, J. (2007). Lifting the crown—citation z-score. Journal of Informetrics, 1, 145–
154 .
Marshakova, I. V. (1973) System of document connection based on references,
Nauchno-Teknichescaya Informatisya, Series II (6): 3-8.
McCain, K. W. (1991). Mapping economics through the journal literature: An
experiment in journal cocitation analysis. Journal of the American Society for
Information Science, 42(4), 290-296. doi: 10.1002/(SICI)1097-
4571(199105)42:4<290::AID-ASI5>3.0.CO;2-9.
Moed, H.F. (2005). Citation Analysis in research evaluation. Dordrecht; Springer, p.
346.
Moya-Anegón, F., Chinchilla-Rodríguez, Z., Vargas-Quesada, B., Corera-Álvarez, E.,
Muñoz-Fernández, F. J., González-Molina, A. & Herrero-Solana, V. (2007).
Coverage analysis of Scopus: A journal metric approach. Scientometrics, 73, (1)
, 53-78.
Moya-Anegón, F., Vargas-Quesada, B., Herrero-Solana, V., Chinchilla-Rodríguez, Z.,
Corera-Álvarez, E., & Muñoz-Fernández, F. J. (2004). A new technique for
building maps of large scientific domains based on the cocitation of classes and
categories. Scientometrics, 61(1), 129-145. doi:
10.1023/B:SCIE.0000037368.31217.34.
Page, L., Brin, S., Motwani, R. & Winograd, T. (1998). The PageRank citation ranking:
Bringing order to the Web. Technical report, Stanford University, Stanford, CA,
1998.
Palacios-Huerta, I & Volij, O. (2004). The measurement of intellectual influence.
Econometrica, 72(3), 963-977.
29
Pinski, G. & Narin, F. (1976), Citation influence for journal aggregates of scientific
publications: Theory, with application to the literature of physics. Information
Processing and Management, 12, 297-312.
SCImago Journal and Country Rank. SCImago Research Group. Available at:
http://www.scimagojr.com [Accessed: 20 October 2011].
Small, H. (1973). Co-citation in the scientific literature: a new measure of the
relationship between two documents, Journal of the American Society for
Information Science (JASIS), 24, 265-269.
White, H. D., Mccain, K. W. (1998). Visualizing a discipline: an author co-citation
analysis of information science, 1972-1995, Journal of the American Society for
Information Science (JASIS), 49, 327-355.