Embed Size (px)
Citation preview
103
C H A P T E R 3
ACHIEVEMENTS AND CHALLENGES IN THE U.S. LABOR MARKET
A fundamental metric for judging an economy’s performance is its suc‑cess in providing abundant job opportunities that pay good wages
and provide an opportunity to get ahead. Five‑and‑one‑half years ago—in the wake of the worst financial crisis since the Great Depression—the U.S. economy faced a massive challenge, as GDP shrank and the number of jobless workers rose to more than 15 million. Since then, a successful multifaceted policy response, including actions by the President, Congress, and the Federal Reserve, combined with the determination of the American people, has enabled the U.S. economy to dig out of that deep hole, putting more people back to work, reducing the unemployment rate, and creating a virtuous cycle in which higher consumer purchasing power supports greater economic activity and job creation. After four years of recovery in employment, in 2014, the unemployment rate declined at its most rapid rate in nearly three decades. By the end of the year, it had fallen to 5.6 percent, close to its pre‑recession average of 5.3 percent.1 But the United States labor market still has more work to do to achieve the full health that comes with not just low levels of unemployment, but also a labor market that encourages labor force participation, supports quality jobs, and facilitates productive matching of workers and positions—all of which are essential to creating well‑paying jobs and supporting robust family incomes.
This chapter begins by discussing the substantial progress that has been made in healing the labor market since 2009, and the acceleration in progress seen throughout 2014. By October 2014, the unemployment rate had fallen more rapidly over the preceding 12 months than in any 12‑month
1 Bureau of Labor Statistics, Current Population Survey; CEA calculations. Throughout this chapter, unless otherwise specified, data and statistics are from the Bureau of Labor Statistics Current Population Survey or CEA calculations from these data.
104 | Chapter 3
period since 1984. The sharp drop in unemployment came amid a stabiliza‑tion in the labor force participation rate and, for the year as a whole busi‑nesses added 3.0 million jobs—the most in any year since 1997. Moreover, nominal wage growth for production and nonsupervisory workers—a group that represents about 80 percent of workers who have lower earnings on average—continued to rise slightly faster than inflation, a reversal from what had been seen earlier in the recovery. Real wage growth was aided by low levels of inflation, including declining prices in the fourth quarter of 2014. Moreover, workers’ take‑home pay was helped by the fact that a typical worker’s contribution to employer‑sponsored family health insur‑ance coverage rose at roughly one‑half the rate seen on average prior to the recession, continuing a recent trend of subdued health cost growth. Finally, 2014 continued to see the economy shift away from part‑time work toward full‑time work, as all of the employment growth was in full‑time jobs. Over the course of the recovery, the share of the labor market in full‑time jobs has increased and by the end of 2014, the number of Americans holding full‑time jobs had increased more from January 2010 than it had added total jobs over the same period.
Despite these positive developments, more work remains to both complete the cyclical recovery and address underlying structural issues that predate the recession, some of which have been present for decades. As described in Chapter 1, three key factors shape the economic situation of the middle class: productivity growth, the distribution of income, and labor force participation. As Chapter 1 also notes, due to a combination of long‑term economic challenges and the Great Recession, the middle class has seen little improvement in real incomes since 1997 despite productivity growth, signaling at least one area where much work remains to be done in the labor market and overall economy.
After reviewing the notable progress in the labor market over 2014, this chapter steps back to consider a set of five long‑run issues the labor market must address. These are: i) a long‑standing decline in the participation rate that has been compounded by the recession and the retirement boom; ii) a rapidly recovering long‑term unemployment rate that nonetheless remains elevated; iii) a similar pattern of rapid decline but continued elevation in the rate of people working part time but who are seeking full‑time employment; iv) cyclical improvements in labor market fluidity that are set against a back‑drop of a long‑term decline in a variety of metrics of labor market fluidity, or labor market “churn”; and v) real wage growth that is beginning to pick up but is still insufficient. These phenomena have, to varying degrees, been building up in the years or decades before the Great Recession and, in many cases, are following patterns similar to those in other recent recessions,
Achievements and Challenges in the U.S. Labor Market | 105
particularly those from 1980 on. This suggests that these issues are linked – for example, when a shock hits the economy, less labor market fluidity can result in more long‑term unemployment and part‑time employment and a lower participation rate than would occur if the labor market were more dynamic. In many cases, the increasingly rapid recovery in the labor market will help to address these challenges. In some cases, these trends may reflect a natural progression that would be undesirable to reverse, such as rising retirements among aging workers. However, additional policy steps are needed to counteract the continued effects of the Great Recession as well as longer‑term trends that predated it. Consequently, this chapter concludes by laying out key elements of the President’s middle‑class economics agenda, which includes policies aimed at growing and supporting middle‑class families, strengthening the labor market and expanding economic oppor‑tunity. As the past several years suggest, economic policies that focus on strengthening the middle class create a stronger foundation for shared and sustainable growth in the years to come.
The State of the U.S. Labor Market in 2014
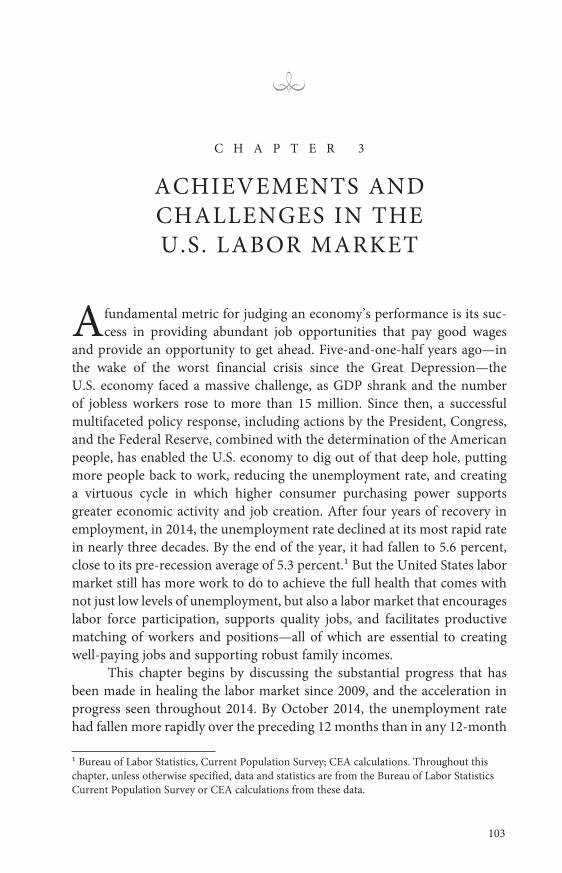
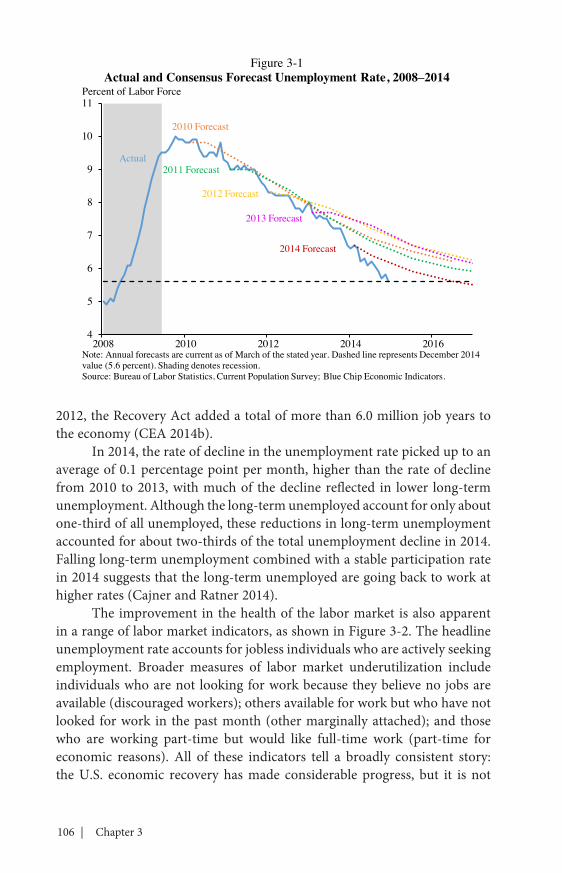
Since the end of the Great Recession in 2009, the economy has made enormous strides toward recovery, in terms of output, labor market indicators, consumer confidence, and numerous other measures. Perhaps no recent economic development has been more surprising than the rapid fall in the unemployment rate and commensurate pickup in the rate of job growth in 2014, which far outperformed forecast expectations. From its 2001‑07 average of 5.3 percent, the unemployment rate hit 10.0 percent in October 2009; but as of December 2014, the rate stands at 5.6 percent, having recovered 93 percent of the way back to its pre‑recession average.2 Notably, 2014 marked the strongest year of job growth since 1999 and the strongest year of private‑sector job growth since 1997. December’s 5.6‑per‑cent unemployment rate was achieved roughly five years ahead of consensus forecasts made as recently as 2013, as shown in Figure 3‑1.
In part due to a vigorous policy response to the economic crisis, the United States is in a sustained economic recovery. The Administration’s early actions, including the American Recovery and Reinvestment Act of 2009 and middle‑class tax cuts, helped catalyze this recovery: the Council of Economic Advisers (CEA) estimates that between early 2009 and the end of
2 Throughout this chapter, the phrase “pre‑recession average” refers to the average between December 2001 and December 2007, the most recent expansionary period before the Great Recession.
106 | Chapter 3
2012, the Recovery Act added a total of more than 6.0 million job years to the economy (CEA 2014b).
In 2014, the rate of decline in the unemployment rate picked up to an average of 0.1 percentage point per month, higher than the rate of decline from 2010 to 2013, with much of the decline reflected in lower long‑term unemployment. Although the long‑term unemployed account for only about one‑third of all unemployed, these reductions in long‑term unemployment accounted for about two‑thirds of the total unemployment decline in 2014. Falling long‑term unemployment combined with a stable participation rate in 2014 suggests that the long‑term unemployed are going back to work at higher rates (Cajner and Ratner 2014).
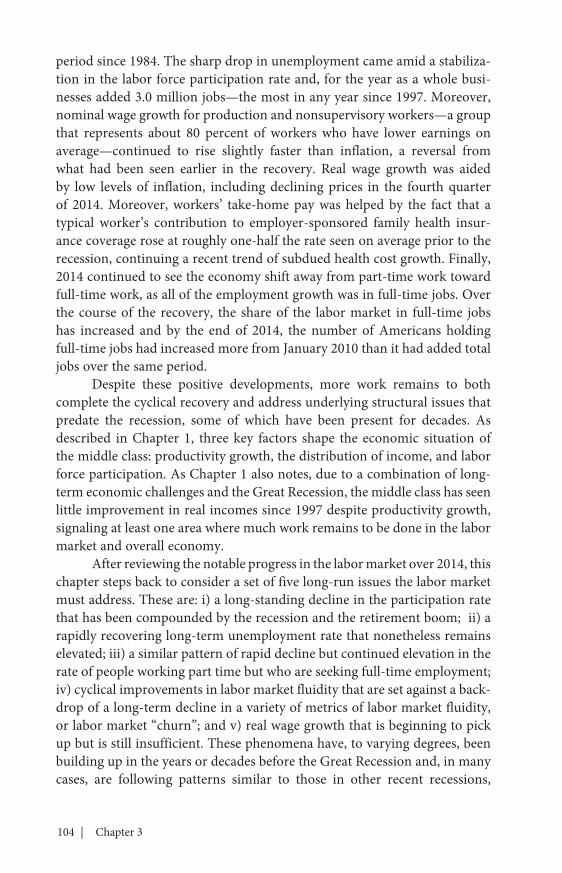
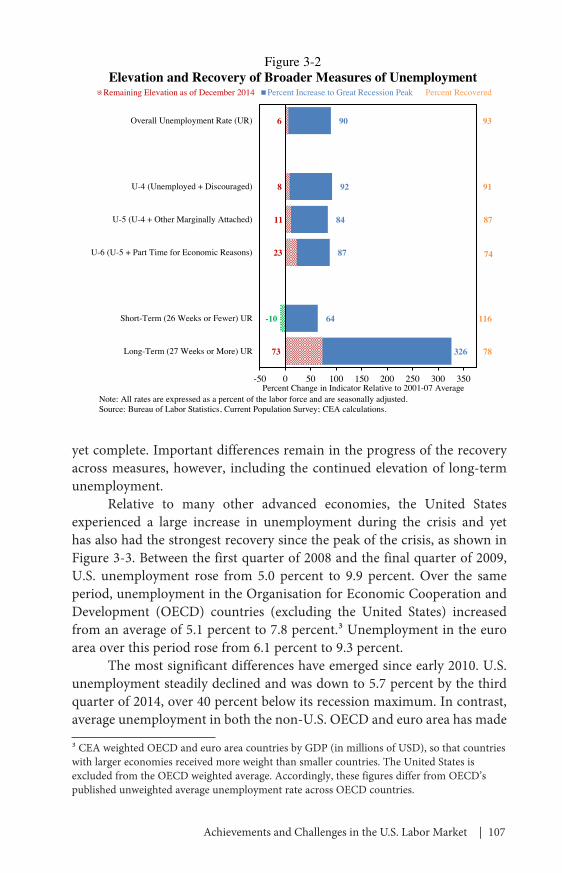
The improvement in the health of the labor market is also apparent in a range of labor market indicators, as shown in Figure 3‑2. The headline unemployment rate accounts for jobless individuals who are actively seeking employment. Broader measures of labor market underutilization include individuals who are not looking for work because they believe no jobs are available (discouraged workers); others available for work but who have not looked for work in the past month (other marginally attached); and those who are working part‑time but would like full‑time work (part‑time for economic reasons). All of these indicators tell a broadly consistent story: the U.S. economic recovery has made considerable progress, but it is not
4
5
6
7
8
9
10
11
2008 2010 2012 2014 2016
2012 Forecast
2013 Forecast
2014 Forecast
2011 Forecast
2010 Forecast
Figure 3-1Actual and Consensus Forecast Unemployment Rate, 2008–2014
Percent of Labor Force
Note: Annual forecasts are current as of March of the stated year. Dashed line represents December 2014 value (5.6 percent). Shading denotes recession. Source: Bureau of Labor Statistics, Current Population Survey; Blue Chip Economic Indicators.
Actual
Achievements and Challenges in the U.S. Labor Market | 107
yet complete. Important differences remain in the progress of the recovery across measures, however, including the continued elevation of long‑term unemployment.
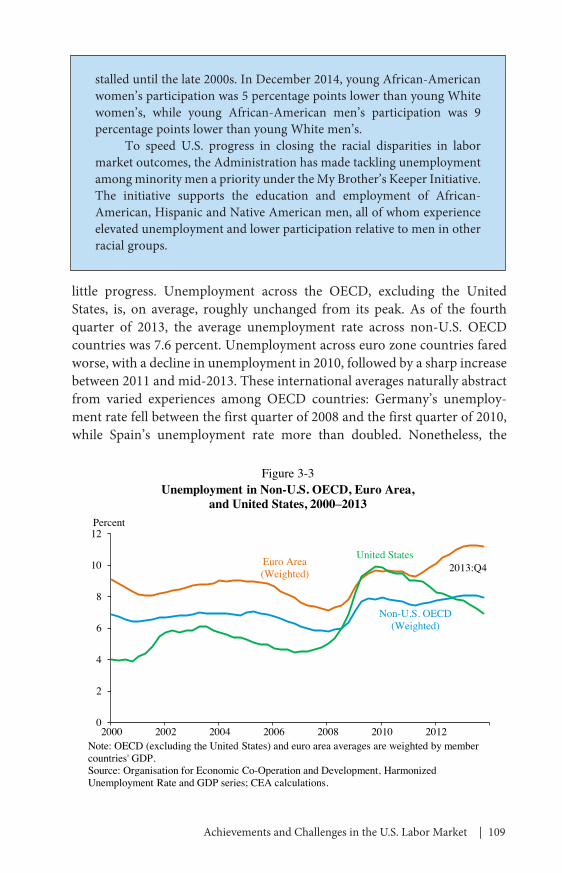
Relative to many other advanced economies, the United States experienced a large increase in unemployment during the crisis and yet has also had the strongest recovery since the peak of the crisis, as shown in Figure 3‑3. Between the first quarter of 2008 and the final quarter of 2009, U.S. unemployment rose from 5.0 percent to 9.9 percent. Over the same period, unemployment in the Organisation for Economic Cooperation and Development (OECD) countries (excluding the United States) increased from an average of 5.1 percent to 7.8 percent.3 Unemployment in the euro area over this period rose from 6.1 percent to 9.3 percent.
The most significant differences have emerged since early 2010. U.S. unemployment steadily declined and was down to 5.7 percent by the third quarter of 2014, over 40 percent below its recession maximum. In contrast, average unemployment in both the non‑U.S. OECD and euro area has made
3 CEA weighted OECD and euro area countries by GDP (in millions of USD), so that countries with larger economies received more weight than smaller countries. The United States is excluded from the OECD weighted average. Accordingly, these figures differ from OECD’s published unweighted average unemployment rate across OECD countries.
78
116
74
87
91
93
326
64
87
84
92
90
73
-10
23
11
8
6
-50 0 50 100 150 200 250 300 350
Long-Term (27 Weeks or More) UR
Short-Term (26 Weeks or Fewer) UR
U-6 (U-5 + Part Time for Economic Reasons)
U-5 (U-4 + Other Marginally Attached)
U-4 (Unemployed + Discouraged)
Overall Unemployment Rate (UR)
Remaining Elevation as of December 2014 Percent Increase to Great Recession Peak Percent Recovered
Percent Change in Indicator Relative to 2001-07 Average
Figure 3-2Elevation and Recovery of Broader Measures of Unemployment
Note: All rates are expressed as a percent of the labor force and are seasonally adjusted.Source: Bureau of Labor Statistics, Current Population Survey; CEA calculations.
108 | Chapter 3
Box 3-1: Unemployment Across Gender, Race, and Ethnicity Groups: The Situation for Men of Color
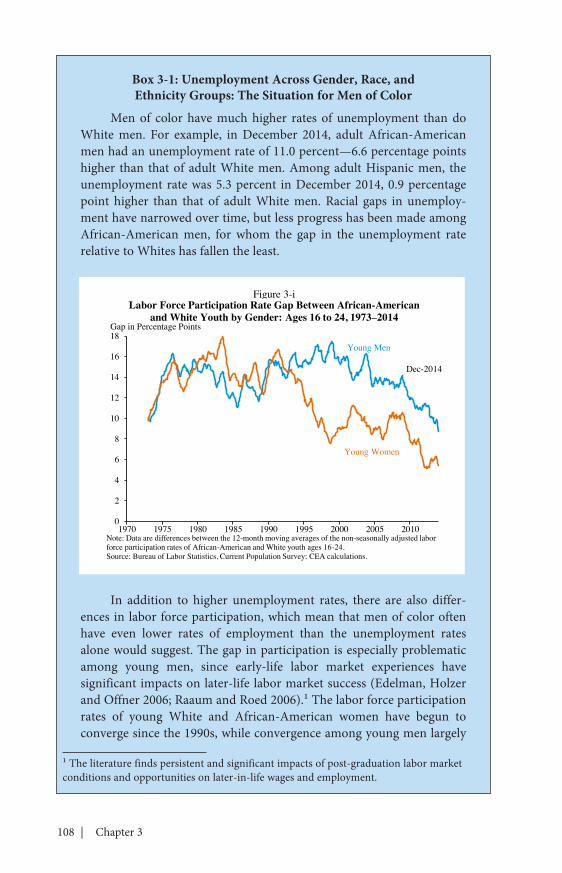
Men of color have much higher rates of unemployment than do White men. For example, in December 2014, adult African‑American men had an unemployment rate of 11.0 percent—6.6 percentage points higher than that of adult White men. Among adult Hispanic men, the unemployment rate was 5.3 percent in December 2014, 0.9 percentage point higher than that of adult White men. Racial gaps in unemploy‑ment have narrowed over time, but less progress has been made among African‑American men, for whom the gap in the unemployment rate relative to Whites has fallen the least.
In addition to higher unemployment rates, there are also differ‑ences in labor force participation, which mean that men of color often have even lower rates of employment than the unemployment rates alone would suggest. The gap in participation is especially problematic among young men, since early‑life labor market experiences have significant impacts on later‑life labor market success (Edelman, Holzer and Offner 2006; Raaum and Roed 2006).1 The labor force participation rates of young White and African‑American women have begun to converge since the 1990s, while convergence among young men largely
1 The literature finds persistent and significant impacts of post‑graduation labor market conditions and opportunities on later‑in‑life wages and employment.
Young Men
Young Women
0
2
4
6
8
10
12
14
16
18
1970 1975 1980 1985 1990 1995 2000 2005 2010
Figure 3-iLabor Force Participation Rate Gap Between African-American
and White Youth by Gender: Ages 16 to 24, 1973–2014Gap in Percentage Points
Note: Data are differences between the 12-month moving averages of the non-seasonally adjusted labor force participation rates of African-American and White youth ages 16-24.Source: Bureau of Labor Statistics, Current Population Survey; CEA calculations.
Dec-2014
Achievements and Challenges in the U.S. Labor Market | 109
little progress. Unemployment across the OECD, excluding the United States, is, on average, roughly unchanged from its peak. As of the fourth quarter of 2013, the average unemployment rate across non‑U.S. OECD countries was 7.6 percent. Unemployment across euro zone countries fared worse, with a decline in unemployment in 2010, followed by a sharp increase between 2011 and mid‑2013. These international averages naturally abstract from varied experiences among OECD countries: Germany’s unemploy‑ment rate fell between the first quarter of 2008 and the first quarter of 2010, while Spain’s unemployment rate more than doubled. Nonetheless, the
Non-U.S. OECD (Weighted)
Euro Area (Weighted) 2013:Q4
United States
0
2
4
6
8
10
12
2000 2002 2004 2006 2008 2010 2012
Figure 3-3Unemployment in Non-U.S. OECD, Euro Area,
and United States, 2000–2013Percent
Note: OECD (excluding the United States) and euro area averages are weighted by member countries' GDP. Source: Organisation for Economic Co-Operation and Development, Harmonized Unemployment Rate and GDP series; CEA calculations.
stalled until the late 2000s. In December 2014, young African‑American women’s participation was 5 percentage points lower than young White women’s, while young African‑American men’s participation was 9 percentage points lower than young White men’s.
To speed U.S. progress in closing the racial disparities in labor market outcomes, the Administration has made tackling unemployment among minority men a priority under the My Brother’s Keeper Initiative. The initiative supports the education and employment of African‑American, Hispanic and Native American men, all of whom experience elevated unemployment and lower participation relative to men in other racial groups.
110 | Chapter 3
recovery in the U.S. unemployment rate compares favorably against the general experience of other advanced economies.
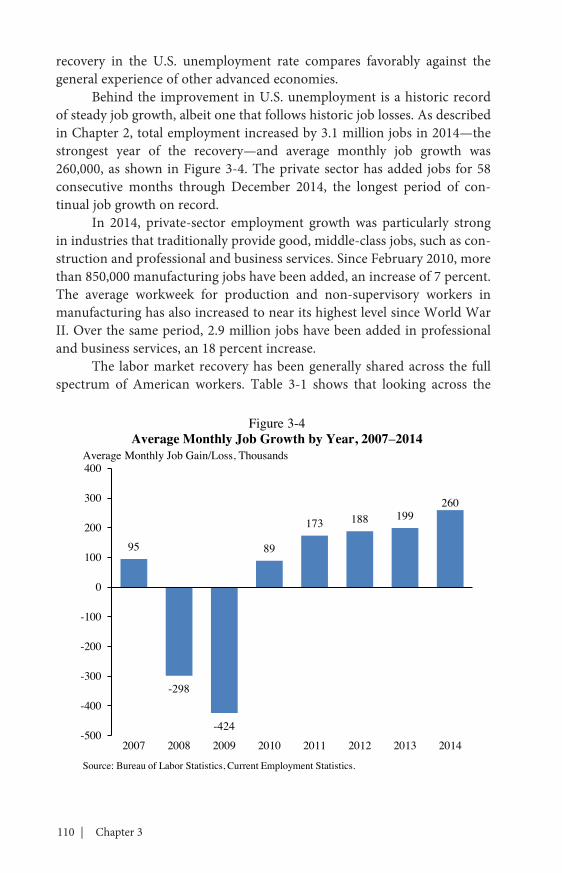
Behind the improvement in U.S. unemployment is a historic record of steady job growth, albeit one that follows historic job losses. As described in Chapter 2, total employment increased by 3.1 million jobs in 2014—the strongest year of the recovery—and average monthly job growth was 260,000, as shown in Figure 3‑4. The private sector has added jobs for 58 consecutive months through December 2014, the longest period of con‑tinual job growth on record.
In 2014, private‑sector employment growth was particularly strong in industries that traditionally provide good, middle‑class jobs, such as con‑struction and professional and business services. Since February 2010, more than 850,000 manufacturing jobs have been added, an increase of 7 percent. The average workweek for production and non‑supervisory workers in manufacturing has also increased to near its highest level since World War II. Over the same period, 2.9 million jobs have been added in professional and business services, an 18 percent increase.
The labor market recovery has been generally shared across the full spectrum of American workers. Table 3‑1 shows that looking across the
95
-298
-424
89
173 188 199260
1900
-500
-400
-300
-200
-100
0
100
200
300
400
2007 2008 2009 2010 2011 2012 2013 2014
Source: Bureau of Labor Statistics, Current Employment Statistics.
Figure 3-4Average Monthly Job Growth by Year, 2007–2014
Average Monthly Job Gain/Loss, Thousands

Achievements and Challenges in the U.S. Labor Market | 111
population by racial, gender, and educational differences, most groups are at least 90 percent recovered, and those that have not reached that point are close to it.
The 1.2 percentage‑point fall in the annual unemployment rate in 2014 was the largest such drop since 1984, and some groups experienced even larger declines in unemployment. Both the Hispanic and African‑American annual unemployment rates fell by 1.7 percentage point in 2014, one of the largest declines in series history. As of December 2014, the African‑American unemployment rate had recovered 91 percent of the way back to its pre‑recession average, compared to 100 percent for Hispanics, 87 percent for Asians, and 96 percent for White workers.
The labor market gained strength in 2014, and numerous indicators illustrate that the recovery is robust. Now that much of the direct challenges of the recession are behind us, the United States must turn its attention to ensuring that the benefits of the recovery are widespread, benefiting more
Table 3-1Tracking the Recovery Across Race, Gender, Age, and
Level of Educational Attainment
Pre-Recession Average
Percent Increase to Great Recessi-on Peak
Remaining Elevation
as of December
2014 (Percent)
Percent Recovered
Overall Unemployment Rate (UR) 5.3 90 6 93
Male UR 5.4 106 8 93Female UR 5.2 74 3 96
White UR 4.6 99 4 96African-American UR 9.8 72 6 91Hispanic UR 6.5 99 0 100Asian UR 4.5 72 9 87
Less than High School UR 7.9 100 9 91High School Graduates UR 4.8 127 9 93Some College UR 4.1 117 20 83College Graduates UR 2.5 99 15 85
Age 16-24 UR 11.4 71 8 88Age 25-54 UR 4.3 108 8 92Note: Asian unemployment rate is a 12-month moving average of not seasonally adjusted data.Source: Bureau of Labor Statistics, Current Population Survey; CEA calculations.
112 | Chapter 3
middle‑class families. This requires addressing five longer‑run challenges in the labor market. The following sections discuss each of these challenges in greater detail.
Labor Force Participation
The decline in the unemployment rate in the economic recovery has been driven by the increased pace of job creation. In addition to the decline in the traditional unemployment rate, a broader measure that also includes discouraged workers and people who would like to work if a job were avail‑able (U‑5) has come down from a high of 11.4 percent in October 2009 to 6.9 percent in December 2014, or 87 percent of the way back to its pre‑recession average.
At the same time, the economy has continued to go through a sub‑stantial change in labor force participation. Since peaking in the first quarter of 2000 at 67.3 percent, the labor force participation rate declined to 62.8 in the fourth quarter of 2014. A large portion of this decline is explained by the lower participation rates of an aging labor force and, in spite of continued demographic pressures in this direction, the participation rate has held steady since October 2013. This suggests that a stronger labor market is bringing people back into the labor force, partially off‑setting the increasing size of the retirement‑age population. Nevertheless, the participation rate is unlikely to return to its peak rate in the near future. This section examines the role of the aging baby boomers in driving declining participation, as well as the lesser but important roles of a decades‑long downward trend in male labor force participation and a more recent slight trend decline in female labor force participation discussed in Chapter 1.
A Longer-Term Perspective on Labor Force ParticipationThe labor force participation rate, defined as the share of the
population ages 16 and older who are working, or who are actively seeking employment, is an important measure of labor market potential and health. Labor force nonparticipation is not always a source of concern—many non‑participators are seniors enjoying their retirements, young people investing in education, or parents caring for their children. However, low labor force participation—particularly among people of prime working age (ages 25 through 54) — is evidence that we can do more to create job prospects and support workers. Moreover, low labor force participation may mean that, even when good economic times return, mobilizing the pool of available workers will take more time.
Achievements and Challenges in the U.S. Labor Market | 113
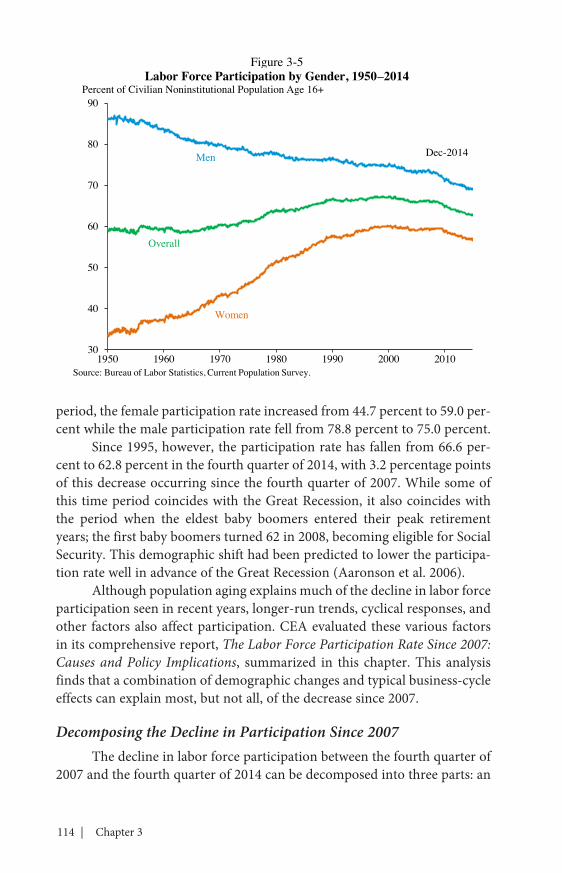
Taking a longer view, as in Figure 3‑5, the labor force participation rate increased from 60.8 percent to 66.6 percent between 1973 and 1995. As described in Chapter 1, this increase during the “Age of Participation” can be entirely accounted for by increased participation among women: over this
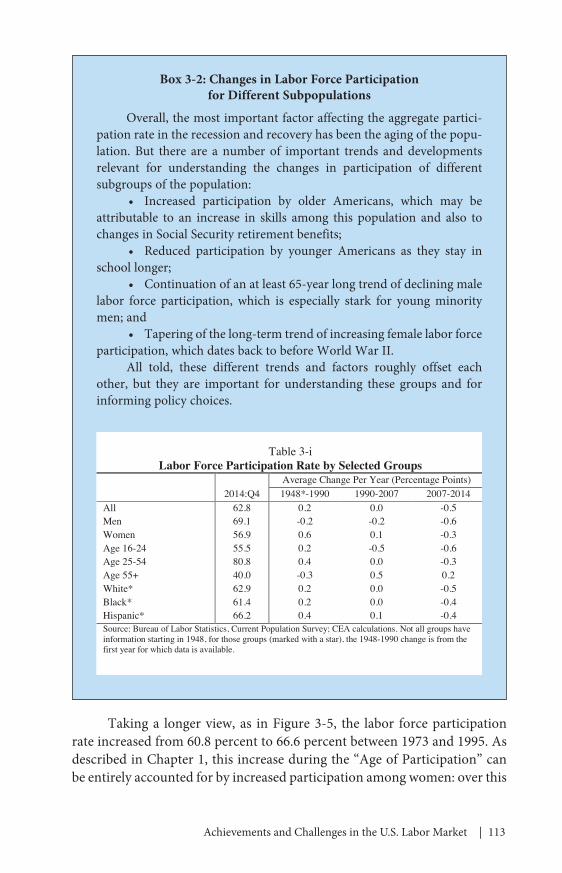
Box 3-2: Changes in Labor Force Participation for Different Subpopulations
Overall, the most important factor affecting the aggregate partici‑pation rate in the recession and recovery has been the aging of the popu‑lation. But there are a number of important trends and developments relevant for understanding the changes in participation of different subgroups of the population:
• Increased participation by older Americans, which may be attributable to an increase in skills among this population and also to changes in Social Security retirement benefits;
• Reduced participation by younger Americans as they stay in school longer;
• Continuation of an at least 65‑year long trend of declining male labor force participation, which is especially stark for young minority men; and
• Tapering of the long‑term trend of increasing female labor force participation, which dates back to before World War II.
All told, these different trends and factors roughly offset each other, but they are important for understanding these groups and for informing policy choices.
Table 3-iLabor Force Participation Rate by Selected Groups
2014:Q4Average Change Per Year (Percentage Points)1948*-1990 1990-2007 2007-2014
All 62.8 0.2 0.0 -0.5Men 69.1 -0.2 -0.2 -0.6Women 56.9 0.6 0.1 -0.3Age 16-24 55.5 0.2 -0.5 -0.6Age 25-54 80.8 0.4 0.0 -0.3Age 55+ 40.0 -0.3 0.5 0.2White* 62.9 0.2 0.0 -0.5Black* 61.4 0.2 0.0 -0.4Hispanic* 66.2 0.4 0.1 -0.4Source: Bureau of Labor Statistics, Current Population Survey; CEA calculations. Not all groups have information starting in 1948, for those groups (marked with a star), the 1948-1990 change is from the first year for which data is available.
114 | Chapter 3
period, the female participation rate increased from 44.7 percent to 59.0 per‑cent while the male participation rate fell from 78.8 percent to 75.0 percent.
Since 1995, however, the participation rate has fallen from 66.6 per‑cent to 62.8 percent in the fourth quarter of 2014, with 3.2 percentage points of this decrease occurring since the fourth quarter of 2007. While some of this time period coincides with the Great Recession, it also coincides with the period when the eldest baby boomers entered their peak retirement years; the first baby boomers turned 62 in 2008, becoming eligible for Social Security. This demographic shift had been predicted to lower the participa‑tion rate well in advance of the Great Recession (Aaronson et al. 2006).
Although population aging explains much of the decline in labor force participation seen in recent years, longer‑run trends, cyclical responses, and other factors also affect participation. CEA evaluated these various factors in its comprehensive report, The Labor Force Participation Rate Since 2007: Causes and Policy Implications, summarized in this chapter. This analysis finds that a combination of demographic changes and typical business‑cycle effects can explain most, but not all, of the decrease since 2007.
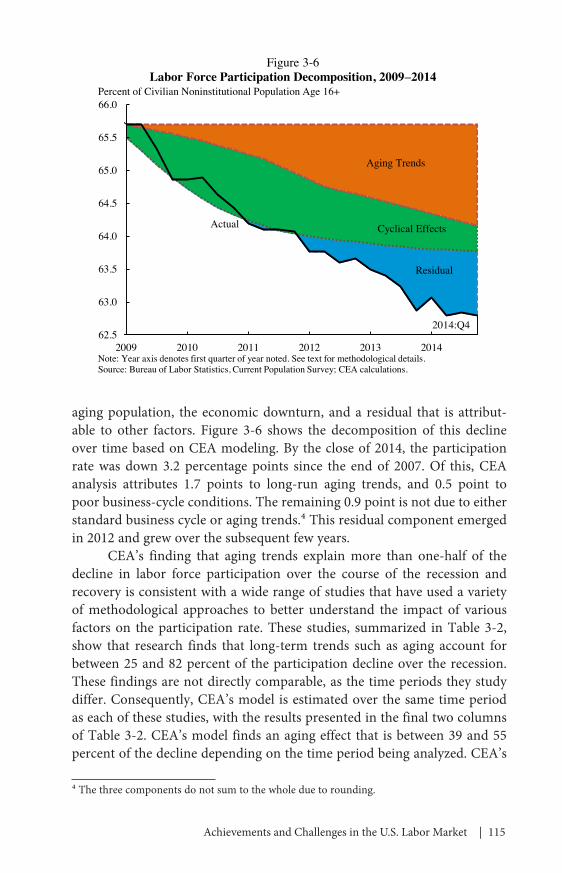
Decomposing the Decline in Participation Since 2007The decline in labor force participation between the fourth quarter of
2007 and the fourth quarter of 2014 can be decomposed into three parts: an
Men Dec-2014
Women
Overall
30
40
50
60
70
80
90
1950 1960 1970 1980 1990 2000 2010
Figure 3-5Labor Force Participation by Gender, 1950–2014
Percent of Civilian Noninstitutional Population Age 16+
Source: Bureau of Labor Statistics, Current Population Survey.
Achievements and Challenges in the U.S. Labor Market | 115
aging population, the economic downturn, and a residual that is attribut‑able to other factors. Figure 3‑6 shows the decomposition of this decline over time based on CEA modeling. By the close of 2014, the participation rate was down 3.2 percentage points since the end of 2007. Of this, CEA analysis attributes 1.7 points to long‑run aging trends, and 0.5 point to poor business‑cycle conditions. The remaining 0.9 point is not due to either standard business cycle or aging trends.4 This residual component emerged in 2012 and grew over the subsequent few years.
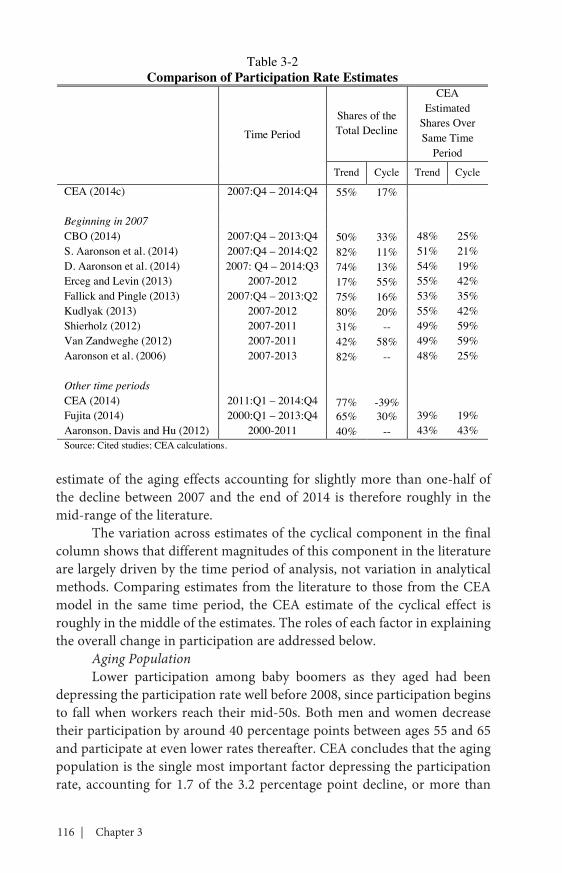
CEA’s finding that aging trends explain more than one‑half of the decline in labor force participation over the course of the recession and recovery is consistent with a wide range of studies that have used a variety of methodological approaches to better understand the impact of various factors on the participation rate. These studies, summarized in Table 3‑2, show that research finds that long‑term trends such as aging account for between 25 and 82 percent of the participation decline over the recession. These findings are not directly comparable, as the time periods they study differ. Consequently, CEA’s model is estimated over the same time period as each of these studies, with the results presented in the final two columns of Table 3‑2. CEA’s model finds an aging effect that is between 39 and 55 percent of the decline depending on the time period being analyzed. CEA’s
4 The three components do not sum to the whole due to rounding.
62.5
63.0
63.5
64.0
64.5
65.0
65.5
66.0
2009 2010 2011 2012 2013 2014
Figure 3-6Labor Force Participation Decomposition, 2009–2014
Percent of Civilian Noninstitutional Population Age 16+
Residual
Aging Trends
Cyclical EffectsActual
Note: Year axis denotes first quarter of year noted. See text for methodological details.Source: Bureau of Labor Statistics, Current Population Survey; CEA calculations.
2014:Q4
116 | Chapter 3
estimate of the aging effects accounting for slightly more than one‑half of the decline between 2007 and the end of 2014 is therefore roughly in the mid‑range of the literature.
The variation across estimates of the cyclical component in the final column shows that different magnitudes of this component in the literature are largely driven by the time period of analysis, not variation in analytical methods. Comparing estimates from the literature to those from the CEA model in the same time period, the CEA estimate of the cyclical effect is roughly in the middle of the estimates. The roles of each factor in explaining the overall change in participation are addressed below.
Aging PopulationLower participation among baby boomers as they aged had been
depressing the participation rate well before 2008, since participation begins to fall when workers reach their mid‑50s. Both men and women decrease their participation by around 40 percentage points between ages 55 and 65 and participate at even lower rates thereafter. CEA concludes that the aging population is the single most important factor depressing the participation rate, accounting for 1.7 of the 3.2 percentage point decline, or more than
Table 3-2Comparison of Participation Rate Estimates
Time Period
Shares of the Total Decline
CEA Estimated
Shares Over Same Time
Period
Trend Cycle Trend Cycle
CEA (2014c) 2007:Q4 – 2014:Q4 55% 17%
Beginning in 2007CBO (2014) 2007:Q4 – 2013:Q4 50% 33% 48% 25%S. Aaronson et al. (2014) 2007:Q4 – 2014:Q2 82% 11% 51% 21%D. Aaronson et al. (2014) 2007: Q4 – 2014:Q3 74% 13% 54% 19%Erceg and Levin (2013) 2007-2012 17% 55% 55% 42%Fallick and Pingle (2013) 2007:Q4 – 2013:Q2 75% 16% 53% 35%Kudlyak (2013) 2007-2012 80% 20% 55% 42%Shierholz (2012) 2007-2011 31% -- 49% 59%Van Zandweghe (2012) 2007-2011 42% 58% 49% 59%Aaronson et al. (2006) 2007-2013 82% -- 48% 25%
Other time periodsCEA (2014) 2011:Q1 – 2014:Q4 77% -39%Fujita (2014) 2000:Q1 – 2013:Q4 65% 30% 39% 19%Aaronson, Davis and Hu (2012) 2000-2011 40% -- 43% 43%Source: Cited studies; CEA calculations.
Achievements and Challenges in the U.S. Labor Market | 117
one‑half of the decline, since the end of 2007. This finding is robust to dif‑ferent methods of modeling the effect of aging on participation, as described in more detail in The Labor Force Participation Rate Since 2007: Causes and Policy Implications (CEA 2014c). The effect of aging has also been growing in magnitude in recent years. The youngest baby boomers will not turn 65 until 2029, so aging will continue to depress labor force participation in coming years.
Business-Cycle EffectsEconomic contractions historically result in both greater unemploy‑
ment and lower labor force participation (Elsby, Hobijn, and Sahin 2010). Therefore, while movements in the participation rate over decades are driven largely by the long‑term trends, in the short‑ and medium term, cyclical factors play a role.
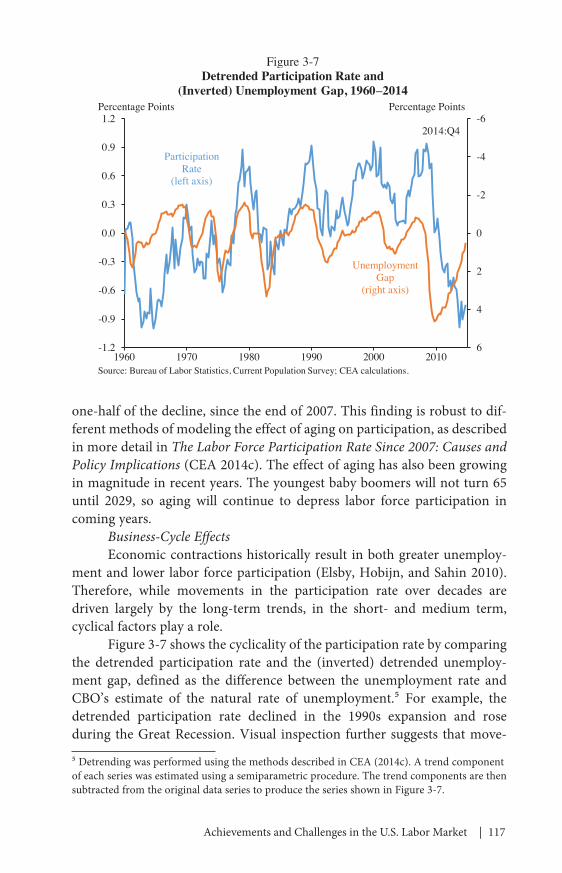
Figure 3‑7 shows the cyclicality of the participation rate by comparing the detrended participation rate and the (inverted) detrended unemploy‑ment gap, defined as the difference between the unemployment rate and CBO’s estimate of the natural rate of unemployment.5 For example, the detrended participation rate declined in the 1990s expansion and rose during the Great Recession. Visual inspection further suggests that move‑
5 Detrending was performed using the methods described in CEA (2014c). A trend component of each series was estimated using a semiparametric procedure. The trend components are then subtracted from the original data series to produce the series shown in Figure 3‑7.
Participation Rate
(left axis)
Unemployment Gap
(right axis)
-6
-4
-2
0
2
4
61960 1970 1980 1990 2000 2010
-1.2
-0.9
-0.6
-0.3
0.0
0.3
0.6
0.9
1.2
Figure 3-7Detrended Participation Rate and
(Inverted) Unemployment Gap, 1960–2014Percentage Points Percentage Points
Source: Bureau of Labor Statistics, Current Population Survey; CEA calculations.
2014:Q4
118 | Chapter 3
Box 3-3: Post-Recession Participation in the United States and United Kingdom
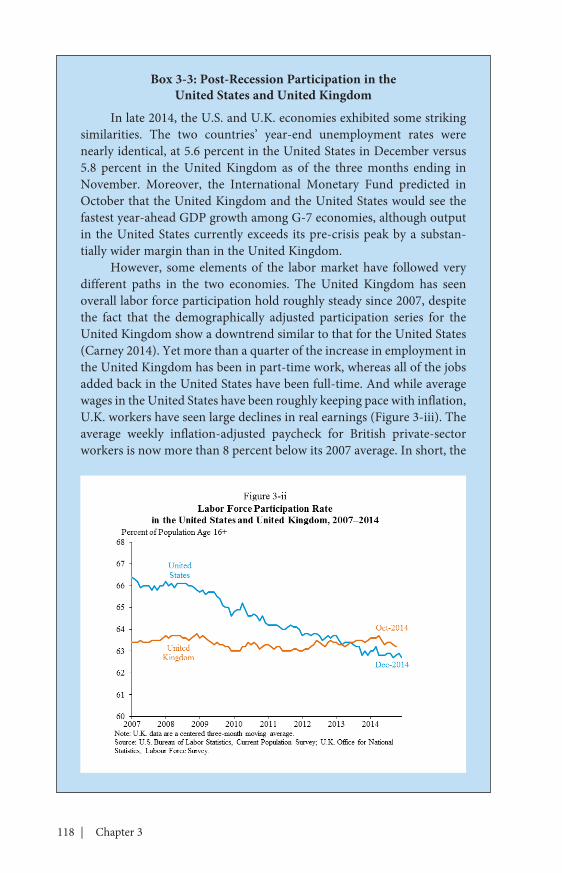
In late 2014, the U.S. and U.K. economies exhibited some striking similarities. The two countries’ year‑end unemployment rates were nearly identical, at 5.6 percent in the United States in December versus 5.8 percent in the United Kingdom as of the three months ending in November. Moreover, the International Monetary Fund predicted in October that the United Kingdom and the United States would see the fastest year‑ahead GDP growth among G‑7 economies, although output in the United States currently exceeds its pre‑crisis peak by a substan‑tially wider margin than in the United Kingdom.
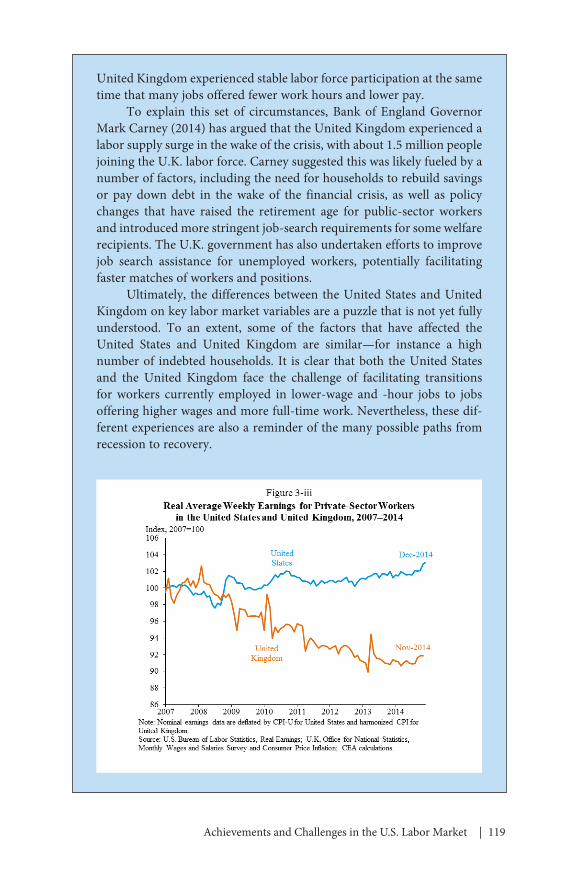
However, some elements of the labor market have followed very different paths in the two economies. The United Kingdom has seen overall labor force participation hold roughly steady since 2007, despite the fact that the demographically adjusted participation series for the United Kingdom show a downtrend similar to that for the United States (Carney 2014). Yet more than a quarter of the increase in employment in the United Kingdom has been in part‑time work, whereas all of the jobs added back in the United States have been full‑time. And while average wages in the United States have been roughly keeping pace with inflation, U.K. workers have seen large declines in real earnings (Figure 3‑iii). The average weekly inflation‑adjusted paycheck for British private‑sector workers is now more than 8 percent below its 2007 average. In short, the
Achievements and Challenges in the U.S. Labor Market | 119
United Kingdom experienced stable labor force participation at the same time that many jobs offered fewer work hours and lower pay.
To explain this set of circumstances, Bank of England Governor Mark Carney (2014) has argued that the United Kingdom experienced a labor supply surge in the wake of the crisis, with about 1.5 million people joining the U.K. labor force. Carney suggested this was likely fueled by a number of factors, including the need for households to rebuild savings or pay down debt in the wake of the financial crisis, as well as policy changes that have raised the retirement age for public‑sector workers and introduced more stringent job‑search requirements for some welfare recipients. The U.K. government has also undertaken efforts to improve job search assistance for unemployed workers, potentially facilitating faster matches of workers and positions.
Ultimately, the differences between the United States and United Kingdom on key labor market variables are a puzzle that is not yet fully understood. To an extent, some of the factors that have affected the United States and United Kingdom are similar—for instance a high number of indebted households. It is clear that both the United States and the United Kingdom face the challenge of facilitating transitions for workers currently employed in lower‑wage and ‑hour jobs to jobs offering higher wages and more full‑time work. Nevertheless, these dif‑ferent experiences are also a reminder of the many possible paths from recession to recovery.
120 | Chapter 3
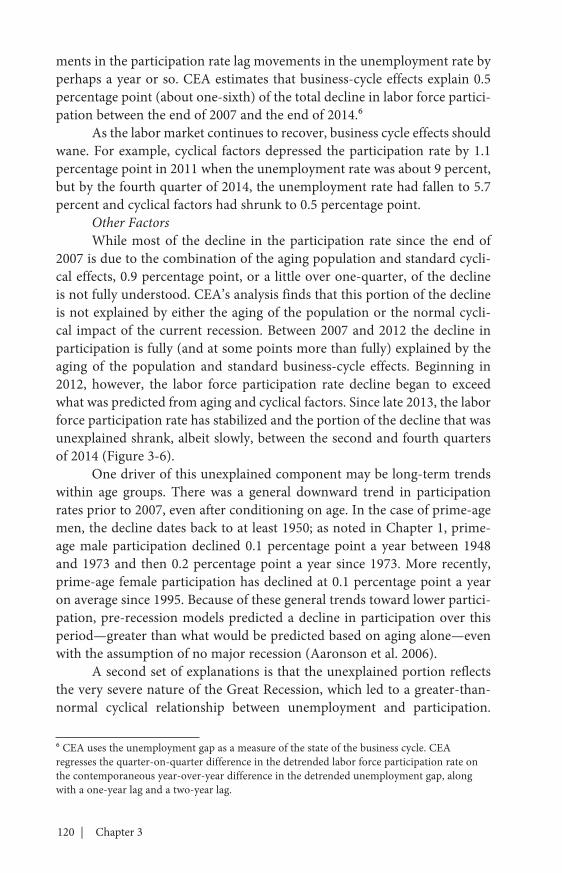
ments in the participation rate lag movements in the unemployment rate by perhaps a year or so. CEA estimates that business‑cycle effects explain 0.5 percentage point (about one‑sixth) of the total decline in labor force partici‑pation between the end of 2007 and the end of 2014.6
As the labor market continues to recover, business cycle effects should wane. For example, cyclical factors depressed the participation rate by 1.1 percentage point in 2011 when the unemployment rate was about 9 percent, but by the fourth quarter of 2014, the unemployment rate had fallen to 5.7 percent and cyclical factors had shrunk to 0.5 percentage point.
Other FactorsWhile most of the decline in the participation rate since the end of
2007 is due to the combination of the aging population and standard cycli‑cal effects, 0.9 percentage point, or a little over one‑quarter, of the decline is not fully understood. CEA’s analysis finds that this portion of the decline is not explained by either the aging of the population or the normal cycli‑cal impact of the current recession. Between 2007 and 2012 the decline in participation is fully (and at some points more than fully) explained by the aging of the population and standard business‑cycle effects. Beginning in 2012, however, the labor force participation rate decline began to exceed what was predicted from aging and cyclical factors. Since late 2013, the labor force participation rate has stabilized and the portion of the decline that was unexplained shrank, albeit slowly, between the second and fourth quarters of 2014 (Figure 3‑6).
One driver of this unexplained component may be long‑term trends within age groups. There was a general downward trend in participation rates prior to 2007, even after conditioning on age. In the case of prime‑age men, the decline dates back to at least 1950; as noted in Chapter 1, prime‑age male participation declined 0.1 percentage point a year between 1948 and 1973 and then 0.2 percentage point a year since 1973. More recently, prime‑age female participation has declined at 0.1 percentage point a year on average since 1995. Because of these general trends toward lower partici‑pation, pre‑recession models predicted a decline in participation over this period—greater than what would be predicted based on aging alone—even with the assumption of no major recession (Aaronson et al. 2006).
A second set of explanations is that the unexplained portion reflects the very severe nature of the Great Recession, which led to a greater‑than‑normal cyclical relationship between unemployment and participation.
6 CEA uses the unemployment gap as a measure of the state of the business cycle. CEA regresses the quarter‑on‑quarter difference in the detrended labor force participation rate on the contemporaneous year‑over‑year difference in the detrended unemployment gap, along with a one‑year lag and a two‑year lag.
Achievements and Challenges in the U.S. Labor Market | 121
CEA’s model assumes that the relationship between the unemployment rate and the labor force participation rate remained the same as in earlier, shallower recessions. However, the particularly long average duration of unemployment in the last recession might discourage participation even more. Adding unemployment duration to the model explains a part of the previously unexplained portion. Thus, the model suggests that a recession that leads to greater long‑term unemployment leads to greater declines in labor force participation, conditional on the unemployment rate.
CEA’s analysis finds no unusual rise in disability insurance in response to the recession—in fact, disability insurance rose less than would be predicted based on the severity of the recession—so this does not account for the unexplained decline in participation. The rise in schooling also does not account for the unexplained portion. Overall, it is likely that a combina‑tion of factors, including both non‑aging trends and factors unique to the Great Recession, played a role in the participation‑rate decline.
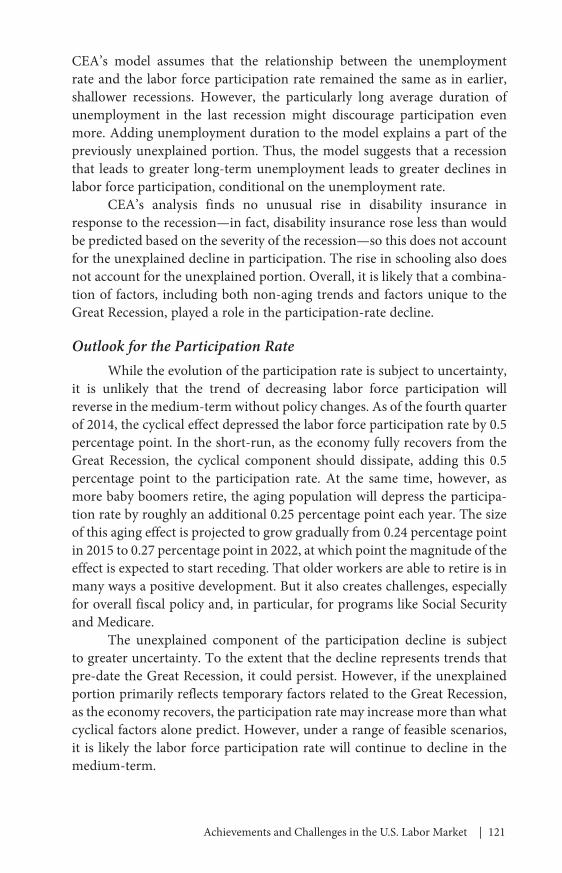
Outlook for the Participation RateWhile the evolution of the participation rate is subject to uncertainty,
it is unlikely that the trend of decreasing labor force participation will reverse in the medium‑term without policy changes. As of the fourth quarter of 2014, the cyclical effect depressed the labor force participation rate by 0.5 percentage point. In the short‑run, as the economy fully recovers from the Great Recession, the cyclical component should dissipate, adding this 0.5 percentage point to the participation rate. At the same time, however, as more baby boomers retire, the aging population will depress the participa‑tion rate by roughly an additional 0.25 percentage point each year. The size of this aging effect is projected to grow gradually from 0.24 percentage point in 2015 to 0.27 percentage point in 2022, at which point the magnitude of the effect is expected to start receding. That older workers are able to retire is in many ways a positive development. But it also creates challenges, especially for overall fiscal policy and, in particular, for programs like Social Security and Medicare.
The unexplained component of the participation decline is subject to greater uncertainty. To the extent that the decline represents trends that pre‑date the Great Recession, it could persist. However, if the unexplained portion primarily reflects temporary factors related to the Great Recession, as the economy recovers, the participation rate may increase more than what cyclical factors alone predict. However, under a range of feasible scenarios, it is likely the labor force participation rate will continue to decline in the medium‑term.
122 | Chapter 3
Long-Term Unemployment
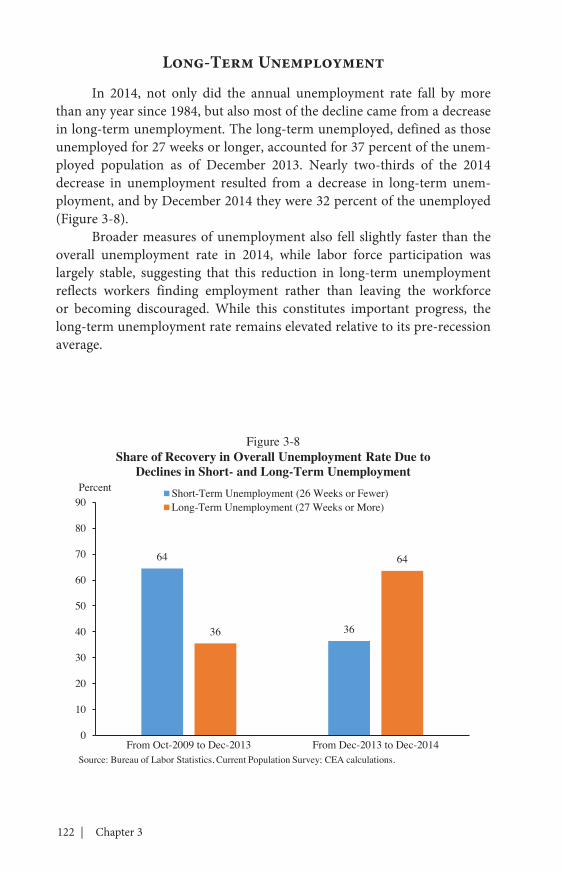
In 2014, not only did the annual unemployment rate fall by more than any year since 1984, but also most of the decline came from a decrease in long‑term unemployment. The long‑term unemployed, defined as those unemployed for 27 weeks or longer, accounted for 37 percent of the unem‑ployed population as of December 2013. Nearly two‑thirds of the 2014 decrease in unemployment resulted from a decrease in long‑term unem‑ployment, and by December 2014 they were 32 percent of the unemployed (Figure 3‑8).
Broader measures of unemployment also fell slightly faster than the overall unemployment rate in 2014, while labor force participation was largely stable, suggesting that this reduction in long‑term unemployment reflects workers finding employment rather than leaving the workforce or becoming discouraged. While this constitutes important progress, the long‑term unemployment rate remains elevated relative to its pre‑recession average.
64
3636
64
0
10
20
30
40
50
60
70
80
90
From Oct-2009 to Dec-2013 From Dec-2013 to Dec-2014
Short-Term Unemployment (26 Weeks or Fewer)Long-Term Unemployment (27 Weeks or More)
Figure 3-8Share of Recovery in Overall Unemployment Rate Due to
Declines in Short- and Long-Term UnemploymentPercent
Source: Bureau of Labor Statistics, Current Population Survey; CEA calculations.
Achievements and Challenges in the U.S. Labor Market | 123
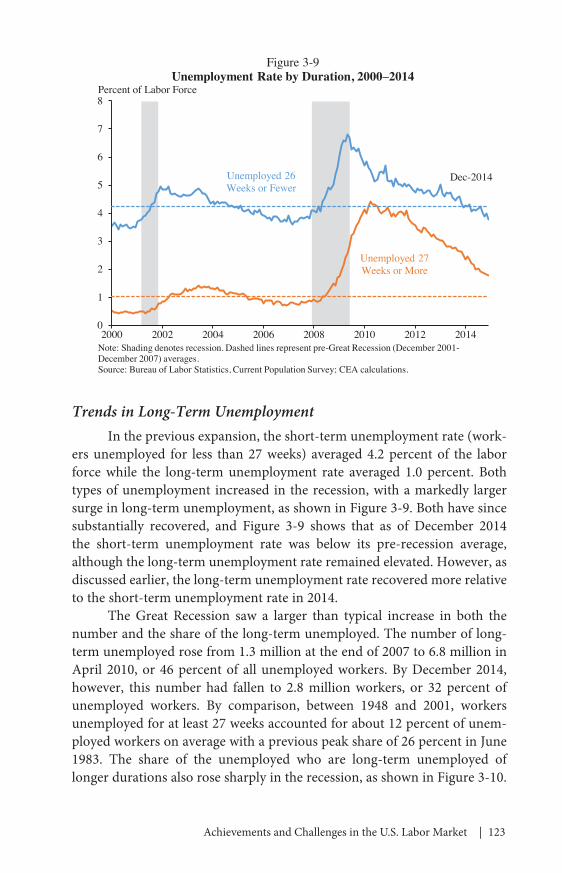
Trends in Long-Term Unemployment In the previous expansion, the short‑term unemployment rate (work‑
ers unemployed for less than 27 weeks) averaged 4.2 percent of the labor force while the long‑term unemployment rate averaged 1.0 percent. Both types of unemployment increased in the recession, with a markedly larger surge in long‑term unemployment, as shown in Figure 3‑9. Both have since substantially recovered, and Figure 3‑9 shows that as of December 2014 the short‑term unemployment rate was below its pre‑recession average, although the long‑term unemployment rate remained elevated. However, as discussed earlier, the long‑term unemployment rate recovered more relative to the short‑term unemployment rate in 2014.
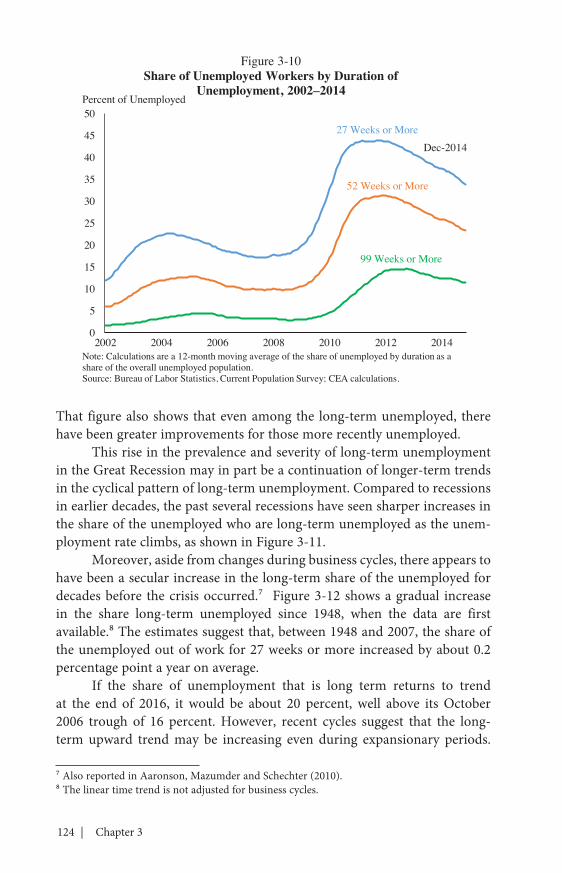
The Great Recession saw a larger than typical increase in both the number and the share of the long‑term unemployed. The number of long‑term unemployed rose from 1.3 million at the end of 2007 to 6.8 million in April 2010, or 46 percent of all unemployed workers. By December 2014, however, this number had fallen to 2.8 million workers, or 32 percent of unemployed workers. By comparison, between 1948 and 2001, workers unemployed for at least 27 weeks accounted for about 12 percent of unem‑ployed workers on average with a previous peak share of 26 percent in June 1983. The share of the unemployed who are long‑term unemployed of longer durations also rose sharply in the recession, as shown in Figure 3‑10.
Dec-2014
Unemployed 27 Weeks or More
0
1
2
3
4
5
6
7
8
2000 2002 2004 2006 2008 2010 2012 2014
Figure 3-9Unemployment Rate by Duration, 2000–2014
Percent of Labor Force
Unemployed 26 Weeks or Fewer
Note: Shading denotes recession. Dashed lines represent pre-Great Recession (December 2001-December 2007) averages.Source: Bureau of Labor Statistics, Current Population Survey; CEA calculations.
124 | Chapter 3
That figure also shows that even among the long‑term unemployed, there have been greater improvements for those more recently unemployed.
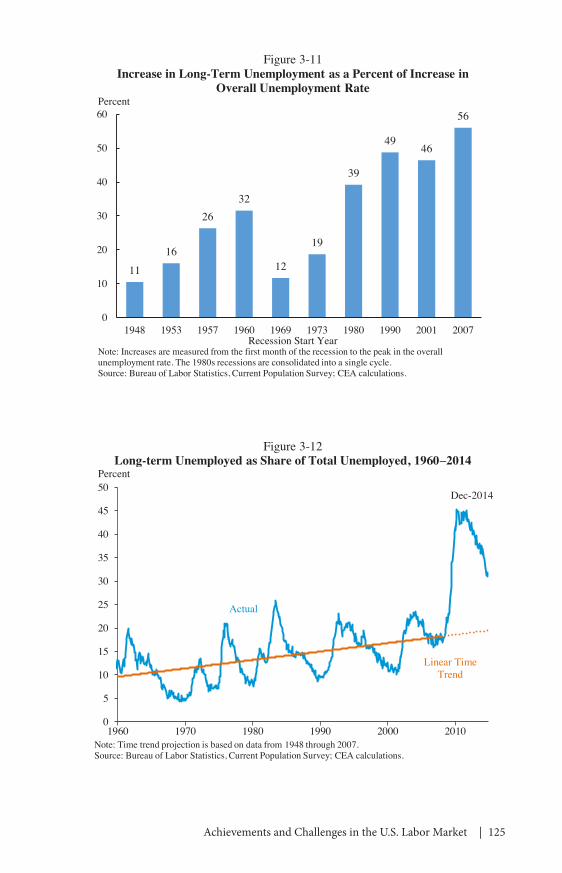
This rise in the prevalence and severity of long‑term unemployment in the Great Recession may in part be a continuation of longer‑term trends in the cyclical pattern of long‑term unemployment. Compared to recessions in earlier decades, the past several recessions have seen sharper increases in the share of the unemployed who are long‑term unemployed as the unem‑ployment rate climbs, as shown in Figure 3‑11.
Moreover, aside from changes during business cycles, there appears to have been a secular increase in the long‑term share of the unemployed for decades before the crisis occurred.7 Figure 3‑12 shows a gradual increase in the share long‑term unemployed since 1948, when the data are first available.8 The estimates suggest that, between 1948 and 2007, the share of the unemployed out of work for 27 weeks or more increased by about 0.2 percentage point a year on average.
If the share of unemployment that is long term returns to trend at the end of 2016, it would be about 20 percent, well above its October 2006 trough of 16 percent. However, recent cycles suggest that the long‑term upward trend may be increasing even during expansionary periods.
7 Also reported in Aaronson, Mazumder and Schechter (2010).8 The linear time trend is not adjusted for business cycles.
0
5
10
15
20
25
30
35
40
45
50
2002 2004 2006 2008 2010 2012 2014
Figure 3-10Share of Unemployed Workers by Duration of
Unemployment, 2002–2014 Percent of Unemployed
Note: Calculations are a 12-month moving average of the share of unemployed by duration as a share of the overall unemployed population.Source: Bureau of Labor Statistics, Current Population Survey; CEA calculations.
27 Weeks or More
52 Weeks or More
99 Weeks or More
Dec-2014
Achievements and Challenges in the U.S. Labor Market | 125
11
16
2632
12
19
39
4946
56
0
10
20
30
40
50
60
1948 1953 1957 1960 1969 1973 1980 1990 2001 2007Recession Start Year
Figure 3-11Increase in Long-Term Unemployment as a Percent of Increase in
Overall Unemployment RatePercent
Note: Increases are measured from the first month of the recession to the peak in the overall unemployment rate. The 1980s recessions are consolidated into a single cycle. Source: Bureau of Labor Statistics, Current Population Survey; CEA calculations.
Actual
Dec-2014
Linear Time Trend
0
5
10
15
20
25
30
35
40
45
50
1960 1970 1980 1990 2000 2010
Figure 3-12Long-term Unemployed as Share of Total Unemployed, 1960–2014
Percent
Note: Time trend projection is based on data from 1948 through 2007. Source: Bureau of Labor Statistics, Current Population Survey; CEA calculations.
126 | Chapter 3
Moreover, during the Great Recession, long‑term unemployment increased even more than would have been expected from the historical relationship (Aaronson, Mazumder, and Schechter 2010), suggesting that while long‑run trends have contributed to higher rates of long‑term unemployment, other factors may contribute to a more persistent increase.
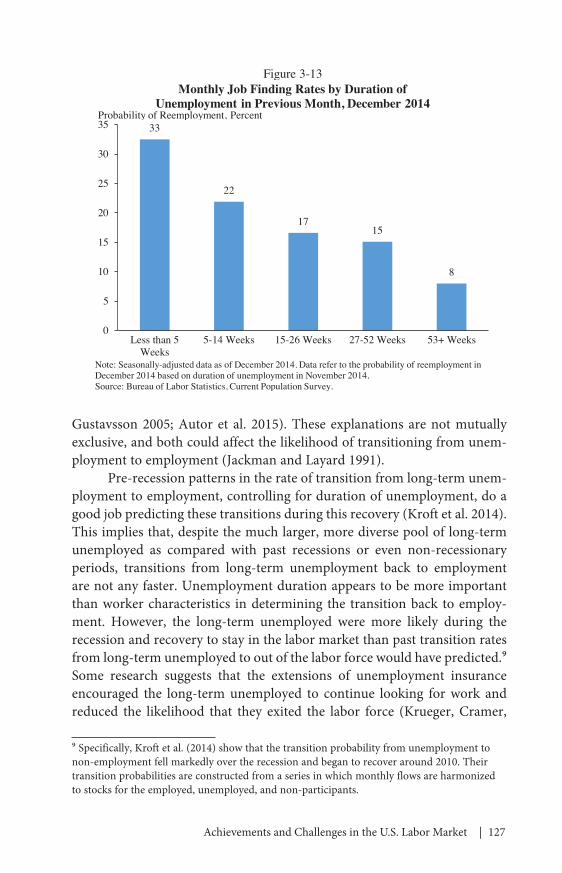
Factors behind Elevated Rates of Long-Term UnemploymentThe likelihood of finding new employment falls as an unemployment
spell extends, as shown in Figure 3‑13. During the Great Recession, the long‑term unemployed were 20 to 40 percent less likely than the short‑term unemployed to obtain employment within two years (Krueger, Cramer, and Cho 2014). In addition, audit studies show that callback rates from prospec‑tive employers decline with the length of unemployment (Kroft, Lange, and Notowidigdo 2013; Ghayad 2013).
The literature offers potential explanations for why the long‑term unemployed are less likely to find employment than the short‑term unem‑ployed. One explanation, “worker heterogeneity,” argues that the long‑term unemployed are different from the short‑term unemployed in ways that make them less attractive to employers, which extends how long they must search to land a new job (Pries 2008). However, this is less likely to be true following a deep recession. Moreover, research by Krueger, Cramer, and Cho (2014) and Mitchell (2013) find that the long‑term unemployed resem‑ble the short‑term unemployed on many dimensions. Kroft et al. (2014) and Aaronson, Mazumder, and Schechter (2010) reach similar conclusions, and show that rates of long‑term unemployment increased for nearly all demographic, occupation, industry, and regional groups during the Great Recession.
This research suggests that another explanation for why the long‑term unemployed are less likely to be hired is more relevant to our recovery: that becoming long‑term unemployed itself makes it harder to escape from unemployment. Employers may interpret a spell of long‑term unemploy‑ment as a negative signal of a worker’s ability because of stigma (Blanchard and Diamond 1994; Kroft, Lange, and Notowidigdo 2013). Additionally, employers’ hiring processes may lead to discrimination against the long‑term unemployed by, for example, screening out all workers with a long spell of unemployment regardless of their other qualifications (Ghayad 2013). Research has shown that the long‑term unemployed conditional on all other characteristics remaining the same are less likely to get called for interviews (Kroft, Lange, and Notowidigdo 2013). Another explanation is that as people remain out of work for extended periods of time, their general and job‑specific skills or connections to industry may deteriorate (Edin and
Achievements and Challenges in the U.S. Labor Market | 127
Gustavsson 2005; Autor et al. 2015). These explanations are not mutually exclusive, and both could affect the likelihood of transitioning from unem‑ployment to employment (Jackman and Layard 1991).
Pre‑recession patterns in the rate of transition from long‑term unem‑ployment to employment, controlling for duration of unemployment, do a good job predicting these transitions during this recovery (Kroft et al. 2014). This implies that, despite the much larger, more diverse pool of long‑term unemployed as compared with past recessions or even non‑recessionary periods, transitions from long‑term unemployment back to employment are not any faster. Unemployment duration appears to be more important than worker characteristics in determining the transition back to employ‑ment. However, the long‑term unemployed were more likely during the recession and recovery to stay in the labor market than past transition rates from long‑term unemployed to out of the labor force would have predicted.9 Some research suggests that the extensions of unemployment insurance encouraged the long‑term unemployed to continue looking for work and reduced the likelihood that they exited the labor force (Krueger, Cramer,
9 Specifically, Kroft et al. (2014) show that the transition probability from unemployment to non‑employment fell markedly over the recession and began to recover around 2010. Their transition probabilities are constructed from a series in which monthly flows are harmonized to stocks for the employed, unemployed, and non‑participants.
33
22
1715
8
0
5
10
15
20
25
30
35
Less than 5Weeks
5-14 Weeks 15-26 Weeks 27-52 Weeks 53+ Weeks
Figure 3-13Monthly Job Finding Rates by Duration of
Unemployment in Previous Month, December 2014
Note: Seasonally-adjusted data as of December 2014. Data refer to the probability of reemployment in December 2014 based on duration of unemployment in November 2014.Source: Bureau of Labor Statistics, Current Population Survey.
Probability of Reemployment, Percent
128 | Chapter 3
and Cho 2014; Aaronson, Mazumder, and Schechter 2010; Kroft et al. 2014; Rothstein 2011).
Why Long-term Unemployment MattersHigher levels of long‑term unemployment are concerning because
they place greater strain on household resources and sometimes necessitate drastic changes in household behavior, such as selling a home or postpon‑ing medical care, which can have disruptive impacts on family members, the wider community, and the economy. Long‑term earnings loss after resuming work also appears to increase with the duration of unemploy‑ment (Schmieder, von Wachter, and Bender 2013; Addison and Portugal 1989). Moreover, it does not appear that these earnings losses are unique to experiencing unemployment during an economic expansion or recovery, nor are they concentrated in the manufacturing or service sector (Couch and Placzek 2010). Former Federal Reserve Chairman Ben Bernanke has said that long‑term unemployment “imposes economic costs on everyone, not just the unemployed themselves,” as their loss of skills and lower rates of employment reduce the economy’s overall productive capacity (Bernanke 2012).
Part-Time Work for Economic Reasons
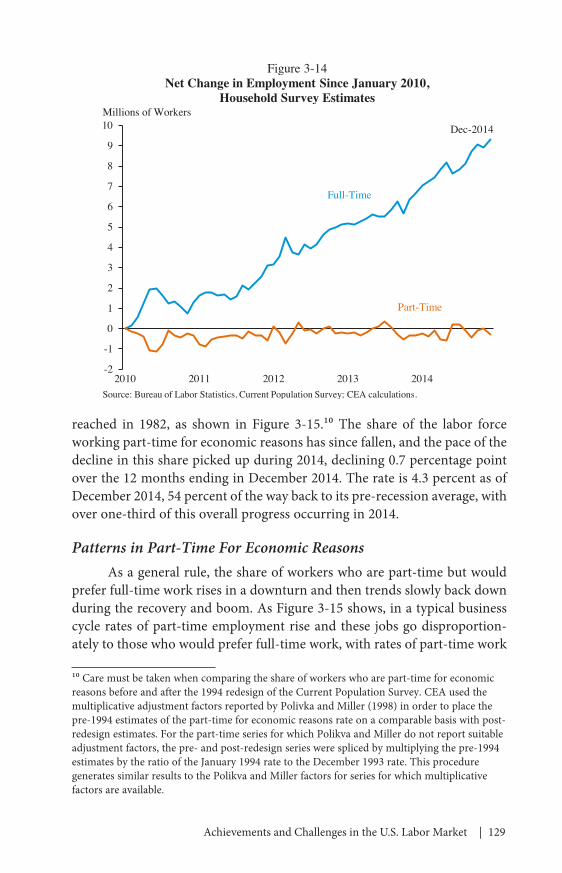
Part‑time employment tends to grow in recessions as some businesses hold on to workers by cutting their hours, and those businesses continuing to hire may need only part‑time hours from new workers. Between December 2007 and December 2009, the share of the labor force usually working part‑time rose from 16.1 percent to 17.9 percent. This increase was driven by a large rise in people working part‑time for economic reasons, defined as employees who would prefer to have full‑time work but either cannot find a full‑time job or have a job that does not provide full‑time hours (even if it once did). As the economy has recovered, the share of the labor force that is part‑time has begun to recede as all the growth in employment has been driven by growth in full‑time employment, as Figure 3‑14 shows. Five years into the recovery, more than 9 million more people are working full‑time, while the number of people employed in part‑time jobs has been largely unchanged. Moreover, part‑time jobs have been increasingly held by those who say they do not want to work full‑time.
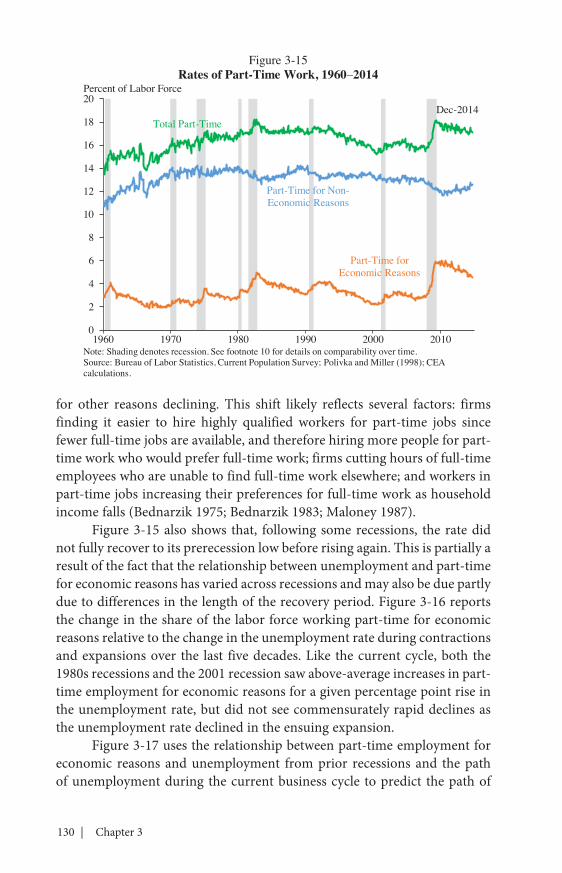
Rates of part‑time employment for economic reasons doubled dur‑ing the recession from 3 percent to 6 percent, exceeding the previous peak
Achievements and Challenges in the U.S. Labor Market | 129
reached in 1982, as shown in Figure 3‑15.10 The share of the labor force working part‑time for economic reasons has since fallen, and the pace of the decline in this share picked up during 2014, declining 0.7 percentage point over the 12 months ending in December 2014. The rate is 4.3 percent as of December 2014, 54 percent of the way back to its pre‑recession average, with over one‑third of this overall progress occurring in 2014.
Patterns in Part-Time For Economic ReasonsAs a general rule, the share of workers who are part‑time but would
prefer full‑time work rises in a downturn and then trends slowly back down during the recovery and boom. As Figure 3‑15 shows, in a typical business cycle rates of part‑time employment rise and these jobs go disproportion‑ately to those who would prefer full‑time work, with rates of part‑time work
10 Care must be taken when comparing the share of workers who are part‑time for economic reasons before and after the 1994 redesign of the Current Population Survey. CEA used the multiplicative adjustment factors reported by Polivka and Miller (1998) in order to place the pre‑1994 estimates of the part‑time for economic reasons rate on a comparable basis with post‑redesign estimates. For the part‑time series for which Polikva and Miller do not report suitable adjustment factors, the pre‑ and post‑redesign series were spliced by multiplying the pre‑1994 estimates by the ratio of the January 1994 rate to the December 1993 rate. This procedure generates similar results to the Polikva and Miller factors for series for which multiplicative factors are available.
Full-Time
Dec-2014
Part-Time
-2
-1
0
1
2
3
4
5
6
7
8
9
10
2010 2011 2012 2013 2014
Figure 3-14Net Change in Employment Since January 2010,
Household Survey EstimatesMillions of Workers
Source: Bureau of Labor Statistics, Current Population Survey; CEA calculations.
130 | Chapter 3
for other reasons declining. This shift likely reflects several factors: firms finding it easier to hire highly qualified workers for part‑time jobs since fewer full‑time jobs are available, and therefore hiring more people for part‑time work who would prefer full‑time work; firms cutting hours of full‑time employees who are unable to find full‑time work elsewhere; and workers in part‑time jobs increasing their preferences for full‑time work as household income falls (Bednarzik 1975; Bednarzik 1983; Maloney 1987).
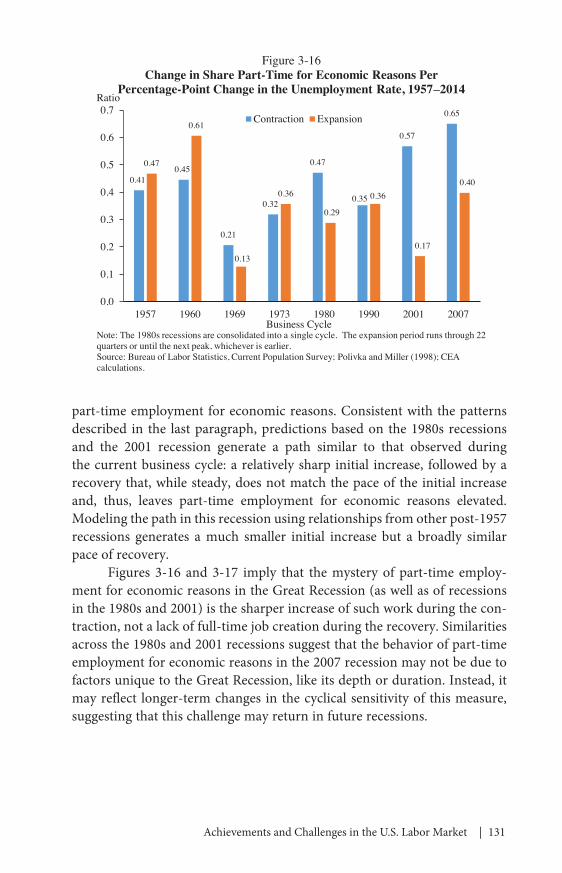
Figure 3‑15 also shows that, following some recessions, the rate did not fully recover to its prerecession low before rising again. This is partially a result of the fact that the relationship between unemployment and part‑time for economic reasons has varied across recessions and may also be due partly due to differences in the length of the recovery period. Figure 3‑16 reports the change in the share of the labor force working part‑time for economic reasons relative to the change in the unemployment rate during contractions and expansions over the last five decades. Like the current cycle, both the 1980s recessions and the 2001 recession saw above‑average increases in part‑time employment for economic reasons for a given percentage point rise in the unemployment rate, but did not see commensurately rapid declines as the unemployment rate declined in the ensuing expansion.
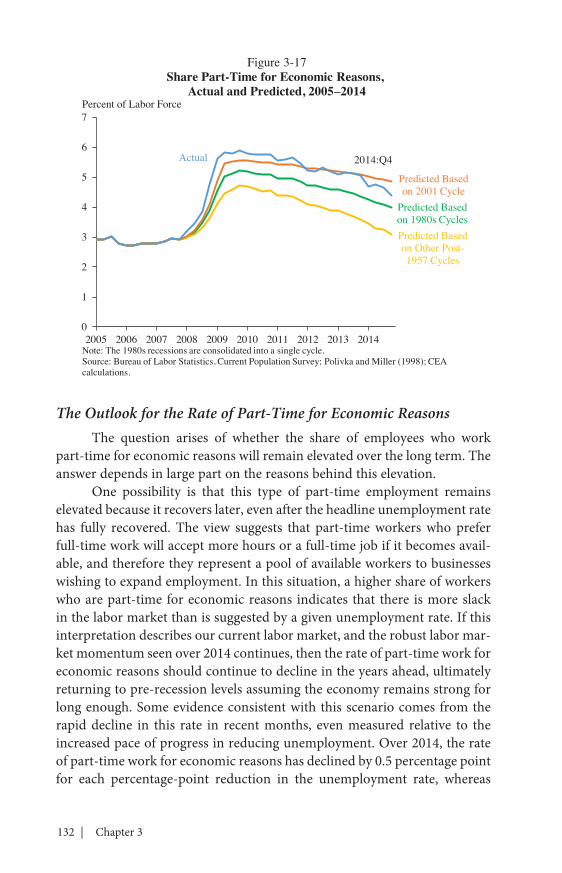
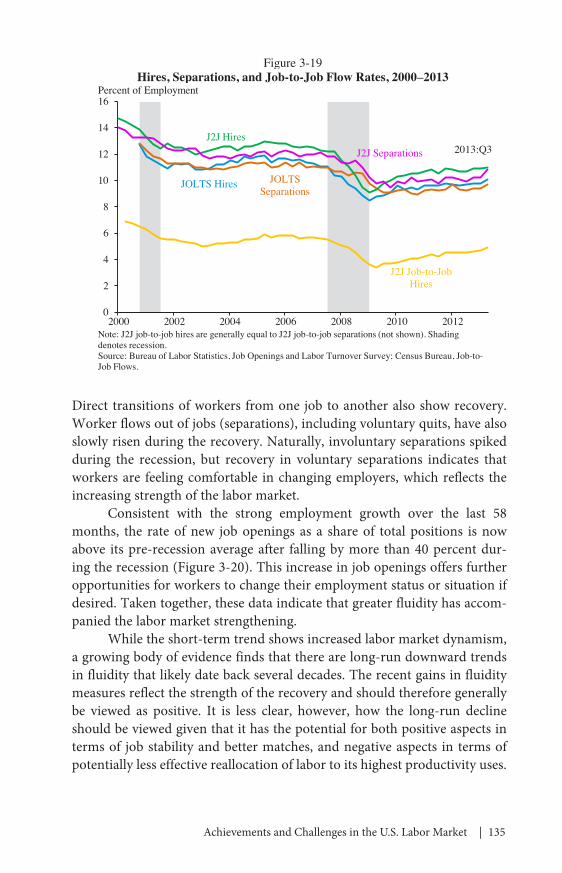
Figure 3‑17 uses the relationship between part‑time employment for economic reasons and unemployment from prior recessions and the path of unemployment during the current business cycle to predict the path of
Total Part-TimeDec-2014
Part-Time for Non-Economic Reasons
Part-Time for Economic Reasons
0
2
4
6
8
10
12
14
16
18
20
1960 1970 1980 1990 2000 2010
Figure 3-15Rates of Part-Time Work, 1960–2014
Percent of Labor Force
Note: Shading denotes recession. See footnote 10 for details on comparability over time.Source: Bureau of Labor Statistics, Current Population Survey; Polivka and Miller (1998); CEA calculations.
Achievements and Challenges in the U.S. Labor Market | 131
part‑time employment for economic reasons. Consistent with the patterns described in the last paragraph, predictions based on the 1980s recessions and the 2001 recession generate a path similar to that observed during the current business cycle: a relatively sharp initial increase, followed by a recovery that, while steady, does not match the pace of the initial increase and, thus, leaves part‑time employment for economic reasons elevated. Modeling the path in this recession using relationships from other post‑1957 recessions generates a much smaller initial increase but a broadly similar pace of recovery.
Figures 3‑16 and 3‑17 imply that the mystery of part‑time employ‑ment for economic reasons in the Great Recession (as well as of recessions in the 1980s and 2001) is the sharper increase of such work during the con‑traction, not a lack of full‑time job creation during the recovery. Similarities across the 1980s and 2001 recessions suggest that the behavior of part‑time employment for economic reasons in the 2007 recession may not be due to factors unique to the Great Recession, like its depth or duration. Instead, it may reflect longer‑term changes in the cyclical sensitivity of this measure, suggesting that this challenge may return in future recessions.
0.410.45
0.21
0.32
0.47
0.35
0.57
0.65
0.47
0.61
0.13
0.36
0.29
0.36
0.17
0.40
0.0
0.1
0.2
0.3
0.4
0.5
0.6
0.7
1957 1960 1969 1973 1980 1990 2001 2007
Contraction Expansion
Figure 3-16Change in Share Part-Time for Economic Reasons Per
Percentage-Point Change in the Unemployment Rate, 1957–2014
Note: The 1980s recessions are consolidated into a single cycle. The expansion period runs through 22 quarters or until the next peak, whichever is earlier.Source: Bureau of Labor Statistics, Current Population Survey; Polivka and Miller (1998); CEA calculations.
Business Cycle
Ratio
132 | Chapter 3
The Outlook for the Rate of Part-Time for Economic ReasonsThe question arises of whether the share of employees who work
part‑time for economic reasons will remain elevated over the long term. The answer depends in large part on the reasons behind this elevation.
One possibility is that this type of part‑time employment remains elevated because it recovers later, even after the headline unemployment rate has fully recovered. The view suggests that part‑time workers who prefer full‑time work will accept more hours or a full‑time job if it becomes avail‑able, and therefore they represent a pool of available workers to businesses wishing to expand employment. In this situation, a higher share of workers who are part‑time for economic reasons indicates that there is more slack in the labor market than is suggested by a given unemployment rate. If this interpretation describes our current labor market, and the robust labor mar‑ket momentum seen over 2014 continues, then the rate of part‑time work for economic reasons should continue to decline in the years ahead, ultimately returning to pre‑recession levels assuming the economy remains strong for long enough. Some evidence consistent with this scenario comes from the rapid decline in this rate in recent months, even measured relative to the increased pace of progress in reducing unemployment. Over 2014, the rate of part‑time work for economic reasons has declined by 0.5 percentage point for each percentage‑point reduction in the unemployment rate, whereas
0
1
2
3
4
5
6
7
2005 2006 2007 2008 2009 2010 2011 2012 2013 2014
Actual
Predicted Based on 1980s CyclesPredicted Based on Other Post-1957 Cycles
Predicted Based on 2001 Cycle
Figure 3-17Share Part-Time for Economic Reasons,
Actual and Predicted, 2005–2014Percent of Labor Force
Note: The 1980s recessions are consolidated into a single cycle.Source: Bureau of Labor Statistics, Current Population Survey; Polivka and Miller (1998); CEA calculations.
2014:Q4
Achievements and Challenges in the U.S. Labor Market | 133
it declined, on average, by 0.3 percentage point for each percentage‑point reduction in the unemployment rate since the start of 2010. Furthermore, experience from the late 1990s and mid‑to‑late 1960s provides historical precedent: part‑time employment for economic reasons rapidly decreased relative to overall unemployment during these strong labor market periods.
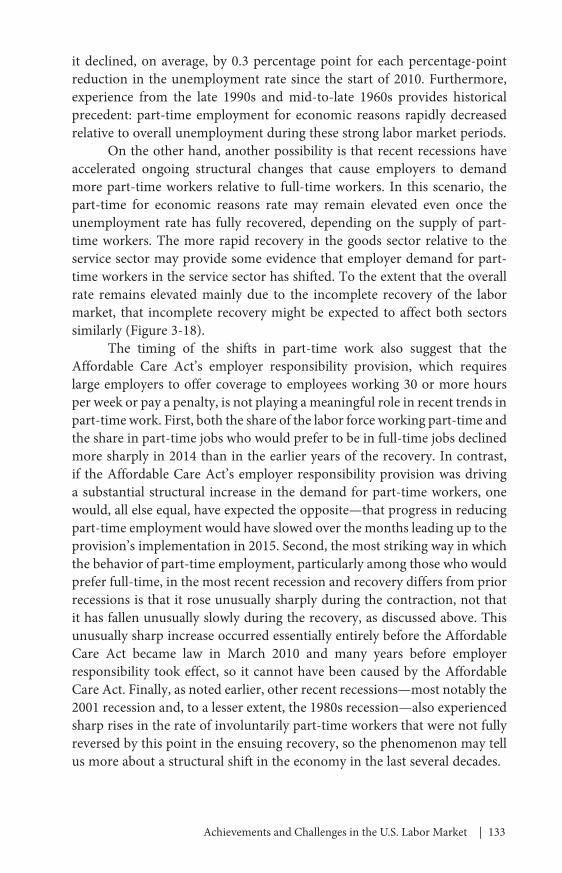
On the other hand, another possibility is that recent recessions have accelerated ongoing structural changes that cause employers to demand more part‑time workers relative to full‑time workers. In this scenario, the part‑time for economic reasons rate may remain elevated even once the unemployment rate has fully recovered, depending on the supply of part‑time workers. The more rapid recovery in the goods sector relative to the service sector may provide some evidence that employer demand for part‑time workers in the service sector has shifted. To the extent that the overall rate remains elevated mainly due to the incomplete recovery of the labor market, that incomplete recovery might be expected to affect both sectors similarly (Figure 3‑18).
The timing of the shifts in part‑time work also suggest that the Affordable Care Act’s employer responsibility provision, which requires large employers to offer coverage to employees working 30 or more hours per week or pay a penalty, is not playing a meaningful role in recent trends in part‑time work. First, both the share of the labor force working part‑time and the share in part‑time jobs who would prefer to be in full‑time jobs declined more sharply in 2014 than in the earlier years of the recovery. In contrast, if the Affordable Care Act’s employer responsibility provision was driving a substantial structural increase in the demand for part‑time workers, one would, all else equal, have expected the opposite—that progress in reducing part‑time employment would have slowed over the months leading up to the provision’s implementation in 2015. Second, the most striking way in which the behavior of part‑time employment, particularly among those who would prefer full‑time, in the most recent recession and recovery differs from prior recessions is that it rose unusually sharply during the contraction, not that it has fallen unusually slowly during the recovery, as discussed above. This unusually sharp increase occurred essentially entirely before the Affordable Care Act became law in March 2010 and many years before employer responsibility took effect, so it cannot have been caused by the Affordable Care Act. Finally, as noted earlier, other recent recessions—most notably the 2001 recession and, to a lesser extent, the 1980s recession—also experienced sharp rises in the rate of involuntarily part‑time workers that were not fully reversed by this point in the ensuing recovery, so the phenomenon may tell us more about a structural shift in the economy in the last several decades.
134 | Chapter 3
Labor Market Fluidity
Labor market fluidity (used interchangeably in this chapter with “dynamism” or “churn”) refers broadly to the frequency of changes in who is working for whom in the labor market. From the worker’s perspective, this is measured by hires and separations; from the firm’s perspective, it is measured by new positions (job creation) and eliminated positions (job destruction). Although separations, hires, creation, destruction, and other measures capture different concepts of fluidity, increases in these measures generally indicate more fluidity.
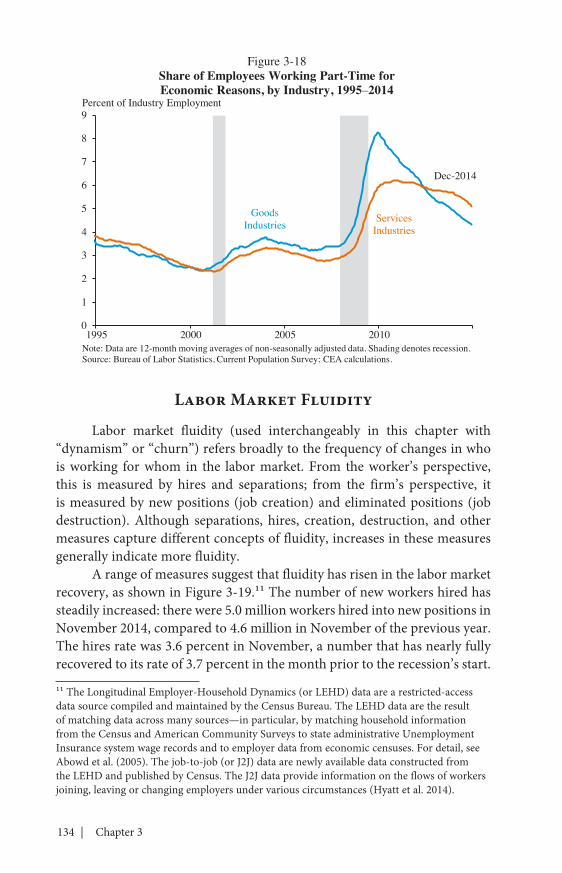
A range of measures suggest that fluidity has risen in the labor market recovery, as shown in Figure 3‑19.11 The number of new workers hired has steadily increased: there were 5.0 million workers hired into new positions in November 2014, compared to 4.6 million in November of the previous year. The hires rate was 3.6 percent in November, a number that has nearly fully recovered to its rate of 3.7 percent in the month prior to the recession’s start.
11 The Longitudinal Employer‑Household Dynamics (or LEHD) data are a restricted‑access data source compiled and maintained by the Census Bureau. The LEHD data are the result of matching data across many sources—in particular, by matching household information from the Census and American Community Surveys to state administrative Unemployment Insurance system wage records and to employer data from economic censuses. For detail, see Abowd et al. (2005). The job‑to‑job (or J2J) data are newly available data constructed from the LEHD and published by Census. The J2J data provide information on the flows of workers joining, leaving or changing employers under various circumstances (Hyatt et al. 2014).
Goods Industries Services
Industries
Dec-2014
0
1
2
3
4
5
6
7
8
9
1995 2000 2005 2010Note: Data are 12-month moving averages of non-seasonally adjusted data. Shading denotes recession.Source: Bureau of Labor Statistics, Current Population Survey; CEA calculations.
Figure 3-18Share of Employees Working Part-Time for Economic Reasons, by Industry, 1995–2014
Percent of Industry Employment
Achievements and Challenges in the U.S. Labor Market | 135
Direct transitions of workers from one job to another also show recovery. Worker flows out of jobs (separations), including voluntary quits, have also slowly risen during the recovery. Naturally, involuntary separations spiked during the recession, but recovery in voluntary separations indicates that workers are feeling comfortable in changing employers, which reflects the increasing strength of the labor market.
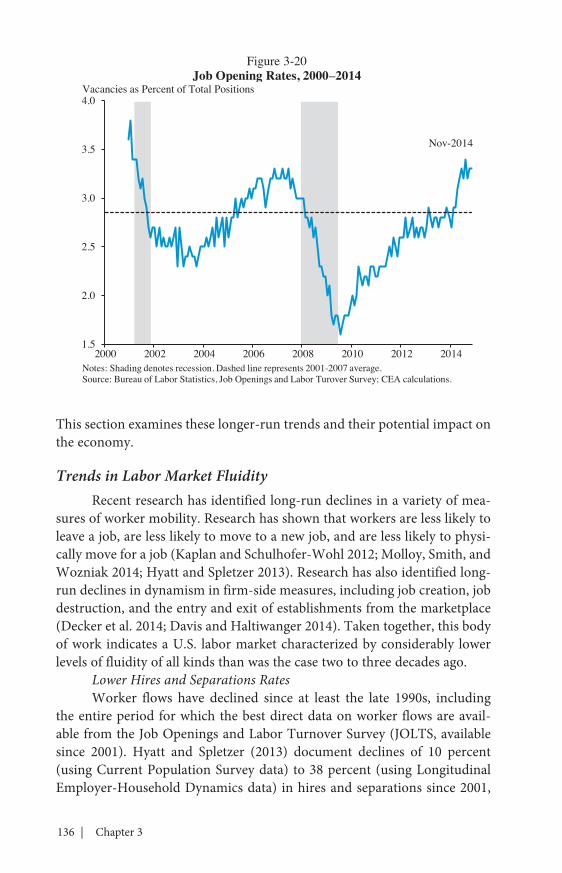
Consistent with the strong employment growth over the last 58 months, the rate of new job openings as a share of total positions is now above its pre‑recession average after falling by more than 40 percent dur‑ing the recession (Figure 3‑20). This increase in job openings offers further opportunities for workers to change their employment status or situation if desired. Taken together, these data indicate that greater fluidity has accom‑panied the labor market strengthening.
While the short‑term trend shows increased labor market dynamism, a growing body of evidence finds that there are long‑run downward trends in fluidity that likely date back several decades. The recent gains in fluidity measures reflect the strength of the recovery and should therefore generally be viewed as positive. It is less clear, however, how the long‑run decline should be viewed given that it has the potential for both positive aspects in terms of job stability and better matches, and negative aspects in terms of potentially less effective reallocation of labor to its highest productivity uses.
JOLTS Hires JOLTS Separations
J2J Hires2013:Q3J2J Separations
J2J Job-to-Job Hires
0
2
4
6
8
10
12
14
16
2000 2002 2004 2006 2008 2010 2012
Figure 3-19Hires, Separations, and Job-to-Job Flow Rates, 2000–2013
Percent of Employment
Note: J2J job-to-job hires are generally equal to J2J job-to-job separations (not shown). Shading denotes recession.Source: Bureau of Labor Statistics, Job Openings and Labor Turnover Survey; Census Bureau, Job-to-Job Flows.
136 | Chapter 3
This section examines these longer‑run trends and their potential impact on the economy.
Trends in Labor Market FluidityRecent research has identified long‑run declines in a variety of mea‑
sures of worker mobility. Research has shown that workers are less likely to leave a job, are less likely to move to a new job, and are less likely to physi‑cally move for a job (Kaplan and Schulhofer‑Wohl 2012; Molloy, Smith, and Wozniak 2014; Hyatt and Spletzer 2013). Research has also identified long‑run declines in dynamism in firm‑side measures, including job creation, job destruction, and the entry and exit of establishments from the marketplace (Decker et al. 2014; Davis and Haltiwanger 2014). Taken together, this body of work indicates a U.S. labor market characterized by considerably lower levels of fluidity of all kinds than was the case two to three decades ago.
Lower Hires and Separations Rates Worker flows have declined since at least the late 1990s, including
the entire period for which the best direct data on worker flows are avail‑able from the Job Openings and Labor Turnover Survey (JOLTS, available since 2001). Hyatt and Spletzer (2013) document declines of 10 percent (using Current Population Survey data) to 38 percent (using Longitudinal Employer‑Household Dynamics data) in hires and separations since 2001,
Nov-2014
1.5
2.0
2.5
3.0
3.5
4.0
2000 2002 2004 2006 2008 2010 2012 2014
Figure 3-20Job Opening Rates, 2000–2014
Vacancies as Percent of Total Positions
Notes: Shading denotes recession. Dashed line represents 2001-2007 average.Source: Bureau of Labor Statistics, Job Openings and Labor Turover Survey; CEA calculations.
Achievements and Challenges in the U.S. Labor Market | 137
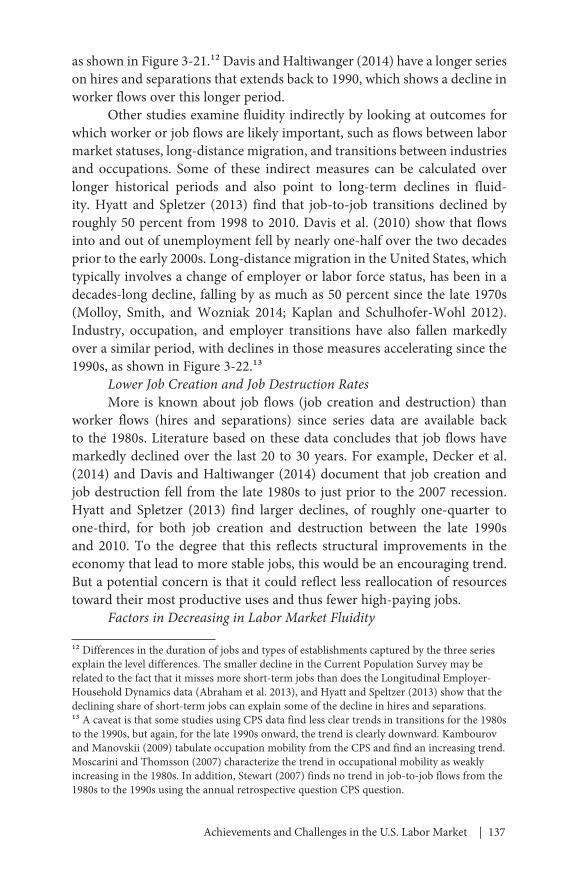
as shown in Figure 3‑21.12 Davis and Haltiwanger (2014) have a longer series on hires and separations that extends back to 1990, which shows a decline in worker flows over this longer period.
Other studies examine fluidity indirectly by looking at outcomes for which worker or job flows are likely important, such as flows between labor market statuses, long‑distance migration, and transitions between industries and occupations. Some of these indirect measures can be calculated over longer historical periods and also point to long‑term declines in fluid‑ity. Hyatt and Spletzer (2013) find that job‑to‑job transitions declined by roughly 50 percent from 1998 to 2010. Davis et al. (2010) show that flows into and out of unemployment fell by nearly one‑half over the two decades prior to the early 2000s. Long‑distance migration in the United States, which typically involves a change of employer or labor force status, has been in a decades‑long decline, falling by as much as 50 percent since the late 1970s (Molloy, Smith, and Wozniak 2014; Kaplan and Schulhofer‑Wohl 2012). Industry, occupation, and employer transitions have also fallen markedly over a similar period, with declines in those measures accelerating since the 1990s, as shown in Figure 3‑22.13
Lower Job Creation and Job Destruction RatesMore is known about job flows (job creation and destruction) than
worker flows (hires and separations) since series data are available back to the 1980s. Literature based on these data concludes that job flows have markedly declined over the last 20 to 30 years. For example, Decker et al. (2014) and Davis and Haltiwanger (2014) document that job creation and job destruction fell from the late 1980s to just prior to the 2007 recession. Hyatt and Spletzer (2013) find larger declines, of roughly one‑quarter to one‑third, for both job creation and destruction between the late 1990s and 2010. To the degree that this reflects structural improvements in the economy that lead to more stable jobs, this would be an encouraging trend. But a potential concern is that it could reflect less reallocation of resources toward their most productive uses and thus fewer high‑paying jobs.
Factors in Decreasing in Labor Market Fluidity
12 Differences in the duration of jobs and types of establishments captured by the three series explain the level differences. The smaller decline in the Current Population Survey may be related to the fact that it misses more short‑term jobs than does the Longitudinal Employer‑Household Dynamics data (Abraham et al. 2013), and Hyatt and Speltzer (2013) show that the declining share of short‑term jobs can explain some of the decline in hires and separations. 13 A caveat is that some studies using CPS data find less clear trends in transitions for the 1980s to the 1990s, but again, for the late 1990s onward, the trend is clearly downward. Kambourov and Manovskii (2009) tabulate occupation mobility from the CPS and find an increasing trend. Moscarini and Thomsson (2007) characterize the trend in occupational mobility as weakly increasing in the 1980s. In addition, Stewart (2007) finds no trend in job‑to‑job flows from the 1980s to the 1990s using the annual retrospective question CPS question.
138 | Chapter 3
CPS Hires
JOLTS Hires
0
5
10
15
20
25
30
35
1995 1997 1999 2001 2003 2005 2007 2009 2011
2012:Q3
Source: Hyatt and Spletzer (2013); Bureau of Labor Statistics, Current Population Survey; Bureau of Labor Statistics, Job Openings and Labor Turnover Survey; Census Bureau, Longitudinal Employer-Household Dynamics.
Figure 3-21Trends in Hires and Separations, 1995–2012
Percent of Total Employment
LEHD Hires
Occupation Change
Industry Change
Employer Change
2013
0
2
4
6
8
10
12
14
1980 1985 1990 1995 2000 2005 2010
Figure 3-22Employer, Occupation, and Industry Transitions, 1983–2013
Percent of Total Population Age 16+
Source: Molloy, Smith, and Wozniak (2014)

Achievements and Challenges in the U.S. Labor Market | 139
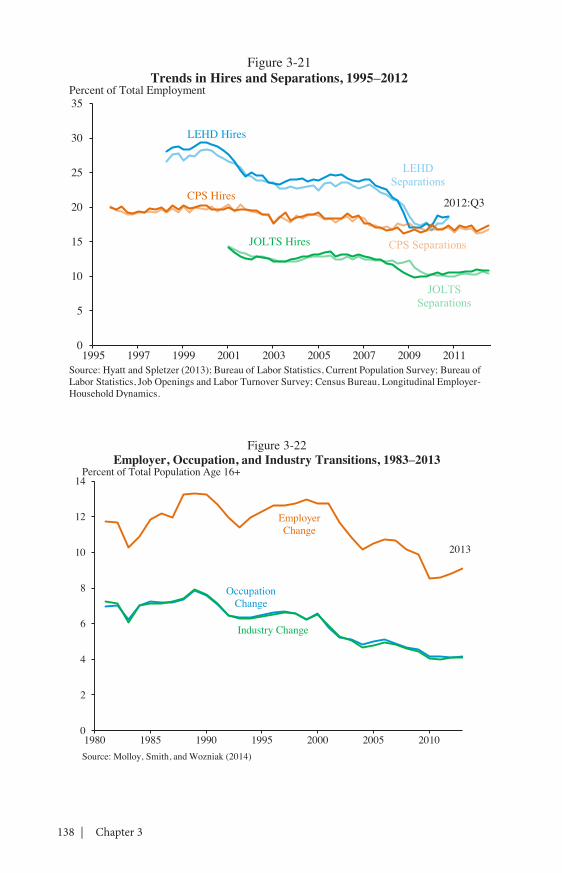
The empirical literature has only recently begun to examine why job and worker transitions have fallen. Two basic hypotheses have been explored: that firms or that workers have changed over time in ways that lower fluidity. Evidence shows that the first of these can explain a portion of declining fluidity. The average age and number of associated establish‑ments per firm have both risen in recent decades (Davis and Haltiwanger 2014; CEA calculations). Older, larger firms are associated with lower job flows, as these firms are less likely to contract or expand rapidly. Consistent with this change in firm composition, rates of firm entry and exit have also declined over the last three decades (Figure 3‑23). Because the change in the composition of firms has shifted in a way that, all else equal, would suggest fewer worker hires and separations, researchers have tested to see how much of the shift in worker flows can be explained by changes in firm composition. Hyatt and Spletzer (2013) and Davis and Haltiwanger (2014) decompose changes in worker flows into those due to job flows and those due to worker movements between existing jobs. They find that changes in job flows account for between one‑third to one‑half of the decline in worker flows. Because job flows are determined in part by firm size and age, chang‑ing firm characteristics contribute to the decline in worker flows (Hyatt and Spletzer 2013). In contrast, changes in characteristics of the average worker, like age and education, have been found to contribute little to declines in fluidity (Molloy, Smith, and Wozniak 2014; Davis and Haltiwanger 2014).
Potential Consequences of Reduced FluiditySome explanations for reduced fluidity may be benign. For example,
employers may be increasing efforts to reduce turnover for a variety of reasons: increased cost of switching workers as job training requirements increase or better worker‑firm matching at the point of hire, to name a few.14 A reduced level of labor market transitions may also have benefits for work‑ers, like more stable jobs with less disruption that allow them to invest more in skills that their employer values.
Reduced flows could be cause for concern, however, because they may undermine workers’ abilities to improve their employment situations. In particular, reduced fluidity may preclude employees from realizing the wage gains of switching jobs or make it difficult for part‑time workers to find full‑time work or result in fewer high‑paying jobs in productive industries.
14 Cairo (2013) finds that job‑training requirements have risen over time, which supports a theory that on‑the‑job experience has also become more important. Both would likely lead firms to want to lower turnover. No direct evidence exists on trends in the quality of worker‑firm matches, but a substantial literature outlines the importance of this matching for wages (Nagypál 2007; Crane 2014; Jovanovic 1979).
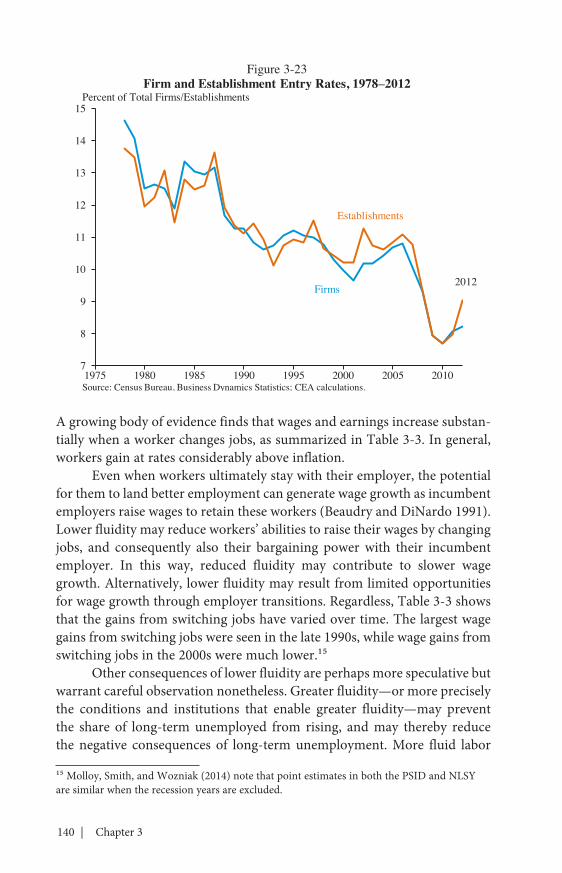
140 | Chapter 3
A growing body of evidence finds that wages and earnings increase substan‑tially when a worker changes jobs, as summarized in Table 3‑3. In general, workers gain at rates considerably above inflation.
Even when workers ultimately stay with their employer, the potential for them to land better employment can generate wage growth as incumbent employers raise wages to retain these workers (Beaudry and DiNardo 1991). Lower fluidity may reduce workers’ abilities to raise their wages by changing jobs, and consequently also their bargaining power with their incumbent employer. In this way, reduced fluidity may contribute to slower wage growth. Alternatively, lower fluidity may result from limited opportunities for wage growth through employer transitions. Regardless, Table 3‑3 shows that the gains from switching jobs have varied over time. The largest wage gains from switching jobs were seen in the late 1990s, while wage gains from switching jobs in the 2000s were much lower.15
Other consequences of lower fluidity are perhaps more speculative but warrant careful observation nonetheless. Greater fluidity—or more precisely the conditions and institutions that enable greater fluidity—may prevent the share of long‑term unemployed from rising, and may thereby reduce the negative consequences of long‑term unemployment. More fluid labor
15 Molloy, Smith, and Wozniak (2014) note that point estimates in both the PSID and NLSY are similar when the recession years are excluded.
Firms
Establishments
2012
7
8
9
10
11
12
13
14
15
1975 1980 1985 1990 1995 2000 2005 2010
Figure 3-23Firm and Establishment Entry Rates, 1978–2012
Percent of Total Firms/Establishments
Source: Census Bureau, Business Dynamics Statistics; CEA calculations.
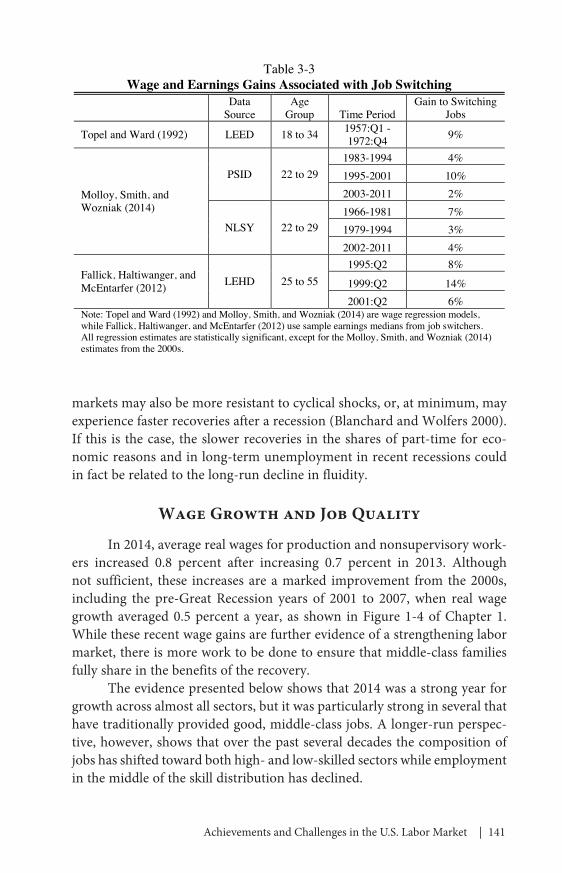
Achievements and Challenges in the U.S. Labor Market | 141
markets may also be more resistant to cyclical shocks, or, at minimum, may experience faster recoveries after a recession (Blanchard and Wolfers 2000). If this is the case, the slower recoveries in the shares of part‑time for eco‑nomic reasons and in long‑term unemployment in recent recessions could in fact be related to the long‑run decline in fluidity.
Wage Growth and Job Quality
In 2014, average real wages for production and nonsupervisory work‑ers increased 0.8 percent after increasing 0.7 percent in 2013. Although not sufficient, these increases are a marked improvement from the 2000s, including the pre‑Great Recession years of 2001 to 2007, when real wage growth averaged 0.5 percent a year, as shown in Figure 1‑4 of Chapter 1. While these recent wage gains are further evidence of a strengthening labor market, there is more work to be done to ensure that middle‑class families fully share in the benefits of the recovery.
The evidence presented below shows that 2014 was a strong year for growth across almost all sectors, but it was particularly strong in several that have traditionally provided good, middle‑class jobs. A longer‑run perspec‑tive, however, shows that over the past several decades the composition of jobs has shifted toward both high‑ and low‑skilled sectors while employment in the middle of the skill distribution has declined.
Table 3-3Wage and Earnings Gains Associated with Job Switching
Data Source
Age Group Time Period
Gain to Switching Jobs
Topel and Ward (1992) LEED 18 to 34 1957:Q1 -1972:Q4 9%
Molloy, Smith, and Wozniak (2014)
PSID 22 to 291983-1994 4%1995-2001 10%2003-2011 2%
NLSY 22 to 291966-1981 7%1979-1994 3%2002-2011 4%
Fallick, Haltiwanger, and McEntarfer (2012) LEHD 25 to 55
1995:Q2 8%
1999:Q2 14%2001:Q2 6%
Note: Topel and Ward (1992) and Molloy, Smith, and Wozniak (2014) are wage regression models, while Fallick, Haltiwanger, and McEntarfer (2012) use sample earnings medians from job switchers. All regression estimates are statistically significant, except for the Molloy, Smith, and Wozniak (2014) estimates from the 2000s.
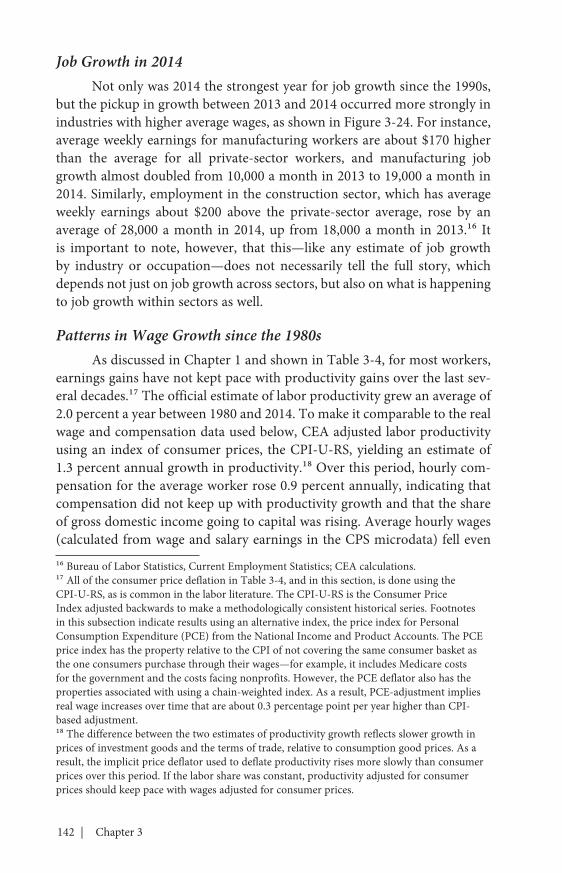
142 | Chapter 3
Job Growth in 2014Not only was 2014 the strongest year for job growth since the 1990s,
but the pickup in growth between 2013 and 2014 occurred more strongly in industries with higher average wages, as shown in Figure 3‑24. For instance, average weekly earnings for manufacturing workers are about $170 higher than the average for all private‑sector workers, and manufacturing job growth almost doubled from 10,000 a month in 2013 to 19,000 a month in 2014. Similarly, employment in the construction sector, which has average weekly earnings about $200 above the private‑sector average, rose by an average of 28,000 a month in 2014, up from 18,000 a month in 2013.16 It is important to note, however, that this—like any estimate of job growth by industry or occupation—does not necessarily tell the full story, which depends not just on job growth across sectors, but also on what is happening to job growth within sectors as well.
Patterns in Wage Growth since the 1980sAs discussed in Chapter 1 and shown in Table 3‑4, for most workers,
earnings gains have not kept pace with productivity gains over the last sev‑eral decades.17 The official estimate of labor productivity grew an average of 2.0 percent a year between 1980 and 2014. To make it comparable to the real wage and compensation data used below, CEA adjusted labor productivity using an index of consumer prices, the CPI‑U‑RS, yielding an estimate of 1.3 percent annual growth in productivity.18 Over this period, hourly com‑pensation for the average worker rose 0.9 percent annually, indicating that compensation did not keep up with productivity growth and that the share of gross domestic income going to capital was rising. Average hourly wages (calculated from wage and salary earnings in the CPS microdata) fell even
16 Bureau of Labor Statistics, Current Employment Statistics; CEA calculations.17 All of the consumer price deflation in Table 3‑4, and in this section, is done using the CPI‑U‑RS, as is common in the labor literature. The CPI‑U‑RS is the Consumer Price Index adjusted backwards to make a methodologically consistent historical series. Footnotes in this subsection indicate results using an alternative index, the price index for Personal Consumption Expenditure (PCE) from the National Income and Product Accounts. The PCE price index has the property relative to the CPI of not covering the same consumer basket as the one consumers purchase through their wages—for example, it includes Medicare costs for the government and the costs facing nonprofits. However, the PCE deflator also has the properties associated with using a chain‑weighted index. As a result, PCE‑adjustment implies real wage increases over time that are about 0.3 percentage point per year higher than CPI‑based adjustment.18 The difference between the two estimates of productivity growth reflects slower growth in prices of investment goods and the terms of trade, relative to consumption good prices. As a result, the implicit price deflator used to deflate productivity rises more slowly than consumer prices over this period. If the labor share was constant, productivity adjusted for consumer prices should keep pace with wages adjusted for consumer prices.
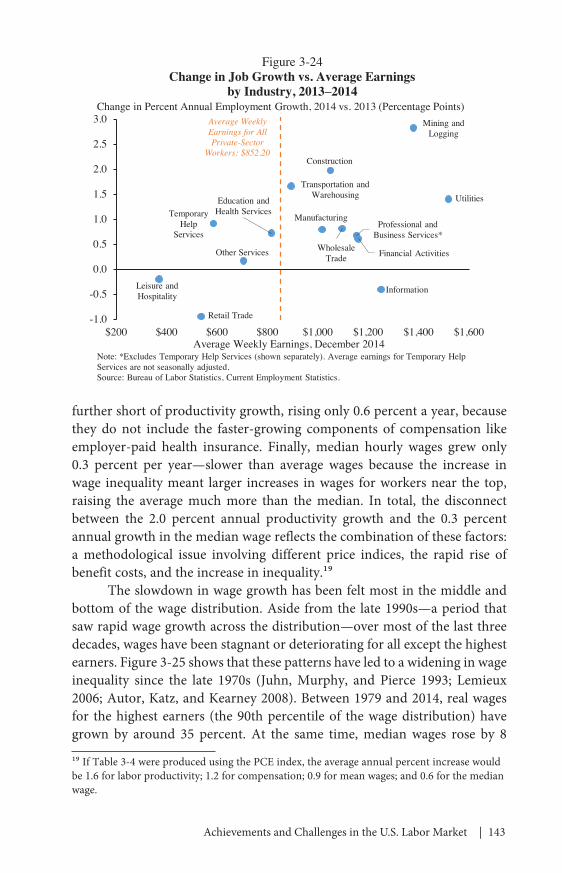
Achievements and Challenges in the U.S. Labor Market | 143
further short of productivity growth, rising only 0.6 percent a year, because they do not include the faster‑growing components of compensation like employer‑paid health insurance. Finally, median hourly wages grew only 0.3 percent per year—slower than average wages because the increase in wage inequality meant larger increases in wages for workers near the top, raising the average much more than the median. In total, the disconnect between the 2.0 percent annual productivity growth and the 0.3 percent annual growth in the median wage reflects the combination of these factors: a methodological issue involving different price indices, the rapid rise of benefit costs, and the increase in inequality.19
The slowdown in wage growth has been felt most in the middle and bottom of the wage distribution. Aside from the late 1990s—a period that saw rapid wage growth across the distribution—over most of the last three decades, wages have been stagnant or deteriorating for all except the highest earners. Figure 3‑25 shows that these patterns have led to a widening in wage inequality since the late 1970s (Juhn, Murphy, and Pierce 1993; Lemieux 2006; Autor, Katz, and Kearney 2008). Between 1979 and 2014, real wages for the highest earners (the 90th percentile of the wage distribution) have grown by around 35 percent. At the same time, median wages rose by 8
19 If Table 3‑4 were produced using the PCE index, the average annual percent increase would be 1.6 for labor productivity; 1.2 for compensation; 0.9 for mean wages; and 0.6 for the median wage.
Mining and Logging
Construction
Manufacturing
Wholesale Trade
Retail Trade
Transportation and Warehousing Utilities
Information
Financial Activities
Professional and Business Services*
Temporary Help
Services
Education and Health Services
Leisure and Hospitality
Other Services
-1.0
-0.5
0.0
0.5
1.0
1.5
2.0
2.5
3.0
$200 $400 $600 $800 $1,000 $1,200 $1,400 $1,600Average Weekly Earnings, December 2014
Figure 3-24Change in Job Growth vs. Average Earnings
by Industry, 2013–2014 Change in Percent Annual Employment Growth, 2014 vs. 2013 (Percentage Points)
Note: *Excludes Temporary Help Services (shown separately). Average earnings for Temporary Help Services are not seasonally adjusted.Source: Bureau of Labor Statistics, Current Employment Statistics.
Average WeeklyEarnings for All Private-Sector
Workers: $852.20
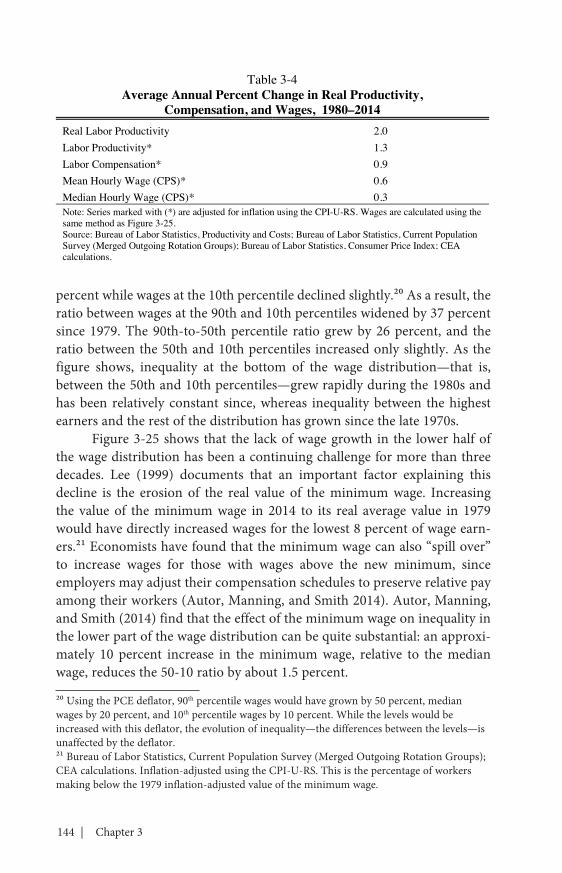
144 | Chapter 3
percent while wages at the 10th percentile declined slightly.20 As a result, the ratio between wages at the 90th and 10th percentiles widened by 37 percent since 1979. The 90th‑to‑50th percentile ratio grew by 26 percent, and the ratio between the 50th and 10th percentiles increased only slightly. As the figure shows, inequality at the bottom of the wage distribution—that is, between the 50th and 10th percentiles—grew rapidly during the 1980s and has been relatively constant since, whereas inequality between the highest earners and the rest of the distribution has grown since the late 1970s.
Figure 3‑25 shows that the lack of wage growth in the lower half of the wage distribution has been a continuing challenge for more than three decades. Lee (1999) documents that an important factor explaining this decline is the erosion of the real value of the minimum wage. Increasing the value of the minimum wage in 2014 to its real average value in 1979 would have directly increased wages for the lowest 8 percent of wage earn‑ers.21 Economists have found that the minimum wage can also “spill over” to increase wages for those with wages above the new minimum, since employers may adjust their compensation schedules to preserve relative pay among their workers (Autor, Manning, and Smith 2014). Autor, Manning, and Smith (2014) find that the effect of the minimum wage on inequality in the lower part of the wage distribution can be quite substantial: an approxi‑mately 10 percent increase in the minimum wage, relative to the median wage, reduces the 50‑10 ratio by about 1.5 percent.
20 Using the PCE deflator, 90th percentile wages would have grown by 50 percent, median wages by 20 percent, and 10th percentile wages by 10 percent. While the levels would be increased with this deflator, the evolution of inequality—the differences between the levels—is unaffected by the deflator.21 Bureau of Labor Statistics, Current Population Survey (Merged Outgoing Rotation Groups); CEA calculations. Inflation‑adjusted using the CPI‑U‑RS. This is the percentage of workers making below the 1979 inflation‑adjusted value of the minimum wage.
Table 3-4Average Annual Percent Change in Real Productivity,
Compensation, and Wages, 1980–2014Real Labor Productivity 2.0Labor Productivity* 1.3Labor Compensation* 0.9Mean Hourly Wage (CPS)* 0.6Median Hourly Wage (CPS)* 0.3Note: Series marked with (*) are adjusted for inflation using the CPI-U-RS. Wages are calculated using the same method as Figure 3-25.Source: Bureau of Labor Statistics, Productivity and Costs; Bureau of Labor Statistics, Current Population Survey (Merged Outgoing Rotation Groups); Bureau of Labor Statistics, Consumer Price Index; CEA calculations.
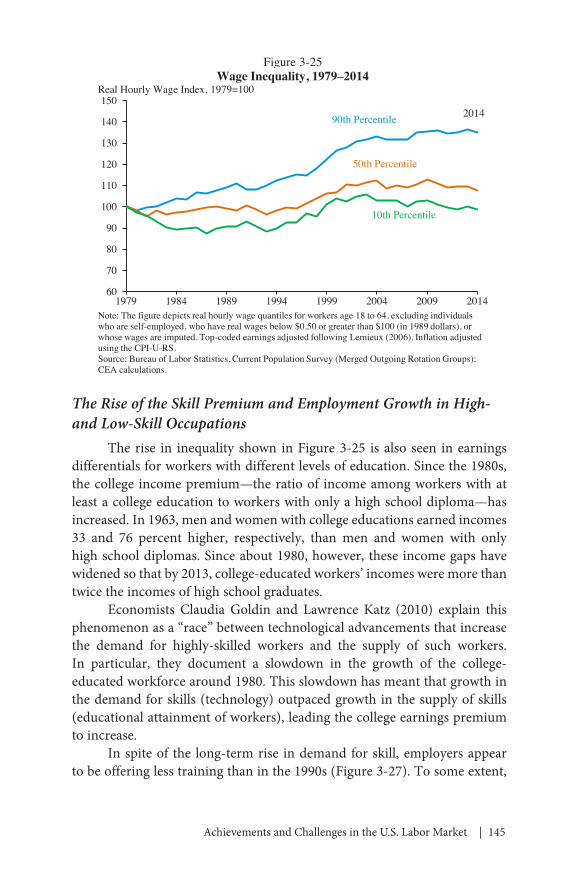
Achievements and Challenges in the U.S. Labor Market | 145
The Rise of the Skill Premium and Employment Growth in High- and Low-Skill Occupations
The rise in inequality shown in Figure 3‑25 is also seen in earnings differentials for workers with different levels of education. Since the 1980s, the college income premium—the ratio of income among workers with at least a college education to workers with only a high school diploma—has increased. In 1963, men and women with college educations earned incomes 33 and 76 percent higher, respectively, than men and women with only high school diplomas. Since about 1980, however, these income gaps have widened so that by 2013, college‑educated workers’ incomes were more than twice the incomes of high school graduates.
Economists Claudia Goldin and Lawrence Katz (2010) explain this phenomenon as a “race” between technological advancements that increase the demand for highly‑skilled workers and the supply of such workers. In particular, they document a slowdown in the growth of the college‑educated workforce around 1980. This slowdown has meant that growth in the demand for skills (technology) outpaced growth in the supply of skills (educational attainment of workers), leading the college earnings premium to increase.
In spite of the long‑term rise in demand for skill, employers appear to be offering less training than in the 1990s (Figure 3‑27). To some extent,
90th Percentile 2014
50th Percentile
10th Percentile
60
70
80
90
100
110
120
130
140
150
1979 1984 1989 1994 1999 2004 2009 2014
Figure 3-25Wage Inequality, 1979–2014
Real Hourly Wage Index, 1979=100
Note: The figure depicts real hourly wage quantiles for workers age 18 to 64, excluding individuals who are self-employed, who have real wages below $0.50 or greater than $100 (in 1989 dollars), or whose wages are imputed. Top-coded earnings adjusted following Lemieux (2006). Inflation adjusted using the CPI-U-RS.Source: Bureau of Labor Statistics, Current Population Survey (Merged Outgoing Rotation Groups); CEA calculations.
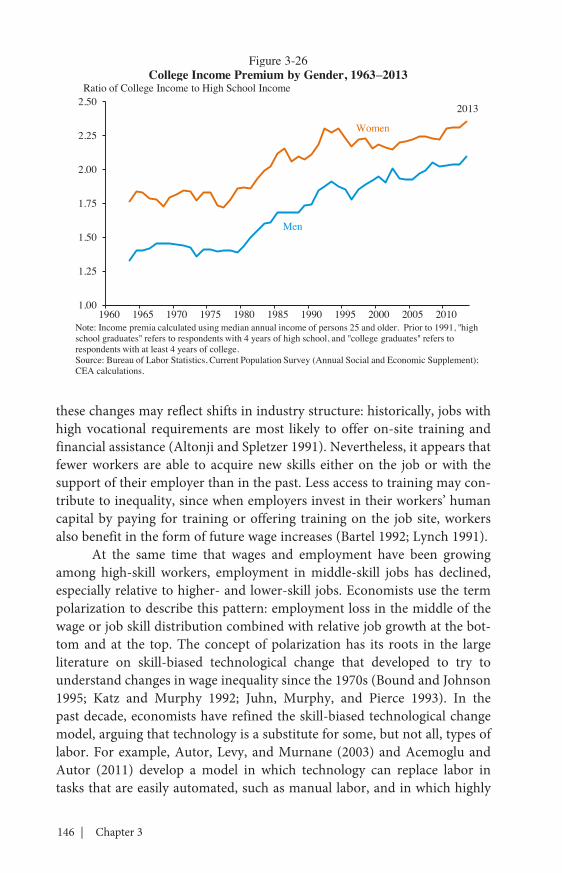
146 | Chapter 3
these changes may reflect shifts in industry structure: historically, jobs with high vocational requirements are most likely to offer on‑site training and financial assistance (Altonji and Spletzer 1991). Nevertheless, it appears that fewer workers are able to acquire new skills either on the job or with the support of their employer than in the past. Less access to training may con‑tribute to inequality, since when employers invest in their workers’ human capital by paying for training or offering training on the job site, workers also benefit in the form of future wage increases (Bartel 1992; Lynch 1991).
At the same time that wages and employment have been growing among high‑skill workers, employment in middle‑skill jobs has declined, especially relative to higher‑ and lower‑skill jobs. Economists use the term polarization to describe this pattern: employment loss in the middle of the wage or job skill distribution combined with relative job growth at the bot‑tom and at the top. The concept of polarization has its roots in the large literature on skill‑biased technological change that developed to try to understand changes in wage inequality since the 1970s (Bound and Johnson 1995; Katz and Murphy 1992; Juhn, Murphy, and Pierce 1993). In the past decade, economists have refined the skill‑biased technological change model, arguing that technology is a substitute for some, but not all, types of labor. For example, Autor, Levy, and Murnane (2003) and Acemoglu and Autor (2011) develop a model in which technology can replace labor in tasks that are easily automated, such as manual labor, and in which highly
Men
Women
2013
1.00
1.25
1.50
1.75
2.00
2.25
2.50
1960 1965 1970 1975 1980 1985 1990 1995 2000 2005 2010
Figure 3-26College Income Premium by Gender, 1963–2013
Ratio of College Income to High School Income
Note: Income premia calculated using median annual income of persons 25 and older. Prior to 1991, "high school graduates" refers to respondents with 4 years of high school, and "college graduates" refers to respondents with at least 4 years of college.Source: Bureau of Labor Statistics, Current Population Survey (Annual Social and Economic Supplement); CEA calculations.

Achievements and Challenges in the U.S. Labor Market | 147
skilled managerial professions are complementary to labor. The tasks that are most easily automated tend to be in the middle of the skills distribution, so that over time employment moves to both the lower and higher ends of the occupational ranking, as shown in Figure 3‑28, where occupations are ranked by average wage.
Figure 3‑29 uses smoothed data from employment by occupations harmonized over a longer time period to show this pattern more clearly: since the late 1970s, employment growth has been greatest in the highest and lowest earning occupations. The middle of the distribution has actually experienced employment losses, with fewer workers employed in middle‑wage occupations in 2012 than in 1979.
As demand falls for manual tasks, wages and employment in these positions also fall relative to highly‑skilled workers, leading to greater inequality. The results from this research show that, in theory, automation can lead to both job and wage polarization (Acemoglu and Autor 2011; Goos, Manning, and Salomon 2007) and some have demonstrated a link between changing tasks and other forms of wage inequality (Black and Spitz‑Oener 2010).
This stylized model, however, has not always matched the data. Some economists argue that the automation hypothesis cannot explain the timing of the trends in wage inequality and employment growth by real wage level (Card and DiNardo 2002; Mishel, Shierholz, and Schmitt 2013).
19.4
16.7
12.411.2
13.111.7
8.6 8.4
0
5
10
15
20
1996 2001 2004 2008
Employer Paid for TrainingOn-the-Job Training
Figure 3-27Percent of Workers Receiving Employer-Sponsored
or On-the-Job Training, 1996–2008
Note: Fraction of workers ages 18-65 receiving training of any duration in the last year.Source: Census Bureau, Survey of Income and Program Participation (Employment and Training Topical Module); CEA calculations.
Percent
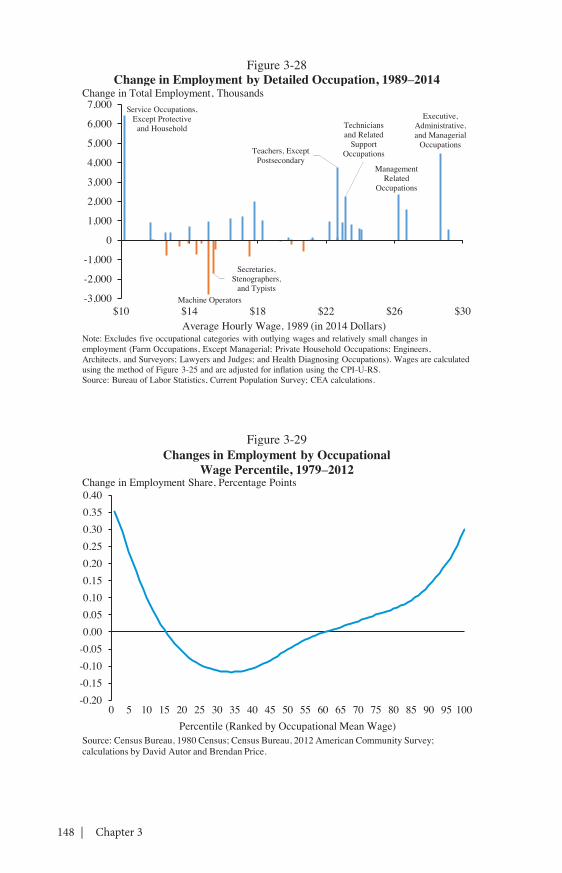
148 | Chapter 3
-0.20-0.15-0.10-0.050.000.050.100.150.200.250.300.350.40
0 5 10 15 20 25 30 35 40 45 50 55 60 65 70 75 80 85 90 95 100Percentile (Ranked by Occupational Mean Wage)
Figure 3-29Changes in Employment by Occupational
Wage Percentile, 1979–2012Change in Employment Share, Percentage Points
Source: Census Bureau, 1980 Census; Census Bureau, 2012 American Community Survey; calculations by David Autor and Brendan Price.
Machine Operators
Secretaries, Stenographers,
and Typists
Service Occupations, Except Protective
and Household Technicians and Related
Support OccupationsTeachers, Except
PostsecondaryManagement
Related Occupations
Executive, Administrative, and Managerial
Occupations
-3,000
-2,000
-1,000
0
1,000
2,000
3,000
4,000
5,000
6,000
7,000
$10 $14 $18 $22 $26 $30Average Hourly Wage, 1989 (in 2014 Dollars)
Figure 3-28Change in Employment by Detailed Occupation, 1989–2014
Change in Total Employment, Thousands
Note: Excludes five occupational categories with outlying wages and relatively small changes in employment (Farm Occupations, Except Managerial; Private Household Occupations; Engineers, Architects, and Surveyors; Lawyers and Judges; and Health Diagnosing Occupations). Wages are calculated using the method of Figure 3-25 and are adjusted for inflation using the CPI-U-RS.Source: Bureau of Labor Statistics, Current Population Survey; CEA calculations.
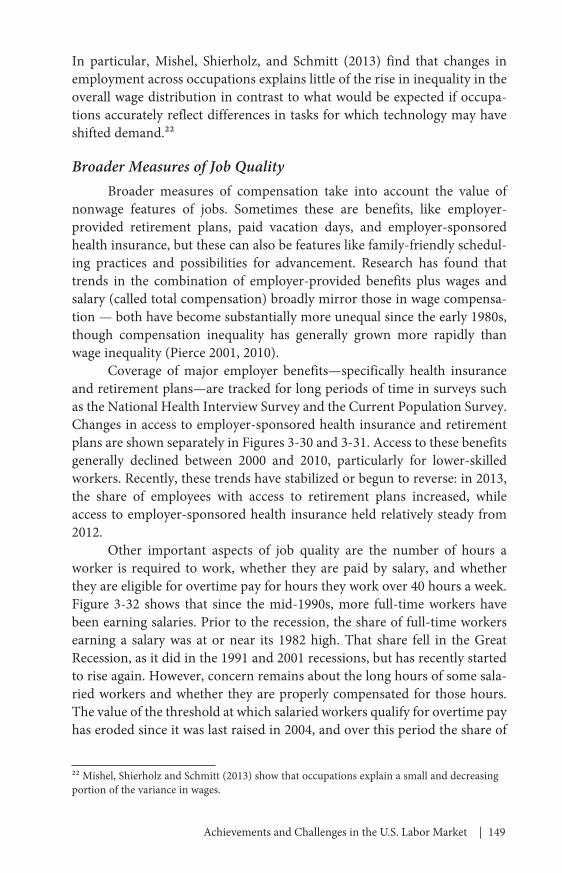
Achievements and Challenges in the U.S. Labor Market | 149
In particular, Mishel, Shierholz, and Schmitt (2013) find that changes in employment across occupations explains little of the rise in inequality in the overall wage distribution in contrast to what would be expected if occupa‑tions accurately reflect differences in tasks for which technology may have shifted demand.22
Broader Measures of Job QualityBroader measures of compensation take into account the value of
nonwage features of jobs. Sometimes these are benefits, like employer‑provided retirement plans, paid vacation days, and employer‑sponsored health insurance, but these can also be features like family‑friendly schedul‑ing practices and possibilities for advancement. Research has found that trends in the combination of employer‑provided benefits plus wages and salary (called total compensation) broadly mirror those in wage compensa‑tion — both have become substantially more unequal since the early 1980s, though compensation inequality has generally grown more rapidly than wage inequality (Pierce 2001, 2010).
Coverage of major employer benefits—specifically health insurance and retirement plans—are tracked for long periods of time in surveys such as the National Health Interview Survey and the Current Population Survey. Changes in access to employer‑sponsored health insurance and retirement plans are shown separately in Figures 3‑30 and 3‑31. Access to these benefits generally declined between 2000 and 2010, particularly for lower‑skilled workers. Recently, these trends have stabilized or begun to reverse: in 2013, the share of employees with access to retirement plans increased, while access to employer‑sponsored health insurance held relatively steady from 2012.
Other important aspects of job quality are the number of hours a worker is required to work, whether they are paid by salary, and whether they are eligible for overtime pay for hours they work over 40 hours a week. Figure 3‑32 shows that since the mid‑1990s, more full‑time workers have been earning salaries. Prior to the recession, the share of full‑time workers earning a salary was at or near its 1982 high. That share fell in the Great Recession, as it did in the 1991 and 2001 recessions, but has recently started to rise again. However, concern remains about the long hours of some sala‑ried workers and whether they are properly compensated for those hours. The value of the threshold at which salaried workers qualify for overtime pay has eroded since it was last raised in 2004, and over this period the share of
22 Mishel, Shierholz and Schmitt (2013) show that occupations explain a small and decreasing portion of the variance in wages.
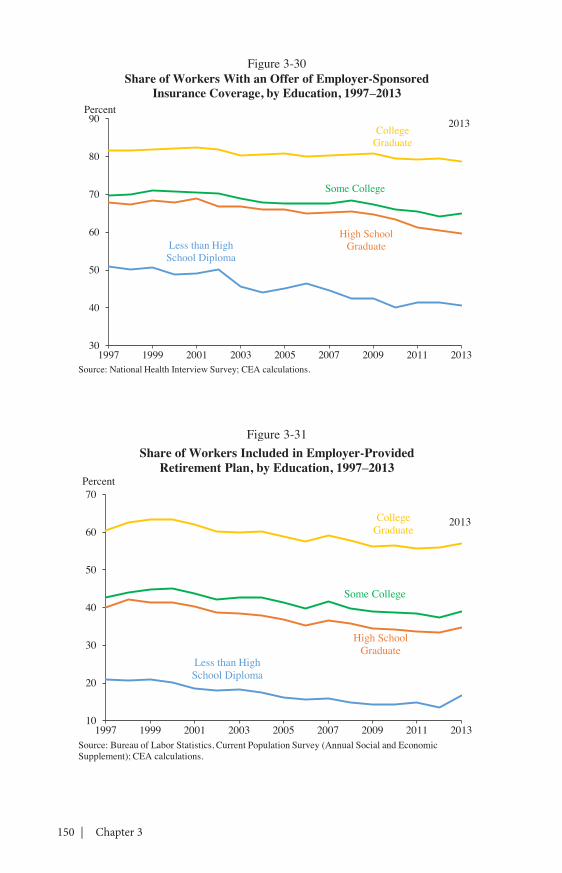
150 | Chapter 3
Less than High School Diploma
High School Graduate
Some College
College Graduate
10
20
30
40
50
60
70
1997 1999 2001 2003 2005 2007 2009 2011 2013
Figure 3-31Share of Workers Included in Employer-Provided
Retirement Plan, by Education, 1997–2013
Source: Bureau of Labor Statistics, Current Population Survey (Annual Social and Economic Supplement); CEA calculations.
2013
Percent
Less than High School Diploma
High School Graduate
Some College
College Graduate
30
40
50
60
70
80
90
1997 1999 2001 2003 2005 2007 2009 2011 2013
Figure 3-30Share of Workers With an Offer of Employer-Sponsored
Insurance Coverage, by Education, 1997–2013
Source: National Health Interview Survey; CEA calculations.
2013Percent
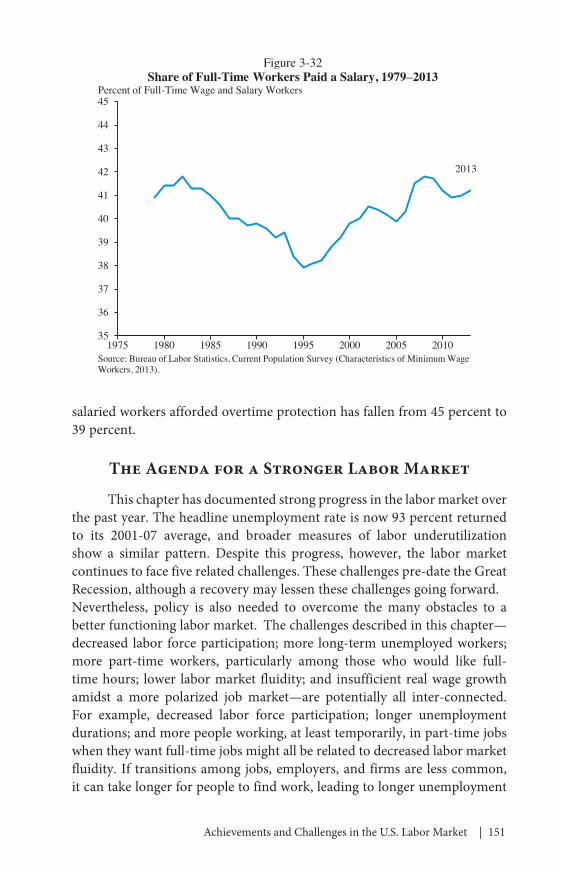
Achievements and Challenges in the U.S. Labor Market | 151
salaried workers afforded overtime protection has fallen from 45 percent to 39 percent.
The Agenda for a Stronger Labor Market
This chapter has documented strong progress in the labor market over the past year. The headline unemployment rate is now 93 percent returned to its 2001‑07 average, and broader measures of labor underutilization show a similar pattern. Despite this progress, however, the labor market continues to face five related challenges. These challenges pre‑date the Great Recession, although a recovery may lessen these challenges going forward. Nevertheless, policy is also needed to overcome the many obstacles to a better functioning labor market. The challenges described in this chapter—decreased labor force participation; more long‑term unemployed workers; more part‑time workers, particularly among those who would like full‑time hours; lower labor market fluidity; and insufficient real wage growth amidst a more polarized job market—are potentially all inter‑connected. For example, decreased labor force participation; longer unemployment durations; and more people working, at least temporarily, in part‑time jobs when they want full‑time jobs might all be related to decreased labor market fluidity. If transitions among jobs, employers, and firms are less common, it can take longer for people to find work, leading to longer unemployment
2013
35
36
37
38
39
40
41
42
43
44
45
1975 1980 1985 1990 1995 2000 2005 2010Source: Bureau of Labor Statistics, Current Population Survey (Characteristics of Minimum Wage Workers, 2013).
Figure 3-32Share of Full-Time Workers Paid a Salary, 1979–2013
Percent of Full-Time Wage and Salary Workers

152 | Chapter 3
durations. In addition, some of those workers may accept part‑time work, at least temporarily, and some workers may stay out of the labor market because they are less likely to be aware of potential opportunities or find the longer searches needed too discouraging.
One key element of a successful strategy to address these challenges is providing workers with skills that help raise job security, earnings, and job quality—and a highly‑trained workforce can also contribute to further long‑term growth. The President’s plans to improve access to education and training from birth through college are at the forefront of this strategy. The President’s Fiscal Year 2016 Budget shows this commitment through a range of proposals, from funding for early learning initiatives, including ensuring that all 4‑year‑olds have access to pre‑school, to proposing that two years of high‑quality community college be free for hard‑working students. In addition, he has proposed expanding apprenticeships and improving our workforce training systems by expanding career counseling and training in high‑growth fields.
To further help workers access jobs that match their skills and quali‑fications, the President has also proposed working with states to spread best practices for occupational licensing systems and to reduce unnecessary training or high fees that keep people from doing jobs that best utilize their talents. This builds on the leadership that First Lady Michelle Obama and Dr. Jill Biden have undertaken to reduce licensing barriers for military spouses, through which 48 states have eased licensing requirements for cur‑rent military spouses and veterans.
A second key aspect of the President’s proposals to support and help build the middle class are policies that help working families stay in the labor force, by supporting flexible workplace practices, access to paid leave and paid sick days, and greater access to high quality child care. In addition to the work‑family policies discussed in Chapter 4, the Administration’s proposal for a new secondary earner credit recognizes the additional costs that families with two earners face and therefore would help dual‑earning couples make ends meet.
Moreover, these policies are intricately linked to the President’s early childhood education proposals since ensuring that children are well‑cared for also supports their parents while they are at work. To this end, the Administration has proposed a continuum of early learning opportunities that could support working parents while benefiting children’s cognitive and socio‑emotional development. These initiatives include tripling the existing child care tax credit for families with very young children and expanding access to high‑quality early education, including child care and preschool. These steps can help parents enter the labor market knowing
Achievements and Challenges in the U.S. Labor Market | 153
that their children are cared for in a safe and nurturing environment, while also improving children’s academic performance and future outcomes in adulthood.
Better skills and better employment supports are two key ingredients for higher wages and higher incomes, but they are not sufficient. That is why the President supports raising the minimum wage, a step that would help tens of millions of workers and help ensure that no full‑time worker raises a family in poverty. Other institutional steps, like strengthening collective bargaining, would further help ensure that everyone shares in the benefits of growth.
Finally, the Administration continues to prioritize reducing long‑term unemployment. The President’s FY 2016 Budget proposes $16 billion for High‑Growth Sector training grants, disbursed across states based on their unemployment rates, to double the number of dislocated workers who can receive the training necessary to transition to high‑quality jobs. By making more funds available during economic downturns to provide training for those who face difficulties finding work in weak labor markets, this proposal could also reduce increases in long‑term unemployment during future downturns. The President has also engaged businesses in hiring and recruit‑ing the long‑term unemployed.
The President’s FY 2016 Budget also proposes a package of reforms to modernize the Unemployment Insurance (UI) program, which provides critical income support to those who are unemployed. These reforms will improve the solvency of state programs, strengthen the program’s connec‑tion to work, and reach more workers who lose a job through no fault of their own. In addition, the proposal would make the UI program more tar‑geted and responsive to economic downturns by implementing an Extended Benefits program that provides added benefits as soon as a state experiences a sharp rise in unemployment, even if a national increase in unemployment has not yet occurred.
Taking steps to foster more growth and high‑quality jobs, better pre‑pare workers for these jobs, and ensure that all workers share in the benefits of these jobs are the central tenets of the President’s approach to middle class economics. All of these actions will help capitalize on the strengths of the U.S. economy while moving to address the long‑standing challenges in the labor market.
154 |
Box 3-4: Immigration Reform and Labor Markets
A large body of academic research finds that, on balance, immigra‑tion has strong benefits for both the U.S. economy in general and U.S. labor markets in particular. Immigrants increase the productivity of the American workforce, both directly through increases in innovation and indirectly through spillovers to U.S. workers. For example, not only do high‑skilled immigrants patent at a higher rate than their nonimmigrant peers, but their innovation also has spillover effects on patenting by native‑born workers (Hunt and Gauthier‑Loiselle 2010). At the same time, lower‑skilled immigration can have positive effects on worker productivity by allowing for greater task specialization. While there is ongoing discussion in the academic literature about the direct wage and employment effects of immigration on native workers, it is important to note that researchers have found positive effects of immigration on these outcomes (for example, Peri, Shih, and Sparber 2014) as well as negative (for example, Borjas et al. 1997). Nevertheless, a number of recent studies suggest that complementarities between immigrant and nonimmigrant workers—interactions that indirectly raise the productivity, and thus wages, of both groups—may be substantial (e.g. Peri and Sparber 2009). In addition to these benefits, immigration has the potential to raise the overall labor force participation rate in the United States because immi‑grants participate in the workforce at higher rates than the native‑born population (CBO 2015a). Researchers have shown that immigration is associated with a range of characteristics that may be related to greater labor force participation (Chiquiar and Hanson 2005; Butcher and Piehl 2007).
Despite these potential gains to the economy — and to American workers — from immigration, the U.S. immigration system remains badly broken. In November 2014, President Obama announced a series of executive actions to begin moving our immigration system into the 21st century. These provisions included actions designed to better attract high‑skilled immigrants and foreign entrepreneurs and to allow advanced‑degree holders in science, technology, engineering, and math‑ematics (STEM) fields to extend on‑the‑job training. The actions will also provide deferred action from removal to millions of undocumented workers who have substantial ties to the United States, pass a criminal background check, and pay payroll and income taxes. Drawing on a large body of research examining the economic effects of previous immigra‑tion reforms, the Council of Economic Advisers (2014a) estimated that the actions announced by the President would raise U.S. GDP by between 0.4 and 0.9 percent within ten years, equivalent to $90 to $210 billion in additional real GDP (in 2014 dollars) in 2024.

| 155
While these gains are substantial, they are small when com‑pared with the potential economic effects of Congressional action on commonsense immigration reform. The Congressional Budget Office (2013) found that the Border Security, Economic Opportunity, and Immigration Modernization Act (S. 744) – the bipartisan immigration reform bill passed by the Senate in 2013 – would increase real GDP by 3.3 percent, or roughly $700 billion, over ten years and would raise average wages for all workers by 0.5 percent in twenty years. In addition, CEA estimates that the Senate’s commonsense immigration reform bill would raise the overall labor force participation rate by approximately 0.3 percentage point in ten years.