Embed Size (px)
Citation preview
University of Plymouth
PEARL https://pearl.plymouth.ac.uk
01 University of Plymouth Research Outputs University of Plymouth Research Outputs
2017-01
A formal approach to discovering
simultaneous additive masking between
auditory medical alarms
Hasanain, B
http://hdl.handle.net/10026.1/5549
10.1016/j.apergo.2016.07.008
Applied Ergonomics
All content in PEARL is protected by copyright law. Author manuscripts are made available in accordance with
publisher policies. Please cite only the published version using the details provided on the item record or
document. In the absence of an open licence (e.g. Creative Commons), permissions for further reuse of content
should be sought from the publisher or author.
A Formal Approach to Discovering Simultaneous Additive MaskingBetween Auditory Medical AlarmsI
Bassam Hasanaina, Andrew D. Boydb, Judy Edworthyc, Matthew L. Boltond,∗
aUniversity of Illinois at Chicago, Department of Mechanical and Industrial Engineering, Chicago, IL, USAbUniversity of Illinois at Chicago, Department of Biomedical and Health Information Sciences, Chicago, IL, USA
cPlymouth University, School of Psychology, Cognition Institute, Plymouth, UKdUniversity at Buffalo, State University of New York, Department of Industrial and Systems Engineering, Buffalo, NT, USA
Abstract
The failure of humans to respond to auditory medical alarms has resulted in numerous patient injuries and deaths and is thus amajor safety concern. A relatively understudied source of response failures has to do with simultaneous masking, a condition whereconcurrent sounds interact in ways that make one or more of them imperceptible due to physical limitations of human perception.This paper presents a method, which builds on a previous implementation, that uses a novel combination of psychophysical modelingand formal verification with model checking to detect masking in a modeled configuration of medical alarms. Specifically, the newmethod discussed here improves the original method by adding the ability to detect additive masking while concurrently improvingmethod usability and scalability. This paper describes how these additions to our method were realized. It then demonstrates thescalability and detection improvements via three different case studies. Results and future research are discussed.
Keywords: Medical Alarms, Masking, Psychoacoustics, Formal Methods, Model Checking
1. Introduction
Auditory medical alarms have many problems that can makethem difficult to perceive and respond to (Edworthy, 2013; Boyd,2010). The Pennsylvania Patient Safety Authority reports thatthere have been 194 documented problems with operators’ re-sponses to telemetry monitoring alerts from June 2004 to Decem-ber 2008 resulting in at least 12 deaths (ECRI Institute & ISMP,2009). A Sentinel Event Alert issued in 2013 reported 98 alarm-related incidents from 01/2009 to 06/2012: 80 resulted in patientdeath, 13 produced “permanent loss of function,” and 5 extendedthe patient’s hospital stay (The Joint Commission, 2013a). Thesetypes of problems occur because the sheer number of alarmssounding in modern medical environments often exceeds humanperceptual and cognitive capabilities (Edworthy, 2013; Cvach,2012; Way et al., 2014; The Joint Commission, 2013a; Lacherezet al., 2007). In statistics cited by the Joint Commission (TheJoint Commission, 2013a), one patient can produce hundredsof alarms a day. This corresponds to thousands of alarms perday from a single unit and tens of thousands of alarms a day in ahospital. These problems have shown themselves to be difficultto solve and, as a result, medical alarms have consistently been
IA subset of the results described in this manuscript will be presented at the2016 Human Factors and Ergonomics Society (HFES) annual meeting (Boltonet al., 2016). This manuscript constitutes a substantial contribution beyondwhat is reported in the HFES paper. Specifically, we present a significantlymore detailed description of our method and its implementation, we presenttwo additional case studies, and we present additional results of the shared casestudy. This manuscript also features a substantive extended discussion.
∗Corresponding authorEmail address: [email protected] (Matthew L. Bolton)
identified as one of the most significant technological hazardsto patient safety for more than a decade (ECRI Institute, 2014;Stead & Lin, 2009).
One of the understudied problems that occurs with simulta-neously sounding alarms is simultaneous masking, a conditionwhere multiple sounds interact in a way that prevents the humanperceptual system from hearing one of or more of them (Fastl &Zwicker, 2006). The Joint Commissions 2014 National PatientSafety Goal (NPSG) to “improve the safety of clinical alarmsystems” claimed that “individual alarm signals are difficultto detect” (The Joint Commission, 2013b) and thus partiallyresponsible for the patient safety problems associated with med-ical alarms (The Joint Commission, 2013a). As such, alarmaudibility and distinguishability are largely acknowledged asproblems that need to be overcome to address this NPSG (ECRIInstitute, 2014; Vockley, 2014). Simultaneous masking is one ofthe factors that influences whether or not an alarm is audible. Itis difficult to assign specific injury or fatality numbers to alarmmasking because it is an extremely challenging problem to iden-tify and no standards exist for determining if masking played arole in alarm non-response. However, we do have good evidencethat masking is, in part, responsible for medical practitionersfailing to respond to alarms. In an analysis of 26 operatingroom alarms and 23 intensive care unit alarms, Momtahan et al.(1993) found 25 pairs of alarms where one alarm was completelymasked by the other. This analysis did not account for the effectof multiple, concurrently sounding alarms nor did it accountfor additive masking. Thus, there were likely more instances ofmasking than were detected. Further, Toor et al. (2008) foundthat low priority sounds could often mask higher priority alarms
Preprint submitted to Applied Ergonomics June 29, 2016
in an operating room environment. As such, many experts andresearchers (Edworthy & Meredith, 1994; Meredith & Edworthy,1995; Konkani et al., 2012; Edworthy & Hellier, 2006, 2005;Patterson et al., 1990; Patterson, 1982) have acknowledged thatsimultaneous masking is a problem that needs to be addressed.
Despite this, the vast majority of the work on alarm safetyhas focused on other areas (Edworthy, 2013). Auditory maskingcan be very difficult to detect experimentally because it mayonly occur with very specific interactions of multiple, concur-rently sounding medical alarms. This problem is exacerbated bytwo conditions. First, most medical alarms are represented asmelodies (patterns) of tonal sounds, which are particularly sus-ceptible to simultaneous masking. Second, the number of alarmsin modern medical environments (Thangavelu et al., 2014), giventhat the likelihood of masking increases with the frequency andnumber of concurrently sounding alarms (Humes & Jesteadt,1989; Bosi & Goldberg, 2003).
To give analysts the ability to detect masking in configura-tions of tonal medical alarms without the need for experimenta-tion, we have developed a computational method (Hasanain et al.,2014, 2015). The method uses a novel combination of psychoa-coustic modeling and model checking. The psychoacousticsof simultaneous masking quantitatively relate sounds’ physi-cal characteristics (frequency/tone and volume) to the maskingeffect the sounds have on human perception using biologically-grounded mathematics (Bosi & Goldberg, 2003; Baumgarteet al., 1995; Schroeder et al., 1979; Ambikairajah et al., 1997;Brandenburg & Stoll, 1994; Brandenburg & Bosi, 1997). Modelchecking is an automated approach for conducting proofs (some-times referred to as formal verification) (Clarke et al., 1999).Used together in our method, an analyst is able to model thesounding behavior of a configuration of tonal alarms and usemodel checking to determine if the psychoacoustics predict ifthe represented alarms can mask each other.
In the research presented here, we present an updated versionof our method that improves its masking detection capabilitieswhile simultaneously improving its scalability. Below we pro-vide the necessary background to understand our previous andupdated methods. We then state the objectives of our new work,present an updated version of the method, and present results thatdemonstrate its improved scalability and analysis capabilities.
2. Background
In the following, we cover the necessary background onmodel checking, the psychoacoustics of simultaneous masking,and the previous version of our method.
2.1. Model Checking
Model checking comes from the field of formal methods.Formal methods are mathematical languages and techniques forthe specification, modeling, and verification of systems (Wing,1990). Specifications are formulated to rigorously describe desir-able system properties, systems are modeled using mathematicallanguages, and verification mathematically proves whether ornot the model satisfies the specification. Formal methods have
been used successfully in a number of applications, especiallyin the analysis of computer hardware and software.
Model checking is an automated approach to formal verifi-cation (Clarke et al., 1999). A model describes a system as a setof variables and transitions between variable states, usually as astate machine or automaton. Specification properties, typicallyin a temporal logic (Emerson, 1990), assert ordinal, temporalrelationships between system elements using system model vari-ables. Verification processes exhaustively search through thesystem model to determine if these propositions hold. If theydo, the model checker returns a confirmation indicating that ithas proven the property is true. If there is a violation, an ex-ecution trace through the model, called a counterexample, isproduced that shows exactly how the failure occurred. Modelchecking is particularly good at finding problems in systemswith concurrency, where system elements can interact in waysunanticipated by designers (Grumberg & Veith, 2008). Modelchecking is normally used to evaluate discrete systems. How-ever, hybrid modeling and analysis techniques can avoid thislimitation (Dutertre & Sorea, 2004; Henzinger, 1996; Podelski &Wagner, 2006) by associating each discrete state in a model (likethe sounding state of an alarm) with a value from a non-discretecontinuum. For example, when using a timed automaton (Alur& Dill, 1994; Dutertre & Sorea, 2004), every discrete state in aformal model is assigned a real numbered time.
Researchers have used formal verification to successfullyfind and correct human factors issues in automated systems (see(Bolton et al., 2013) for a review). However, outside of ourprevious results (Hasanain et al., 2014, 2015), none of this workhas explored how human perception and problems associatedwith it can be included in formal analyses.
2.2. The Psychoacoustics of Simultaneous MaskingThe psychoacoustics of simultaneous masking mathemati-
cally relate a sound’s physical characteristics (its frequency/toneand volume) to the masking effect the sound has on human per-ception. The most successful of these are based on the expectedexcitation patterns of the human ear’s basilar membrane (thephysical structure largely responsible for allowing humans todistinguish between different sounds) (Bosi & Goldberg, 2003;Baumgarte et al., 1995; Schroeder et al., 1979; Ambikairajahet al., 1997; Brandenburg & Stoll, 1994; Brandenburg & Bosi,1997). Conceptually, these models predict how a potentiallymasking sound (the masker ) will stimulate the receptors on thebasilar membrane based on its volume and relative frequencyto the potentially masked sound (the maskee). This stimulationcreates a higher volume threshold (in dB) that the maskee mustexceed to be perceivable (Bosi & Goldberg, 2003).
The psychoacoustics used to describe masking representfrequency on the Bark scale (E. Zwicker and R. Feldtkeller,1967). Specifically, the Bark scale maps a frequency (in Hz) toa location on the basilar membrane where the sound stimulatesthe receptors the strongest. Frequency to Bark conversion iscalculated as
zsound = 13 · arctan(0.00076 · fsound)
+ 3.5 · arctan(
(fsound/7500)2),
(1)
2
where fsound is the sound’s frequency in hz (E. Zwicker and R.Feldtkeller, 1967).
The masking threshold is then represented by a “maskingcurve” formulated as:
curvemasker (zmaskee) = spreadmasker (δz)
+ vmasker −∆.(2)
vmasker is the volume of the masker in dB. δz is defined as
δz = zmaskee − zmasker , (3)
where zmaskee and zmasker are the frequency of the maskee andmasker respectively on the Bark scale. spreadmasker defineshow the volume/magnitude of the masking threshold changeswith δz. ∆ is the minimum difference between a masker’s andmaskee’s volume under which masking can occur.
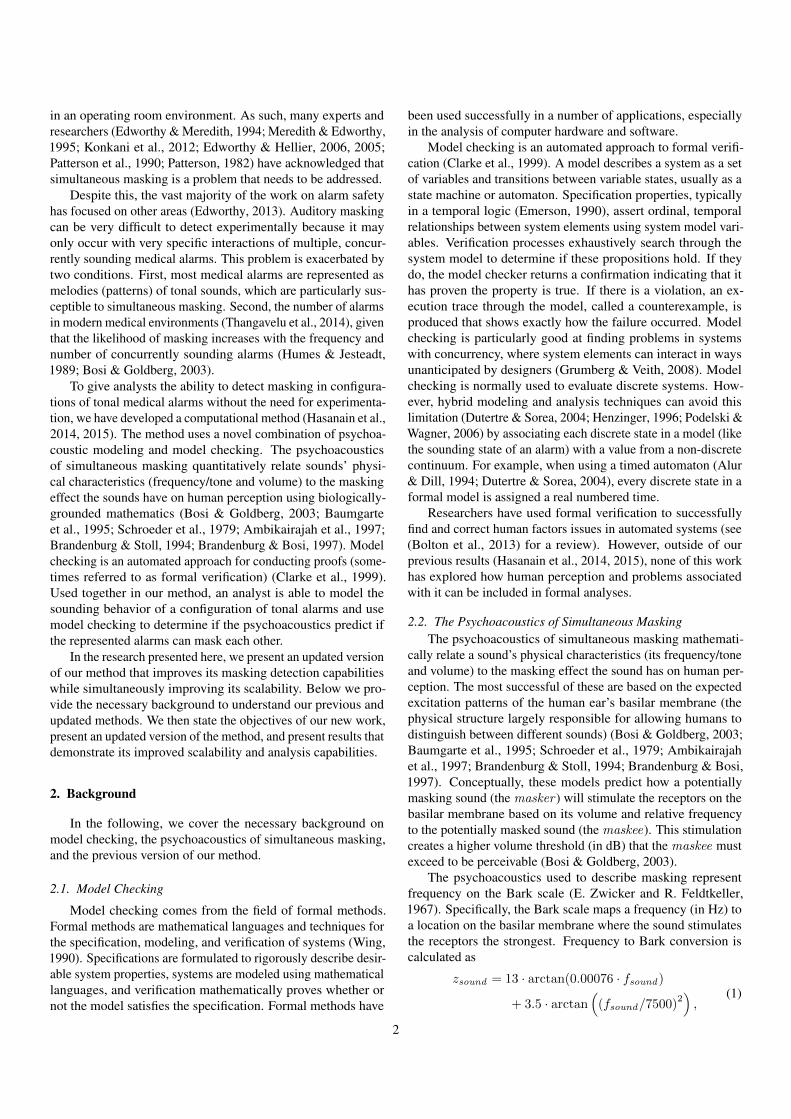
There are multiple psychoacoustic spreading functions fordifferent types of sounds (Bosi & Goldberg, 2003). Similarly,there can be different formulations of ∆ depending on types ofsounds. An example of a masking curve can be seen in Fig. 1
These psychoacoustics can determine if a single sound canmask another sound and were the basis for previously publishedresults (Hasanain et al., 2014, 2015). However, when there aremultiple concurrent sounds, their combined masking thresholdcan be greater than the sum of each individual masker’s effect.This additive masking (Humes & Jesteadt, 1989; Bosi & Gold-berg, 2003) is modeled by combining the masking curve valuesof each potential masker on the power scale. Using the followingequation to represent a volume (v in dB) on the power scale
power (v) = 10v/10, (4)
for a given potential maskee and N potential maskers, the aggre-gate masking threshold (in dB) is calculated as
power (mthreshmaskee) = power (absmaskee)
+(∑N
n=1 power (curvemaskern(zmaskee))α)1/α
.(5)
In this, α is a positive constant (Green, 1967) and absmaskee
is the absolute threshold of hearing (in dB) at the maskee’s
Masker Volume
δz
dB
0
∆
Masking
Masking Curve
Figure 1: An example masking curve. Peak masking occurs at δz = 0, whereany sound with a volume ∆ below the masker’s will be masked. The maskingeffect decreases in accordance with the masking curve’s spreading function asδz moves away from zero.
frequency (fmaskee in Hz) calculated as (Terhardt, 1979)
absmaskee = 3.64 ·(fmaskee
1000
)−0.8
− 6.5 · e−0.6(
fmaskee1000 −3.3
)2
+ 10−3 ·(fmaskee
1000
)4
.
(6)
These psychoacoustics have shown themselves to be validand useful for predicting masking for normal human hearingfor decades (Bosi & Goldberg, 2003). They have been usedto identify masking between recorded medical sounds (Tooret al., 2008). They have also served as the basis for lossy audiocompression techniques like those used in the different versionsof MPEG (Bosi & Goldberg, 2003).
2.3. Our Original Method
In our original method (Hasanain et al., 2014, 2015), ananalyst was required to manually model a configuration of medi-cal alarms based on a set architecture and code patterns. Thisallowed an analyst to describe each alarm as a state machine,where the frequency (in Hz) and volume (in Db) would changeat specific times. Specifications could also be created usingspecification patterns for asserting the absence of partial andtotal masking. Model checking could then be used to determineif any given alarm could ever be masked by other alarms basedon the psychoacoustics in Eq. (2). It is important to note thatmasking could only be detected between pairs of alarms, thoughmultiple pairs of alarms could ultimately contribute to the totalmasking of a given alarm.
In this version of the method, we used the spreading function(for computations using Eq. (2)) from the MPEG2 audio codec(Schroeder et al., 1979). This is formulated as
spreadmasker(δz) =15.81 + 7.5 · (δz + 0.474)
− 17.5 ·√
1 + (δz + 0.474)2.(7)
This spreading function was chosen specifically because of theexpressiveness limitations of model checking. In particular,model checkers are unable to represent non-linear mathematicaloperations on model variables. Thus, non-linear psychoacousticswere implemented using lookup tables (Hasanain et al., 2015).Because this spreading function has only one independent vari-able (δz), it was computationally feasible to implement a lookuptable for all of the possible values of δz at a resolution of 0.1barks. We also used a ∆ formulated as
∆ = 14.5 + zmasker (8)
because (Jayant et al., 1993) found this to be appropriate fortonal maskers.
While this version of the method proved itself to be useful(see Hasanain et al. 2014, 2015) it has four significant limita-tions. First, because it only considers masking between pairsor alarm sounds, it does not account for the additive effect ofmasking (Humes & Jesteadt, 1989; Bosi & Goldberg, 2003).
3
Second, because Eq. (7) was predominantly used because ofits computational convenience, there are psychoacoustics bettersuited to modeling the effect of tonal alarms. Third, the methodscaled badly, resulting in analyses that would take prohibitivelylong to give useful results for complex applications (Hasanainet al., 2015). Fourth, the method required manual formal model-ing and specification by analysts and provided no user supportfor interpreting analysis results.
3. Objectives
The work presented here shows how our method was re-implemented to address the above limitations of the original. Tothis end, we enable our method to account for the additive ofmasking. We also update the psychoacoustics used to computemasking curves to better reflect the tonal nature of the maskingsounds of alarms. We further create a computer program thatenables the lookup tables to be optimized to improve scalabilitywhile using new psychoacoustics. Finally, this program wasgiven features to simplify the model creation process and allowanalysts to automatically visualize counterexamples to identifywhen and how masking can occur. Below we describe howthese features were realized. To demonstrate the scalabilityimprovements of the method and show that the new version hascomparable detection capabilities to the original, we re-evaluatethe application presented in (Hasanain et al., 2014, 2015) andcompare the results. We also demonstrate the ability of themethod to detect additive masking in another simple application.Finally, we show the ability of the method to detect additivemasking in a realistic application by applying it to the alarmsused in a telemetry monitoring system.
4. Method
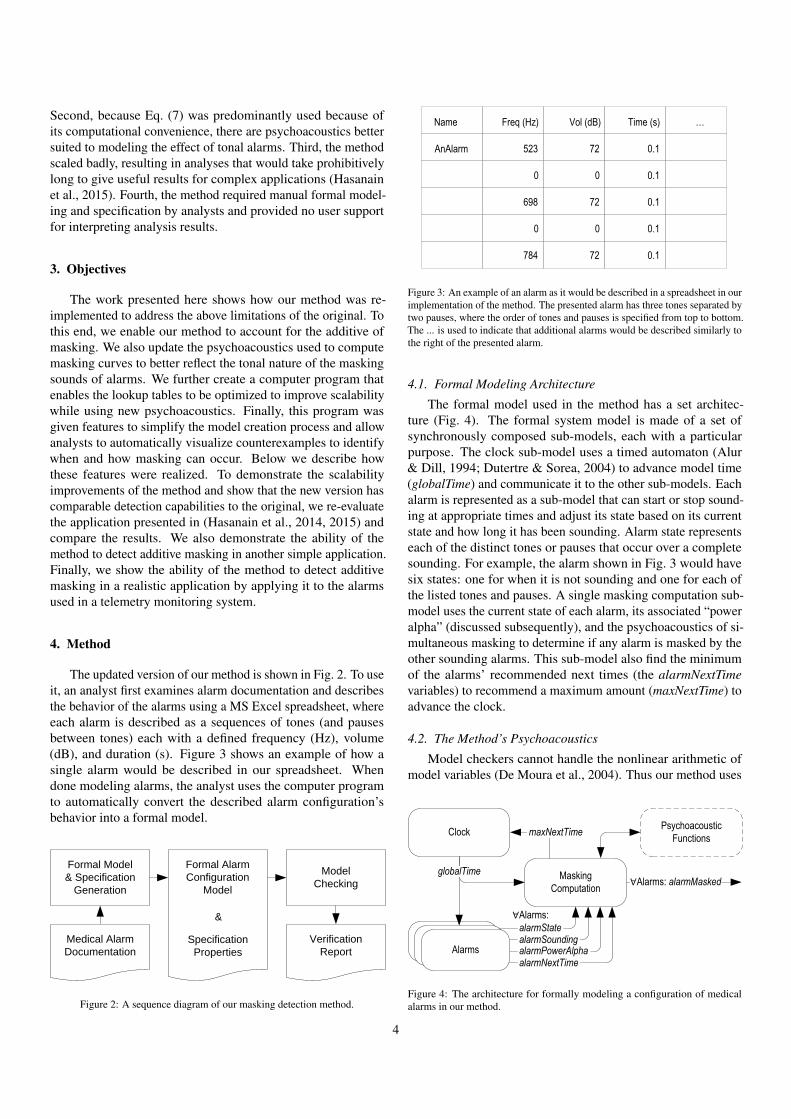
The updated version of our method is shown in Fig. 2. To useit, an analyst first examines alarm documentation and describesthe behavior of the alarms using a MS Excel spreadsheet, whereeach alarm is described as a sequences of tones (and pausesbetween tones) each with a defined frequency (Hz), volume(dB), and duration (s). Figure 3 shows an example of how asingle alarm would be described in our spreadsheet. Whendone modeling alarms, the analyst uses the computer programto automatically convert the described alarm configuration’sbehavior into a formal model.
Model
Checking
Formal Model
& Specification
Generation
Verification
Report
Medical Alarm
DocumentationSpecification
Properties
Formal Alarm
Configuration
Model
&
Figure 2: A sequence diagram of our masking detection method.
Name Freq (Hz) Vol (dB) Time (s) …
AnAlarm 523 72 0.1
0 0 0.1
698 72 0.1
0 0 0.1
784 72 0.1
Figure 3: An example of an alarm as it would be described in a spreadsheet in ourimplementation of the method. The presented alarm has three tones separated bytwo pauses, where the order of tones and pauses is specified from top to bottom.The ... is used to indicate that additional alarms would be described similarly tothe right of the presented alarm.
4.1. Formal Modeling Architecture
The formal model used in the method has a set architec-ture (Fig. 4). The formal system model is made of a set ofsynchronously composed sub-models, each with a particularpurpose. The clock sub-model uses a timed automaton (Alur& Dill, 1994; Dutertre & Sorea, 2004) to advance model time(globalTime) and communicate it to the other sub-models. Eachalarm is represented as a sub-model that can start or stop sound-ing at appropriate times and adjust its state based on its currentstate and how long it has been sounding. Alarm state representseach of the distinct tones or pauses that occur over a completesounding. For example, the alarm shown in Fig. 3 would havesix states: one for when it is not sounding and one for each ofthe listed tones and pauses. A single masking computation sub-model uses the current state of each alarm, its associated “poweralpha” (discussed subsequently), and the psychoacoustics of si-multaneous masking to determine if any alarm is masked by theother sounding alarms. This sub-model also find the minimumof the alarms’ recommended next times (the alarmNextTimevariables) to recommend a maximum amount (maxNextTime) toadvance the clock.
4.2. The Method’s Psychoacoustics
Model checkers cannot handle the nonlinear arithmetic ofmodel variables (De Moura et al., 2004). Thus our method uses
Clock
Masking
Computation
Psychoacoustic
FunctionsmaxNextTime
∀Alarms:
∀Alarms: alarmMasked
Alarms
alarmState
alarmPowerAlphaalarmSounding
alarmNextTime
globalTime
Figure 4: The architecture for formally modeling a configuration of medicalalarms in our method.
4
a pre-computed lookup table (functions) to represent nonlinearpsychoacoustic computations. However, the size of your lookuptables can reduce the efficiency of your model. Thus, in ournew method, we encapsulate all of the necessary non-linearmathematical operations into a single lookup table. This wasoptimized to ensure the minimum number of necessary entriesfor any given model. This was done to reduce verification time.
The “power alpha” value discussed above and in Fig. 4 playsan important role in this optimization and allows for the detectionof masking using a model checker. By transforming the maskee’svolume and the masking effect of maskers into “power alpha”values using lookup tables, masking can be detected using onlylinear arithmetic operations. Figure 5 explains the formulationand rational for the “power alpha” transformation.
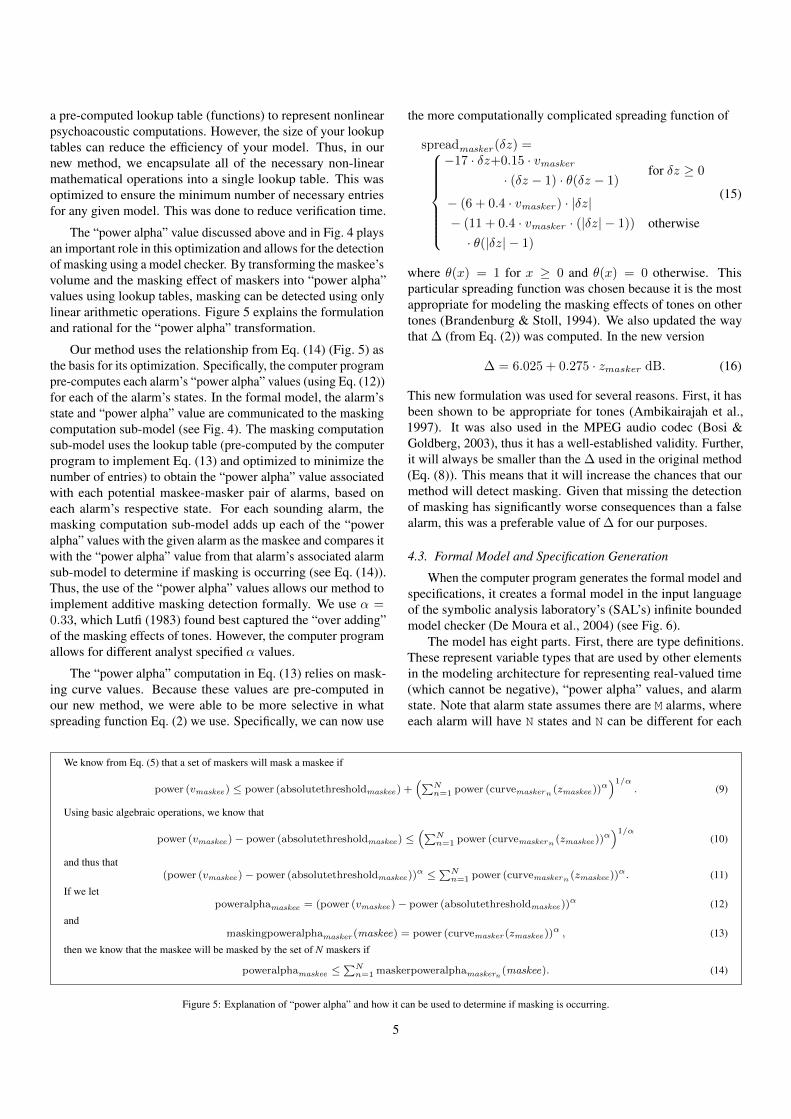
Our method uses the relationship from Eq. (14) (Fig. 5) asthe basis for its optimization. Specifically, the computer programpre-computes each alarm’s “power alpha” values (using Eq. (12))for each of the alarm’s states. In the formal model, the alarm’sstate and “power alpha” value are communicated to the maskingcomputation sub-model (see Fig. 4). The masking computationsub-model uses the lookup table (pre-computed by the computerprogram to implement Eq. (13) and optimized to minimize thenumber of entries) to obtain the “power alpha” value associatedwith each potential maskee-masker pair of alarms, based oneach alarm’s respective state. For each sounding alarm, themasking computation sub-model adds up each of the “poweralpha” values with the given alarm as the maskee and compares itwith the “power alpha” value from that alarm’s associated alarmsub-model to determine if masking is occurring (see Eq. (14)).Thus, the use of the “power alpha” values allows our method toimplement additive masking detection formally. We use α =0.33, which Lutfi (1983) found best captured the “over adding”of the masking effects of tones. However, the computer programallows for different analyst specified α values.
The “power alpha” computation in Eq. (13) relies on mask-ing curve values. Because these values are pre-computed inour new method, we were able to be more selective in whatspreading function Eq. (2) we use. Specifically, we can now use
the more computationally complicated spreading function of
spreadmasker (δz) =
−17 · δz+0.15 · vmasker
· (δz − 1) · θ(δz − 1)for δz ≥ 0
− (6 + 0.4 · vmasker ) · |δz|− (11 + 0.4 · vmasker · (|δz| − 1))
· θ(|δz| − 1)
otherwise
(15)
where θ(x) = 1 for x ≥ 0 and θ(x) = 0 otherwise. Thisparticular spreading function was chosen because it is the mostappropriate for modeling the masking effects of tones on othertones (Brandenburg & Stoll, 1994). We also updated the waythat ∆ (from Eq. (2)) was computed. In the new version
∆ = 6.025 + 0.275 · zmasker dB. (16)
This new formulation was used for several reasons. First, it hasbeen shown to be appropriate for tones (Ambikairajah et al.,1997). It was also used in the MPEG audio codec (Bosi &Goldberg, 2003), thus it has a well-established validity. Further,it will always be smaller than the ∆ used in the original method(Eq. (8)). This means that it will increase the chances that ourmethod will detect masking. Given that missing the detectionof masking has significantly worse consequences than a falsealarm, this was a preferable value of ∆ for our purposes.
4.3. Formal Model and Specification Generation
When the computer program generates the formal model andspecifications, it creates a formal model in the input languageof the symbolic analysis laboratory’s (SAL’s) infinite boundedmodel checker (De Moura et al., 2004) (see Fig. 6).
The model has eight parts. First, there are type definitions.These represent variable types that are used by other elementsin the modeling architecture for representing real-valued time(which cannot be negative), “power alpha” values, and alarmstate. Note that alarm state assumes there are M alarms, whereeach alarm will have N states and N can be different for each
We know from Eq. (5) that a set of maskers will mask a maskee if
power (vmaskee) ≤ power (absolutethresholdmaskee) +(∑N
n=1 power (curvemaskern (zmaskee))α)1/α
. (9)
Using basic algebraic operations, we know that
power (vmaskee) − power (absolutethresholdmaskee) ≤(∑N
n=1 power (curvemaskern (zmaskee))α)1/α
(10)
and thus that(power (vmaskee) − power (absolutethresholdmaskee))α ≤
∑Nn=1 power (curvemaskern (zmaskee))α. (11)
If we letpoweralphamaskee = (power (vmaskee) − power (absolutethresholdmaskee))α (12)
andmaskingpoweralphamasker (maskee) = power (curvemasker (zmaskee))α , (13)
then we know that the maskee will be masked by the set of N maskers if
poweralphamaskee ≤∑Nn=1 maskerpoweralphamaskern
(maskee). (14)
Figure 5: Explanation of “power alpha” and how it can be used to determine if masking is occurring.
5
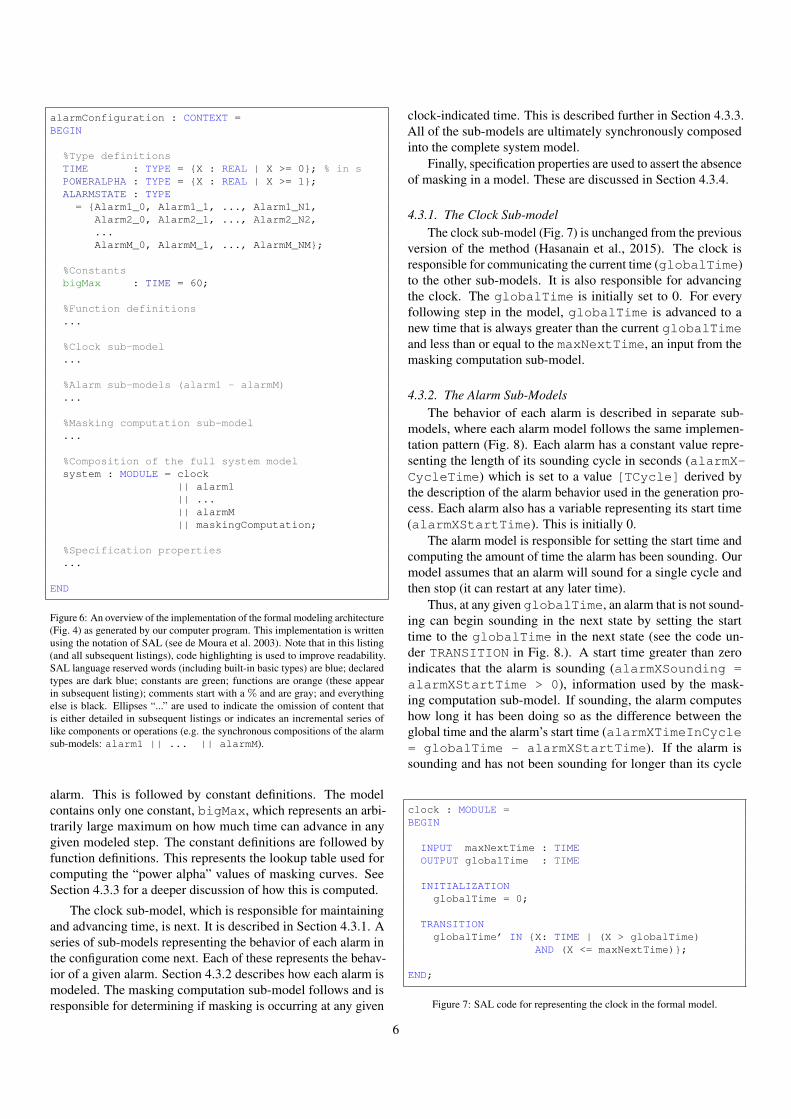
alarmConfiguration : CONTEXT =BEGIN
%Type definitionsTIME : TYPE = {X : REAL | X >= 0}; % in sPOWERALPHA : TYPE = {X : REAL | X >= 1};ALARMSTATE : TYPE
= {Alarm1_0, Alarm1_1, ..., Alarm1_N1,Alarm2_0, Alarm2_1, ..., Alarm2_N2,...AlarmM_0, AlarmM_1, ..., AlarmM_NM};
%ConstantsbigMax : TIME = 60;
%Function definitions...
%Clock sub-model...
%Alarm sub-models (alarm1 - alarmM)...
%Masking computation sub-model...
%Composition of the full system modelsystem : MODULE = clock
|| alarm1|| ...|| alarmM|| maskingComputation;
%Specification properties...
END
Figure 6: An overview of the implementation of the formal modeling architecture(Fig. 4) as generated by our computer program. This implementation is writtenusing the notation of SAL (see de Moura et al. 2003). Note that in this listing(and all subsequent listings), code highlighting is used to improve readability.SAL language reserved words (including built-in basic types) are blue; declaredtypes are dark blue; constants are green; functions are orange (these appearin subsequent listing); comments start with a % and are gray; and everythingelse is black. Ellipses “...” are used to indicate the omission of content thatis either detailed in subsequent listings or indicates an incremental series oflike components or operations (e.g. the synchronous compositions of the alarmsub-models: alarm1 || ... || alarmM).
alarm. This is followed by constant definitions. The modelcontains only one constant, bigMax, which represents an arbi-trarily large maximum on how much time can advance in anygiven modeled step. The constant definitions are followed byfunction definitions. This represents the lookup table used forcomputing the “power alpha” values of masking curves. SeeSection 4.3.3 for a deeper discussion of how this is computed.
The clock sub-model, which is responsible for maintainingand advancing time, is next. It is described in Section 4.3.1. Aseries of sub-models representing the behavior of each alarm inthe configuration come next. Each of these represents the behav-ior of a given alarm. Section 4.3.2 describes how each alarm ismodeled. The masking computation sub-model follows and isresponsible for determining if masking is occurring at any given
clock-indicated time. This is described further in Section 4.3.3.All of the sub-models are ultimately synchronously composedinto the complete system model.
Finally, specification properties are used to assert the absenceof masking in a model. These are discussed in Section 4.3.4.
4.3.1. The Clock Sub-modelThe clock sub-model (Fig. 7) is unchanged from the previous
version of the method (Hasanain et al., 2015). The clock isresponsible for communicating the current time (globalTime)to the other sub-models. It is also responsible for advancingthe clock. The globalTime is initially set to 0. For everyfollowing step in the model, globalTime is advanced to anew time that is always greater than the current globalTimeand less than or equal to the maxNextTime, an input from themasking computation sub-model.
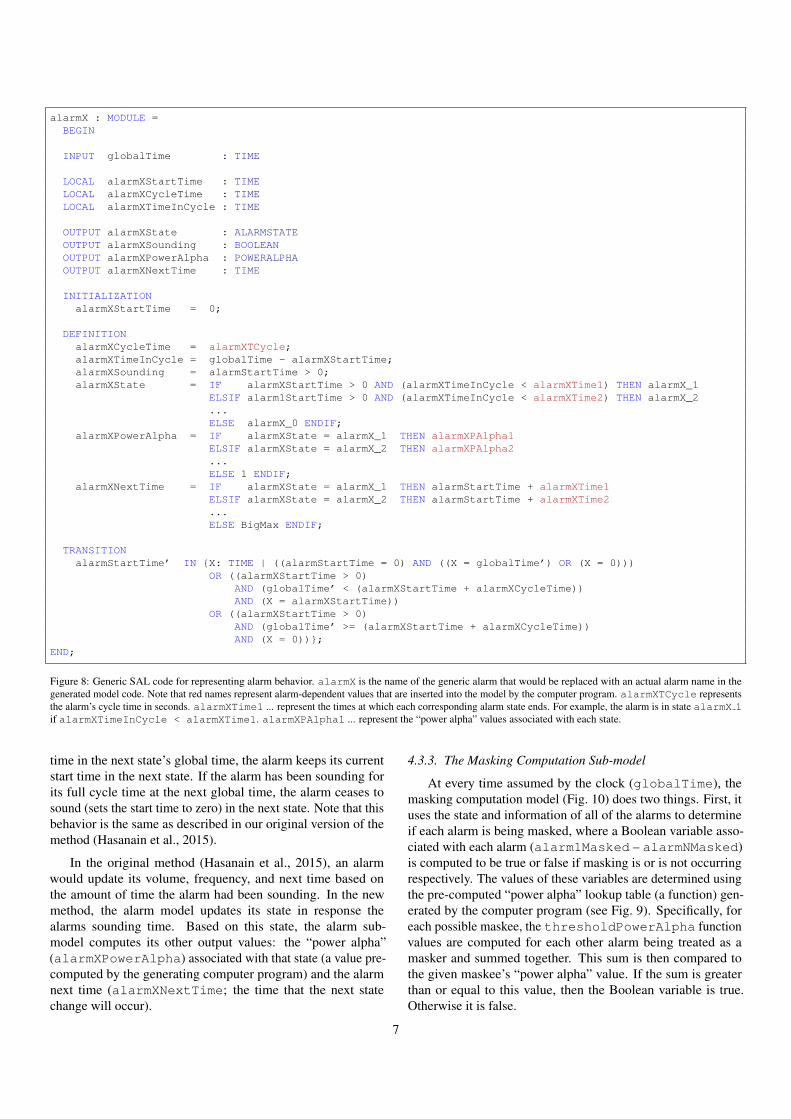
4.3.2. The Alarm Sub-ModelsThe behavior of each alarm is described in separate sub-
models, where each alarm model follows the same implemen-tation pattern (Fig. 8). Each alarm has a constant value repre-senting the length of its sounding cycle in seconds (alarmX-CycleTime) which is set to a value [TCycle] derived bythe description of the alarm behavior used in the generation pro-cess. Each alarm also has a variable representing its start time(alarmXStartTime). This is initially 0.
The alarm model is responsible for setting the start time andcomputing the amount of time the alarm has been sounding. Ourmodel assumes that an alarm will sound for a single cycle andthen stop (it can restart at any later time).
Thus, at any given globalTime, an alarm that is not sound-ing can begin sounding in the next state by setting the starttime to the globalTime in the next state (see the code un-der TRANSITION in Fig. 8.). A start time greater than zeroindicates that the alarm is sounding (alarmXSounding =alarmXStartTime > 0), information used by the mask-ing computation sub-model. If sounding, the alarm computeshow long it has been doing so as the difference between theglobal time and the alarm’s start time (alarmXTimeInCycle= globalTime - alarmXStartTime). If the alarm issounding and has not been sounding for longer than its cycle
clock : MODULE =BEGIN
INPUT maxNextTime : TIMEOUTPUT globalTime : TIME
INITIALIZATIONglobalTime = 0;
TRANSITIONglobalTime’ IN {X: TIME | (X > globalTime)
AND (X <= maxNextTime)};
END;
Figure 7: SAL code for representing the clock in the formal model.
6
alarmX : MODULE =BEGIN
INPUT globalTime : TIME
LOCAL alarmXStartTime : TIMELOCAL alarmXCycleTime : TIMELOCAL alarmXTimeInCycle : TIME
OUTPUT alarmXState : ALARMSTATEOUTPUT alarmXSounding : BOOLEANOUTPUT alarmXPowerAlpha : POWERALPHAOUTPUT alarmXNextTime : TIME
INITIALIZATIONalarmXStartTime = 0;
DEFINITIONalarmXCycleTime = alarmXTCycle;alarmXTimeInCycle = globalTime - alarmXStartTime;alarmXSounding = alarmStartTime > 0;alarmXState = IF alarmXStartTime > 0 AND (alarmXTimeInCycle < alarmXTime1) THEN alarmX_1
ELSIF alarm1StartTime > 0 AND (alarmXTimeInCycle < alarmXTime2) THEN alarmX_2...ELSE alarmX_0 ENDIF;
alarmXPowerAlpha = IF alarmXState = alarmX_1 THEN alarmXPAlpha1ELSIF alarmXState = alarmX_2 THEN alarmXPAlpha2...ELSE 1 ENDIF;
alarmXNextTime = IF alarmXState = alarmX_1 THEN alarmStartTime + alarmXTime1ELSIF alarmXState = alarmX_2 THEN alarmStartTime + alarmXTime2...ELSE BigMax ENDIF;
TRANSITIONalarmStartTime’ IN {X: TIME | ((alarmStartTime = 0) AND ((X = globalTime’) OR (X = 0)))
OR ((alarmXStartTime > 0)AND (globalTime’ < (alarmXStartTime + alarmXCycleTime))AND (X = alarmXStartTime))
OR ((alarmXStartTime > 0)AND (globalTime’ >= (alarmXStartTime + alarmXCycleTime))AND (X = 0))};
END;
Figure 8: Generic SAL code for representing alarm behavior. alarmX is the name of the generic alarm that would be replaced with an actual alarm name in thegenerated model code. Note that red names represent alarm-dependent values that are inserted into the model by the computer program. alarmXTCycle representsthe alarm’s cycle time in seconds. alarmXTime1 ... represent the times at which each corresponding alarm state ends. For example, the alarm is in state alarmX 1if alarmXTimeInCycle < alarmXTime1. alarmXPAlpha1 ... represent the “power alpha” values associated with each state.
time in the next state’s global time, the alarm keeps its currentstart time in the next state. If the alarm has been sounding forits full cycle time at the next global time, the alarm ceases tosound (sets the start time to zero) in the next state. Note that thisbehavior is the same as described in our original version of themethod (Hasanain et al., 2015).
In the original method (Hasanain et al., 2015), an alarmwould update its volume, frequency, and next time based onthe amount of time the alarm had been sounding. In the newmethod, the alarm model updates its state in response thealarms sounding time. Based on this state, the alarm sub-model computes its other output values: the “power alpha”(alarmXPowerAlpha) associated with that state (a value pre-computed by the generating computer program) and the alarmnext time (alarmXNextTime; the time that the next statechange will occur).
4.3.3. The Masking Computation Sub-model
At every time assumed by the clock (globalTime), themasking computation model (Fig. 10) does two things. First, ituses the state and information of all of the alarms to determineif each alarm is being masked, where a Boolean variable asso-ciated with each alarm (alarm1Masked – alarmNMasked)is computed to be true or false if masking is or is not occurringrespectively. The values of these variables are determined usingthe pre-computed “power alpha” lookup table (a function) gen-erated by the computer program (see Fig. 9). Specifically, foreach possible maskee, the thresholdPowerAlpha functionvalues are computed for each other alarm being treated as amasker and summed together. This sum is then compared tothe given maskee’s “power alpha” value. If the sum is greaterthan or equal to this value, then the Boolean variable is true.Otherwise it is false.
7
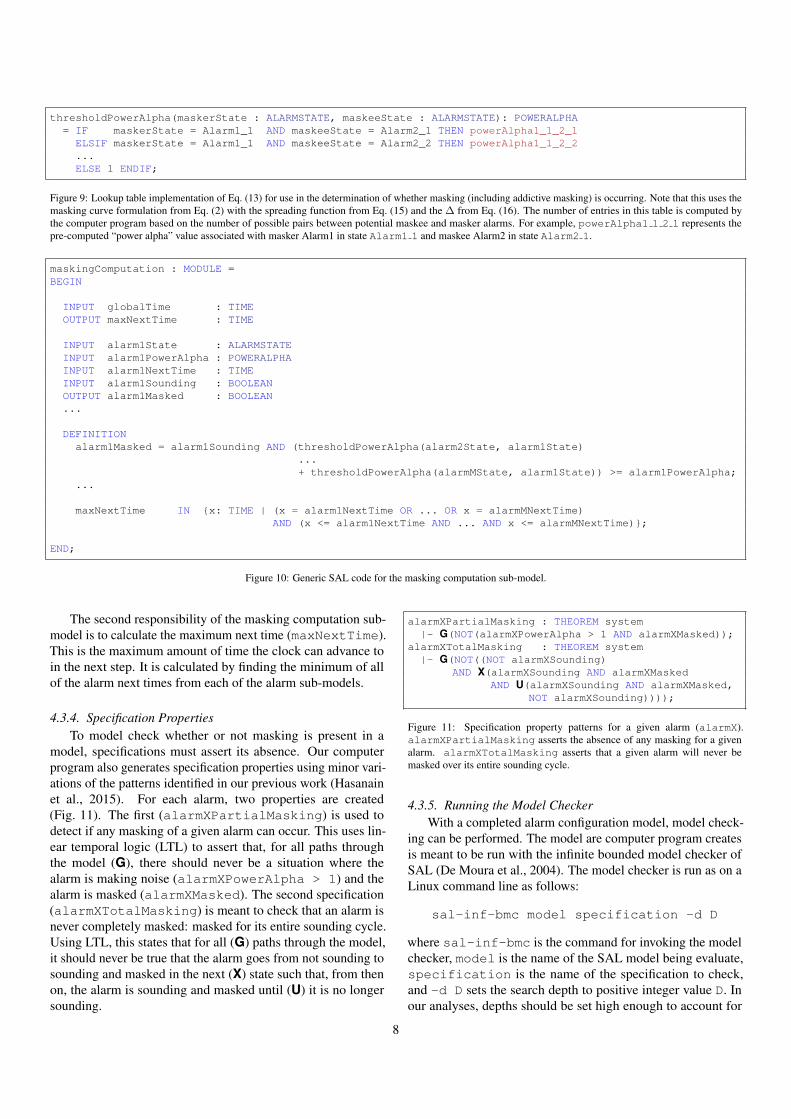
thresholdPowerAlpha(maskerState : ALARMSTATE, maskeeState : ALARMSTATE): POWERALPHA= IF maskerState = Alarm1_1 AND maskeeState = Alarm2_1 THEN powerAlpha1_1_2_1
ELSIF maskerState = Alarm1_1 AND maskeeState = Alarm2_2 THEN powerAlpha1_1_2_2...ELSE 1 ENDIF;
Figure 9: Lookup table implementation of Eq. (13) for use in the determination of whether masking (including addictive masking) is occurring. Note that this uses themasking curve formulation from Eq. (2) with the spreading function from Eq. (15) and the ∆ from Eq. (16). The number of entries in this table is computed bythe computer program based on the number of possible pairs between potential maskee and masker alarms. For example, powerAlpha1 1 2 1 represents thepre-computed “power alpha” value associated with masker Alarm1 in state Alarm1 1 and maskee Alarm2 in state Alarm2 1.
maskingComputation : MODULE =BEGIN
INPUT globalTime : TIMEOUTPUT maxNextTime : TIME
INPUT alarm1State : ALARMSTATEINPUT alarm1PowerAlpha : POWERALPHAINPUT alarm1NextTime : TIMEINPUT alarm1Sounding : BOOLEANOUTPUT alarm1Masked : BOOLEAN...
DEFINITIONalarm1Masked = alarm1Sounding AND (thresholdPowerAlpha(alarm2State, alarm1State)
...+ thresholdPowerAlpha(alarmMState, alarm1State)) >= alarm1PowerAlpha;
...
maxNextTime IN {x: TIME | (x = alarm1NextTime OR ... OR x = alarmMNextTime)AND (x <= alarm1NextTime AND ... AND x <= alarmMNextTime)};
END;
Figure 10: Generic SAL code for the masking computation sub-model.
The second responsibility of the masking computation sub-model is to calculate the maximum next time (maxNextTime).This is the maximum amount of time the clock can advance toin the next step. It is calculated by finding the minimum of allof the alarm next times from each of the alarm sub-models.
4.3.4. Specification PropertiesTo model check whether or not masking is present in a
model, specifications must assert its absence. Our computerprogram also generates specification properties using minor vari-ations of the patterns identified in our previous work (Hasanainet al., 2015). For each alarm, two properties are created(Fig. 11). The first (alarmXPartialMasking) is used todetect if any masking of a given alarm can occur. This uses lin-ear temporal logic (LTL) to assert that, for all paths throughthe model (G), there should never be a situation where thealarm is making noise (alarmXPowerAlpha > 1) and thealarm is masked (alarmXMasked). The second specification(alarmXTotalMasking) is meant to check that an alarm isnever completely masked: masked for its entire sounding cycle.Using LTL, this states that for all (G) paths through the model,it should never be true that the alarm goes from not sounding tosounding and masked in the next (X) state such that, from thenon, the alarm is sounding and masked until (U) it is no longersounding.
alarmXPartialMasking : THEOREM system|- G(NOT(alarmXPowerAlpha > 1 AND alarmXMasked));
alarmXTotalMasking : THEOREM system|- G(NOT((NOT alarmXSounding)
AND X(alarmXSounding AND alarmXMaskedAND U(alarmXSounding AND alarmXMasked,
NOT alarmXSounding))));
Figure 11: Specification property patterns for a given alarm (alarmX).alarmXPartialMasking asserts the absence of any masking for a givenalarm. alarmXTotalMasking asserts that a given alarm will never bemasked over its entire sounding cycle.
4.3.5. Running the Model CheckerWith a completed alarm configuration model, model check-
ing can be performed. The model are computer program createsis meant to be run with the infinite bounded model checker ofSAL (De Moura et al., 2004). The model checker is run as on aLinux command line as follows:
sal-inf-bmc model specification -d D
where sal-inf-bmc is the command for invoking the modelchecker, model is the name of the SAL model being evaluate,specification is the name of the specification to check,and -d D sets the search depth to positive integer value D. Inour analyses, depths should be set high enough to account for
8
all of the possible transition states an analyst wants to consider.To ensure that all of the possible alarm interactions containedin a configuration are accounted for, this should be set to thesum of the total number of alarm states of each alarm. Sucha value ensures that every alarm can fully transition through aentire cycle independently of all the other alarms. However, it isimportant to note that smaller search depth can be used. Becauseincreasing the search depth will likely increase verification time,an analyst may wish to save time by using smaller depth. Anycounterexamples returned from shorter searchers will still con-stitute valid results. However, a failure to find a counterexampleat a depth below the suggested one may not genuinely indicatethe absence of masking.
4.4. Counterexample Visualization
In the original method, a model checker produced coun-terexample needed to be manually interpreted by analysts. Wefound that a variation of a vertical bar graph could be used toeffectively show how alarms in a counterexample sounded inrelation to each other and indicate when masking was occurring(Hasanain et al., 2015). Thus, in our new version of the method,we have added the ability to automatically create these graphsfrom a counterexample input.
Created graphs list the names each alarm in a configurationalong the vertical axis. Time is shown on the horizontal axis.Bars are plotted in the chart to show when the tones of eachalarm are sounding. Smaller black lines are overlaid on the barsto show when a particular tone (or part of a tone) is masked.Examples of these plots can be seen later in Figs. 12 to 14.
5. Case Studies
Below we present three different case studies that illustratethe power of the presented method. First, we evaluate the casestudy originally presented by Hasanain et al. (2015) to show boththat the new formulation of the method can detect the maskingof the original, but also that it does so more quickly. Second,we apply the method to a simple case study that demonstratesthe ability of the method to detect additive masking. Third,we apply the method to a realistic application based on theGE CARESCAPETMMonitor B850 (GE Healthcare, 2010), atelemetry monitoring system.
In all of the reported case studies, formal verifications wereperformed using SAL’s infinite bounded model checker on aLinux workstation with a 3.3 GHz Intel Xeon processor and 64GB of RAM.
5.1. Case Study 1: The Original Application
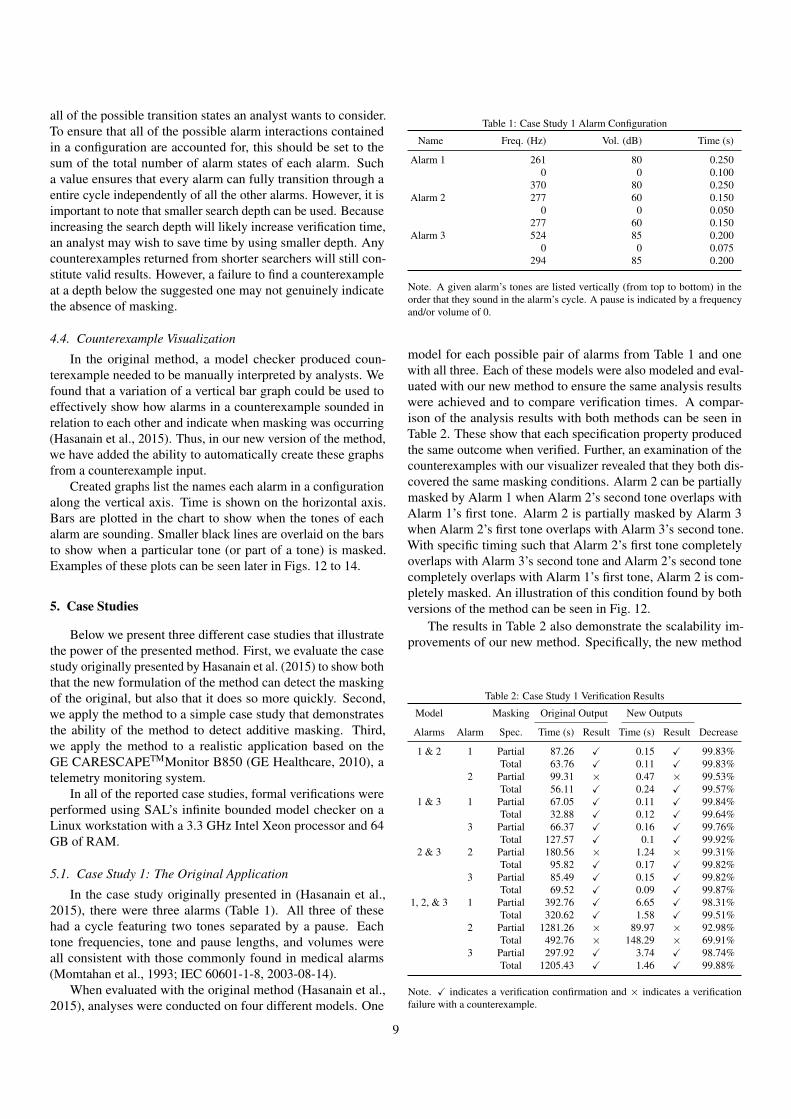
In the case study originally presented in (Hasanain et al.,2015), there were three alarms (Table 1). All three of thesehad a cycle featuring two tones separated by a pause. Eachtone frequencies, tone and pause lengths, and volumes wereall consistent with those commonly found in medical alarms(Momtahan et al., 1993; IEC 60601-1-8, 2003-08-14).
When evaluated with the original method (Hasanain et al.,2015), analyses were conducted on four different models. One
Table 1: Case Study 1 Alarm Configuration
Name Freq. (Hz) Vol. (dB) Time (s)
Alarm 1 261 80 0.2500 0 0.100
370 80 0.250Alarm 2 277 60 0.150
0 0 0.050277 60 0.150
Alarm 3 524 85 0.2000 0 0.075
294 85 0.200
Note. A given alarm’s tones are listed vertically (from top to bottom) in theorder that they sound in the alarm’s cycle. A pause is indicated by a frequencyand/or volume of 0.
model for each possible pair of alarms from Table 1 and onewith all three. Each of these models were also modeled and eval-uated with our new method to ensure the same analysis resultswere achieved and to compare verification times. A compar-ison of the analysis results with both methods can be seen inTable 2. These show that each specification property producedthe same outcome when verified. Further, an examination of thecounterexamples with our visualizer revealed that they both dis-covered the same masking conditions. Alarm 2 can be partiallymasked by Alarm 1 when Alarm 2’s second tone overlaps withAlarm 1’s first tone. Alarm 2 is partially masked by Alarm 3when Alarm 2’s first tone overlaps with Alarm 3’s second tone.With specific timing such that Alarm 2’s first tone completelyoverlaps with Alarm 3’s second tone and Alarm 2’s second tonecompletely overlaps with Alarm 1’s first tone, Alarm 2 is com-pletely masked. An illustration of this condition found by bothversions of the method can be seen in Fig. 12.
The results in Table 2 also demonstrate the scalability im-provements of our new method. Specifically, the new method
Table 2: Case Study 1 Verification Results
Model Masking Original Output New Outputs
Alarms Alarm Spec. Time (s) Result Time (s) Result Decrease
1 & 2 1 Partial 87.26 X 0.15 X 99.83%Total 63.76 X 0.11 X 99.83%
2 Partial 99.31 × 0.47 × 99.53%Total 56.11 X 0.24 X 99.57%
1 & 3 1 Partial 67.05 X 0.11 X 99.84%Total 32.88 X 0.12 X 99.64%
3 Partial 66.37 X 0.16 X 99.76%Total 127.57 X 0.1 X 99.92%
2 & 3 2 Partial 180.56 × 1.24 × 99.31%Total 95.82 X 0.17 X 99.82%
3 Partial 85.49 X 0.15 X 99.82%Total 69.52 X 0.09 X 99.87%
1, 2, & 3 1 Partial 392.76 X 6.65 X 98.31%Total 320.62 X 1.58 X 99.51%
2 Partial 1281.26 × 89.97 × 92.98%Total 492.76 × 148.29 × 69.91%
3 Partial 297.92 X 3.74 X 98.74%Total 1205.43 X 1.46 X 99.88%
Note. X indicates a verification confirmation and × indicates a verificationfailure with a counterexample.
9
Masking
Alarm 1
Alarm 2
Alarm 3
Time (s): 0 0.2 0.4 0.6 0.8 1
Tone 1
Tone 2
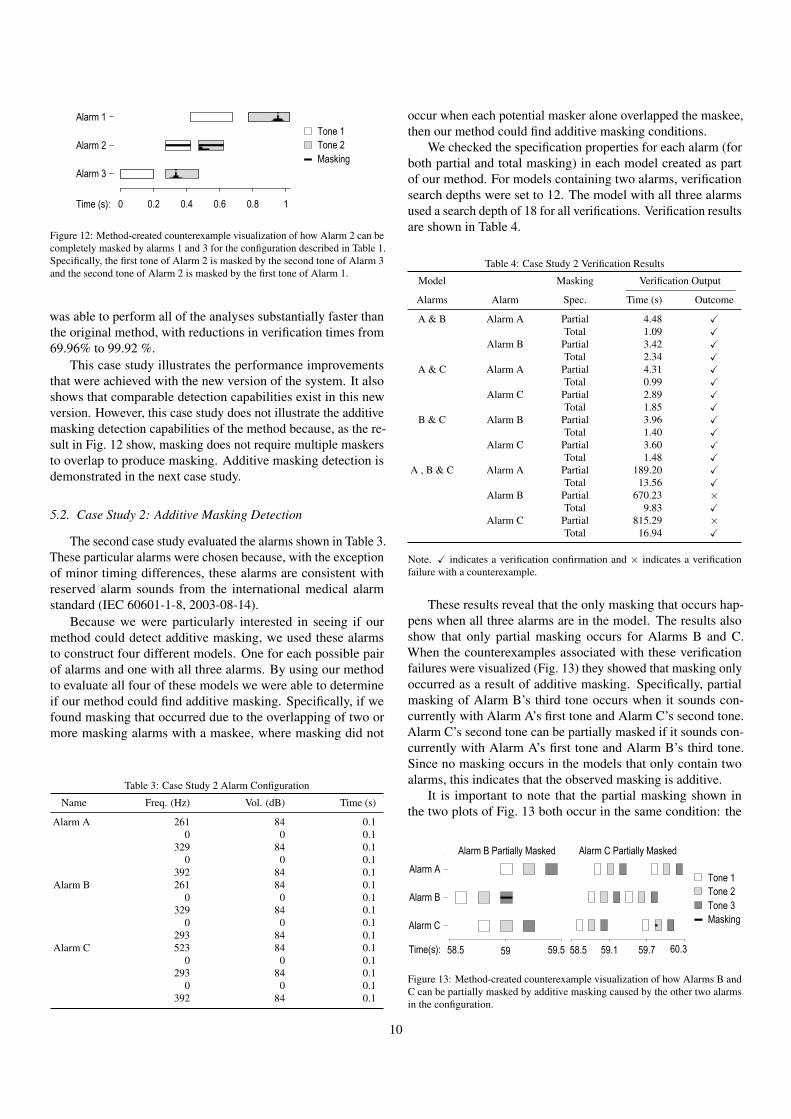
Figure 12: Method-created counterexample visualization of how Alarm 2 can becompletely masked by alarms 1 and 3 for the configuration described in Table 1.Specifically, the first tone of Alarm 2 is masked by the second tone of Alarm 3and the second tone of Alarm 2 is masked by the first tone of Alarm 1.
was able to perform all of the analyses substantially faster thanthe original method, with reductions in verification times from69.96% to 99.92 %.
This case study illustrates the performance improvementsthat were achieved with the new version of the system. It alsoshows that comparable detection capabilities exist in this newversion. However, this case study does not illustrate the additivemasking detection capabilities of the method because, as the re-sult in Fig. 12 show, masking does not require multiple maskersto overlap to produce masking. Additive masking detection isdemonstrated in the next case study.
5.2. Case Study 2: Additive Masking Detection
The second case study evaluated the alarms shown in Table 3.These particular alarms were chosen because, with the exceptionof minor timing differences, these alarms are consistent withreserved alarm sounds from the international medical alarmstandard (IEC 60601-1-8, 2003-08-14).
Because we were particularly interested in seeing if ourmethod could detect additive masking, we used these alarmsto construct four different models. One for each possible pairof alarms and one with all three alarms. By using our methodto evaluate all four of these models we were able to determineif our method could find additive masking. Specifically, if wefound masking that occurred due to the overlapping of two ormore masking alarms with a maskee, where masking did not
Table 3: Case Study 2 Alarm Configuration
Name Freq. (Hz) Vol. (dB) Time (s)
Alarm A 261 84 0.10 0 0.1
329 84 0.10 0 0.1
392 84 0.1Alarm B 261 84 0.1
0 0 0.1329 84 0.1
0 0 0.1293 84 0.1
Alarm C 523 84 0.10 0 0.1
293 84 0.10 0 0.1
392 84 0.1
occur when each potential masker alone overlapped the maskee,then our method could find additive masking conditions.
We checked the specification properties for each alarm (forboth partial and total masking) in each model created as partof our method. For models containing two alarms, verificationsearch depths were set to 12. The model with all three alarmsused a search depth of 18 for all verifications. Verification resultsare shown in Table 4.
Table 4: Case Study 2 Verification Results
Model Masking Verification Output
Alarms Alarm Spec. Time (s) Outcome
A & B Alarm A Partial 4.48 XTotal 1.09 X
Alarm B Partial 3.42 XTotal 2.34 X
A & C Alarm A Partial 4.31 XTotal 0.99 X
Alarm C Partial 2.89 XTotal 1.85 X
B & C Alarm B Partial 3.96 XTotal 1.40 X
Alarm C Partial 3.60 XTotal 1.48 X
A , B & C Alarm A Partial 189.20 XTotal 13.56 X
Alarm B Partial 670.23 ×Total 9.83 X
Alarm C Partial 815.29 ×Total 16.94 X
Note. X indicates a verification confirmation and × indicates a verificationfailure with a counterexample.
These results reveal that the only masking that occurs hap-pens when all three alarms are in the model. The results alsoshow that only partial masking occurs for Alarms B and C.When the counterexamples associated with these verificationfailures were visualized (Fig. 13) they showed that masking onlyoccurred as a result of additive masking. Specifically, partialmasking of Alarm B’s third tone occurs when it sounds con-currently with Alarm A’s first tone and Alarm C’s second tone.Alarm C’s second tone can be partially masked if it sounds con-currently with Alarm A’s first tone and Alarm B’s third tone.Since no masking occurs in the models that only contain twoalarms, this indicates that the observed masking is additive.
It is important to note that the partial masking shown inthe two plots of Fig. 13 both occur in the same condition: the
Alarm A
Alarm B
Alarm C
Tone 1
Tone 2
Tone 3
Masking
Time(s):
Alarm B Partially Masked Alarm C Partially Masked
59 59.5 58.5 59.1 59.7 60.358.5
Figure 13: Method-created counterexample visualization of how Alarms B andC can be partially masked by additive masking caused by the other two alarmsin the configuration.
10
concurrent sounding of Alarm A’s first tone, Alarm B’s third tone,and Alarm C’s second tone. This would mean that, when actuallyheard by a human, that either of the potentially masked tones(Alarm B’s third or Alarm C’s second) would be unhearable. It isa potential limitation of the method that it cannot identify whichof these would actually be masked. Despite this limitation, thepresented analyses do demonstrate the ability of the method todetect additive masking. However, even though the includedalarms are realistic, this case study is still artificial. The abilityof the method to detect masking in a more realistic context isexplored in the third case study.
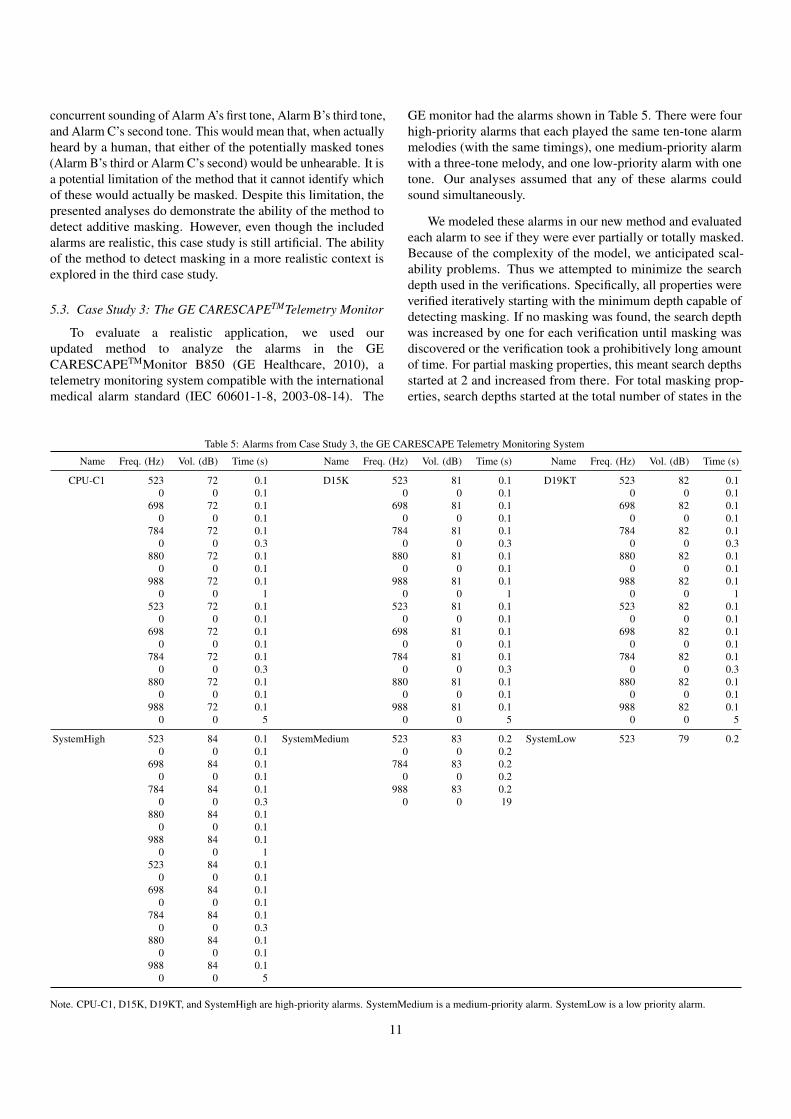
5.3. Case Study 3: The GE CARESCAPETMTelemetry Monitor
To evaluate a realistic application, we used ourupdated method to analyze the alarms in the GECARESCAPETMMonitor B850 (GE Healthcare, 2010), atelemetry monitoring system compatible with the internationalmedical alarm standard (IEC 60601-1-8, 2003-08-14). The
GE monitor had the alarms shown in Table 5. There were fourhigh-priority alarms that each played the same ten-tone alarmmelodies (with the same timings), one medium-priority alarmwith a three-tone melody, and one low-priority alarm with onetone. Our analyses assumed that any of these alarms couldsound simultaneously.
We modeled these alarms in our new method and evaluatedeach alarm to see if they were ever partially or totally masked.Because of the complexity of the model, we anticipated scal-ability problems. Thus we attempted to minimize the searchdepth used in the verifications. Specifically, all properties wereverified iteratively starting with the minimum depth capable ofdetecting masking. If no masking was found, the search depthwas increased by one for each verification until masking wasdiscovered or the verification took a prohibitively long amountof time. For partial masking properties, this meant search depthsstarted at 2 and increased from there. For total masking prop-erties, search depths started at the total number of states in the
Table 5: Alarms from Case Study 3, the GE CARESCAPE Telemetry Monitoring System
Name Freq. (Hz) Vol. (dB) Time (s) Name Freq. (Hz) Vol. (dB) Time (s) Name Freq. (Hz) Vol. (dB) Time (s)
CPU-C1 523 72 0.1 D15K 523 81 0.1 D19KT 523 82 0.10 0 0.1 0 0 0.1 0 0 0.1
698 72 0.1 698 81 0.1 698 82 0.10 0 0.1 0 0 0.1 0 0 0.1
784 72 0.1 784 81 0.1 784 82 0.10 0 0.3 0 0 0.3 0 0 0.3
880 72 0.1 880 81 0.1 880 82 0.10 0 0.1 0 0 0.1 0 0 0.1
988 72 0.1 988 81 0.1 988 82 0.10 0 1 0 0 1 0 0 1
523 72 0.1 523 81 0.1 523 82 0.10 0 0.1 0 0 0.1 0 0 0.1
698 72 0.1 698 81 0.1 698 82 0.10 0 0.1 0 0 0.1 0 0 0.1
784 72 0.1 784 81 0.1 784 82 0.10 0 0.3 0 0 0.3 0 0 0.3
880 72 0.1 880 81 0.1 880 82 0.10 0 0.1 0 0 0.1 0 0 0.1
988 72 0.1 988 81 0.1 988 82 0.10 0 5 0 0 5 0 0 5
SystemHigh 523 84 0.1 SystemMedium 523 83 0.2 SystemLow 523 79 0.20 0 0.1 0 0 0.2
698 84 0.1 784 83 0.20 0 0.1 0 0 0.2
784 84 0.1 988 83 0.20 0 0.3 0 0 19
880 84 0.10 0 0.1
988 84 0.10 0 1
523 84 0.10 0 0.1
698 84 0.10 0 0.1
784 84 0.10 0 0.3
880 84 0.10 0 0.1
988 84 0.10 0 5
Note. CPU-C1, D15K, D19KT, and SystemHigh are high-priority alarms. SystemMedium is a medium-priority alarm. SystemLow is a low priority alarm.
11
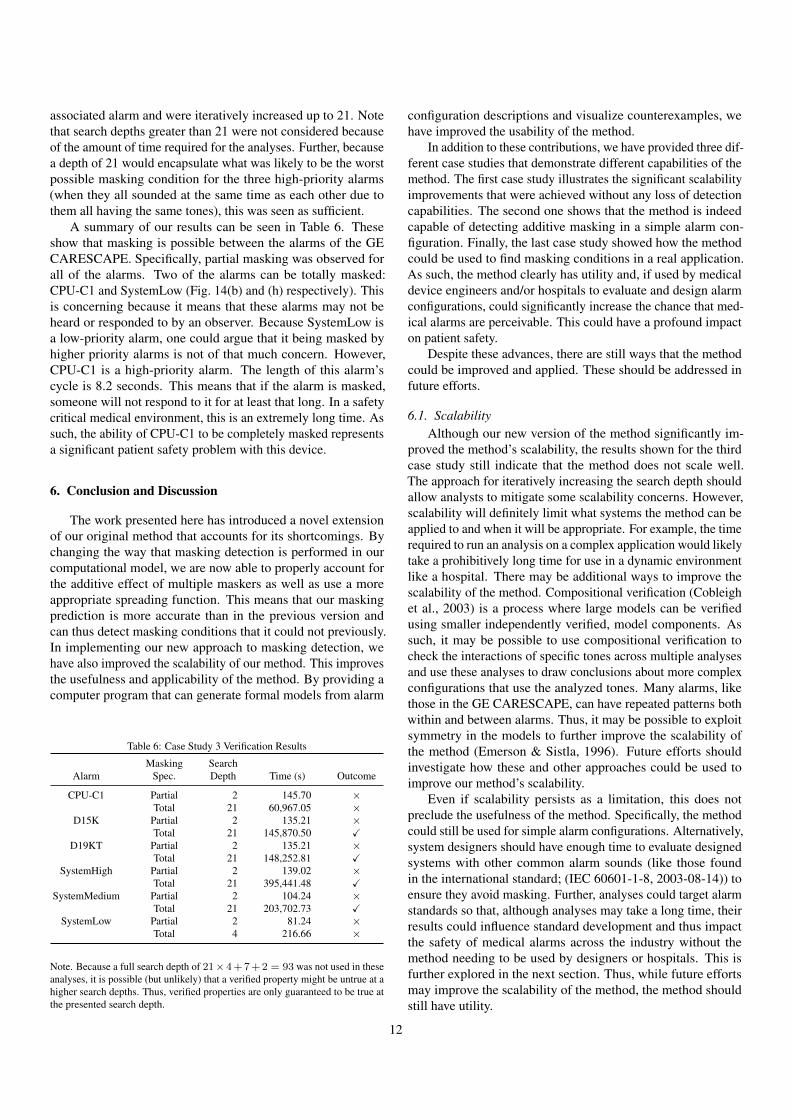
associated alarm and were iteratively increased up to 21. Notethat search depths greater than 21 were not considered becauseof the amount of time required for the analyses. Further, becausea depth of 21 would encapsulate what was likely to be the worstpossible masking condition for the three high-priority alarms(when they all sounded at the same time as each other due tothem all having the same tones), this was seen as sufficient.
A summary of our results can be seen in Table 6. Theseshow that masking is possible between the alarms of the GECARESCAPE. Specifically, partial masking was observed forall of the alarms. Two of the alarms can be totally masked:CPU-C1 and SystemLow (Fig. 14(b) and (h) respectively). Thisis concerning because it means that these alarms may not beheard or responded to by an observer. Because SystemLow isa low-priority alarm, one could argue that it being masked byhigher priority alarms is not of that much concern. However,CPU-C1 is a high-priority alarm. The length of this alarm’scycle is 8.2 seconds. This means that if the alarm is masked,someone will not respond to it for at least that long. In a safetycritical medical environment, this is an extremely long time. Assuch, the ability of CPU-C1 to be completely masked representsa significant patient safety problem with this device.
6. Conclusion and Discussion
The work presented here has introduced a novel extensionof our original method that accounts for its shortcomings. Bychanging the way that masking detection is performed in ourcomputational model, we are now able to properly account forthe additive effect of multiple maskers as well as use a moreappropriate spreading function. This means that our maskingprediction is more accurate than in the previous version andcan thus detect masking conditions that it could not previously.In implementing our new approach to masking detection, wehave also improved the scalability of our method. This improvesthe usefulness and applicability of the method. By providing acomputer program that can generate formal models from alarm
Table 6: Case Study 3 Verification Results
Masking SearchAlarm Spec. Depth Time (s) Outcome
CPU-C1 Partial 2 145.70 ×Total 21 60,967.05 ×
D15K Partial 2 135.21 ×Total 21 145,870.50 X
D19KT Partial 2 135.21 ×Total 21 148,252.81 X
SystemHigh Partial 2 139.02 ×Total 21 395,441.48 X
SystemMedium Partial 2 104.24 ×Total 21 203,702.73 X
SystemLow Partial 2 81.24 ×Total 4 216.66 ×
Note. Because a full search depth of 21× 4 + 7 + 2 = 93 was not used in theseanalyses, it is possible (but unlikely) that a verified property might be untrue at ahigher search depths. Thus, verified properties are only guaranteed to be true atthe presented search depth.
configuration descriptions and visualize counterexamples, wehave improved the usability of the method.
In addition to these contributions, we have provided three dif-ferent case studies that demonstrate different capabilities of themethod. The first case study illustrates the significant scalabilityimprovements that were achieved without any loss of detectioncapabilities. The second one shows that the method is indeedcapable of detecting additive masking in a simple alarm con-figuration. Finally, the last case study showed how the methodcould be used to find masking conditions in a real application.As such, the method clearly has utility and, if used by medicaldevice engineers and/or hospitals to evaluate and design alarmconfigurations, could significantly increase the chance that med-ical alarms are perceivable. This could have a profound impacton patient safety.
Despite these advances, there are still ways that the methodcould be improved and applied. These should be addressed infuture efforts.
6.1. ScalabilityAlthough our new version of the method significantly im-
proved the method’s scalability, the results shown for the thirdcase study still indicate that the method does not scale well.The approach for iteratively increasing the search depth shouldallow analysts to mitigate some scalability concerns. However,scalability will definitely limit what systems the method can beapplied to and when it will be appropriate. For example, the timerequired to run an analysis on a complex application would likelytake a prohibitively long time for use in a dynamic environmentlike a hospital. There may be additional ways to improve thescalability of the method. Compositional verification (Cobleighet al., 2003) is a process where large models can be verifiedusing smaller independently verified, model components. Assuch, it may be possible to use compositional verification tocheck the interactions of specific tones across multiple analysesand use these analyses to draw conclusions about more complexconfigurations that use the analyzed tones. Many alarms, likethose in the GE CARESCAPE, can have repeated patterns bothwithin and between alarms. Thus, it may be possible to exploitsymmetry in the models to further improve the scalability ofthe method (Emerson & Sistla, 1996). Future efforts shouldinvestigate how these and other approaches could be used toimprove our method’s scalability.
Even if scalability persists as a limitation, this does notpreclude the usefulness of the method. Specifically, the methodcould still be used for simple alarm configurations. Alternatively,system designers should have enough time to evaluate designedsystems with other common alarm sounds (like those foundin the international standard; (IEC 60601-1-8, 2003-08-14)) toensure they avoid masking. Further, analyses could target alarmstandards so that, although analyses may take a long time, theirresults could influence standard development and thus impactthe safety of medical alarms across the industry without themethod needing to be used by designers or hospitals. This isfurther explored in the next section. Thus, while future effortsmay improve the scalability of the method, the method shouldstill have utility.
12
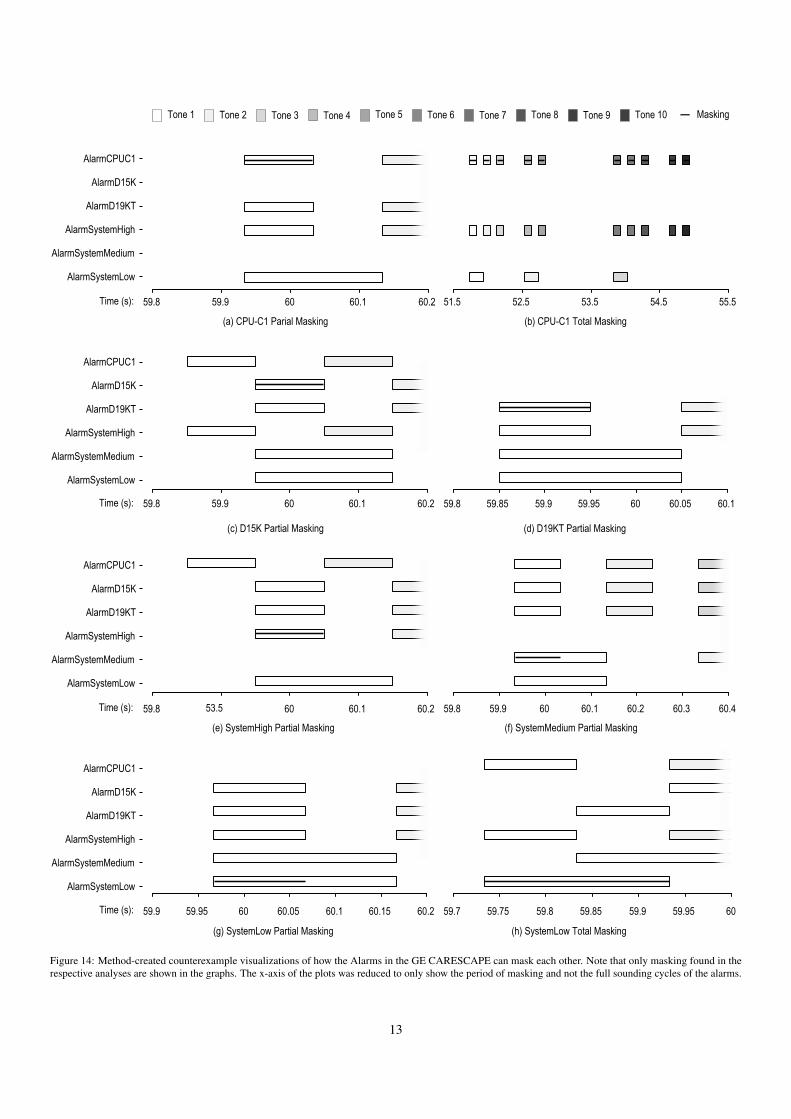
AlarmSystemLow
AlarmSystemMedium
AlarmSystemHigh
AlarmD19KT
AlarmD15K
AlarmCPUC1
AlarmSystemLow
AlarmSystemMedium
AlarmSystemHigh
AlarmD19KT
AlarmD15K
AlarmCPUC1
AlarmSystemLow
AlarmSystemMedium
AlarmSystemHigh
AlarmD19KT
AlarmD15K
AlarmCPUC1
Time (s):
Time (s):
Time (s):
AlarmSystemLow
AlarmSystemMedium
AlarmSystemHigh
AlarmD19KT
AlarmD15K
AlarmCPUC1
Time (s):
(a) CPU-C1 Parial Masking
(c) D15K Partial Masking
(e) SystemHigh Partial Masking
(g) SystemLow Partial Masking
53.559.8 60 60.1 60.2
59.9 59.95 60 60.05 60.1 60.15 60.2
59.8 59.9 60 60.1 60.2
59.8 59.9 60 60.1 60.2
(d) D19KT Partial Masking
(f) SystemMedium Partial Masking
(h) SystemLow Total Masking
59.8 59.9 60 60.1 60.2 60.3 60.4
59.7 59.75 59.8 59.85 59.9 59.95 60
59.8 59.85 59.9 59.95 60 60.05 60.1
(b) CPU-C1 Total Masking
51.5 52.5 53.5 54.5 55.5
Tone 1 Tone 2 Tone 3 Tone 4 Tone 5 Tone 6 Tone 7 Tone 8 Tone 9 Tone 10 Masking
Figure 14: Method-created counterexample visualizations of how the Alarms in the GE CARESCAPE can mask each other. Note that only masking found in therespective analyses are shown in the graphs. The x-axis of the plots was reduced to only show the period of masking and not the full sounding cycles of the alarms.
13
6.2. The International Medical Alarm Standard
The analyses presented under case studies 2 and 3 haveinteresting implications for future analyses. Specifically, the GECARESCAPE alarms (case study 3) are in conformance with theIEC 60601-1-8 international medical alarm standard (IEC 60601-1-8, 2003-08-14). The alarms in case study 2 are nearly identicalto reserved alarms sounds from IEC 60601-1-8 (there are onlyminor and likely inconsequential timing differences). Becausemasking was detected in both of these case studies, this wouldindicate that there are masking problems for alarms designed toadhere to the standard. This is potentially very dangerous. Themethod presented here offers the capabilities to systematicallyevaluate the alarm requirements and reserved sounds found inIEC 60601-1-8 and potentially explore solutions to discoveredproblems. This should be a priority of future work.
6.3. More Complex Alarm Behavior and Sounds
The tonal alarms we evaluated are realistic in that they werebased on existing alarm systems and sounds from the IEC 60601-1-8 standard. However, there are other types of alarms beyondthe tonal sounds currently supported by the method.
Features of IEC 60601-1-8 are not currently supported bythe method. Specifically IEC 60601-1-8 alarms can have sub-frequencies, additional simultaneous frequencies that make eachtonal sound more complicated (IEC 60601-1-8, 2003-08-14).Given that the method currently supports additive masking, ac-counting for these sub-harmonics should be an easy extensionof the method. This should be the subject of future work. Itis important to note that while the inclusion of sub-frequenciescould make the problem of alarm identification worse by addingadditional masking potential. This could make it more likelythat the primary harmonics of the alarm would be masked andthus potentially make it more difficult to identify. Future workshould consider this in future investigations.
Additionally, there are a number of different spreading func-tions for representing the masking properties of different types(tonal vs noisy) of sounds (Bosi & Goldberg, 2003). Thus futureextensions of the method should be able to readily account fordifferent types of sounds.
Finally, the current formulation of our method works withdiscrete transitions in alarm state. However, alarm sounds canhave many dynamic elements related to the frequencies and vol-umes of different components of a sound. In fact, IEC 60601-1-8allows for and expert design recommendations (Patterson, 1982;Patterson et al., 1990) encourage the use of dynamic changesand rhythms in alarms to facilitate identification. Accommodat-ing these dynamics naturalistically would require a significantchange in the way the method models alarms. However, heuris-tics or abstractions could be created to allow dynamics to bemodeled with discrete steps within a given model or betweenmodels. Future work should investigate how such abstractionscould be used with our method to allow these types of alarmfeatures to be accounted for. Even if this is not successful, auto-mated theorem proving techniques exists that can account for awider variety of input model behaviors. However, using theserequire much more skilled analyst interaction and significantly
more analysis time. Future efforts should investigate whetherautomated theorem proving is viable for this application.
6.4. Additional Masking DetectionOur method is capable of detecting simultaneous masking.
However, there is also a phenomenon called temporal mask-ing (Fastl & Zwicker, 2006). Temporal masking describes asituation where non-concurrent sounds, but ones that soundsin close temporal proximity, are masked. Such a phenomenoncould increase the instances of masking in a given configuration.Psychoacoustics exist for accounting for these factors, howeverthey are not readily adaptable to formal modeling. Thus, futurework could investigate how to include these in our method usingeither extended formal modeling techniques or through clever ex-ploitation of other analysis approaches with formal verification.Further, background and transient noises in health care environ-ments can mask alarms or exacerbate other masking conditions(Block, 1992). Laroche et al. (1991) and Zheng et al. (2003)have developed a tool capable of evaluate the perceivability ofalarms and alerts in noisy environment. Future work shouldexplore how such detection capabilities could be included in ourmethod.
6.5. Deeper Analysis SupportAs illustrated in the result for case study 2, our method can
detect masking conditions where it is unclear which of two ormore alarms would actually be masked. Future work shouldinvestigate how to disambiguate such analysis results. Addition-ally, it is the nature of the model checking analyses that theyonly ever find one instance of a problem (a specification viola-tion). This means that there could be more masking conditionsin any given configuration than those initial found by the method.Ideally, our method would be able to find all of the conditions ina configuration that produce masking. Such capabilities shouldbe investigated in the future. Finally, while our method can findmasking problems, it is not clear how the method should be usedto find solutions to those problems. Future work should focuson extending the method to support the exploration of designsolutions that will avoid masking.
6.6. Experimental ValidationThe psychoacoustics used in our method have been well val-
idated over the years and have served as the basis for the MPEGfamily of lossy audio codecs (Bosi & Goldberg, 2003). Thus,we expect our method to give accurate masking predictions.However, experiments with actual human subjects in realisticlistening environments would allow us to validate our method’sfindings. This should be the subject of future work.
6.7. Other Application DomainsThe work presented here and in previous analyses (Hasanain
et al., 2014, 2015) have focused on medical alarms. However,the perceivability of alarms can play a critical role in the safetyof aviation (Bliss, 2003), automobile (Bliss & Acton, 2003),and industrial systems (Rothenberg, 2009). Thus, future workshould investigate how our method could be used in these andother safety critical domains.
14
6.8. Other Alarm Problems
There are many problems facing medical alarms beyondsimultaneous masking (Edworthy, 2013). Because our workconstitutes the first attempt to address alarm problems formally,there may be many future opportunities for extending our workto explore other alarm issues. In particular, there is good evi-dence suggesting that human mental workload can contribute toalarm mistrust, fatigue, and inattentional deafness (Dehais et al.,2014; Bliss & Dunn, 2000; Edworthy, 2013; Cvach, 2012; Wayet al., 2014). Formal methods could help researchers discoverwhen these conditions could occur. Such an analysis will needto integrate formal approaches for modeling alarm perception(Hasanain et al., 2014, 2015), workload (Moore et al., 2014;Houser et al., 2015), and task behavior (Bolton et al., 2011,2012; Bolton & Bass, 2013) to be successful. This should beexplored in future work.
References
Alur, R., & Dill, D. L. (1994). A theory of timed automata. Theoretical computerscience, 126, 183–235.
Ambikairajah, E., Davis, A., & Wong, W. (1997). Auditory masking and MPEG-1 audio compression. Electronics & Communication Engineering Journal, 9,165–175.
Baumgarte, F., Ferekidis, C., & Fuchs, H. (1995). A nonlinear psychoacousticmodel applied to ISO/MPEG layer 3 coder. In Proceedings of the AudioEngineering Society Convention. New York: Audio Engineering Society.
Bliss, J. P. (2003). Investigation of alarm-related accidents and incidents inaviation. The International Journal of Aviation Psychology, 13, 249–268.
Bliss, J. P., & Acton, S. A. (2003). Alarm mistrust in automobiles: How collisionalarm reliability affects driving. Applied Ergonomics, 34, 499–509.
Bliss, J. P., & Dunn, M. C. (2000). Behavioural implications of alarm mistrustas a function of task workload. Ergonomics, 43, 1283–1300.
Block, F. E. (1992). Evaluation of users’ abilities to recognize musical alarmtones. Journal of Clinical Monitoring and Computing, 8, 285–290.
Bolton, M. L., & Bass, E. J. (2013). Generating erroneous human behavior fromstrategic knowledge in task models and evaluating its impact on system safetywith model checking. IEEE Transactions on Systems, Man and Cybernetics:Systems, 43, 1314–1327.
Bolton, M. L., Bass, E. J., & Siminiceanu, R. I. (2012). Generating phenotypicalerroneous human behavior to evaluate human-automation interaction usingmodel checking. International Journal of Human-Computer Studies, 70,888–906.
Bolton, M. L., Bass, E. J., & Siminiceanu, R. I. (2013). Using formal verificationto evaluate human-automation interaction in safety critical systems, a review.IEEE Transactions on Systems, Man and Cybernetics: Systems, 43, 488–503.
Bolton, M. L., Hasanain, B., Boyde, A. D., & Edworthy, J. (2016). Using modelchecking to detect masking in iec 60601-1-8-compliant alarm configurations.In Proceedings of the 2015 International Annual Meeting of the HumanFactors and Ergonomics Society (p. 5 Pages). Santa Monica: HFES. In Press.
Bolton, M. L., Siminiceanu, R. I., & Bass, E. J. (2011). A systematic approachto model checking human-automation interaction using task-analytic models.IEEE Transactions on Systems, Man, and Cybernetics, Part A, 41, 961–976.
Bosi, M., & Goldberg, R. E. (2003). Introduction to Digital Audio Coding andStandards. New York: Springer.
Boyd, A. D. (2010). Centralized Telemetry Monitoring Center Human FactorsReport. Technical Report University of Illinois at Chicago.
Brandenburg, K., & Bosi, M. (1997). Overview of MPEG audio: Currentand future standards for low bit-rate audio coding. Journal of the AudioEngineering Society, 45, 4–21.
Brandenburg, K., & Stoll, G. (1994). ISO/MPEG-1 audio: A generic standardfor coding of high-quality digital audio. Journal of the Audio EngineeringSociety, 42, 780–792.
Clarke, E. M., Grumberg, O., & Peled, D. A. (1999). Model checking. Cam-bridge: MIT Press.
Cobleigh, J., Giannakopoulou, D., & Pasareanu, C. (2003). Learning assump-tions for compositional verification. Tools and Algorithms for the Construc-tion and Analysis of Systems, (pp. 331–346).
Cvach, M. (2012). Monitor alarm fatigue: An integrative review. BiomedicalInstrumentation & Technology, 46, 268–277.
De Moura, L., Owre, S., Rueß, H., Rushby, J., Shankar, N., Sorea, M., & Tiwari,A. (2004). SAL 2. In Proceedings of the 16th International Conference onComputer Aided Verification (pp. 496–500). Springer.
de Moura, L., Owre, S., & Shankar, N. (2003). The SAL language manual.Technical Report CSL-01-01 Computer Science Laboratory, SRI InternationalMenlo Park.
Dehais, F., Causse, M., Vachon, F., Regis, N., Menant, E., & Tremblay, S.(2014). Failure to detect critical auditory alerts in the cockpit evidence forinattentional deafness. Human Factors, 56, 631–644.
Dutertre, B., & Sorea, M. (2004). Timed systems in SAL. Technical ReportNASA/CR-2002-211858 SRI International.
E. Zwicker and R. Feldtkeller (1967). Das Ohr als Nachrichtenempfnger.Stuttgart: Hirzel Verlag.
ECRI Institute (2014). Top 10 health technology hazards for 2015. HealthDevices, November. URL: http://www.ecri.org/2015hazards.
ECRI Institute, & ISMP (2009). Connecting remote cardiac monitoringissues with care areas. Pennsylvania Patient Safety Authority, 6, 79–83.URL: http://patientsafetyauthority.org/ADVISORIES/AdvisoryLibrary/2009/Sep6(3)/Pages/79.aspx.
Edworthy, J. (2013). Medical audible alarms: A review. Journal of the AmericanMedical Informatics Association, 20, 584–589.
Edworthy, J., & Hellier, E. (2005). Fewer but better auditory alarms will improvepatient safety. Quality and Safety in Health Care, 14, 212–215.
Edworthy, J., & Hellier, E. (2006). Alarms and human behaviour: Implicationsfor medical alarms. British Journal of Anaesthesia, 97, 12–17.
Edworthy, J., & Meredith, C. S. (1994). Cognitive psychology and the design ofalarm sounds. Medical Engineering & Physics, 16, 445–449.
Emerson, E. A. (1990). Temporal and modal logic. In J. van Leeuwen, A. R.Meyer, M. Nivat, M. Paterson, & D. Perrin (Eds.), Handbook of TheoreticalComputer Science chapter 16. (pp. 995–1072). Cambridge: MIT Press.
Emerson, E. A., & Sistla, A. P. (1996). Symmetry and model checking. Formalmethods in system design, 9, 105–131.
Fastl, H., & Zwicker, E. (2006). Psychoacoustics: Facts and models volume 22.Springer.
GE Healthcare (2010). CARESCAPETMMonitor B850 Technical SpecificationsSupplement. Technical Report 2040386-084D General Electric Company.
Green, D. M. (1967). Additivity of masking. The Journal of the AcousticalSociety of America, 41, 1517–1525.
Grumberg, O., & Veith, H. (2008). 25 Years of Model Checking: History,Achievements, Perspectives. Berlin: Springer.
Hasanain, B., Boyd, A., & Bolton, M. (2015). Using model checking to detectsimultaneous masking in medical alarms. IEEE Transactions on Human-Machine Systems, . doi:10.1109/THMS.2014.2379661.
Hasanain, B., Boyd, A., & Bolton, M. L. (2014). An approach to model checkingthe perceptual interactions of medical alarms. In Proceedings of the 2014International Annual Meeting of the Human Factors and Ergonomics Society(pp. 822–826). Santa Monica: HFES.
Henzinger, T. A. (1996). The theory of hybrid automata. In Proceedings of the11th Annual IEEE Symposium on Logic in Computer Science (pp. 278–292).Washington: IEEE Computer Society.
Houser, A., Ma, L. M., Feigh, K., & Bolton, M. L. (2015). A formal approachto modeling and analyzing human taskload in simulated air traffic scenarios.In Proceedings of the IEEE International Conference on Complex SystemsEngineering. Piscataway: IEEE. (6 pages). In Press.
Humes, L. E., & Jesteadt, W. (1989). Models of the additivity of masking. TheJournal of the Acoustical Society of America, 85, 1285–1294.
IEC 60601-1-8 (2003-08-14). Medical Electrical Equipment - Part 1-8. Geneva:International Electrotechnical Commission.
Jayant, N., Johnston, J., & Safranek, R. (1993). Signal compression based onmodels of human perception. Proceedings of the IEEE, 81, 1385–1422.
Konkani, A., Oakley, B., & Bauld, T. J. (2012). Reducing hospital noise: Areview of medical device alarm management. Biomedical Instrumentation &Technology, 46, 478–487.
Lacherez, P., Seah, E., & Sanderson, P. (2007). Overlapping melodic alarms arealmost indiscriminable. Human Factors, 49, 637–645.
Laroche, C., Quoc, H. T., Hetu, R., & McDuff, S. (1991). ‘Detectsound’: A
15
computerized model for predicting the detectability of warning signals innoisy workplaces. Applied Acoustics, 32, 193–214.
Lutfi, R. A. (1983). Additivity of simultaneous masking. The Journal of theAcoustical Society of America, 73, 262–267.
Meredith, C., & Edworthy, J. (1995). Are there too many alarms in the intensivecare unit? An overview of the problems. Journal of Advanced Nursing, 21,15–20.
Momtahan, K., Hetu, R., & Tansley, B. (1993). Audibility and identification ofauditory alarms in the operating room and intensive care unit. Ergonomics,36, 1159–1176.
Moore, J., Ivie, R., Gledhill, T., Mercer, E., & Goodrich, M. (2014). Mod-eling human workload in unmanned aerial systems. In 2014 AAAI SpringSymposium Series. Palo Alto: AAAI.
Patterson, R. D. (1982). Guidelines for Auditory Warning Systems on CivilAircraft. Civil Aviation Authority.
Patterson, R. D., Mayfield, T. F., Patterson, R. D., & Mayfield, T. F. (1990). Au-ditory warning sounds in the work environment. Philosophical Transactionsof the Royal Society of London. B, Biological Sciences, 327, 485–492.
Podelski, A., & Wagner, S. (2006). Model checking of hybrid systems: Fromreachability towards stability. In Hybrid Systems: Computation and Control(pp. 507–521). Springer.
Rothenberg, D. H. (2009). Alarm management for process control: a best-practice guide for design, implementation, and use of industrial alarm sys-tems. New York: Momentum Press.
Schroeder, M. R., Atal, B. S., & Hall, J. (1979). Optimizing digital speechcoders by exploiting masking properties of the human ear. The Journal of theAcoustical Society of America, 66, 1647–1652.
Stead, W. W., & Lin, H. S. (Eds.) (2009). Computational Technology for EffectiveHealth Care: Immediate Steps and Strategic Directions. Atlanta: NationalAcademies Press.
Terhardt, E. (1979). Calculating virtual pitch. Hearing Research, 1, 155–182.Thangavelu, S. D., Ifeachor, E., Edworthy, J., Yunus, J., & Chinna, K. (2014).
Challenges and recommendation of clinical alarm system in intensive careunits from user perspective. In 2014 IEEE Region 10 Symposium (pp. 366–369). Piscataway: IEEE.
The Joint Commission (2013a). Medical device alarm safety in hospitals. Sen-tinel Even Alert, 50.
The Joint Commission (2013b). Npsg.06.01.01: Improve the safety of clinicalalarm systems. Joint Commission Perspectives, 33.
Toor, O., Ryan, T., & Richard, M. (2008). Auditory masking potential of com-mon operating room sounds: A psychoacoustic analysis. In Anesthesiology(p. A1207). Park Ridge: American Society of Anesthesiologists volume 109.
Vockley, M. (2014). Clinical Alarm Management Compendium. Arlington:AAMI Foundation.
Way, R. B., Beer, S. A., & Wilson, S. J. (2014). Whats that noise? Bedsidemonitoring in the emergency department. International Emergency Nursing,22, 197–201.
Wing, J. M. (1990). A specifier’s introduction to formal methods. Computer,23, 8, 10–22, 24.
Zheng, Y., Giguere, C., Laroche, C., & Sabourin, C. (2003). Detectsound version2: A software tool for adjusting the level and spectrum of acoustic warningsignals. Canadian Acoustics, 31, 76–77.
16