Embed Size (px)
Citation preview

A Forensic Accountant’s Review of the 2018 Financial Report of the United States Government

CONTENTS
What You Should Know About the U.S. Government’s Financial Reporting ......................................................................1
Matching Financial Information with the Method of Accounting ................................................................2
Overview of Major Financial Results and ConditionFinancial Statements of the U.S. Government ............................3Budget of the U.S. Government ..................................................6
Our Observations on the U.S. Financial ReportWarning: Reported Results May Not Be Reliable........................8Taxpayers Deserve Internal Controls Just Like Investors ............8“Off-Balance Sheet” Risks and Liabilities .................................10Current Budget Deficits Understate Government “Losses” .......11Recent Periods’ Trend Analysis and Inflation Comparison .......12"An Unsustainable Fiscal Path" ................................................12
Introduction and Our Objective
We are pleased to present you with our report, A Forensic Accountant’s Review of the 2018 Financial Report of the United States Government.
The 2018 Financial Report of the United States Government (the “U.S. Financial Report” or “Financial Report”) is prepared by the United States Department of the Treasury (“Department of Treasury” or “Treasury”) and is audited by the United States Government Accountability Office (“GAO”). From a financial reporting perspective, these entities serve in roles very similar to the management of a business enterprise who bears responsibility for its company’s financial statement assertions, and its independent certified public accounting firm that performs audit services and renders an opinion on such financial statements.
Our objective in preparing this report is to provide useful insights on how to interpret the information contained in the U.S. Financial Report. Importantly, we will highlight our observations on the quality and completeness of the reporting by the Department of Treasury based on applying the financial reporting expectations, standards, and requirements for a publicly traded company. We will also consider certain matters that we believe warrant special attention for users of the Financial Report, notably the citizens of the United States, as they relate to the financial condition of the U.S. Government. If you wish to review the Financial Report itself, you may find a copy at https://www.gao.gov/products/GAO-19-294R.
As an independent consulting firm with financial and accounting expertise, we are committed to contributing thought leadership and relevant research regarding financial reporting matters that will assist our clients in today’s fast-paced and demanding market. This report is just one example of how we intend to fulfill this commitment.
We welcome your comments and feedback, especially any additional analyses you would find helpful.
Floyd Advisory LLC August 2019

What You Should KnowAbout the U.S. Government's Financial ReportingBased on our review of the U.S. Financial Report, we identified several issues that would raise significant concerns to the users of the financial statements of a public company:
• The GAO, as the auditor to the U.S. Government, considers the government’s current financial state to be an “unsustainable long-term fiscal path,”1 sounding similar to a “going concern” opinion for a public registrant;
• The fiscal year 2018 deficit of $779.0 billion reflects the cash basis of accounting, whereas under the accrual basis of accounting, what is consistent with GAAP, the deficit would exceed $1.1 trillion;2
• The U.S. Government’s national debt included on the Financial Report’s balance sheet is approximately $21.5 trillion.3 However, “off-balance sheet” liabilities such as Social Security, Medicare, and other social programs, increase the actual debt to over $72.1 trillion;4
• Of significance, the GAO identified significant material weaknesses in the internal controls over financial reporting for the U.S. Government;5 and
• As a result of the material weaknesses, the GAO issued a disclaimer of opinion, meaning the U.S. Financial Report “may not be reliable.”6
These topics and other observations are discussed more fully herein.
1 2018 U.S. Financial Report, at pg. 233 (emphasis added).2 2018 U.S. Financial Report, at pg. 1.3 Ibid.4 2018 U.S. Financial Report, at pgs. 62 and 135.5 2018 U.S. Financial Report, at pg. 228.6 Ibid (emphasis added).
Page 1
AUGUST 2019 | Floyd Advisory

Matching Financial Information with the Method of AccountingBefore reviewing any financial schedule or set of financial statements, the reader should understand the method of accounting applied in the preparation of the information to be reported, as such information may be presented using different methods.
Generally accepted accounting principles7 (“GAAP”) require the use of the accrual basis of accounting, which reports economic events and transactions in the period earned or incurred, regardless of when cash is paid or received. The other common method of accounting is known as the cash basis, which, conversely, records events and transactions upon cash disbursement or receipt. Variations of the accrual and cash methods are referred to as hybrid methods and may be defined as the modified cash basis or modified accrual basis. To evaluate the financial reports of the U.S. Government, understanding the method of accounting is especially important because the Treasury presents information using more than one method.
Specific to the U.S. Financial Report, budgetary-related information is presented on the cash basis of accounting, and therefore references to budget deficits or surpluses reflect net cash inflows and outflows in a period. In contrast, the information included the financial statements (e.g., balance sheet, statement of operations, etc.) is based on a modified accrual basis. This method includes 1) expenses generally presented on an accrual basis, 2) revenues from taxes, duties, fines and penalties presented on a cash basis, and 3) revenues for the delivery of products and services for fees presented on an accrual basis. Therefore, net operating costs or profits, as captured in the Financial Report, are reported using this modified accrual method and will generally be incompatible with deficit figures presented in budget discussions.
With this foundational knowledge of the U.S. Government accounting methods, we will provide an overview of the recently reported financial information.
7 The set of accounting standards that most U.S. businesses, non-for-profits, and state and local governments follow for financial reporting purposes.
Page 2
Floyd Advisory | AUGUST 2019

Overview of Major Financial Results and ConditionFinancial Statements of the U.S. Government
Below you will find information related to the U.S. Government’s revenues, net costs, and assets and liabilities for the fiscal year 2018, as summarized from the U.S. Financial Report. Before analyzing the results, it is important to note that not all U.S. Government entities are included in this consolidated Financial Report.
The Statements of Federal Financial Accounting Standards provide guidance related to the financial reporting of the Federal Government. SFFAS No. 47 was established in 2014 to provide guidance to the Federal Government in determining what organizations to report upon. The statement defines which types of entities should have financial reports and establishes guidelines of types of information that should be included.8
There are 159 entities that are included in the Financial Report.9 The entities are trifurcated into the following categories: 24 Chief Financial Officer Act Consolidation Entities, 16 Additional Significant Consolidation Entities, and 119 Additional Consolidation Entities. For purposes of this report, we have included the CFO Act Entities10 in the table on the right (and continued on the next page) and the Additional Significant Entities in the table on the right of page 5 (and continued on page 6). Please refer to the Financial Report for a listing of the remaining 119 entities and funds.
It is important to note that while SFFAS No. 47 governs the inclusion of certain entities for consolidated federal reporting, it also sets forth criteria for the omission of other entities. Some entities are excluded from the U.S. Financial Report because they qualify as Government Sponsored Entities (“GSEs”). Such entities include the Federal National Mortgage Association (“Fannie Mae”) and Federal Home Loan Mortgage Corporation (“Freddie Mac”).11 Others are excluded because their activities are not included in the federal budget (e.g., the Federal Reserve System). Additionally, any financial organization or commercial entity with which the Treasury holds either a direct, indirect, or beneficial equity investment is excluded (e.g., National Railroad Passenger Corporation – also known as Amtrak).
8 files.fasab.gov/pdffiles/handbook_sffas_47.pdf, at paragraph 2.9 2018 U.S. Financial Report, at pgs. 216-218.10 Such entities relate to the CFO Act of 1990 which mandated financial management reform. The act intended to establish a leadership structure, provide for long-term planning, require audited financial statements, and strengthen accountability report (www.gao.gov/special.pubs/af12194.pdf ).11 2018 U.S. Financial Report, at pgs. 160, 218-219.
Page 3
AUGUST 2019 | Floyd Advisory
CFO Act Entities
Department of Agriculture
Department of Commerce
Department of Defense
Department of Education
Department of Energy
Department of Health and Human Services
Department of Homeland Security
Department of Housing and Urban Development
Department of the Interior
Department of Justice
Department of Labor
Department of State
Department of Transportation
Department of the Treasury
(continued on pg. 4)

An introduction to the U.S. Government’s Fiscal Year (“FY”) 2018 and 201712 financial results is featured in the snapshot below:13
Breaking the results down, there are three main components to focus discussion around:
1. Revenues (“Total Tax and Other Revenues”)
Total government revenues reported in the U.S. Financial Report increased by a mere 0.3% ($9.7 billion) in FY 2018 as compared to FY 2017.14 This increase, offset entirely by the $10.1 billion increase in Net Cost in FY 2018 as compared to FY 2017, results in a “bottom line” Net Operating Cost which is largely unchanged since FY 2017.15 Refer to the graphic below for an illustration of the five-year revenue growth trend.16
12 Note, FY 2017 U.S. Government results were restated. The amounts contained herein are reflective of such restatements.13 2018 U.S. Financial Report, at pg. 1. Note the U.S. Government’s fiscal year begins October 1st and ends September 30th.14 2018 U.S. Financial Report, at pgs. 3 and 17.15 2018 U.S. Financial Report, at pg. 15.16 2018 U.S. Financial Report, at pgs. 3 and 17. Note, other revenues include Federal Reserve earnings, excise taxes, and customs duties.
(continued from pg. 3)
CFO Act Entities
Department of Veterans Affairs
Environmental Protection Agency
General Services Administration
National Aeronautics and Space Administration
National Science Foundation
Office of Personnel Management
Small Business Administration
Social Security Administration
U.S. Agency for International Development
U.S. Nuclear Regulatory Commission
Page 4
Floyd Advisory | AUGUST 2019

2. Expenses (“Net Cost”)
The Net Cost amounts in the U.S. Financial Report are defined as follows:17
“the net of: (1) gross costs, or the costs of goods produced and services rendered by the government, (2) the earned revenues generated by those goods and services during the fiscal year, and (3) gains or losses from changes in actuarial assumptions used to estimate certain liabilities.”
Net Cost represents agency and department expenses offset only by earned revenues from the sale of products or delivery of services along with adjustments to accounting estimates. Therefore, the Net Cost balance does not consider tax revenues or budget allocations to fund agency and department costs and, therefore, represents a useful measure of expenditures offset by agency specific items.
Interestingly, the majority of the U.S. Government’s Net Cost is incurred by four major agencies – Department of Health and Human Services (“HHS”), Social Security Administration (“SSA”), Department of Defense (“DOD”), and Department of Veterans Affairs (“VA”) – in addition to the interest on the United States Treasury debt securities. The remaining Net Cost relates to less significant agencies and all other consolidated government operations. Refer to the graphic below for the five-year spending trends of each of these departments and categories.18
Naturally, the five-year trends indicate that the HHS, SSA, DOD, and VA have consistently incurred the majority of the Federal Government’s expenses in recent years. In FY 2018 specifically, over 70% of the total Net Cost was incurred by these four entities.19 Over the past five years, HHS, SSA, and Interest costs alone have increased by approximately 20%, 15%, and 37%, respectively.20
17 2018 U.S. Financial Report, at pg. 15.18 2018 U.S. Financial Report, at pg. 16.19 Ibid.20 Ibid.
Additional Significant Entities
Export-Import Bank of the U.S.
Farm Credit System Insurance Corporation
Federal Communications Commission
Federal Deposit Insurance Corporation
General Fund of the U.S. Government
Millennium Challenge Corporation
National Credit Union Administration
National Railroad Retirement Investment Trust
Overseas Private Investment Corporation
(continued on pg. 6)
Page 5
AUGUST 2019 | Floyd Advisory

3. Financial Position For FY 2018, the U.S. Government reported $3.8 trillion in total assets and $25.4 trillion in total liabilities, which excludes certain “off-balance sheet” items which will be discussed later in this report. Refer to the graphic below for a summary of the assets and liabilities reported on the U.S. Government’s balance sheet.21
Budget of the U.S. Government
From a budgetary perspective, which again, is presented on the cash basis of accounting, the Federal Government collected $3.3 trillion in FY 2018, while it spent $4.1 trillion, operating at a $779.0 billion Budget Deficit22 (see graphic below for a five-year deficit trend, as compared to the corresponding years’ Net Operating Costs).23
21 2018 U.S. Financial Report, at pg. 4.22 2018 U.S. Financial Report, at pg. 58.23 2018 U.S. Financial Report, at pg. 2.
(continued from pg. 5)
Additional Significant Entities
Pension Benefit Guaranty Corporation
Railroad Retirement Board
Securities and Exchange Commission
Security Assistance Accounts
Smithsonian Institution
Tennessee Valley Authority
U.S. Postal Service
Page 6
Floyd Advisory | AUGUST 2019

This deficit constituted a 17% increase since FY 2017. The key factors driving the deficit increase are as follows:
1. Increased Spending
From FY 2017 to FY 2018, the U.S. Financial Report indicates a $127.1 billion increase in outlays, a 3.2% increase since FY 2017.24 FY 2018 marked record highs in military and defense spending. A closer look at the DOD’s budget revealed a budgetary increase of approximately $64.6 billion from FY 2017 to FY 2018.25 The DOD’s financial statement disclosures indicated it “was the first full budget from the new administration and provided increases above the cap formally imposed by the Budget Control Act of 2011.”26 Please refer to the graph below for the five-year DOD budget trend analysis.27
Figure 7. Trend in DoD Budget Authority
2. Tax Cuts and Jobs Act of 201728
For the same periods, the U.S. Financial Report highlights a slowing increase in revenues of $13.8 billion (or 0.4%).29 The Tax Cuts and Jobs Act of 2017 is key factor in this depressed growth.30 It is important to note that FY 2018 results only include a 9-month period in which the tax cuts were in effect.
24 2018 U.S. Financial Report, at pg. 13.25 DOD’s 2018 Annual Financial Report, at pg. 25.26 DOD’s 2018 Annual Financial Report, at pg. 8.27 Ibid.28 The Tax Cuts and Jobs Act is considered one of the most significant tax code overhauls in the past 30 years. The Tax Foundation (www.taxfoundation.org) characterizes “[o]ne of the most significant provisions … was the reduction of the U.S. corporate income tax rate from 35 percent to 21 percent.”29 2018 U.S. Financial Report, at pg. 13.30 2018 U.S. Financial Report, at pg. 60.
Page 7
AUGUST 2019 | Floyd Advisory

Our Observations on the U.S. Financial ReportThere are several items reported in the U.S. Financial Report that are worthy of specific discussion. Key topics include the following: the GAO’s disclaimer of opinion, the material weaknesses identified in the U.S. Government’s accounting controls, the significant liabilities that are disclosed but not reported on the balance sheet, and the assertion by the Treasury that current fiscal policy is not sustainable.
Warning: Reported Results May Not Be Reliable
The GAO issued a disclaimer of opinion on the U.S. Government’s Financial Report. A disclaimer of opinion is a type of audit report in which “the auditor does not express an opinion on the financial statements.”31 The GAO stated that the reason for this conclusion was due to the following:32
“The federal government is not able to demonstrate the reliability of significant portions of the accompanying accrual-based consolidated financial statements as of and for the fiscal years ended September 30, 2018, and 2017, principally because of limitations related to certain material weaknesses in internal control over financial reporting and other limitations affecting the reliability of these financial statements and the scope of our work … As a result of these limitations, readers are cautioned that amounts reported in the accrual-based consolidated financial statements and related notes may not be reliable.”
For comparison’s sake, when a public company receive a disclaimer of opinion from its auditors, it risks being delisted from the stock exchange(s) (e.g., NYSE, NASDAQ, etc.) where its shares publicly trade.
Taxpayers Deserve Internal Controls Just Like Investors
Following the passage of the Sarbanes Oxley Act of 2002, publicly traded companies were required by law to annually document and test their system of internal controls over financial reporting.33 In testing these controls, companies must generally ascertain that a control is 1) in place and 2) appropriately functioning according to its design. Issues with either, or both, of these elements may result in an auditor issuing a control deficiency. The most severe control deficiency assessment is known as a material weakness. A material weakness is defined as:34
“A deficiency, or a combination of deficiencies, in internal control over financial reporting, such that there is a reasonable possibility that a material misstatement of the entity's financial statements will not be prevented, or detected and corrected, on a timely basis.”
A material weakness can have an adverse impact on a public company as it may subject the business to increased auditor attention, costly initiatives to remediate issues identified, and shareholder scrutiny. Though such standards do not apply to the U.S. Government, it has not met its own designated benchmarks and has reported a voluminous list of material weaknesses in internal controls, as indicated in its Financial Report.
31 AICPA AU-C §705.26b Modifications to the Opinion in the Independent Auditor’s Report (emphasis added).32 2018 U.S. Financial Report, at pg. 228 (emphasis added).33 15 U.S.C. §7262 (2019) Management Assessment of Internal Controls.34 AICPA AU-C §265.07 Communicating Internal Control Related Matters Identified in an Audit.
Page 8
Floyd Advisory | AUGUST 2019
“As a result of these limitations, readers are
cautioned that amounts reported in the accrual-
based consolidated financial statements and related notes may not be
reliable.”

Page 9
AUGUST 2019 | Floyd Advisory
All told, the GAO identified nine broad areas on which to focus its discussion of material weaknesses identified in FY 2018 U.S. Financial Report. These include the following:35
Area of Material Weakness DescriptionProperty, Plant, and Equipment; Inventories and Related Property; and Accounts Receivable
The DOD did not maintain adequate systems or have sufficient records of its assets. Other entities reported deficiencies in internal control procedures related to property, plant and equipment as well. In addition, the DOD could not adequately support its accounts receivable balance.
Liabilities and Commitments and Contingencies
The Federal Government could not reasonably estimate or adequately support amounts reported for certain liabilities. Additionally, it could not determine whether commitments and contingencies were complete and properly reported.
Cost of Government Operations and Disbursement Activity
Reported net costs were affected by the material weaknesses in reporting assets and liabilities, material weaknesses in financial statement preparation, and the lack of adequate disbursement reconciliation.
Intragovernmental Activity and Balances
Federal entities continue to be unable to adequately account for and reconcile intragovernmental activity and balances.
Preparation of Consolidated Financial Statements
The Federal Government continued to have inadequate systems, controls, and procedures to ensure that the consolidated financial statements are consistent with the underlying audited entity financial statements, properly balanced, and in accordance with GAAP.
Reconciliations of Budget Deficit to Net Operating Cost and Changes in Cash Balance
For several years, there have been considerable internal control deficiencies related to the monitoring, accounting, and reporting of budgetary transactions. Such deficiencies may affect the calculation of the net outlay amounts in the federal entities’ Statements of Budgetary Resources, which in turn, may impact these entities’ ability to report reliable budgetary information to the Treasury and the Office of Management and Budget.
Improper Payments The Federal Government continues to face challenges in determining the full extent of its improper payments. Although progress has been made, internal control deficiencies over financial reporting continue to increase the risk that improper payments may not be detected promptly.
Information Security Control deficiencies continue to be identified related to security management, access to computer resources, changes to information system resources, segregation of incompatible duties, and contingency planning.
Loans Receivable and Loan Guarantee Liabilities
Internal control deficiencies were identified related to credit program cost estimation, associated control activities, and financial reporting processes. Such deficiencies increase the risk that misstatements in federal entity and government-wide financial statements could occur.
35 2018 U.S. Financial Report, at pgs. 244-253.

Disaggregating this further, the Financial Report states that the CFO Act Entities, specifically, reported 40 material weaknesses and despite progress at many agencies, “continued work is needed.”36 However, taxpayers should not expect the deficiencies to be corrected in the near future. The DOD alone has reported extended planned periods for correction of its identified deficiencies, some that range through FY 2025.37
The DOD is of particular relevance as its FY 2018 reporting identified 38 material weaknesses of its own. The agency also accounts for a large portion of the government’s reported assets and net costs, as we’ve pointed out in the preceding. Notably, 34 of the 38 material weaknesses disclosed by the DOD are not expected to be corrected in the current fiscal year.38
“Off-Balance Sheet” Risks and Liabilities
The U.S. Financial Report does not reflect all of the government’s obligations as certain agencies are omitted from the consolidated reporting entity. Notably, the present value of social insurance obligations and the status of GSEs – to name a few – are in large part not reflected in the financial position of the U.S. Government.
Social Insurance Obligations
Given the fact that “Social Security and Medicare are among the largest expenditure categories of the U.S. federal budget,”39 the omission of the related obligations in the U.S Financial Report materially understates the liabilities burdening the U.S. Government. The Treasury’s Statements of Social Insurance40 report that as of September 30, 2018, the total present value estimate of future expenditures in excess of future revenue (in other words, the net obligation) for the Social Insurance programs is approximately $53.8 trillion.41 In weighing this projection, the Financial Report presents a $3.2 trillion total in Trust Fund Assets to cover the entirety of the Social Insurance programs.42
Relationship with Government Sponsored Enterprises
The Federal Government holds Senior Preferred Stock Purchase Agreements with Fannie Mae and Freddie Mac. These arrangements require a maximum remaining potential commitment of $254.1 billion to the GSEs.43 Effectively, this could require potential future payments by the Federal Government to keep the GSEs solvent (i.e., maintain positive net assets).44 The Treasury estimated there was no probable future funding draws, citing “challenges quantifying future market volatility or the timing, magnitude, and likelihood of non-recurring events,” and as such, opted not to accrue a
36 2018 U.S. Financial Report, at pg. 32.37 DOD’s 2018 Annual Financial Report at pgs. 147-154. 38 Ibid.39 2018 U.S. Financial Report, at pg. 176.40 Per the Bureau of the Fiscal Service’s website (fiscal.treasury.gov), the “Statements of Social Insurance provide estimates of the status of the most significant social insurance programs.”41 2018 U.S. Financial Report, at pg. 62.42 2018 U.S. Financial Report, at pgs. 134-135. The report balance is the total of the following social insurance programs: Social Security ($2.9 trillion as of January 1, 2018) and Medicare ($0.3 trillion as of January 1, 2018).43 2018 U.S. Financial Report, at pgs. 90-92.44 Ibid.
Page 10
Floyd Advisory | AUGUST 2019
Disaggregating this further, the Financial
Report states that the CFO Act Entities,
specifically, reported 40 material weaknesses and despite progress at many
agencies, “continued work is needed.”
* * * * *
The Treasury’s Statements of Social Insurance report
that as of September 30,
2018, the total present value estimate of future
expenditures in excess of future revenue (in other words, the net
obligation) for the Social Insurance programs is
approximately $53.8 trillion.

Page 11
AUGUST 2019 | Floyd Advisory
Fannie Mae and Freddie Mac’s combined “off-balance sheet” liability exposure was $263.1 billion for the same year ended.
* * * * *
The modified accrual basis of accounting, which is a more accurate economic measurement of financial position and profitability, resulted in a 31% higher
cumulative “deficit” over the last decade than the annual budget process reflects.
contingent liability as of September 30, 2018.45 It did, however, determine that such non-recurring events and market volatility represented a “reasonably possible future funding liability.”46 While the entities had about $12.5 billion of combined net assets as of September 30, 2018, their combined “off-balance sheet” liability exposure was $263.1 billion for the same year ended.47
Current Budget Deficits Understate Government “Losses”
As discussed above, while the U.S. Financial Report uses the cash basis of accounting for budgetary purposes, the financial statements are reported on a modified accrual basis.
When comparing the results from these two reports that use very different methods of accounting for reporting U.S. Government financial information, a material difference arises. While both reflect negative results, the modified accrual basis of accounting, which is a more accurate economic measurement of financial position and profitability, resulted in a 31% higher cumulative “deficit” over the last decade than the annual budget process reflects.
The graph below lays out the accumulated budget deficit for each year over the last ten years, as well as the additional incremental net operating costs incurred.48
Separately, when comparing year-by-year differences on a standalone basis, FY 2010 demonstrated one of the largest disparities in the budget deficit versus the accrual deficit at approximately $800 billion. Per the 2010 Financial Report, this difference was mainly attributed to programs such as military employee benefits, veteran’s compensation, and GSEs.49
45 2018 U.S. Financial Report, at pg. 91.46 Ibid.47 Fannie Mae’s Form 10-Q for the quarterly period ended September 30, 2018, at pgs. 46 and 52; Freddie Mac’s Form 10-Q for the quarterly period ended September 30, 2018, at pgs. 77 and 82.48 Compiled from U.S. Government Reconciliations of Net Operating Cost and Unified Budget Deficit for the years ended September 30, 2009 through 2018.49 2010 U.S. Financial Report, at pg. 43.
10 Year Cumulative Unified Budget Deficit vs. Net Operating Cost

Page 12
Floyd Advisory | AUGUST 2019
As is underscored by the results of the U.S. Financial Report, the
Treasury states that the “current policy is not
sustainable.” Contrary to the current trend,
a sustainable policy is one where the debt-to-GDP ratio is ultimately
stable or declining. The debt-to-GDP ratio for FY
2018 was 78%. Under the current policy, this ratio is projected to exceed 100%
by 2030 and reach 530% in 2093.
Recent Periods’ Trend Analysis and Inflation Comparison
As shown in the graph below, when comparing the five-year period beginning in FY 2014 through FY 2018, cash outlays grew by approximately 19%, while cash receipts grew by approximately 20% overall. For comparison, aggregate inflation was approximately 8% over the same period.50
It is important to note that the changes in revenue and outlays have been impacted recently by lower growth of receipts as compared to increased spending on areas like Defense, Medicaid, Social Security, disaster relief and flood insurance, Refundable Premium Tax Credits and cost sharing reductions, interest on publicly-held Treasury debt, and lower GSE receipts (an offset to outlays).51 For example, the DOD’s financial results reveal record highs in military and defense spending. Its FY 2018 $33.0 billion net cost increase is comprised of a $39.2 billion decrease in earned revenues across the Department, as well as increases in the costs of procurement, personnel, and research and development.52
“An Unsustainable Fiscal Path”
As is underscored by the results of the U.S. Financial Report, the Treasury states that the “current policy is not sustainable.”53 Contrary to the current trend, a sustainable policy is one where the debt-to-GDP ratio is ultimately stable or declining.
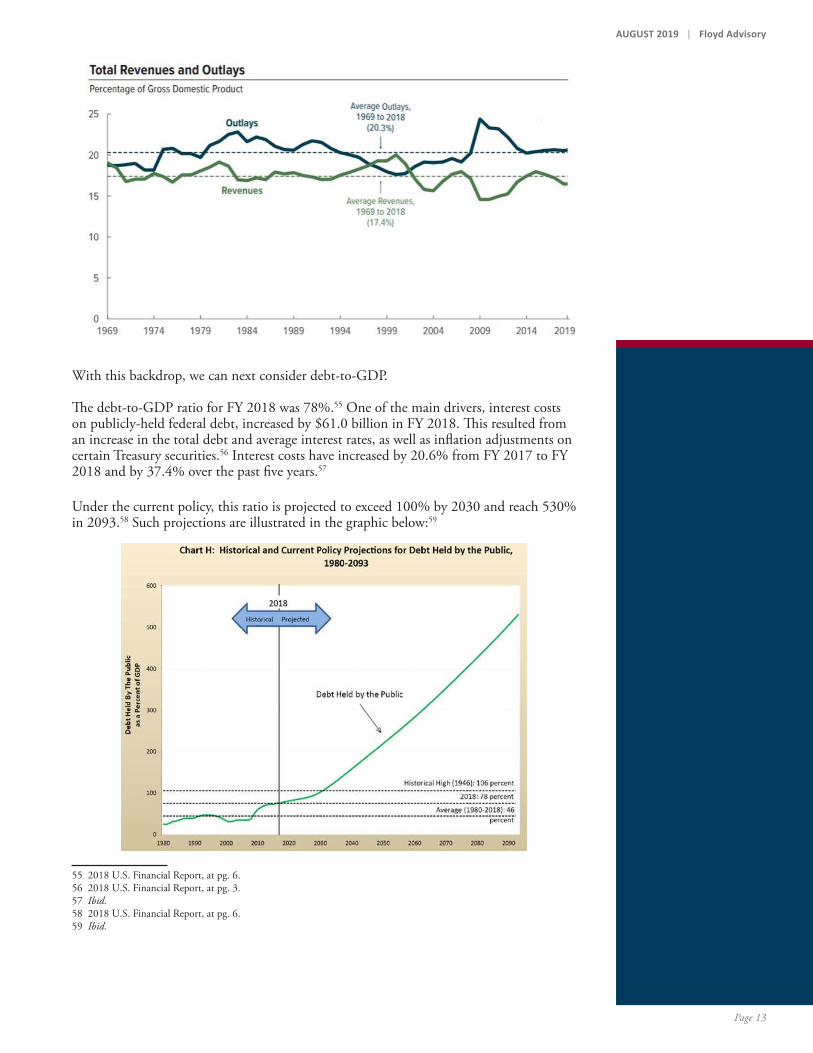
GDP is a measurement of the nation’s economy in terms of the total value of all final goods and services that are produced in a year. When considering financial results relative to GDP, the result is a useful indicator of our economy’s ability to sustain the government’s numerous programs. Before analyzing the current debt-to-GDP ratio, it is helpful to first understand the broader picture in terms of the government’s historical collections and spending, as a function of GDP. The chart on the next page includes total government revenues and outlays as a percentage of GDP for the last 50 years.54 Notably, while the average outlays for the past 50 years averaged 20% of GDP, revenues averaged just 17% for the same period.
50 The chart illustrating these data points was compiled from historical Congressional Budget Office data tables and The U.S. Department of Labor Bureau of Labor Statistics Consumer Price Index historical tables.51 2018 U.S. Financial Report, at pg. 13.52 2018 U.S. Financial Report, at pg. 3.53 2018 U.S. Financial Report, at pg. ii.54 https://www.cbo.gov/publication/55151.
Cash Revenue and Outlays5-Year Historical Growth
Page 13
AUGUST 2019 | Floyd Advisory
With this backdrop, we can next consider debt-to-GDP.
The debt-to-GDP ratio for FY 2018 was 78%.55 One of the main drivers, interest costs on publicly-held federal debt, increased by $61.0 billion in FY 2018. This resulted from an increase in the total debt and average interest rates, as well as inflation adjustments on certain Treasury securities.56 Interest costs have increased by 20.6% from FY 2017 to FY 2018 and by 37.4% over the past five years.57
Under the current policy, this ratio is projected to exceed 100% by 2030 and reach 530% in 2093.58 Such projections are illustrated in the graphic below:59
55 2018 U.S. Financial Report, at pg. 6.56 2018 U.S. Financial Report, at pg. 3.57 Ibid.58 2018 U.S. Financial Report, at pg. 6.59 Ibid.

Page 14
Floyd Advisory | AUGUST 2019
“if action is delayed by 10 years, the estimated magnitude of primary surplus increases necessary to close the 75-year fiscal gap increases by nearly 20 percent … if action is delayed by 20 years, the magnitude of reforms necessary increases by about 46 percent."
To an auditor of a public company, trends and projections such as these would trigger questions about a company’s ability to continue as a going concern.60
Circling back to government collections and spending as a function of GDP, the following graph illustrates the impact that a current policy would have on projections for government spending and receipts.61
As articulated above, the gap between government receipts and government spending is expected to widen significantly over time, given current policy remains static.
Additionally, the GAO found that the cost of delaying fiscal reform policy is such that “if action is delayed by 10 years, the estimated magnitude of primary surplus increases necessary to close the 75-year fiscal gap increases by nearly 20 percent … if action is delayed by 20 years, the magnitude of reforms necessary increases by about 46 percent.”62 As such, addressing the fiscal gap issues timely is the most fiscally responsible course of action.
Needless to say, from the perspective of a corporate shareholder, the data and analyses relayed herein would raise serious concerns about the U.S. Government’s financial outlook and its ability to continue as a going concern.
60 Generally accepted auditing standards (“GAAS”) defines substantial doubt about an entity’s ability to continue as a going concern as follows: “conditions and events, considered in the aggregate, indicate that it is probable that the entity will be unable to meet its obligations as they become due within one year after the date that the financial statements are issued (or within one year after the date that the financial statements are available to be issued, when applicable).” AICPA AU-C §570.A3 The Auditor’s Consideration of an Entity’s Ability to Continue as a Going Concern.61 2018 U.S. Financial Report, at pg. 5.62 2018 U.S. Financial Report, at pg. 7.
Page 15
AUGUST 2019 | Floyd Advisory
We hope you found our analyses and related observations insightful and welcome your comments and feedback.
ACKNOWLEDGEMENT We wish to acknowledge the valuable contribution to this analysis by Marni Kaufman, Jake Lee, and Sarah Cronk.
For more information, please contact Jeffrey Dary at 617.586.1088 or Joseph J. Floyd at 212.867.5848

New York555 Fifth Avenue, 6th FloorNew York, NY 10017212.845.9018
Boston155 Federal Street, 11th Floor Boston, MA 02110617.586.1040
www.floydadvisory.com
ABOUT Floyd AdvisoryFloyd Advisory is a consulting firm providing financial and accounting expertise in areas of Business Strategy, Valuation, SEC Reporting, Transaction Analysis, and Litigation Services.