Embed Size (px)
Citation preview
A Financial and Economic Appraisal of Capital
Investment in Jijiga Export Slaughter House, Somali
Region, Ethiopia, Using FAST Modeling Standards
Amirreza Botlani Esfahani
Submitted to the
Institute of Graduate Studies and Research,
in partial fulfillment of the requirements for the degree of
Master of Science
in
Banking and Finance
Eastern Mediterranean University
February 2016
Gazimağusa, North Cyprus
Approval of the Institute of Graduate Studies and Research
Prof. Dr. Cem Tanova
Acting Director
I certify that this thesis satisfies the requirements as a thesis for the degree of Master
of Science in Banking and Finance.
Assoc. Prof. Dr. Nesrin Ozatac
Chair, Department of Banking and Finance
We certify that we have read this thesis and that in our opinion it is fully adequate in
scope and quality as a thesis for the degree of Master of Science in Banking and
Finance.
Prof. Dr. Glenn P. Jenkins
Supervisor
Examining Committee
1. Prof. Dr. Glenn P. Jenkins
2. Prof. Dr. Hatice Jenkins
3. Asst. Prof. Dr. Hasan Ulaş Altıok
iii
ABSTRACT
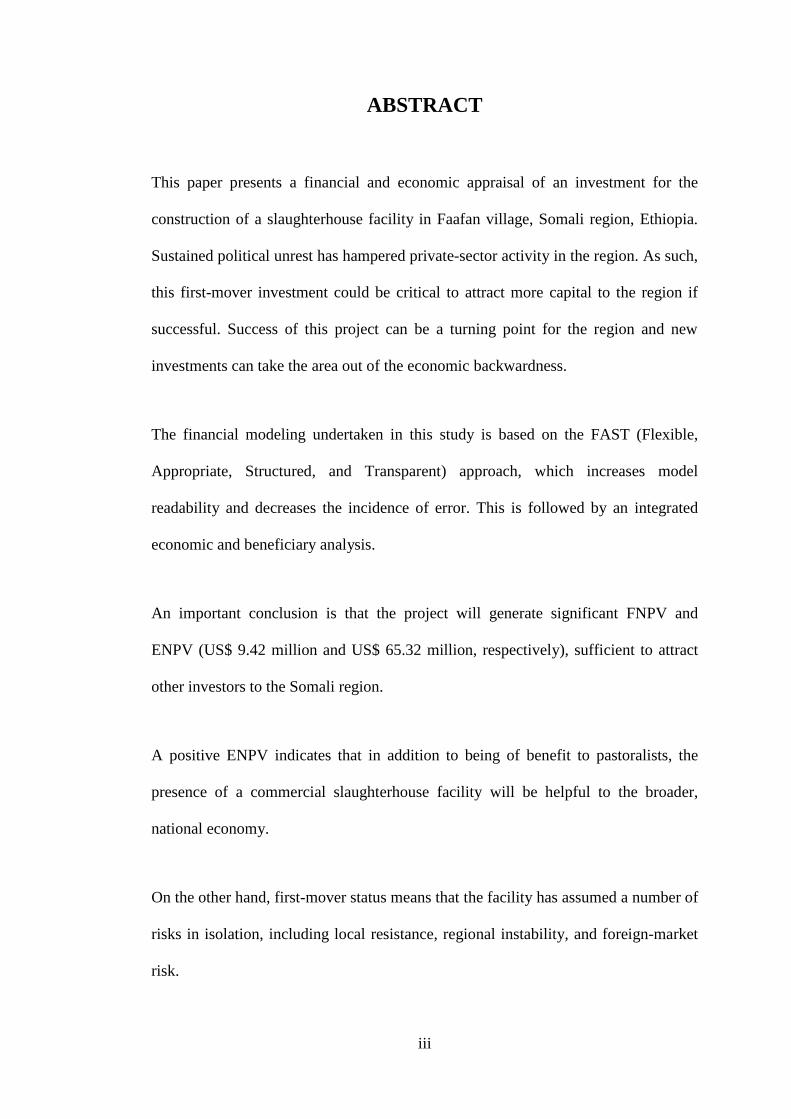
This paper presents a financial and economic appraisal of an investment for the
construction of a slaughterhouse facility in Faafan village, Somali region, Ethiopia.
Sustained political unrest has hampered private-sector activity in the region. As such,
this first-mover investment could be critical to attract more capital to the region if
successful. Success of this project can be a turning point for the region and new
investments can take the area out of the economic backwardness.
The financial modeling undertaken in this study is based on the FAST (Flexible,
Appropriate, Structured, and Transparent) approach, which increases model
readability and decreases the incidence of error. This is followed by an integrated
economic and beneficiary analysis.
An important conclusion is that the project will generate significant FNPV and
ENPV (US$ 9.42 million and US$ 65.32 million, respectively), sufficient to attract
other investors to the Somali region.
A positive ENPV indicates that in addition to being of benefit to pastoralists, the
presence of a commercial slaughterhouse facility will be helpful to the broader,
national economy.
On the other hand, first-mover status means that the facility has assumed a number of
risks in isolation, including local resistance, regional instability, and foreign-market
risk.

iv
The project stakeholders comprise of the private investor, smallholder livestock
producers, livestock traders, slaughterhouse workers, the Faafan village community,
and the Government of Ethiopia, who are also major project beneficiaries.
Keywords: financial and economic analysis, FAST modeling, Somali region,
Slaughterhouse, FNPV, ENPV.
v
ÖZ
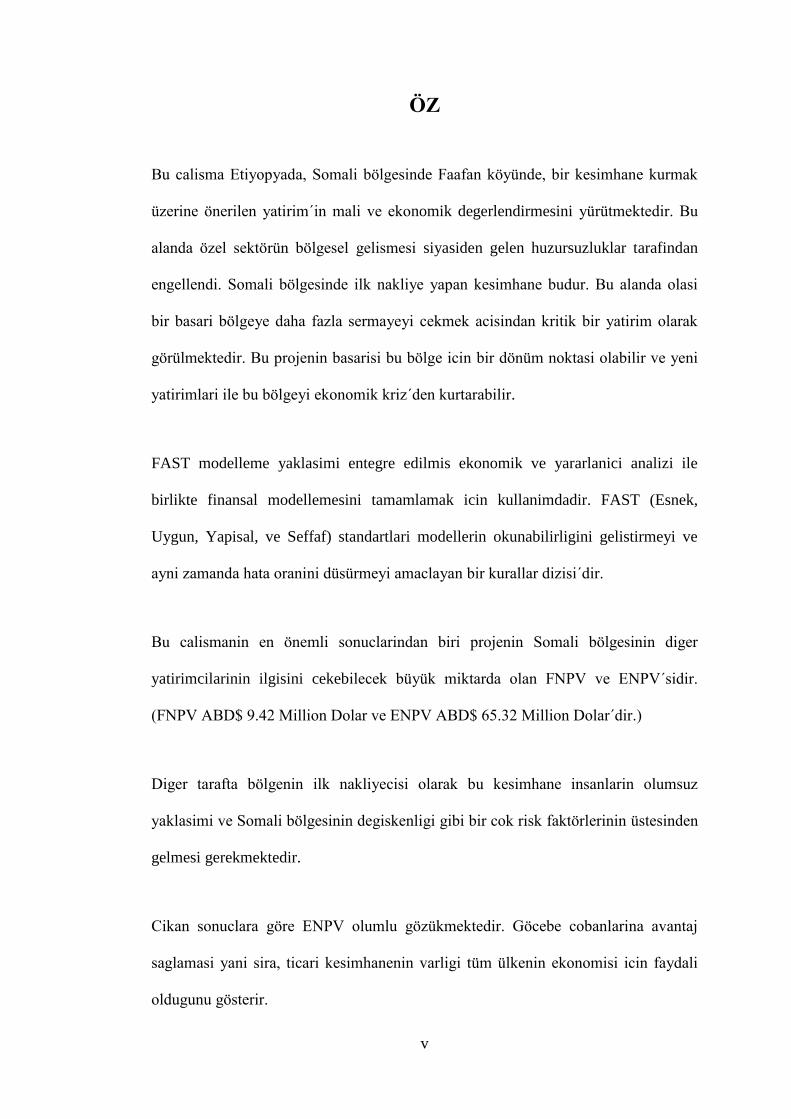
Bu calisma Etiyopyada, Somali bölgesinde Faafan köyünde, bir kesimhane kurmak
üzerine önerilen yatirim´in mali ve ekonomik degerlendirmesini yürütmektedir. Bu
alanda özel sektörün bölgesel gelismesi siyasiden gelen huzursuzluklar tarafindan
engellendi. Somali bölgesinde ilk nakliye yapan kesimhane budur. Bu alanda olasi
bir basari bölgeye daha fazla sermayeyi cekmek acisindan kritik bir yatirim olarak
görülmektedir. Bu projenin basarisi bu bölge icin bir dönüm noktasi olabilir ve yeni
yatirimlari ile bu bölgeyi ekonomik kriz´den kurtarabilir.
FAST modelleme yaklasimi entegre edilmis ekonomik ve yararlanici analizi ile
birlikte finansal modellemesini tamamlamak icin kullanimdadir. FAST (Esnek,
Uygun, Yapisal, ve Seffaf) standartlari modellerin okunabilirligini gelistirmeyi ve
ayni zamanda hata oranini düsürmeyi amaclayan bir kurallar dizisi´dir.
Bu calismanin en önemli sonuclarindan biri projenin Somali bölgesinin diger
yatirimcilarinin ilgisini cekebilecek büyük miktarda olan FNPV ve ENPV´sidir.
(FNPV ABD$ 9.42 Million Dolar ve ENPV ABD$ 65.32 Million Dolar´dir.)
Diger tarafta bölgenin ilk nakliyecisi olarak bu kesimhane insanlarin olumsuz
yaklasimi ve Somali bölgesinin degiskenligi gibi bir cok risk faktörlerinin üstesinden
gelmesi gerekmektedir.
Cikan sonuclara göre ENPV olumlu gözükmektedir. Göcebe cobanlarina avantaj
saglamasi yani sira, ticari kesimhanenin varligi tüm ülkenin ekonomisi icin faydali
oldugunu gösterir.
vi
Proje paydaslarin´in birkac gruplari vardir: özel yatirimci, kücük ölcekli hayvancilik
üreticileri, ve hayvancilik tüccarlari, kesimhane calisanlari, Faafan köy halki ve
Etiyopya hükümeti.
Anahtar kelimeler: mali ve ekonomik degerlendirme, FAST modelleme, Somali
bölgesi, kesimhane, FNPV, ENPV, paydaslar

vii
DEDICATION
To my dearest Mom and Dad
With love and respect

viii
ACKNOWLEDGMENT
I would like to thank my supervisor Prof. Dr. Glenn Paul Jenkins for his advice and
valuable support. I am also grateful to Mikhail Miklyaev, who provided valuable
suggestions and comments during my work.
ix
TABLE OF CONTENTS
ABSTRACT ................................................................................................................ iii
ÖZ ................................................................................................................................ v
DEDICATION ........................................................................................................... vii
ACKNOWLEDGMENT ........................................................................................... viii
LIST OF TABLES .................................................................................................... xiii
LIST of EQUATIONS ............................................................................................. xvii
LIST OF ABBREVIATION ................................................................................... xviii
1 INTRODUCTION .................................................................................................... 1
1.1 Introduction ......................................................................................................... 1
1.2 Aim of the Study ................................................................................................. 3
1.3 Methodology ....................................................................................................... 3
1.4 Structure ......................................................................................................................... 4
2 LITERATURE REVIEW ......................................................................................... 5
2.1 Background ......................................................................................................... 5
2.2 Livestock Market ................................................................................................ 7
2.2.1 Market Conditions ................................................................................................. 8
2.2.2 Livestock Transportation ...................................................................................... 9
2.2.2.1 Livestock Transportation Problems and Consequences ............................. 9
2.2.3 Actors in the Livestock Value Chain ................................................................ 10
2.2.3.1 Brokers ............................................................................................................ 10
2.2.3.2 Export Abattoirs ............................................................................................ 11
2.3 USAID PRIME Program .................................................................................. 11
2.4 Jijiga Export Slaughterhouse ............................................................................ 11
x
2.4.1 Challenges faced by JESH .................................................................................. 13
2.4.2 JESH Benefits....................................................................................................... 13
3 METHODOLOGY ................................................................................................. 15
3.1 Introduction ....................................................................................................... 15
3.2 Financial Analysis ............................................................................................. 15
3.3 Costs-Benefit Analysis (CBA) .......................................................................... 15
3.3.1 Price Index and Exchange Rates ........................................................................ 15
3.3.2 Cash-flow Statements .......................................................................................... 16
3.3.3 Financial Evaluation Criteria .............................................................................. 16
3.3.3.1 Net Present Value (NPV) 16
3.3.3.2 Internal Rate of Return (IRR) 17
3.3.4 Sensitivity Analysis ............................................................................................. 17
3.4 Economic Appraisal .......................................................................................... 17
3.4.1 Economic Externalities ....................................................................................... 18
3.4.2 Beneficiary Analysis ........................................................................................... 18
3.5 FAST Modeling Standards ............................................................................... 19
3.5.1 Workbook Design Rules ..................................................................................... 20
3.5.2 Worksheet Rules .................................................................................................. 20
3.5.2.1 Worksheet Design 20
3.5.2.2 Calculation Blocks 21
3.5.2.3 Check Box 21
3.5.3 Multiple Worksheets ........................................................................................... 21
4 FINANCIAL ANALYSIS ...................................................................................... 22
4.1 Introduction ....................................................................................................... 22
4.2 Project Description ............................................................................................ 22
xi
4.3 Project Modeling ............................................................................................... 23
4.3.1 Timing ................................................................................................................... 23
4.3.2 Price Index and Exchange Rates ........................................................................ 23
4.3.3 Project Potential Utilization ............................................................................... 24
4.3.4 Investment Cost .................................................................................................... 25
4.3.5 Production and Losses ......................................................................................... 26
4.3.6 Labor Costs ........................................................................................................... 28
4.3.7 Cost of Inputs ....................................................................................................... 30
4.3.8 Working Capital ................................................................................................... 30
4.3.9 Tax ......................................................................................................................... 32
4.3.10 Microeconomic Parameters .............................................................................. 32
4.3.11 Residual Values ................................................................................................. 33
4.3.12 Tax Depreciation Rates ..................................................................................... 34
4.3.13 Income Tax Statement ...................................................................................... 35
4.3.14 Cash-Flow Statements ....................................................................................... 36
5 SENSITIVITY ANALYSIS ................................................................................... 42
5.1 Introduction ....................................................................................................... 42
5.2 Sensitivity Analysis .......................................................................................... 42
5.3 Results and Interpretations ................................................................................ 42
5.4 Risk Management ............................................................................................. 47
6 ECONOMIC ANALYSIS ...................................................................................... 49
6.1 Introduction ....................................................................................................... 49
6.2 Conversion Factors ........................................................................................... 49
6.3 Statements and Results ..................................................................................... 51
6.3.1 Economic Resource Flow ................................................................................... 52
xii
6.4 Stakeholder Analysis ........................................................................................ 52
6.4.1 Sensitivity Analysis ............................................................................................. 53
6.5 Beneficiary Analysis .................................................................................................. 55
7 CONCLUSION AND RECOMMENDATIONS ................................................... 56
REFERENCES .......................................................................................................... 58
APPENDIX ................................................................................................................ 62
Appendix A: Economic Resource Flow Statement ................................................... 63
Appendix B: Statement of Economic Externalities .................................................. 66
xiii
LIST OF TABLES
Table 4.1: Sources and Uses of Funds ........................................................................ 23
Table 4.2: Price Index and Exchange Rates ................................................................ 24
Table 4.3: Production Capacity Utilization............................................................ .... 24
Table 4.4: Annual Capacity Utilization ...................................................................... 25
Table 4.5: Investment Costs in Dollar Terms ............................................................. 25
Table 4.6: Investment Costs (Million ETB, Real) ...................................................... 26
Table 4.7: Annual JESH Production ........................................................................... 27
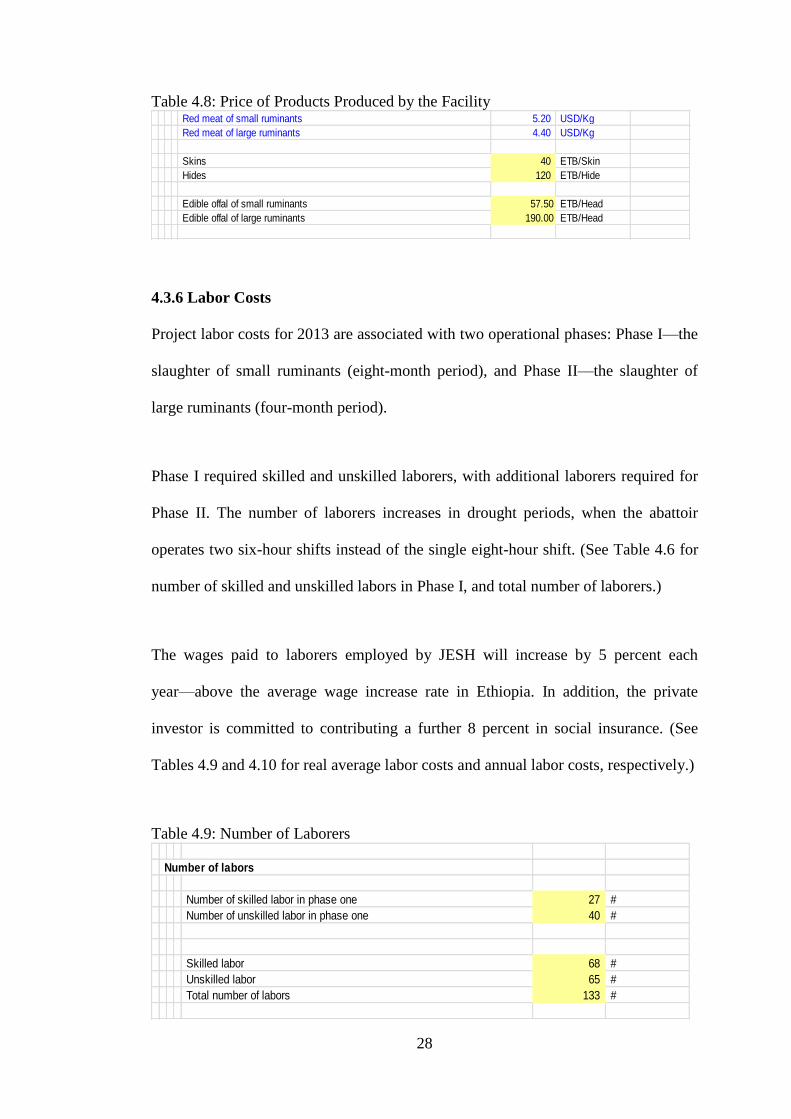
Table 4.8: Price of Products Produced by the Facility ................................................ 28
Table 4.9: Number of Laborers ................................................................................... 28
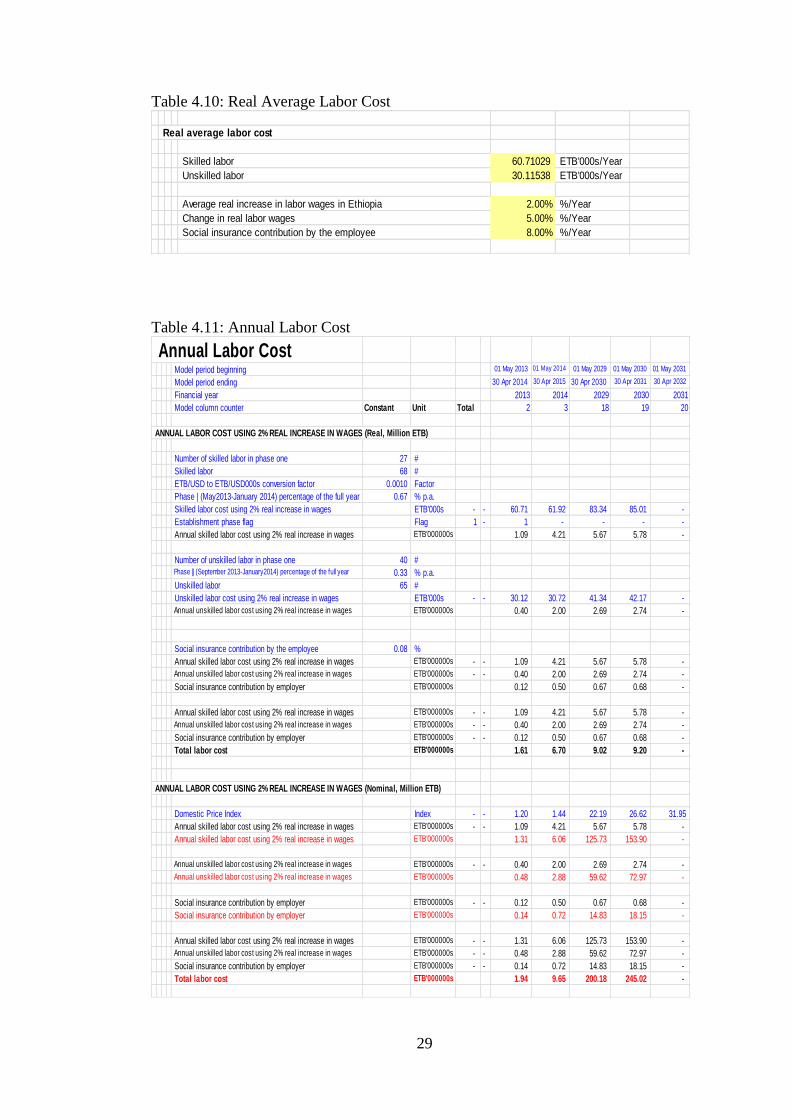
Table 4.10: Real Average Labor Cost ......................................................................... 29
Table 4.11: Annual Labor Cost ................................................................................... 29
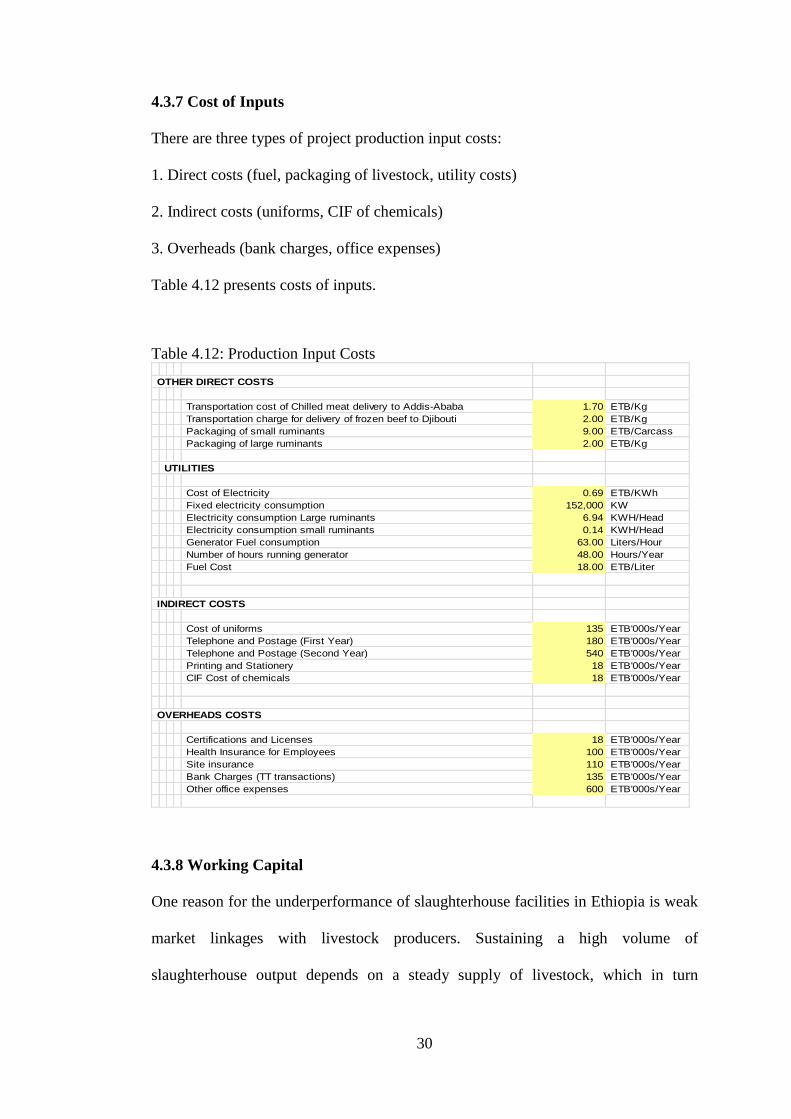
Table 4.12: Production Input Costs ............................................................................ 30
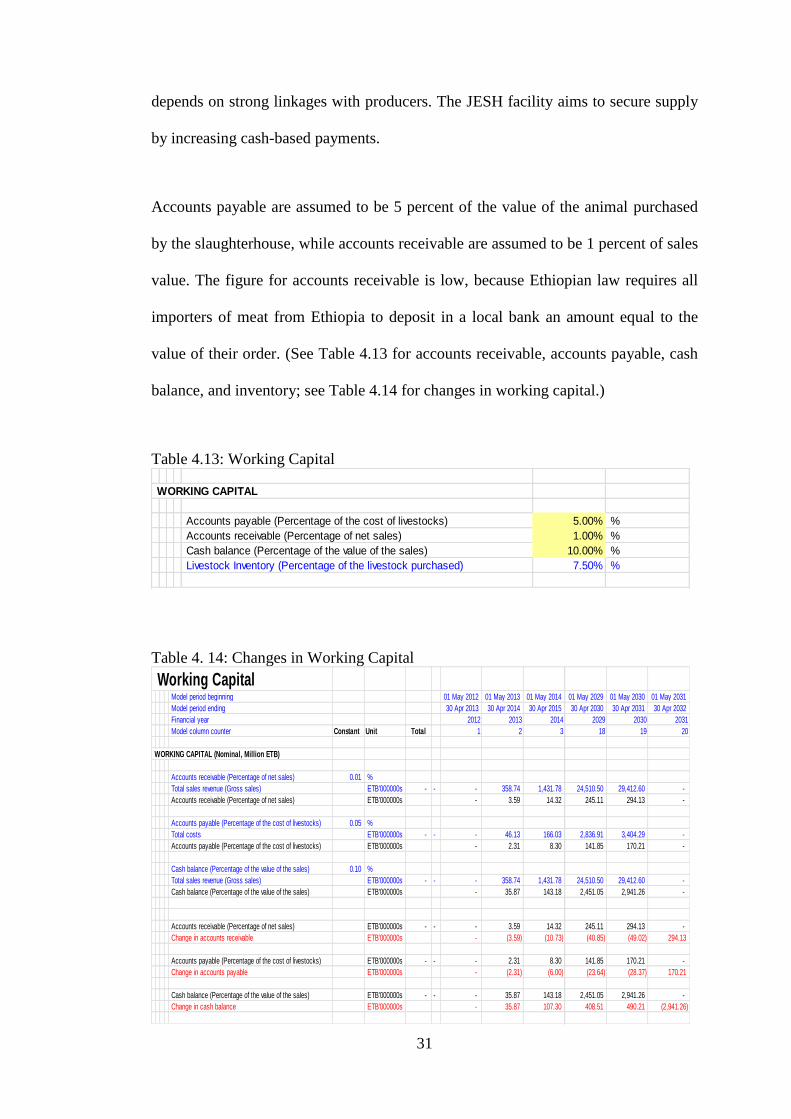
Table 4.13: Working Capital ....................................................................................... 31
Table 4.14: Changes in Working Capital .................................................................... 31
Table 4.15: Tax Rates ................................................................................................. 32
Table 4.16: Economic Parameters .............................................................................. 33
Table 4.17: Project Assets’ Useful Life ...................................................................... 33
Table 4.18: Project Assets’ Residual Values .............................................................. 34
Table 4.19: Depreciation Rates for Income Tax ......................................................... 34
Table 4.20: Depreciation for Tax Purposes ................................................................ 35
Table 4.21: Income Tax Statement (Nominal, Million ETB) ..................................... 36
Table 4.22: Cash Flow Statement: Total Investment Point of View (Real, Million
ETB) ............................................................................................................................ 37
xiv
Table 4.23: Cash Flow Statement: Owner’s Point of View (Real, Million ETB) ..... 39
Table 4.24: Financial Results ..................................................................................... 41
Table 5.1: Impact of Average Cost of Small Ruminants on FNPV and FIRR
(Million USD)…………… …………………………………… …………………..43
Table 5.2: Impact of FOB Price of Lamb on FNPV and FIRR (Million USD) ......... 43
Table 5.3: Impact of Average Cost of Large Ruminants on FNPV and FIRR (Million
USD) .......................................................................................................................... 44
Table 5.4: Impact of Price of Beef on FNPV and FIRR (Million USD) ................... 44
Table 5.5: Impact of Changes in Small Ruminants’ Average Carcass as Proportion of
Live Weight on FNPV and FIRR (Million USD) ...................................................... 45
Table 5.6: Impact of Changes in Large Ruminants’Average Beef Cuts as Proportion
of Live Weight on FNPV and FIRR (Million USD) ............................................... 45
Table 5.7: Impact of Livestock Inventory on FNPV and FIRR (Million USD) ........ 46
Table 5.8: Impact of Small Ruminants’ Purchase Prices and FOB Prices on FNPV
(Million USD) ............................................................................................................ 46
Table 5.9: Impact of Large Ruminants Purchase Prices and FOB Prices on FNPV.. 47
Table6.1: Conversion Factor for Exportable Project Input (Smallruminants) … . ...49
Table 6.2: Conversion Factor for Importable Project Input (Vehicles) ..................... 50
Table 6.3: List of Conversion Factors ........................................................................ 51
Table 6.4: Economic Resource Flow Statement ........................................................ 52
Table 6.5: Distributive Analysis ................................................................................ 53
Table 6.6: Stakeholder Impact (Million USD)........................................................... 53
Table 6.7: Impact of changes in prices of small ruminants’ meat and small ruminants
purchase price on ENPV (Million USD) ................................................................... 54
xv
Table 6.8: Impact of changes in prices of large ruminants’ meat and large ruminants’
purchase price on ENPV (Million USD) ................................................................... 54
Table 6.9: Beneficiaries Analysis… .......................................................................... 55
xvi
TABLE of FIGURES
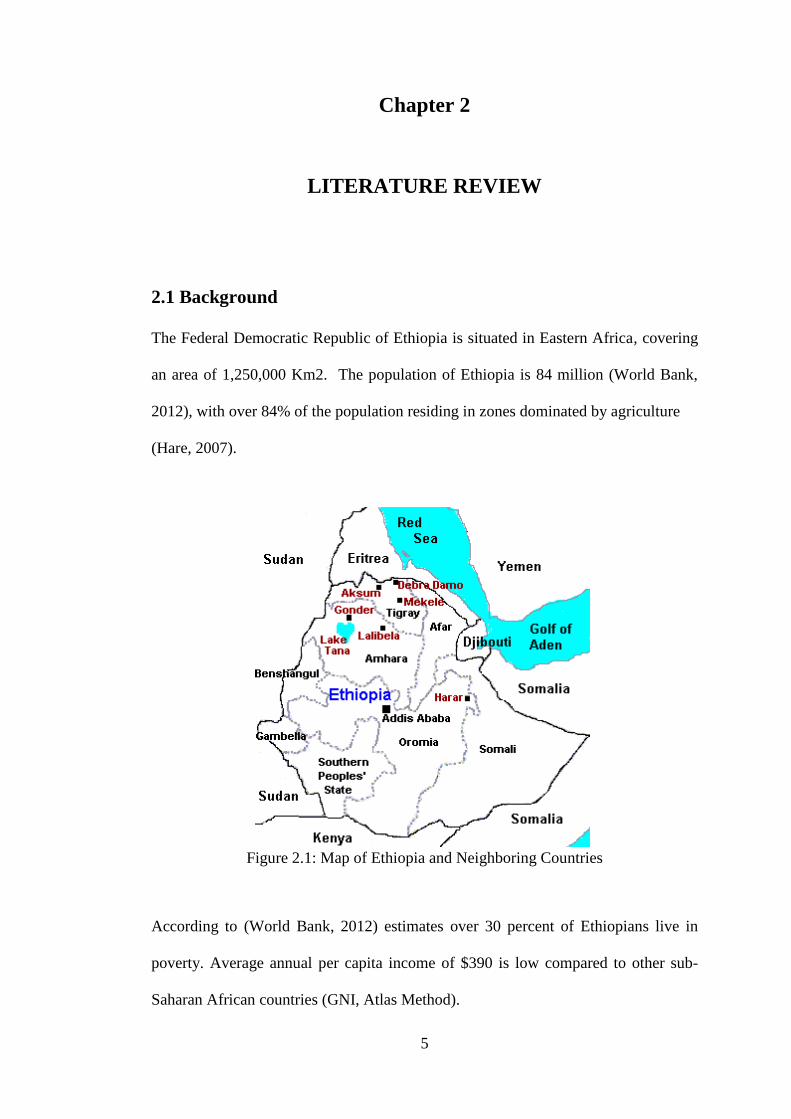
Figure 2.1: Map of Ethiopia and Neighboring Countries ............................................ 5
Figure 2.2: Location of Somali Region, Ethiopia ........................................................ 7
Figure 2.3: Animal Trade Paths on Ethiopia Borderland............................................. 8
Figure 2.4: Livestock Loading and Unloading .......................................................... 10
Figure 2.5: Land Dedicated to Growing Fodder ........................................................ 12

xvii
LIST of EQUATIONS
Equation 3.1: Net Present Value ................................................................................. 17
xviii
LIST OF ABBREVIATION
CBA Cost-Benefit Analysis
CF Conversion Factor
ENPV Economic Net Present Value
ETB Ethiopian Birr (Currency)
FEP Foreign Exchange Premium
FNPV Financial Net Present Value
FOB Free on Board
FtF Feed the Future
GDP Gross Domestic Product
NCF Net Cash Flow
NPV Net Present Value
PRIME Pastoralists Resilience Improvement and Market Development
VAT Value Added Tax
USD United States Dollar
USAID United States Agency for International Development
1
Chapter 1
INTRODUCTION
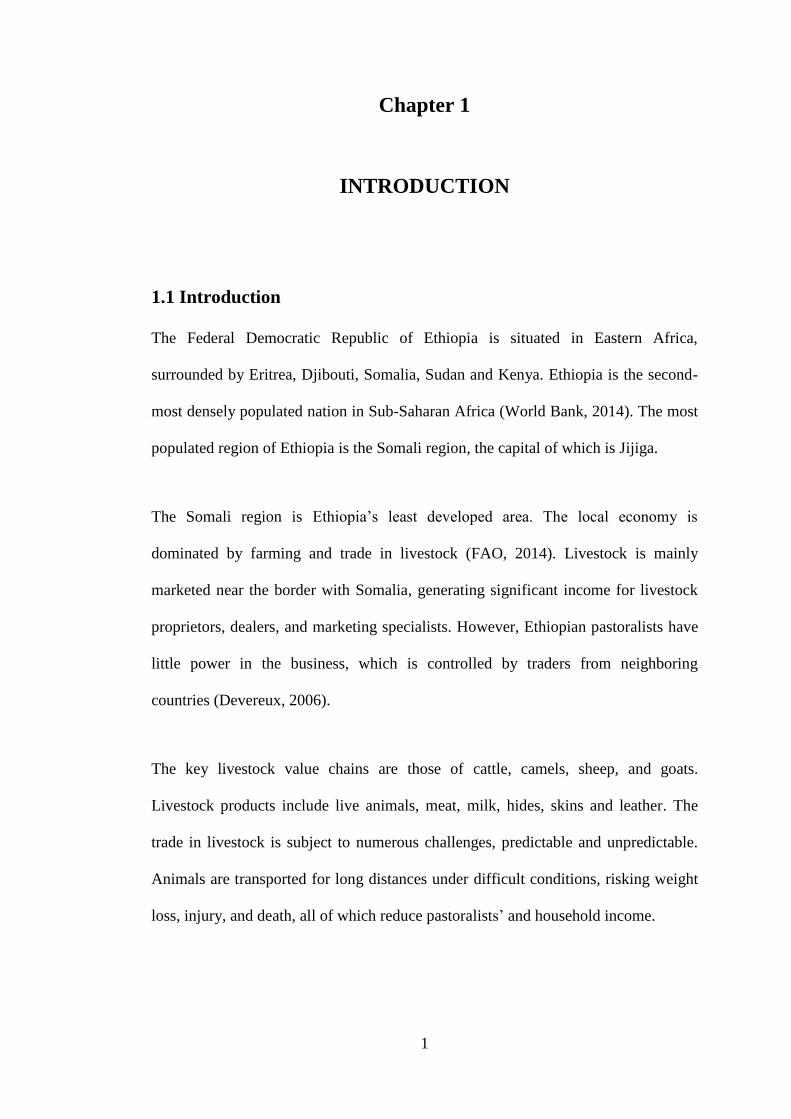
1.1 Introduction
The Federal Democratic Republic of Ethiopia is situated in Eastern Africa,
surrounded by Eritrea, Djibouti, Somalia, Sudan and Kenya. Ethiopia is the second-
most densely populated nation in Sub-Saharan Africa (World Bank, 2014). The most
populated region of Ethiopia is the Somali region, the capital of which is Jijiga.
The Somali region is Ethiopia’s least developed area. The local economy is
dominated by farming and trade in livestock (FAO, 2014). Livestock is mainly
marketed near the border with Somalia, generating significant income for livestock
proprietors, dealers, and marketing specialists. However, Ethiopian pastoralists have
little power in the business, which is controlled by traders from neighboring
countries (Devereux, 2006).
The key livestock value chains are those of cattle, camels, sheep, and goats.
Livestock products include live animals, meat, milk, hides, skins and leather. The
trade in livestock is subject to numerous challenges, predictable and unpredictable.
Animals are transported for long distances under difficult conditions, risking weight
loss, injury, and death, all of which reduce pastoralists’ and household income.
2
The risk of weight loss and death is particularly high in small ruminants, such as
sheep and goats. However, there is little domestic demand for such livestock and
small ruminants are therefore the dominant livestock traded. In order to reduce the
risks of livestock injury or death, and to maximize returns, pastoralists often wait
several years in order to sell their animals at a higher weight.
The establishment of a slaughterhouse in the region will enhance demand for small
ruminants. The concomitant reduction in herd size will ensure more and better
quality pasture, such that animals will gain weight in a shorter period of time.
Meat produced by the abattoir will be sold in the Middle East-a new market for the
region’s pastoralists. The abattoir has also raised pastoralists’ income in drought
years when herds are de-stocked, helping to minimize pastoralists’ losses and to
cover the cost of feeding the rest of the herd.
Before the construction of the slaughterhouse, there was no commercial abattoir in
the Somali region of Ethiopia. Indeed, political instability in the region has prevented
private-sector investment in the area for some time.
The Pastoralists Resilience Improvement and Market Development (PRIME) is a
USAID program, which operates projects that aim to improve the resilience of
pastoralists in Ethiopia. The PRIME program forms part of the larger Feed the Future
(FtF) program, which supports sustainable investments in profitable and relatively
simple interventions in agricultural value chains, to diminish destitution, poverty, and
hunger (Mercy Corps, 2015).
3
The success of projects such as the abattoir facility can play a critical role in
enhancing general well-being in the district, as well as in attracting new investors.
1.2 Aim of the Study
This study aims to determine the feasibility of an investment to construct a
slaughterhouse in Faafan village in the Somali region of Ethiopia—the Jijiga Export
Slaughterhouse (JESH). The ex-ante financial and economic returns and net benefits
to project stakeholders are also presented.
JESH project stakeholders comprise the private operator, smallholder livestock
producers, livestock traders, labor employed by the facility, and the Government of
Ethiopia.
The study uses data obtained by others in the course of site visits, to construct cost-
benefit analysis (CBA) models of the intervention. The CBA models are designed to
assess the financial and economic outcomes of the intervention, i.e. financial net
present value (FNPV), economic net present value (ENPV), and financial rate of
return (FIRR).
1.3 Methodology
The financial and economic models are based on a new approach called FAST
modeling—flexible, appropriate, structured and transparent. FAST financial
modeling relies on a series of principles to guide the structure and design of effective
spreadsheets (fast-standard, 2014).
4
After constructing the model, sensitivity analysis is carried out to determine the
impact of crucial input variables on various outputs, highlighting potential distinctive
effects of critical and risky variables.
1.4 Structure
A brief structure of the study is as follows:
The main focus of the study has been explained in chapter Ι.
Chapter ΙΙ presents the project background, providing insight into the current
situation in the Somali region, and reasons for establishing the JESH facility.
Chapter ΙΙΙ provides a brief overview of the methodology used in this study,
including financial, economic and risk analysis. This chapter also explains the FAST
Modeling Standard, how it works, and its benefits.
Chapters ΙV and V and VI present the results of the financial and the economic
analysis, respectively, along with a discussion of essential findings.
5
Chapter 2
LITERATURE REVIEW
2.1 Background
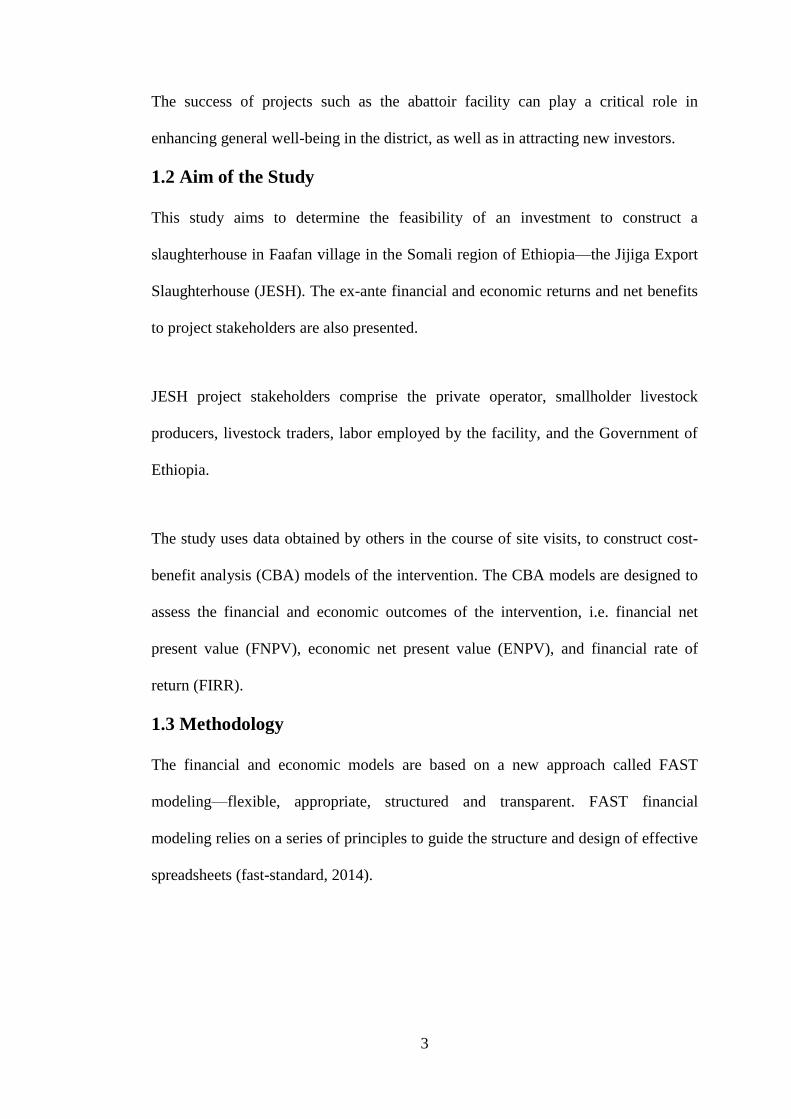
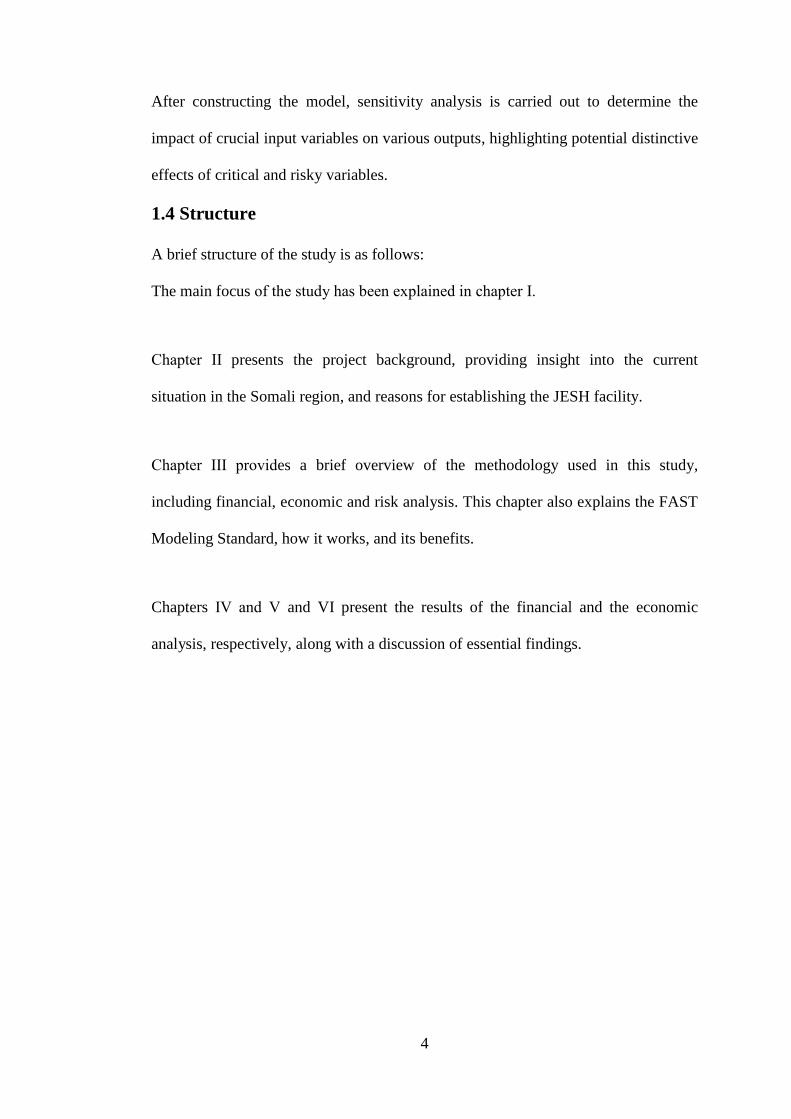
The Federal Democratic Republic of Ethiopia is situated in Eastern Africa, covering
an area of 1,250,000 Km2. The population of Ethiopia is 84 million (World Bank,
2012), with over 84% of the population residing in zones dominated by agriculture
(Hare, 2007).
Figure 2.1: Map of Ethiopia and Neighboring Countries
According to (World Bank, 2012) estimates over 30 percent of Ethiopians live in
poverty. Average annual per capita income of $390 is low compared to other sub-
Saharan African countries (GNI, Atlas Method).
6
Ethiopia’s economy is predominantly agrarian with the greatest number of livestock
in Africa—including 31 million sheep and 35 million goats (Negassa, Shahidur and
Gebremedhin, 2011). In many areas, livestock is the main or only source of
household income. As a consequence, livestock is a key contributor to the farming
sector as well as to overall GDP, accounting for 12 to 15 percent of GDP and around
25 to 30 percent of agricultural GDP (Deressa, 2006). The key livestock value chains
are cattle, camels, sheep, and goats.
There are two climate sub-systems in Ethiopia: the highlands, which are 1500 meters
above sea level and account for 40 percent of the country’s territory and around 60
percent of its livestock (Legese et al, 2014); and the lowlands, home to some 12
million pastoralists, who rely on livestock for their living (Negassa and Jabbar,
2008).
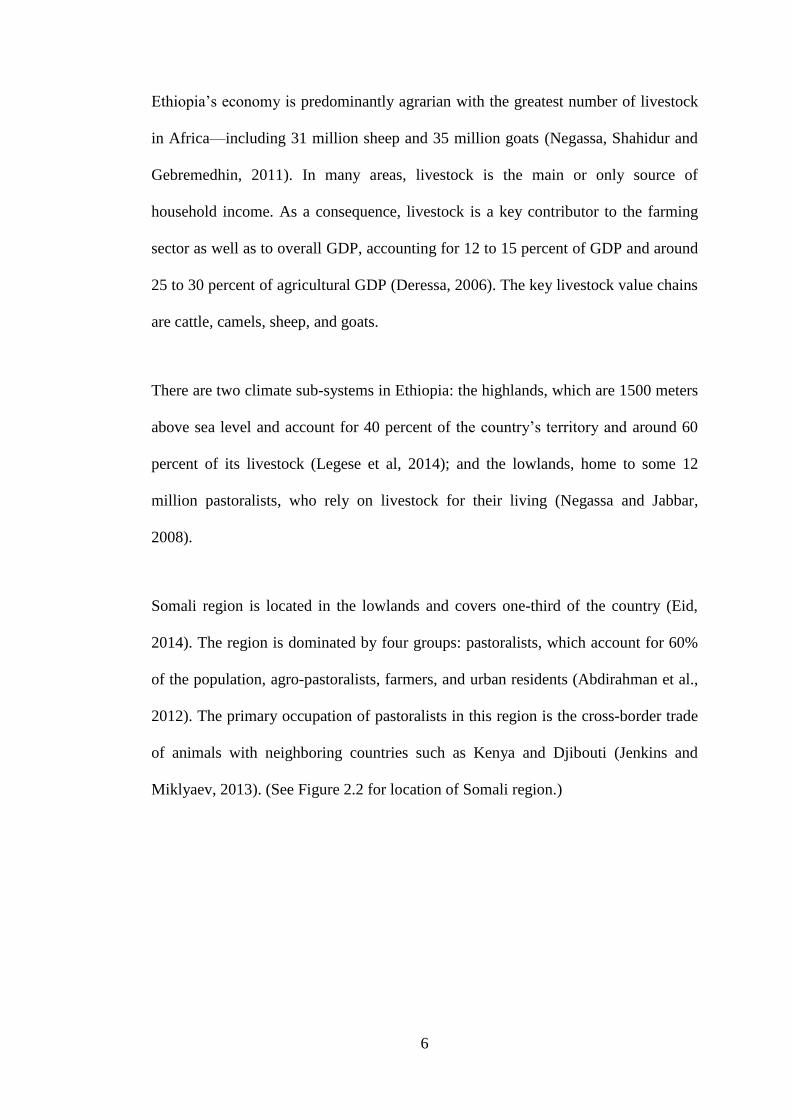
Somali region is located in the lowlands and covers one-third of the country (Eid,
2014). The region is dominated by four groups: pastoralists, which account for 60%
of the population, agro-pastoralists, farmers, and urban residents (Abdirahman et al.,
2012). The primary occupation of pastoralists in this region is the cross-border trade
of animals with neighboring countries such as Kenya and Djibouti (Jenkins and
Miklyaev, 2013). (See Figure 2.2 for location of Somali region.)
7
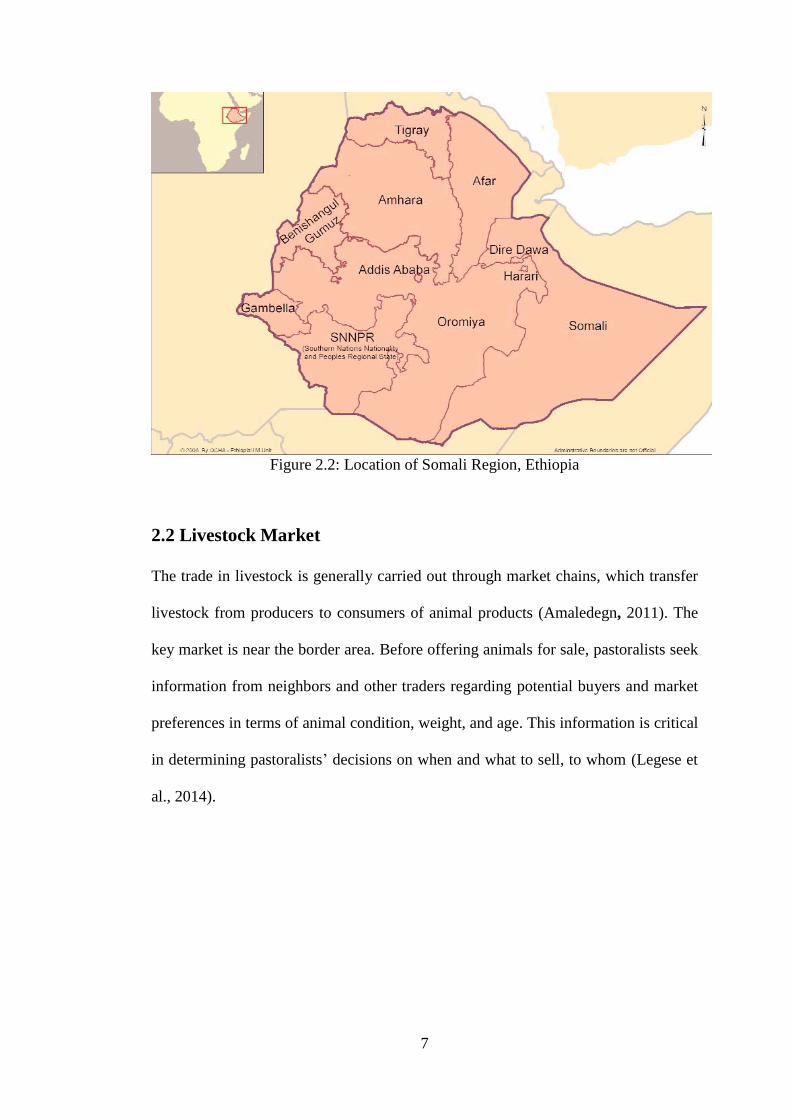
Figure 2.2: Location of Somali Region, Ethiopia
2.2 Livestock Market
The trade in livestock is generally carried out through market chains, which transfer
livestock from producers to consumers of animal products (Amaledegn, 2011). The
key market is near the border area. Before offering animals for sale, pastoralists seek
information from neighbors and other traders regarding potential buyers and market
preferences in terms of animal condition, weight, and age. This information is critical
in determining pastoralists’ decisions on when and what to sell, to whom (Legese et
al., 2014).
8
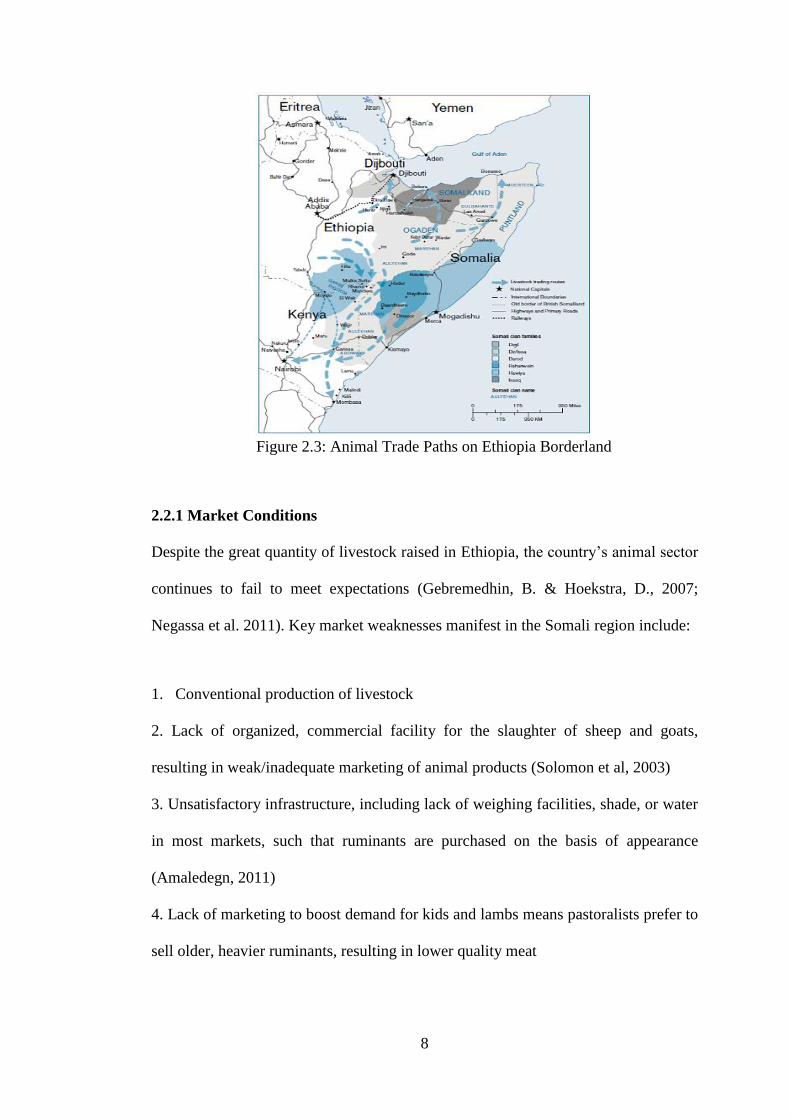
Figure 2.3: Animal Trade Paths on Ethiopia Borderland
2.2.1 Market Conditions
Despite the great quantity of livestock raised in Ethiopia, the country’s animal sector
continues to fail to meet expectations (Gebremedhin, B. & Hoekstra, D., 2007;
Negassa et al. 2011). Key market weaknesses manifest in the Somali region include:
1. Conventional production of livestock
2. Lack of organized, commercial facility for the slaughter of sheep and goats,
resulting in weak/inadequate marketing of animal products (Solomon et al, 2003)
3. Unsatisfactory infrastructure, including lack of weighing facilities, shade, or water
in most markets, such that ruminants are purchased on the basis of appearance
(Amaledegn, 2011)
4. Lack of marketing to boost demand for kids and lambs means pastoralists prefer to
sell older, heavier ruminants, resulting in lower quality meat
9
5. Cross-border trade controlled by neighboring-country traders who keep prices
down, to the disadvantage of Ethiopian pastoralists (Jenkins & Mikleaev, 2013)
6. Lack of integration of pastoralists in the marketing chain, leaving them vulnerable
to changes in trading routes due to conflict or drought, and unable to sell their
livestock (Devereux, 2006)
7. Lack of efficient destocking mechanism (abattoir) to support pastoralists in times
of drought, when small ruminants lose weight or die, impacting pastoralist and
household income.
8. Distance to market, leading to weight loss and death of ruminants trekked or
trucked in difficult conditions
2.2.2 Livestock Transportation
Livestock for sale must be delivered to market, by trekking, trucking or a
combination of both—a journey that can take from several hours to several days
(Jabbar & Ayele, 2004).
2.2.2.1 Livestock Transportation Problems and Consequences
The transport and handling of livestock presents a number of challenges with adverse
consequences:
1. Sub-standard roads and trekking routes lead to animal injury and weight loss, as
well as increasing transportation costs and reducing pastoralists’ and household
income (Pavanello, 2010)
2. Lack of vehicles appropriate to the transport of live animals (Yami, 2010)
3. Lack of driver and handler knowledge on avoiding livestock losses, injury, and
stress
4. Lack of training in the loading and unloading of live animals and lack of
infrastructure such as ramps (Yami, 2010).
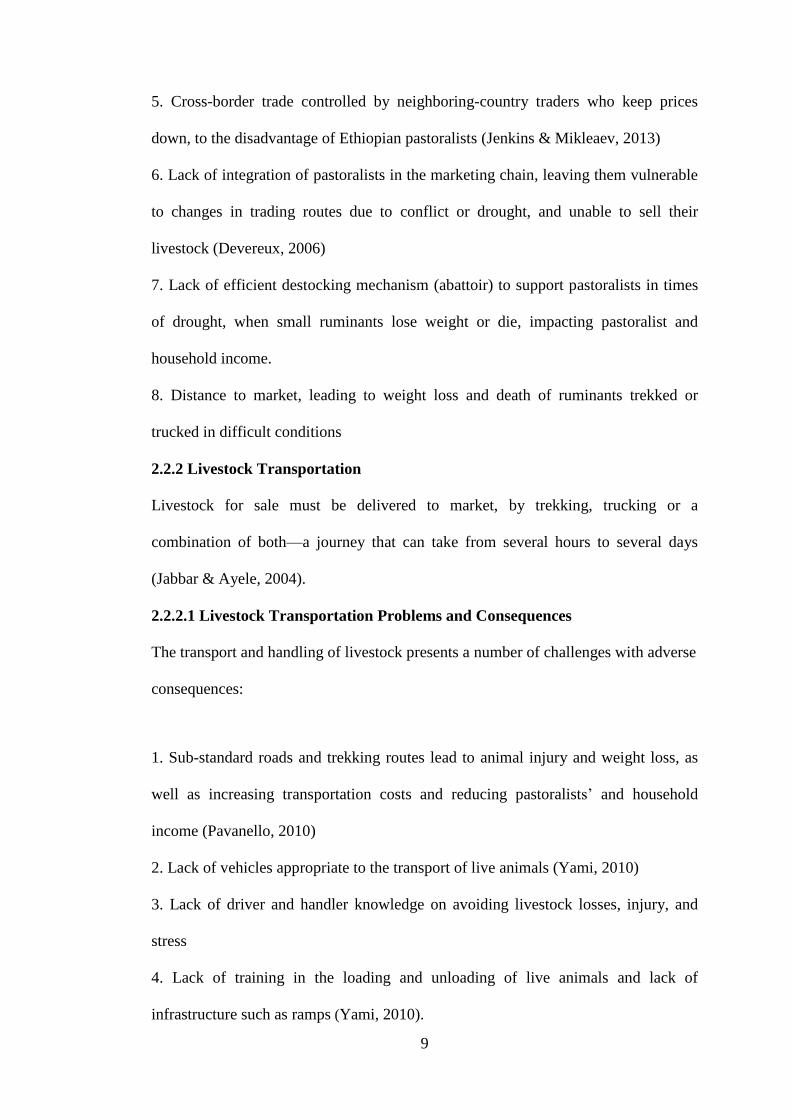
10
Figure 2.4: Examples of Livestock Loading and Unloading
5. Lack of water, feed, or rest during animal transport, often at high temperatures,
leading to death by dehydration or exhaustion, reduced quality of animal products,
and lower pastoralists’ profit
2.2.3 Actors in the Livestock Value Chain
“The livestock value chain involves different actors and agents: pastoralists
(producers), domestic buyers (small traders, wholesalers, and butchers), abattoir
facilities, livestock exporters, brokers, and consumers” (Legese et al., 2014).
2.2.3.1 Brokers
Brokers are one of the most important actors in the market for livestock, connecting
pastoralists (sellers) to consumers (buyers). The role of a broker varies by location.
In Somali region, each pastoralist is a member of a clan and should give his livestock
to the clan broker, who is obliged to offer the animals at the predominant market
price in return for a fixed amount per animal as commission (Aklilu & Catley, 2010).
The Somali region livestock market is controlled by (buyers’) brokers from
neighboring countries who, naturally, try to keep prices low. In addition, buyers’ and
sellers’ brokers often conspire to conceal the final sale price from the producer
(Jenkins & Miklyaev, 2013).
11
2.2.3.2 Export Abattoirs
Of the 11 export slaughterhouses once operational in Ethiopia, six have closed while
the remaining five operate at less than 50 percent of capacity (ITAB-CONSULT
PLC, 2006). This underperformance restricts Ethiopia’s potential foreign-exchange
earnings.
Export abattoirs purchase livestock at the slaughterhouse gates or through their own
agents, exporting processed products mainly to the Middle East and North Africa.
Animals are purchased by weight, after resting for a day in the slaughterhouse
holding area. This delay reduces the common practice of over-watering livestock in
order to increase their weight. Pastoralists are paid 24 hours after purchase, with
higher prices paid to producers who can provide the abattoir with a large number of
livestock within a period of less than a week (Fadiga, 2014).
2.3 USAID PRIME Program
“A five-year USAID activity in Ethiopia called PRIME has as its main goal is to
improve the lifestyle of the people in Ethiopia and enhance households’ income. The
USAID Ethiopia PRIME venture is part of the more extensive strategy of the Feed
the Future (FtF) programs. FtF’s aim is to diminish destitution, poverty and hunger.
The PRIME program plans to contribute about one third of the investment cost
needed to start construction of a new abattoir facility” (Mercy Corps, 2013).
2.4 Jijiga Export Slaughterhouse
The Jijiga Export Slaughterhouse aims to provide a world-class commercial abattoir
and animal-fattening facility, with the goal of improving the livelihoods of Ethiopian
pastoralists (Jeshplc, 2012). In addition to improving market linkages for more than
12
500,000 livestock producers, the facility will also create between 100 and 1,000 new
job for people of the region (Business Portal, 2011).
The JESH facility will have the capacity to process 200 large animals (i.e., cattle)
and 2,000 small animals (i.e. sheep and goats) per shift, operating two shifts per day
during periods of drought. The facility will have a storage capacity of over 300
tons—far greater than that of existing abattoirs. Facilities for the slaughter of camels
are also to be introduced over the course of the project (Jeshplc, 2012). Output of red
meat, carcasses, skin/hides, and edible offal will be sold to neighboring countries as
well as Asia, with possible additional markets in Italy, Sweden, and Denmark.
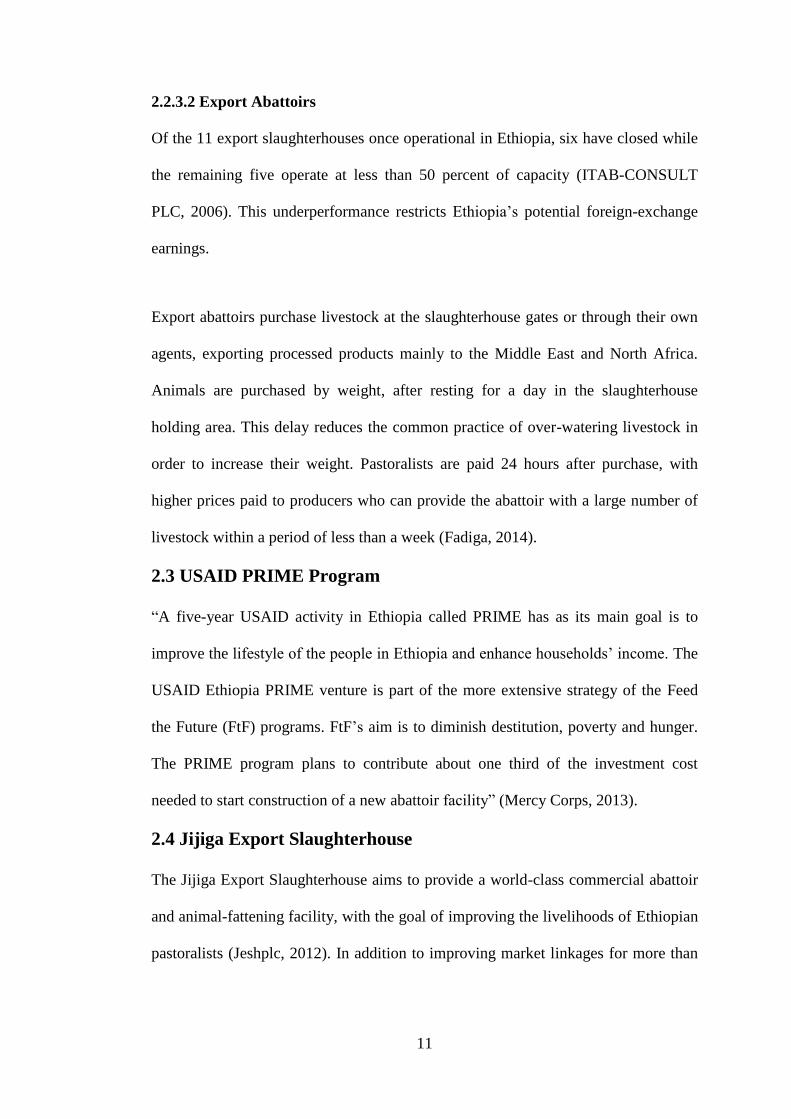
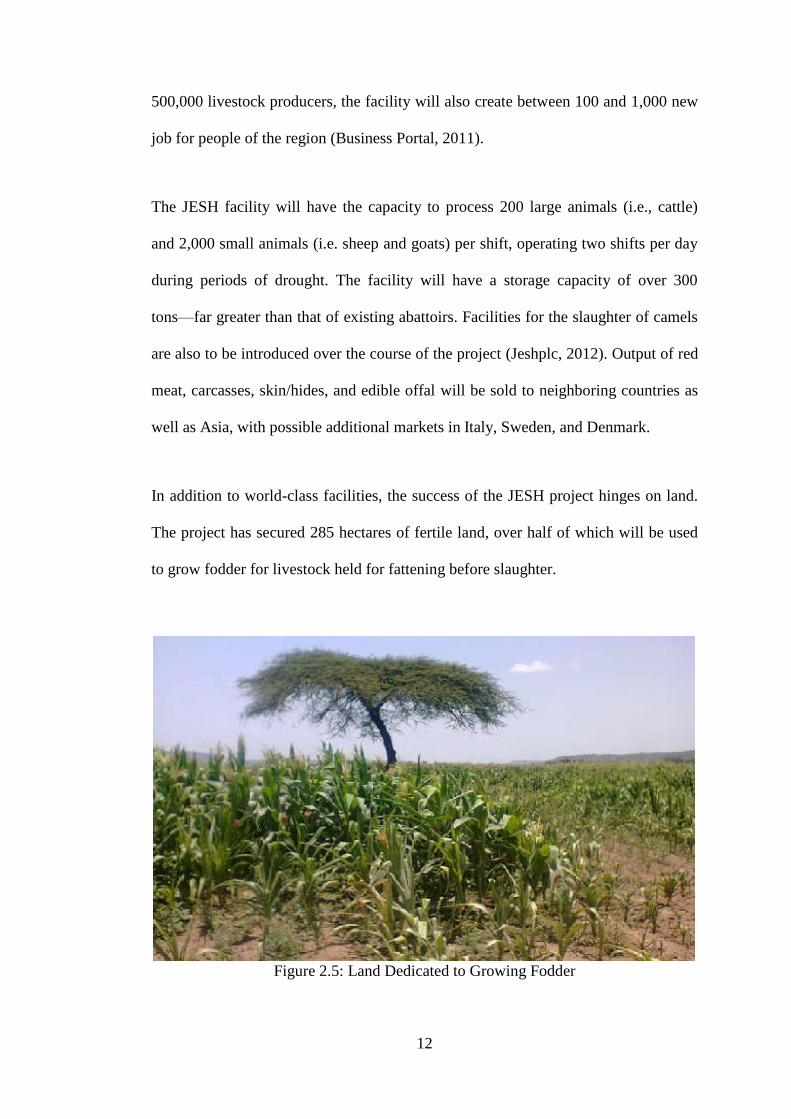
In addition to world-class facilities, the success of the JESH project hinges on land.
The project has secured 285 hectares of fertile land, over half of which will be used
to grow fodder for livestock held for fattening before slaughter.
Figure 2.5: Land Dedicated to Growing Fodder
13
2.4.1 Challenges faced by JESH
Despite the fact that 90 percent of livestock and pastoralists live in the lowlands,
there is no commercial abattoir in the region (Business Portal, 2011). Three main
issues have restricted private-sector investment, posing challenges to JESH:
1. Political instability and conflict in Ethiopia and the Somali region in particular
have destabilized the local economy for over a decade (Gathege, 2012)
2. Extremely limited regional transport infrastructure will require JESH to provide
livestock producers with new road access, without which herds must be trekked,
resulting in weight loss and lower meat quality
3. Religious strictures against the taking of loans and the payment of interest limit the
JESH facility investor’s access to capital
2.4.2 JESH Benefits
The JESH facility presents major potential benefits for the regional economy, as well
as significantly improving pastoralists’ lives and livelihoods, by:
1. Generating reliable local demand for livestock, decreasing transport costs and
increasing pastoralists’ profit through off-take contracts (Jenkins and Miklyaev,
2013)
2. Establishing an export market in the Middle East, where demand for small
ruminants (21-25 kg) is high compared to the local market
3. Operating double-shifts during periods of drought so that pastoralists can rapidly
destock, using earnings to fatten remaining livestock
4. Contributing 2.5 percent of revenue to the community, bolstering the local
economy and gaining people’s trust

14
5. Additional incentives for pastoralists who can provide large numbers of livestock
within short periods of time
15
Chapter 3
METHODOLOGY
3.1 Introduction
This study conducts a cost-benefit analysis (CBA) of the proposed intervention to
assess its financial and economic outcomes in terms of financial net present value
(FNPV), economic net present value (ENPV), and financial rate of return (FIRR).
This is followed by a sensitivity analysis. FAST modeling standards are employed
throughout.
3.2 Financial Analysis
The financial analysis of a venture is undertaken to determine whether a given
project is financially feasible over its planned lifetime. Using cost-benefit analysis to
assess financial feasibility reduces the possibility that an unviable project is pursued,
while providing insights to improve project profitabilty.
3.3 Costs-Benefit Analysis (CBA)
Cost-benefit analysis (CBA) facilitates financial and economic decision-making, by
assessing the potential costs of a new project compared to anticipated benefits to
determine project viability.
3.3.1 Price Index and Exchange Rates
The output values of a project are usually expected to change over the project’s
lifetime. These changes, which can be in nominal or real terms, must be consider at
each stage of the project. Unanticipated changes in prices and costs are likely to have
a serious impact on project outcomes.
16
A basic task in financial modeling is to build an estimation of nominal prices, taking
account of expect rates of inflation as well as anticipated changes in real prices. The
financial model used in this study calculated price indices over the life of the project,
using annual base rates of inflation and changes in items’ real values, reducing the
chance of error due to inconsistent assumptions regarding prices in calculating
project outcomes.
3.3.2 Cash-flow Statements
A cash-flow statement indicates annual cash flows generated by project operations.
In general, the cash-flow statement is used to illustrate the financial position of a
business. In this case, JESH project cash-flow statements are prepared in nominal
and real terms over the 20-year lifetime of the project. Real-price cash-flow
statements are derived for each year by dividing annual nominal cash flows by the
price index for that year.
3.3.3 Financial Evaluation Criteria
Projects can be appraised according to a variety of criteria, of which net present
value (NPV) and internal rate of return (IRR) are the most reliable and commonly
used in business evaluations.
3.3.3.1 Net Present Value (NPV)
Net present value is the estimated discounted value of a particular stream of future
cash flows, expressed in present-day corresponding currency values (Equation 3.1).
Net present value is obtained by comparing the initial investment cost to the value of
future net project cash flows.
In this study, net present value is calculated in real terms, from two perspectives:
total investment and the owner’s points of view.
17
∑( )
( )
Equation 3.1: Net Present Value
3.3.3.2 Internal Rate of Return (IRR)
The second criteria used in evaluating a proposed project is internal rate of return
(IRR)—an approach commonly used in both private- and public-sector projects.
Similarly to NPV, IRR is calculated in real terms, from the perspective of total
investment and the owner’s point of view. However, IRR alone cannot provide a
reliable indicator for investment decision-making.
3.3.4 Sensitivity Analysis
The first step in analyzing business risk is to identify key risk variables—parameters
susceptible to small changes with significant effects on model outcomes for values
such as FNPV or ENPV.
The financial analysis conducted for this study incorporated sensitivity analysis for
ten critical variables and line items, to establish their impact on project FNPV and
FIRR.
3.4 Economic Appraisal
Similarly to financial analysis, economic analysis is a means of assessing all project
costs and benefits. However, rather than just considering the project owner’s
perspective, economic analysis considers the impact of a project on society as a
whole.
18
The model’s economic appraisal consists of an economic resource-flow statement, a
statement of economic externalities, and the reconciliation of the economic, the
financial, and externalities, followed by distributive analysis, and stakeholder and
beneficiary analysis, in order to determine the project effect on the broader society.
3.4.1 Economic Externalities
The outcomes of financial and economic analyses differ, because some externalities
are not included in financial values. Such externalities include:
1. Taxes are levied on domestically sourced inputs as well as on the foreign-
exchange earnings on exported output, resulting in a change in total government tax
collections
2. Provision of a reliable, local, easily accessible market for small ruminants is likely
to increase the price for small ruminants, to the pastoralists’ net benefit
3.4.2 Beneficiary Analysis
There are seven groups of stakeholders who will benefit from the JESH facility:
1. Government of Ethiopia, in terms of
a. taxes on production inputs
b. foreign exchange earned from exports
c. taxes on income earned by 133 workers JESH employees
d. 8 percent social insurance on workers’ wages, payable by JESH
e. sales tax on livestock sold to JESH (levied at 10 ETB/head for small ruminants
and 100 ETB/head for large ruminants)
2. Pastoralists, who gain access to reliable, local facility, and rapid cash payment for
livestock
3. Laborers, who are to be paid above-market rates
19
4. Traders, who will be rewarded for providing large numbers of livestock to JESH
within short time periods, increasing the number of traders active in the region
5. Community of Faffan village, which will receive 2.5 percent of operational
income each year, building trust with local pastoralists and securing JESH access to
livestock
6. USAID, which is contributing one-third of project costs
7. Private investors, who benefit from decreased financing risk as a result of USAID
involvement
3.5 FAST Modeling Standards
FAST modeling standards are a set of rules that help to ensure that a model is
transparent, well structured, and easily understood by the various organizations
involved in its construction and use. FAST is:
Flexible: design and procedures must permit model to be both flexible in the short-
term and adjustable in the long-term. Model must permit different users to apply new
data and different scenarios, and to make adjustments over an extended period as
new data becomes available.
Appropriate: model must indicate key business presumptions specifically and
precisely without being over-constructed, and must not include non-essential
information.
Structured: strict consistency in model format and association, in order to maintain
logic and consistency over time and between users.
Transparent: use straightforward and simple equations easily understood by
modelers and non-modelers alike. Suggestions that enhance transparency of the
model will also help the model to be more flexible.
20
3.5.1 Workbook Design Rules
Workbooks should be divided according to the following:
1. Foundation
a. Two sheets dedicated to inputs—input constant and input series
b. One timesheet, incorporating flags, start date, end date, and other critical dates and
periods
c. One temporary sheet
2. Workings (Model Engine)
All calculations are conducted in and results obtained from the model engine.
3. Presentation
Includes statements, charts and inputs. When the model is completed, inputs move to
the input sheet, and all links are replaced.
4. Controls
Includes track sheet, check box, and control for sensitivities.
3.5.2 Worksheet Rules
A number of rules should be followed in the worksheet, as discussed below.
3.5.2.1 Worksheet Design
According to FAST standards, each worksheet is divided into two—columns A-I on
the left, and columns J onwards on the right. Each column is dedicated to a unique
purpose. Columns A, B, C, and D are dedicated to section and sub-section labels,
column F to line labels. Constant numbers, units, and row totals apply to columns F,
G, and H, respectively. Columns J onwards are used for calculations.
FAST modeling also makes consistent use of color: links are blue; exported links are
red; and counter-flows are gray.
21
3.5.2.2 Calculation Blocks
The calculation block is a key min feature of the FAST modeling approach. Used to
increase model readability, the calculation block contains all the components
(equations) of the formula used in model calculations.
3.5.2.3 Check Box
A check box is linked to every sheet, tracking all calculations in order to assess if the
model is working correctly. This function enables the modeler to spot
miscalculations and fix the problem in each section.
3.5.3 Multiple Worksheets
Another principle of FAST modeling is to establish separate sheets for the
calculation of tax, investment cost, financial statement, sensitivity analysis, and so
on, enabling the modeler to easily locate and fix problems. This approach also takes
advantage of the Excel program function to flag and recall selected areas of given
sheets. The approach is not recommended in the case of complicated models,
however, as the number of sheets created may be unmanageable.
22
Chapter 4
FINANCIAL ANALYSIS
4.1 Introduction
This study undertakes a financial and economic appraisal of investment to build the
Jijiga Export Slaughterhouse (JESH) in Faafan village in the Somali region of
Ethiopia—a facility that could have an important impact on the future of the region
and country as a whole.
4.2 Project Description
The aim of this study is to determine the financial and economic outcomes associated
with the establishment of a commercial slaughterhouse in the Somali region of
Ethiopia, through cost-benefit analysis using data gathered in the course of field
visits (Jenkins and Miklyaev, 2013).
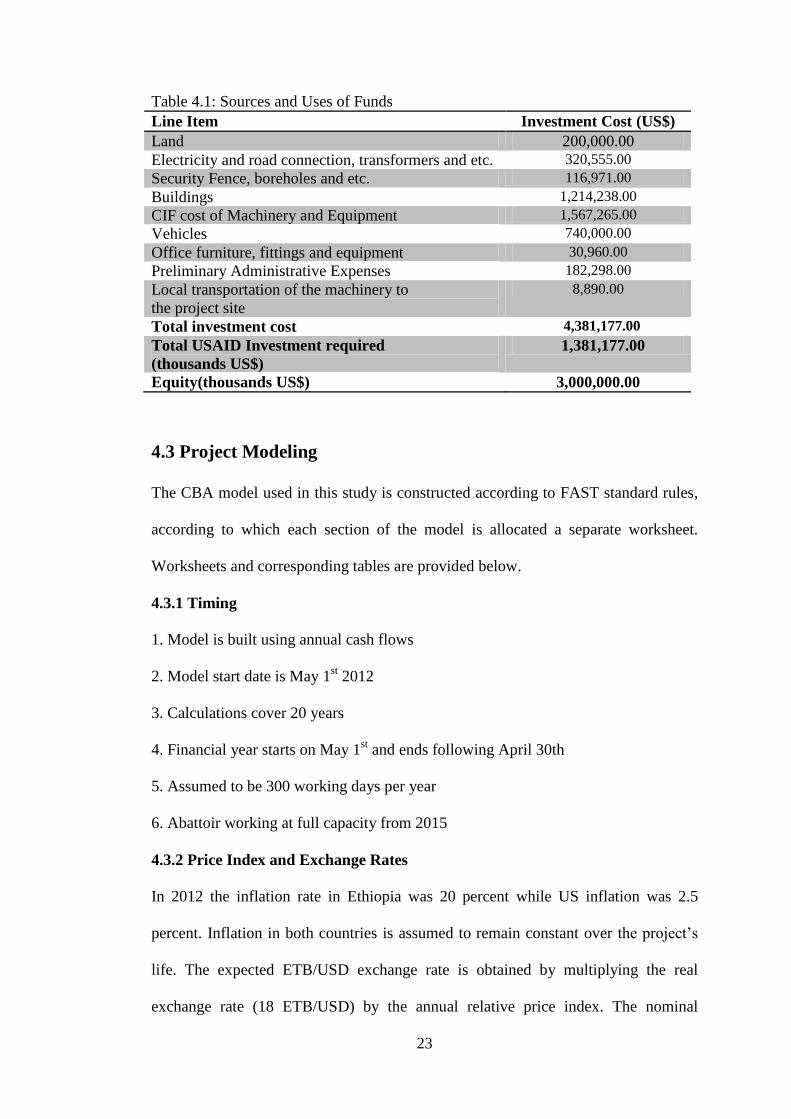
The private investor in the JESH facility is an observant Muslim who, in accordance
with religious strictures, is unwilling to pay interest on a loan. (There is no Islamic
bank serving the region.) The project is therefore not financed by a loan: instead,
USAID will grant the private investor one-third of the investment cost—a sum of
USD 1,387,177—while the Ethiopian government has agreed to install the electricity
required, at a cost of USD 320,555. (Currencies used in this study are the Ethiopian
Birr (ETB) and United States dollar (USD).) See Table 4.1 for sources and uses of
funds
23
Table 4.1: Sources and Uses of Funds Line Item Investment Cost (US$)
Land 200,000.00
Electricity and road connection, transformers and etc. 320,555.00
Security Fence, boreholes and etc. 116,971.00
Buildings 1,214,238.00
CIF cost of Machinery and Equipment 1,567,265.00
Vehicles 740,000.00
Office furniture, fittings and equipment 30,960.00
Preliminary Administrative Expenses 182,298.00
Local transportation of the machinery to
the project site
8,890.00
Total investment cost 4,381,177.00
Total USAID Investment required
(thousands US$)
1,381,177.00
Equity(thousands US$) 3,000,000.00
4.3 Project Modeling
The CBA model used in this study is constructed according to FAST standard rules,
according to which each section of the model is allocated a separate worksheet.
Worksheets and corresponding tables are provided below.
4.3.1 Timing
1. Model is built using annual cash flows
2. Model start date is May 1st 2012
3. Calculations cover 20 years
4. Financial year starts on May 1st and ends following April 30th
5. Assumed to be 300 working days per year
6. Abattoir working at full capacity from 2015
4.3.2 Price Index and Exchange Rates
In 2012 the inflation rate in Ethiopia was 20 percent while US inflation was 2.5
percent. Inflation in both countries is assumed to remain constant over the project’s
life. The expected ETB/USD exchange rate is obtained by multiplying the real
exchange rate (18 ETB/USD) by the annual relative price index. The nominal
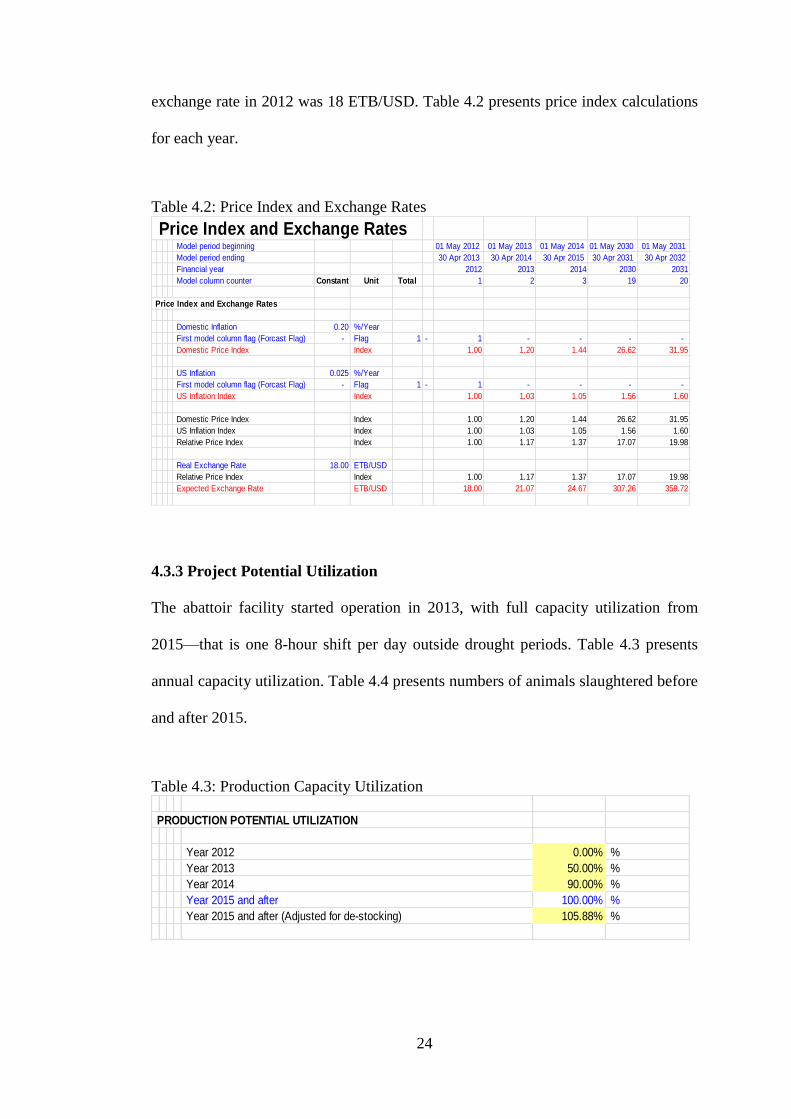
24
exchange rate in 2012 was 18 ETB/USD. Table 4.2 presents price index calculations
for each year.
Table 4.2: Price Index and Exchange Rates
4.3.3 Project Potential Utilization
The abattoir facility started operation in 2013, with full capacity utilization from
2015—that is one 8-hour shift per day outside drought periods. Table 4.3 presents
annual capacity utilization. Table 4.4 presents numbers of animals slaughtered before
and after 2015.
Table 4.3: Production Capacity Utilization
Price Index and Exchange Rates Model period beginning 01 May 2012 01 May 2013 01 May 2014 01 May 2030 01 May 2031
Model period ending 30 Apr 2013 30 Apr 2014 30 Apr 2015 30 Apr 2031 30 Apr 2032
Financial year 2012 2013 2014 2030 2031
Model column counter Constant Unit Total 1 2 3 19 20
Price Index and Exchange Rates
Domestic Inflation 0.20 %/Year
First model column flag (Forcast Flag) - Flag 1 - 1 - - - -
Domestic Price Index Index 1.00 1.20 1.44 26.62 31.95
US Inflation 0.025 %/Year
First model column flag (Forcast Flag) - Flag 1 - 1 - - - -
US Inflation Index Index 1.00 1.03 1.05 1.56 1.60
Domestic Price Index Index 1.00 1.20 1.44 26.62 31.95
US Inflation Index Index 1.00 1.03 1.05 1.56 1.60
Relative Price Index Index 1.00 1.17 1.37 17.07 19.98
Real Exchange Rate 18.00 ETB/USD
Relative Price Index Index 1.00 1.17 1.37 17.07 19.98
Expected Exchange Rate ETB/USD 18.00 21.07 24.67 307.26 359.72
PRODUCTION POTENTIAL UTILIZATION
Year 2012 0.00% %
Year 2013 50.00% %
Year 2014 90.00% %
Year 2015 and after 100.00% %
Year 2015 and after (Adjusted for de-stocking) 105.88% %
25
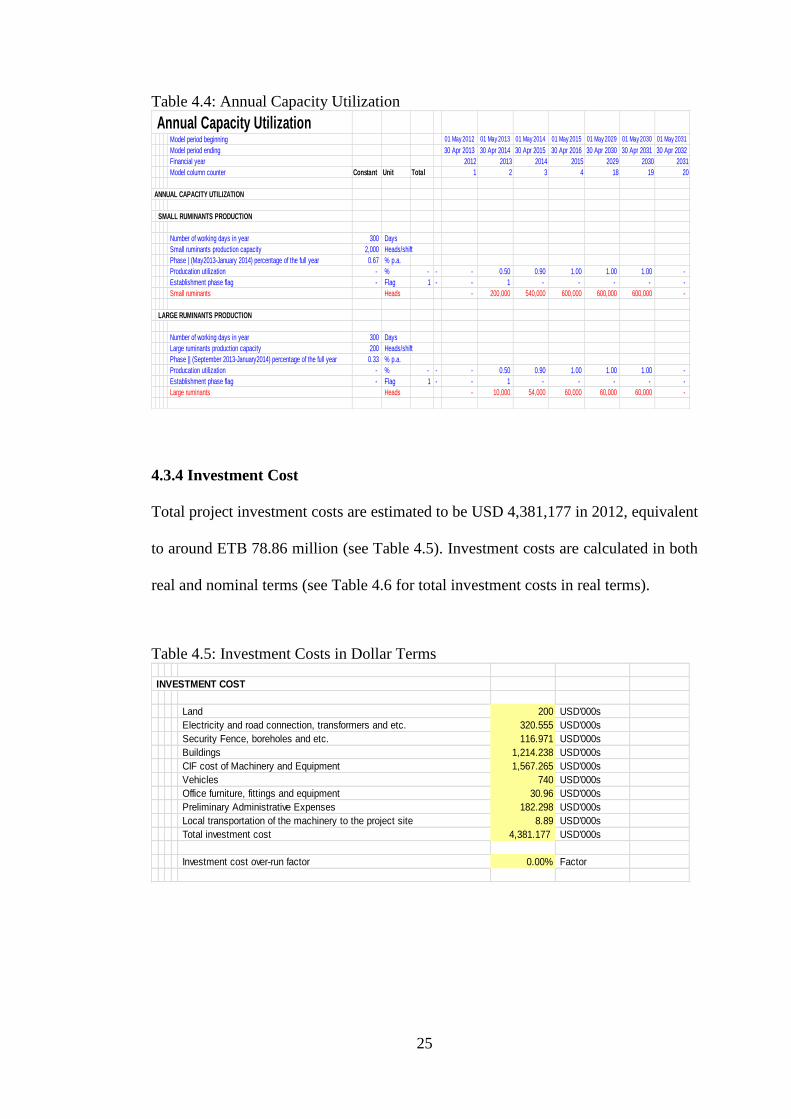
Table 4.4: Annual Capacity Utilization
4.3.4 Investment Cost
Total project investment costs are estimated to be USD 4,381,177 in 2012, equivalent
to around ETB 78.86 million (see Table 4.5). Investment costs are calculated in both
real and nominal terms (see Table 4.6 for total investment costs in real terms).
Table 4.5: Investment Costs in Dollar Terms
Annual Capacity Utilization Model period beginning 01 May 2012 01 May 2013 01 May 2014 01 May 2015 01 May 2029 01 May 2030 01 May 2031
Model period ending 30 Apr 2013 30 Apr 2014 30 Apr 2015 30 Apr 2016 30 Apr 2030 30 Apr 2031 30 Apr 2032
Financial year 2012 2013 2014 2015 2029 2030 2031
Model column counter Constant Unit Total 1 2 3 4 18 19 20
ANNUAL CAPACITY UTILIZATION
SMALL RUMINANTS PRODUCTION
Number of working days in year 300 Days
Small ruminants production capacity 2,000 Heads/shift
Phase | (May2013-January 2014) percentage of the full year 0.67 % p.a.
Producation utilization - % - - - 0.50 0.90 1.00 1.00 1.00 -
Establishment phase flag - Flag 1 - - 1 - - - - -
Small ruminants Heads - 200,000 540,000 600,000 600,000 600,000 -
LARGE RUMINANTS PRODUCTION
Number of working days in year 300 Days
Large ruminants production capacity 200 Heads/shift
Phase || (September 2013-January2014) percentage of the full year 0.33 % p.a.
Producation utilization - % - - - 0.50 0.90 1.00 1.00 1.00 -
Establishment phase flag - Flag 1 - - 1 - - - - -
Large ruminants Heads - 10,000 54,000 60,000 60,000 60,000 -
INVESTMENT COST
Land 200 USD'000s
Electricity and road connection, transformers and etc. 320.555 USD'000s
Security Fence, boreholes and etc. 116.971 USD'000s
Buildings 1,214.238 USD'000s
CIF cost of Machinery and Equipment 1,567.265 USD'000s
Vehicles 740 USD'000s
Office furniture, fittings and equipment 30.96 USD'000s
Preliminary Administrative Expenses 182.298 USD'000s
Local transportation of the machinery to the project site 8.89 USD'000s
Total investment cost 4,381.177 USD'000s
Investment cost over-run factor 0.00% Factor
26
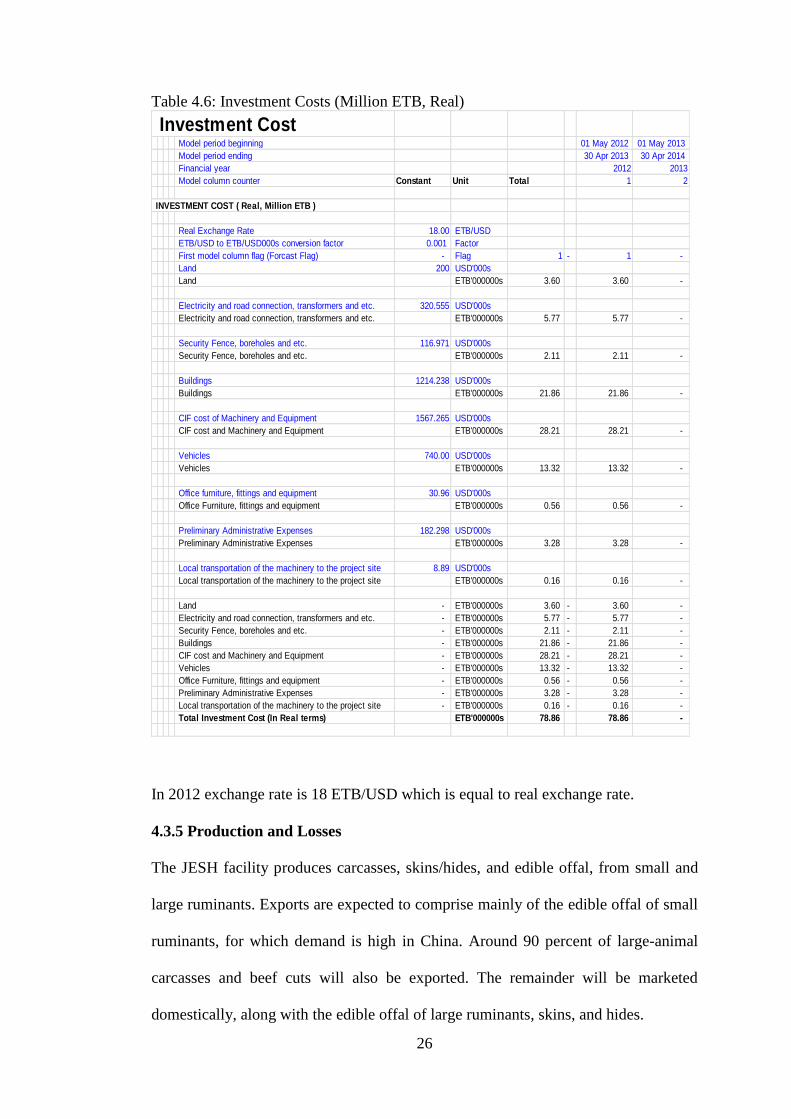
Table 4.6: Investment Costs (Million ETB, Real)
In 2012 exchange rate is 18 ETB/USD which is equal to real exchange rate.
4.3.5 Production and Losses
The JESH facility produces carcasses, skins/hides, and edible offal, from small and
large ruminants. Exports are expected to comprise mainly of the edible offal of small
ruminants, for which demand is high in China. Around 90 percent of large-animal
carcasses and beef cuts will also be exported. The remainder will be marketed
domestically, along with the edible offal of large ruminants, skins, and hides.
Investment Cost Model period beginning 01 May 2012 01 May 2013
Model period ending 30 Apr 2013 30 Apr 2014
Financial year 2012 2013
Model column counter Constant Unit Total 1 2
INVESTMENT COST ( Real, Million ETB )
Real Exchange Rate 18.00 ETB/USD
ETB/USD to ETB/USD000s conversion factor 0.001 Factor
First model column flag (Forcast Flag) - Flag 1 - 1 -
Land 200 USD'000s
Land ETB'000000s 3.60 3.60 -
Electricity and road connection, transformers and etc. 320.555 USD'000s
Electricity and road connection, transformers and etc. ETB'000000s 5.77 5.77 -
Security Fence, boreholes and etc. 116.971 USD'000s
Security Fence, boreholes and etc. ETB'000000s 2.11 2.11 -
Buildings 1214.238 USD'000s
Buildings ETB'000000s 21.86 21.86 -
CIF cost of Machinery and Equipment 1567.265 USD'000s
CIF cost and Machinery and Equipment ETB'000000s 28.21 28.21 -
Vehicles 740.00 USD'000s
Vehicles ETB'000000s 13.32 13.32 -
Office furniture, fittings and equipment 30.96 USD'000s
Office Furniture, fittings and equipment ETB'000000s 0.56 0.56 -
Preliminary Administrative Expenses 182.298 USD'000s
Preliminary Administrative Expenses ETB'000000s 3.28 3.28 -
Local transportation of the machinery to the project site 8.89 USD'000s
Local transportation of the machinery to the project site ETB'000000s 0.16 0.16 -
Land - ETB'000000s 3.60 - 3.60 -
Electricity and road connection, transformers and etc. - ETB'000000s 5.77 - 5.77 -
Security Fence, boreholes and etc. - ETB'000000s 2.11 - 2.11 -
Buildings - ETB'000000s 21.86 - 21.86 -
CIF cost and Machinery and Equipment - ETB'000000s 28.21 - 28.21 -
Vehicles - ETB'000000s 13.32 - 13.32 -
Office Furniture, fittings and equipment - ETB'000000s 0.56 - 0.56 -
Preliminary Administrative Expenses - ETB'000000s 3.28 - 3.28 -
Local transportation of the machinery to the project site - ETB'000000s 0.16 - 0.16 -
Total Investment Cost (In Real terms) ETB'000000s 78.86 78.86 -
27
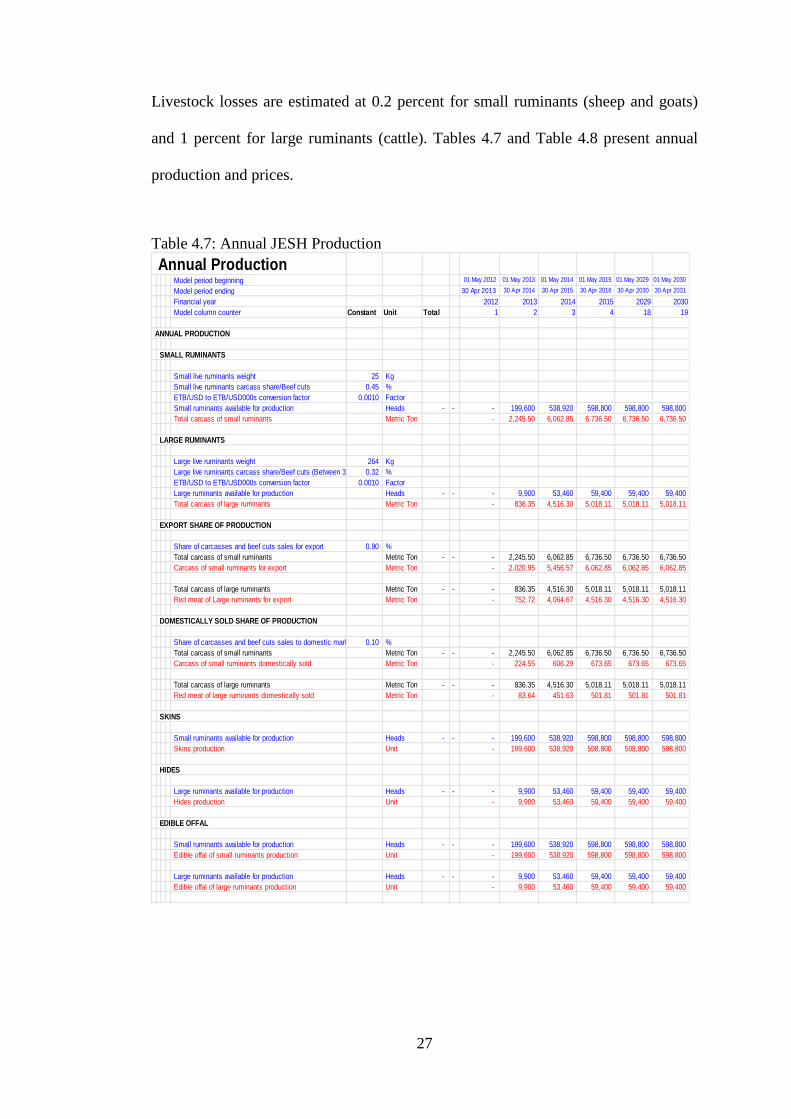
Livestock losses are estimated at 0.2 percent for small ruminants (sheep and goats)
and 1 percent for large ruminants (cattle). Tables 4.7 and Table 4.8 present annual
production and prices.
Table 4.7: Annual JESH Production
Annual Production Model period beginning 01 May 2012 01 May 2013 01 May 2014 01 May 2015 01 May 2029 01 May 2030
Model period ending 30 Apr 2013 30 Apr 2014 30 Apr 2015 30 Apr 2016 30 Apr 2030 30 Apr 2031
Financial year 2012 2013 2014 2015 2029 2030
Model column counter Constant Unit Total 1 2 3 4 18 19
ANNUAL PRODUCTION
SMALL RUMINANTS
Small live ruminants weight 25 Kg
Small live ruminants carcass share/Beef cuts 0.45 %
ETB/USD to ETB/USD000s conversion factor 0.0010 Factor
Small ruminants available for production Heads - - - 199,600 538,920 598,800 598,800 598,800
Total carcass of small ruminants Metric Ton - 2,245.50 6,062.85 6,736.50 6,736.50 6,736.50
LARGE RUMINANTS
Large live ruminants weight 264 Kg
Large live ruminants carcass share/Beef cuts (Between 32% - 35%)0.32 %
ETB/USD to ETB/USD000s conversion factor 0.0010 Factor
Large ruminants available for production Heads - - - 9,900 53,460 59,400 59,400 59,400
Total carcass of large ruminants Metric Ton - 836.35 4,516.30 5,018.11 5,018.11 5,018.11
EXPORT SHARE OF PRODUCTION
Share of carcasses and beef cuts sales for export 0.90 %
Total carcass of small ruminants Metric Ton - - - 2,245.50 6,062.85 6,736.50 6,736.50 6,736.50
Carcass of small ruminants for export Metric Ton - 2,020.95 5,456.57 6,062.85 6,062.85 6,062.85
Total carcass of large ruminants Metric Ton - - - 836.35 4,516.30 5,018.11 5,018.11 5,018.11
Red meat of Large ruminants for export Metric Ton - 752.72 4,064.67 4,516.30 4,516.30 4,516.30
DOMESTICALLY SOLD SHARE OF PRODUCTION
Share of carcasses and beef cuts sales to domestic market 0.10 %
Total carcass of small ruminants Metric Ton - - - 2,245.50 6,062.85 6,736.50 6,736.50 6,736.50
Carcass of small ruminants domestically sold Metric Ton - 224.55 606.29 673.65 673.65 673.65
Total carcass of large ruminants Metric Ton - - - 836.35 4,516.30 5,018.11 5,018.11 5,018.11
Red meat of large ruminants domestically sold Metric Ton - 83.64 451.63 501.81 501.81 501.81
SKINS
Small ruminants available for production Heads - - - 199,600 538,920 598,800 598,800 598,800
Skins production Unit - 199,600 538,920 598,800 598,800 598,800
HIDES
Large ruminants available for production Heads - - - 9,900 53,460 59,400 59,400 59,400
Hides production Unit - 9,900 53,460 59,400 59,400 59,400
EDIBLE OFFAL
Small ruminants available for production Heads - - - 199,600 538,920 598,800 598,800 598,800
Edible offal of small ruminants production Unit - 199,600 538,920 598,800 598,800 598,800
Large ruminants available for production Heads - - - 9,900 53,460 59,400 59,400 59,400
Edible offal of large ruminants production Unit - 9,900 53,460 59,400 59,400 59,400
28
Table 4.8: Price of Products Produced by the Facility
4.3.6 Labor Costs
Project labor costs for 2013 are associated with two operational phases: Phase I—the
slaughter of small ruminants (eight-month period), and Phase II—the slaughter of
large ruminants (four-month period).
Phase I required skilled and unskilled laborers, with additional laborers required for
Phase II. The number of laborers increases in drought periods, when the abattoir
operates two six-hour shifts instead of the single eight-hour shift. (See Table 4.6 for
number of skilled and unskilled labors in Phase I, and total number of laborers.)
The wages paid to laborers employed by JESH will increase by 5 percent each
year—above the average wage increase rate in Ethiopia. In addition, the private
investor is committed to contributing a further 8 percent in social insurance. (See
Tables 4.9 and 4.10 for real average labor costs and annual labor costs, respectively.)
Table 4.9: Number of Laborers
Red meat of small ruminants 5.20 USD/Kg
Red meat of large ruminants 4.40 USD/Kg
Skins 40 ETB/Skin
Hides 120 ETB/Hide
Edible offal of small ruminants 57.50 ETB/Head
Edible offal of large ruminants 190.00 ETB/Head
Number of labors
Number of skilled labor in phase one 27 #
Number of unskilled labor in phase one 40 #
Skilled labor 68 #
Unskilled labor 65 #
Total number of labors 133 #
29
Table 4.10: Real Average Labor Cost
Table 4.11: Annual Labor Cost
Real average labor cost
Skilled labor 60.71029 ETB'000s/Year
Unskilled labor 30.11538 ETB'000s/Year
Average real increase in labor wages in Ethiopia 2.00% %/Year
Change in real labor wages 5.00% %/Year
Social insurance contribution by the employee 8.00% %/Year
Annual Labor Cost Model period beginning 01 May 2013 01 May 2014 01 May 2029 01 May 2030 01 May 2031
Model period ending 30 Apr 2014 30 Apr 2015 30 Apr 2030 30 Apr 2031 30 Apr 2032
Financial year 2013 2014 2029 2030 2031
Model column counter Constant Unit Total 2 3 18 19 20
ANNUAL LABOR COST USING 2% REAL INCREASE IN WAGES (Real, Million ETB)
Number of skilled labor in phase one 27 #
Skilled labor 68 #
ETB/USD to ETB/USD000s conversion factor 0.0010 Factor
Phase | (May2013-January 2014) percentage of the full year 0.67 % p.a.
Skilled labor cost using 2% real increase in wages ETB'000s - - 60.71 61.92 83.34 85.01 -
Establishment phase flag Flag 1 - 1 - - - -
Annual skilled labor cost using 2% real increase in wages ETB'000000s 1.09 4.21 5.67 5.78 -
Number of unskilled labor in phase one 40 # Phase || (September 2013-January2014) percentage of the full year 0.33 % p.a.
Unskilled labor 65 #
Unskilled labor cost using 2% real increase in wages ETB'000s - - 30.12 30.72 41.34 42.17 -
Annual unskilled labor cost using 2% real increase in wages ETB'000000s 0.40 2.00 2.69 2.74 -
Social insurance contribution by the employee 0.08 %
Annual skilled labor cost using 2% real increase in wages ETB'000000s - - 1.09 4.21 5.67 5.78 -
Annual unskilled labor cost using 2% real increase in wages ETB'000000s - - 0.40 2.00 2.69 2.74 -
Social insurance contribution by employer ETB'000000s 0.12 0.50 0.67 0.68 -
Annual skilled labor cost using 2% real increase in wages ETB'000000s - - 1.09 4.21 5.67 5.78 -
Annual unskilled labor cost using 2% real increase in wages ETB'000000s - - 0.40 2.00 2.69 2.74 -
Social insurance contribution by employer ETB'000000s - - 0.12 0.50 0.67 0.68 -
Total labor cost ETB'000000s 1.61 6.70 9.02 9.20 -
ANNUAL LABOR COST USING 2% REAL INCREASE IN WAGES (Nominal, Million ETB)
Domestic Price Index Index - - 1.20 1.44 22.19 26.62 31.95
Annual skilled labor cost using 2% real increase in wages ETB'000000s - - 1.09 4.21 5.67 5.78 -
Annual skilled labor cost using 2% real increase in wages ETB'000000s 1.31 6.06 125.73 153.90 -
Annual unskilled labor cost using 2% real increase in wages ETB'000000s - - 0.40 2.00 2.69 2.74 -
Annual unskilled labor cost using 2% real increase in wages ETB'000000s 0.48 2.88 59.62 72.97 -
Social insurance contribution by employer ETB'000000s - - 0.12 0.50 0.67 0.68 -
Social insurance contribution by employer ETB'000000s 0.14 0.72 14.83 18.15 -
Annual skilled labor cost using 2% real increase in wages ETB'000000s - - 1.31 6.06 125.73 153.90 -
Annual unskilled labor cost using 2% real increase in wages ETB'000000s - - 0.48 2.88 59.62 72.97 -
Social insurance contribution by employer ETB'000000s - - 0.14 0.72 14.83 18.15 -
Total labor cost ETB'000000s 1.94 9.65 200.18 245.02 -
30
4.3.7 Cost of Inputs
There are three types of project production input costs:
1. Direct costs (fuel, packaging of livestock, utility costs)
2. Indirect costs (uniforms, CIF of chemicals)
3. Overheads (bank charges, office expenses)
Table 4.12 presents costs of inputs.
Table 4.12: Production Input Costs
4.3.8 Working Capital
One reason for the underperformance of slaughterhouse facilities in Ethiopia is weak
market linkages with livestock producers. Sustaining a high volume of
slaughterhouse output depends on a steady supply of livestock, which in turn
OTHER DIRECT COSTS
Transportation cost of Chilled meat delivery to Addis-Ababa 1.70 ETB/Kg
Transportation charge for delivery of frozen beef to Djibouti 2.00 ETB/Kg
Packaging of small ruminants 9.00 ETB/Carcass
Packaging of large ruminants 2.00 ETB/Kg
UTILITIES
Cost of Electricity 0.69 ETB/KWh
Fixed electricity consumption 152,000 KW
Electricity consumption Large ruminants 6.94 KWH/Head
Electricity consumption small ruminants 0.14 KWH/Head
Generator Fuel consumption 63.00 Liters/Hour
Number of hours running generator 48.00 Hours/Year
Fuel Cost 18.00 ETB/Liter
INDIRECT COSTS
Cost of uniforms 135 ETB'000s/Year
Telephone and Postage (First Year) 180 ETB'000s/Year
Telephone and Postage (Second Year) 540 ETB'000s/Year
Printing and Stationery 18 ETB'000s/Year
CIF Cost of chemicals 18 ETB'000s/Year
OVERHEADS COSTS
Certifications and Licenses 18 ETB'000s/Year
Health Insurance for Employees 100 ETB'000s/Year
Site insurance 110 ETB'000s/Year
Bank Charges (TT transactions) 135 ETB'000s/Year
Other office expenses 600 ETB'000s/Year
31
depends on strong linkages with producers. The JESH facility aims to secure supply
by increasing cash-based payments.
Accounts payable are assumed to be 5 percent of the value of the animal purchased
by the slaughterhouse, while accounts receivable are assumed to be 1 percent of sales
value. The figure for accounts receivable is low, because Ethiopian law requires all
importers of meat from Ethiopia to deposit in a local bank an amount equal to the
value of their order. (See Table 4.13 for accounts receivable, accounts payable, cash
balance, and inventory; see Table 4.14 for changes in working capital.)
Table 4.13: Working Capital
Table 4. 14: Changes in Working Capital
WORKING CAPITAL
Accounts payable (Percentage of the cost of livestocks) 5.00% %
Accounts receivable (Percentage of net sales) 1.00% %
Cash balance (Percentage of the value of the sales) 10.00% %
Livestock Inventory (Percentage of the livestock purchased) 7.50% %
Working Capital Model period beginning 01 May 2012 01 May 2013 01 May 2014 01 May 2029 01 May 2030 01 May 2031
Model period ending 30 Apr 2013 30 Apr 2014 30 Apr 2015 30 Apr 2030 30 Apr 2031 30 Apr 2032
Financial year 2012 2013 2014 2029 2030 2031
Model column counter Constant Unit Total 1 2 3 18 19 20
WORKING CAPITAL (Nominal, Million ETB)
Accounts receivable (Percentage of net sales) 0.01 %
Total sales revenue (Gross sales) ETB'000000s - - - 358.74 1,431.78 24,510.50 29,412.60 -
Accounts receivable (Percentage of net sales) ETB'000000s - 3.59 14.32 245.11 294.13 -
Accounts payable (Percentage of the cost of livestocks) 0.05 %
Total costs ETB'000000s - - - 46.13 166.03 2,836.91 3,404.29 -
Accounts payable (Percentage of the cost of livestocks) ETB'000000s - 2.31 8.30 141.85 170.21 -
Cash balance (Percentage of the value of the sales) 0.10 %
Total sales revenue (Gross sales) ETB'000000s - - - 358.74 1,431.78 24,510.50 29,412.60 -
Cash balance (Percentage of the value of the sales) ETB'000000s - 35.87 143.18 2,451.05 2,941.26 -
Accounts receivable (Percentage of net sales) ETB'000000s - - - 3.59 14.32 245.11 294.13 -
Change in accounts receivable ETB'000000s - (3.59) (10.73) (40.85) (49.02) 294.13
Accounts payable (Percentage of the cost of livestocks) ETB'000000s - - - 2.31 8.30 141.85 170.21 -
Change in accounts payable ETB'000000s - (2.31) (6.00) (23.64) (28.37) 170.21
Cash balance (Percentage of the value of the sales) ETB'000000s - - - 35.87 143.18 2,451.05 2,941.26 -
Change in cash balance ETB'000000s - 35.87 107.30 408.51 490.21 (2,941.26)
32
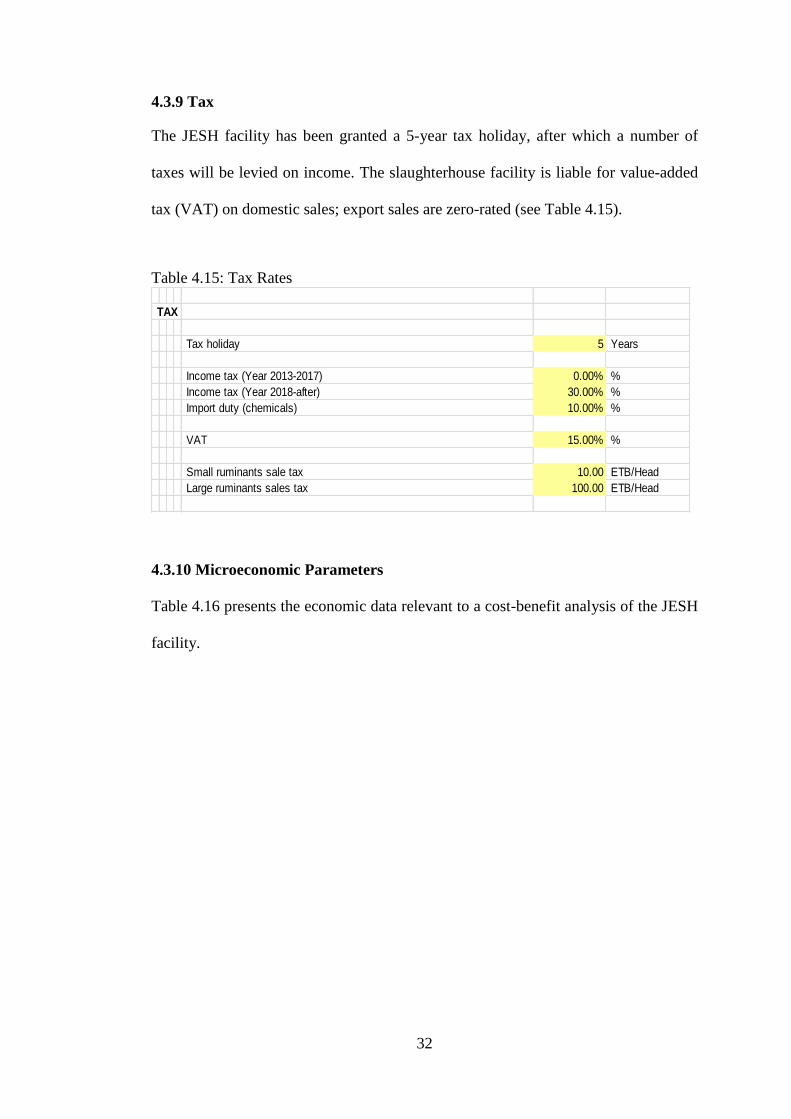
4.3.9 Tax
The JESH facility has been granted a 5-year tax holiday, after which a number of
taxes will be levied on income. The slaughterhouse facility is liable for value-added
tax (VAT) on domestic sales; export sales are zero-rated (see Table 4.15).
Table 4.15: Tax Rates
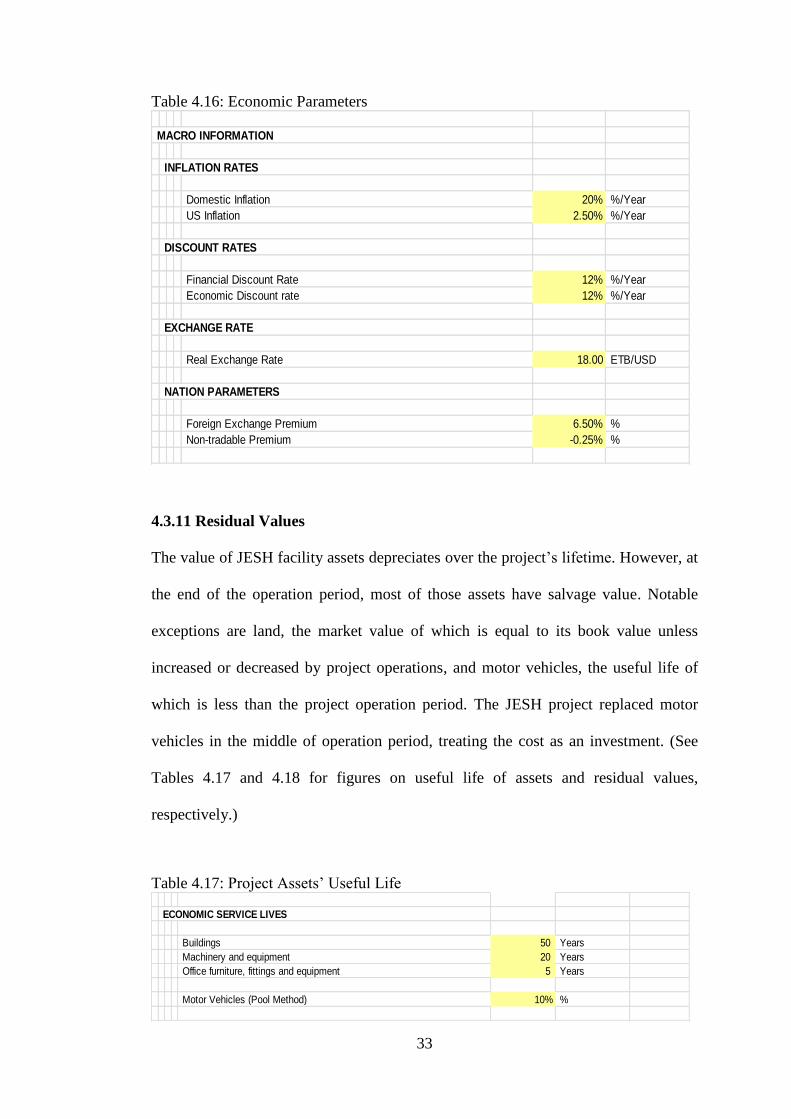
4.3.10 Microeconomic Parameters
Table 4.16 presents the economic data relevant to a cost-benefit analysis of the JESH
facility.
TAX
Tax holiday 5 Years
Income tax (Year 2013-2017) 0.00% %
Income tax (Year 2018-after) 30.00% %
Import duty (chemicals) 10.00% %
VAT 15.00% %
Small ruminants sale tax 10.00 ETB/Head
Large ruminants sales tax 100.00 ETB/Head
33
Table 4.16: Economic Parameters
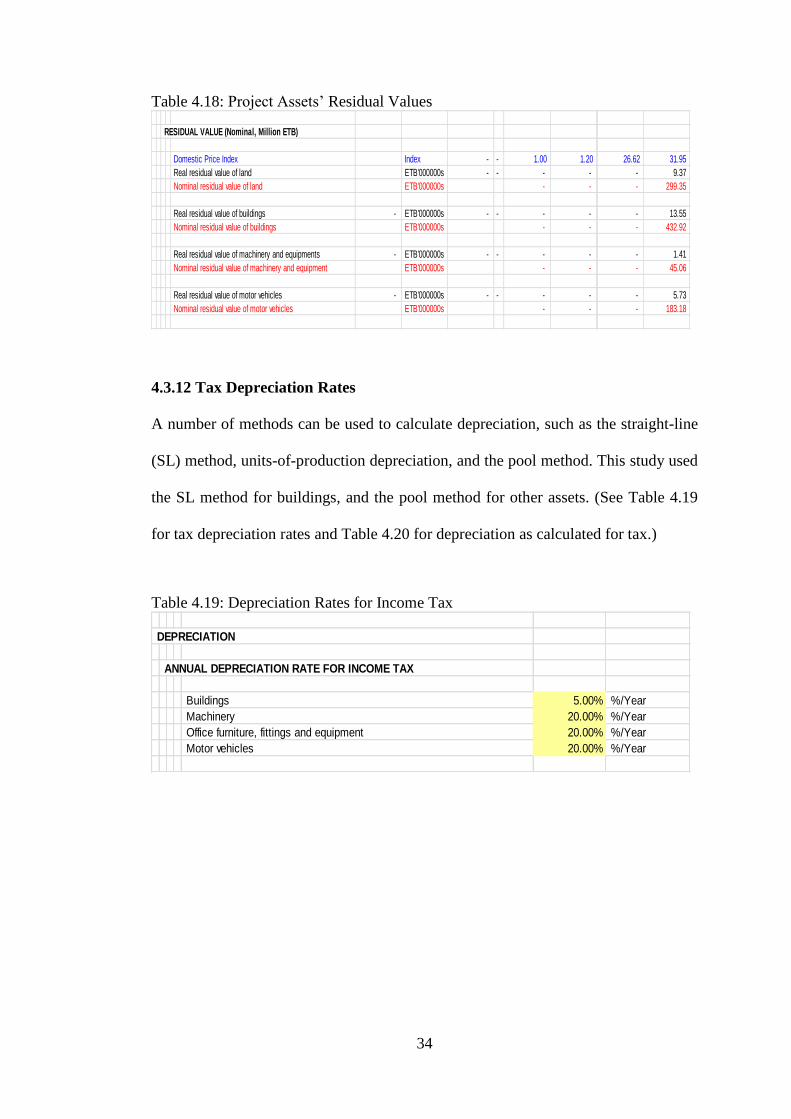
4.3.11 Residual Values
The value of JESH facility assets depreciates over the project’s lifetime. However, at
the end of the operation period, most of those assets have salvage value. Notable
exceptions are land, the market value of which is equal to its book value unless
increased or decreased by project operations, and motor vehicles, the useful life of
which is less than the project operation period. The JESH project replaced motor
vehicles in the middle of operation period, treating the cost as an investment. (See
Tables 4.17 and 4.18 for figures on useful life of assets and residual values,
respectively.)
Table 4.17: Project Assets’ Useful Life
MACRO INFORMATION
INFLATION RATES
Domestic Inflation 20% %/Year
US Inflation 2.50% %/Year
DISCOUNT RATES
Financial Discount Rate 12% %/Year
Economic Discount rate 12% %/Year
EXCHANGE RATE
Real Exchange Rate 18.00 ETB/USD
NATION PARAMETERS
Foreign Exchange Premium 6.50% %
Non-tradable Premium -0.25% %
ECONOMIC SERVICE LIVES
Buildings 50 Years
Machinery and equipment 20 Years
Office furniture, fittings and equipment 5 Years
Motor Vehicles (Pool Method) 10% %
34
Table 4.18: Project Assets’ Residual Values
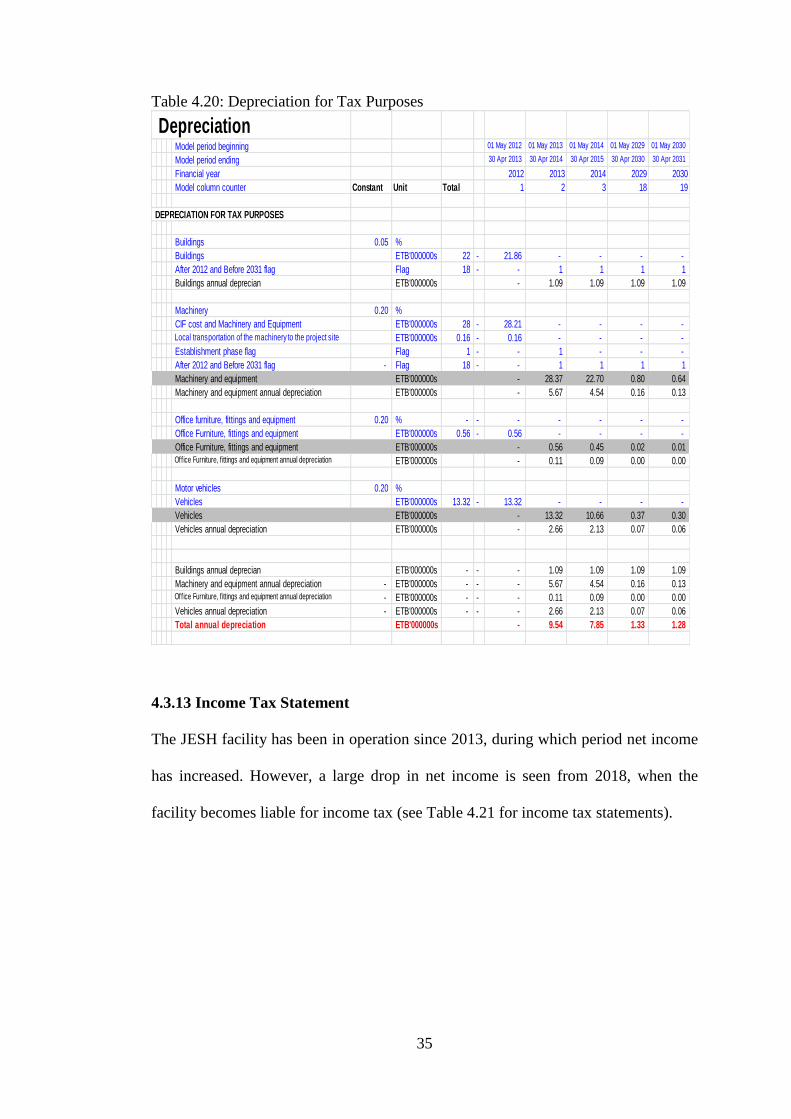
4.3.12 Tax Depreciation Rates
A number of methods can be used to calculate depreciation, such as the straight-line
(SL) method, units-of-production depreciation, and the pool method. This study used
the SL method for buildings, and the pool method for other assets. (See Table 4.19
for tax depreciation rates and Table 4.20 for depreciation as calculated for tax.)
Table 4.19: Depreciation Rates for Income Tax
RESIDUAL VALUE (Nominal, Million ETB)
Domestic Price Index Index - - 1.00 1.20 26.62 31.95
Real residual value of land ETB'000000s - - - - - 9.37
Nominal residual value of land ETB'000000s - - - 299.35
Real residual value of buildings - ETB'000000s - - - - - 13.55
Nominal residual value of buildings ETB'000000s - - - 432.92
Real residual value of machinery and equipments - ETB'000000s - - - - - 1.41
Nominal residual value of machinery and equipment ETB'000000s - - - 45.06
Real residual value of motor vehicles - ETB'000000s - - - - - 5.73
Nominal residual value of motor vehicles ETB'000000s - - - 183.18
DEPRECIATION
ANNUAL DEPRECIATION RATE FOR INCOME TAX
Buildings 5.00% %/Year
Machinery 20.00% %/Year
Office furniture, fittings and equipment 20.00% %/Year
Motor vehicles 20.00% %/Year
35
Table 4.20: Depreciation for Tax Purposes
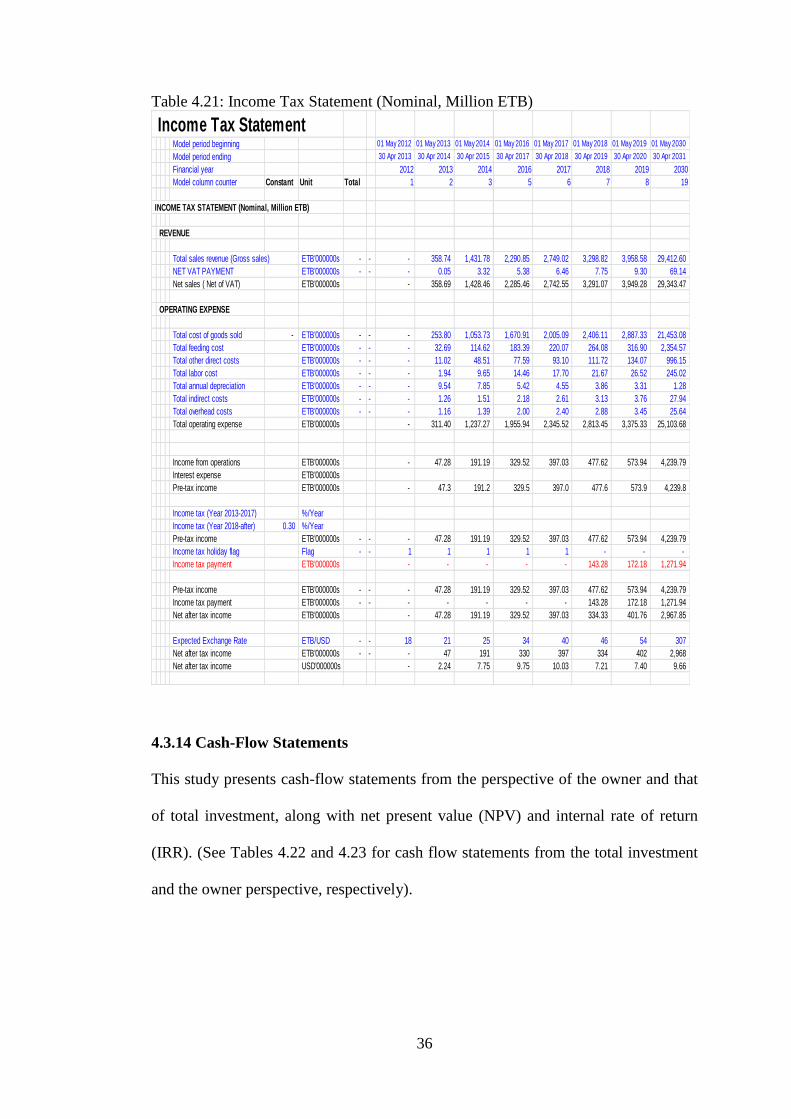
4.3.13 Income Tax Statement
The JESH facility has been in operation since 2013, during which period net income
has increased. However, a large drop in net income is seen from 2018, when the
facility becomes liable for income tax (see Table 4.21 for income tax statements).
Depreciation Model period beginning 01 May 2012 01 May 2013 01 May 2014 01 May 2029 01 May 2030
Model period ending 30 Apr 2013 30 Apr 2014 30 Apr 2015 30 Apr 2030 30 Apr 2031
Financial year 2012 2013 2014 2029 2030
Model column counter Constant Unit Total 1 2 3 18 19
DEPRECIATION FOR TAX PURPOSES
Buildings 0.05 %
Buildings ETB'000000s 22 - 21.86 - - - -
After 2012 and Before 2031 flag Flag 18 - - 1 1 1 1
Buildings annual deprecian ETB'000000s - 1.09 1.09 1.09 1.09
Machinery 0.20 %
CIF cost and Machinery and Equipment ETB'000000s 28 - 28.21 - - - -
Local transportation of the machinery to the project site ETB'000000s 0.16 - 0.16 - - - -
Establishment phase flag Flag 1 - - 1 - - -
After 2012 and Before 2031 flag - Flag 18 - - 1 1 1 1
Machinery and equipment ETB'000000s - 28.37 22.70 0.80 0.64
Machinery and equipment annual depreciation ETB'000000s - 5.67 4.54 0.16 0.13
Office furniture, fittings and equipment 0.20 % - - - - - - -
Office Furniture, fittings and equipment ETB'000000s 0.56 - 0.56 - - - -
Office Furniture, fittings and equipment ETB'000000s - 0.56 0.45 0.02 0.01 Office Furniture, f ittings and equipment annual depreciation ETB'000000s - 0.11 0.09 0.00 0.00
Motor vehicles 0.20 %
Vehicles ETB'000000s 13.32 - 13.32 - - - -
Vehicles ETB'000000s - 13.32 10.66 0.37 0.30
Vehicles annual depreciation ETB'000000s - 2.66 2.13 0.07 0.06
Buildings annual deprecian ETB'000000s - - - 1.09 1.09 1.09 1.09
Machinery and equipment annual depreciation - ETB'000000s - - - 5.67 4.54 0.16 0.13 Office Furniture, f ittings and equipment annual depreciation - ETB'000000s - - - 0.11 0.09 0.00 0.00
Vehicles annual depreciation - ETB'000000s - - - 2.66 2.13 0.07 0.06
Total annual depreciation ETB'000000s - 9.54 7.85 1.33 1.28
36
Table 4.21: Income Tax Statement (Nominal, Million ETB)
4.3.14 Cash-Flow Statements
This study presents cash-flow statements from the perspective of the owner and that
of total investment, along with net present value (NPV) and internal rate of return
(IRR). (See Tables 4.22 and 4.23 for cash flow statements from the total investment
and the owner perspective, respectively).
Income Tax Statement Model period beginning 01 May 2012 01 May 2013 01 May 2014 01 May 2016 01 May 2017 01 May 2018 01 May 2019 01 May 2030
Model period ending 30 Apr 2013 30 Apr 2014 30 Apr 2015 30 Apr 2017 30 Apr 2018 30 Apr 2019 30 Apr 2020 30 Apr 2031
Financial year 2012 2013 2014 2016 2017 2018 2019 2030
Model column counter Constant Unit Total 1 2 3 5 6 7 8 19
INCOME TAX STATEMENT (Nominal, Million ETB)
REVENUE
Total sales revenue (Gross sales) ETB'000000s - - - 358.74 1,431.78 2,290.85 2,749.02 3,298.82 3,958.58 29,412.60
NET VAT PAYMENT ETB'000000s - - - 0.05 3.32 5.38 6.46 7.75 9.30 69.14
Net sales ( Net of VAT) ETB'000000s - 358.69 1,428.46 2,285.46 2,742.55 3,291.07 3,949.28 29,343.47
OPERATING EXPENSE
Total cost of goods sold - ETB'000000s - - - 253.80 1,053.73 1,670.91 2,005.09 2,406.11 2,887.33 21,453.08
Total feeding cost ETB'000000s - - - 32.69 114.62 183.39 220.07 264.08 316.90 2,354.57
Total other direct costs ETB'000000s - - - 11.02 48.51 77.59 93.10 111.72 134.07 996.15
Total labor cost ETB'000000s - - - 1.94 9.65 14.46 17.70 21.67 26.52 245.02
Total annual depreciation ETB'000000s - - - 9.54 7.85 5.42 4.55 3.86 3.31 1.28
Total indirect costs ETB'000000s - - - 1.26 1.51 2.18 2.61 3.13 3.76 27.94
Total overhead costs ETB'000000s - - - 1.16 1.39 2.00 2.40 2.88 3.45 25.64
Total operating expense ETB'000000s - 311.40 1,237.27 1,955.94 2,345.52 2,813.45 3,375.33 25,103.68
Income from operations ETB'000000s - 47.28 191.19 329.52 397.03 477.62 573.94 4,239.79
Interest expense ETB'000000s
Pre-tax income ETB'000000s - 47.3 191.2 329.5 397.0 477.6 573.9 4,239.8
Income tax (Year 2013-2017) %/Year
Income tax (Year 2018-after) 0.30 %/Year
Pre-tax income ETB'000000s - - - 47.28 191.19 329.52 397.03 477.62 573.94 4,239.79
Income tax holiday flag Flag - - 1 1 1 1 1 - - -
Income tax payment ETB'000000s - - - - - 143.28 172.18 1,271.94
Pre-tax income ETB'000000s - - - 47.28 191.19 329.52 397.03 477.62 573.94 4,239.79
Income tax payment ETB'000000s - - - - - - - 143.28 172.18 1,271.94
Net after tax income ETB'000000s - 47.28 191.19 329.52 397.03 334.33 401.76 2,967.85
Expected Exchange Rate ETB/USD - - 18 21 25 34 40 46 54 307
Net after tax income ETB'000000s - - - 47 191 330 397 334 402 2,968
Net after tax income USD'000000s - 2.24 7.75 9.75 10.03 7.21 7.40 9.66
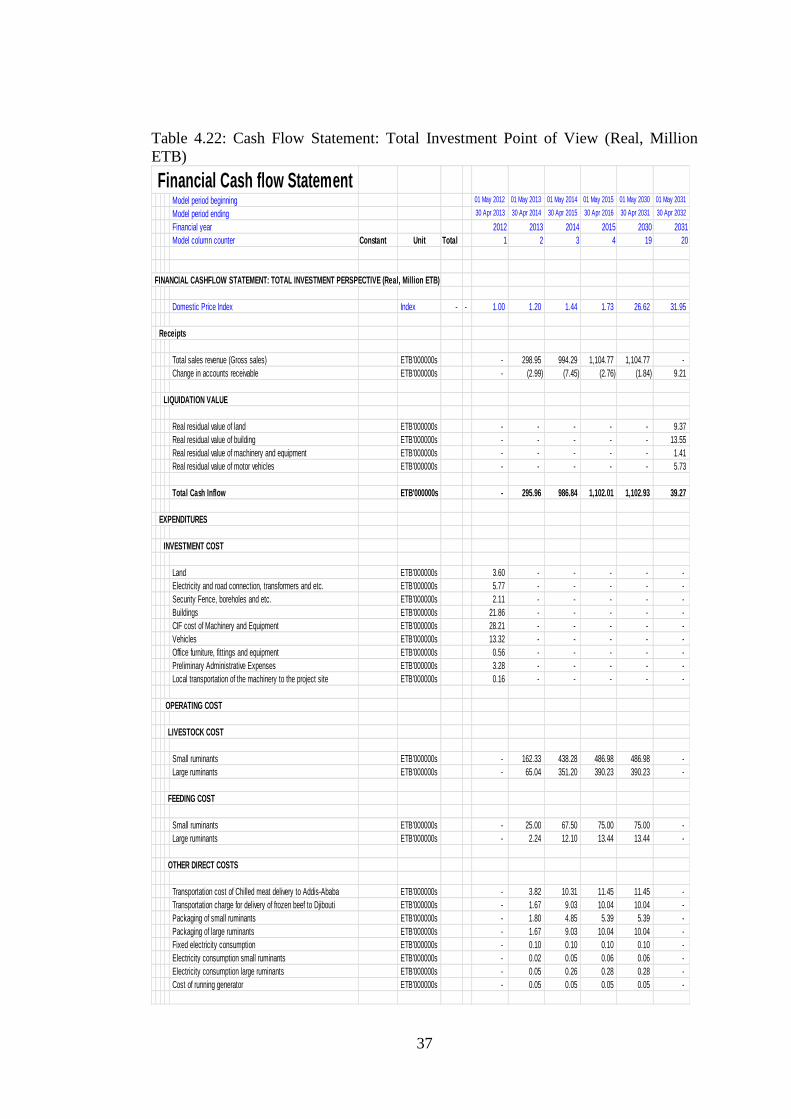
37
Table 4.22: Cash Flow Statement: Total Investment Point of View (Real, Million
ETB)
Financial Cash flow Statement Model period beginning 01 May 2012 01 May 2013 01 May 2014 01 May 2015 01 May 2030 01 May 2031
Model period ending 30 Apr 2013 30 Apr 2014 30 Apr 2015 30 Apr 2016 30 Apr 2031 30 Apr 2032
Financial year 2012 2013 2014 2015 2030 2031
Model column counter Constant Unit Total 1 2 3 4 19 20
FINANCIAL CASHFLOW STATEMENT: TOTAL INVESTMENT PERSPECTIVE (Real, Million ETB)
Domestic Price Index Index - - 1.00 1.20 1.44 1.73 26.62 31.95
Receipts
Total sales revenue (Gross sales) ETB'000000s - 298.95 994.29 1,104.77 1,104.77 -
Change in accounts receivable ETB'000000s - (2.99) (7.45) (2.76) (1.84) 9.21
LIQUIDATION VALUE
Real residual value of land ETB'000000s - - - - - 9.37
Real residual value of building ETB'000000s - - - - - 13.55
Real residual value of machinery and equipment ETB'000000s - - - - - 1.41
Real residual value of motor vehicles ETB'000000s - - - - - 5.73
Total Cash Inflow ETB'000000s - 295.96 986.84 1,102.01 1,102.93 39.27
EXPENDITURES
INVESTMENT COST
Land ETB'000000s 3.60 - - - - -
Electricity and road connection, transformers and etc. ETB'000000s 5.77 - - - - -
Security Fence, boreholes and etc. ETB'000000s 2.11 - - - - -
Buildings ETB'000000s 21.86 - - - - -
CIF cost of Machinery and Equipment ETB'000000s 28.21 - - - - -
Vehicles ETB'000000s 13.32 - - - - -
Office furniture, fittings and equipment ETB'000000s 0.56 - - - - -
Preliminary Administrative Expenses ETB'000000s 3.28 - - - - -
Local transportation of the machinery to the project site ETB'000000s 0.16 - - - - -
OPERATING COST
LIVESTOCK COST
Small ruminants ETB'000000s - 162.33 438.28 486.98 486.98 -
Large ruminants ETB'000000s - 65.04 351.20 390.23 390.23 -
FEEDING COST
Small ruminants ETB'000000s - 25.00 67.50 75.00 75.00 -
Large ruminants ETB'000000s - 2.24 12.10 13.44 13.44 -
OTHER DIRECT COSTS
Transportation cost of Chilled meat delivery to Addis-Ababa ETB'000000s - 3.82 10.31 11.45 11.45 -
Transportation charge for delivery of frozen beef to Djibouti ETB'000000s - 1.67 9.03 10.04 10.04 -
Packaging of small ruminants ETB'000000s - 1.80 4.85 5.39 5.39 -
Packaging of large ruminants ETB'000000s - 1.67 9.03 10.04 10.04 -
Fixed electricity consumption ETB'000000s - 0.10 0.10 0.10 0.10 -
Electricity consumption small ruminants ETB'000000s - 0.02 0.05 0.06 0.06 -
Electricity consumption large ruminants ETB'000000s - 0.05 0.26 0.28 0.28 -
Cost of running generator ETB'000000s - 0.05 0.05 0.05 0.05 -
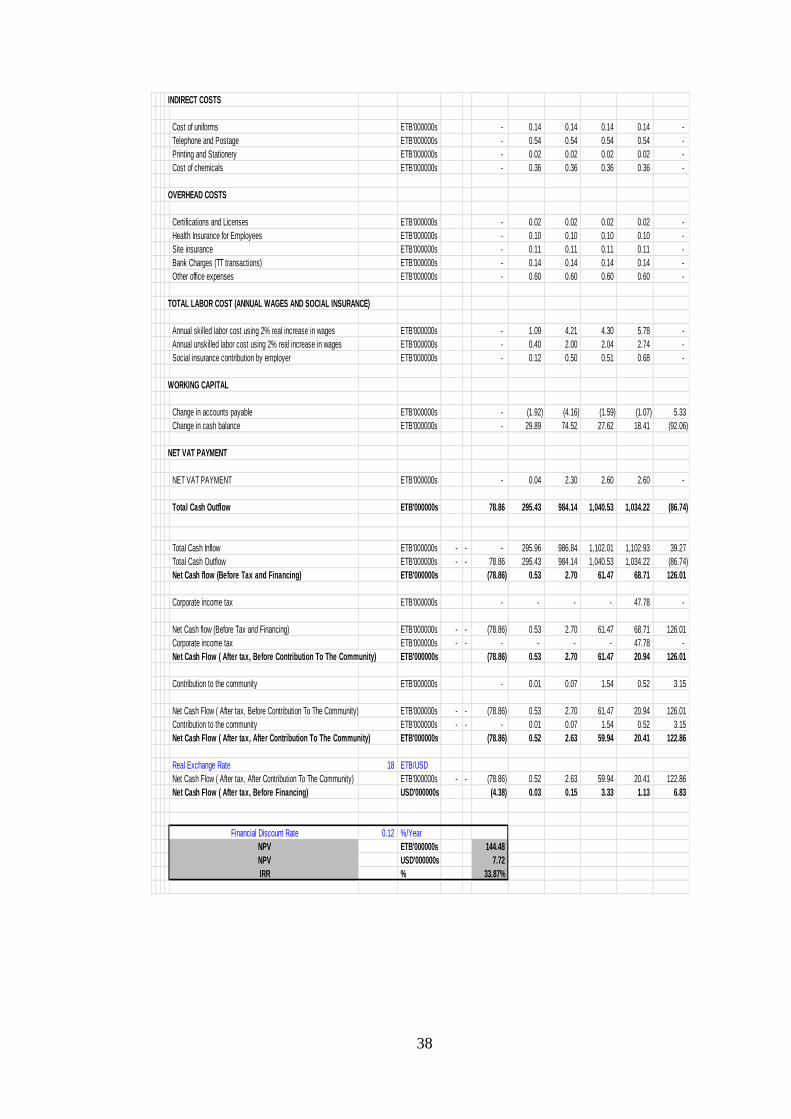
38
INDIRECT COSTS
Cost of uniforms ETB'000000s - 0.14 0.14 0.14 0.14 -
Telephone and Postage ETB'000000s - 0.54 0.54 0.54 0.54 -
Printing and Stationery ETB'000000s - 0.02 0.02 0.02 0.02 -
Cost of chemicals ETB'000000s - 0.36 0.36 0.36 0.36 -
OVERHEAD COSTS
Certifications and Licenses ETB'000000s - 0.02 0.02 0.02 0.02 -
Health Insurance for Employees ETB'000000s - 0.10 0.10 0.10 0.10 -
Site insurance ETB'000000s - 0.11 0.11 0.11 0.11 -
Bank Charges (TT transactions) ETB'000000s - 0.14 0.14 0.14 0.14 -
Other office expenses ETB'000000s - 0.60 0.60 0.60 0.60 -
TOTAL LABOR COST (ANNUAL WAGES AND SOCIAL INSURANCE)
Annual skilled labor cost using 2% real increase in wages ETB'000000s - 1.09 4.21 4.30 5.78 -
Annual unskilled labor cost using 2% real increase in wages ETB'000000s - 0.40 2.00 2.04 2.74 -
Social insurance contribution by employer ETB'000000s - 0.12 0.50 0.51 0.68 -
WORKING CAPITAL
Change in accounts payable ETB'000000s - (1.92) (4.16) (1.59) (1.07) 5.33
Change in cash balance ETB'000000s - 29.89 74.52 27.62 18.41 (92.06)
NET VAT PAYMENT
NET VAT PAYMENT ETB'000000s - 0.04 2.30 2.60 2.60 -
Total Cash Outflow ETB'000000s 78.86 295.43 984.14 1,040.53 1,034.22 (86.74)
Total Cash Inflow ETB'000000s - - - 295.96 986.84 1,102.01 1,102.93 39.27
Total Cash Outflow ETB'000000s - - 78.86 295.43 984.14 1,040.53 1,034.22 (86.74)
Net Cash flow (Before Tax and Financing) ETB'000000s (78.86) 0.53 2.70 61.47 68.71 126.01
Corporate income tax ETB'000000s - - - - 47.78 -
Net Cash flow (Before Tax and Financing) ETB'000000s - - (78.86) 0.53 2.70 61.47 68.71 126.01
Corporate income tax ETB'000000s - - - - - - 47.78 -
Net Cash Flow ( After tax, Before Contribution To The Community) ETB'000000s (78.86) 0.53 2.70 61.47 20.94 126.01
Contribution to the community ETB'000000s - 0.01 0.07 1.54 0.52 3.15
Net Cash Flow ( After tax, Before Contribution To The Community) ETB'000000s - - (78.86) 0.53 2.70 61.47 20.94 126.01
Contribution to the community ETB'000000s - - - 0.01 0.07 1.54 0.52 3.15
Net Cash Flow ( After tax, After Contribution To The Community) ETB'000000s (78.86) 0.52 2.63 59.94 20.41 122.86
Real Exchange Rate 18 ETB/USD
Net Cash Flow ( After tax, After Contribution To The Community) ETB'000000s - - (78.86) 0.52 2.63 59.94 20.41 122.86
Net Cash Flow ( After tax, Before Financing) USD'000000s (4.38) 0.03 0.15 3.33 1.13 6.83
Financial Discount Rate 0.12 %/Year
NPV ETB'000000s 144.48
NPV USD'000000s 7.72
IRR % 33.87%
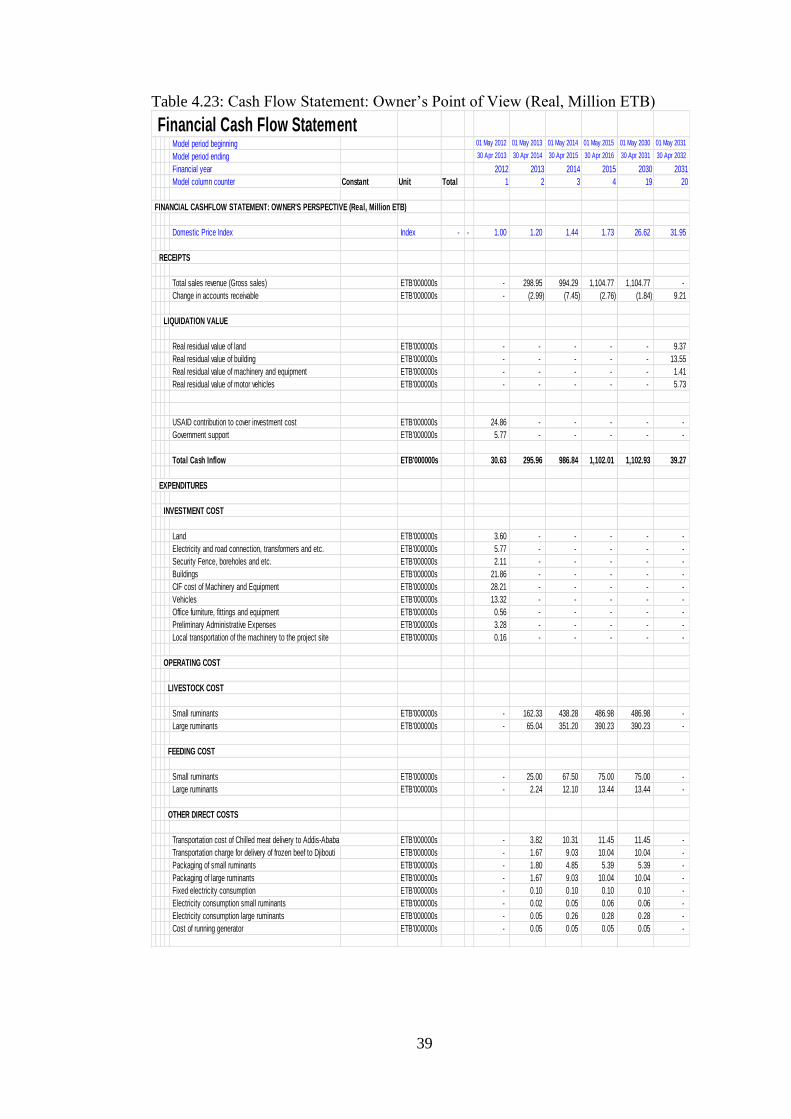
39
Table 4.23: Cash Flow Statement: Owner’s Point of View (Real, Million ETB)
Financial Cash Flow Statement Model period beginning 01 May 2012 01 May 2013 01 May 2014 01 May 2015 01 May 2030 01 May 2031
Model period ending 30 Apr 2013 30 Apr 2014 30 Apr 2015 30 Apr 2016 30 Apr 2031 30 Apr 2032
Financial year 2012 2013 2014 2015 2030 2031
Model column counter Constant Unit Total 1 2 3 4 19 20
FINANCIAL CASHFLOW STATEMENT: OWNER'S PERSPECTIVE (Real, Million ETB)
Domestic Price Index Index - - 1.00 1.20 1.44 1.73 26.62 31.95
RECEIPTS
Total sales revenue (Gross sales) ETB'000000s - 298.95 994.29 1,104.77 1,104.77 -
Change in accounts receivable ETB'000000s - (2.99) (7.45) (2.76) (1.84) 9.21
LIQUIDATION VALUE
Real residual value of land ETB'000000s - - - - - 9.37
Real residual value of building ETB'000000s - - - - - 13.55
Real residual value of machinery and equipment ETB'000000s - - - - - 1.41
Real residual value of motor vehicles ETB'000000s - - - - - 5.73
USAID contribution to cover investment cost ETB'000000s 24.86 - - - - -
Government support ETB'000000s 5.77 - - - - -
Total Cash Inflow ETB'000000s 30.63 295.96 986.84 1,102.01 1,102.93 39.27
EXPENDITURES
INVESTMENT COST
Land ETB'000000s 3.60 - - - - -
Electricity and road connection, transformers and etc. ETB'000000s 5.77 - - - - -
Security Fence, boreholes and etc. ETB'000000s 2.11 - - - - -
Buildings ETB'000000s 21.86 - - - - -
CIF cost of Machinery and Equipment ETB'000000s 28.21 - - - - -
Vehicles ETB'000000s 13.32 - - - - -
Office furniture, fittings and equipment ETB'000000s 0.56 - - - - -
Preliminary Administrative Expenses ETB'000000s 3.28 - - - - -
Local transportation of the machinery to the project site ETB'000000s 0.16 - - - - -
OPERATING COST
LIVESTOCK COST
Small ruminants ETB'000000s - 162.33 438.28 486.98 486.98 -
Large ruminants ETB'000000s - 65.04 351.20 390.23 390.23 -
FEEDING COST
Small ruminants ETB'000000s - 25.00 67.50 75.00 75.00 -
Large ruminants ETB'000000s - 2.24 12.10 13.44 13.44 -
OTHER DIRECT COSTS
Transportation cost of Chilled meat delivery to Addis-Ababa ETB'000000s - 3.82 10.31 11.45 11.45 -
Transportation charge for delivery of frozen beef to Djibouti ETB'000000s - 1.67 9.03 10.04 10.04 -
Packaging of small ruminants ETB'000000s - 1.80 4.85 5.39 5.39 -
Packaging of large ruminants ETB'000000s - 1.67 9.03 10.04 10.04 -
Fixed electricity consumption ETB'000000s - 0.10 0.10 0.10 0.10 -
Electricity consumption small ruminants ETB'000000s - 0.02 0.05 0.06 0.06 -
Electricity consumption large ruminants ETB'000000s - 0.05 0.26 0.28 0.28 -
Cost of running generator ETB'000000s - 0.05 0.05 0.05 0.05 -
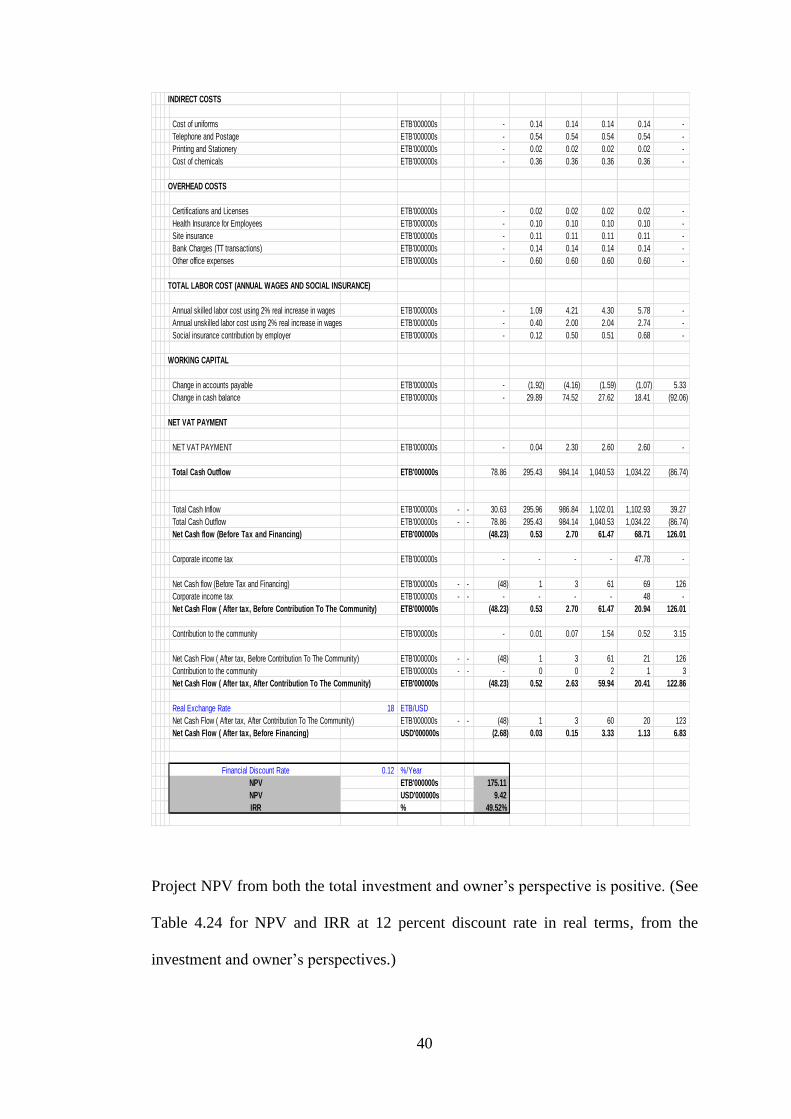
40
Project NPV from both the total investment and owner’s perspective is positive. (See
Table 4.24 for NPV and IRR at 12 percent discount rate in real terms, from the
investment and owner’s perspectives.)
INDIRECT COSTS
Cost of uniforms ETB'000000s - 0.14 0.14 0.14 0.14 -
Telephone and Postage ETB'000000s - 0.54 0.54 0.54 0.54 -
Printing and Stationery ETB'000000s - 0.02 0.02 0.02 0.02 -
Cost of chemicals ETB'000000s - 0.36 0.36 0.36 0.36 -
OVERHEAD COSTS
Certifications and Licenses ETB'000000s - 0.02 0.02 0.02 0.02 -
Health Insurance for Employees ETB'000000s - 0.10 0.10 0.10 0.10 -
Site insurance ETB'000000s - 0.11 0.11 0.11 0.11 -
Bank Charges (TT transactions) ETB'000000s - 0.14 0.14 0.14 0.14 -
Other office expenses ETB'000000s - 0.60 0.60 0.60 0.60 -
TOTAL LABOR COST (ANNUAL WAGES AND SOCIAL INSURANCE)
Annual skilled labor cost using 2% real increase in wages ETB'000000s - 1.09 4.21 4.30 5.78 -
Annual unskilled labor cost using 2% real increase in wages ETB'000000s - 0.40 2.00 2.04 2.74 -
Social insurance contribution by employer ETB'000000s - 0.12 0.50 0.51 0.68 -
WORKING CAPITAL
Change in accounts payable ETB'000000s - (1.92) (4.16) (1.59) (1.07) 5.33
Change in cash balance ETB'000000s - 29.89 74.52 27.62 18.41 (92.06)
NET VAT PAYMENT
NET VAT PAYMENT ETB'000000s - 0.04 2.30 2.60 2.60 -
Total Cash Outflow ETB'000000s 78.86 295.43 984.14 1,040.53 1,034.22 (86.74)
Total Cash Inflow ETB'000000s - - 30.63 295.96 986.84 1,102.01 1,102.93 39.27
Total Cash Outflow ETB'000000s - - 78.86 295.43 984.14 1,040.53 1,034.22 (86.74)
Net Cash flow (Before Tax and Financing) ETB'000000s (48.23) 0.53 2.70 61.47 68.71 126.01
Corporate income tax ETB'000000s - - - - 47.78 -
Net Cash flow (Before Tax and Financing) ETB'000000s - - (48) 1 3 61 69 126
Corporate income tax ETB'000000s - - - - - - 48 -
Net Cash Flow ( After tax, Before Contribution To The Community) ETB'000000s (48.23) 0.53 2.70 61.47 20.94 126.01
Contribution to the community ETB'000000s - 0.01 0.07 1.54 0.52 3.15
Net Cash Flow ( After tax, Before Contribution To The Community) ETB'000000s - - (48) 1 3 61 21 126
Contribution to the community ETB'000000s - - - 0 0 2 1 3
Net Cash Flow ( After tax, After Contribution To The Community) ETB'000000s (48.23) 0.52 2.63 59.94 20.41 122.86
Real Exchange Rate 18 ETB/USD
Net Cash Flow ( After tax, After Contribution To The Community) ETB'000000s - - (48) 1 3 60 20 123
Net Cash Flow ( After tax, Before Financing) USD'000000s (2.68) 0.03 0.15 3.33 1.13 6.83
Financial Discount Rate 0.12 %/Year
NPV ETB'000000s 175.11
NPV USD'000000s 9.42
IRR % 49.52%
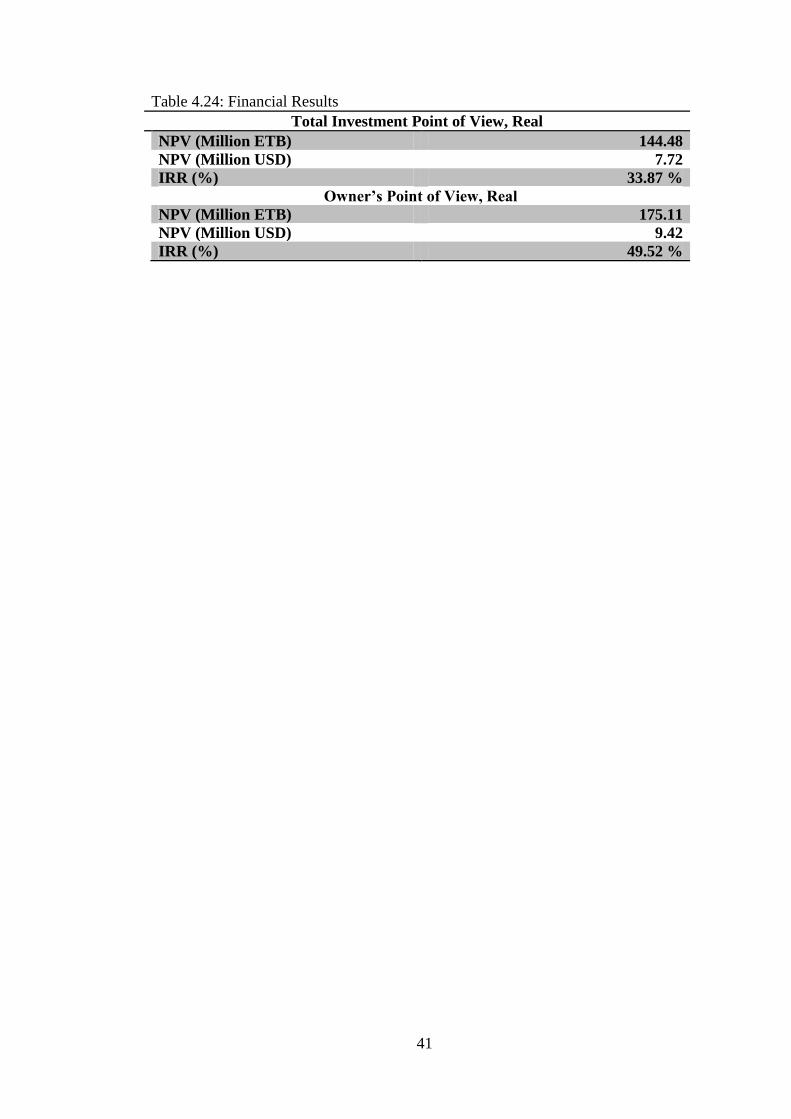
41
Table 4.24: Financial Results
Total Investment Point of View, Real
NPV (Million ETB) 144.48
NPV (Million USD) 7.72
IRR (%) 33.87 %
Owner’s Point of View, Real
NPV (Million ETB) 175.11
NPV (Million USD) 9.42
IRR (%) 49.52 %
42
Chapter 5
SENSITIVITY ANALYSIS
5.1 Introduction
This chapter presents the results and a discussion of sensitivity analysis, conducted to
identify project risk variables.
5.2 Sensitivity Analysis
Sensitivity analysis is widely used in the private sector, in order to identify the key
risk variables associated with project outcomes.
Although only one parameter can be modified at a time, sensitivity analysis
nonetheless remains a practical means of identifying critical project variables. A
further challenge in the context of this study was that, according to FAST standards,
inputs and sensitivity analysis should be recorded on two separate Excel
spreadsheets. However, Excel cannot run sensitivity analysis if inputs are not
included. As a result some required inputs were transferred to the sensitivity
spreadsheet.
5.3 Results and Interpretations
The following section identifies a number of potential risk variables, presenting the
impact of each selected parameter on project FNPV and FIRR.
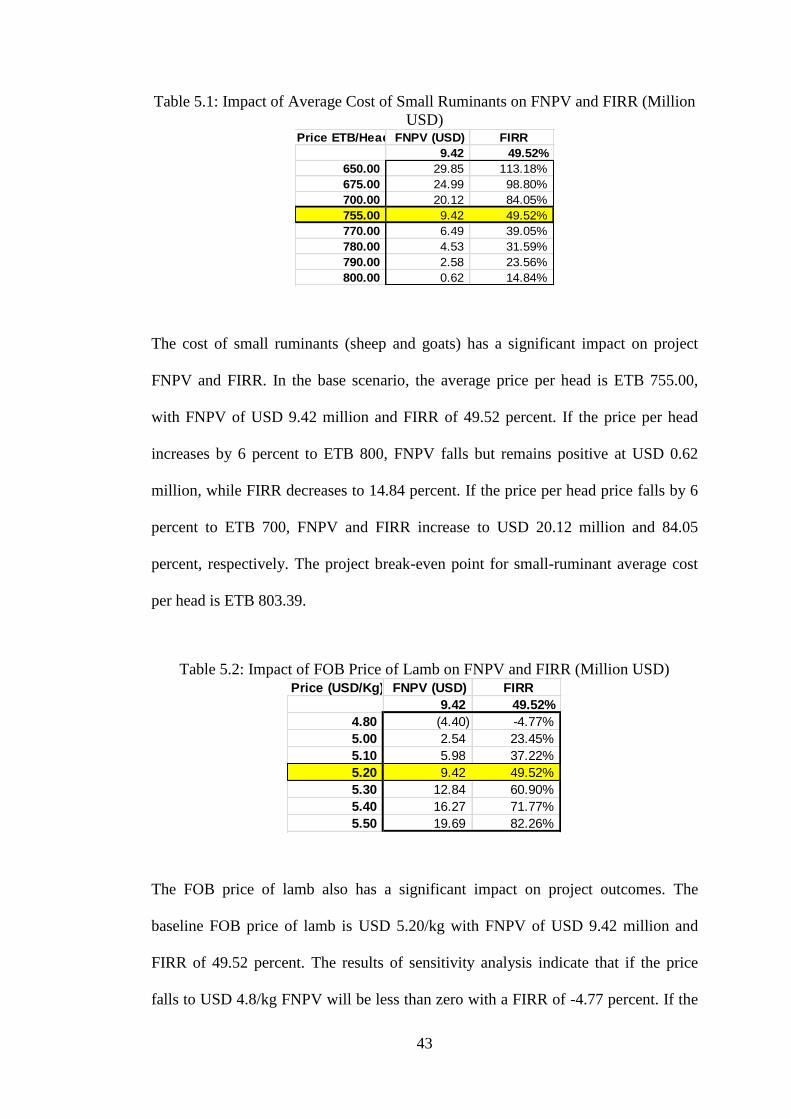
43
Table 5.1: Impact of Average Cost of Small Ruminants on FNPV and FIRR (Million
USD)
The cost of small ruminants (sheep and goats) has a significant impact on project
FNPV and FIRR. In the base scenario, the average price per head is ETB 755.00,
with FNPV of USD 9.42 million and FIRR of 49.52 percent. If the price per head
increases by 6 percent to ETB 800, FNPV falls but remains positive at USD 0.62
million, while FIRR decreases to 14.84 percent. If the price per head price falls by 6
percent to ETB 700, FNPV and FIRR increase to USD 20.12 million and 84.05
percent, respectively. The project break-even point for small-ruminant average cost
per head is ETB 803.39.
Table 5.2: Impact of FOB Price of Lamb on FNPV and FIRR (Million USD)
The FOB price of lamb also has a significant impact on project outcomes. The
baseline FOB price of lamb is USD 5.20/kg with FNPV of USD 9.42 million and
FIRR of 49.52 percent. The results of sensitivity analysis indicate that if the price
falls to USD 4.8/kg FNPV will be less than zero with a FIRR of -4.77 percent. If the
Price ETB/Head FNPV (USD) FIRR
9.42 49.52%
650.00 29.85 113.18%
675.00 24.99 98.80%
700.00 20.12 84.05%
755.00 9.42 49.52%
770.00 6.49 39.05%
780.00 4.53 31.59%
790.00 2.58 23.56%
800.00 0.62 14.84%
Price (USD/Kg) FNPV (USD) FIRR
9.42 49.52%
4.80 (4.40) -4.77%
5.00 2.54 23.45%
5.10 5.98 37.22%
5.20 9.42 49.52%
5.30 12.84 60.90%
5.40 16.27 71.77%
5.50 19.69 82.26%
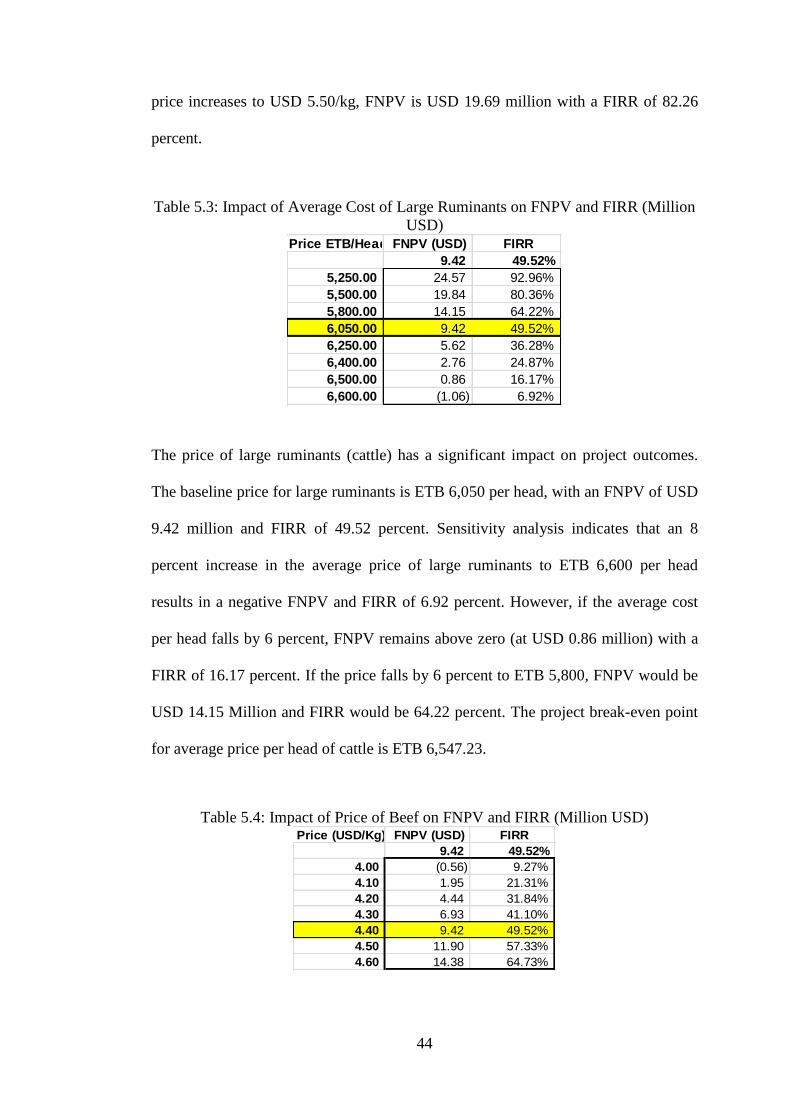
44
price increases to USD 5.50/kg, FNPV is USD 19.69 million with a FIRR of 82.26
percent.
Table 5.3: Impact of Average Cost of Large Ruminants on FNPV and FIRR (Million
USD)
The price of large ruminants (cattle) has a significant impact on project outcomes.
The baseline price for large ruminants is ETB 6,050 per head, with an FNPV of USD
9.42 million and FIRR of 49.52 percent. Sensitivity analysis indicates that an 8
percent increase in the average price of large ruminants to ETB 6,600 per head
results in a negative FNPV and FIRR of 6.92 percent. However, if the average cost
per head falls by 6 percent, FNPV remains above zero (at USD 0.86 million) with a
FIRR of 16.17 percent. If the price falls by 6 percent to ETB 5,800, FNPV would be
USD 14.15 Million and FIRR would be 64.22 percent. The project break-even point
for average price per head of cattle is ETB 6,547.23.
Table 5.4: Impact of Price of Beef on FNPV and FIRR (Million USD)
Price ETB/Head FNPV (USD) FIRR
9.42 49.52%
5,250.00 24.57 92.96%
5,500.00 19.84 80.36%
5,800.00 14.15 64.22%
6,050.00 9.42 49.52%
6,250.00 5.62 36.28%
6,400.00 2.76 24.87%
6,500.00 0.86 16.17%
6,600.00 (1.06) 6.92%
Price (USD/Kg) FNPV (USD) FIRR
9.42 49.52%
4.00 (0.56) 9.27%
4.10 1.95 21.31%
4.20 4.44 31.84%
4.30 6.93 41.10%
4.40 9.42 49.52%
4.50 11.90 57.33%
4.60 14.38 64.73%
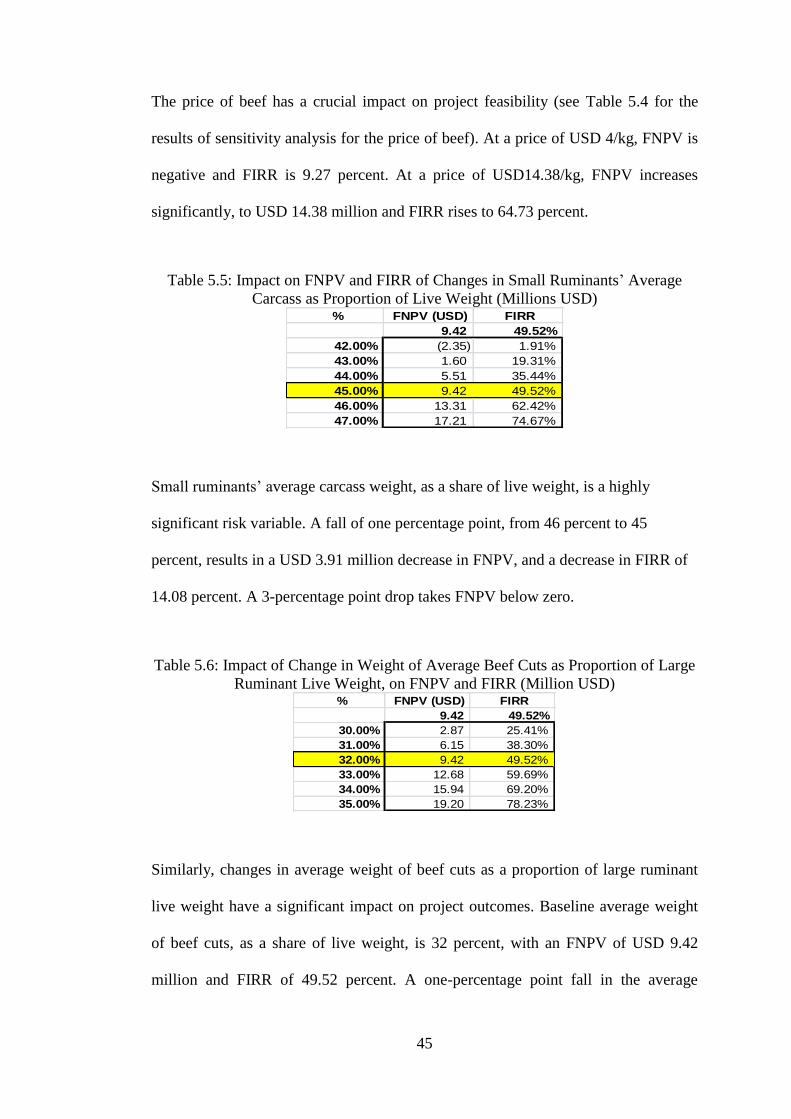
45
The price of beef has a crucial impact on project feasibility (see Table 5.4 for the
results of sensitivity analysis for the price of beef). At a price of USD 4/kg, FNPV is
negative and FIRR is 9.27 percent. At a price of USD14.38/kg, FNPV increases
significantly, to USD 14.38 million and FIRR rises to 64.73 percent.
Table 5.5: Impact on FNPV and FIRR of Changes in Small Ruminants’ Average
Carcass as Proportion of Live Weight (Millions USD)
Small ruminants’ average carcass weight, as a share of live weight, is a highly
significant risk variable. A fall of one percentage point, from 46 percent to 45
percent, results in a USD 3.91 million decrease in FNPV, and a decrease in FIRR of
14.08 percent. A 3-percentage point drop takes FNPV below zero.
Table 5.6: Impact of Change in Weight of Average Beef Cuts as Proportion of Large
Ruminant Live Weight, on FNPV and FIRR (Million USD)
Similarly, changes in average weight of beef cuts as a proportion of large ruminant
live weight have a significant impact on project outcomes. Baseline average weight
of beef cuts, as a share of live weight, is 32 percent, with an FNPV of USD 9.42
million and FIRR of 49.52 percent. A one-percentage point fall in the average
% FNPV (USD) FIRR
9.42 49.52%
42.00% (2.35) 1.91%
43.00% 1.60 19.31%
44.00% 5.51 35.44%
45.00% 9.42 49.52%
46.00% 13.31 62.42%
47.00% 17.21 74.67%
% FNPV (USD) FIRR
9.42 49.52%
30.00% 2.87 25.41%
31.00% 6.15 38.30%
32.00% 9.42 49.52%
33.00% 12.68 59.69%
34.00% 15.94 69.20%
35.00% 19.20 78.23%
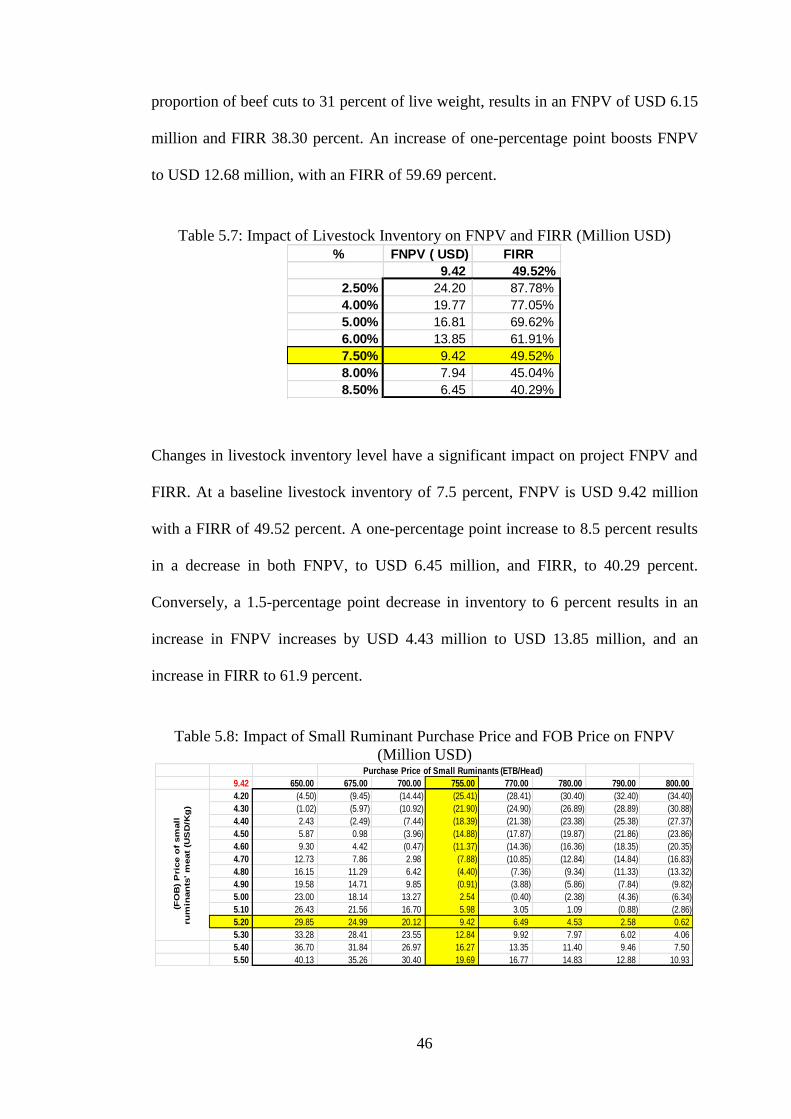
46
proportion of beef cuts to 31 percent of live weight, results in an FNPV of USD 6.15
million and FIRR 38.30 percent. An increase of one-percentage point boosts FNPV
to USD 12.68 million, with an FIRR of 59.69 percent.
Table 5.7: Impact of Livestock Inventory on FNPV and FIRR (Million USD)
Changes in livestock inventory level have a significant impact on project FNPV and
FIRR. At a baseline livestock inventory of 7.5 percent, FNPV is USD 9.42 million
with a FIRR of 49.52 percent. A one-percentage point increase to 8.5 percent results
in a decrease in both FNPV, to USD 6.45 million, and FIRR, to 40.29 percent.
Conversely, a 1.5-percentage point decrease in inventory to 6 percent results in an
increase in FNPV increases by USD 4.43 million to USD 13.85 million, and an
increase in FIRR to 61.9 percent.
Table 5.8: Impact of Small Ruminant Purchase Price and FOB Price on FNPV
(Million USD)
% FNPV ( USD) FIRR
9.42 49.52%
2.50% 24.20 87.78%
4.00% 19.77 77.05%
5.00% 16.81 69.62%
6.00% 13.85 61.91%
7.50% 9.42 49.52%
8.00% 7.94 45.04%
8.50% 6.45 40.29%
9.42 650.00 675.00 700.00 755.00 770.00 780.00 790.00 800.00
4.20 (4.50) (9.45) (14.44) (25.41) (28.41) (30.40) (32.40) (34.40)
4.30 (1.02) (5.97) (10.92) (21.90) (24.90) (26.89) (28.89) (30.88)
4.40 2.43 (2.49) (7.44) (18.39) (21.38) (23.38) (25.38) (27.37)
4.50 5.87 0.98 (3.96) (14.88) (17.87) (19.87) (21.86) (23.86)
4.60 9.30 4.42 (0.47) (11.37) (14.36) (16.36) (18.35) (20.35)
4.70 12.73 7.86 2.98 (7.88) (10.85) (12.84) (14.84) (16.83)
4.80 16.15 11.29 6.42 (4.40) (7.36) (9.34) (11.33) (13.32)
4.90 19.58 14.71 9.85 (0.91) (3.88) (5.86) (7.84) (9.82)
5.00 23.00 18.14 13.27 2.54 (0.40) (2.38) (4.36) (6.34)
5.10 26.43 21.56 16.70 5.98 3.05 1.09 (0.88) (2.86)
5.20 29.85 24.99 20.12 9.42 6.49 4.53 2.58 0.62
5.30 33.28 28.41 23.55 12.84 9.92 7.97 6.02 4.06
5.40 36.70 31.84 26.97 16.27 13.35 11.40 9.46 7.50
5.50 40.13 35.26 30.40 19.69 16.77 14.83 12.88 10.93
Purchase Price of Small Ruminants (ETB/Head)
(F
OB
) P
ric
e o
f sm
all
ru
min
an
ts' m
eat
(US
D/K
g)
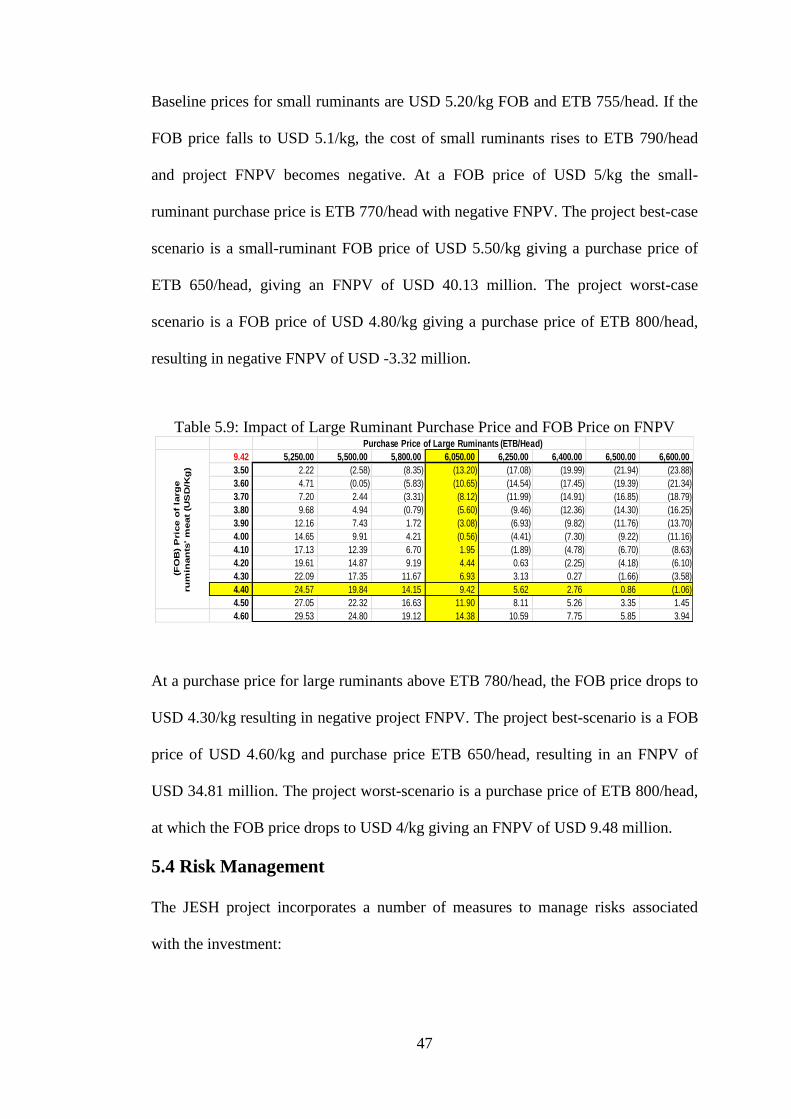
47
Baseline prices for small ruminants are USD 5.20/kg FOB and ETB 755/head. If the
FOB price falls to USD 5.1/kg, the cost of small ruminants rises to ETB 790/head
and project FNPV becomes negative. At a FOB price of USD 5/kg the small-
ruminant purchase price is ETB 770/head with negative FNPV. The project best-case
scenario is a small-ruminant FOB price of USD 5.50/kg giving a purchase price of
ETB 650/head, giving an FNPV of USD 40.13 million. The project worst-case
scenario is a FOB price of USD 4.80/kg giving a purchase price of ETB 800/head,
resulting in negative FNPV of USD -3.32 million.
Table 5.9: Impact of Large Ruminant Purchase Price and FOB Price on FNPV
At a purchase price for large ruminants above ETB 780/head, the FOB price drops to
USD 4.30/kg resulting in negative project FNPV. The project best-scenario is a FOB
price of USD 4.60/kg and purchase price ETB 650/head, resulting in an FNPV of
USD 34.81 million. The project worst-scenario is a purchase price of ETB 800/head,
at which the FOB price drops to USD 4/kg giving an FNPV of USD 9.48 million.
5.4 Risk Management
The JESH project incorporates a number of measures to manage risks associated
with the investment:
9.42 5,250.00 5,500.00 5,800.00 6,050.00 6,250.00 6,400.00 6,500.00 6,600.00
3.50 2.22 (2.58) (8.35) (13.20) (17.08) (19.99) (21.94) (23.88)
3.60 4.71 (0.05) (5.83) (10.65) (14.54) (17.45) (19.39) (21.34)
3.70 7.20 2.44 (3.31) (8.12) (11.99) (14.91) (16.85) (18.79)
3.80 9.68 4.94 (0.79) (5.60) (9.46) (12.36) (14.30) (16.25)
3.90 12.16 7.43 1.72 (3.08) (6.93) (9.82) (11.76) (13.70)
4.00 14.65 9.91 4.21 (0.56) (4.41) (7.30) (9.22) (11.16)
4.10 17.13 12.39 6.70 1.95 (1.89) (4.78) (6.70) (8.63)
4.20 19.61 14.87 9.19 4.44 0.63 (2.25) (4.18) (6.10)
4.30 22.09 17.35 11.67 6.93 3.13 0.27 (1.66) (3.58)
4.40 24.57 19.84 14.15 9.42 5.62 2.76 0.86 (1.06)
4.50 27.05 22.32 16.63 11.90 8.11 5.26 3.35 1.45
4.60 29.53 24.80 19.12 14.38 10.59 7.75 5.85 3.94
Purchase Price of Large Ruminants (ETB/Head)
(F
OB
) P
ric
e o
f la
rg
e
ru
min
an
ts' m
eat
(US
D/K
g)

48
1. Improve market linkages to diversify supply and avoid price increases associated
with monopoly providers, buying small quantities of animals from different suppliers
2. Maintain livestock inventory to control costs while ensuring continuous
production, even when market prices are high
3. Secure access to water and land for fodder, to sustain increased livestock inventory
during periods of drought
4. Provide two-week fattening facilities for underweight animals before slaughter
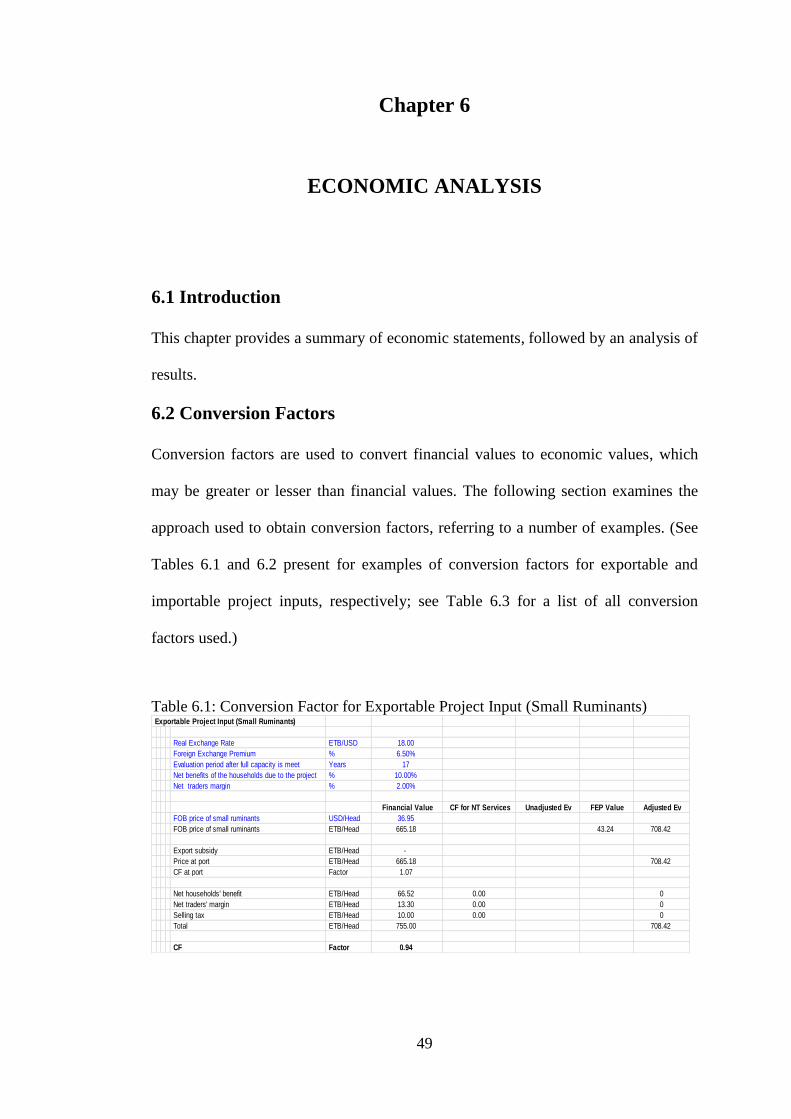
49
Chapter 6
ECONOMIC ANALYSIS
6.1 Introduction
This chapter provides a summary of economic statements, followed by an analysis of
results.
6.2 Conversion Factors
Conversion factors are used to convert financial values to economic values, which
may be greater or lesser than financial values. The following section examines the
approach used to obtain conversion factors, referring to a number of examples. (See
Tables 6.1 and 6.2 present for examples of conversion factors for exportable and
importable project inputs, respectively; see Table 6.3 for a list of all conversion
factors used.)
Table 6.1: Conversion Factor for Exportable Project Input (Small Ruminants)
Exportable Project Input (Small Ruminants)
Real Exchange Rate ETB/USD
Foreign Exchange Premium %
Evaluation period after full capacity is meet Years
Net benefits of the households due to the project %
Net traders margin %
FOB price of small ruminants USD/Head
FOB price of small ruminants ETB/Head
Export subsidy ETB/Head
Price at port ETB/Head
CF at port Factor
Net households' benefit ETB/Head
Net traders' margin ETB/Head
Selling tax ETB/Head
Total ETB/Head
CF Factor
CF for NT Services Unadjusted Ev FEP Value Adjusted Ev
36.95
43.24 708.42
-
665.18
1.07
66.52
665.18
708.42
00.00
0.00
0
0
708.42
0.00
10.00
755.00
0.94
18.00
6.50%
17
10.00%
2.00%
13.30
Financial Value
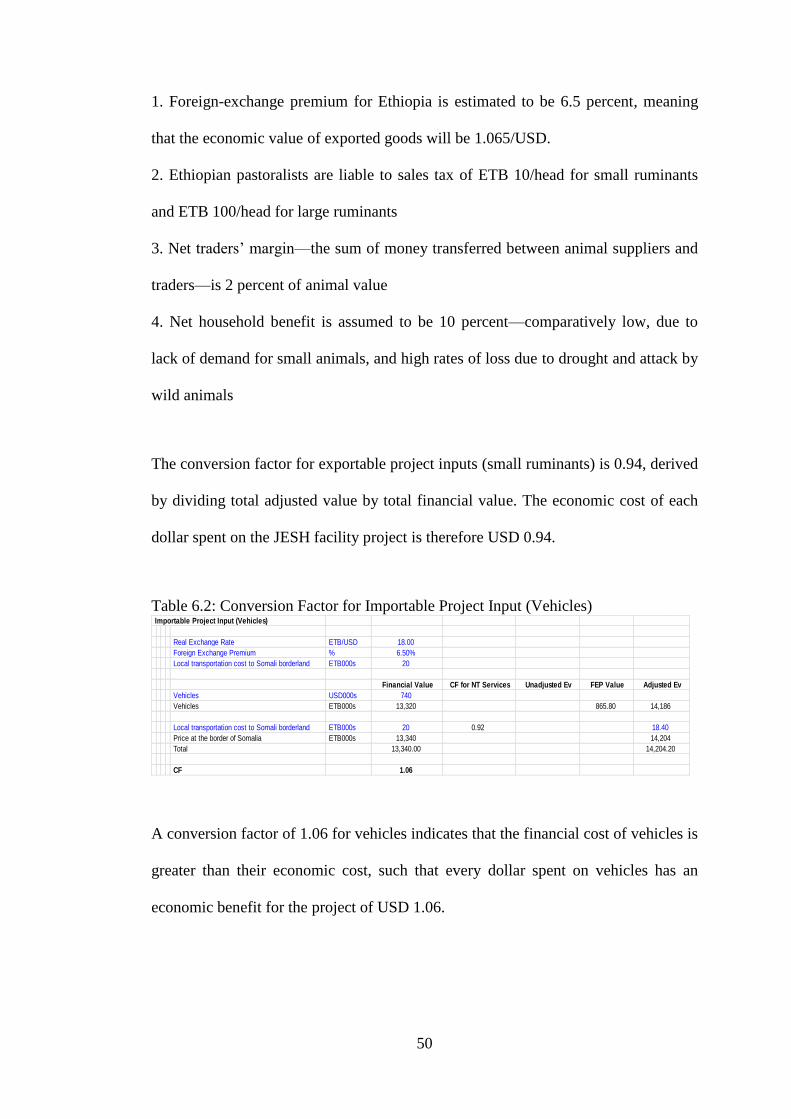
50
1. Foreign-exchange premium for Ethiopia is estimated to be 6.5 percent, meaning
that the economic value of exported goods will be 1.065/USD.
2. Ethiopian pastoralists are liable to sales tax of ETB 10/head for small ruminants
and ETB 100/head for large ruminants
3. Net traders’ margin—the sum of money transferred between animal suppliers and
traders—is 2 percent of animal value
4. Net household benefit is assumed to be 10 percent—comparatively low, due to
lack of demand for small animals, and high rates of loss due to drought and attack by
wild animals
The conversion factor for exportable project inputs (small ruminants) is 0.94, derived
by dividing total adjusted value by total financial value. The economic cost of each
dollar spent on the JESH facility project is therefore USD 0.94.
Table 6.2: Conversion Factor for Importable Project Input (Vehicles)
A conversion factor of 1.06 for vehicles indicates that the financial cost of vehicles is
greater than their economic cost, such that every dollar spent on vehicles has an
economic benefit for the project of USD 1.06.
Importable Project Input (Vehicles)
Real Exchange Rate ETB/USD
Foreign Exchange Premium %
Local transportation cost to Somali borderland ETB000s
Vehicles USD000s
Vehicles ETB000s
Local transportation cost to Somali borderland ETB000s
Price at the border of Somalia ETB000s
Total
CF
Adjusted Ev
14,186
14,204
14,204.20
FEP Value
865.80
18.40
Unadjusted Ev
1.06
CF for NT Services
0.92
20
740
Financial Value
13,320
20
13,340
13,340.00
6.50%
18.00
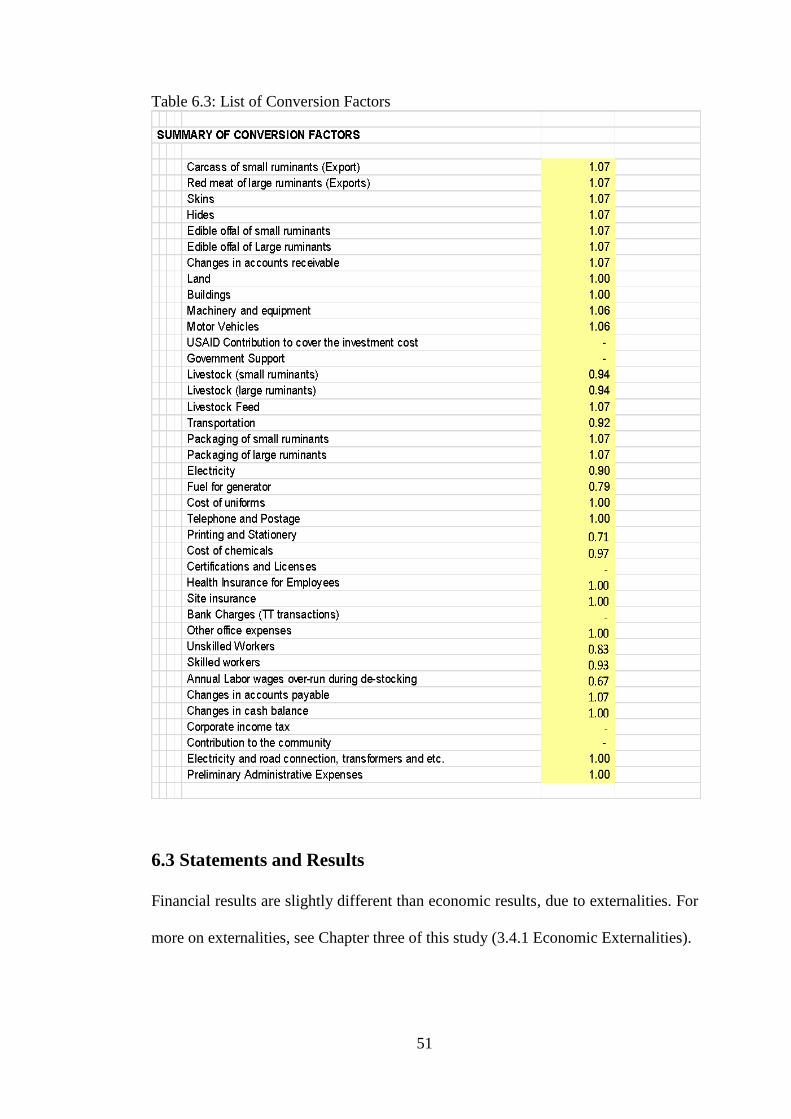
51
Table 6.3: List of Conversion Factors
6.3 Statements and Results
Financial results are slightly different than economic results, due to externalities. For
more on externalities, see Chapter three of this study (3.4.1 Economic Externalities).
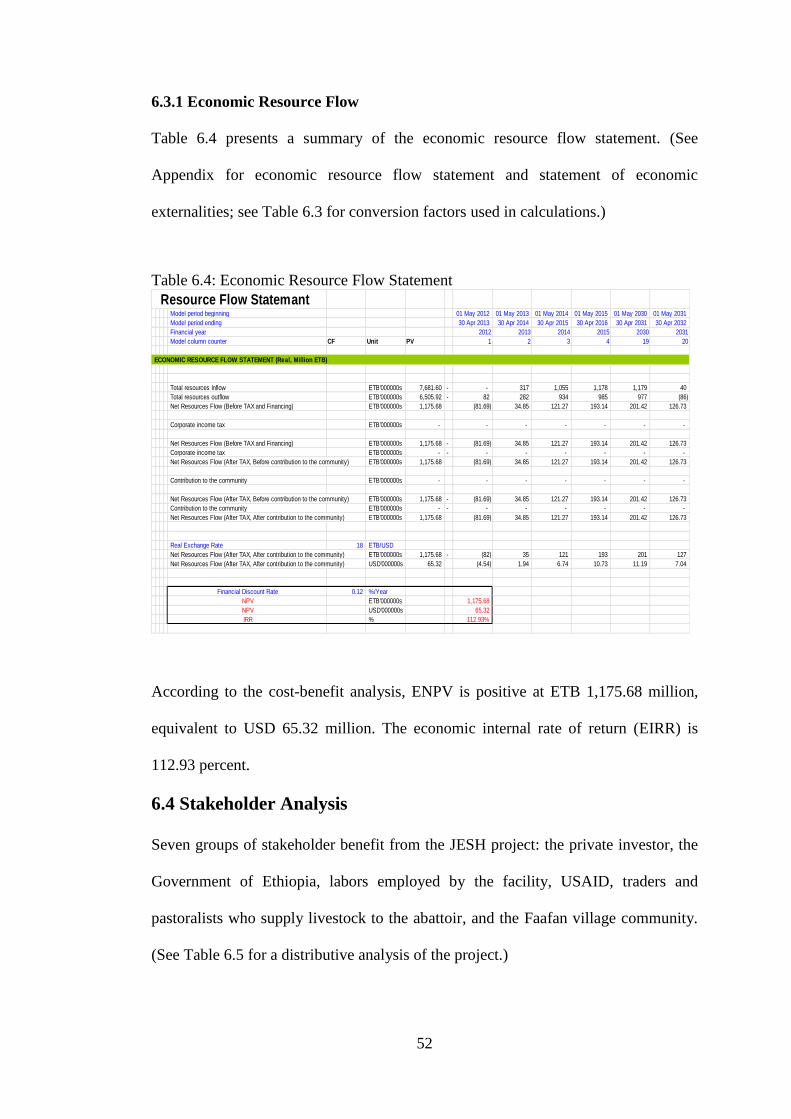
52
6.3.1 Economic Resource Flow
Table 6.4 presents a summary of the economic resource flow statement. (See
Appendix for economic resource flow statement and statement of economic
externalities; see Table 6.3 for conversion factors used in calculations.)
Table 6.4: Economic Resource Flow Statement
According to the cost-benefit analysis, ENPV is positive at ETB 1,175.68 million,
equivalent to USD 65.32 million. The economic internal rate of return (EIRR) is
112.93 percent.
6.4 Stakeholder Analysis
Seven groups of stakeholder benefit from the JESH project: the private investor, the
Government of Ethiopia, labors employed by the facility, USAID, traders and
pastoralists who supply livestock to the abattoir, and the Faafan village community.
(See Table 6.5 for a distributive analysis of the project.)
Resource Flow Statemant Model period beginning 01 May 2012 01 May 2013 01 May 2014 01 May 2015 01 May 2030 01 May 2031
Model period ending 30 Apr 2013 30 Apr 2014 30 Apr 2015 30 Apr 2016 30 Apr 2031 30 Apr 2032
Financial year 2012 2013 2014 2015 2030 2031
Model column counter CF Unit PV 1 2 3 4 19 20
ECONOMIC RESOURCE FLOW STATEMENT (Real, Million ETB)
Total resources Inflow ETB'000000s 7,681.60 - - 317 1,055 1,178 1,179 40
Total resources outflow ETB'000000s 6,505.92 - 82 282 934 985 977 (86)
Net Resources Flow (Before TAX and Financing) ETB'000000s 1,175.68 (81.69) 34.85 121.27 193.14 201.42 126.73
Corporate income tax ETB'000000s - - - - - - -
Net Resources Flow (Before TAX and Financing) ETB'000000s 1,175.68 - (81.69) 34.85 121.27 193.14 201.42 126.73
Corporate income tax ETB'000000s - - - - - - - -
Net Resources Flow (After TAX, Before contribution to the community) ETB'000000s 1,175.68 (81.69) 34.85 121.27 193.14 201.42 126.73
Contribution to the community ETB'000000s - - - - - - -
Net Resources Flow (After TAX, Before contribution to the community) ETB'000000s 1,175.68 - (81.69) 34.85 121.27 193.14 201.42 126.73
Contribution to the community ETB'000000s - - - - - - - -
Net Resources Flow (After TAX, After contribution to the community) ETB'000000s 1,175.68 (81.69) 34.85 121.27 193.14 201.42 126.73
Real Exchange Rate 18 ETB/USD
Net Resources Flow (After TAX, After contribution to the community) ETB'000000s 1,175.68 - (82) 35 121 193 201 127
Net Resources Flow (After TAX, After contribution to the community) USD'000000s 65.32 (4.54) 1.94 6.74 10.73 11.19 7.04
Financial Discount Rate 0.12 %/Year
NPV ETB'000000s 1,175.68
NPV USD'000000s 65.32
IRR % 112.93%
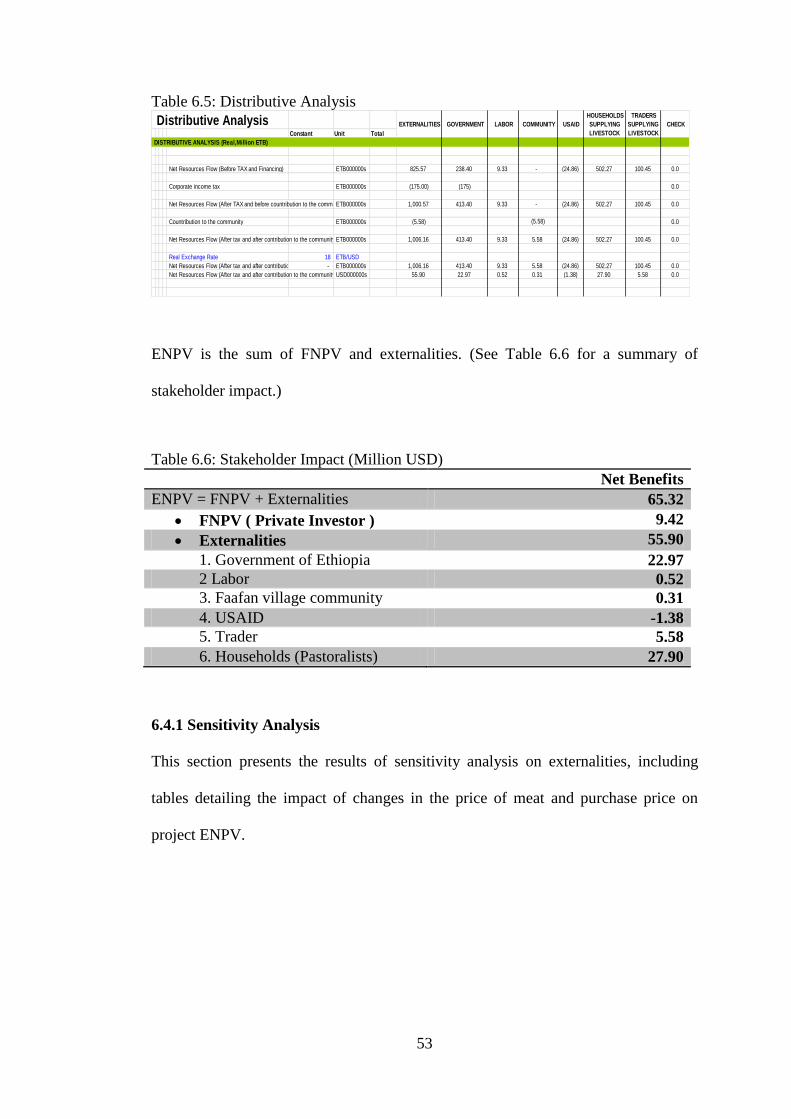
53
Table 6.5: Distributive Analysis
ENPV is the sum of FNPV and externalities. (See Table 6.6 for a summary of
stakeholder impact.)
Table 6.6: Stakeholder Impact (Million USD)
Net Benefits
ENPV = FNPV + Externalities 65.32
FNPV ( Private Investor ) 9.42
Externalities 55.90
1. Government of Ethiopia 22.97
2 Labor 0.52
3. Faafan village community 0.31
4. USAID -1.38
5. Trader 5.58
6. Households (Pastoralists) 27.90
6.4.1 Sensitivity Analysis
This section presents the results of sensitivity analysis on externalities, including
tables detailing the impact of changes in the price of meat and purchase price on
project ENPV.
Distributive AnalysisConstant Unit Total
DISTRIBUTIVE ANALYSIS (Real,Million ETB)
Net Resources Flow (Before TAX and Financing) ETB000000s
Corporate income tax ETB000000s
Net Resources Flow (After TAX and before countribution to the community ETB000000s
Countribution to the community ETB000000s
Net Resources Flow (After tax and after contribution to the community) ETB000000s
Real Exchange Rate 18 ETB/USD
Net Resources Flow (After tax and after contribution to the community)- ETB000000s
Net Resources Flow (After tax and after contribution to the community) USD000000s
TRADERS
SUPPLYING
LIVESTOCK
CHECK
HOUSEHOLDS
SUPPLYING
LIVESTOCK
55.90 22.97 0.52 0.31 (1.38)
1,006.16 413.40 9.33 5.58 (24.86)
1,006.16 413.40 9.33 5.58 (24.86)
(5.58) (5.58)
1,000.57 413.40 9.33 - (24.86)
(175.00) (175)
825.57 238.40 9.33 - (24.86)
EXTERNALITIES GOVERNMENT LABOR COMMUNITY USAID
502.27
502.27
502.27
502.27
27.90
100.45
100.45
100.45
100.45
5.58
0.0
0.0
0.0
0.0
0.0
0.0
0.0
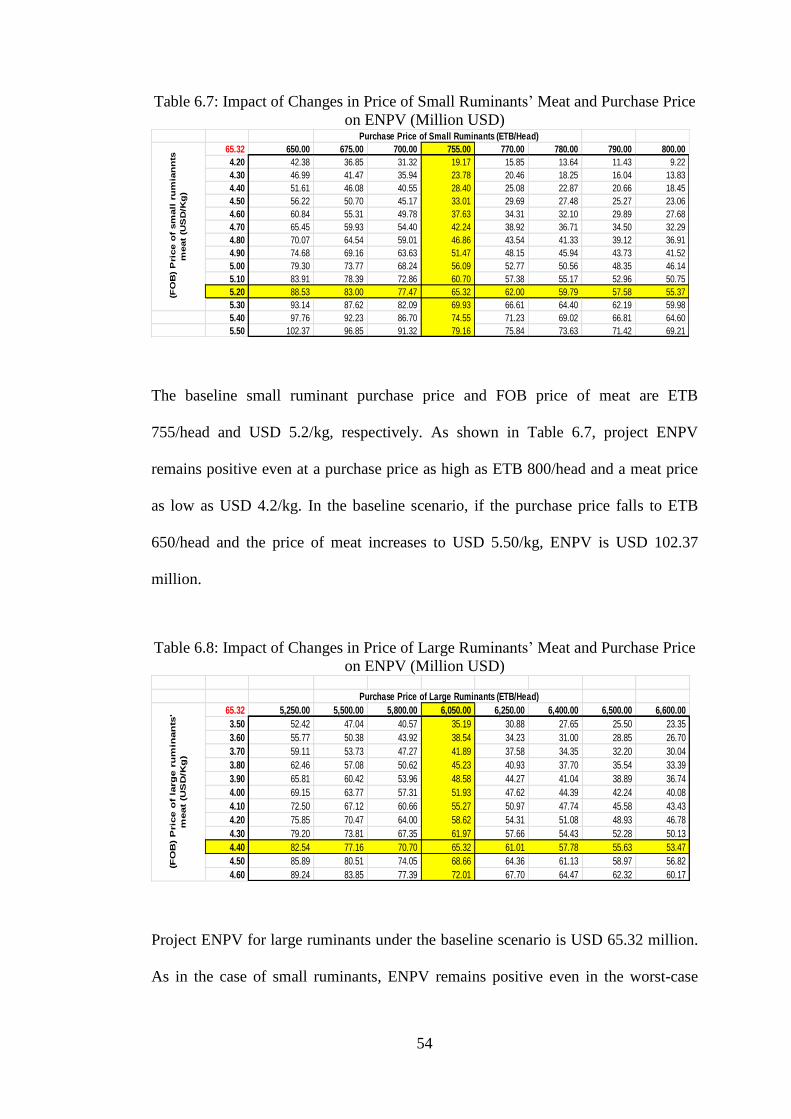
54
Table 6.7: Impact of Changes in Price of Small Ruminants’ Meat and Purchase Price
on ENPV (Million USD)
The baseline small ruminant purchase price and FOB price of meat are ETB
755/head and USD 5.2/kg, respectively. As shown in Table 6.7, project ENPV
remains positive even at a purchase price as high as ETB 800/head and a meat price
as low as USD 4.2/kg. In the baseline scenario, if the purchase price falls to ETB
650/head and the price of meat increases to USD 5.50/kg, ENPV is USD 102.37
million.
Table 6.8: Impact of Changes in Price of Large Ruminants’ Meat and Purchase Price
on ENPV (Million USD)
Project ENPV for large ruminants under the baseline scenario is USD 65.32 million.
As in the case of small ruminants, ENPV remains positive even in the worst-case
65.32 650.00 675.00 700.00 755.00 770.00 780.00 790.00 800.00
4.20 42.38 36.85 31.32 19.17 15.85 13.64 11.43 9.22
4.30 46.99 41.47 35.94 23.78 20.46 18.25 16.04 13.83
4.40 51.61 46.08 40.55 28.40 25.08 22.87 20.66 18.45
4.50 56.22 50.70 45.17 33.01 29.69 27.48 25.27 23.06
4.60 60.84 55.31 49.78 37.63 34.31 32.10 29.89 27.68
4.70 65.45 59.93 54.40 42.24 38.92 36.71 34.50 32.29
4.80 70.07 64.54 59.01 46.86 43.54 41.33 39.12 36.91
4.90 74.68 69.16 63.63 51.47 48.15 45.94 43.73 41.52
5.00 79.30 73.77 68.24 56.09 52.77 50.56 48.35 46.14
5.10 83.91 78.39 72.86 60.70 57.38 55.17 52.96 50.75
5.20 88.53 83.00 77.47 65.32 62.00 59.79 57.58 55.37
5.30 93.14 87.62 82.09 69.93 66.61 64.40 62.19 59.98
5.40 97.76 92.23 86.70 74.55 71.23 69.02 66.81 64.60
5.50 102.37 96.85 91.32 79.16 75.84 73.63 71.42 69.21
(F
OB
) P
ric
e o
f sm
all
ru
mia
nn
ts
meat
(US
D/K
g)
Purchase Price of Small Ruminants (ETB/Head)
65.32 5,250.00 5,500.00 5,800.00 6,050.00 6,250.00 6,400.00 6,500.00 6,600.00
3.50 52.42 47.04 40.57 35.19 30.88 27.65 25.50 23.35
3.60 55.77 50.38 43.92 38.54 34.23 31.00 28.85 26.70
3.70 59.11 53.73 47.27 41.89 37.58 34.35 32.20 30.04
3.80 62.46 57.08 50.62 45.23 40.93 37.70 35.54 33.39
3.90 65.81 60.42 53.96 48.58 44.27 41.04 38.89 36.74
4.00 69.15 63.77 57.31 51.93 47.62 44.39 42.24 40.08
4.10 72.50 67.12 60.66 55.27 50.97 47.74 45.58 43.43
4.20 75.85 70.47 64.00 58.62 54.31 51.08 48.93 46.78
4.30 79.20 73.81 67.35 61.97 57.66 54.43 52.28 50.13
4.40 82.54 77.16 70.70 65.32 61.01 57.78 55.63 53.47
4.50 85.89 80.51 74.05 68.66 64.36 61.13 58.97 56.82
4.60 89.24 83.85 77.39 72.01 67.70 64.47 62.32 60.17
Purchase Price of Large Ruminants (ETB/Head)
(F
OB
) P
ric
e o
f la
rg
e r
um
inan
ts'
meat
(US
D/K
g)
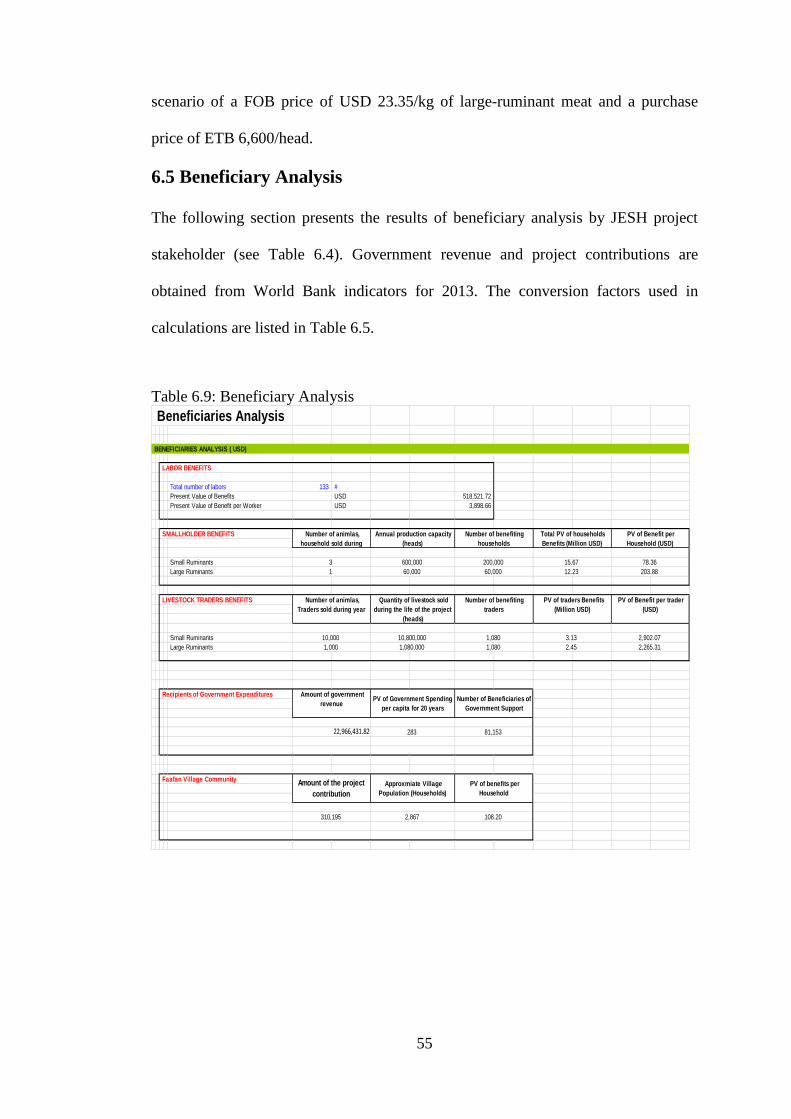
55
scenario of a FOB price of USD 23.35/kg of large-ruminant meat and a purchase
price of ETB 6,600/head.
6.5 Beneficiary Analysis
The following section presents the results of beneficiary analysis by JESH project
stakeholder (see Table 6.4). Government revenue and project contributions are
obtained from World Bank indicators for 2013. The conversion factors used in
calculations are listed in Table 6.5.
Table 6.9: Beneficiary Analysis
Beneficiaries Analysis
BENEFICIARIES ANALYSIS ( USD)
LABOR BENEFITS
Total number of labors 133 #
Present Value of Benefits USD 518,521.72
Present Value of Benefit per Worker USD 3,898.66
SMALLHOLDER BENEFITS
Small Ruminants
Large Ruminants
LIVESTOCK TRADERS BENEFITS
Small Ruminants
Large Ruminants
Recipients of Government Expenditures
Faafan Village Community
Number of animlas,
household sold during
Annual production capacity
(heads)
Number of benefiting
households
Total PV of households
Benefits (Million USD)
PV of Benefit per
Household (USD)
203.881
600,000
60,000
200,000
60,000
15.67
12.23
3 78.36
3.13 2,902.07
1,000 1,080,000 1,080 2.45 2,265.31
PV of traders Benefits
(Million USD)
PV of Benefit per trader
(USD)
Amount of government
revenuePV of Government Spending
per capita for 20 years
Number of Beneficiaries of
Government Support
Quantity of livestock sold
during the life of the project
(heads)
Number of animlas,
Traders sold during year
Number of benefiting
traders
10,000 10,800,000 1,080
81,153
Amount of the project
contribution
Approxmiate Village
Population (Households)
PV of benefits per
Household
22,966,431.82 283
108.20310,195 2,867
56
Chapter 7
CONCLUSION AND RECOMMENDATIONS
Cost-benefit analysis of the JESH facility investment indicates that project FNPV
and FIRR are positive from both the owner and the total investment perspectives. In
addition, ENPV is positive, indicating that as well as benefiting pastoralists, the
establishment of a commercial slaughterhouse is beneficial to the broader national
economy.
USAID’s Feed the Future (FtF) program supports projects that improve household
incomes. The large NPV of the JESH project demonstrates that the facility will
enhance household incomes, in line with FtF aims.
The high transportation costs and poor road conditions faced by pastoralists taking
animals to market result in a high death rate among kids and lambs, in particular.
Additional risks are entailed in taking animals to border markets to be sold. The
JESH facility will create a new, accessible market for the meat of small animals,
leads to an increase in household wellbeing.
The existence of a local slaughterhouse also helps pastoralists cope with the
incidence of drought, facilitating the timely and efficient destocking of herds, in
exchange for earnings sufficient to sustain remaining livestock.
57
In addition, the high project NPV will serve to attract other investors to the area,
including in the construction of more slaughterhouses, further improving local
livelihoods, while introducing the competition needed to ensure that the existing
facility continues to operate efficiently. At the same time, the increased demand for
livestock will boost prices paid to pastoralists, further increasing household incomes.
However, the JESH facility faces a number of challenges. First, the abattoir needs to
further strengthen linkages with pastoralists with a view to gaining their trust and so
securing a reliable supply of livestock, ensuring a steady rate of plant utilization.
Second, JESH must exercise caution in the managing livestock inventory, in order to
protect against spikes in prices. Similarly, the facility must alert to the onset of
drought, when feeding costs as well as the supply of livestock increase.
Key project risks can be summarized as follows:
1. Lack of trust: pastoralists in the region tend to keep small ruminants for several
years until they have grown, in order to sell them at a higher price
2. First-mover risk: war and political instability have limited private investment in
the Somali region, exposing JESH to challenges in isolation
3. Animal disease: a major outbreak could severely hamper exports
4. Drought: facility income may increase in periods of drought due to the lower cost
of livestock but feeding and watering costs will increase significantly
58
REFERENCES
Abdirahman, A., Mohamed, A., Warsame, A., Sheriff Nur, T., Kasim, M., &
Mohamud, M. (2012). Somali Region ,Deyr 2012 Multi Agency Need
Assessment Report (pp. 2-3).
Aklilu, Y., & Catley, A. (2010). Mind the Gap Commercialization, Livelihoods and
Wealth Disparity in Pastoralist Areas of Ethiopia (p. 11). UKaid.
Amaledegn, A. (2011). Marketing Your Sheep and Goats (pp. 3-4). ESGPIP.
Berhanu Gebremedhin, Hoekstra D and Samson Jemaneh. 2007. Heading Towards
Commercialization? The Case of Live Animal Marketing in Ethiopia. Improving
Productivity and Market Success (IPMS) of Ethiopian Farmers Project
WorkingPaper 5. ILRI (International Livestock Research Institute), Nairobi,
Kenya. (p. 77)
Business Portal,. (2011). Jigjiga Export Slaughter House PLC. Retrieved 3
September 2015, from http://www.businessportals.com/supplier/jeshplc.html
Deressa, T T, 2006 Measuring the Economic Impact of Climate Change on Ethiopian
Agriculture: Ricardian Approach. CEEPA Discussion Paper No.25. Centre for
Environmental Economics and Policy in Africa: University of Pretoria.
Devereux, S. (2006). Vulnerable Livelihoods in Somali Region, Ethiopia (p. 52).
IDS.
59
Eid, A. (2014). Jostling for Trade: The Politics of Livestock Marketing on the
Ethiopia - Somaliland Border (pp. 4-5). Future Agriculture.
Fadiga, M. Legese, G. 2014. Small Ruminant Value Chain Development in Ethiopia:
Situation Analysis and Trends. ICARDA/ILRI Project Report. Nairobi, Kenya:
International Center for Agricultural Research in the Dry Areas/International
Livestock Research Institute.
FAO,. (2014). Somalia Registers Record Exports of 5 Million Livestock in 2014.
Retrieved 17 November 2015, from
http://www.fao.org/news/story/en/item/283777/icode/
fast-standard,. (2014). The FAST Standard Practical, Structured Design Rules for
Financial Modelling. Retrieved 26 July 2015, from
http://www.fast-standard.org/the-fast-standard/
Gathege, D., & Ruparelia, S. (2012). Assessment of Environmental, Institutional and
Individual Leadership Capacity Needs for the Knowledge Society in Ethiopia
(p. 19). geSCI.
Hare, H. (2007). Survey of ICT in Education in Ethiopia. Survey of ICT and
Education in Africa (Volume 2): 53 Country Reports. Washington, DC: infoDev /
World Bank.
ITAB-CONSULT PLC,. (2006). Addis Ababa Chamber of Commerce and Sectoral
Association (pp. 37-38).
60
Jabbar, M., & Ayele, G. (2004). Livestock Marketing, Food Security and Related
Issues in Ethiopia (pp. 9-10). Ethiopian Agricultural Research Organisation.
Jenkins, G., & Miklyaev, M. (2013). Economic Feasibility of a First-mover Abattoir
Establishment in Somali Region, Ethiopia (pp. 3-6).
Jeshplc,. (2012). Retrieved 10 July 2015, from http://www.jeshplc.com/
Legese, G., Haile, A., Duncan, A.J., Dessie, T., Gizaw, S. and Rischkowsky, B.
2014. Sheep and Goat Value Chains in Ethiopia: A Synthesis of Opportunities
and Constraints. ICARDA/ILRI Project Report. Nairobi, Kenya: International
Center for Agricultural Research in the Dry Areas/International Livestock
Research Institute.
Mercy Corps,. (2013). Pastoralists Areas Resilience Improvement and Market
Expansion (PRIME) Project (p. 10). USAID/Ethiopia.
Mercy Corps,. (2015). Pastoralist Areas Resilience Improvement Through Market
Expansion (PRIME) Project (p. 2). USAID/Ethiopia.
Negassa, A. and Jabbar, M. 2008. Livestock Ownership, Commercial Off-take Rates
and Their Determinants in Ethiopia. ILRI Research Report 19. Nairobi, Kenya:
ILRI.
Negassa, N., Shahidur, R. and Gebremedhin, B. 2011. Livestock Production and
Marketing. ESSP Working Paper 26.Washington, DC, USA: IFPRI.
61
Pavanello, S. (2010). Livestock marketing in Kenya- Ethiopia Border Areas: A
Baseline Study (p. 26). Humanitarian Policy Group.
Solomon, A., Workalemahu, A., Jabbar, M., Hurissa, A., and Hurissa, B. (2003).
Livestock Marketing in Ethiopia: A Review of Structure, Performance and
Development Initiatives (pp. 23-24).
World Bank,. (2012). International Development Association and International
Finance Corporation and Multilateral Investment Guarantee Agency Country
Partnership Strategy for the Federal Democratic Republic of Ethiopia (p. 14).
World Bank Group,. (2013). World Development Indicators: Size of the Economy
(p.69).
World Bank,. (2014). Economic Overview. Retrieved 20 September 2015, from
http://www.worldbank.org/en/country/ethiopia/overview
Yami, A. (2010). Sheep and goat transport (pp. 1-2). ESGPIP.
62
APPENDIX
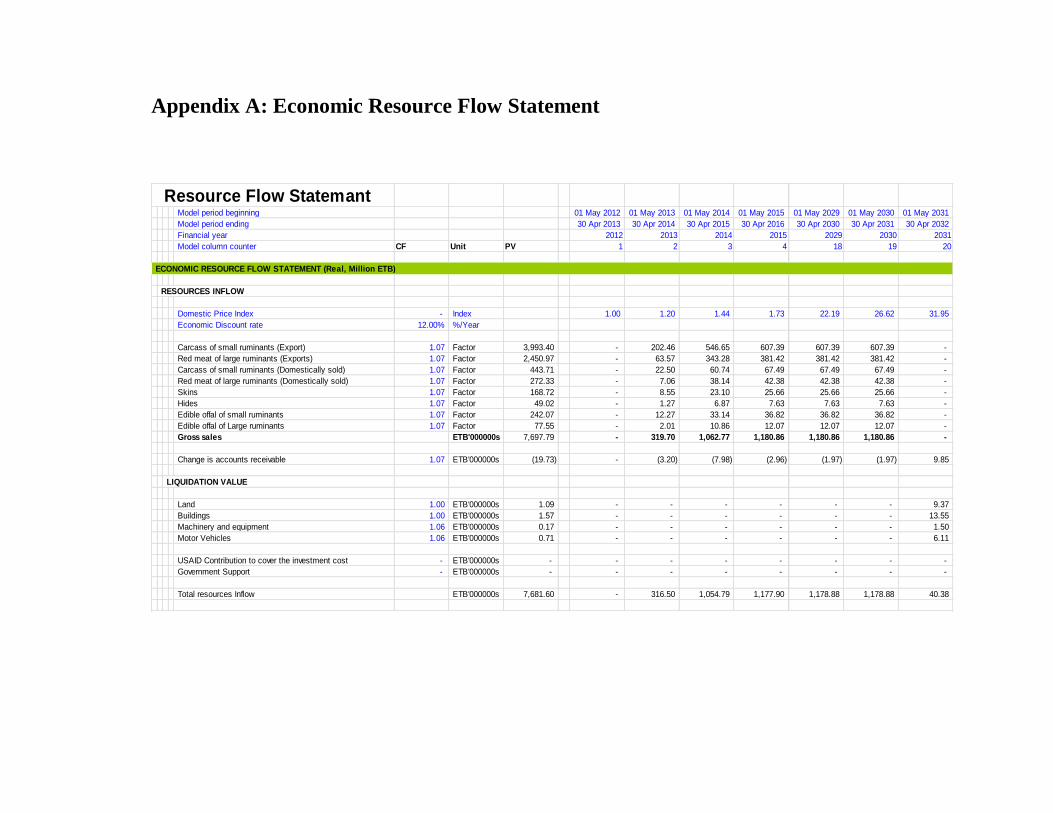
Appendix A: Economic Resource Flow Statement
Resource Flow Statemant Model period beginning 01 May 2012 01 May 2013 01 May 2014 01 May 2015 01 May 2029 01 May 2030 01 May 2031
Model period ending 30 Apr 2013 30 Apr 2014 30 Apr 2015 30 Apr 2016 30 Apr 2030 30 Apr 2031 30 Apr 2032
Financial year 2012 2013 2014 2015 2029 2030 2031
Model column counter CF Unit PV 1 2 3 4 18 19 20
ECONOMIC RESOURCE FLOW STATEMENT (Real, Million ETB)
RESOURCES INFLOW
Domestic Price Index - Index 1.00 1.20 1.44 1.73 22.19 26.62 31.95
Economic Discount rate 12.00% %/Year
Carcass of small ruminants (Export) 1.07 Factor 3,993.40 - 202.46 546.65 607.39 607.39 607.39 -
Red meat of large ruminants (Exports) 1.07 Factor 2,450.97 - 63.57 343.28 381.42 381.42 381.42 -
Carcass of small ruminants (Domestically sold) 1.07 Factor 443.71 - 22.50 60.74 67.49 67.49 67.49 -
Red meat of large ruminants (Domestically sold) 1.07 Factor 272.33 - 7.06 38.14 42.38 42.38 42.38 -
Skins 1.07 Factor 168.72 - 8.55 23.10 25.66 25.66 25.66 -
Hides 1.07 Factor 49.02 - 1.27 6.87 7.63 7.63 7.63 -
Edible offal of small ruminants 1.07 Factor 242.07 - 12.27 33.14 36.82 36.82 36.82 -
Edible offal of Large ruminants 1.07 Factor 77.55 - 2.01 10.86 12.07 12.07 12.07 -
Gross sales ETB'000000s 7,697.79 - 319.70 1,062.77 1,180.86 1,180.86 1,180.86 -
Change is accounts receivable 1.07 ETB'000000s (19.73) - (3.20) (7.98) (2.96) (1.97) (1.97) 9.85
LIQUIDATION VALUE
Land 1.00 ETB'000000s 1.09 - - - - - - 9.37
Buildings 1.00 ETB'000000s 1.57 - - - - - - 13.55
Machinery and equipment 1.06 ETB'000000s 0.17 - - - - - - 1.50
Motor Vehicles 1.06 ETB'000000s 0.71 - - - - - - 6.11
USAID Contribution to cover the investment cost - ETB'000000s - - - - - - - -
Government Support - ETB'000000s - - - - - - - -
Total resources Inflow ETB'000000s 7,681.60 - 316.50 1,054.79 1,177.90 1,178.88 1,178.88 40.38
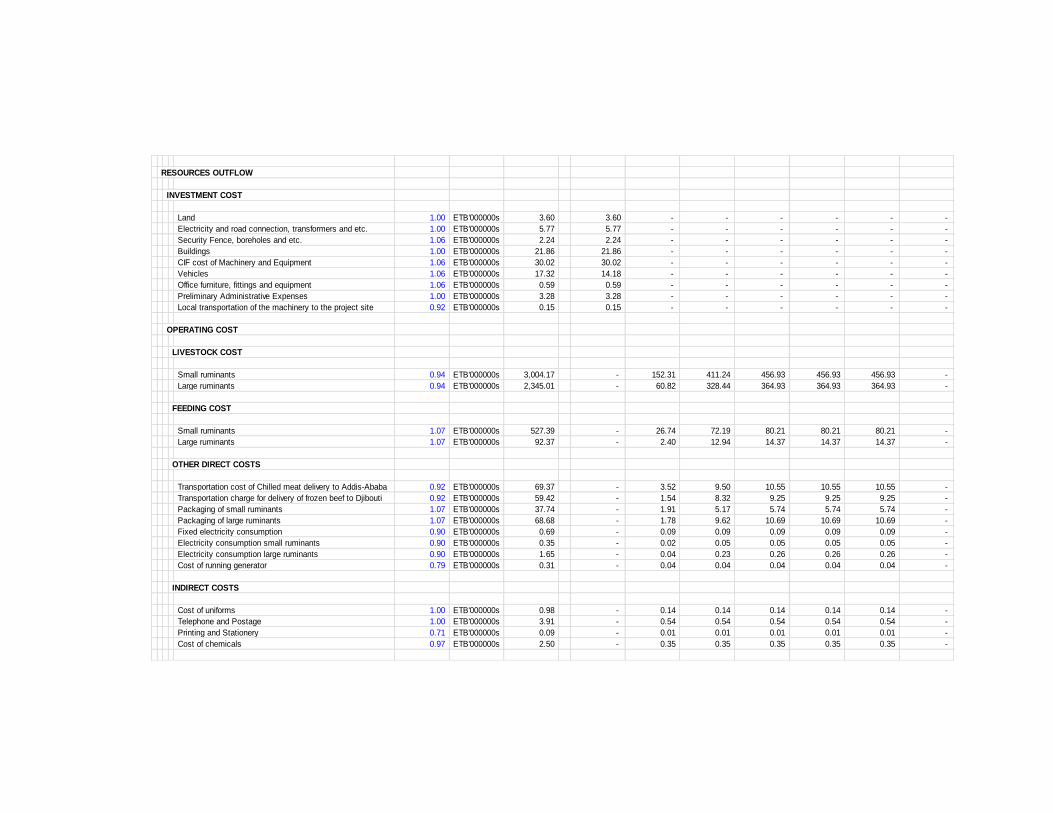
RESOURCES OUTFLOW
INVESTMENT COST
Land 1.00 ETB'000000s 3.60 3.60 - - - - - -
Electricity and road connection, transformers and etc. 1.00 ETB'000000s 5.77 5.77 - - - - - -
Security Fence, boreholes and etc. 1.06 ETB'000000s 2.24 2.24 - - - - - -
Buildings 1.00 ETB'000000s 21.86 21.86 - - - - - -
CIF cost of Machinery and Equipment 1.06 ETB'000000s 30.02 30.02 - - - - - -
Vehicles 1.06 ETB'000000s 17.32 14.18 - - - - - -
Office furniture, fittings and equipment 1.06 ETB'000000s 0.59 0.59 - - - - - -
Preliminary Administrative Expenses 1.00 ETB'000000s 3.28 3.28 - - - - - -
Local transportation of the machinery to the project site 0.92 ETB'000000s 0.15 0.15 - - - - - -
OPERATING COST
LIVESTOCK COST
Small ruminants 0.94 ETB'000000s 3,004.17 - 152.31 411.24 456.93 456.93 456.93 -
Large ruminants 0.94 ETB'000000s 2,345.01 - 60.82 328.44 364.93 364.93 364.93 -
FEEDING COST
Small ruminants 1.07 ETB'000000s 527.39 - 26.74 72.19 80.21 80.21 80.21 -
Large ruminants 1.07 ETB'000000s 92.37 - 2.40 12.94 14.37 14.37 14.37 -
OTHER DIRECT COSTS
Transportation cost of Chilled meat delivery to Addis-Ababa 0.92 ETB'000000s 69.37 - 3.52 9.50 10.55 10.55 10.55 -
Transportation charge for delivery of frozen beef to Djibouti 0.92 ETB'000000s 59.42 - 1.54 8.32 9.25 9.25 9.25 -
Packaging of small ruminants 1.07 ETB'000000s 37.74 - 1.91 5.17 5.74 5.74 5.74 -
Packaging of large ruminants 1.07 ETB'000000s 68.68 - 1.78 9.62 10.69 10.69 10.69 -
Fixed electricity consumption 0.90 ETB'000000s 0.69 - 0.09 0.09 0.09 0.09 0.09 -
Electricity consumption small ruminants 0.90 ETB'000000s 0.35 - 0.02 0.05 0.05 0.05 0.05 -
Electricity consumption large ruminants 0.90 ETB'000000s 1.65 - 0.04 0.23 0.26 0.26 0.26 -
Cost of running generator 0.79 ETB'000000s 0.31 - 0.04 0.04 0.04 0.04 0.04 -
INDIRECT COSTS
Cost of uniforms 1.00 ETB'000000s 0.98 - 0.14 0.14 0.14 0.14 0.14 -
Telephone and Postage 1.00 ETB'000000s 3.91 - 0.54 0.54 0.54 0.54 0.54 -
Printing and Stationery 0.71 ETB'000000s 0.09 - 0.01 0.01 0.01 0.01 0.01 -
Cost of chemicals 0.97 ETB'000000s 2.50 - 0.35 0.35 0.35 0.35 0.35 -
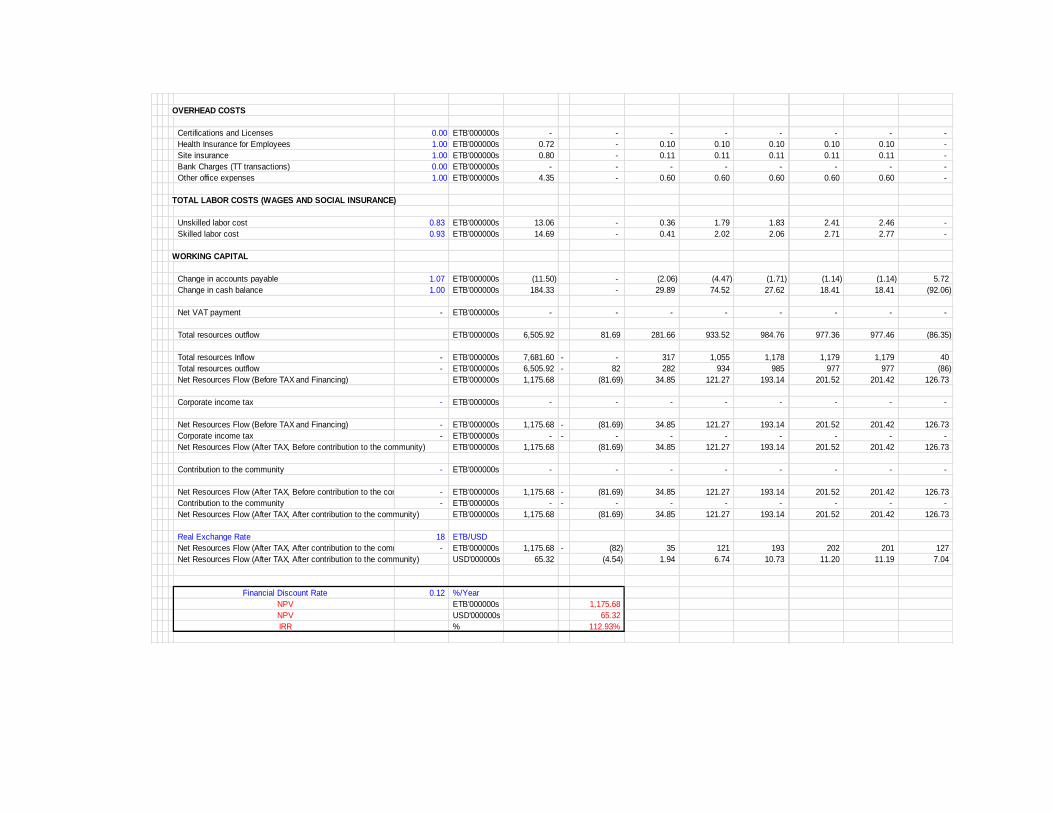
OVERHEAD COSTS
Certifications and Licenses 0.00 ETB'000000s - - - - - - - -
Health Insurance for Employees 1.00 ETB'000000s 0.72 - 0.10 0.10 0.10 0.10 0.10 -
Site insurance 1.00 ETB'000000s 0.80 - 0.11 0.11 0.11 0.11 0.11 -
Bank Charges (TT transactions) 0.00 ETB'000000s - - - - - - - -
Other office expenses 1.00 ETB'000000s 4.35 - 0.60 0.60 0.60 0.60 0.60 -
TOTAL LABOR COSTS (WAGES AND SOCIAL INSURANCE)
Unskilled labor cost 0.83 ETB'000000s 13.06 - 0.36 1.79 1.83 2.41 2.46 -
Skilled labor cost 0.93 ETB'000000s 14.69 - 0.41 2.02 2.06 2.71 2.77 -
WORKING CAPITAL
Change in accounts payable 1.07 ETB'000000s (11.50) - (2.06) (4.47) (1.71) (1.14) (1.14) 5.72
Change in cash balance 1.00 ETB'000000s 184.33 - 29.89 74.52 27.62 18.41 18.41 (92.06)
Net VAT payment - ETB'000000s - - - - - - - -
Total resources outflow ETB'000000s 6,505.92 81.69 281.66 933.52 984.76 977.36 977.46 (86.35)
Total resources Inflow - ETB'000000s 7,681.60 - - 317 1,055 1,178 1,179 1,179 40
Total resources outflow - ETB'000000s 6,505.92 - 82 282 934 985 977 977 (86)
Net Resources Flow (Before TAX and Financing) ETB'000000s 1,175.68 (81.69) 34.85 121.27 193.14 201.52 201.42 126.73
Corporate income tax - ETB'000000s - - - - - - - -
Net Resources Flow (Before TAX and Financing) - ETB'000000s 1,175.68 - (81.69) 34.85 121.27 193.14 201.52 201.42 126.73
Corporate income tax - ETB'000000s - - - - - - - - -
Net Resources Flow (After TAX, Before contribution to the community) ETB'000000s 1,175.68 (81.69) 34.85 121.27 193.14 201.52 201.42 126.73
Contribution to the community - ETB'000000s - - - - - - - -
Net Resources Flow (After TAX, Before contribution to the community) - ETB'000000s 1,175.68 - (81.69) 34.85 121.27 193.14 201.52 201.42 126.73
Contribution to the community - ETB'000000s - - - - - - - - -
Net Resources Flow (After TAX, After contribution to the community) ETB'000000s 1,175.68 (81.69) 34.85 121.27 193.14 201.52 201.42 126.73
Real Exchange Rate 18 ETB/USD
Net Resources Flow (After TAX, After contribution to the community) - ETB'000000s 1,175.68 - (82) 35 121 193 202 201 127
Net Resources Flow (After TAX, After contribution to the community) USD'000000s 65.32 (4.54) 1.94 6.74 10.73 11.20 11.19 7.04
Financial Discount Rate 0.12 %/Year
NPV ETB'000000s 1,175.68
NPV USD'000000s 65.32
IRR % 112.93%
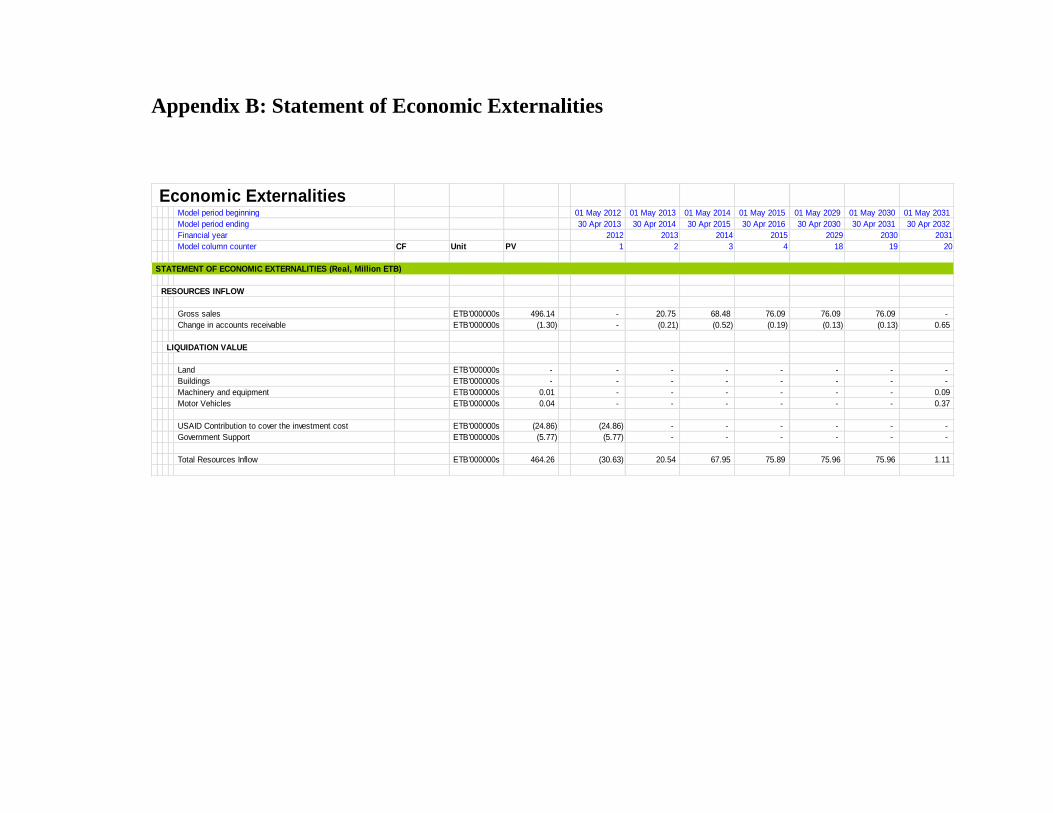
Appendix B: Statement of Economic Externalities
Economic Externalities Model period beginning 01 May 2012 01 May 2013 01 May 2014 01 May 2015 01 May 2029 01 May 2030 01 May 2031
Model period ending 30 Apr 2013 30 Apr 2014 30 Apr 2015 30 Apr 2016 30 Apr 2030 30 Apr 2031 30 Apr 2032
Financial year 2012 2013 2014 2015 2029 2030 2031
Model column counter CF Unit PV 1 2 3 4 18 19 20
STATEMENT OF ECONOMIC EXTERNALITIES (Real, Million ETB)
RESOURCES INFLOW
Gross sales ETB'000000s 496.14 - 20.75 68.48 76.09 76.09 76.09 -
Change in accounts receivable ETB'000000s (1.30) - (0.21) (0.52) (0.19) (0.13) (0.13) 0.65
LIQUIDATION VALUE
Land ETB'000000s - - - - - - - -
Buildings ETB'000000s - - - - - - - -
Machinery and equipment ETB'000000s 0.01 - - - - - - 0.09
Motor Vehicles ETB'000000s 0.04 - - - - - - 0.37
USAID Contribution to cover the investment cost ETB'000000s (24.86) (24.86) - - - - - -
Government Support ETB'000000s (5.77) (5.77) - - - - - -
Total Resources Inflow ETB'000000s 464.26 (30.63) 20.54 67.95 75.89 75.96 75.96 1.11
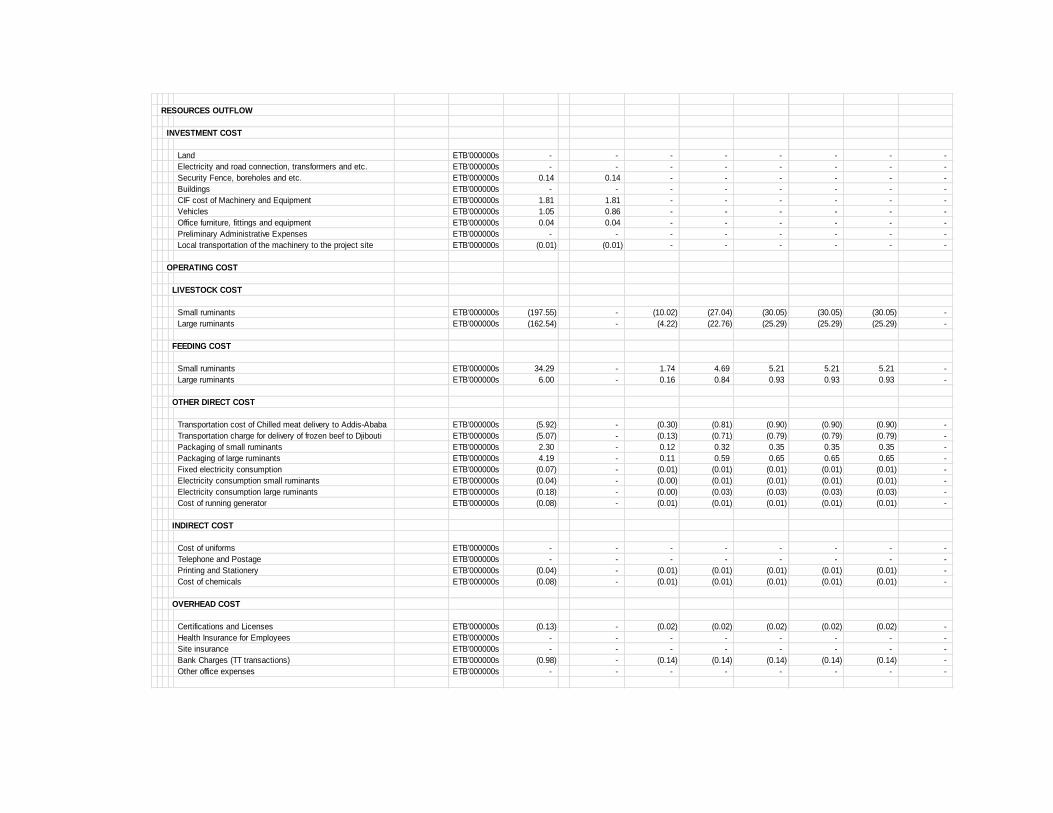
RESOURCES OUTFLOW
INVESTMENT COST
Land ETB'000000s - - - - - - - -
Electricity and road connection, transformers and etc. ETB'000000s - - - - - - - -
Security Fence, boreholes and etc. ETB'000000s 0.14 0.14 - - - - - -
Buildings ETB'000000s - - - - - - - -
CIF cost of Machinery and Equipment ETB'000000s 1.81 1.81 - - - - - -
Vehicles ETB'000000s 1.05 0.86 - - - - - -
Office furniture, fittings and equipment ETB'000000s 0.04 0.04 - - - - - -
Preliminary Administrative Expenses ETB'000000s - - - - - - - -
Local transportation of the machinery to the project site ETB'000000s (0.01) (0.01) - - - - - -
OPERATING COST
LIVESTOCK COST
Small ruminants ETB'000000s (197.55) - (10.02) (27.04) (30.05) (30.05) (30.05) -
Large ruminants ETB'000000s (162.54) - (4.22) (22.76) (25.29) (25.29) (25.29) -
FEEDING COST
Small ruminants ETB'000000s 34.29 - 1.74 4.69 5.21 5.21 5.21 -
Large ruminants ETB'000000s 6.00 - 0.16 0.84 0.93 0.93 0.93 -
OTHER DIRECT COST
Transportation cost of Chilled meat delivery to Addis-Ababa ETB'000000s (5.92) - (0.30) (0.81) (0.90) (0.90) (0.90) -
Transportation charge for delivery of frozen beef to Djibouti ETB'000000s (5.07) - (0.13) (0.71) (0.79) (0.79) (0.79) -
Packaging of small ruminants ETB'000000s 2.30 - 0.12 0.32 0.35 0.35 0.35 -
Packaging of large ruminants ETB'000000s 4.19 - 0.11 0.59 0.65 0.65 0.65 -
Fixed electricity consumption ETB'000000s (0.07) - (0.01) (0.01) (0.01) (0.01) (0.01) -
Electricity consumption small ruminants ETB'000000s (0.04) - (0.00) (0.01) (0.01) (0.01) (0.01) -
Electricity consumption large ruminants ETB'000000s (0.18) - (0.00) (0.03) (0.03) (0.03) (0.03) -
Cost of running generator ETB'000000s (0.08) - (0.01) (0.01) (0.01) (0.01) (0.01) -
INDIRECT COST
Cost of uniforms ETB'000000s - - - - - - - -
Telephone and Postage ETB'000000s - - - - - - - -
Printing and Stationery ETB'000000s (0.04) - (0.01) (0.01) (0.01) (0.01) (0.01) -
Cost of chemicals ETB'000000s (0.08) - (0.01) (0.01) (0.01) (0.01) (0.01) -
OVERHEAD COST
Certifications and Licenses ETB'000000s (0.13) - (0.02) (0.02) (0.02) (0.02) (0.02) -
Health Insurance for Employees ETB'000000s - - - - - - - -
Site insurance ETB'000000s - - - - - - - -
Bank Charges (TT transactions) ETB'000000s (0.98) - (0.14) (0.14) (0.14) (0.14) (0.14) -
Other office expenses ETB'000000s - - - - - - - -
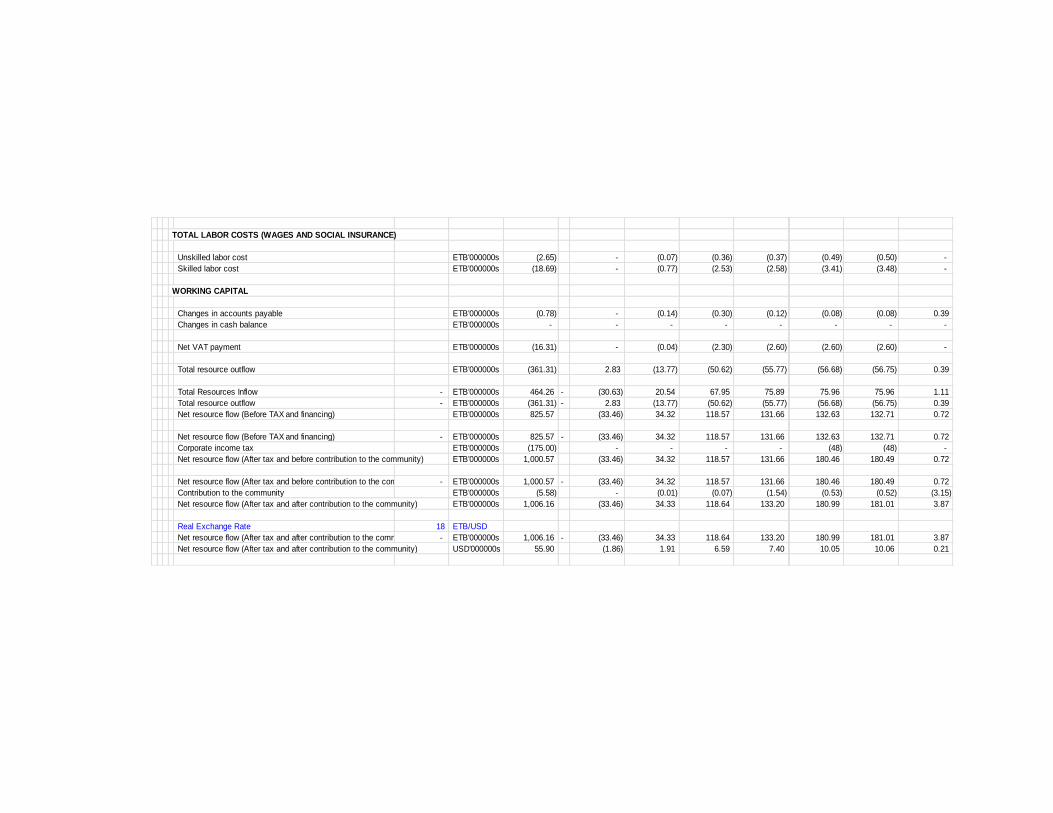
TOTAL LABOR COSTS (WAGES AND SOCIAL INSURANCE)
Unskilled labor cost ETB'000000s (2.65) - (0.07) (0.36) (0.37) (0.49) (0.50) -
Skilled labor cost ETB'000000s (18.69) - (0.77) (2.53) (2.58) (3.41) (3.48) -
WORKING CAPITAL
Changes in accounts payable ETB'000000s (0.78) - (0.14) (0.30) (0.12) (0.08) (0.08) 0.39
Changes in cash balance ETB'000000s - - - - - - - -
Net VAT payment ETB'000000s (16.31) - (0.04) (2.30) (2.60) (2.60) (2.60) -
Total resource outflow ETB'000000s (361.31) 2.83 (13.77) (50.62) (55.77) (56.68) (56.75) 0.39
Total Resources Inflow - ETB'000000s 464.26 - (30.63) 20.54 67.95 75.89 75.96 75.96 1.11
Total resource outflow - ETB'000000s (361.31) - 2.83 (13.77) (50.62) (55.77) (56.68) (56.75) 0.39
Net resource flow (Before TAX and financing) ETB'000000s 825.57 (33.46) 34.32 118.57 131.66 132.63 132.71 0.72
Net resource flow (Before TAX and financing) - ETB'000000s 825.57 - (33.46) 34.32 118.57 131.66 132.63 132.71 0.72
Corporate income tax ETB'000000s (175.00) - - - - (48) (48) -
Net resource flow (After tax and before contribution to the community) ETB'000000s 1,000.57 (33.46) 34.32 118.57 131.66 180.46 180.49 0.72
Net resource flow (After tax and before contribution to the community) - ETB'000000s 1,000.57 - (33.46) 34.32 118.57 131.66 180.46 180.49 0.72
Contribution to the community ETB'000000s (5.58) - (0.01) (0.07) (1.54) (0.53) (0.52) (3.15)
Net resource flow (After tax and after contribution to the community) ETB'000000s 1,006.16 (33.46) 34.33 118.64 133.20 180.99 181.01 3.87
Real Exchange Rate 18 ETB/USD
Net resource flow (After tax and after contribution to the community) - ETB'000000s 1,006.16 - (33.46) 34.33 118.64 133.20 180.99 181.01 3.87
Net resource flow (After tax and after contribution to the community) USD'000000s 55.90 (1.86) 1.91 6.59 7.40 10.05 10.06 0.21