Embed Size (px)
Citation preview

A Feasibility Study for a Micro-hydro Installation for the Strangford Lough Wildfowlers & Conservation
Association
Mark Tamburrini
A Thesis Submitted in Partial Fulfilment of the
Requirements of the Degree of Master of Science
Energy Systems Research Unit Department of Mechanical Engineering University of Strathclyde, Glasgow, UK
September 2004

2
Acknowledgements
I wish to express my thanks to Dr. Paul Strachan at the Department of
Mechanical Engineering, University of Strathclyde for supervising this project.
My sincere gratitude goes to David Palmer and Alison Campbell of The
Campbell Palmer Partnership for sponsoring me to do the course. I would also
like to thank the Strangford Lough Wildfowlers and Conservation Association
for providing a case study for the project.
Finally, my deepest thanks are to my family for providing a constant source of
inspiration throughout my academic and working career.

3
Copyright Declaration
The copyright of this dissertation belongs to the author under the terms of the
United Kingdom Copyright Acts as qualified by University of Strathclyde
Regulation 3.49. Due acknowledgement must always be made of the use of
any material contained in, or derived from, this dissertation.

4
Contents
I General 13 1.1 Introduction 13
1.2 Micro-hydro 14
1.3 The Project 16
1.4 Methodology 17
1.5 Brief Overview 19
II Literature Review 21 2 Hydro – Generation 21
2.1 Conversion of Water Power to Electricity 21
2.2 Hydro Technical Review 21
2.3 Types of Hydro-Electric Schemes 23
2.4 Types of Turbines 24
2.5 Turbine Selection Chart 31
2.6 Governors 32
2.7 Hydro Electric Generators 33
2.8 Civil Works 33
2.9 Scheme Banding 35
2.10 Micro-hydro Schemes in the UK 37
3 Grid Network Review 38
3.1 Northern Ireland Overview 38
3.2 Northern Ireland Electricity 38
3.3 Distributed Generation 38
3.4 Technical Requirements to Operate Distributed 39
Generation in Parallel with the NIE Network
III Feasibility Study 42 4.1 The Glen Vale Site 42
4.2 Micro-hydro Scheme Concept 42
4.3 Meetings with the SLW&CA 44

5
4.4 The Contribution of the Micro-hydro 48
Scheme to the Local Community
4.5 Meeting with Stephen Thompson of NIE 48
4.6 Unique Features of the Project 50
5 Legal Considerations 53
5.1 Ownership 53
5.2 Management of the Scheme 53
5.3 Planning Considerations 53
5.4 Other Statutory Obligations 54
IV Technical Analysis 55 6.1 Map and Photographs of The Glen Vale Site 55
6.2 Map Location References 56
6.3 Site Survey 57
6.4 Environmental Considerations 57
6.5 Other Environmental Aspects 60
6.6 Flow Measurements from the Valve 61
House Outlet and Overspill
6.7 Sustainable Flows 64
6.8 Available Head 64
6.9 Possible Locations for the Hydro-Generator 65
6.10 Optimum Position for the Hydro-Generator House 66
6.11 Penstock Pressure Loss if Existing 300mm 67
Pipe was to be Used
6.12 New Intake and Penstock Route 68
6.13 Outflow from the Site 68
6.14 Electrical Interconnection 69
7 Real-time Performance of Micro-hydro Scheme 71
7.1 Data Acquisition System 71
7.2 Web Server Prototype Page 72

6
V Analysis of Potential Energy Resource and Income from 74 Exported Energy 8.1 Methodology 74
8.2 Effective Head 77
8.3 Electricity Consumers 78
8.4 Proposed Turbine Schedule 79
8.5 Analysis of Potential Revenue Resulting from 81
Selling Electricity
8.6 Analysis of Potential Revenue Resulting from 82
Selling Electricity to Exploris
8.7 Energy Resource and Projected Income 84
VI Financial Viability 86 9.1 Capital Costs 86
9.2 Ongoing Annual Costs 86
9.3 Sources of Finance 87
9.4 Annual Income for SLW&CA 87
9.5 Renewable Obligation Certificates 88
VII Conclusions and Recommendations 90 10.1 Conclusions 90
10.2 Recommendations 91
References 92
Bibliography 94
Appendices 96 A Pipe Pressure Loss 96
B Contacts 104
C Northern Ireland Electricity Tariffs 106
D Power Outputs for Different Pipe Lengths 111
and Diameters and Flow Rates
E Potential Revenue from Different NIE Tariffs 123

7
F Letters of Support for the Project 130
G Electrical Schematic for Embedded Generator 136
Linked to NIE System

8
List of Figures Figure 1 Map of Northern Ireland 16
Figure 2 Layout of a Run-of-River Hydro 23
Figure 3 Pelton Turbine 25
Figure 4 Single Jet Pelton Efficiency Curve 25
Figure 5 Turgo Turbine 26
Figure 6 Crossflow Turbine 26
Figure 7 Francis Turbine 27
Figure 8 Francis Turbine Efficiency Curve 28
Figure 9 Propeller Turbine 28
Figure 10 Kaplan Turbine 29
Figure 11 Kaplan Turbine Efficiency Curve 29
Figure 12 Bulb Turbine 30
Figure 13 Turbine Selection Chart 31
Figure 14 Governor Function 32
Figure 15 Breakdown of Hydro Electric Sites in 36
the UK by Scheme Banding
Figure 16 Exploris Marine Visitors Centre 43
Figure 17 Map and Photographs of The Glen Vale Site 55
Figure 18 Sketch of Lake Overspill 62
Figure 19 Existing Valve House Pipe Arrangement 63
Figure 20 Data Acquisition System Schematic 71
Figure 21 Prototype Web Page 73
Figure 22 Power Output from a 500mm Diameter Pipe 78
Figure 23 Kaplan Turbine and System Efficiencies for Glen Vale 81
Figure 24 Valve House Pipework 96
Figure 25 Power Output from a 300mm Diameter Pipe 97
With the Hydro-generator Situated in Location 1
Figure 26 Power Output from a 400mm Diameter Pipe 98
with the Hydro-generator Situated in Location 1
Figure 27 Power Output from a 400mm Diameter Pipe 99
with the Hydro-generator Situated in Location 2
Figure 28 Power Output from a 450mm Diameter Pipe 100

9
with the Hydro-generator Situated in Location 1
Figure 29 Power Output from a 450mm Diameter Pipe 101
with the Hydro-generator Situated in Location 2
Figure 30 Power Output from a 450mm Diameter Pipe 102
with the Hydro-generator Situated in Location 1
Figure 31 Power Output from a 450mm Diameter Pipe 103
with the Hydro-generator Situated in Location 2

10
List of Tables Table 1 Scheme Banding of Hydro Electric Schemes 35
Table 2 Location of Micro-hydro Schemes 37
Table 3 Record of Overspill Depths 62
Table 4 Location of Data Acquisition Sensors 72
Table 5 Revenues for Different Pipe Diameters 82
with Business Tariff Multi-Rate Option
Under 1MW High Voltage Line with the
Hydro-generator Sited at a 15m Head
Table 6 Revenues for Different Pipe Diameters 82
Farm Tariff Multi-Rate Option Under 1MW
High Voltage Line with the Hydro-generator
Sited at a 15m Head
Table 7 Distributed Use of System Charges for Exploris 83
Table 8 Unit Electricity income for SLW&CA 84
Table 9 Annual Energy Resource and Income from Exploris 85
Table 10 Summary of Capital Costs and Funding 88
Table 11 NIE Tariff Structure and Distributed Use 106
of System Charges
Table 12 Power Output from 150m Length of 500mm 111
Diameter Pipe at a 15m Head
Table 13 Power Output from 150m Length of 450mm 113
Diameter Pipe at a 15m Head
Table 14 Power Output from 150m Length of 400mm 115
Diameter Pipe at a 15m Head
Table 15 Power Output from 260m Length of 500mm 117
Diameter Pipe at a 17m Head
Table 16 Power Output from 260m Length of 450mm 119
Diameter Pipe at a 15m Head
Table 17 Power Output from 260m Length of 400mm 121
Diameter Pipe at a 17m Head

11
Table 18 Potential Revenue from Exploris with the 123
Generator sited at the 15m Head
Table 19 Potential Revenue from Business Multi Rate 125
Option (Under 1MW High Voltage) the Generator
sited at the 15m Head
Table 20 Potential Revenue from Farm Energy Tariff 127
(Under 1MW High Voltage) with the Generator
sited at the 15m Head

12
Abstract Micro-hydro is an ancient source of renewable energy and, in the light of
government CO2 reduction targets and funding incentives, is currently being
considered for installation in locations where sustainable water resources exist.
This thesis is concerned with a feasibility study for a micro-hydro scheme on a
conservation site in Newtownards, Northern Ireland. The conservation site has
an existing 10m dam behind which is a 4 acre lake; water flows through an
existing outflow pipe continuously throughout the year. A survey of the site was
undertaken to determine the available head, flow rates and possible locations for
the turbine. Discussions with Northern Ireland Electricity (NIE) established costs
and the issues of integrating a distributed generator, at the conservation site, into
the national electricity grid. The study confirmed that the concept of a micro-
hydro scheme using the existing dam is sound, and that a peak sustainable
power output of 54kW could be achieved using a high efficiency vertical axis
turbine. A new intake would need to be constructed with a 500mm penstock to a
pre-fabricated turbine house beneath the dam at a 15m head. A sustainable
operational schedule was used for the purposes of the study (based on
discussions with the conservation site owners) to enable an analysis of the
possible annual income for different NIE tariff charges.
The owners of the conservation site have a passion for the environment, and
over the last 50 years have safeguarded this unique nature reserve. The socio-
economic and environmental impacts of the proposed micro-hydro scheme are
discussed in detail in the thesis. The literature review of micro-hydro shows that
no scheme around the world has real-time performance data which is available
over the web. This study gives an overall design of a data acquisition scheme
with a mock prototype web page showing real-time system performance.
Finally, it is estimated that a net income of £13,950 per annum could be achieved
for a total capital cost of £268,000. With the maximum grant funding of £100,000
from Clear Skies and 25% funding from the Northern Ireland Electricity Smart
Fund, the owners of the site would have to raise just under £100,000.

13
Section I – General 1.1 Introduction Energy demands are increasing on a global scale. The energy demands from
developing countries such as China are set to rise exponentially. This places
significant pressure on the earth’s finite resources while producing increased CO2
emissions. The UK has signed up to meet CO2 emission reduction targets as
part of the Kyoto Protocol. To meet these emission reduction targets government
policies has ensured an influx of renewable energy in the UK. The majority of
renewable energy in the UK is currently produced by large-scale hydro and wind
farms. However, it is predicted that smaller distributed energy systems will
increase with rising electricity prices and government incentive schemes such as
Renewable Obligation Certificates.
Northern Ireland does not generate enough electricity to match its demand and
has recently installed a 275kV high voltage direct current (HVDC) interconnector
from Scotland supplying up to 500MW from Scottish Power. In addition, Northern
Ireland penalises heavy electricity users with a seasonal time of day tariff. This
results in many industrial users switching to diesel generators with cheaper
operating costs during this time to supply their electricity needs. However, this
form of energy increases the strain on the finite resources. The country has a
growing economy and, hence, rising energy demand [13] with the option to
supply electricity demands from distributed generators becoming increasingly
attractive. This thesis investigates the feasibility of installing a micro-hydro-
generator in a conservation site in Northern Ireland.

14
1.2 Micro-hydro Water is a natural resource which has been used to generate power, in one form
or another, for centuries. In its simplest form hydro power was used to grind
grain, provide shaft power for textile plants, sawmills and other manufacturing
operations [5]. These small hydro power sites could be found in many locations
throughout Europe and North America.
The development of centrally-generated electric power eventually reduced the
requirement for small hydro sites. These developments fuelled a growth in large-
scale hydro-electric schemes where dams were constructed to store water and
generate, in many cases, mega-watts of power. As a result, the majority of sites
with potential for large-scale hydro-electricity in the UK have been exploited [14].
The trend is shifting in hydro electricity developments, with installations now
reflecting small scale developments similar to the ones of centuries past. Micro-
hydro turbines with high efficiencies have aided the move back towards small
distributed sites.
Micro-hydro is defined as the generation of electricity from a few hundred watts
to 100kW [10]. There are currently 24 micro-hydro sites throughout the UK [11].
However, thirteen of these sites are mills with waterwheels, or in one case a
Francis turbine, typically installed between 1910 and 1960. The most recent
hydro-electric installation was in 2003 in Grantis Mill, Somerset where a 15kW
hydro-generator was installed [11]. The two principal reasons for a low uptake in
micro-hydro installations in the UK in the past are; excessive capital cost and
environmental impacts. To negate these barriers to micro-hydro development,
sites which have an existing infrastructure are more attractive to micro-hydro
developers. In addition, government grants are available for community
orientated renewable projects to aid the installation and contribute towards
reducing emissions.
Two such grants are Clear Skies and Northern Ireland Electricity (NIE) Smart
Fund. The £10 million “Clear Skies” initiative aims to give homeowners and
communities a chance to become more familiar with renewable energy by
providing grants and advice. Community organisations can receive up to

15
£100,000 for installations and up to £10,000 for feasibility studies. Funding
support for feasibility studies will be available to community schemes, to help
address key issues such as technical and financial viability, legal and planning
issues, and access to other sources of funding. The feasibility study is used
as an application for renewable energy installation funding. The scheme is
operating in England, Wales and Northern Ireland (excluding Isle of Man and
Channel Islands), and was introduced in January 2003, and is planned to
operate for 2 years [16].
NIE’s SMART (Sustainable Management of Assets and Renewable Technology)
has funds available to support renewable energy and demand side management
initiatives. There is up to £250,000 per annum available to support projects
installing near-market renewable technologies, including: solar water heating,
photovoltaics, micro-hydro, small scale biomass, ground source heat pumps and
micro CHP. The applicant is eligible if they fall into one of the following
categories: community group, business, housing association, public sector and
charities or voluntary organisations [17].

16
1.3 The Project The Strangford Lough Wildfowlers and Conservation Association is a cross-
community group whose membership is open to the public throughout Northern
Ireland. The Association provides members with access to wildfowl shooting on
Strangford Lough from islands that they own in the lough. The Association, being
conscious of the need for conservation, breeds wildfowl at two locations in
Newtownards to ensure wildfowl stocks are not depleted as a result of their
shooting activities. The Association owns the fishing, shooting, mineral and
water rights on their property.
Figure 1: Map of Northern Ireland
Sourced: www.nidex.com/map.htm
One of the areas used to breed wildfowl is the Glen Vale Conservation Area just
north of Newtownards town centre. This area was purchased by the association
over fifty years ago and comprises a 4 acre lake formed from a dammed-up
quarry, surrounding woodland and a lower pond used for breeding. Four rivers
from the catchment area run into the lake providing a continuous flow of water
throughout the year, even in dry weather. The dam was formed over 100 years
ago to supply water to two textile mills in Newtownards and the valve house at
Location of
Glen Vale Site

17
the base of the dam still has outflow pipes leading to the town. The lake is
assessed to be about 10 metres at its deepest point. The lake is used by the
local fishing club, another cross-community organisation open to the public, who
have full access to the site. The Association stocks the lake with brown trout for
the fishing club, and the lake also has a natural stock of brown trout.
The site, however, is not currently open to the general public because of
significant concerns about security, vandalism and the maintenance of the area
as a nature reserve. The site is opened for an annual open week when members
of the Association are present to allow members of the public access to raise
awareness on the conservation work undertaken on the site. The manner in
which this site could be better utilised has long been on the Association’s
agenda. A proposed micro-hydro installation is intended to generate income for
the Association to enable it to improve facilities on the site including the
construction of a visitor centre, better and safe access for school parties and
world wide access via the internet.
1.4 Methodology The Campbell Palmer Partnership Ltd (who sponsored the fulfilment of this
Master of Science Degree) presented the opportunity to undertake a feasibility
study for a micro-hydro Installation for the Strangford Lough Wildfowlers &
Conservation Association (SLW&CA). The work within the dissertation has been
carried out throughout the duration of the study, by the author.
The purpose of the study is to analyse the technical, social, legal and
environmental feasibility of a micro-hydro installation on the SLW&CA site.
Moreover, this entire process will be integrated to present a methodology for
potential income from the plethora of electricity tariffs and use of system charges
for distributed generators such as the proposed micro-hydro installation.
The first phase of the study was to recognise the components of a micro-hydro
system. A literature review of hydro-electricity was carried out. This review
presented an understanding of the technology and the components required to

18
perform a field study, and to establish potential performance characteristics. A
review of the electricity grid identified the issues associated with connecting
distributed generators to operate in parallel with the electricity network.
The second phase of the study involved meeting the key personnel involved in
the proposed developments at the SLW&CA site in Northern Ireland, and
undertaking a preliminary survey of the site. The intended idea of the SLW&CA
was to use the existing water flow from an ancient penstock on the site.
Discussions were centred on environmental concerns, community involvement
and the need for the project. It was identified from the meeting that the SLW&CA
wanted to maintain the existing flow from the penstock and weir in the Lake. By
doing this, the amount of water taken from the lake will not be altered in any way.
For this reason it was decided that it would be unnecessary to survey the
catchment area of the lake.
On the second visit to Northern Ireland a meeting was arranged with the
Distributed Generation Manager for Northern Ireland Electricity (NIE) to discuss
grid connection issues with the proposed micro-hydro-generator. In addition
possible income streams were also examined.
An in depth survey of the site was undertaken on the second visit to Northern
Ireland. There is no historical data for the flow rate from the outflow or weir. The
flow rates from the existing pipe and weir were measured using an anemometer
and possible locations for the generator site assessed with a theodolite and staff.
The manufacturer of the anemometer confirmed that as well as being able to
measure wind velocity the instrument could also be used to measure water
velocity. The Chairman recorded the flow from the weir for a period of 4 months.
From the survey it was possible to estimate mean and peak flow rates and
analyse optimum penstock diameter to maximise the head. Discussions with
SLW&CA, local council and community helped identify the environmental impacts
of the project.
19
The findings from the second survey were used to contact potential micro-hydro
installers. Two installers replied with capital cost guidelines for the proposed
micro-hydro project.
Following the survey, a sustainable operating schedule for the micro-hydro
scheme was established and, hence, generation profiles were examined from
NIE tariffs and use of system distribution charges. This permitted an analysis of
the potential income by exporting energy from the micro-hydro scheme to specific
customers with different tariff structures.
The final stage of the study was to assess the financial viability of the proposed
micro-hydro installation. The capital costs, ongoing annual costs and possible
sources of finance were integrated to identify whether the micro-hydro scheme
could be cost effectively installed on the SLW&CA site.
1.5 Brief Overview This dissertation comprises seven sections which are discussed below:
Section 1. General, presents an introduction, the subject and major focus of the
study and structure.
Section 2. Literature Review, reviews relevant literature within the hydro electric
work field, investigating core concepts of energy production from water, the
technology of hydro-electricity, and the requirements for connection of distributed
generation in parallel with the Northern Ireland Electricity Grid.
Section 3. Feasibility Study, describes the proposed micro-hydro-electric
scheme site and outlines the environmental and electrical grid connection issues
relating to the site. In addition, this section details unique features of the
proposed hydro installation and the educational benefits to the local community.
Section 4. Technical Analysis, documents the findings from the survey of the
site.

20
Section 5. Analysis of Potential Energy Resource and Income from Exported
Energy, uses the data gathered from the site survey to develop a methodology
for assessing the potential energy and income for the SLW&CA.
Section 6. Financial Viability, includes the cost of installing a micro-hydro
scheme on the site, operating costs of the scheme, available funding and the
final cost to the SLW&CA.
Section 7. Conclusions and Recommendations, presents conclusions and
scope for further studies and development.

21
Section II – Literature Review 2 Hydro Generation 2.1 Conversion of Water Power to Electricity Nearly a quarter of the energy from the sun that reaches the Earth’s surface
causes water from the seas, lakes and ponds to evaporate [20]. A proportion of
this energy is used to make water vapour rise, against the gravitational pull of the
Earth into the atmosphere, where it eventually condenses to form rain or snow.
When it rains in the hills or snows in the mountains, some of the solar energy
input remains stored. Therefore water at any height above sea level represents
stored ‘gravitational’ energy [2].
This energy is naturally dissipated by eddies and currents as the water runs
downhill in streams and rivers until it reaches the sea. The greater the volume of
water stored and the higher up it is, then the more available energy it contains.
For example, water stored behind a dam in a reservoir contains considerable
‘potential’ energy. To capture this energy in a controlled form, some or all of the
water in a natural waterway can be diverted into a pipe. It can then be directed
as a stream of water under pressure onto a water wheel or turbine wheel. The
water striking the blades causes the wheel (or turbine) to turn and create
mechanical energy [10].
The hydro electric plants work by converting the kinetic energy from water falling
into electric energy. This is achieved from water powering a turbine, and using
the rotation movement to transfer energy through a shaft to an electric generator.
2.2 Hydro Technical Review This section provides a brief technical review of hydro power. Hydro electricity
generation is considered a mature renewable technology, with extensive
textbooks and journal papers which have covered the subject in detail. For this
reason a brief review of the technical aspects are presented below.

22
2.2.1 Stored Potential Energy A water flow from an upper to a lower level represents a hydraulic power
potential. The difference between the level of the upper reservoir zres and the
level of tail water ztw is defined as the available head [18].
Available Head,
HAV = zres - ztw
The potential energy to move 1kg of water from the upper to the lower level is
given by:
PE = gHAV
Where
PE is the potential energy (Joules)
g is the acceleration of gravity (9.81ms-2)
HAV is the available head (m)
2.2.2 Power Output The available power from the hydro is given by the equation [18],
P = ρQgHAV
Where
P is the available power of the hydro scheme (W)
ρ is the density of water (kg/m3)
Q is the flow rate of the water (m3/s)
Effective head (HEF). In real hydro systems the water delivered to the turbines
will lose some energy as a result of frictional drag and turbulence as it flows in
channels and pipes. Thus, the effective head will be less than the available head
[18].
System Efficiency (η). The efficiency of turbines varies according to the type of
turbine and the flow rate into the turbine. The system efficiency considers both
the combined efficiency of the generator, converting mechanical to electrical
energy, and the turbine [18].

23
Hydro Turbine Power Output,
P(W) = ηρQgHEF 2.3 Types of Hydro-Electric Schemes 2.3.1 Run of River The first hydro facilities were known as Run of River schemes [3]. The schemes
do not include any significant water storage, and therefore make use of whatever
water is flowing in the river. When streams and rivers have low flow, run of river
Figure 2: Layout of a Run-of River Hydro Scheme
Sourced: www.itdg.org schemes are unable to generate power. A typical run of river scheme involves
either a low level diversion weir (a small dam) or a stream bed intake, and are
usually located on swift flowing streams [14]. A low level diversion weir raises
the water level in the river sufficiently to enable an intake structure to be located
on the side of the river. The intake consists of a trash screen and submerged
opening with an intake gate. An alternative arrangement (not requiring a weir
see Figure 2 above) is to have a streambed intake where the water drops
through a screened inlet duct that has been installed flush with the bottom of the
riverbed. A streambed intake will allow rocks and gravel to enter which means
the design must include a screen to flush out the debris in the system. Water
from the intake is normally taken through a pipe (penstock) downhill to a power
24
house constructed downstream of the intake and as at low a level as possible to
gain the maximum head of the turbine.
2.3.2 Dam Based Hydro schemes may also be based on the construction of a large dam to store
water and to provide sufficient head for the turbine. These water storage
schemes enable the power station to generate at times of peak power demand,
and then allow the water level to rise again during off peak time. Schemes with
large dams are better suited to larger, gently graded rivers [20]. The advantage
of this type of plant is that they have the capability to store the energy (water) and
use it when necessary.
2.3.3 Pumped Storage Pumped storage plants utilise a reversible pumping turbine to store hydro energy
during off-peak electricity hours by pumping water from a lower reservoir to an
upper reservoir. This stored energy is then used to generate electricity during
peak hours, when electricity is costly to produce, by distributing water from the
upper to the lower reservoir.
2.4 Types of Turbines Hydro turbines can be broadly categorised into either impulse or reaction turbines
[10]. Impulse turbines convert the kinetic energy of a jet of water in air into
movement by striking buckets or blades. By comparison, the blades of a reaction
turbine are totally immersed in the flow of water, and the angular as well as linear
momentum of water is converted into shaft power. The types of turbines are
discussed in more detail.

25
Impulse Turbines 2.4.1 Pelton Turbines The Pelton wheel was developed in California during the Gold rush days of the
1850s [21]. The Pelton turbine consists of a set of specially shaped buckets
mounted on a periphery of a circular disc. The disc is
turned by jets of water, which are discharged from
one or more nozzles, striking the buckets (see Figure
3). The buckets are split into two halves so that the
central area does not act as a dead spot incapable of
deflecting water away from the oncoming jet. The
cutaway on the lower lip allows the following bucket to
move further before cutting off the jet, propelling the
bucket ahead of it, and also permits a smoother
Figure 3: Pelton Turbine entrance of the bucket into the jet. The Pelton
Sourced: www.waterwheelfactory.com bucket is designed to deflect the jet
through 165 degrees (not 180 degrees which is the maximum angle possible
without the return jet interfering with the following bucket for the oncoming jet). In
large scale hydro Pelton turbines are normally only considered for heads above
150m, but for micro-hydro applications Pelton turbines can used effectively at
heads down to about 20m. Pelton turbines are not used at lower heads because
their rotational speed becomes very slow and the runner required is very large
and unwieldy.
This is an efficient process of extracting energy from the flow of water (90%)
when there is a very high head
available [22]. To operate at a
turbine efficiency of 90% the
water flow must operate
between 70% and 80% of the
maximum flow (see Figure 4).
Figure 4: Single Jet Pelton Efficiency Curve
Sourced: www.newmillshydro.freeserve.co.uk

26
2.4.2 Turgo Turbines The Turgo turbine is similar in design to a Pelton turbine, but was designed to
have a higher specific speed [23]. In this case,
the jets are aimed to strike the plane of the runner
on one side and exit on the other. Therefore the
flow rate is not limited by the discharged fluid
interfering with the incoming jet (as is the case
with Pelton turbines). As a consequence, a Turgo
turbine can have a smaller diameter runner than a
Pelton for equivalent power. The Turgo is efficient
Figure 5: Turgo Turbine over a wide range of speeds and shares the
Sourced: www.jyoti.com general characteristics of a Pelton turbine including
the fact that it can be mounted either horizontally or vertically. A Turgo runner is
more difficult to make than a Pelton and the vanes of the runner are more fragile
than Pelton buckets. They require about the same heads as do the Peltons and
they sometimes employ multi jets to allow them to accommodate more water
flow.
2.4.3 Crossflow Turbines
A crossflow turbine has a drum-
shaped runner consisting of two
parallel discs connected together near
their rims by a series of curved blades
[15]. A cross flow turbine always has
its runner shaft horizontal (unlike
Pelton and Turgo turbines). In
operation a rectangular nozzle directs
the jet onto the full length of the
Figure 6: Crossflow Turbines runner. The water strikes the blades
Sourced: http://www.ossberger.de/index and imparts most of its kinetic energy.
It then passes through the runner and strikes the blades again on exit (see Figure
6) impacting a smaller amount of energy before leaving the turbine. At low flows,
the water can be channelled through either two thirds or one third of the runner,
thereby sustaining relatively high turbine efficiency.

27
Reaction Turbines 2.4.4 Francis Turbines The Francis turbines may be divided in two groups; horizontal and vertical shaft.
In practice turbines with comparatively small dimensions are arranged with
horizontal shaft, while larger turbines have vertical shaft. Francis turbines can
either be volute-cased or open-flume machines. The spiral casing is tapered to
distribute water uniformly
around the entire perimeter of
the runner and the guide
vanes feed the water into the
runner at the correct angle
[19]. The Francis turbine is
generally fitted with
adjustable guide vanes. The
runner blades are profiled in
a complex manner and direct
the water so that it exits
axially from the centre of the
runner. In doing so the water
imparts most of its pressure
energy to the runner before
leaving the turbine via a draft
tube. Figure 7: Francis Turbine
Sourced: www.cineca.it

28
The Francis turbine has the widest range of application among the various types
of turbines available. Highly
flexible, it comes in a range
of different sizes that can
operate under heads
ranging from around 20 to
500 metres. When the
turbine’s flow rate is
reduced below 85% of the
maximum flow, the
efficiency of the turbine falls
away (see Figure 8) [22]. Figure 8: Francis Turbine Efficiency Curve
Sourced: www.newmillshydro.freeserve.co.uk 2.4.5 Propeller Turbines The basic propeller turbine consists of a propeller, similar to a ship’s propeller,
fitted inside a continuation of the penstock tube (see Figure 9). The turbine shaft
passes out of the tube at the point where the tube changes direction. The
propeller usually has three to six blades or swivel gates just upstream of the
propeller. This kind of propeller
turbine is known as a fixed
blade axial flow turbine because
the pitch angle of the rotor
blades cannot be changed. The
part-flow efficiency of fixed-
blade propeller turbines tends to
be very poor [20]. Figure 9: Propeller Turbine
Sourced: bioen.okstate.edu

29
2.4.6 Kaplan Turbines Large scale hydro sites make use of more sophisticated versions of the propeller
turbines. Varying the pitch of the
propeller blades together with wicket
gate adjustment enables to handle a
great variation of flow very efficiently.
Such turbines are known as variable
pitch or Kaplan turbines (see Figure 10).
The Kaplan runner is a development of
the early 20th century and can only be
installed in the vertical orientation,
Kaplan turbines have a high specific
speed which means that direct coupling
to the generator is possible but only at
higher heads and lower flows [19].
Figure 10: Kaplan Turbine
Sourced: www.shomepower.com
This means that a speed
increase will be necessary on
most applications. The Kaplan
turbines are 90% or better in
efficiency when turbine flows are
35% or greater than the
maximum flow (see Figure 11),
but are very expensive and,
hence normally used in larger
installations [22]. Figure 11: Kaplan Turbine Efficiency Curve
Sourced: www.newmillshydro.freeserve.co.uk

30
2.4.7 Bulb Turbines Bulb turbines are named after the shape of their upstream watertight enclosures.
The generator is accommodated within the enclosure and therefore submerged
in the water passage (see Figure 12).
Suitable for low heads and large discharge/head variations, bulb-units have
virtually replaced Kaplan turbines for very low heads sites [19]. This is because
the near straight design of the water passage improves the hydraulic
characteristics of the flow, giving both size and cost reductions. The bulb
turbines have been utilised however, more widely, in tidal power installations
such as La Rance in France. For very low heads, generator speeds have to be
increased by means of gears.
Figure 12: Bulb Turbines
Sourced: acre.murdoch.edu.au

31
2.5 Turbine Selection Chart The turbine selection chart below permits the user to select turbines for a given
flow rate (m3/s) and head (m).
Figure 13: Turbine Selection Chart
Sourced: www.newmillshydro.freeserve.co.uk
The area within the blue line represents a Kaplan or Bulb turbine
The area within the red line represents a Francis turbine
The area within the green line represents a Pelton turbine
The area within the dark dashed line represents a Turgo turbine
The area within the black line represents a crossflow turbine

32
2.6 Governors Turbine governors are equipment for rapid control and adjustment of the turbine
power output and evening out deviations between power and the grid load. The
governor system can be mechanical-hydraulic, electro-hydraulic, or digital
hydraulic [24]. The systems, regardless of type have the following three
components:
• The controller, which is the unit used for control of the hydro installation
• The servo system, which is an amplifier that carries out water
admission changes determined by the controller
• The pressure oil supply system, which is used to supply oil to the servo
system
The turbine governors purpose is to keep the rotational speed of the turbine-
generator stable at any grid load and water flow in the turbine conduit. During
load rejections or emergency stops the turbine water admission must be closed
down according to acceptable limits of the rotational speed rise of the unit and
the pressure rise in the water conduit.
Figure 14: Governor Function
Figure 14 above shows the function of the governor. The input reference signal
is compared with the speed feedback signal. With a momentary change in the
load a deviation between the generator power output and load occurs. The
deviation causes the unit inertia masses either to accelerate or to decelerate.
Turbine andWater ConduitGovernor Generator
Load
-
-
+ +
Admission
Speed Deviation
Power
Reference Speed

33
The output of this process is the speed, which is again compared with the
reference.
2.7 Hydro-Electric Generators 2.7.1 Synchronous Generators A synchronous generator can be connected to a micro-hydro turbine and can
operate either connected to the grid or as a stand-alone generator. The
generator operates at a speed directly related to the frequency. However, when
the micro-hydro turbine is connected to a synchronous generator, which is
directly connected to the electric grid, a speed variation is not possible. If speed
variation is not possible, system efficiency is reduced because the generator
cannot adapt to a partial load. There are also safety issues with synchronous
generators which include; voltage regulation, islanding, and speed and frequency
control.
2.7.2 Induction Generators Induction generators rely on a connection to an outside source of power, ie the
electricity network, to establish and control the rotating magnetic field. This
makes this type of generator a safer option than other types of generators for
connection to the grid. However, in the absence of grid connection it is possible
for induction generators to generate power if it is connected to a sufficient source
of capacitance reactance, such as capacitors. In this case very high voltages will
be produced , causing a hazard to the equipment [4].
2.8 Civil Works 2.8.1 Dams Dams are classified according to their profile and building material, which is
typically concrete, earth or rock. The civil works for a hydro electric scheme
typically accounts for 60% of a plant’s initial investment [14].
2.8.2 Concrete Dams Concrete dams can be divided into solid gravity, hollow gravity, and arch dams.
The gravity dam relies on its own weight to resist hydraulic thrust. The hollow
gravity dam contains about 35% of the concrete required for a solid dam, but is

34
more expensive per unit volume. The arch dam, is designed for narrow valleys
and distributes the hydraulic thrust to its abutments.
2.8.3 Rockfill and Earthfill Rockfill and earthfill dams usually have a core which is covered with loose rock or
earthfill. Grass may even be grown on the earth fill. Water will seep in through
the earth or rock fill, but should not seep into the core.
2.8.4 Canals and Channels The canal conducts the water from the intake to the forebay tank (see Figure 2).
The length of the channel depends on local conditions. Most canals and
channels are excavated to reduce friction and prevent leakage, channels are
often sealed with cement, clay or polythene sheet. The size and shape of a
channel are often a compromise between costs and reduced head. As water
flows in the channel, it loses energy in the process of sliding past the walls and
bed material. The rougher the material, the greater the friction loss and the
higher the head drop needed between channel entry and exit.
2.8.5 Settling Basin The water drawn from the river and fed to the turbine will usually carry a
suspension of small particles (see Figure 2). The sediment will be composed of
hard abrasive particles such as sand which can cause damage and rapid wear to
turbine runners. To remove this material the water flow must be slowed down in
settling basins so that the silt particles will settle on the basin floor. The deposit
formed is then periodically flushed away.
2.8.6 Forebay Tank The forebay tank forms the connection between the channel and the penstock
(see Figure 2). The main purpose is to allow the last particles to settle down
before the water enters the penstock. Depending on its size it can also serve as
a reservoir to store water. A sluice will make it possible to close the entrance to
the penstock. In front of the penstock a trashrack is normally installed to prevent
large particles entering the penstock

35
2.8.7 Penstock The penstock is the pipe which conveys water under pressure from the forebay
tank to the turbine. The penstock often constitutes a major expense in the total
micro-hydro budget, as much as 40% is not uncommon in high head installations,
and it is therefore worthwhile optimising the design [12]. The trade-off is between
head loss and capital cost. Head loss due to friction in the pipe decrease
dramatically with increasing pipe diameter. Conversely, pipe costs increase
steeply with diameter. Therefore a compromise between cost and performance
is required.
2.9 Scheme Banding The size of a hydro-electric facility is classified by its power output. The table
below shows five hydro-electric categories with their associated power outputs.
The chart below the table attempts to illustrate the breakdown of hydro-electric
sites in the UK [11]. It shows that medium hydro (15 to 100MW), mini-hydro
(above 100kW but below 1MW) and small hydro (1 to 15MW) account for the
largest proportion of hydro schemes in the UK.
Table 1: Scheme Banding of Hydro Electric Schemes
Size of Hydro Electric Facility
Power Output
Large hydro More than 100MW
Medium hydro 15 to 100MW
Small hydro 1 to 15MW
Mini-hydro above 100kW but below 1MW
Micro-hydro Ranging from a few hundred watts up to 100kW

36
Figure 15: Breakdown of Hydro-Electric Sites in the UK by Scheme Banding
Breakdown of Hydro Electric Sites in the UK by Type (%)
Sites from 1-15MW (Small Hydro)
25%
Sites from 15-100MW (Medium
Hydro)28%
Sites over 100MW (Large Hydro)
4%
Sites above 100kW but Below 1MW
(Mini Hydro)27%
A few hundred watts to 100kW (Micro Hydro)
16%

37
2.10 Micro-hydro Schemes in the UK The table below shows lists all of the micro-hydro installations found in the UK. It
can be seen that the majority of installations were before 1990 and relate to the
textile industry. There is no performance data available from any of these
installations [11]. Table 2: Location of Micro-hydro Schemes
Location Hydro Location Power Output Installation Date Argyll Inver. Isle of Gura 30 kW 1984 Scottish Highlands
Eliock House 36 kW 1977
Gwynedd Brynkir woollen mill
10 kW 1960
Brooklyn Mill 20 kW 1904 Somerset Gantis Mill 15 kW 2003 Stirling Ashfield House
Hydro 6 kW 1995
Wiltshire Crabb Mill 5 kW 1890 Worcestershire Fradbury Mill 18 kW 1981 Yorkshire Armitage Bridge Avon Avon Power
Station 89 kW 1957
Cartmarthenshire Cwmcych Mill 10 kW Not Available Cwmorgan Mill 10 kW Not Available Dreifa Mills 10 kW 1880 Godremamog Mill 10 kW Not Available Mars y Felin 10 kW Not Available Ceredigion Rheidol 50 MW 1961 Cheshire Pedley Wood 2 kW 1991 Staveley Millyard 30 kW 2002 Derbyshire Errwood Reservoir 100 kW 1989 Devon Changford Power
Station 20 kW 1891
Fernworthy Damn 5 kW 1957 Holne Park 40 kW 1981 Old Walls Hydro 90 kW 1995 Dumfries & Galloway
Maidenholm Forge Mill
30 kW 1946

38
3 Grid Network Review 3.1 Northern Ireland Overview Northern Ireland has an emerging economy resulting in a rising demand for
electricity [13]. There are problems meeting this demand from existing power
generation plants, and consequently an expensive seasonal time of day tariff
(STOD) was introduced to heavy users. This was designed to try and reduce
demand at certain times of the day when there was not enough capacity to meet
demand. This has resulted in many industrial and business users switching to
standby generators (in most cases powered by oil) during the STOD tariff period
to reduce energy costs.
In 1990, NIE signed agreements with Scottish Power for the construction of a
275kV high voltage direct current (HVDC) interconnector between the
companies’ transmission systems. It took nine years of planning applications,
public inquiries and environmental statement procedures before NIE obtained the
statutory consents for the transmission line, undersea crossing and converter
stations [25]. The submarine cable has a power transfer capability of 500MW.
The link supplies Northern Ireland with an important new source of electricity
supply, which will promote electricity in the emerging markets in Northern Ireland
and the Republic of Ireland, as well as enhance security and quality of supply.
3.2 Northern Ireland Electricity The transmission system in Northern Ireland is owned and maintained by
Northern Ireland Electricity (NIE). Power in Northern Ireland is generated by four
power stations which are owned by independent companies. The power stations
are linked to 30 substations by 275kV double circuit transmission lines, 110kV
double and single circuit lines. The substations distribute electricity to consumers
via 33kV transmission lines [13].
3.3 Distributed Generation Environmental legislation and government targets to reduce CO2 emissions
have increased the integration of renewable energy generation into
distribution networks. The renewable energy technologies are often small-

39
scale and include micro-hydro, small wind turbines and micro combined heat
and power. The majority of these schemes can be found in remote rural
areas where the electrical distribution structure can be considered weak and
underdeveloped.
The existing electricity network architecture was not designed to
accommodate the reverse flow of electricity from distributed sources. This
can pose a number of problems for the network operators. These are
discussed as below:
• Maintaining voltage and frequency control within statutory limits
• Reduced power factors and increased losses due to the reactive
energy consumed by generators
• Automatic disconnection of a generator (islanding) is not designed
to cope with reverse power
• Harmonic distortion can cause stress in a distribution system and
result in additional heating in equipment, transformers, capacitors
and wiring, resulting in wasted energy.
The strain placed on the electricity network can be reduced where the
generation technology matches a local load within the distribution system.
This reduces the requirement to transport electricity in the reverse direction
and hence, reduces network demand and distribution losses.
3.4 Technical Requirements to Operate Distributed Generation in Parallel with the NIE Network
3.4.1 Introduction The operation of any distributed generation will, potentially have implications
for NIE in respect of the way in which it operates its networks and the quality
of supply provided to other customers. The level of involvement and cost
implications for NIE is dependant on the type and size of the generating
capacity. A preliminary investigation is carried out by NIE in to the connection

40
of a proposed distributed generator to assess firstly, the feasibility and
secondly, an indicative cost for the project.
3.4.2 Procedure to Facilitate Connection
A generator questionnaire must firstly be completed and returned to NIE
where the proposal will be considered. NIE may request that the distributed
generator applicant pay NIE alteration charges and NIE will arrange for the
work to be carried out. A generator capacity agreement and a blank copy of
the embedded generation test record will be provided by NIE. The distributed
generator applicant must also advise NIE of the intended electricity trading
arrangements. It is the responsibility of the applicant to ensure any
installation is in accordance with G59/1/NI Recommendations for the
Connection of Embedded Generation Plant to the Public Electricity Suppliers’
Distribution System.
3.4.3 G59/1/NI G59/1/NI is an engineering recommendation document from the Electricity
Association regarding the safety and protection requirements of connecting
embedded generating plant to public electricity suppliers’ distribution systems.
The document also contains the legal aspect of connecting embedded
generating plant to public electricity suppliers’ distribution systems. The
recommendation applies to systems to be connected at, or below, 20kV and
where the generating plant output is less than 5MW [5].
Technical Factors within G59/1/NI [5]:
Fault Infeed. The level of fault infeed from the generator must be established
before installation to assess what impact the generator will have on the fault
level of the public electricity supply.
Synchronising. If a synchronous generator is used, the generator must be
synchronised with the public electricity supply before parallel connection.
During parallel connection the voltage fluctuation should not be greater than
3% at the point of connection.

41
Distortion and Interference. The embedded generator may produce
harmonic voltages and currents which could cause harmonic distortion of the
public electricity supply.
Isolation. The public electricity supplier has the right to disconnect the
embedded generators supply of electricity to the distribution network for safety
reasons. Protection Equipment. The generator protection system must be able to
detect the following:
• Over voltage
• Under voltage
• Over frequency
• Under frequency
• Neutral Voltage Displacement
• Over current
• Earth Fault
• Reverse Power
• Loss of mains

42
Section III – Feasibility Study 4.1 The Glen Vale Site The Glen Vale site is a private nature reserve containing a 4 acre lake, which is
referred to locally as the high dam, and the Glenvale Conservation Area. A
structural and underwater survey of the dam was carried out in February 2003,
and the dam was reported to be in good condition. The lake level is controlled by
an outlet from a brick valve house positioned at the base of the dam and an
overspill located at the north-east corner of the lake.
A lower pond, which is fed from the lake, is located 15m below and 145m from
the valve house outlet. This pond is manmade and used to breed wildfowl. At
the south end of the lower pond a sluice distributes the water into a concrete
drainage pipe where the water flows from the SLW&CA site and connects with
Newtownards drainage system.
4.2 Micro-hydro Scheme Concept Having established that the dam is in good condition it was suggested to the
Association that the site could be suitable for a micro-hydro-generator scheme.
The existence of the dam structure together with the much reduced requirement
for civil engineering works, make for an excellent site for a micro-hydro scheme.
The current sustainable flow rate from the existing outlet would be maintained
with the installation of a hydro-generator, virtually eliminating undesirable
ecological and environmental impacts which would otherwise result from such an
installation.
The purpose of the hydro-scheme is to provide a stable source of income for the
Association by becoming an energy supplier. The intention is to wheel electricity
over the Northern Ireland Electricity (NIE) distribution network to an organisation
capable of taking the full output from the generator 24 hours a day. Wheeling is
the term used in the electricity sector for transporting electricity over transmission
and distribution lines to consumers.

43
4.2.1 Ards Borough Council
Two meetings were held with officers of Ards Borough Council, the first at the
start of the study and the other later in the study. In addition, many issues
have been discussed over the telephone with the Local Agenda 21 officer.
4.2.1.1 Meeting at Ards Borough Council The purpose of the meeting was to discuss the Council’s involvement in the
feasibility study and arrangements for the supply of electricity to a nominated
Council building. The principal outcomes were:
1. The Council agreed in principal to the purchase of electricity wheeled
over the NIE network to a nominated council site. This would most
likely be the Exploris Marine Visitors Centre, the Northern Ireland
Aquarium in Portaferry on the Ards peninsular, which has a baseload of
85kVA and a maximum demand of 160kVA. The centre has a number
of large seawater pumps which operate continuously to replenish and
oxygenate the seawater tanks. With a maximum possible output of
54kW from the proposed hydro-generator, Exploris would be able to
take the entire output of the generator continuously. Exploris has a seal
Figure 16: Exploris Marine Visitors Centre
Sourced: www.exploris.org.uk

44
Sanctuary (see Figure 16) and a reputation for rescuing injured seals
for re-release into the wild. Its environmental credentials and
educational commitment make it an ideal partner for the proposed
hydro project.
2. Council electricity tariff structures were discussed, and a Seasonal Time
of Day electricity tariff applies to the building in question. Subsequent to
the meeting the details of the electricity tariff structure for Exploris were
provided.
3. General discussions were held concerning the extent and nature of the
community involvement required to secure a Clear Skies Grant for the
proposed hydro project. It was felt that emphasis should be placed on
educational activities rather than recreational activities as these could,
more realistically, be regulated by the Association. Various ideas for
this were discussed.
4. The Council offered the services of their Local Agenda 21 officer to
assist with the feasibility study.
4.3 Meetings with the Strangford Lough Wildfowling and Conservation Association Two meetings and many discussions have been held with office bearers of the
Association. The initial meeting was held with Jack Gilliland, chairman of the
Association, and Robert Morrison the Hydro-Scheme Project Officer. They
provided the background information about the Association and the site. A
number of issues in relation to the local environment were discussed.
An evening meeting was held at the Association’s clubhouse at Glen Vale to
meet the entire committee including the head of the angling section. Also
present at the meeting was Ursula Toman of the Local Energy Efficiency
Advice Centre. A lively two hour discussion enabled Association members to
ask questions on all aspects of the proposed scheme including: hydro

45
generation; the water resource available; possible engineering solutions;
environmental impacts; funding assistance; and increase access and the use
of their unique site in a controlled manner.
4.3.1 Dialogue with the Local Community Dialogue with the local community has been ongoing for some time as the
Association has been seeking to make better use, and create better public
access to, the Glen Vale Conservation area. Support has been forthcoming
from local councillors which resulted in the active involvement of Ards
Borough Council. Jim Shannon, the MLA member of the Northern Ireland
Assembly for the Newtownards area, in his role as a Local Agenda 21 office
bearer, has visited the site and is enthusiastic for the proposals.
4.3.2 Support from Educational Establishments Letters were sent to local schools, colleges and Queens University Belfast
advising them of the project and the educational opportunities presented.
Letters of support were received from the University, two secondary schools,
Killard House the special needs school, and three primary schools (see
Appendix F).
4.3.3 Details of Existing Community Involvement and Input The Association has been very active in the field of conservation and the
members work towards the maintenance of wild life habitat including the
preservation of wild birds. A bird rearing programme is operated where wild
duck eggs are collected under license, hatched and brought-on to be released
into the wild. For these efforts the Association has been awarded the Stanley
Duncan Trophy for Conservation on no less than three occasions and more
recently has won the North Downs Rotary Club award for Conservation.
The education of the public, in particular younger children, to the ways of
country sports and country life is a long term constitutional objective of the
Association, and to this end the Association’s grounds have been opened up
on an annual basis to the general public and local schools for over 30 years.
Currently the conservation area is opened to the public for the second week in

46
June and the number of visitors coming to the open week in some years has
numbered several hundred. The schools that visit regularly include several of
those who replied in support of the hydro scheme. They are mainly primary
and infant school children, but regular visitors are groups of disabled pupils
from Killard Special Care School. In the past the visitors and schools have
been able to use the ‘Conservation Hall’, located on the site, to view displays
and carry out curriculum based nature study classes. However, concerns
over the condition of the asbestos roof and wall cladding have led to the
building being closed. A short term Association objective is to replace this
building with a Visitor Centre which can be utilised on a regular basis by
schools.
The 4 acre lake is open to Club anglers, and day tickets are available to the
public. However, access to the water’s edge is not suitable for those with
certain physical disabilities. It is an aspiration of the Association to provide
parking and improved access so that disabled anglers can also enjoy the
benefits of the facilities. The lower pond is to be developed to provide coarse
fishing for a junior angling club, the membership for which will be drawn from
the local community including disadvantaged children in association with the
Ards Community Network.
4.3.4 Public Profile The planned publicity together with the plans to construct a visitor centre and
make information available on the internet should result in high public profile
for the project. This is especially so considering the several unique features
of this project. The provision of data on the performance of the hydro system
which is not currently available on the internet for any other UK micro-hydro
installation will assist in the understanding of renewable hydro energy
generation.
4.3.5 Public Access The site being privately owned by the Association has never been open to the
general public except for an annual open week. The income generated by
this project will enable a greater level of public access to be achieved in a

47
structured and safe manner which also protects the fragile eco-system in the
nature reserve. The Association is currently formalising the access
arrangements to the site for the general public, and these arrangements will
be notified through the local press once in place.
4.3.6 The Need for the Project The objectives of the micro-hydro project are to generate income for the
Association to enable it to fulfil its goals, and to generate renewable electricity
to reduce the carbon emissions from the recipient organisation. From the
responses received to the Association’s letter to educational establishments,
the need for improved access and a quality visitor centre on the Glen Vale site
are clear. The most pressing need is to generate regular income in order that
schools and the general public can benefit fully from improvements to the site.
Once the improved facilities and improved access are in place it is estimated
that several classes of pupils from each of the local schools will visit the site
every year. This could amount to 1,000 or more school pupils visiting the site
each year. It is expected that a site with hydro generation technology on view
will attract a lot of public interest and that public visitor numbers on open days
will increase significantly, again drawing over 1,000 people a year. Improved
access to disabled people and disabled anglers could bring further visitors.
The visibility presented by the Association’s proposed website will bring world-
wide recognition to this unique site. Not only will thousands, perhaps tens of
thousands, of people visit the website, but this also draws in increasing
numbers of people interested in renewable energy generation by hydro power.
The Newtownards Electoral Ward is designated as a socially disadvantaged
area. Together with the cross community nature of the Association, a
significant opportunity is presented to serve the needs of disadvantaged
children in a cross community setting.

48
4.3.7 Promotion of the Scheme As facilities are developed at the site it is planned to invite the local press to
run articles on the development and the facilities to be provided. Initially,
publicity is planned following the feasibility study and the Association is
pursuing the possibility of a feature article with the local newspaper. Further
publicity is planned once a contract has been let for the hydro scheme. Both
Ards Borough Council and the Local Energy Efficiency Advice Centre are very
supportive of the scheme which they each plan to use for publicity purposes.
4.4 The Contribution of the Micro-hydro Scheme to the Local Community
In addition to the generation of green electricity for sale, the proposed micro-
hydro scheme would be one component of a range of improved educational
opportunities for schools, colleges and universities. It would enable a stable
income to be generated to provide the educational facilities presented by this
site. Learning opportunities include the study of nature, ecology and renewable
energy. It is hoped that, with the support of the local communities, the project
will be able to create employment through the development of this amenity which
is part and parcel of the local heritage of the town of Newtownards.
4.5 Meeting with Stephen Thompson of Northern Ireland Electricity A meeting was held with Mr Stephen Thompson of NIE Connect who is the
desk officer for embedded generator connections in the Belfast area. The
following is a summary of the discussions:
• Wheeling of electricity using NIE system should not be a problem. NIE
would charge 2.5p per kWh
• An electricity sub-station located at the rear of Saratoga Avenue
(approximately 200m from the site) could be used to accept output from
the generator. NIE will provide a budget cost for connection.
• The length of cable run should be kept as short as possible as the
voltage rise can be a significant problem for long lengths of cable. The
maximum permitted voltage rise between the NIE substation and the

49
hydro-generator is 10% or approximately 24 volts. The longer the
cable run the heavier the cable needs to be to limit this voltage rise.
• NIE will provide a high level design before a more detailed design for
the system is completed
• G59 protection equipment could be located by either in the hydro-
generator house or on the site boundary. If the former, NIE would lay
cable all the way. If the latter NIE would lay cable to site boundary only.
If protection equipment located on site boundary planning permission
would be required for a secure housing.
• The G59 protection requirements in Northern Ireland vary slightly from
those on UK mainland:
o Under frequency trip at 4%
o Automatic reconnect delay after fault disconnection a minimum
of 1 minute
• The generator house must have background trace heating installed
• NIE sends 2 documents: a wheeling agreement and their pre-
connection questionnaire
• Options for sale of electricity are to identify a nominated recipient and
wheel electricity over the NIE network. If, for example, the client pays
6p/kWh when the wheeling charge is taken off this produces an income
of about 3.5p/kWh for the Association. If electricity sold to NIE a rate of
3p/kWh was quoted, this is inclusive of the wheeling charge.
• NIE is particularly concerned that a maintenance contract is in place
with a reputable and experienced contractor.
• It is proposed that Renewable Obligation Certificate (ROCs) will be
available to all renewable generation by 2005 irrespective of the size of
generator.
• There are a number of different tariff structures which must be
considered eg seasonal time of day (STOD) tariff.

50
4.6 Unique Features of the Project 4.6.1 Educational Potential There are several micro-hydro schemes operating in the UK, the full educational
potential of which are not exploited to their full. A visit to a micro-hydro
installation generally enables the penstock, turbine, generator and outflow to be
viewed. This provides a qualitative experience but does not necessarily enable a
proper understanding of the system or its performance. With the instrumentation
proposed for this project (a lake level monitor, a rainfall monitor, flow meter in the
penstock and electricity meter on the generator output) linked into the control
system it will be possible to monitor lake level, flow rate, generator power output
and power factor in real-time. The data produced will also enable the hydro-
turbine-generator system efficiency to be calculated in real-time. All of this data
will be displayed in real-time on a monitor in the proposed visitor centre.
4.6.2 Wider Educational Access via the World Wide Web By installing a web server and permanent internet connection, and linking the
data outputs from the control system into it will be possible to view the
performance data on the system in real-time via the internet. Research has
revealed that, at present, there is no hydro-generator site in the world which puts
real-time data onto a website. This project will be unique in that it will be a world
first providing students from secondary school to university throughout the world
the opportunity to monitor a micro-hydro site remotely in real-time.
It is also intended to log all of the above data on the web server so that complete
data sets encompassing one year’s worth of data can be downloaded from the
website. Complete data sets would enable comprehensive analysis of the
performance of this particular hydro system, and would allow hydrologists to
compare water flow rates and lake levels with rainfall in the area. This could
provide another income stream for the Association if downloadable data is made
available on a subscription basis, and the income generated would contribute
towards the cost of operating the web server.

51
4.6.3 CCTV Monitoring of the Site CCTV monitoring will be installed to monitor selected areas of the nature reserve
or particular activities on the reserve. CCTV monitors will be positioned in the
visitor centre from where visitors will be able to watch wildlife activities on and
around the lake, and on the lower pond non-intrusively. The monitor outputs will
be extended to the web server to provide a webcam service. This will allow
remote monitoring of the reserve for both educational and security purposes.
Schools will be able to monitor what happens on the reserve throughout the year,
and the Association’s members will be able to monitor poachers and other
unauthorised access to the site.
4.6.4 Educational Access to the Site A steady income from the hydro system will enable the Association to upgrade
the site progressively making it safe for educational parties to use the site for
nature walks and wildlife projects. At present the paths are not in good condition,
there are no guard rails where paths cross streams, the steps to the high dam
are uneven and there is no hand rail.
4.6.5 Disabled Access At present disabled access to the site is very limited, and the Association is in the
process of upgrading this access. The money generated by the hydro scheme
will enable further improvements in disabled facilities on the site including access
for wheelchair bound members of the fishing club as well as members of the
public.
4.6.6 Proposed Waterwheel The correspondence with Queen’s University Belfast resulted in Gerald Müller, a
lecturer in mechanical engineering, expressing an interest in the installation of a
modern high efficiency waterwheel on the site. This could be installed at the
outlet from the lower pond using the same water flow and generating a further
small quantity of electricity. Queens University is currently applying for funding to
construct a full size prototype waterwheel. With the existence of a
hydrogenerator on this site, the additional mains electrical connection required

52
could be provided at low cost. Similarly, a means for the University to monitor
the performance of the waterwheel remotely in real-time could be provided via
the web server.
This would provide an example of modern (hydro-generator) and historical
(waterwheel) methods of generating renewable energy from water. Gerald Müller
and this author know of no other installation in the UK, or the world for that
matter, with a micro-hydro-generator and waterwheel installed on the same site.
An installation of this nature would provide a unique opportunity for University
students and research fellows to monitor the performance of both technologies.

53
5 Legal Considerations 5.1 Ownership The Strangford Lough Wildfowlers and Conservation Association is currently an
unincorporated association. At a recent special general meeting the Association
members agreed to change the legal status of the Association to a Private
Limited Company, limited by Guarantee. The new status will enable the
Association to own and operate the proposed hydro scheme.
The Association owns the Glen Vale conservation area and the water rights in
the area.
5.2 Management of the Scheme The scheme will be managed by the Association under an operating contract with
a local company. Day-to-day responsibility for the safe and correct operation of
the hydro-generator will rest with the contractor. Northern Ireland Electricity has
a statutory responsibility to ensure the electrical safety of the system and its
requirements in respect of connection to the NIE network, system maintenance
and the contractual arrangements required between NIE and the Association,
and the Association and its maintenance and operating contractor. NIE made it
clear that it would not sanction a connection to its system unless it was wholly
satisfied with the competence and experience of the operating and maintenance
contractor.
5.3 Planning Considerations In Northern Ireland the Planning function is carried out by the Northern Ireland
Civil Service. Mr George Martin is the planning officer responsible for
Newtownards and has been consulted about the proposed Hydro-generator
Project. His initial reaction was very positive and, like many of the people
contacted during the study, was engaged by the possibilities presented by the
scheme. He confirmed that planning permission will be required for the
installation of the new intake, penstock and hydro-generator house.
However, the nature and location of the installation is not expected to result in
any formal planning objection. The Environmental Heritage organisation
should be contacted prior to the submission of a planning application.

54
5.4 Other Statutory Obligations The upgrading of a 450mm drainage gully will require the approval of The
Northern Ireland Rivers Agency, and the formal agreement of the land owner
through whose land the drainage gully passes.

55
Section IV - Technical Analysis 6.1 Map and Photographs of The Glen Vale Site The map below shows the position of the lake, dam, valve house, pond, sluice
and other features of the site in conjunction with representative photos. The map
location references are shown in section 6.2.
Figure 17: Map and Photographs of The Glen Vale Site
9
4
5
6
8
13
14
1
3
12
4 Acre Lake
Penstock
Turbine &Generator
House 9
2
Lower Pond
11
To NIE Substation
Main Entrance to Site
10
Glenvale Hall 7
4
5
6
1314
8

56
6.2 Map Location References
1 Inflow to 4 acre lake
2 Main outflow over weir
3 Valve house
4 Outflow from lower pond
5 Outflow from site in 550mm diameter concrete culvert
6 Location where stream wall to be rebuilt
7 Final outflow into 450mm diameter concrete culvert
8 Probable location of junction of drain culverts
9 Proposed location for hydro-generator house
10 Main entrance to site
11 Proposed location of new intake
12 High Dam
13 Route of Penstock
14 Location of NIE Sub-Station

57
6.3 Site Survey
The objectives of the site survey were to:
• Identify environmental considerations
• Determine water flowrates from the valve house outlet and at the
overspill
• Assess the available head
• Identify possible locations for the hydro-generator
6.4 Environmental Considerations Environmental considerations are always an important consideration when
planning a hydro electric generation scheme. Many potential impacts were
examined with the following results:
6.4.1 Hydrological Aspects The 4 acre lake is fed by four streams which, together, provide a continuous flow
of water throughout the year. While flows are greatest in the winter, a substantial
amount of water flows into the lake even during a dry summer. The locations
referred to below are detailed on the map of the Glen Vale in section 6.1.
6.4.2 Silting-Up of Final Inflow Stream (Location 1 on Map) A number of silt traps exist on the final inflow stream to the lake. These have not
been maintained with the result that the lake has silted up gradually over the last
50 years reducing its maximum depth from about 13m to 10m. The Association
recognises that it will be necessary to repair these traps in the near future to
prevent further silting of the lake and to reduce the amount of silt passing through
the hydro turbine. Restoring the traps will have no undesirable environmental
impact.
6.4.3 Water Flow Rate in the Main Overflow Channel (Location 2 on Map) Much of the outflow from the lake flows over a weir at the south east corner of the
lake into an open drainage channel. As this channel dries up in the summer, and
can be 0.5m or more deep in the winter, diverting most of this water to supply the

58
hydro-generator and reducing the flow of water in this overflow channel would not
result in a significant environmental impact.
6.4.4 Water Flow in the Outflow from the Existing Valve House (Location 3 on Map)
The smaller outflow from the existing valve house runs down a stream bed to
service the lower pond. Installing a hydro-generator would bypass this short
stream but discharge directly into the lower pond. The lower pond would
experience an increase in mean flow rate through the pond. Again, no
undesirable environmental impact is likely to result.
6.4.5 Outflow from the Lower Pond (Location 4 on Map) The outflow from the lower pond passes into a large drainage channel 1.6m
below the level of the pond. Increasing the flow rate through the lower pond
would have no measurable effect on the pond.
6.4.6 Outflow from the Site (Locations 5, 6, 7 and 8 on Map) At the point it leaves the site (Location 5), the drainage channel from the lower
pond passes into a 550mm diameter concrete drainage gulley for a very short
distance. Beyond that it passes through the garden of a private house in an open
stream, and then past another house before entering a 450mm diameter
concrete drain where it remains underground as it passes beneath the town
centre of Newtownards. Two areas of concern were identified:
1 Where the drainage channel passes through the garden of the private
house (Location 6) previous owners have removed part of the original
channel wall to form a rock garden feature leading into the water.
During a full flow test from the valve house this caused the stream
partially to overflow into the garden. In discussion between the owner
and the Association Chairman the owner was both supportive of the
plans for the hydro scheme and agreed to allow the stream wall to be
reconstructed by the Association.

59
2 Of greater concern is the 450mm final outflow pipe (Location 7). A
further site survey found this section to comprise three 3.5m concrete
sections, the first having a 2o slope and the other two sections being
horizontal. Beyond these three sections the concrete pipe joins a
much larger culvert beneath Mountain Road. The assessed location of
this junction is shown on the map as Location 8. In discussion with
the Northern Ireland Rivers Agency they advised that no records of
either outflow from the site exist, and that their records begin some
300m to the south of the site. In order to accept the full flow of
0.5m3/s from the hydro-generator system it would be necessary to
upgrade the 450mm diameter section.
6.4.6.1 Consultation with The Northern Ireland Rivers Agency Mr Frankie Mallon of the Northern Ireland Rivers agency was consulted
concerning the capacity of the 450mm diameter drainage culvert leaving the
site, its route slope and length before it connects with the main drainage
channel coming from the existing lake overflow. The Rivers Agency has no
drainage records for this part of Newtownards. Before contracts are let on the
hydro project it will be necessary to undertake an intrusive investigation to
establish the route and length of the 450mm section. A provisional sum has
been included in the costings for this investigation and the upgrading of the
pipe. 6.4.7 Water Flowrate through the Hydro-turbine
In order not to disturb the balance of water flow through the lake, and to maintain
lake levels close to the present summer minimum/winter maximum levels, it is
intended not to draw more water from the lake than the sum of the existing
outflows at the overflow and valvehouse. This will result in a minimum
continuous flowrate through the turbine sufficient to generate over 20kW of
electricity while enabling up to 54kW to be generated when lake levels are high.
Control of the water flow rate through the turbine would be by a lake level sensor
which would operate the turbine at full power when the lake level exceeds a pre-
determined level, and would switch the turbine off if a minimum lake level was
detected.

60
6.4.8 Lake Level. As the lake level in winter is often 1m higher than the mean annual level it is
proposed to increase the lake level by 0.8m by raising the overflow weir. The
structural survey of the dam raised no concerns about its structural integrity as its
top is presently 1.5m above the mean water level. Raising the water level would
have no undesirable environmental effects while increasing the lake store
capacity significantly and the available head by 7%. The Association recognises
that it would need either to cut a new pathway along the southern edge of the
lake higher up the bank and/or construct a boardwalk just above water level for a
distance of about 100m.
6.4.9 Fish Stocks The Association currently has a problem with fish escaping over the weir during
periods of high flow, and is obliged by the Fisheries Board to prevent fish
escaping from the lake. Increasing the lake level and reducing the amount of
water flowing over the overflow will both help to address this issue producing a
positive environmental benefit.
6.4.10 Hydro System Intake The hydro intake will be sited sufficiently below the water level to ensure that
water is available down to the minimum acceptable lake level and that floating
debris is not drawn into the intake, while minimising the pick-up of silt from the
lake bed. Again, raising the lake level will assist in reducing the amount of silt
carried through the hydro system. The intake will be fitted with a fish screen to
prevent fish being drawn through the hydro system.
6.5 Other Environmental Aspects Visual Impact. The hydrogenerator house (Location 9) and penstock will not be
visible from outside the Glen Vale reserve and, thus, no visual impact issues are
likely to arise.
Noise. The hydro-generator system will produce no more noise than is currently
generated by the existing outflow weir. By siting the main water outflow from the

61
lake at the lower pond the main source of noise will be moved further away from
existing housing close to the conservation area.
Trees and Shrubs. While the conservation area has an abundance of mature
trees, the proposed route of the penstock and location of the hydro-generator
house will not require the removal of a single tree. Small shrubs and grasses will
have to be cut back to allow the penstock to be installed, but once in place these
will grow back to cover the penstock permanently.
NIE Power Cable. The NIE power cable will be routed down the Crawfordsburn
Road and into the site. Once in the site it will be buried in soft ground up to the
hydro-generator house. The laying of this cable will require access only for a
mini-digger. Again no trees will be disturbed as a result of cable laying.
Vehicular Access and Plant Equipment (Location 10). The access to the site
is less than 3.5m wide between two brick pillars. This will limit the size of plant
and equipment which can be taken onto the site. The largest item of plant will be
a small crane to lift the pre-fabricated hydro-generator house onto its concrete
plinth.
6.6 Flow Measurements from the Valve House Outlet and Overspill A miniature propeller vane anemometer (which can be used to measure water
velocity as well as wind or air velocity) was used to measure the velocity of the
flow of water from the valve house outlet and the overspill1. The velocity of water
from the valve house outlet was measured at full flow and half flow (the normal
setting of the flow) with the results described below:
• Full flow through the 200mm diameter outlet, the mean velocity
measured was 3.9m/s giving a volumetric flow rate of 0.12m3/s
1 The measuring instrument used was a Testo 435 meter with a 16mm diameter propeller vane 0635.9544 probe. The probe accuracy is ± 0.2m/s.

62
• Half flow, the normal operational setting where the water only exited
from the lower half of the pipe, a mean water velocity of 1.78m/s was
measured giving a volumetric flow rate of 0.03m3/s
Below is a sketch of the construction of the overspill. There was very little water
depth over the weir2, about 10mm, too small for the diameter of the measuring
instrument, and the water was very turbulent. Hence, measurements were taken
in clear laminar [6] flow about 100mm to the lake side of the loose rock barrier.
Figure 18: Sketch of Lake Overspill
The mean water velocity for the overspill, on the day of the visit, over a depth of
175mm and a width of 2.7m was 0.41m/s giving a volumetric flow rate of
0.19m3/s. The depth of the water was recorded by the Association from
November 2003 to February 2004, with the results shown in the table below. Table 3: Record of Overspill Depths
Date Depth of Overspill (mm) 09/11/03 165 16/11/03 265 21/11/03 190
2 Most of the water was found to be flowing through the rock barrier forming the weir.

63
29/11/03 265 08/12/03 190 19/12/03 565 28/12/03 265 05/01/04 295 07/01/04 275 13/01/04 415 18/01/04 340 31/01/04 540 06/02/04 440 07/02/04 340 08/02/04 265 16/02/04 265 20/02/04 240 29/02/04 240
This shows that the flow rate over the weir measured during the site survey is
typical of a winter flow. Currently, the water drained from the lake is maintained
at half flow through the valve house outlet, whilst there is little or no water flow
from the overspill during the summer and a variation in the flowrate in winter
months. In a typical wet summer there is no flow over the weir for a period of
four months, and in the worst case dry summer for a period of 6 months. A mean
flow over the weir based on a weir depth of 175mm for the six winter months and
zero flow over the weir during the summer six months is used for this analysis.
The figure below shows the existing valve house pipe arrangement where it was
suspected, from the site survey, that there could be water flowing in branch pipes
C and D. An investigation
to determine if there was
any flow in the two
pipelines was carried out
by the Association. An
attempt was made to
insert a flow meter in
branch D but was
unsuccessful as the
pressure in the pipe was
too great as valve 4 was
Figure 19: Existing Valve House Pipe Arrangement found to be jammed open.
2"
12"
12"
8"
6"
2"
V1
V2 V5 V6
A
B
D
C
V3
6"
6"
6"
Filter Box AV4
Filter Box B

64
There is a small possibility that water is flowing in branch D which would provide
a greater water resource, but this could not be verified. Based on these findings
it was decided that pipes C and D should be blanked off. By inserting plates
where they come off the 12” main pipe section. The outflow would then be
controlled by valve V2, which is currently operational. 6.7 Sustainable Flows The lake water level has been maintained by setting valve 2 at the normal
operational position for many years with no known adverse reaction to wildlife or
the surrounding environment. For this reason the flowrates measured during the
site survey are representative and should be considered sustainable. The
sustainable winter flowrate is therefore the summation of the measured flowrate
of water from the overspill (0.19m3/s) and the measured flowrate from the valve
house outlet at half flow (0.03m3/s), giving 0.22m3/s, while the sustainable
summer flowrate is 0.03m3/s.
A summer flow of 0.03m3/s would result in an average daily outflow of
2,592m3/day. This flow rate is too low to be of any practical use as it represents
only 6% of the peak flow of a turbine matched to the peak flow. In order to be
able to generate electricity in the summer months the number of hours for which
the turbine could be operated would need to be reduced. As the minimum
pragmatic flow through the turbine is about 30%, based on the turbine efficiency
curve included in Section 7.2, the turbine could be operated at 30% flow for 4.8
hours per day or 33.6 hours per week on average. The financial analysis carried
out to identify how to achieve optimum income from the turbine, indicates that it
would be most cost effective to operate the turbine for 6.7 hours per day between
0800 and 2030 Monday to Friday in the summer months.
6.8 Available Head Water located at a height represents stored energy. Thus, if the available head
at the site is maximised the power output from the turbine will be increased. A
theodolite and staff were used to measure the vertical drop from the centre of the
existing 200mm outflow pipe to the lowest point on the site beneath the weir on

65
the outflow from the pond. The results of the measurements are described
below:
• The drop between the top of the dam and the lake level was measured
as 1.5m, and using the 11.5m difference in level between the top of the
dam and the valve house (contained in the underwater survey report)
the head of the water from the lake to the centre of the 200mm outlet is
10m.
• A fall of 4.2m was measured from the centre of the 200mm outlet to the
north bank of the pond, Location 9 on the map. If this is used as the
turbine location a head of 14.2m would be available.
• A further 2.8m drop was measured from the north bank of the pond to
the top of the 550mm concrete culvert pipe leaving the site, Location 4.
If a turbine was located at the concrete culvert a head of 17m (10m +
4.2m + 2.8m) would be available.
• If the lake level is increased by 0.8m as agreed with between the
Association and its fishing section, the available heads at locations 9
and 4 would be 15.0m and 17.8m respectively.
6.9 Possible Locations for the Hydro-Generator A meeting with the Distributed Generation Manager at Northern Ireland Electricity
(NIE) highlighted some important considerations for locating the hydro-generator
on the site. Firstly, the nearest substation to the site is situated at the rear of
Saratoga Avenue, Location 14 on the map, 200m from the Crawfordsburn Road
and the closest point to the site boundary. Secondly, the length of cable run
should be kept as short as possible as the maximum permissible voltage rise
from the substation to the generator must is 10%. The longer the cable run the
heavier the cable needs to be to limit this voltage rise resulting in additional cost.

66
Thirdly, the G59/13 protection equipment could be sited either in the hydro-
generator house or on the site boundary. These factors will have to be
considered in conjunction with the maximisation of the available head when
deciding the optimum location for the hydro-generator.
It was initially suggested that the hydro-generator could be positioned in the
existing valve house and connected directly onto the existing pipe, utilising the
existing 10m head. However, the measurements revealed that the head could be
increased significantly by situating the hydro-generator south of the valve house
towards the pond at Location 9. The two possible generator locations and
penstock (pipe) route are shown on the map as Locations 9 and 4. It is proposed
that a new penstock be installed with a new inlet at Location 11 with the hydro-
generator positioned 150m from the inlet at Location 9. Location 4 would incur
far greater capital expenditure as a longer and larger diameter penstock would be
required together with a heavier and longer electrical power cable. From the cost
estimates received for the project, the capital cost would increase by at least
£30,000 with a payback on this additional cost of more than ten years.
Furthermore, locating the hydro-generator at Location 4 would require the
penstock to run above ground around the lower pond causing a significant
obstruction to access both the lower pond and the site, and unduly increasing the
visual impact of the installation.
6.10 Optimum Position for the Hydro-Generator House As part of the feasibility study, a specification was produced for the construction
of a hydro-generator house, installation of the hydro-generator and pipework,
control system and G59/1 protection equipment. The tender was sent to six
hydro-generator installers selected from the Clear Skies Installers List, with a
request for the installer to provide a recommendation for the optimum position of
the hydro-generator house. Two of the six installers replied to the tender enquiry
with both confirming that the optimal position for the hydro-generator house is
Location 9.
3 G59/1 is the engineering recommendation relating to the connection of embedded generating plant to public electricity suppliers’ distribution systems.

67
6.11 Penstock Pressure Loss if Existing 300mm Pipe was to be Used It was assessed, before measurements were taken, that the peak flow rate using
the existing 300mm pipe from the existing lake bed intake to the valve house,
could be of the order of 0.5m3/s, giving a power output of 49kW (before the
efficiencies of the turbine and generator are taken into account) on an available
head of 10m at Location 3. However, the measured flow rate of 0.12m3/s
(3.9m/s) from the valve house outlet on full flow did not match the predicted flow
rate as the theoretical power output from the measured flow rate would be only
11.8kW, 37.2kW lower than expected.
Equating the kinetic energy in the measured flow to the potential energy required
to produce that flow, the head for the measured velocity of water at full flow was
calculated as 0.78m. As the actual head is 10m, 92% of the potential energy
available is lost in the current pipe and inlet as friction and inlet losses.
The reason for this pressure loss on the existing pipe appears to be the result of
three factors:
1 The cast iron was installed around 90 years ago, and judging from the
condition of the pipes in the valve house, significant corrosion is
present causing turbulent flow in the pipe and increasing the pressure
loss.
2 The lake bed inlet is at least 40m from the dam face with a further 20m
through the dam wall to the valve house, producing a significant
pressure loss over 60m.
3 The lake has silted-up over time, which is beginning to cause the
Association problems. The existing intake pipe appears to be clogged,
verified by the substantial rotted leaf debris which collected on and
fouled the measuring equipment during the survey. It is concluded
from the analysis that the existing pipe could not be re-used for the
hydro-generator.

68
6.12 New Intake and Penstock Route It is proposed that the new intake be located at Location 11 shown on the map.
The intake must be sufficiently deep that the inlet does not draw branches and
other floating debris into the pipe, but not too deep that silt is sucked from the
lake bed. Increasing the lake level by 800mm will greatly assist in achieving a
location for the intake which meets these criteria. The location proposed is the
site of the original overflow where the dam wall is lower and the earth is soft,
making for a relatively simple penstock penetration through the top of the dam
wall. The area is completely clear of trees and shrubs making the laying of the
penstock relatively straightforward.
The Effective Head section in Appendix A shows possible power outputs from the
hydro-generator based on the hydro-generator house situated at Location 9 for
different penstock sizes. The effective head and, hence, power output is
increased with a 500mm diameter pipe compared to a 400mm diameter penstock
as the pressure losses reduce for an increased flow rate. The turbine installers
recommended that a 500mm diameter penstock be installed.
6.13 Outflow from the Site A number of issues were identified with the outflow. The original overflow weir
from the lake was located where it is proposed to locate the new intake, Location
11. This overflow fed the lower pond and the stream leaving the site between
Locations 5 & 8 took the full storm flow. It is not known why the location of the
lake overflow was changed, but it appears that sections of the outflow stream
were put into concrete drainage pipes at that time. The net result is that the
outflow stream from the lower pond is unable to take the full storm flow from the
lake and unlikely to be able to take the proposed peak flow of 0.5m3/s.
A site survey revealed that at some time in the past the owner of one of the
properties through which the stream flows has removed the side wall of the
stream for a distance of several meters. The stream is no longer contained at
this point resulting in flooding of the owner’s garden when the flow is higher than
normal. Furthermore, the fragile condition of the remaining stream walls could
result in erosion of the banks if a substantially higher flow occurs.

69
In order to avoid the need to replace the final 10.5m of 450mm diameter drainage
culvert to where it joins the main drainage culvert beneath Mountain Road, it is
proposed to:
• Install an automatic weir with pond level control on the lower pond
• Allow the level of the lower pond to rise to accept the large volume of
water produced during the 3 hours per day of full flow operation in the
winter. If the normal winter outflow rate from the lower pond is
0.22m3/s, which the 450mm culvert could handle, the lower pond level
would rise by 0.72m over a 3 hour period. As the lower pond could
accept a water level rise of about 0.4m without increasing the height of
the banks, the outflow lip from the pond, and hence the lowest level for
the automatic weir, would need to be lowered by just over 300mm.
• To duct the existing stream in a 450mm pipe all the way from the site
outlet, Location 5 to the final outflow into the 450mm culvert, Location
7. Rivers Agency approval has been sought for this. Should this not
be forthcoming, the walls of the stream would need to be re-
constructed in a suitable material to ensure that erosion of the stream
banks cannot occur.
6.14 Electrical Interconnection The electrical schematic for the proposed hydro-generator installation is shown in
the drawing in Appendix G. The generator will be of the asynchronous type and
connected for parallel operation with the Northern Ireland Electricity (NIE)
system. The electrical system in the hydro-generator house is to include the
following:
• Hydro-turbine protection
• Generator Protection to G59/1 including
Over Voltage

70
Under Voltage
Over Frequency
Under Frequency
Loss of Mains
• Generator and turbine connection to earth electrode
A 350m run of underground cable will be installed by NIE from the 11kV
substation to the hydro-generator house. The installation will include NIE’s own
protection equipment and export metering.

71
7 Real-time Performance of Micro-hydro Scheme Section 4.6.2 discusses the possibility of installing a real-time data acquisition
system which can be viewed over the web, as an integral part of the SLW&CA
micro-hydro scheme. An overall design schematic of the proposed data
acquisition system for the SLW&CA hydro scheme is presented below.
7.1 Data Acquisition System The data acquisition system would comprise four sensors to monitor lake level,
water flow rate, power output and rainfall. Table 3 shows the type of sensor
required in each case and the location of each sensor. The recorded data from
the four sensors is delivered to a hydro-generator control system, to be located in
the generator house which enables the generating plant to run unattended [26].
The hydro-generator control system would continually make adjustments to the
hydro scheme by communicating with the sensors to open or close gates to
ensure the optimal flow of water from the lake while protecting the ecology of the
lake.
Figure 20: Data Acquisition System Schematic
Lake Level
Sensors
Water Flow Meter
Power Output
Rainfall
Hydro-generator Control System
(Places Data on Web Page)
Data word at 1 second
Intervals
Start Bit Stop Bit 16 bits for each sensor
Computer and Web Server

72
Table 4: Location of Data Acquisition Sensors
Sensors Type Output Location
Lake Level Ultrasonic 4 – 20mA On Lake Bank
Water Flow Rate Flow Meter 4 – 20mA In Penstock
Power Output Electricity Meter Pulse On Generator
Output
Rainfall Rain Gauge 4 – 20mA On top of dam
7.2 Web Server Prototype Page From the hydro-generator control system the data collected from the sensors
would be sent to a computer web server, located in the SLW&CA club house,
at one second intervals. The data from the sensors would then be presented
as live outputs of the system performance on an SLW&CA webpage. The
web page should give the user the facility to access historical data.
A mock prototype of the proposed SLW&CA webpage is presented on the
following page showing the real-time performance characteristics of the hydro
scheme.

73
Date Time 13/09/2004 11:00:13
Water Flow Rate (m3/s)
Power Output (kW)
0.30 33.00
Lake Level (m) Rainfall Today (mm)
11.00 10.00 KWh Today 300.00
Figure 21 Prototype Web Page

74
Section V – Analysis of Potential Energy Resource and Income from Exported Energy
8.1 Methodology A methodology was used to model the potential energy resource and income
from exported energy from the proposed hydro-generator using the data
gathered during the study. The feasibility study was constrained by time and
limited availability of historical data. The study relies on flow rate
measurements taken on two separate visits, one in winter and one in summer,
and the Association’s knowledge of hydrological and environmental aspects of
the lake. The Association agree that the data, measured during the visits and
over the course of the feasibility study, is an accurate representation of the
lake’s characteristics. This has permitted a technical analysis of different
scenarios and a corresponding financial appraisal of the proposed micro-
hydro scheme.
The methodology utilises CIBSE GUIDE VOLUME C Section C4 Flow of
Fluids in Pipes Table C4.24 and Table C4.18 [1], and the Statement of
Charges for Use of NIE plc Electricity and Distribution System [8]. The main
objectives of the study are to establish the optimum location of the turbine-
generator, the optimum diameter of penstock pipe and the income from
exported energy. The location for the hydro-generator was identified in
Section IV 6.10 Optimum Position for the Hydro-generator. Section V
provides the methodology for examining the optimum pipe size and possible
income generated by distributing the electricity generated across the network.
8.1.1 Site Survey As no historical data is available, the site survey is essential for gathering flow
rates, available head and possible locations of the hydro-generator. It is
important to question the historical knowledge of the site, if there is any. A
survey may also be able to identify electrical connection, planning and land
ownership issues.

75
8.1.2 Penstock Pipe Size As the existing pipe penstock cannot be re-used on the Glen Vale site, a
technical analysis of the optimum pipe sizes must be undertaken. A
spreadsheet (see Appendix D) with an array of flow rates was created, from
the CIBSE GUIDE VOLUME C Section C4 Flow of Fluids in Pipes, for
different diameter of pipes. Using the calculated optimum flow rates to
maintain the lake’s ecology, and available head at the site, the pressure
losses in pipe sizes were established in order to calculate the effective head.
From the effective head, flow rate and the turbine efficiency (using a Kaplan
turbine), the power output was calculated and, hence, the optimum penstock
pipe size identified.
8.1.3 Income from Electricity To maximise the income from the hydro-generator, it is important that
electricity output from the hydro-generator matches the electricity use profile
of a customer in the area for a 24 hour period. However, it is highly unlikely
that in any half-hour the exported electricity will exactly match the import
requirements. In this case the deficit (makeup) will be made up by NIE Supply
or another Supply business and charged under the Supply tariff (see
Appendix C) [9]. Under the Bulk Purchase tariff the surplus (spill) will be
purchased by NIE Power Procurement. NIE are keen to wheel distributed
renewable sources of electricity over the network.
8.1.3.1 Distribution Use of System Charges NIE Transmission & Distribution Business will apply Distribution Use of
System charges to all units wheeled across the network. Distribution Use of
System charges will be passed on to the embedded generator and are based
upon the connected voltage and the appropriate Use of System tariff of the
sites being wheeled to (see Appendix C).

76
8.1.3.2 NIE Electricity Tariffs The study considers the distribution use of system charges, from the
Statement of Charges for Use of the NIE plc Electricity Transmission and
Distribution System and the associated consumer tariffs. Without considering
domestic electricity supply, NIE’s tariffs are subdivided into small commercial/
industrial and Seasonal Time of Day Tariff (STOD). The STOD tariff is further
divided into two categories; Business and Farm Energy. The table in
Appendix C shows all of the different tariffs available. However, the only
tariffs analysed in conjunction with the operating hours of the hydro-generator
are Farm and Business Energy for supplies under 1MW.
8.1.3.3 Connection Arrangement The connection arrangement for generators wishing to export on to the NIE
network includes a technical assessment of the connection arrangement at
the property where the generator is to be located and can result in a charge
for connecting the generator. A suitable meter 3 phase, Code 5, Issue 2
meter & modem will be required at a cost of £400 to record the import and
export at each of the sites. A dedicated BT telephone line is also required for
accessing and downloading the metering data on a daily basis.
8.1.4 Financial Viability The final phase of the methodology was to assess the financial viability of the
project. This includes all capital costs for the installation of a hydro-generator,
associated electrical and civil works which were established from Newmills
Hydro, located in Northern Ireland. Estimates of the annual costs are made
and sources of finance for renewable projects.

77
8.2 Effective Head The pressure losses in the pipe are a result of frictional drag and turbulence as
the water flows through the pipe. These flow losses contribute towards energy
losses in the system. The CIBSE GUIDE VOLUME C Section C4 Flow of Fluids
in Pipes Table C4.24 and Table C4.18 were used to calculate pressure losses for
a range of given flow rates for four different diameter pipes (300mm, 400mm,
450mm and 500mm). The calculations do not consider entry and exit losses
from different pipe diameters because they are negligible for pipes of these
diameters. For each pipe diameter the calculation was based, firstly, on a 14.2m
available head and 150m pipe length and, secondly, on a 17m available head
and 260m pipe length. The pressure loss of the pipe is taken away from the
available head to give the effective head for different flow rates. The potential
power output is calculated for each of the different values for effective head and
corresponding flow rate. There are further energy losses converting the input
power into electrical output. The calculations assume a hydro-generator
efficiency of 90% and is based on a Kaplan vertical axis turbine. Power and flow
rate line graphs were produced against an effective head, for locations one and
two, for different pipe diameters.
Figure 22 shows the power output from a 500mm diameter pipe with the hydro-
generator situated in location 1, with 15m available head and 150m pipe length.
The effective head is increased with a 500mm pipe compared to other diameter
pipes as the pressure losses and flow rate are reduced. The power output with a
500mm pipe shows a more linear trend than with lower pipe diameter sizes,
giving 54kW peak output at 0.5m3/s. The graph shows that the power output
increases as the flowrate increases while the effective head decreases. If the
flowrate is increased in a given pipe this causes increased pressure losses as a
result and, hence, the effective head is reduced. Although the effective head is
reduced in Figure 22 below, the flowrate increases sufficiently to result in an
increase in power. However, there are cases (see Appendix A Figure 27) where
the flowrate in the pipe becomes so high that the pressure losses result in a
significant reduction in effective head, causing the power output to decrease. A
number of similar graphs were produced for the hydro-generator sited at location
1 and two for different pipe diameters. However, siting the hydro-generator at

78
location 1 (14.2m actual head), with a 500mm diameter pipe was found to be the
optimum location and pipe size for the hydro-generator. See Appendix A for the
power output analysis of different pipe diameters at an available head of 14.2m
and 17m.
Figure 22: Power Output from a 500mm Diameter Pipe 8.3 Electricity Consumers The site has one small building, the clubhouse, which is occasionally used and
which uses electricity for lighting and domestic appliances only. Hence, there is
no significant electrical load on the site. The electricity generated by the
proposed hydro scheme could be sold to a consumer in the area, with a load
which matches the proposed hydro-generator output or to NIE. The preferred option would be to sell to a consumer in the area. For SLW&CA to
maximise their income they need a customer whose electricity use profile
matches the output of the proposed hydro-generator, uses electricity 24 hours a
day and pays an average commercial or industrial tariff and a Seasonal Time of
Day (SToD) charge. The NIE SToD tariff is a charge levied on commercial and
500mm Diameter Pipe - Power Output at 90% Efficiency and Flow Rate vs Effective Head - Based on 15m head and 150m
Pipe Length
0.0010.0020.0030.0040.0050.0060.0070.00
13.9313.8613.7813.7013.6313.5513.4713.4013.3213.2413.1713.0913.0112.9412.8612.7912.71
Effective Head (m)
Pow
er (k
W)
0
0.1
0.2
0.3
0.4
0.5
0.6
Flow
Rat
e (m
3/s)
Power Flow Rate

79
industrial consumers for 3 hours per day in Northern Ireland between November
and February and can be 45p/kWh or more.
It is therefore necessary to identify a nominated recipient and wheel electricity
over the Northern Ireland Electricity (NIE) Network. NIE would charge SLW&CA
for using distribution lines (wheeling) at around 2.5p/kWh.
8.4 Proposed Turbine Operating Schedule The different tariff structures provided by NIE must be considered in conjunction
with the turbine operating under conditions that will not adversely affect the
ecology of the lake. The proposed operational schedule for the hydro scheme is
assumed purely for the feasibility analysis. To optimise the income whilst
maintaining an acceptable lake level, the following operation should be adopted
for supplying electricity to the grid or a nominated recipient:
1. Operate the turbine at a flow rate of 0.22m3/s (44% flow, 78.1% system
efficiency and 14.69m effective head on a 500mm penstock) for the
following periods of the year:
• March & October 0800-2030 hours (weekdays)
• March & October 2030-2230 hours (weekday Evenings)
• March & October 2230-0800 hours (weekday Nights)
• March & October (weekends)
• November - February (weekends) 2. Operate the turbine at a lower flow rate of 0.17m3/s (34% flow, 76.24%
system efficiency and 14.81m effective head on a 500mm penstock)
for the periods described below:
• November & February (weekday outside SToD hours)
• January & December (weekday)

80
3. Operate the turbine at the peak flow rate of 0.5m3/s (100% flow, 85.5%
system efficiency and 13.55m effective head on a 500mm penstock)
for the period described below:
• November - February (SToD 1600 -1900 hours)
4. Operate the turbine at the peak flow rate of 0.15m3/s (30% flow, 75.5%
system efficiency and 14.85m effective head on a 500mm penstock)
for the period described below:
• April – September 6.7hours between 0800 – 2030
Weekdays

81
8.5 Analysis of Potential Revenue Resulting from Selling Electricity The calculations in this section are based on a Kaplan Turbine with a maximum
Figure 23: Kaplan Turbine and System Efficiencies for Glen Vale
output of 54kW designed for the Glen Vale site. The graph above shows that the
turbine efficiency is 92% at a maximum flow rate. The turbine efficiency curve in
Figure 23 was extrapolated from the Kaplan turbine efficiency graph from
Newmills Hydro (see Figure 11). The system efficiency is based on an assumed
generator efficiency of 95% and the corresponding turbine efficiency at a given
flow rate. Appendix C shows the standard electricity tariffs for NIE for supplies greater or
less than 1MW and whether the supply is on a high voltage or medium voltage
line. For the purposes of the case study an analysis of the possible incomes was
undertaken for supplies of less than 1MW on the Business Multi-Option and Farm
Tariffs. The full analysis can be seen in the tables in Appendix D. The following
tables are a summary of the results in Appendix D:
Kaplan Turbine and System Efficiencies for Glen Vale
70%
75%
80%
85%
90%
95%
0% 20% 40% 60% 80% 100% 120%
Percentage Flow
Effic
ienc
ies
Turbine EfficiencySystem Efficiency

82
Table 5: Revenues for Different Pipe Diameters with Business Tariff Multi-Rate Option Under
1MW High Voltage Line with the Hydro-generator Sited at a 15m Head
Diameter of Pipe (mm) Annual Energy (kWh) Revenue (£)
400mm 116,085 £10,132
450mm 119,500 £10,523
500mm 120,677 £11,505
Table 6: Revenues for Different Pipe Diameters Farm Tariff Multi-Rate Option Under 1MW
High Voltage Line with the Hydro-generator Sited at a 15m Head
Diameter of Pipe (mm) Annual Energy (kWh) Revenue (£)
400mm 116,085 £9,679
450mm 119,500 £10,044
500mm 120,677 £10,972
The two tables clearly show that the 500mm pipe provides the greatest annual
revenue for the SLW&CA. A comparison between the figures in the two
tables also shows that the Business Tariff provides the greatest income of the
two tariffs.
8.6 Analysis of Potential Revenue Resulting from Selling Electricity to Exploris SLW&CA approached Ards Borough Council for assistance with a micro-hydro
feasibility study. The Council proposed that SLW&CA could sell the electricity
generated by the proposed hydro-generator to Exploris. The Exploris building is
on the Farm Energy NIE tariff.
The table below shows the distribution use of system charges if SLW&CA were
to wheel electricity to Exploris.

83
Table 7: Distributed Use of System Charges for Exploris
Distribution UoS Charges in Respect of Wheeled Units4
STOD TARIFFS Peak Weekday Day units April – Oct & March
Evening & Weekend
Night
Dec/Jan p/kWh
Nov/Feb p/kWh
Dec/Janp/kWh
Nov/Feb p/kWh p/kWh p/kWh p/kWh
Medium Voltage
under 1 MW 12.671 11.872 2.760 1.379 0.476 0.545 0.226 For the purpose of the study, and in order to calculate the possible revenue
available to the association, the Council provided the current unit charges of
electricity for Exploris. The table on the following page shows the different NIE
tariff structures for Exploris and establishes the unit income for SLW&CA if they
were to sell electricity to the Council.
4 Table 5 is taken from Schedule E Table 1b from the Statement of Charges for Use of The Northern Ireland Electricity and Distribution System by Authorised Persons provided by NIE

84
The annual energy resource available and income revenue from Exploris are
shown in the table below for a given power output and flowrate. Table 8: Unit Electricity income for SLW&CA
Exploris Tariff Structure Exploris Tariff p/kWh
NIE Wheeling Charge
p/kWh
Unit Income for SLW&CA
p/kWh April - October & March 0800-2030 hours (weekdays)
6.4 0.476 5.924
April - October & March 2030-2230 hours (weekday Evenings)
3.5 0.545 2.955
April - October & March 2230-0800 hours (weekday Nights)
3.5 0.226 3.274
April - October & March (weekends) 3.5 0.545 2.955Nov & Feb (weekday Outside SToD hours 9.6 1.379 8.221Jan & Dec (weekday) 9.6 2.76 6.84Nov & Feb (SToD 1600-1900 hours) 48 11.872 36.128Jan & Dec (SToD 1600-1900 hours) 48 12.671 35.329Nov & Feb (weekends) 3.5 0.545 2.955Jan & Dec (weekends) 3.5 0.545 2.955
8.7 Energy Resource and Projected Income Estimates of the annual energy resource available and income revenue from
Exploris are shown in the table below. The same calculations were undertaken
for another hydro-generator location on the site and different diameters of pipes.
However, the data in the table are estimates of the annual energy resource
available and income revenue for the hydro-generator at the optimum location, ie
Location 9, with a 15m actual head.

85
Table 9: Annual Energy Resource and Income from Exploris
500mm Diameter Pipe – 15m Actual Head Exploris Tariff Structure Power Output
(kW)
Annual Energy (kWh)
Annual Revenue
(£)
March & October 0800-2030 hours (weekdays)
24.88 13,684 £811
March & October 2030-2230 hours (weekday Evenings)
24.88 2,189 £65
March & October 2230-0800 hours (weekday Nights)
24.88 10,400 £340
March & October (weekends) 24.88 10,748 £318 Nov & Feb (weekday Outside SToD hours)
18.81 16,591 £1,364
Jan & Dec (weekday) 18.81 17,776 £1,216 Nov & Feb (SToD 1600-1900 hours) 57.16 7,202 £2,602 Jan & Dec (SToD 1600-1900 hours) 57.16 7,717 £2,726 Nov & Feb (weekends) 24.88 19,705 £582 April - September between 0800-20hours weekdays
16.71 14,466 £857
Total 120,677 £10,892
If SLW&CA were to supply Exploris, and the hydro-generator were installed at
Location 9 with a 500mm diameter pipe supplying water to a Kaplan turbine a
revenue of £10,892 per annum could be possible.

86
Section VI - Financial Viability
9.1 Capital Costs An analysis of estimated costs for the proposed hydro project is given in this
section. The hydro contractor costs are accurate costs received as a result of a
tendering process in support of the feasibility study. The costs include:
• Civil, mechanical and electrical works
• System design
• Supply of all plant and equipment
• Installation, Connection, Testing and commissioning of Plant and
Equipment
• Provisional Sums for:
• Connection to the NIE system
• Repairs to the upstream silt traps
• Upgrades to the outflow stream
• Installation of an automatic level controlled weir on the lower pond
• Planning costs and other statutory fees
• Project Management costs
• A web server and broadband connection
Total estimated costs = £267,951
9.2 Ongoing Annual Costs Estimates of ongoing costs are:
• Operation and Maintenance Contract for hydro-generator = £750
• Annual rental of broadband circuit for web server = £200
• Website maintenance = £200
• Insurance = £500
Total ongoing costs = £1,650 / annum

87
9.3 Sources of Finance The financing plan for the project is:
1. Clear Skies grant of 50% of project cost = £100,000
2. Northern Ireland Electricity SMART fund of 25% of project cost =
£64,488
3. The balance of funding to come from:
Ards Borough Council Local Agenda 21 Committee funding
Funds raised by the Association
The Association is investigating several options for raising the balance of funding
required. These could include loans from members and membership levies, and
an interest free loan from the British Association of Shooting Clubs. The club’s
property portfolio is estimated to be worth up to £1,000,000, and further finance
could be raised through the sale of a portion of the Glen Vale site which could
raise up to £100,000.
9.4 Annual Income for SLW&CA The annual income from the hydro-generator, based on a 90% peak efficiency
Kaplan Turbine installation, could be £10,800 per annum. The analysis of annual
energy resource and income from exported energy, Appendix D, covers the
projected performance of all components of installation including energy,
rating/output (kW, kWh/year). The sale by subscription of hydro system data
over the internet could produce a small income helping to offset the cost of
operating the web server. The data could be of interest to students or people
installing their own micro-hydro systems and, hence, fees could be charged at £1
each time the data the data is accessed. This could provide a small annual
income contributing towards the cost of maintaining the web page. In future
years, when at least one year’s worth of data has been collected and the site is
known worldwide, it is hoped that sufficient income would be produced to cover
the whole of the web server operating costs. An estimate of the net annual
income available is £9,150.

88
The table below is a summary of the hydro installation costs at the Glen Vale
site. These costs were provided by Newmills Hydro.
Table 10: Summary of Capital Costs and Funding
Capital Costs
Clearskies Grant
NIE SMART Funding
Balance Required
Hydro Contractor
£179,951
NIE Connection to Grid
£45,000
Planning Permission
£2,000
Project Management
£15,000
Outflow Upgrades
£10,000
Automatic weir
£10,000
Repair Silt traps
£2,000
Webserver/website
£4,000
Total £267,951 £100,000 £66,988 £100,963
9.5 Renewable Obligation Certificates (ROCs) The renewable obligation directs electricity companies to source a proportion
of their generating capacity from renewable technologies, and was introduced
by the government to stimulate investment in renewable energy. ROCs are
awarded to accredited generators of eligible renewable electricity produced
within the UK. Types of renewable technologies that are eligible are; solar
energy, hydro, wave power, tidal energy, geothermal energy, biofuels and on
and offshore wind farms.
At the time of the meeting with Stephen Thompson of NIE he was asked for
guidance on ROCs. Stephen was unable to help at that time, or give us a
contact with whom we could discuss ROCs, as he stated that no decisions
had yet been made about ROCs in Northern Ireland and that no information
had yet been published. Following a telephone conversation with Jenny

89
Boyd, Malachy Mckernon of the DETI Energy Division was contacted. He
advised that he is currently preparing a consultation document in which it is
proposed that small scale hydro (less than 1.25MW capacity) in Northern
Ireland be eligible for ROCs from April 2005. It is therefore, highly likely that
the proposed hydro system will be eligible, but is not a foregone conclusion.
Based on the current value of 4p/kWh (this could change), the estimated
120,000kWh of electricity generated annually by the system could attract an
additional annual income of £4,800. This would increase the net annual
income from £9,150 in the feasibility study to £13,950. It should be noted that
as ROCs are a tradeable commodity their value is not fixed and can rise or fall
dependent on market forces.

90
Section VII – Conclusions and Recommendations 10.1 Conclusions The approach undertaken in this thesis involved five stages which are
summarised below.
Stage 1
A literature review of hydro-electricity aided in providing an understanding of
hydro schemes, their components and the requirements to perform a field
study at the Glen Vale site. The main findings were that the majority of micro-
hydro installations in the UK were installed before 1990, relating to the textile
industry, and not grid connected. To connect the proposed SLW&CA turbine
generator to the grid strict health and safety guidelines must be followed and,
to reduce the strain on the electricity network a local load matching the output
from the generator must be found. The literature review established that no
real-time performance data from the web is available from any micro-hydro
installation.
Stage 2
The feasibility study itself, because of time constraints, permitted flow rate
measurements from the existing outflow to be taken on two separate
occasions with the Association’s Chairman recording overspill measurements
throughout the winter. Using a theodolite, possible generator locations were
established to maximize the available head. The findings resulted in a peak
power output of 54kW. A Kaplan turbine, the most efficient turbine at the
available head and flow rate, was selected from the findings in the literature
review. The knowledge from the Association and Council was used to
determine the environmental and socio-economic impacts of the proposed
hydro scheme.
Stage 3
Hydro installers were contacted to establish indicative installation costs of a
56kW turbine.

91
Stage 4
A sustainable operating schedule for the micro-hydro scheme was assumed
based on sustainable flow rates and maximising possible income from NIE
tariffs and use of system distribution charges.
Stage 5
Using the costs provided by a hydro installer, the predicted income from the
hydro-generator, and possible grants, the proposed scheme was found to
have a payback of just over 10 years.
Without grant assistance the payback on the micro-hydro scheme would be
over 28 years. This length of payback is typical for capital intensive hydro
installations. However, the installation is financially viable if viewed long term
by the Association, with a payback of 10 years which could be less if the cost
of electricity increases.
The five stage approach used in the thesis to assess the feasibility of a micro-
hydro installation could be used as a guideline methodology for other projects
of a similar size and nature. However, stage two of the methodology would
need to be adapted if there was no existing sustainable outflow from the lake.
Water levels, rainfall analysis and catchment area would have to be taken into
account in the survey of the site. An analysis of the impact on lake level by
alternating the water flow rate throughout the seasons would be required. The
electricity tariffs would have to be analysed, based on the different suppliers
for a given location.
10.2 Recommendations
It is recommended that if grant funding is made available that the Association
employ a hydro contractor to install the micro-hydro turbine scheme described
in this thesis. As part of the installation the Association should ensure that the
installer agrees with all measurements and assumptions made in this thesis.
Further work is required to produce a detailed schematic of the data
acquisition system and web page with performance characteristics of the
scheme.

92
References 1. CIBSE GUIDE VOLUME C Section C4 Flow of Fluids in Pipes
2. Small Hydro Power
http://www.smallhydropower.com 2. Types of Hydro Plants
http://www.webconx.com/hydro.htm 3. Simond J J, Adjustable Speed Asynchronous Machine in Hydro Power
Plants and its Advantages for the Electric Grid http://lemewww.epfl.ch/ME/publications/1998/speeddrive_1998.pdf
4. Warnick C.C (1984), Hydropower Engineering, Prentice-Hall, U.S.A pp 5. 5. Engineering Recommendation G59/1 1991 Recommendations for the
Connection of Embedded Generating Plant to the Public Supplier’s Distribution Systems
6. Acheson D J (1990), Elementary Fluid Dynamics, Clarendon Press Oxford,
UK pp 265 7. Statement of Charges for Use of The Northern Ireland Electricity plc
Electricity Transmission and Distribution System by Authorised Persons 2003/2004, Northern Ireland Electricity
8. Northern Ireland Electricity Tariffs: http://www.nie.co.uk/nieenergy/businessenergy/billingoptions/latestprices.html 9. Gulliver J S, Arndt R E A, (1991), Hydropower Engineering Handbook,
American Society of Mechanical Engineers, pp 8 -10 10. UK Hydro Installations
http://www.british-hydro.org/installations.asp 11. Micro-hydro Power in the Nineties
http://www.elements .nb.ca/theme/energy/micro/micro.html 12. Pollitt M G, The Restructuring and Privatisation of the Electricity
Supply Industry in Northern Ireland – Will it be Worth It? 1997 http://www.econ.cam.ac.uk
13. Baudoncourt C, Feasibility of a 100% renewable energy community at
Clachan, Mull of Kintyre 2000, MSc Thesis, ESRU, University of Strathclyde, pp 28

93
14. Gilbert J, The existing hydro-electric system and further renewable energy potential at the Ormsary Estate 1993, MSc Thesis, ESRU, University of Strathclyde, pp 23
15. Clear Skies Renewable Energy Grants, 02-03: clearskies-guidance-feas-
v1.0, Clear Skies 16. NIE SMART fund
http://www.actionrenewables.org/funding.htm 17. Open University (1986) T362 Design and Innovation, Units 3 – 5, Water
Turbines, Open University Press, pp 1-20 19. Distributed Energy Resources
http://www.eere.energy.gov/der/us 20. Evans Engineering Ltd
http://www.microhydro.com/ 21. Newmills Hydro:
http:.//www.newmillshydro.freeserve.co.uk
22. Water Power – Micro-hydro Systems http://www.save.org.au/~ata/basics/bashydro.html
23. Hydro Governors and Controls
http://www.energypulse.net/centers/article 24. Northern Ireland Electricity http://www.nie.co.uk 25. Data Acquisition System http://domino.automation.rockwell.com

94
Bibliography 27. Journal of Hydraulic Research Performance Characteristics of Water
Wheels (2004) Vol 00, No 0, pp 1-2 28. Micro-hydro Power:
http://www.microhydropower.net/welcome.html 29. Frequently Asked Hydro Questions
http://www.jade-mtn.com/faq/faqhydro.html 30. Nautilus Turbine
http://www.waterturbine.com 31. Micro-hydro Turbine Generators
http://www.almac.co.uk/proven/pages/hydro.html 32. Northern Ireland Electricity:
http:.//www.nie.co.uk 33. Hydrolink
http://www.hydrolink.cz/
34. Examples of Small Scale Hydro Developments
http://www.canren.gc.ca/tech_appl
35. Hydro Power Pressure and Flow Tables
http://www.poweriseverything.com/impt-info/hydropwrpage.html 36. Fraenkel P, 1991 Micro-hydro Power, Intermediate Technology 37. ICE Civil Engineering 156 August 2003 pp124-129 Paper12917 Cuileig –
A Benchmark for Future Hydropower Schemes 38. Energy Primer (1974) Solar, Water, Wind and Biofuels 39. Adam Harvey, 1993, “Micro-Hydro Design Manual”, Intermediate
technology 40. International Hydropower Association
http://www.hydropower.org 41. State of the Art Hydro Power Technologies
http://www.asem-greenippnetwork.net 42. Current Hydro Projects by Amco
http://www.amco-construction.co.uk/project.cfm

95
43. Department of Trade and Industry
http://www.dti.gov.uk 44. Frey G W, Linke D M, 2002, Hydropower as a Renewable and Sustainable
energy Resource Meeting Global Energy Challenges in a Renewable Way, Energy Policy

96
APPENDICES Appendix A - Pipe Pressure Loss It was initially predicted that, before measurements were taken, the flow rate
would be of the order of 0.5m3/s, giving a power output of 49kW (before
efficiency of the generator is taken into account) on an available head of 10m.
However, the measured flow rate of 0.12m3/s (3.9m/s) from the valve house
outlet on full flow did not match the prediction as the theoretical power output
from the measured flow rate would be 11.8kW (37.2kW lower than expected).
Equating the kinetic energy in the measured flow to the potential energy required
to produce that flow, the head for the measured velocity of water flowing at
3.9m/s was calculated as 0.76m. As the actual head is 10m, 92% of the potential
energy available is lost as pipe friction loss.
The explanations for the pressure losses are a combination of three factors. The
first is that the pipe is cast iron and was installed around 90 years ago. It is
therefore suspected from the condition of the pipes in the valve house (see
Figure 24 below) to have been subjected to corrosion, causing turbulent flow in
the pipes and increasing the pressure loss. The second issue is that the inlet
from the lake is 40m from the dam and could be a further 15m to 20m before
existing at the
Figure 24: Valve House Pipework

97
outlet from the valve house, resulting in significant pressure loss over this
distance. The third combining factor is the lake has gathered silt over time, which
the SLW & CA have expressed increasing problems with. It is suspected that the
existing intake pipe could be clogged. This assumption is further verified by the
substantial rotted leaf debris which collected on and fouled the measuring
equipment during the survey. To optimise the performance of the system it is
recommended that that the existing pipe be abandoned and be permanently
valved off as the power available from the existing pipe is too small for practical
purposes. Effective Head
The CIBSE GUIDE VOLUME C Section C4 Flow of Fluids in Pipes Table C4.24
and Table C4.18 were used to calculate pressure losses for a range of given flow
rates for four different diameter pipes (300mm, 400mm, 450mm and 500mm).
The graphs are discussed and shown on the following page.
Figure 25: Power Output from a 300mm Diameter Pipe with the Hydro-generator Situated in
Location 1
Figure 25 shows the power output from a 300mm diameter pipe with the hydro-
generator situated in location 1, with 14.2m available head and a 150m pipe
length. The graph shows that the peak power output could be around 23kW for a
corresponding flowrate of around 0.3m3/s and an effective head of around 9m.
300mm Diameter Pipe - Power Output at 90% Efficiency and Flow Rate vs Effective Head - Based on 14.2m head and 150m Pipe Length
0.00
5.00
10.00
15.00
20.00
25.00
13.44 13.13 12.67 12.21 11.52 10.38 8.85 6.55 3.50
Effective Head (m)
Pow
er (k
W)
00.10.20.30.40.50.6
Flow
Rat
e (m
3 /s)
Power Flow Rate

98
The pressure losses become so great once the flow rate reaches a certain point
(in this case around 0.35m3/s) that the power falls significantly.
Figure 26: Power Output from a 400mm Diameter Pipe with the Hydro-generator Situated in
Location 1
400mm Diameter Pipe - Power Output at 90% Efficiency and Flow Rate vs Effective Head - Based on 14.2m head and 150m Pipe Length
0.005.00
10.0015.0020.0025.0030.0035.0040.0045.0050.00
13.66 13.55 13.44 13.32 13.21 13.09 12.98 12.86 12.75 12.37 11.45 10.53 9.61 8.70 7.78 6.86 5.94 5.03
Effective Head (m)
Pow
er (k
W)
0
0.1
0.2
0.3
0.4
0.5
0.6
0.7
0.8
Flow
Rat
e (m
3 /s)
Power Flow Rate

99
Figure 26 shows the power output from a 400mm diameter pipe with the hydro-
generator situated in location 1, with 14.2m available head and 150m pipe length.
This scenario could generate a peak power output of around 42kW with a flow
rate of the order of 0.52m3/s and an effective head of around 9m. Figure 26
shows a similar trend to Figure 25 with the power falling once the flow rate
reaches around 0.55m3/s5.
Figure 27: Power Output from a 400mm Diameter Pipe with the Hydro-generator Situated in
Location 2
Figure 27 shows the power output from a 400mm diameter pipe with the hydro-
generator situated in location 2, with 17m available head and 260m pipe length.
A comparison between situating the generator at location 1 and 2 shows that the
average power increases slightly for different flow rates if positioned in location 2.
However, the peak power generated by location 2 would be the same as location
1, but would require an even greater flow rate.
5 The apparent cusp in the flow rate and power output curves in graph 2, 3 and 4 result from the CIBSE data used in the calculations.
400mm Diameter Pipe - Power Output at 90% Efficiency and Flow Rate vrs Effective Head - Based on 17m head and 260m Pipe Length
0.00
5.00
10.00
15.00
20.00
25.00
30.00
35.00
40.00
45.00
16.07 15.81 15.54 15.28 15.01 14.75 14.48 13.29 11.17 9.05 6.93 4.81 2.69 0.57
Effective Head (m)
Pow
er (k
W)
0
0.1
0.2
0.3
0.4
0.5
0.6
0.7
0.8
Flow
Rat
e (m
3 /s)
Pow er Flow Rate

100
Figure 28: Power Output from a 450mm Diameter Pipe with the Hydro-generator Situated in
Location 1
Figure 28 shows the power output from a 450mm diameter pipe with the hydro-
generator situated in location 1, with 14.2m available head and 150m pipe length.
It can be seen that with generally lower flow rates than a 400mm pipe (see Figure
25) the power increases by, on average, 4kW. The pressure losses are also
reduced compared to Figure 26. The peak power output that could be generated
would be of the order of 54kW for a flow rate of around 0.55m3/s.
450mm Diameter Pipe - Power Output at 90% Efficiency and Flow Rate vs Effective Head - Based on 14.2m head and 150m Pipe Length
0.00
10.00
20.00
30.00
40.00
50.00
60.00
13.89 13.78 13.66 13.55 13.44 13.32 13.21 13.09 12.98 12.86 12.75 12.37 11.45
Effective Head (m)
Pow
er (k
W)
0
0.1
0.2
0.3
0.4
0.5
0.6
Flow
Rat
e (m
3 /s)
Pow er Flow Rate

101
Figure 29: Power Output from a 450mm Diameter Pipe with the Hydro-generator Situated in
Location 2
Figure 29 shows the power output from a 450mm diameter pipe with the hydro-
generator situated in location 2, with 17m available head and 260m pipe length.
By moving the generator to location 2 with a 450mm pipe, Figure 29 shows that
the power output is only likely to increase by around 3kW from positioning a
450mm pipe in location 1 (see Figure 26).
450mm Diameter Pipe - Power Output at 90% Efficiency and Flow Rate vs Effective Head - Based on 17m head and 260m Pipe Length
0.00
10.00
20.00
30.00
40.00
50.00
60.00
70.00
16.47 16.27 16.07 15.87 15.67 15.48 15.28 15.08 14.88 14.68 14.48 13.82 12.23
Effective Head (m)
Pow
er (k
W)
0
0.1
0.2
0.3
0.4
0.5
0.6
Flow
Rat
e (m
3 /s)
Pow er Flow Rate

102
Figure 30: Power Output from a 450mm Diameter Pipe with the Hydro-generator Situated in
Location 1
Figure 30 shows the power output from a 450mm diameter pipe with the hydro-
generator situated in location 1, with 14.2m available head and 150m pipe length.
The effective head is increased with a 500mm pipe compared to a 450mm pipe
(see Figure 28) as the pressure losses and flow rate are reduced. The power
output with a 500mm pipe shows a more linear trend and an average increase of
around 4kW over the 450mm pipe for the same hydro-generator location (see
Figure 28), giving 58kW peak at 0.5m3/s.
500mm Diameter Pipe - Power Output at 90% Efficiency and Flow Rate vs Effective Head - Based on 14.2m head and 150m Pipe Length
0.0010.0020.0030.0040.0050.0060.0070.00
13.93 13.82 13.70 13.59 13.47 13.36 13.24 13.13 13.01 12.90 12.79
Effective Head (m)
Pow
er (k
W)
0
0.1
0.2
0.3
0.4
0.5
0.6
Flow
Rat
e (m
3/s)
Pow er Flow Rate

103
Figure 31: Power Output from a 450mm Diameter Pipe with the Hydro-generator Situated in
Location 2
Figure 31 shows the power output from a 500mm diameter pipe with the hydro-
generator situated in location 2, with 17m available head and 260m pipe length.
By moving the generator to location 2 with a 500mm pipe, Figure 31 shows that
the power output could increase by around 7kW from positioning a 500mm pipe
in location 1 (see Figure 30), giving 65kW peak at 0.5m3/s.
500mm Diameter Pipe - Power Output at 90% Efficiency and Flow Rate vs Effective Head - Based on 17m head and 260m Pipe Length
0.0010.0020.0030.0040.0050.0060.0070.00
16.54 16.34 16.14 15.94 15.74 15.54 15.34 15.14 14.95 14.75 14.55
Effective Head (m)
Pow
er (k
W)
0
0.1
0.2
0.3
0.4
0.5
0.6
Flow
Rat
e (m
3/s)
Pow er Flow Rate

104
Appendix B – Contacts Northern Ireland Electricity Steven Thompson Distributed Generation Manager NIE Headquarters 120 Malone Road Belfast BT95 HT 0289 066 1100 32706 [email protected] Bill Poag NIE Headquarters 120 Malone Road Belfast BT95 HT 0289 066 1100 32706 [email protected] Newtownards Borough Council Danny Osbourne Local Authority 21 Committee 2 Church Street Newtownards BT23 4AP Council 02891 824 072 Derek McCallan Head of Economic Development 2 Church Street Newtownards BT23 4AP Council 02891 824 072 Ken Green 2 Church Street Netownards BT23 4AP Energy Manager Council 02891 824 072 Local Energy Efficiency Office Advice Centre (LEEOAC) Ursula Tonan Local Energy Efficiency Office Advice Centre (LEEOAC)

105
02890 240 664 Newtownards Planning Office George Martin Northern Ireland Civil Service Planning Department 0284 461 8123 Rivers Agency Northern Ireland Frankie Mallon Eastern Region Regional Office Ravarenet House Altona Road Lisburn BT27 5QB Tel: 028 9260 6100 Fax: 028 9260 6111 [email protected] SLW&CA Jack Gilliland Chairman 0289 048 5224 Frank Brown Secretary 0289 047 8379 Robert Morrison Hydro Project Officer 0289 071 9977

106
Appendix C – Northern Ireland Electricity Tariffs Table 11: NIE Tariff Structure and Distributed Use of System Charges NIE Wheeling Charge (p/kWh) Tariff
(p/kWh) Small
Commercial/ Industrial (p/kWh)
Small Commercial/Industri
al Economy 7 (Preserved) (p/kWh)
Small Commercial/Industrial Economy 7
(p/kWh)
STOD Tariff
(p/kWh)
Popular Option
9.2 1.816
Night Saver Option
Daytime (8am-1am) 9.8 1.988 1.975
Night time & Heating Unit Rate (1am-8am) 3.3 0.287 0.284 Weekender Option
Daytime (Mon-Fri, 7-30am-8pm) 12 2.863
Evening and Weekend (Mon-Fri 8pm-7-30am) 4.75 0.489 Farm Energy Popular Option
Daytime Unit (8am - 1am) 9.08 1.816
Farm Energy Night Saver
Daytime Unit (8am - 1am) 9.3 1.988
Night Time Unit (1am-8am 3.3 0.287 Winter Peak (Mon-Fri 4pm-7pm Nov and Feb 48 12.671Winter Peak (Mon-Fri 4pm-7pm) Jan and Dec 48 12.671Winter Daytime Nov + Feb (Mon-Fir, 8am-830pm excluding Winter Peak Times)
9.3 1.379
Winter Daytime Jan & Dec (Mon-Fir, 8am-830pm excluding Winter Peak Times)
9.3 2.76
Summer Daytime (Mon-Fri, 8am -830pm) 6.5 0.476Summer Night time (Mon-Fri, 2230 - 0800) 6.5 0.226
Multi Rate Options (Medium Voltage) Under 1MW
Evening and weekend (all year Mon-Fri, 830pm-8am and weekend)
4.3 0.545

107
Winter Peak (Mon-Fri 4pm-7pm Nov and Feb 48 11.702Winter Peak (Mon-Fri 4pm-7pm) Jan and Dec 48 11.722Winter Daytime Nov + Feb (Mon-Fir, 8am-830pm excluding Winter Peak Times)
9.3 1.1
Winter Daytime Jan & Dec (Mon-Fir, 8am-830pm excluding Winter Peak Times)
9.3 2.247
Summer Daytime (Mon-Fri, 8am -830pm) 6.5 0.374Summer Night time (Mon-Fri, 2230 - 0800) 6.5 0.205
Multi Rate Option (Medium Voltage) Over 1MW Average Distance
Evening and weekend (all year Mon-Fri, 830pm-8am and weekend)
4.3 0.426
Winter Peak (Mon-Fri 4pm-7pm Nov and Feb 48 9.441Winter Peak (Mon-Fri 4pm-7pm) Jan and Dec 48 10.657Winter Daytime Nov + Feb (Mon-Fir, 8am-830pm excluding Winter Peak Times)
9.3 0.948
Winter Daytime Jan & Dec (Mon-Fir, 8am-830pm excluding Winter Peak Times)
9.3 1.923
Summer Daytime (Mon-Fri, 8am -830pm) 6.5 0.286Summer Night time (Mon-Fri, 2230 - 0800) 6.5 0.154
Multi Rate Option (Medium Voltage) Over 1MW Minimum Distance
Evening and weekend (all year Mon-Fri, 830pm-8am and weekend)
4.3 0.426
Winter Peak (Mon-Fri 4pm-7pm Nov and Feb 45 5.205Winter Peak (Mon-Fri 4pm-7pm) Jan and Dec 45 5.611Winter Daytime Nov + Feb (Mon-Fir, 8am-830pm excluding Winter Peak Times)
8.7 0.888
Winter Daytime Jan & Dec (Mon-Fir, 8am-830pm excluding Winter Peak Times)
8.7 1.95
Summer Daytime (Mon-Fri, 8am -830pm) 6 0.257Summer Night time (Mon-Fri, 2230 - 0800) 6 0.155
Multi Rate Option (High Voltage) Under 1MW
Evening and weekend (all year Mon-Fri, 830pm-8am and weekend)
3.7 0.308

108
Winter Peak (Mon-Fri 4pm-7pm Nov and Feb 45 7.314Winter Peak (Mon-Fri 4pm-7pm) Jan and Dec 45 7.945Winter Daytime Nov + Feb (Mon-Fir, 8am-830pm excluding Winter Peak Times)
8.7 0.932
Winter Daytime Jan & Dec (Mon-Fir, 8am-830pm excluding Winter Peak Times)
8.7 1.898
Summer Daytime (Mon-Fri, 8am -830pm) 6 0.256Summer Night time (Mon-Fri, 2230 - 0800) 6 0.123
Multi Rate Option (High Voltage) Over 1MW
Average Distance
Evening and weekend (all year Mon-Fri, 830pm-8am and weekend)
3.7 0.298
Winter Peak (Mon-Fri 4pm-7pm Nov and Feb 45 3.243Winter Peak (Mon-Fri 4pm-7pm) Jan and Dec 45 2.29Winter Daytime Nov + Feb (Mon-Fir, 8am-830pm excluding Winter Peak Times)
8.7 0.748
Winter Daytime Jan & Dec (Mon-Fir, 8am-830pm excluding Winter Peak Times)
8.7 1.443
Summer Daytime (Mon-Fri, 8am -830pm) 6 0.172Summer Night time (Mon-Fri, 2230 - 0800) 6 0.075
Multi Rate Option (High Voltage)
Over 1MW Minimum Distance
Evening and weekend (all year Mon-Fri, 830pm-8am and weekend)
3.7 0.212
Farm Energy
Winter Peak (Mon-Fri 4pm-7pm) Nov and Feb 48 11.872Winter Peak (Mon-Fri 4pm-7pm) Jan and Dec 48 12.671Winter Daytime Nov + Feb(Mon-Fir, 8am-830pm excluding Winter Peak Times)
9.6 1.379
Winter Daytime Jan & Dec (Mon-Fir, 8am-830pm excluding Winter Peak Times)
9.6 2.76
Summer Daytime (Mon-Fri, 8am -830pm) 6.4 0.476Summer Night time (Mon-Fri, 2230 - 0800) 3.5 0.226
Multi Rate Options (med Voltage) Under 1MW
Evening and weekend (all year Mon-Fri, 830pm-8am and weekend)
3.5 0.545

109
Winter Peak (Mon-Fri 4pm-7pm) Nov and Feb 48 11.702Winter Peak (Mon-Fri 4pm-7pm) Jan and Dec 48 11.722Winter Daytime Nov + Feb(Mon-Fir, 8am-830pm excluding Winter Peak Times)
9.6 1.1
Winter Daytime Jan & Dec (Mon-Fir, 8am-830pm excluding Winter Peak Times)
9.6 2.247
Summer Daytime (Mon-Fri, 8am -830pm) 6.4 0.374Summer Night time (Mon-Fri, 2230 - 0800) 3.5 0.205
Multi Rate Options (med Volatge) Over 1MW Average Distance
Evening and weekend (all year Mon-Fri, 830pm-8am and weekend)
3.5 0.426
Winter Peak (Mon-Fri 4pm-7pm) Nov and Feb 48 9.441Winter Peak (Mon-Fri 4pm-7pm) Jan and Dec 48 10.657Winter Daytime Nov + Feb(Mon-Fir, 8am-830pm excluding Winter Peak Times)
9.6 0.948
Winter Daytime Jan & Dec (Mon-Fir, 8am-830pm excluding Winter Peak Times)
9.6 1.923
Summer Daytime (Mon-Fri, 8am -830pm) 6.4 0.286Summer Night time (Mon-Fri, 2230 - 0800) 3.5 0.154
Multi Rate Options (med Volatge) Over 1MW Minimum Distance
Evening and weekend (all year Mon-Fri, 830pm-8am and weekend)
3.5 0.426
Winter Peak (Mon-Fri 4pm-7pm Nov and Feb 43 5.205Winter Peak (Mon-Fri 4pm-7pm) Jan and Dec 43 5.611Winter Daytime Nov + Feb (Mon-Fir, 8am-830pm excluding Winter Peak Times)
8.6 0.888
Winter Daytime Jan & Dec (Mon-Fir, 8am-830pm excluding Winter Peak Times)
8.6 1.95
Summer Daytime (Mon-Fri, 8am -830pm) 5.9 0.257Summer Night time (Mon-Fri, 2230 - 0800) 5.9 0.155
Multi Rate Option (high Voltage) Under 1MW
Evening and weekend (all year Mon-Fri, 830pm-8am and weekend)
3.3 0.308

110
Winter Peak (Mon-Fri 4pm-7pm Nov and Feb 43 7.314Winter Peak (Mon-Fri 4pm-7pm) Jan and Dec 43 7.945Winter Daytime Nov + Feb (Mon-Fir, 8am-830pm excluding Winter Peak Times)
8.6 0.932
Winter Daytime Jan & Dec (Mon-Fir, 8am-830pm excluding Winter Peak Times)
8.6 1.898
Summer Daytime (Mon-Fri, 8am -830pm) 5.9 0.256Summer Night time (Mon-Fri, 2230 - 0800) 5.9 0.123
Multi Rate Option (high Voltage) Over 1MW Average Distance
Evening and weekend (all year Mon-Fri, 830pm-8am and weekend)
3.3 0.298
Winter Peak (Mon-Fri 4pm-7pm Nov and Feb 43 3.243Winter Peak (Mon-Fri 4pm-7pm) Jan and Dec 43 2.29Winter Daytime Nov + Feb (Mon-Fir, 8am-830pm excluding Winter Peak Times)
8.6 0.748
Winter Daytime Jan & Dec (Mon-Fir, 8am-830pm excluding Winter Peak Times)
8.6 1.443
Summer Daytime (Mon-Fri, 8am -830pm) 5.9 0.172Summer Night time (Mon-Fri, 2230 - 0800) 5.9 0.075
Multi Rate Option (high Voltage) Over 1MW Minimum Distance
Evening and weekend (all year Mon-Fri, 830pm-8am and weekend)
3.3 0.212

111
Appendix D – Power Outputs for Different Pipe Lengths and Diameters and Flow Rates Table 12: Power Output from 150m Length of 500mm Diameter Pipe at a 15m Head
Note: The figures highlighted in yellow (in all of the tables in Appendix D) are the flow rates which will maintain the ecology of the lake during certain periods of the year.
Mass Flow Rate (kg/s)
Delta P Pipe
(kPa/m)
Delta P(kPa)
Delta P (m)
Head (m)
Effective Head (m)
44% Flow Power at 78.1% System Efficiency (kW)
34% Flow Power at 76.24% system Efficiency(kW)
100%flow Power at 85.5% system
Efficiency (kW)
30% Flow Power at 75.5% system
Efficiency (kW)
144 0.009 1.35 0.14 15.00 14.86 16.40 16.01 17.95 15.85 148 0.0095 1.425 0.15 15.00 14.85 16.84 16.44 18.44 16.28
Nov & Feb STOD 152 0.01 1.5 0.15 15.00 14.85 17.29 16.88 18.93 16.71 Jan & Dec weekends
172 0.0125 1.875 0.19 15.00 14.81 19.52 19.05 21.36 18.87
189 0.015 2.25 0.23 15.00 14.77 21.39 20.88 23.42 20.68 205 0.0175 2.625 0.27 15.00 14.73 23.14 22.59 25.33 22.37
Sustainable Flow Rate
221 0.02 3 0.31 15.00 14.69 24.88 24.29 27.24 24.05
235 0.0225 3.375 0.34 15.00 14.66 26.39 25.76 28.89 25.51 249 0.025 3.75 0.38 15.00 14.62 27.89 27.22 30.53 26.96 262 0.0275 4.125 0.42 15.00 14.58 29.27 28.57 32.04 28.29 274 0.03 4.5 0.46 15.00 14.54 30.53 29.80 33.42 29.51 286 0.0325 4.875 0.50 15.00 14.50 31.78 31.02 34.79 30.72 297 0.035 5.25 0.54 15.00 14.46 32.91 32.13 36.03 31.82 308 0.0375 5.625 0.57 15.00 14.43 34.04 33.23 37.27 32.91 319 0.04 6 0.61 15.00 14.39 35.17 34.33 38.50 34.00 329 0.0425 6.375 0.65 15.00 14.35 36.17 35.31 39.60 34.97 340 0.045 6.75 0.69 15.00 14.31 37.28 36.39 40.81 36.04 349 0.0475 7.125 0.73 15.00 14.27 38.17 37.26 41.78 36.90 359 0.05 7.5 0.76 15.00 14.24 39.15 38.22 42.86 37.85 368 0.0525 7.875 0.80 15.00 14.20 40.03 39.08 43.82 38.70 378 0.055 8.25 0.84 15.00 14.16 41.01 40.03 44.89 39.64 386 0.0575 8.625 0.88 15.00 14.12 41.76 40.77 45.72 40.37 395 0.06 9 0.92 15.00 14.08 42.62 41.60 46.66 41.20

112
404 0.0625 9.375 0.96 15.00 14.04 43.47 42.44 47.59 42.02 412 0.065 9.75 0.99 15.00 14.01 44.21 43.16 48.40 42.74 420 0.0675 10.125 1.03 15.00 13.97 44.95 43.88 49.21 43.45 429 0.07 10.5 1.07 15.00 13.93 45.78 44.69 50.12 44.26 437 0.0725 10.875 1.11 15.00 13.89 46.51 45.40 50.92 44.96 444 0.075 11.25 1.15 15.00 13.85 47.13 46.00 51.59 45.56 452 0.0775 11.625 1.19 15.00 13.81 47.84 46.70 52.37 46.25 460 0.08 12 1.22 15.00 13.78 48.55 47.40 53.15 46.94 467 0.0825 12.375 1.26 15.00 13.74 49.16 47.99 53.81 47.52 475 0.085 12.75 1.30 15.00 13.70 49.86 48.67 54.58 48.20 482 0.0875 13.125 1.34 15.00 13.66 50.45 49.25 55.23 48.77 489 0.09 13.5 1.38 15.00 13.62 51.04 49.83 55.88 49.34 496 0.0925 13.875 1.41 15.00 13.59 51.63 50.40 56.52 49.91
Peak Flow Rate 503 0.095 14.25 1.45 15.00 13.55 52.21 50.97 57.16 50.47 510 0.0975 14.625 1.49 15.00 13.51 52.79 51.53 57.79 51.03

113
Table 13: Power Output from 150m Length of 450mm Diameter Pipe at a 15m Head
Mass
Flow Rate (kg/s)
Delta P Pipe
(kPa/m)
Delta P
(kPa)
Delta P (m)
Head (m)
Effective head (m)
44% Flow Power at 78.1% system
Efficiency (kW)
34% Flow Power at 76.24% system Efficiency (kW)
100%flow Power at 85.5% system
Efficiency (kW)
30% Flow Power at 75.5% system
Efficiency (kW)
Nov & Feb STOD 165 0.02 3 0.31 15.00 14.69 18.58 18.13 20.34 17.96 Jan & Dec weekends
176 0.0225 3.375 0.34 15.00 14.66 19.76 19.29 21.64 19.10
186 0.025 3.75 0.38 15.00 14.62 20.83 20.34 22.80 20.14 196 0.0275 4.125 0.42 15.00 14.58 21.89 21.37 23.97 21.16 205 0.03 4.5 0.46 15.00 14.54 22.84 22.30 25.00 22.08 214 0.0325 4.875 0.50 15.00 14.50 23.78 23.21 26.03 22.99
Sustainable Flow Rate
223 0.035 5.25 0.54 15.00 14.46 24.71 24.13 27.06 23.89
231 0.0375 5.625 0.57 15.00 14.43 25.53 24.92 27.95 24.68 239 0.04 6 0.61 15.00 14.39 26.35 25.72 28.84 25.47 247 0.0425 6.375 0.65 15.00 14.35 27.16 26.51 29.73 26.25 255 0.045 6.75 0.69 15.00 14.31 27.96 27.30 30.61 27.03 262 0.0475 7.125 0.73 15.00 14.27 28.65 27.97 31.37 27.70 269 0.05 7.5 0.76 15.00 14.24 29.34 28.64 32.12 28.36 276 0.0525 7.875 0.80 15.00 14.20 30.02 29.31 32.87 29.02 283 0.055 8.25 0.84 15.00 14.16 30.70 29.97 33.61 29.68 290 0.0575 8.625 0.88 15.00 14.12 31.37 30.63 34.35 30.33 296 0.06 9 0.92 15.00 14.08 31.94 31.18 34.96 30.87 303 0.0625 9.375 0.96 15.00 14.04 32.60 31.83 35.69 31.52 309 0.065 9.75 0.99 15.00 14.01 33.16 32.37 36.30 32.05 315 0.0675 10.125 1.03 15.00 13.97 33.71 32.91 36.90 32.59 321 0.07 10.5 1.07 15.00 13.93 34.26 33.44 37.50 33.12 327 0.0725 10.875 1.11 15.00 13.89 34.80 33.97 38.10 33.64 333 0.075 11.25 1.15 15.00 13.85 35.34 34.50 38.69 34.17 339 0.0775 11.625 1.19 15.00 13.81 35.88 35.03 39.28 34.69 345 0.08 12 1.22 15.00 13.78 36.42 35.55 39.87 35.20

114
350 0.0825 12.375 1.26 15.00 13.74 36.84 35.96 40.33 35.61 356 0.085 12.75 1.30 15.00 13.70 37.37 36.48 40.91 36.12 361 0.0875 13.125 1.34 15.00 13.66 37.79 36.89 41.37 36.53 367 0.09 13.5 1.38 15.00 13.62 38.31 37.40 41.94 37.03 372 0.0925 13.875 1.41 15.00 13.59 38.72 37.80 42.39 37.43 377 0.095 14.25 1.45 15.00 13.55 39.13 38.20 42.84 37.83 383 0.0975 14.625 1.49 15.00 13.51 39.64 38.70 43.40 38.32 388 0.1 15 1.53 15.00 13.47 40.05 39.09 43.84 38.71 427 0.12 18 1.83 15.00 13.17 43.07 42.04 47.15 41.64 462 0.14 21 2.14 15.00 12.86 45.52 44.43 49.83 44.00
Peak Flow Rate 496 0.16 24 2.45 15.00 12.55 47.71 46.57 52.23 46.12 527 0.18 27 2.75 15.00 12.25 49.45 48.27 54.14 47.81 557 0.2 30 3.06 15.00 11.94 50.96 49.75 55.79 49.27

115
Table 14: Power Output from 150m Length of 400mm Diameter Pipe at a 15m Head
Mass Flow Rate (kg/s)
Delta P Pipe
(kPa/m)
Delta P
(kPa)
Delta P (m)
Head (m)
Effective Head (m)
44% Flow Power at 78.1% system
Efficiency (kW)
34% Flow Power at 76.24% system Efficiency (kW)
100%flow Power at 85.5% system
Efficiency (kW)
30% Flow Power at 75.5% system
Efficiency (kW)
Nov & Feb STOD 164 0.03 4.5 0.459 15 14.54 18.27 17.84 20.00 17.66 164 0.0325 4.875 0.497 15 14.50 18.22 17.79 19.95 17.62 164 0.035 5.25 0.535 15 14.46 18.18 17.74 19.90 17.57 170 0.0375 5.625 0.573 15 14.43 18.79 18.34 20.57 18.16
Jan & Dec weekends
176 0.04 6 0.612 15 14.39 19.40 18.94 21.24 18.76
181 0.0425 6.375 0.650 15 14.35 19.90 19.43 21.79 19.24 187 0.045 6.75 0.688 15 14.31 20.50 20.02 22.45 19.82 192 0.0475 7.125 0.726 15 14.27 21.00 20.50 22.99 20.30 198 0.05 7.5 0.765 15 14.24 21.60 21.08 23.64 20.88 203 0.0525 7.875 0.803 15 14.20 22.08 21.56 24.17 21.35 208 0.055 8.25 0.841 15 14.16 22.56 22.03 24.70 21.81 213 0.0575 8.625 0.879 15 14.12 23.04 22.50 25.23 22.28 218 0.06 9 0.917 15 14.08 23.52 22.96 25.75 22.74
Sustainable Flow Rate
222 0.0625 9.375 0.956 15 14.04 23.89 23.32 26.15 23.09
227 0.065 9.75 0.994 15 14.01 24.36 23.78 26.67 23.55 232 0.0675 10.125 1.032 15 13.97 24.83 24.24 27.18 24.00 236 0.07 10.5 1.070 15 13.93 25.19 24.59 27.57 24.35 241 0.0725 10.875 1.109 15 13.89 25.65 25.04 28.08 24.80 245 0.075 11.25 1.147 15 13.85 26.00 25.38 28.47 25.14 249 0.0775 11.625 1.185 15 13.81 26.36 25.73 28.85 25.48 253 0.08 12 1.223 15 13.78 26.70 26.07 29.23 25.82 258 0.0825 12.375 1.261 15 13.74 27.16 26.51 29.73 26.25 262 0.085 12.75 1.300 15 13.70 27.50 26.85 30.11 26.59 266 0.0875 13.125 1.338 15 13.66 27.84 27.18 30.48 26.92 270 0.09 13.5 1.376 15 13.62 28.18 27.51 30.85 27.24 273 0.0925 13.875 1.414 15 13.59 28.42 27.74 31.11 27.47

116
277 0.095 14.25 1.453 15 13.55 28.75 28.07 31.48 27.79 281 0.0975 14.625 1.491 15 13.51 29.08 28.39 31.84 28.12 285 0.1 15 1.529 15 13.47 29.41 28.71 32.20 28.44 313 0.12 18 1.835 15 13.17 31.57 30.82 34.56 30.52 340 0.14 21 2.141 15 12.86 33.50 32.70 36.67 32.38 364 0.16 24 2.446 15 12.55 35.01 34.18 38.33 33.84 387 0.18 27 2.752 15 12.25 36.31 35.45 39.76 35.11 409 0.2 30 3.058 15 11.94 37.42 36.53 40.97 36.18 430 0.22 33 3.364 15 11.64 38.33 37.42 41.97 37.06 450 0.24 36 3.670 15 11.33 39.06 38.13 42.76 37.76 469 0.26 39 3.976 15 11.02 39.61 38.67 43.37 38.30 487 0.28 42 4.281 15 10.72 39.99 39.04 43.78 38.66
Peak Flow Rate 505 0.3 45 4.587 15 10.41 40.29 39.33 44.11 38.95 522 0.32 48 4.893 15 10.11 40.42 39.46 44.25 39.08 539 0.34 51 5.199 15 9.80 40.48 39.51 44.31 39.13 555 0.36 54 5.505 15 9.50 40.38 39.41 44.20 39.03 571 0.38 57 5.810 15 9.19 40.20 39.25 44.01 38.86 586 0.4 60 6.116 15 8.88 39.89 38.94 43.66 38.56

117
Table 15: Power Output from 260m Length of 500mm Diameter Pipe at a 17m Head
Mass Flow Rate (kg/s)
Delta P Pipe
(kPa/m)
Delta P
(kPa)
Delta P (m)
Head (m)
Effective Head (m)
44% Flow Power at 78.1% System Efficiency(kW)
34% Flow Power at 76.24% System Efficiency (kW)
100%flow Power at 85.5% System Efficiency (kW)
30% Flow Power at 75.5% System Efficiency (kW)
144 0.009 2.34 0.24 17.00 16.76 18.49 18.05 20.24 17.88 148 0.0095 2.47 0.25 17.00 16.75 18.99 18.54 20.79 18.36
Nov & Feb STOD 152 0.01 2.6 0.27 17.00 16.73 19.49 19.02 21.34 18.84 Jan & Dec weekends
172 0.0125 3.25 0.33 17.00 16.67 21.97 21.44 24.05 21.23
189 0.015 3.9 0.40 17.00 16.60 24.04 23.47 26.32 23.24 205 0.0175 4.55 0.46 17.00 16.54 25.97 25.35 28.43 25.11
Sustainable Flow Rate
221 0.02 5.2 0.53 17.00 16.47 27.89 27.22 30.53 26.96
235 0.0225 5.85 0.60 17.00 16.40 29.53 28.83 32.33 28.55 249 0.025 6.5 0.66 17.00 16.34 31.17 30.43 34.12 30.13 262 0.0275 7.15 0.73 17.00 16.27 32.66 31.88 35.76 31.57 274 0.03 7.8 0.80 17.00 16.20 34.02 33.21 37.24 32.89 286 0.0325 8.45 0.86 17.00 16.14 35.36 34.52 38.71 34.19 297 0.035 9.1 0.93 17.00 16.07 36.57 35.70 40.04 35.36 308 0.0375 9.75 0.99 17.00 16.01 37.77 36.87 41.35 36.51 319 0.04 10.4 1.06 17.00 15.94 38.96 38.03 42.65 37.66 329 0.0425 11.05 1.13 17.00 15.87 40.01 39.06 43.80 38.68 340 0.045 11.7 1.19 17.00 15.81 41.18 40.20 45.08 39.81 349 0.0475 12.35 1.26 17.00 15.74 42.09 41.09 46.08 40.69 359 0.05 13 1.33 17.00 15.67 43.11 42.09 47.20 41.68 368 0.0525 13.65 1.39 17.00 15.61 44.01 42.96 48.18 42.54 378 0.055 14.3 1.46 17.00 15.54 45.01 43.94 49.28 43.51 386 0.0575 14.95 1.52 17.00 15.48 45.77 44.68 50.11 44.24 395 0.06 15.6 1.59 17.00 15.41 46.64 45.52 51.05 45.08 404 0.0625 16.25 1.66 17.00 15.34 47.49 46.36 51.99 45.91

118
412 0.065 16.9 1.72 17.00 15.28 48.22 47.08 52.79 46.62 420 0.0675 17.55 1.79 17.00 15.21 48.95 47.78 53.58 47.32 429 0.07 18.2 1.86 17.00 15.14 49.78 48.59 54.49 48.12 437 0.0725 18.85 1.92 17.00 15.08 50.48 49.28 55.27 48.80 444 0.075 19.5 1.99 17.00 15.01 51.07 49.85 55.91 49.37 452 0.0775 20.15 2.05 17.00 14.95 51.76 50.53 56.66 50.04 460 0.08 20.8 2.12 17.00 14.88 52.44 51.19 57.41 50.70 467 0.0825 21.45 2.19 17.00 14.81 53.00 51.74 58.02 51.24 475 0.085 22.1 2.25 17.00 14.75 53.67 52.39 58.75 51.88 482 0.0875 22.75 2.32 17.00 14.68 54.22 52.92 59.35 52.41 489 0.09 23.4 2.39 17.00 14.61 54.75 53.45 59.94 52.93 496 0.0925 24.05 2.45 17.00 14.55 55.29 53.97 60.52 53.45
Peak Flow Rate 503 0.095 24.7 2.52 17.00 14.48 55.81 54.48 61.10 53.95 510 0.0975 25.35 2.58 17.00 14.42 56.33 54.99 61.67 54.45

119
Table 16: Power Output from 260m Length of 450mm Diameter Pipe at a 15m Head
Mass
Flow Rate (kg/s)
Delta P Pipe
(kPa/m)
Delta P
(kPa)
Delta P (m)
Head (m)
Effective head (m)
44% Flow Power at 78.1% System Efficiency (kW)
34% Flow Power at 76.24% System Efficiency (kW)
100%flow Power at 85.5% System Efficiency (kW)
30% Flow Power at 75.5% System Efficiency (kW)
Nov & Feb STOD 165 0.02 5.2 0.53 17.00 16.47 20.82 20.32 22.79 20.13 Jan & Dec weekends
176 0.0225 5.85 0.60 17.00 16.40 22.12 21.59 24.22 21.38
186 0.025 6.5 0.66 17.00 16.34 23.28 22.73 25.49 22.51 196 0.0275 7.15 0.73 17.00 16.27 24.43 23.85 26.75 23.62 205 0.03 7.8 0.80 17.00 16.20 25.45 24.85 27.86 24.60
Sustainable Flow Rate
214 0.0325 8.45 0.86 17.00 16.14 26.46 25.83 28.97 25.58
223 0.035 9.1 0.93 17.00 16.07 27.46 26.81 30.06 26.55 231 0.0375 9.75 0.99 17.00 16.01 28.33 27.65 31.01 27.39 239 0.04 10.4 1.06 17.00 15.94 29.19 28.49 31.95 28.22 247 0.0425 11.05 1.13 17.00 15.87 30.04 29.32 32.89 29.04 255 0.045 11.7 1.19 17.00 15.81 30.88 30.15 33.81 29.85 262 0.0475 12.35 1.26 17.00 15.74 31.60 30.85 34.59 30.55 269 0.05 13 1.33 17.00 15.67 32.31 31.54 35.37 31.23 276 0.0525 13.65 1.39 17.00 15.61 33.01 32.22 36.13 31.91 283 0.055 14.3 1.46 17.00 15.54 33.70 32.90 36.89 32.58 290 0.0575 14.95 1.52 17.00 15.48 34.39 33.57 37.64 33.24 296 0.06 15.6 1.59 17.00 15.41 34.95 34.11 38.26 33.78 303 0.0625 16.25 1.66 17.00 15.34 35.62 34.77 38.99 34.43 309 0.065 16.9 1.72 17.00 15.28 36.17 35.31 39.59 34.96 315 0.0675 17.55 1.79 17.00 15.21 36.71 35.84 40.19 35.49 321 0.07 18.2 1.86 17.00 15.14 37.25 36.36 40.78 36.01 327 0.0725 18.85 1.92 17.00 15.08 37.78 36.88 41.36 36.52 333 0.075 19.5 1.99 17.00 15.01 38.30 37.39 41.93 37.03 339 0.0775 20.15 2.05 17.00 14.95 38.82 37.89 42.50 37.53 345 0.08 20.8 2.12 17.00 14.88 39.33 38.39 43.06 38.02

120
350 0.0825 21.45 2.19 17.00 14.81 39.72 38.78 43.49 38.40 356 0.085 22.1 2.25 17.00 14.75 40.22 39.27 44.03 38.88 361 0.0875 22.75 2.32 17.00 14.68 40.61 39.64 44.45 39.25 367 0.09 23.4 2.39 17.00 14.61 41.09 40.12 44.99 39.73 372 0.0925 24.05 2.45 17.00 14.55 41.46 40.48 45.39 40.08 377 0.095 24.7 2.52 17.00 14.48 41.83 40.83 45.79 40.44 383 0.0975 25.35 2.58 17.00 14.42 42.30 41.29 46.31 40.89 388 0.1 26 2.65 17.00 14.35 42.66 41.64 46.70 41.24 427 0.12 31.2 3.18 17.00 13.82 45.21 44.13 49.49 43.71 462 0.14 36.4 3.71 17.00 13.29 47.04 45.92 51.50 45.47
Peak Flow Rate 496 0.16 41.6 4.24 17.00 12.76 48.49 47.33 53.08 46.87 527 0.18 46.8 4.77 17.00 12.23 49.38 48.20 54.06 47.73 557 0.2 52 5.30 17.00 11.70 49.93 48.74 54.66 48.26
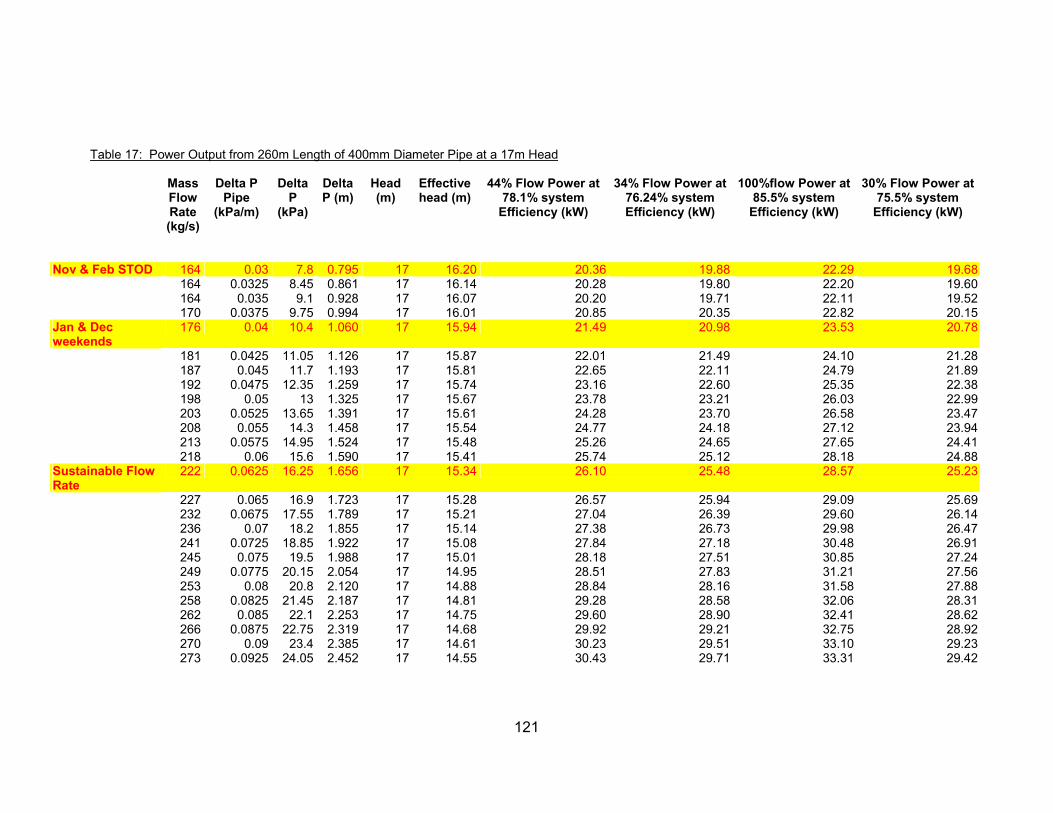
121
Table 17: Power Output from 260m Length of 400mm Diameter Pipe at a 17m Head
Mass Flow Rate (kg/s)
Delta P Pipe
(kPa/m)
Delta P
(kPa)
Delta P (m)
Head (m)
Effective head (m)
44% Flow Power at 78.1% system
Efficiency (kW)
34% Flow Power at 76.24% system Efficiency (kW)
100%flow Power at 85.5% system
Efficiency (kW)
30% Flow Power at 75.5% system
Efficiency (kW)
Nov & Feb STOD 164 0.03 7.8 0.795 17 16.20 20.36 19.88 22.29 19.68 164 0.0325 8.45 0.861 17 16.14 20.28 19.80 22.20 19.60 164 0.035 9.1 0.928 17 16.07 20.20 19.71 22.11 19.52 170 0.0375 9.75 0.994 17 16.01 20.85 20.35 22.82 20.15
Jan & Dec weekends
176 0.04 10.4 1.060 17 15.94 21.49 20.98 23.53 20.78
181 0.0425 11.05 1.126 17 15.87 22.01 21.49 24.10 21.28 187 0.045 11.7 1.193 17 15.81 22.65 22.11 24.79 21.89 192 0.0475 12.35 1.259 17 15.74 23.16 22.60 25.35 22.38 198 0.05 13 1.325 17 15.67 23.78 23.21 26.03 22.99 203 0.0525 13.65 1.391 17 15.61 24.28 23.70 26.58 23.47 208 0.055 14.3 1.458 17 15.54 24.77 24.18 27.12 23.94 213 0.0575 14.95 1.524 17 15.48 25.26 24.65 27.65 24.41 218 0.06 15.6 1.590 17 15.41 25.74 25.12 28.18 24.88
Sustainable Flow Rate
222 0.0625 16.25 1.656 17 15.34 26.10 25.48 28.57 25.23
227 0.065 16.9 1.723 17 15.28 26.57 25.94 29.09 25.69 232 0.0675 17.55 1.789 17 15.21 27.04 26.39 29.60 26.14 236 0.07 18.2 1.855 17 15.14 27.38 26.73 29.98 26.47 241 0.0725 18.85 1.922 17 15.08 27.84 27.18 30.48 26.91 245 0.075 19.5 1.988 17 15.01 28.18 27.51 30.85 27.24 249 0.0775 20.15 2.054 17 14.95 28.51 27.83 31.21 27.56 253 0.08 20.8 2.120 17 14.88 28.84 28.16 31.58 27.88 258 0.0825 21.45 2.187 17 14.81 29.28 28.58 32.06 28.31 262 0.085 22.1 2.253 17 14.75 29.60 28.90 32.41 28.62 266 0.0875 22.75 2.319 17 14.68 29.92 29.21 32.75 28.92 270 0.09 23.4 2.385 17 14.61 30.23 29.51 33.10 29.23 273 0.0925 24.05 2.452 17 14.55 30.43 29.71 33.31 29.42

122
277 0.095 24.7 2.518 17 14.48 30.73 30.00 33.65 29.71 281 0.0975 25.35 2.584 17 14.42 31.04 30.30 33.98 30.00 285 0.1 26 2.650 17 14.35 31.33 30.59 34.30 30.29 313 0.12 31.2 3.180 17 13.82 33.14 32.35 36.28 32.04 340 0.14 36.4 3.710 17 13.29 34.62 33.79 37.90 33.47 364 0.16 41.6 4.241 17 12.76 35.58 34.74 38.96 34.40 387 0.18 46.8 4.771 17 12.23 36.26 35.40 39.70 35.05 409 0.2 52 5.301 17 11.70 36.66 35.79 40.13 35.44 430 0.22 57.2 5.831 17 11.17 36.80 35.92 40.28 35.57 450 0.24 62.4 6.361 17 10.64 36.68 35.81 40.16 35.46 469 0.26 67.6 6.891 17 10.11 36.32 35.46 39.77 35.12 487 0.28 72.8 7.421 17 9.58 35.74 34.89 39.13 34.55
Peak Flow Rate 505 0.3 78 7.951 17 9.05 35.01 34.18 38.33 33.85 522 0.32 83.2 8.481 17 8.52 34.07 33.26 37.30 32.94 539 0.34 88.4 9.011 17 7.99 32.99 32.20 36.12 31.89 555 0.36 93.6 9.541 17 7.46 31.72 30.96 34.72 30.66 571 0.38 98.8 10.071 17 6.93 30.31 29.59 33.18 29.30 586 0.4 104 10.601 17 6.40 28.73 28.04 31.45 27.77

123
Appendix E – Potential Revenue from Different NIE Tariffs Table 18: Potential Revenue from Exploris with the Generator sited at the 15m Head
Number of
Daily HoursNumber of Days
Number of Hours/Year
Exploris Tariff
(p/kWh)
NIE Wheeling Charge (p/kWh)
Unit Income for SWL & CA
(p/kWh)
Power Output 400mm Diameter Pipe (kW)
15m head
Annual Energy (kWh)
Revenue (£)
March & October 0800-2030 hours (weekdays)
12.5 44 550 6.4 0.476 5.924 23.89 13,140 £778
March & October 2030-2230 hours (weekday Evenings)
2 44 88 3.5 0.545 2.955 23.89 2,102 £62
March & October 2230-0800 hours (weekday Nights)
9.5 44 418 3.5 0.226 3.274 23.89 9,986 £327
March & October (weekends) 24 18 432 3.5 0.545 2.955 23.89 10,320 £305 Nov + Feb (weekday Outside SToD hours)
21 42 882 9.6 1.379 8.221 18.94 16,705 £1,373
Jan + Dec (weekday) 21 45 945 9.6 2.76 6.84 18.94 17,898 £1,224 Nov + Feb (SToD 1600-1900 hours) 3 42 126 48 11.872 36.128 44.11 5,558 £2,008 Jan + Dec (SToD 1600-1900 hours) 3 45 135 48 12.671 35.329 44.11 5,955 £2,104 Nov - Feb (weekends) 24 33 792 3.5 0.545 2.955 23.89 18,921 £559 April - September between 0800-2030 hours weekdays
6.7 131 877.7 6.4 0.476 5.924 17.66 15,500 £918
TOTAL 116,085 £9,659 Number of
Daily HoursNumber of Days
Number of Hours/Year
Exploris Tariff
(p/kWh)
NIE Wheeling Charge (p/kWh)
Unit Income for SWL & CA
(p/kWh)
Power Output 450mm Diameter Pipe
(kWh)15m head
Annual Energy (kWh)
Revenue (£)
March & October 0800-2030 hours (weekdays)
12.5 44 550 6.4 0.476 5.924 24.71 13,591 £805
March & October 2030-2230 hours (weekday Evenings)
2 44 88 3.5 0.545 2.955 24.71 2,174 £64
March & October 2230-0800 hours (weekday Nights)
9.5 44 418 3.5 0.226 3.274 24.71 10,329 £338
March & October (weekends) 24 18 432 3.5 0.545 2.955 24.71 10,675 £315 Nov + Feb (weekday Outside SToD 21 42 882 9.6 1.379 8.221 19.29 17,014 £1,399

124
hours) Jan + Dec (weekday) 21 45 945 9.6 2.76 6.84 19.29 18,229 £1,247 Nov + Feb (SToD 1600-1900 hours) 3 42 126 48 11.872 36.128 46.57 5,868 £2,120 Jan + Dec (SToD 1600-1900 hours) 3 45 135 48 12.671 35.329 46.57 6,287 £2,221 Nov - Feb (weekends) 24 33 792 3.5 0.545 2.955 24.71 19,570 £578 April - September between 0800-2030 hours weekdays
6.7 131 877.7 6.4 0.476 5.924 17.96 15,763 £934
TOTAL 119,500 £10,022 Number of Daily Hours
Number of Days
Number of Hours/Year
Exploris Tariff
(p/kWh)
NIE Wheeling Charge (p/kWh)
Unit Income for SWL & CA
(p/kWh)
Power Output 500mm Diameter Pipe
(kWh)15m head
Annual Energy (kWh)
Revenue (£)
March & October 0800-2030 hours (weekdays)
12.5 44 550 6.4 0.476 5.924 24.88 13,684 £811
March & October 2030-2230 hours (weekday Evenings)
2 44 88 3.5 0.545 2.955 24.88 2,189 £65
March & October 2230-0800 hours (weekday Nights)
9.5 44 418 3.5 0.226 3.274 24.88 10,400 £340
March & October (weekends) 24 18 432 3.5 0.545 2.955 24.88 10,748 £318 Nov + Feb (weekday Outside SToD hours)
21 42 882 9.6 1.379 8.221 18.81 16,590 £1,364
Jan + Dec (weekday) 21 45 945 9.6 2.76 6.84 18.81 17,775 £1,216 Nov + Feb (SToD 1600-1900 hours) 3 42 126 48 11.872 36.128 57.16 7,202 £2,602 Jan + Dec (SToD 1600-1900 hours) 3 45 135 48 12.671 35.329 57.16 7,717 £2,726 Nov - Feb (weekends) 24 33 792 3.5 0.545 2.955 24.88 19,705 £582 April - September between 0800-2030 hours weekdays
6.7 131 877.7 6.4 0.476 5.924 16.71 14,666 £869
TOTAL 120,677 £10,892

125
Table 19: Potential Revenue from Business Multi Rate Option (Under 1MW High Voltage) the Generator sited at the 15m Head
Number of Daily Hours
Number of Days
Number of Hours/Year
Business Tariff
(p/kWh)
NIE Wheeling Charge (p/kWh)
Unit Income for SWL & CA
(p/kWh)
Power Output 400mm Diameter Pipe
(kWh)15m head
Annual Energy (kWh)
Revenue (£)
March & October 0800-2030 hours (weekdays)
12.5 44 550 6 0.257 5.743 23.89 13,140 £755
March & October 2030-2230 hours (weekday Evenings)
2 44 88 3.7 0.308 3.392 23.89 2,102 £71
March & October 2230-0800 hours (weekday Nights)
9.5 44 418 3.7 0.155 3.545 23.89 9,986 £354
March & October (weekends) 24 18 432 3.7 0.308 3.392 23.89 10,320 £350 Nov + Feb (weekday Outside SToD hours)
21 42 882 8.7 0.888 7.812 18.94 16,705 £1,305
Jan + Dec (weekday) 21 45 945 8.7 1.95 6.75 18.94 17,898 £1,208 Nov + Feb (SToD 1600-1900 hours) 3 42 126 45 5.205 39.795 44.11 5,558 £2,212 Jan + Dec (SToD 1600-1900 hours) 3 45 135 45 5.611 39.389 44.11 5,955 £2,346 Nov - Feb (weekends) 24 33 792 3.7 0.308 3.392 23.89 18,921 £642 April - September between 0800-2030 hours weekdays
6.7 131 877.7 6 0.257 5.743 17.66 15,500 £890
TOTAL 116,085 £10,132
Number of Daily Hours
Number of Days
Number of Hours/Year
Business Tariff
(p/kWh)
NIE Wheeling Charge (p/kWh)
Unit Income for SWL & CA
(p/kWh)
Power Output 450mm Diameter Pipe
(kWh)15m head
Annual Energy (kWh)
Revenue (£)
March & October 0800-2030 hours (weekdays)
12.5 44 550 6 0.257 5.743 24.71 13,591 £781
March & October 2030-2230 hours (weekday Evenings)
2 44 88 3.7 0.308 3.392 24.71 2,174 £74
March & October 2230-0800 hours (weekday Nights)
9.5 44 418 3.7 0.155 3.545 24.71 10,329 £366
March & October (weekends) 24 18 432 3.7 0.308 3.392 24.71 10,675 £362 Nov + Feb (weekday Outside SToD hours)
21 42 882 8.7 0.888 7.812 19.29 17,014 £1,329

126
Jan + Dec (weekday) 21 45 945 8.7 1.95 6.75 19.29 18,229 £1,230 Nov + Feb (SToD 1600-1900 hours) 3 42 126 45 5.205 39.795 46.57 5,868 £2,335 Jan + Dec (SToD 1600-1900 hours) 3 45 135 45 5.611 39.389 46.57 6,287 £2,476 Nov - Feb (weekends) 24 33 792 3.7 0.308 3.392 24.71 19,570 £664 April - September between 0800-2030 hours weekdays
6.7 131 877.7 6 0.257 5.743 17.96 15,763 £905
TOTAL 119,500 £10,523 Number of
Daily HoursNumber of Days
Number of Hours/Year
Business Tariff
(p/kWh)
NIE Wheeling Charge (p/kWh)
Unit Income for SWL & CA
(p/kWh)
Power Output 500mm Diameter Pipe
(kWh)15m head
Annual Energy (kWh)
Revenue (£)
March & October 0800-2030 hours (weekdays)
12.5 44 550 6 0.257 5.743 24.88 13,684 £786
March & October 2030-2230 hours (weekday Evenings)
2 44 88 3.7 0.308 3.392 24.88 2,189 £74
March & October 2230-0800 hours (weekday Nights)
9.5 44 418 3.7 0.155 3.545 24.88 10,400 £369
March & October (weekends) 24 18 432 3.7 0.308 3.392 24.88 10,748 £365 Nov + Feb (weekday Outside SToD hours)
21 42 882 8.7 0.888 7.812 18.81 16,590 £1,296
Jan + Dec (weekday) 21 45 945 8.7 1.95 6.75 18.81 17,775 £1,200 Nov + Feb (SToD 1600-1900 hours) 3 42 126 45 5.205 39.795 57.16 7,202 £2,866 Jan + Dec (SToD 1600-1900 hours) 3 45 135 45 5.611 39.389 57.16 7,717 £3,039 Nov - Feb (weekends) 24 33 792 3.7 0.308 3.392 24.88 19,705 £668 April - September between 0800-2030 hours weekdays
6.7 131 877.7 6 0.257 5.743 16.71 14,666 £842
TOTAL 120,677 £11,506

127
Table 20: Potential Revenue from Farm Energy Tariff (Under 1MW High Voltage) with the Generator sited at the 15m Head
Number of Daily Hours
Number of Days
Number of Hours/Year
Business Tariff
(p/kWh)
NIE Wheeling Charge (p/kWh)
Unit Income for SWL & CA
(p/kWh)
Power Output 400mm Diameter Pipe
(kWh)15m head
Annual Energy (kWh)
Revenue (£)
March & October 0800-2030 hours (weekdays)
12.5 44 550 5.9 0.257 5.643 23.89 13,140 £741
March & October 2030-2230 hours (weekday Evenings)
2 44 88 3.3 0.308 2.992 23.89 2,102 £63
March & October 2230-0800 hours (weekday Nights)
9.5 44 418 3.3 0.155 3.145 23.89 9,986 £314
March & October (weekends) 24 18 432 3.3 0.308 2.992 23.89 10,320 £309 Nov + Feb (weekday Outside SToD hours)
21 42 882 8.6 0.888 7.712 18.94 16,705 £1,288
Jan + Dec (weekday) 21 45 945 8.6 1.95 6.65 18.94 17,898 £1,190 Nov + Feb (SToD 1600-1900 hours) 3 42 126 43 5.205 37.795 44.11 5,558 £2,101 Jan + Dec (SToD 1600-1900 hours) 3 45 135 43 5.611 37.389 44.11 5,955 £2,226 Nov - Feb (weekends) 24 33 792 3.3 0.308 2.992 23.89 18,921 £566 April - September between 0800-2030 hours weekdays
6.7 131 877.7 5.9 0.257 5.643 17.66 15,500 £875
TOTAL 116,085 £9,674 Number of
Daily HoursNumber of Days
Number of Hours/Year
Business Tariff
(p/kWh)
NIE Wheeling Charge (p/kWh)
Unit Income for SWL & CA
(p/kWh)
Power Output 450mm Diameter Pipe
(kWh)15m head
Annual Energy (kWh)
Revenue (£)
March & October 0800-2030 hours (weekdays)
12.5 44 550 5.9 0.257 5.643 24.71 13,591 £767
March & October 2030-2230 hours (weekday Evenings)
2 44 88 3.3 0.308 2.992 24.71 2,174 £65
March & October 2230-0800 hours (weekday Nights)
9.5 44 418 3.3 0.155 3.145 24.71 10,329 £325
March & October (weekends) 24 18 432 3.3 0.308 2.992 24.71 10,675 £319 Nov + Feb (weekday Outside SToD hours)
21 42 882 8.6 0.888 7.712 19.29 17,014 £1,312
Jan + Dec (weekday) 21 45 945 8.6 1.95 6.65 19.29 18,229 £1,212 Nov + Feb (SToD 1600-1900 hours) 3 42 126 43 5.205 37.795 46.57 5,868 £2,218

128
Jan + Dec (SToD 1600-1900 hours) 3 45 135 43 5.611 37.389 46.57 6,287 £2,351 Nov - Feb (weekends) 24 33 792 3.3 0.308 2.992 24.71 19,570 £586 April - September between 0800-2030 hours weekdays
6.7 131 877.7 5.9 0.257 5.643 17.96 15,763 £890
TOTAL 119,500 £10,044 Number of
Daily HoursNumber of Days
Number of Hours/Year
Business Tariff
(p/kWh)
NIE Wheeling Charge (p/kWh)
Unit Income for SWL & CA
(p/kWh)
Power Output 500mm Diameter Pipe
(kWh)15m head
Annual Energy (kWh)
Revenue (£)
March & October 0800-2030 hours (weekdays)
12.5 44 550 5.9 0.257 5.643 24.88 13,684 £772
March & October 2030-2230 hours (weekday Evenings)
2 44 88 3.3 0.308 2.992 24.88 2,189 £66
March & October 2230-0800 hours (weekday Nights)
9.5 44 418 3.3 0.155 3.145 24.88 10,400 £327
March & October (weekends) 24 18 432 3.3 0.308 2.992 24.88 10,748 £322 Nov + Feb (weekday Outside SToD hours)
21 42 882 8.6 0.888 7.712 18.81 16,590 £1,279
Jan + Dec (weekday) 21 45 945 8.6 1.95 6.65 18.81 17,775 £1,182 Nov + Feb (SToD 1600-1900 hours) 3 42 126 43 5.205 37.795 57.16 7,202 £2,722 Jan + Dec (SToD 1600-1900 hours) 3 45 135 43 5.611 37.389 57.16 7,717 £2,885 Nov - Feb (weekends) 24 33 792 3.3 0.308 2.992 24.88 19,705 £590 April - September between 0800-2030 hours weekdays
6.7 131 877.7 5.9 0.257 5.643 16.71 14,666 £828
TOTAL 120,677 £10,972


130
Appendix F – Letters of Support for the Micro-hydro Project

131

132

133

134

135

136
Appendix G - Electrical Schematic for Embedded Generator Linked to NIE System