Embed Size (px)
Citation preview
Molecular and Condensed Matter Lab(Physics 4580)
PV Materials and Device Physics Lab (PHYS 6/7280)
The University of ToledoInstructors: Randy Ellingson, Mike Heben
A. Experimental Practices, andB. Graphing and Analysis with Igor Pro
Week of Aug. 29, 2011
http://en.wikipedia.org/wiki/Scientific_method
Experimental Methods and Practices
http://www.sciencebuddies.org/science-fair-projects/project_scientific_method.shtml
Experimental Methods and Practices
Key InfoThe scientific method is a way to ask and answer scientific questions by making observations and doing experiments.
The steps of the scientific method are to:
• Ask a Question• Do Background Research• Construct a Hypothesis• Test Your Hypothesis by Doing an Experiment• Analyze Your Data and Draw a Conclusion• Communicate Your Results
It is important for your experiment to be a fair test. A "fair test" occurs when you change only one factor (variable) and keep all other conditions the same.
From sciencebuddies.org:
http://en.wikipedia.org/wiki/Scientific_method
Key Elements of the Scientific Method
1. Define the question2. Gather information and resources (observe)3. Form hypothesis4. Perform experiment and collect data5. Analyze data6. Interpret data and draw conclusions that serve as a starting point for
new hypothesis7. Publish results8. Retest (frequently done by other scientists)
The iterative cycle inherent in this step‐by‐step methodology goes from point 3 to 6 back to 3 again.
http://en.wikipedia.org/wiki/Scientific_method
Thoughts on the Scientific Method
According to William Whewell (1794–1866), "invention, sagacity, genius" are required at every step in scientific method. It is not enough to base scientific method on experience alone; multiple steps are needed in scientific method, ranging from our experience to our imagination, back and forth.
Ibn al‐Haytham (Alhazen, 965–1039), pointed out the emphasis on seeking truth:
Truth is sought for its own sake. And those who are engaged upon the quest for anything for its own sake are not interested in other things. Finding the truth is difficult, and the road to it is rough.
http://en.wikipedia.org/wiki/Scientific_method
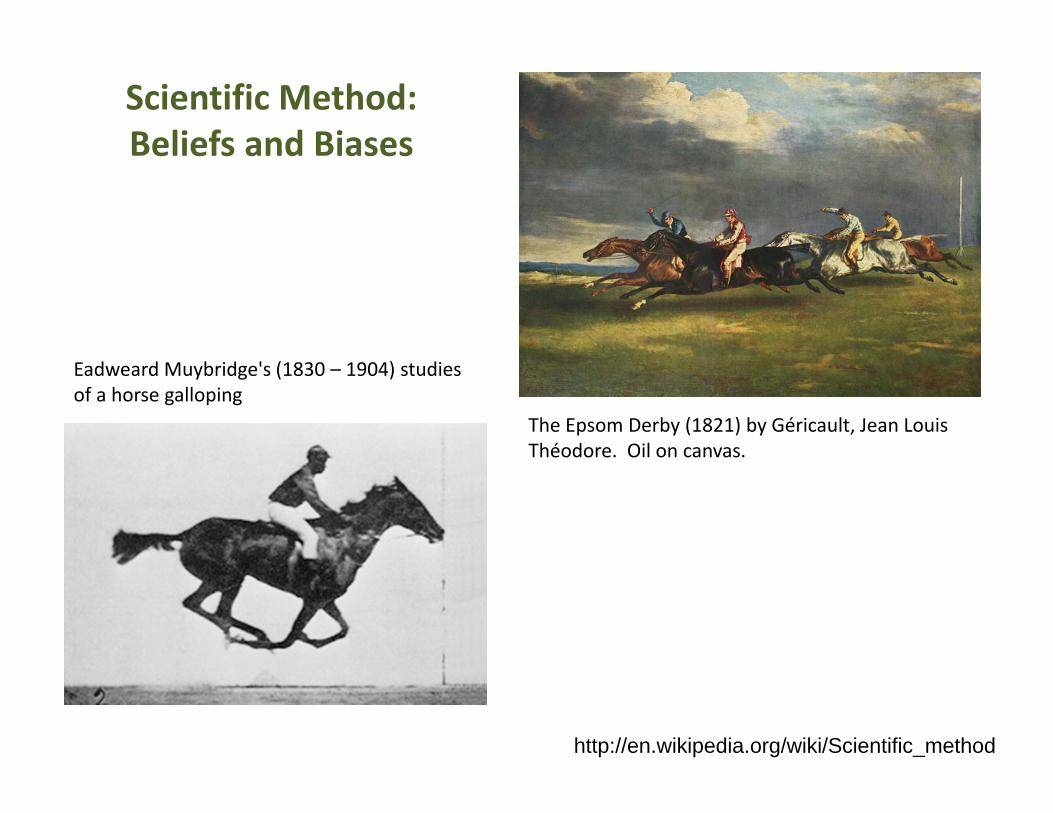
Scientific Method: Beliefs and Biases
The Epsom Derby (1821) by Géricault, Jean Louis Théodore. Oil on canvas.
Eadweard Muybridge's (1830 – 1904) studies of a horse galloping
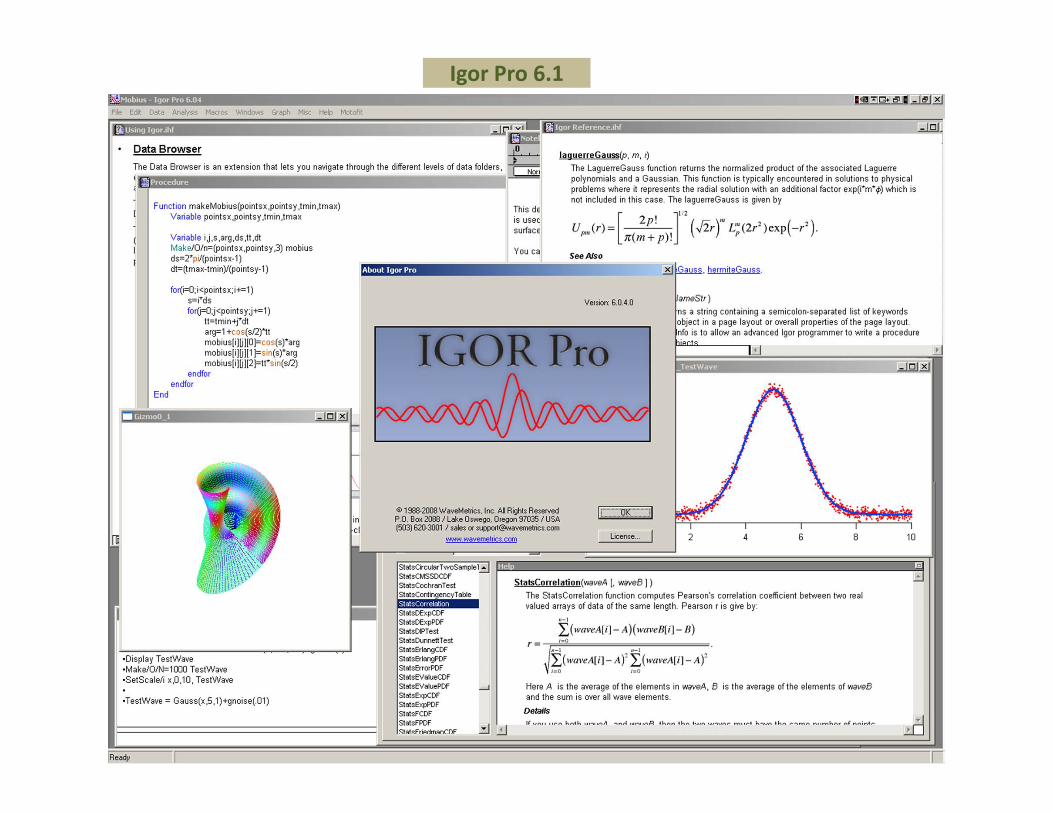
Igor Pro 6.1
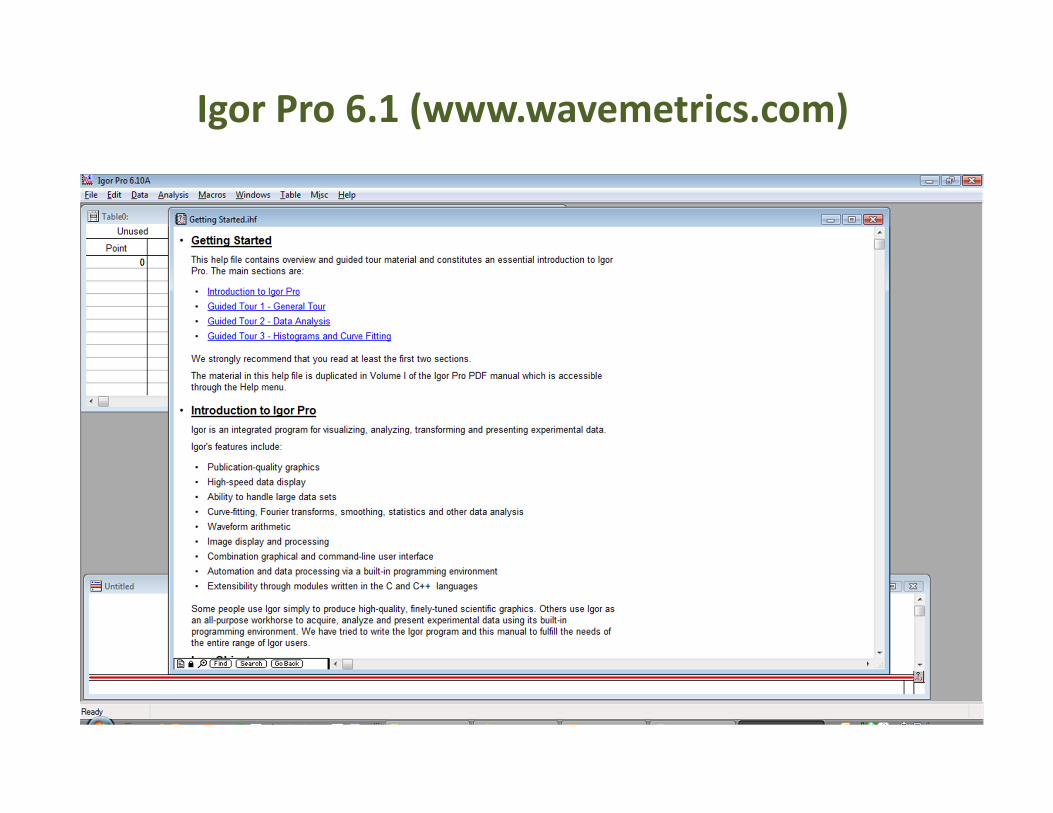
Igor Pro 6.1 (www.wavemetrics.com)
Error handling and propagation
• See handout (to be emailed)• See also:
http://teacher.pas.rochester.edu/PHY_LABS/AppendixB/AppendixB.html
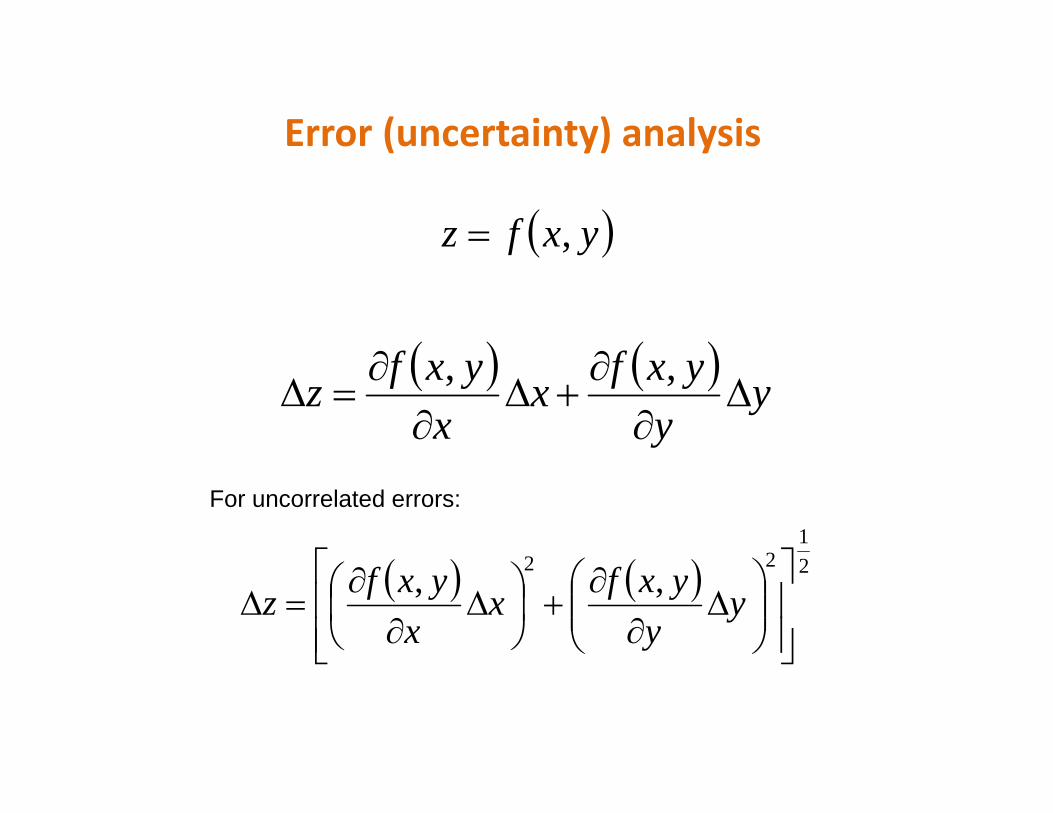
Error (uncertainty) analysis
yxfz ,
yy
yxfxx
yxfz
,,
21
22 ,,
yy
yxfxx
yxfz
For uncorrelated errors:
2
2
22
4
4s
rC
rs
CA
rrsCC
srA
rsCr
rC
sCr
CA
244
44
22
2
2
2
2
2
21
2
2
2
2
2 84
r
sCrC
srA
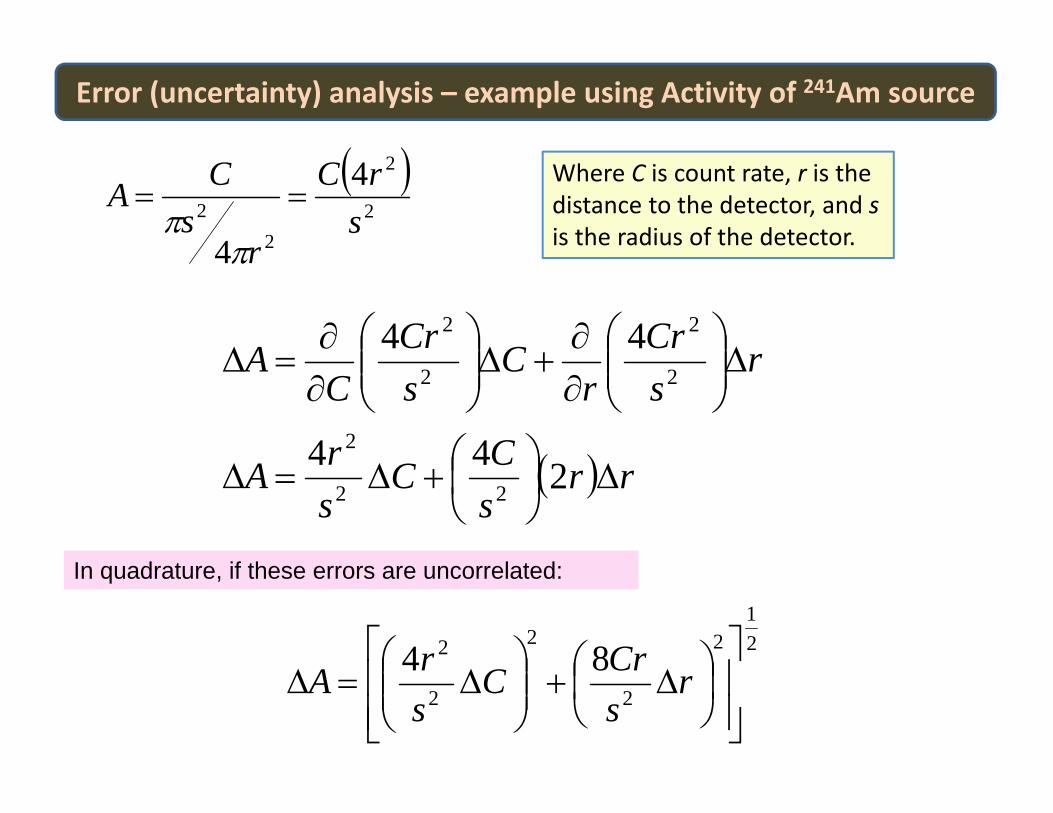
Where C is count rate, r is the distance to the detector, and sis the radius of the detector.
In quadrature, if these errors are uncorrelated:
Error (uncertainty) analysis – example using Activity of 241Am source
Error (uncertainty) analysis – multiple value r.m.s. approach
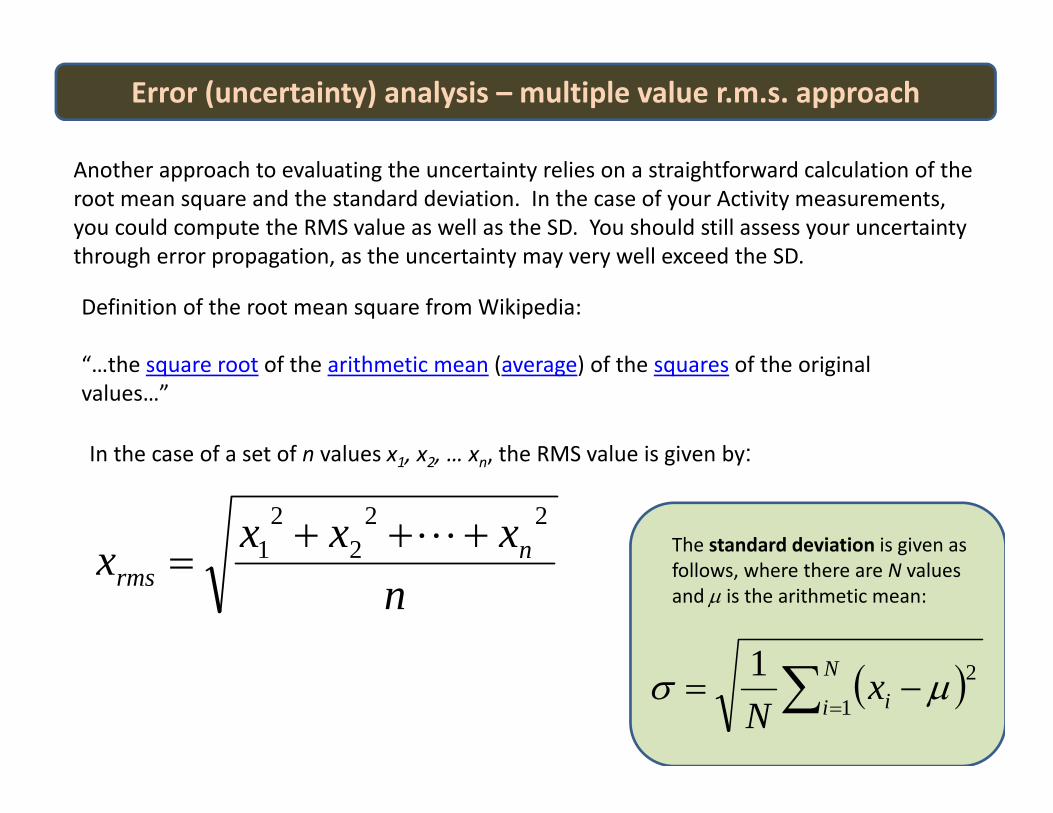
Definition of the root mean square from Wikipedia:
“…the square root of the arithmetic mean (average) of the squares of the original values…”
In the case of a set of n values x1, x2, … xn, the RMS value is given by:
nxxxx n
rms
222
21
Another approach to evaluating the uncertainty relies on a straightforward calculation of the root mean square and the standard deviation. In the case of your Activity measurements, you could compute the RMS value as well as the SD. You should still assess your uncertainty through error propagation, as the uncertainty may very well exceed the SD.
The standard deviation is given as follows, where there are N values and is the arithmetic mean:
N
i ixN 1
21
LabVIEW Introduction
Adapted from a presentation prepared by
Imran Haider Malik of McGill University CanadaImran Haider Malik of McGill University, CanadaJanuary 16, 2006 for their Measurement Lab. MECH262‐MECH261
http://www.cim.mcgill.ca/~paul/LabviewTut.pdf
OutlineOutline• Introduction• LabVIEW Introduction• Data Acquisition (DAQ)• Features of LabVIEW
E l i• Example .vi• LabVIEW Interface• Lab Equipmentq p• Goals of this UT LabVIEW Lab• List of Typical Measurements• Conclusions.
LabVIEWLabVIEW
• Product of National Instruments (NI)
• Software for Virtual Instrumentation ( vi)• Software for Virtual Instrumentation (.vi)
• Data Acquisition (DAQ)
h l• Graphical Programming
• Data Storage and Analysis for wide range of applications
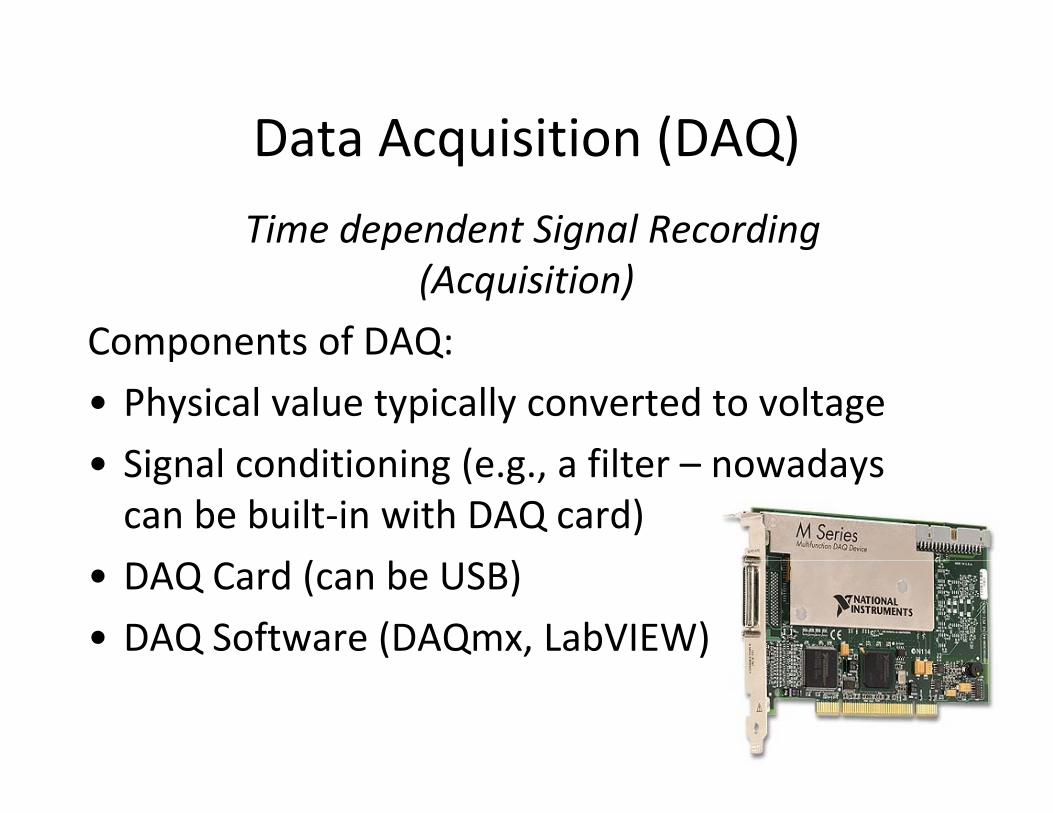
Data Acquisition (DAQ)Data Acquisition (DAQ)
Time dependent Signal Recording (Acquisition)
Components of DAQ:p Q
• Physical value typically converted to voltage
• Signal conditioning (e g a filter nowadays• Signal conditioning (e.g., a filter – nowadays can be built‐in with DAQ card)
d ( b )• DAQ Card (can be USB)
• DAQ Software (DAQmx, LabVIEW)
Features of LabVIEWFeatures of LabVIEW• Design
– Signal and Image Processing
– Embedded System Programming
• (PC, DSP, FPGA, Microcontroller)
– Simulation and Prototyping
– And more…
• Control
– Automatic Controls and Dynamic Systems
– Mechatronics and Robotics
– And more…
• Measurements
– Circuits and Electronics
– Measurements and Instrumentation
– And more…
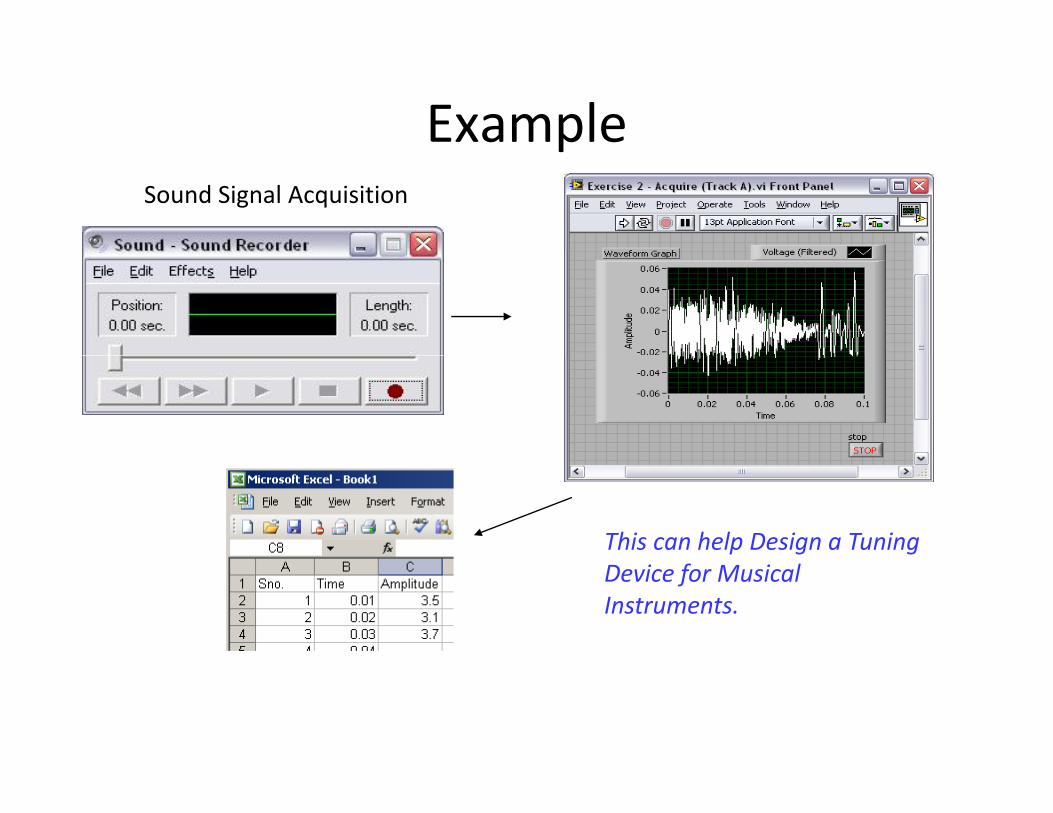
ExamplepSound Signal Acquisition
This can help Design a Tuning Device for Musical Instruments.
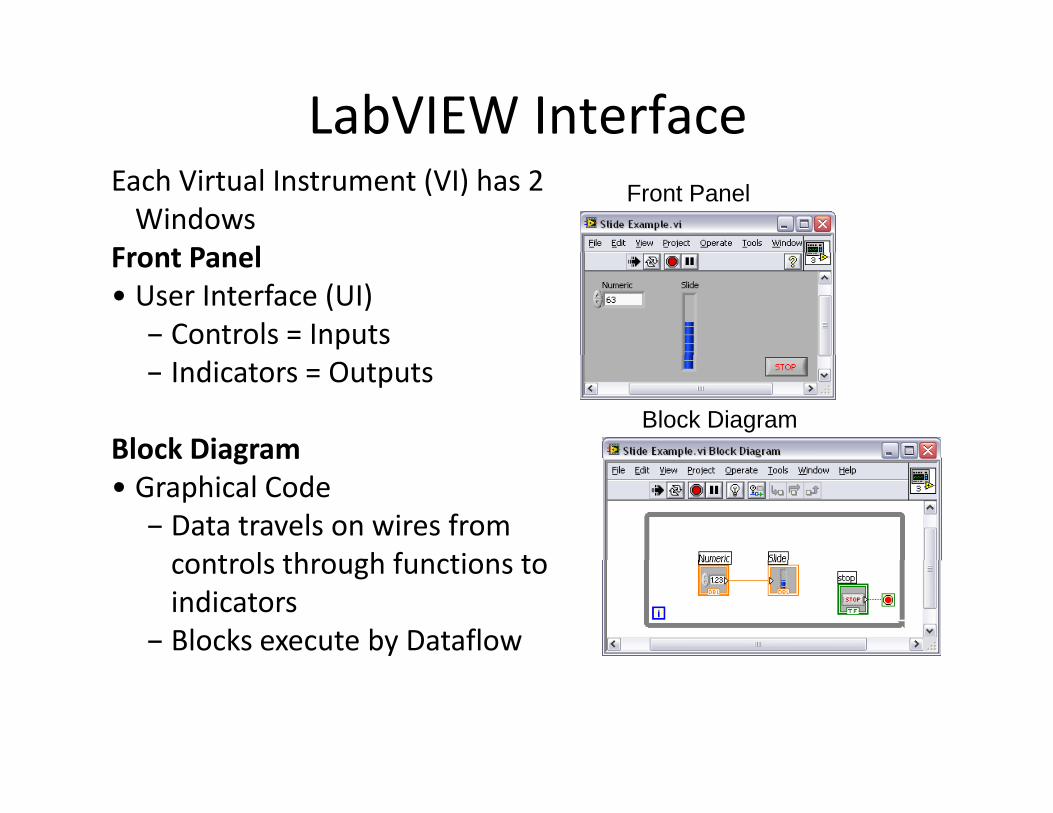
LabVIEW InterfaceEach Virtual Instrument (VI) has 2 Windows
Front Panel
Front Panel
Front Panel• User Interface (UI)
– Controls = Inputs– Indicators = Outputs
Block DiagramBlock Diagram
Block Diagram• Graphical Code
– Data travels on wires from controls through functions tocontrols through functions to indicators
– Blocks execute by Dataflow
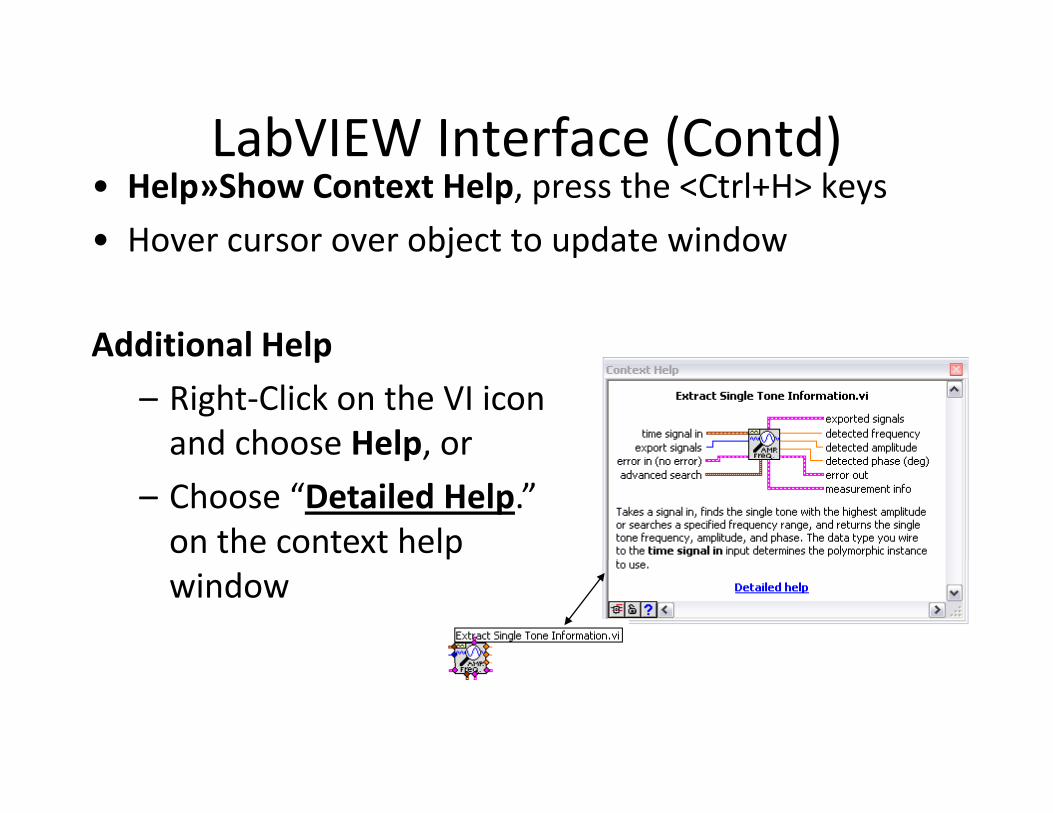
LabVIEW Interface (Contd)LabVIEW Interface (Contd)• Help»Show Context Help, press the <Ctrl+H> keys
• Hover cursor over object to update windowj p
Additional HelpAdditional Help
– Right‐Click on the VI icon and choose Help, orp,
– Choose “Detailed Help.” on the context help window
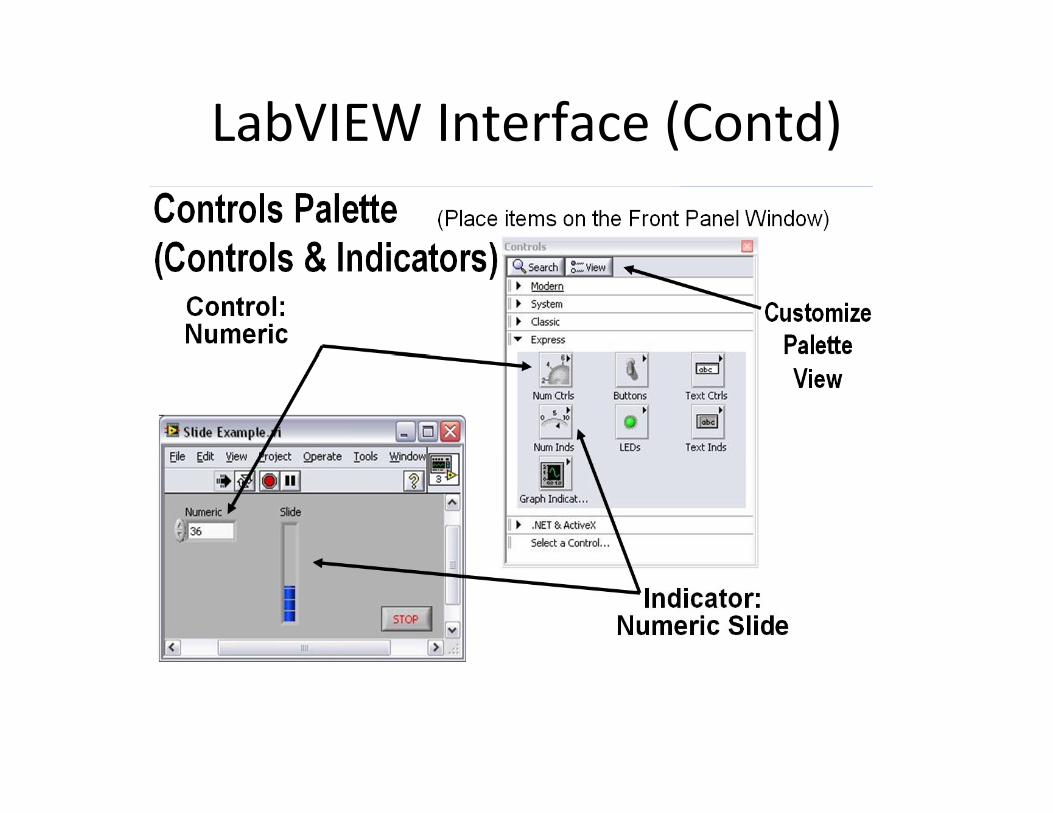
LabVIEW Interface (Contd)( )
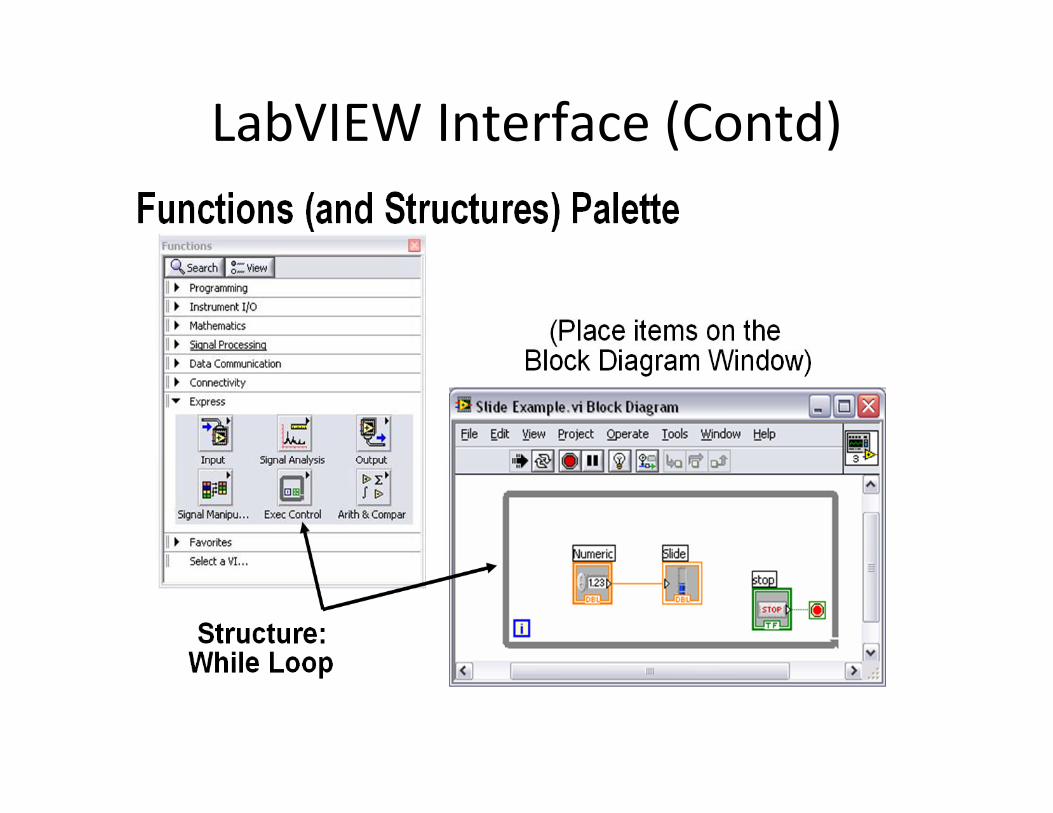
LabVIEW Interface (Contd)( )
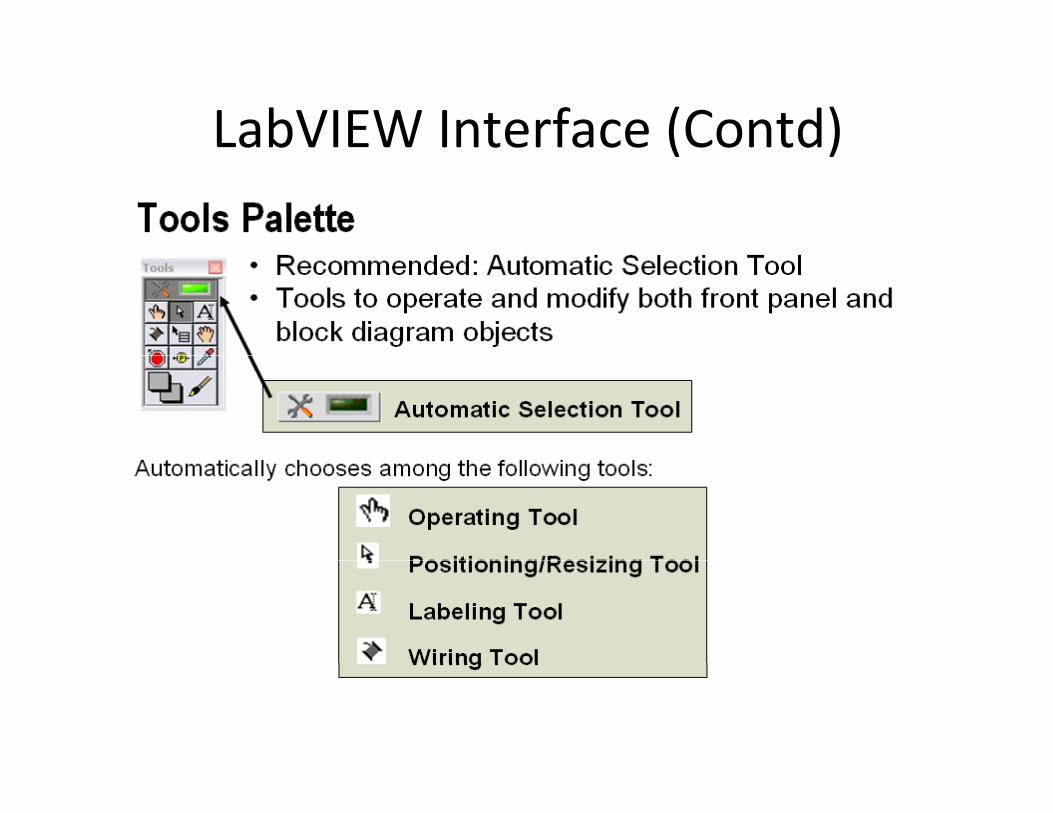
LabVIEW Interface (Contd)( )
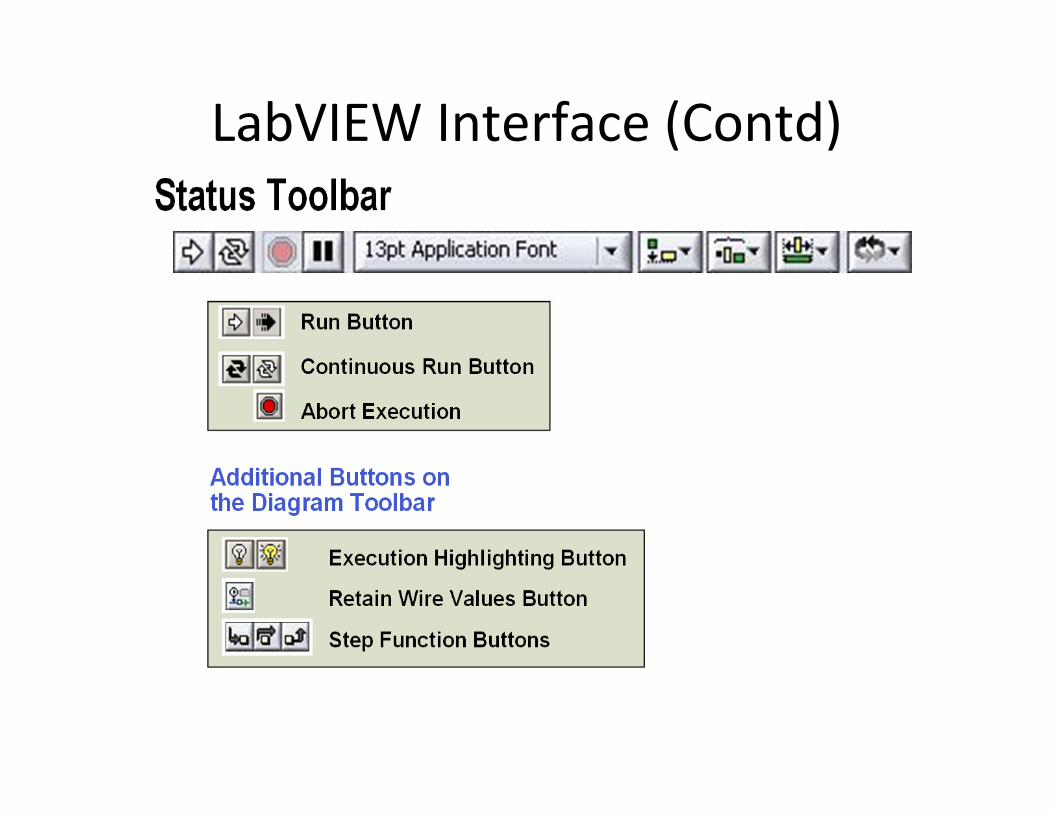
LabVIEW Interface (Contd)( )
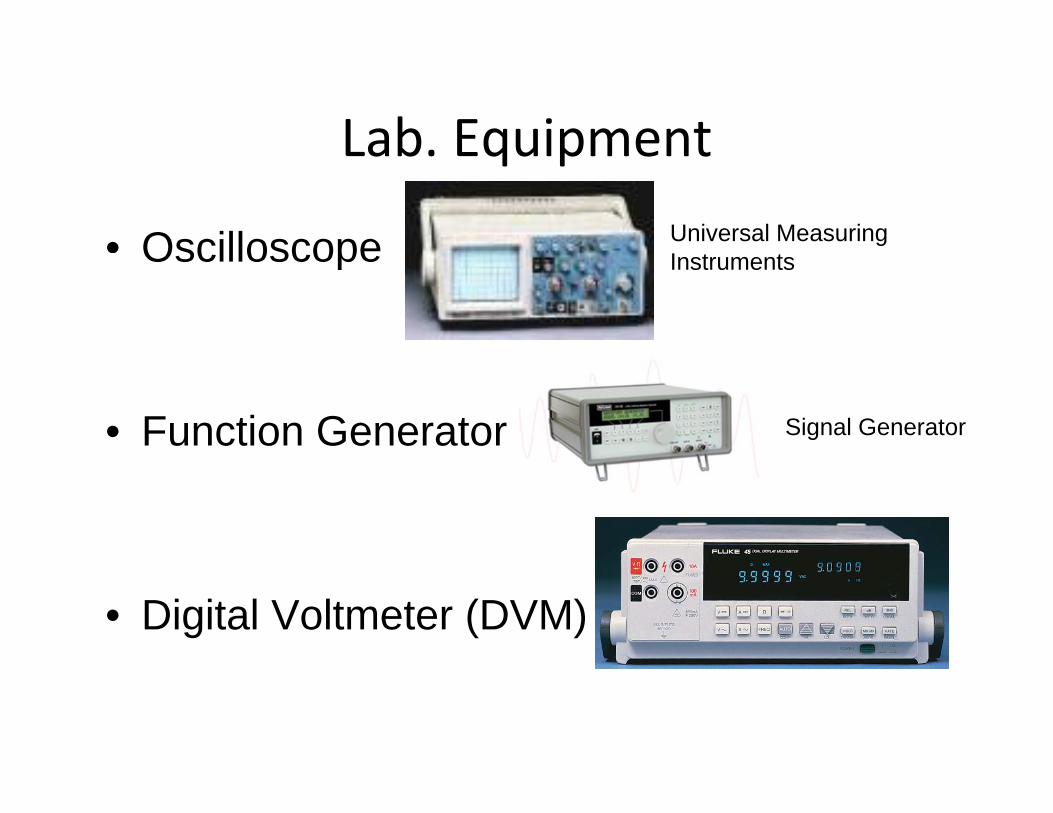
Lab. EquipmentLab. Equipment
• Oscilloscope Universal Measuring IOscilloscope Instruments
• Function Generator Signal Generator
• Digital Voltmeter (DVM)
Goals of this week’s LabGoals of this week s Lab
• Introduce LabVIEW• Introduce LabVIEW
• Experience DAQ
f l i i• Use of Electronic instruments:
Oscilloscope, Function Generator
Digital Volt‐meter (DVM).
Measurement ExamplesMeasurement Examples1. Instrumentation Overview.
2. Introduction to LabVIEW.
3. Data Sampling.
4. Time Constant.
5. Stress and Strain.
6. Transducer Sensitivity (Part 1)
7. Transducer Sensitivity (Part 2) and Linearity
8. Pressure Transducer Calibration and Jet Profile
9. Thermocouples: Calibration and Manufacturing
What you should know about LabVIEW being a physicist
• Selection of DAQ system for an application
• Communicating with instruments (drivers, GPIB, other)GPIB, other)
• Modularity of programming approaches: making your vi’s flexible and adaptablemaking your .vi s flexible and adaptable
ReferencesReferences
• www ni com• www.ni.com
• Using the oscilloscope http://www doctronics co uk/scope htmhttp://www.doctronics.co.uk/scope.htm