Embed Size (px)
Citation preview
A Distribution-Free Summarization Method for Affymetrix GeneChip Arrays
Zhongxue Chen, Monnie McGee, Qingzhong Liu and Richard Scheuermann
Dallas Area Bioinformatics Workshop
August 29, 2006
DAB Workshop 2006 2
A new summarization method
• Distribution Free Weighted (DFW) Summarization
• Use information on variability of probe intensities to summarize Affymetrix data
• Translate variability into weights which allow downweighting of poorly performing probes
DAB Workshop 2006 3
Need for Summarization
• Result of unique Affymetrix array structure
• Summarization is necessary to obtain one number for each gene
• All 11 - 20 probes interrogating each gene must be summarized into one expression value
DAB Workshop 2006 4
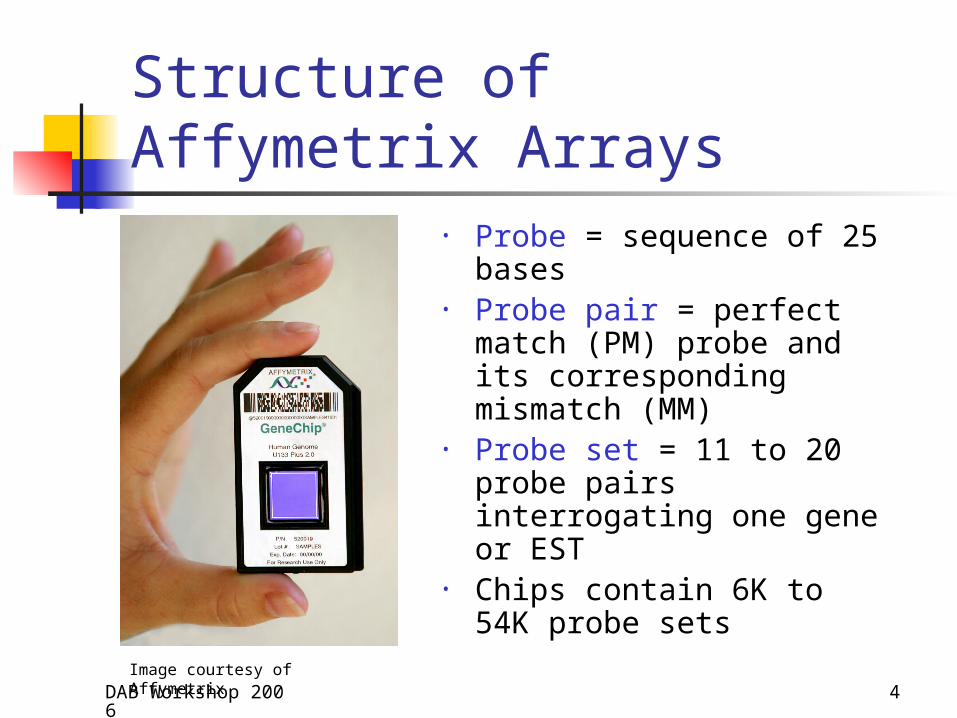
Structure of Affymetrix Arrays• Probe = sequence of 25
bases• Probe pair = perfect match
(PM) probe and its corresponding mismatch (MM)
• Probe set = 11 to 20 probe pairs interrogating one gene or EST
• Chips contain 6K to 54K probe sets
Image courtesy of Affymetrix
DAB Workshop 2006 5
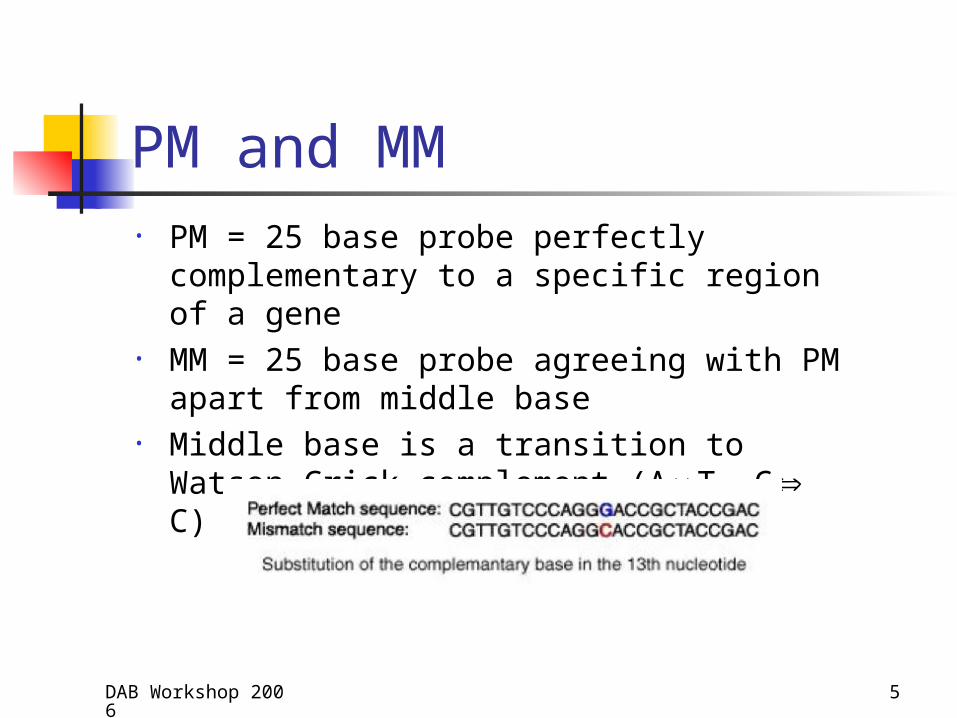
PM and MM • PM = 25 base probe perfectly complementary to
a specific region of a gene• MM = 25 base probe agreeing with PM apart
from middle base• Middle base is a transition to Watson-Crick
complement (AT, G C)
DAB Workshop 2006 6
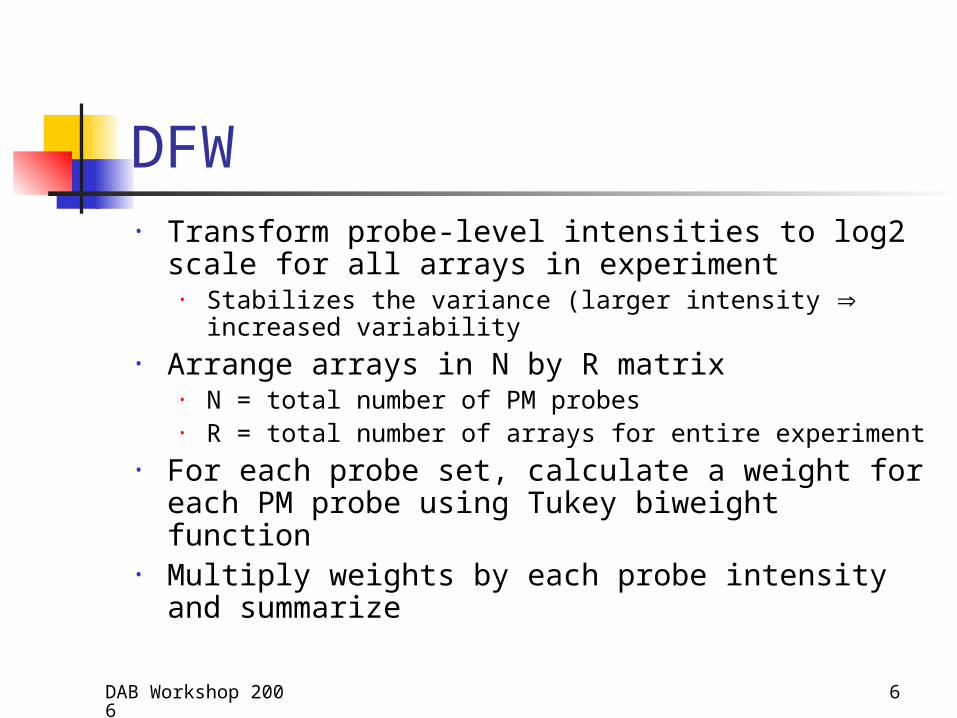
DFW• Transform probe-level intensities to log2 scale for all
arrays in experiment• Stabilizes the variance (larger intensity increased
variability• Arrange arrays in N by R matrix
• N = total number of PM probes • R = total number of arrays for entire experiment
• For each probe set, calculate a weight for each PM probe using Tukey biweight function
• Multiply weights by each probe intensity and summarize
DAB Workshop 2006 7
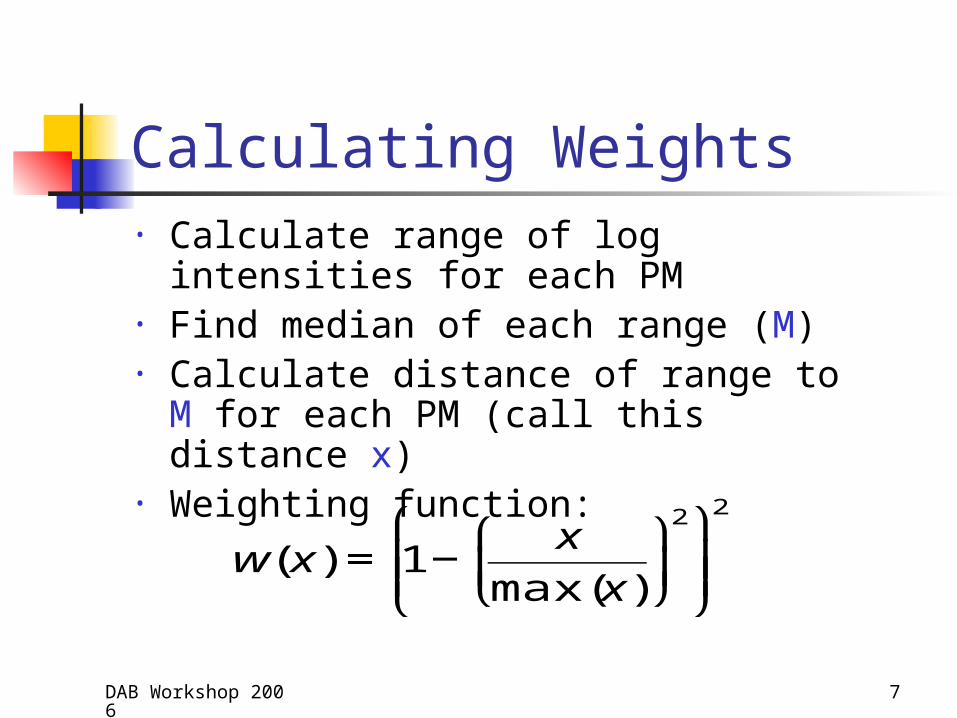
Calculating Weights• Calculate range of log intensities for
each PM• Find median of each range (M)• Calculate distance of range to M for
each PM (call this distance x)• Weighting function:
€
w(x) = 1−x
max(x)
⎛
⎝ ⎜
⎞
⎠ ⎟2 ⎛
⎝ ⎜ ⎜
⎞
⎠ ⎟ ⎟
2
DAB Workshop 2006 8
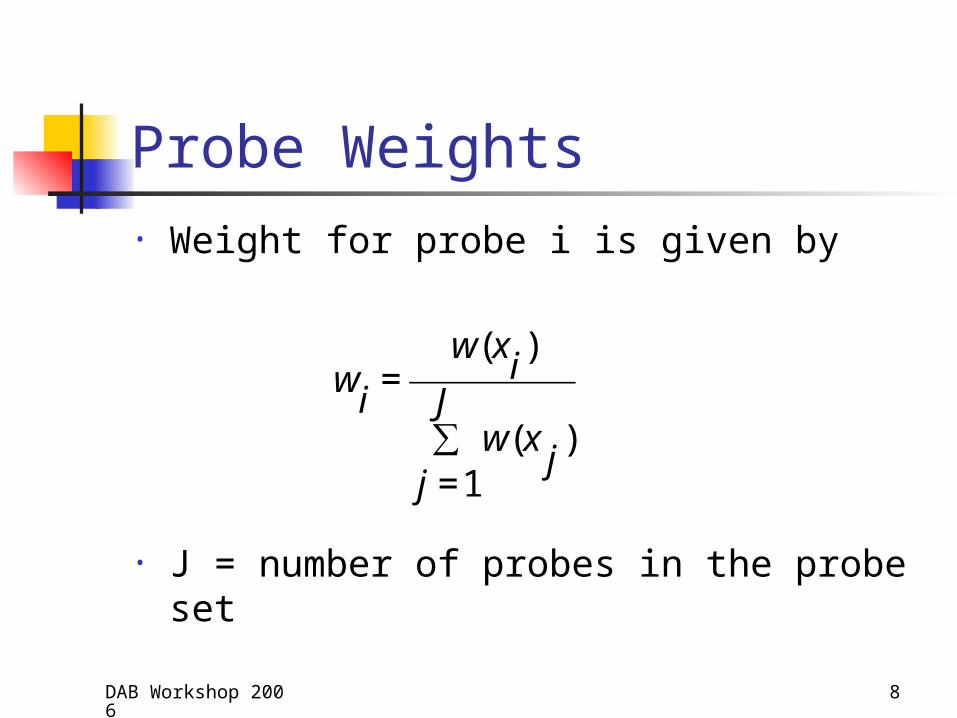
Probe Weights• Weight for probe i is given by
• J = number of probes in the probe set
€
wi
=w(x
i)
w(xj)
j =1
J∑
DAB Workshop 2006 9
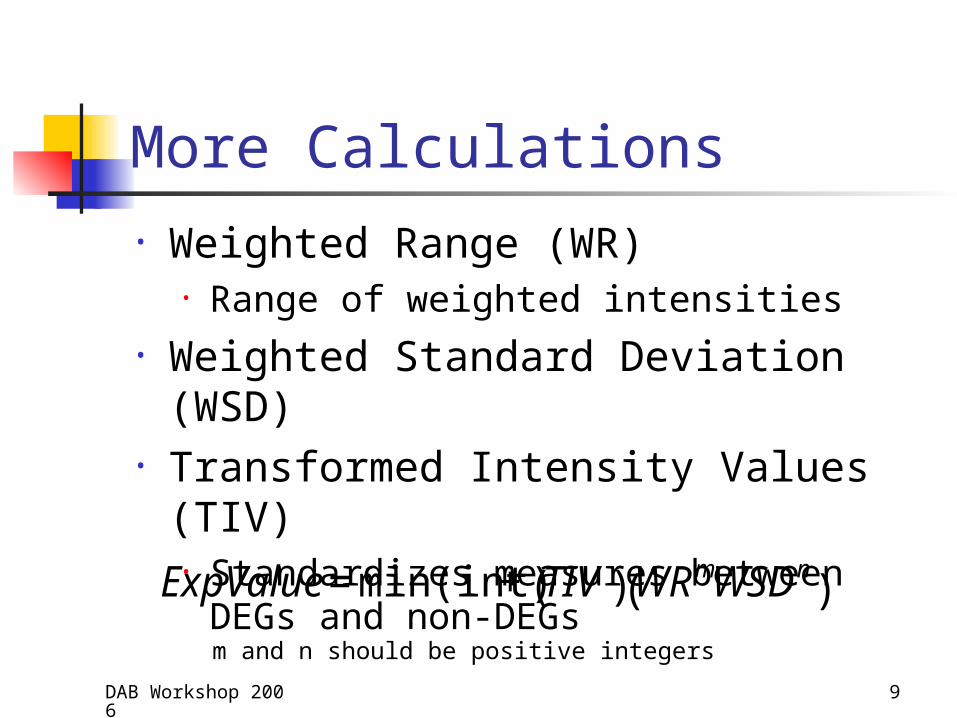
More Calculations
• Weighted Range (WR)• Range of weighted intensities
• Weighted Standard Deviation (WSD)• Transformed Intensity Values (TIV)
• Standardizes measures between DEGs and non-DEGs
€
ExpValue = min(int) + TIV( ) WRmWSDn( )m and n should be positive integers
DAB Workshop 2006 10
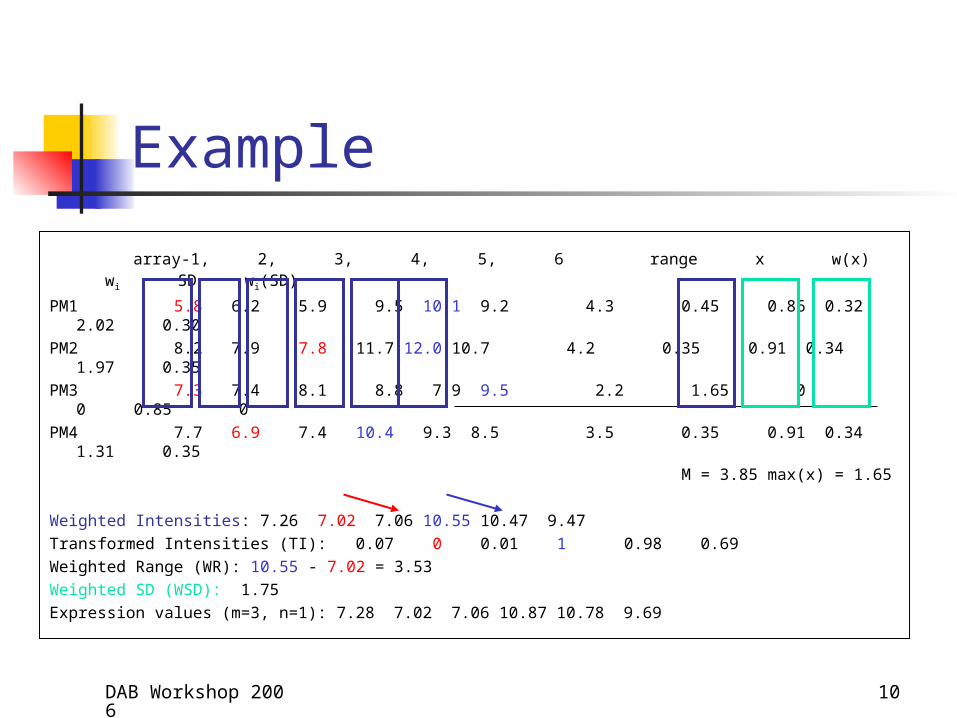
Example
array-1, 2, 3, 4, 5, 6 range x w(x) w i SD wi(SD)
PM1 5.8 6.2 5.9 9.5 10.1 9.2 4.3 0.45 0.86 0.32 2.02 0.30
PM2 8.2 7.9 7.8 11.7 12.0 10.7 4.2 0.35 0.91 0.34 1.97 0.35
PM3 7.3 7.4 8.1 8.8 7.9 9.5 2.2 1.65 0 0 0.85 0
PM4 7.7 6.9 7.4 10.4 9.3 8.5 3.5 0.35 0.91 0.34 1.31 0.35
M = 3.85 max(x) = 1.65
Weighted Intensities: 7.26 7.02 7.06 10.55 10.47 9.47
Transformed Intensities (TI): 0.07 0 0.01 1 0.98 0.69
Weighted Range (WR): 10.55 - 7.02 = 3.53
Weighted SD (WSD): 1.75
Expression values (m=3, n=1): 7.28 7.02 7.06 10.87 10.78 9.69
DAB Workshop 2006 11
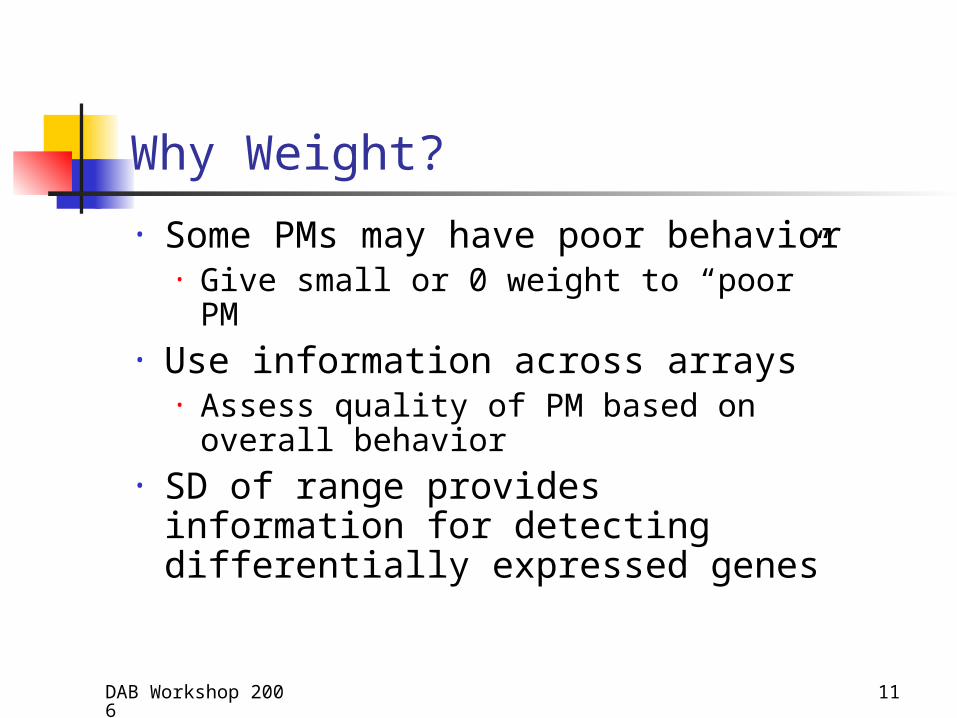
Why Weight?
• Some PMs may have poor behavior• Give small or 0 weight to “poor” PM
• Use information across arrays• Assess quality of PM based on overall
behavior• SD of range provides information for
detecting differentially expressed genes
DAB Workshop 2006 12
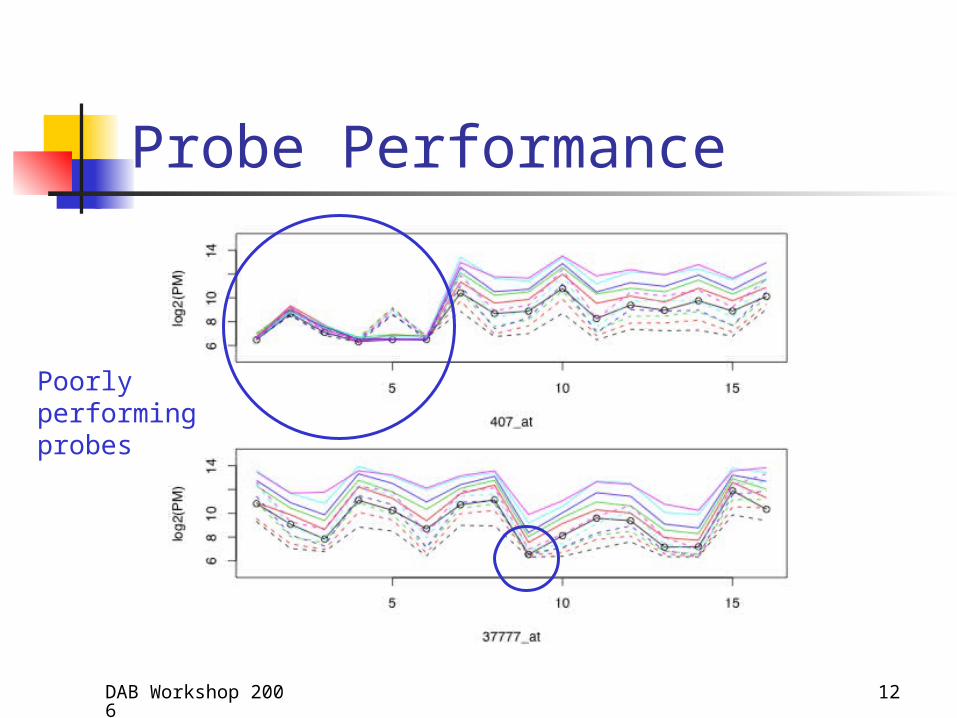
Probe Performance
Poorly performing probes
DAB Workshop 2006 13
Comparison Data Sets• Affymetrix Latin Square Spike-In Experiments
• Two experiments: on HGU-95Av2 platform and HGU-133A platform
• HGU-95 experiments has 14 transcripts spiked-in at concentrations from 0 to 1024 pM (59 arrays)
• HGU-133 experiment has 42 transcripts spiked-in in triplicate at concentrations from 0 to 512 (42 arrays)
• McGee and Chen (2006) report 22 more spike-ins
• “GoldenSpike” Experiment (Choe et al., 2005)• Six arrays (3 experiment, 3 control) on DrosGenome1 Chip• 1309 transcripts recognizing known fold differences
(from 1.2 to 4)• 2551 recognizing transcripts included at the same
concentration
DAB Workshop 2006 14
Comparison Methods• ROC curves, AUC values and CPU time• Competitors:
• Robust Multichip Average (RMA) • Bolstad, 2004; Irizarry et al., 2003
• Gene Chip RMA (GCRMA) • Wu et al., 2004
• MAS 5.0, PLIER • Affymetrix 2001, 2004
• Model-Based Expression Index (MBEI) • Li & Wong, 2001a,b
• Factor Analysis for Robust Array Summarization (FARMS) • Hochreiter et al., 2006
DAB Workshop 2006 15
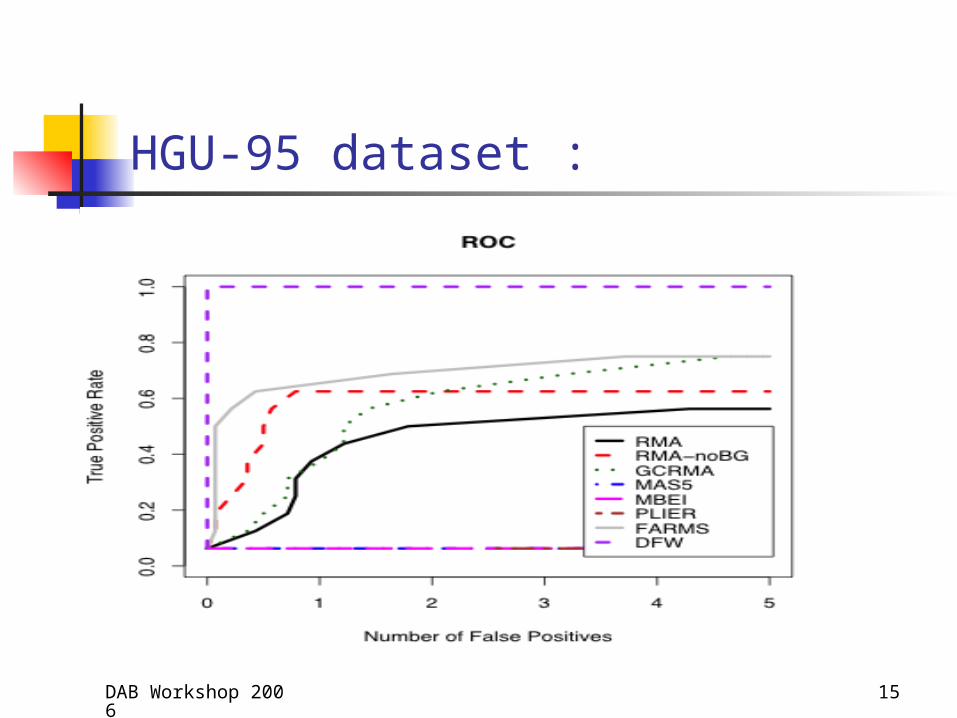
HGU-95 dataset :
DAB Workshop 2006 16
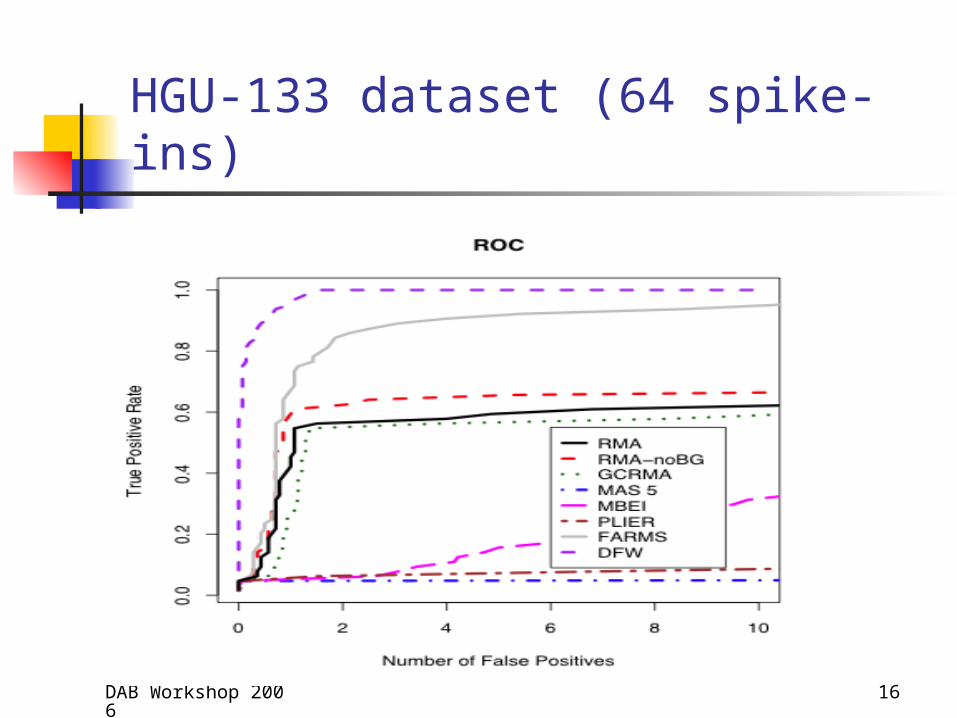
HGU-133 dataset (64 spike-ins)
DAB Workshop 2006 17
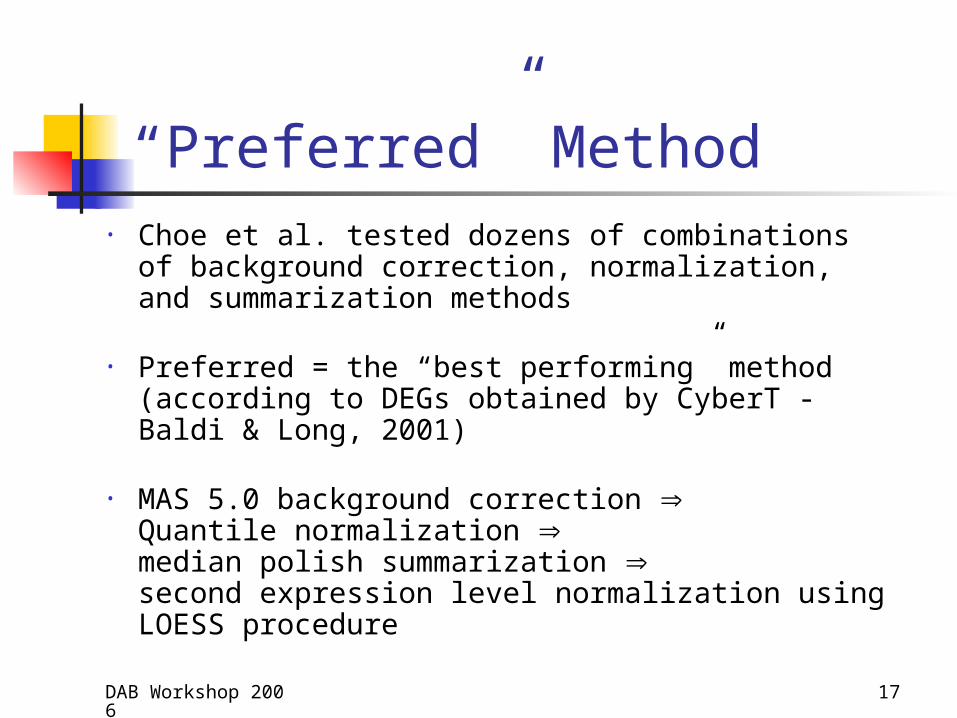
“Preferred” Method• Choe et al. tested dozens of combinations of
background correction, normalization, and summarization methods
• Preferred = the “best performing” method (according to DEGs obtained by CyberT - Baldi & Long, 2001)
• MAS 5.0 background correction Quantile normalization median polish summarization second expression level normalization using LOESS procedure
DAB Workshop 2006 18
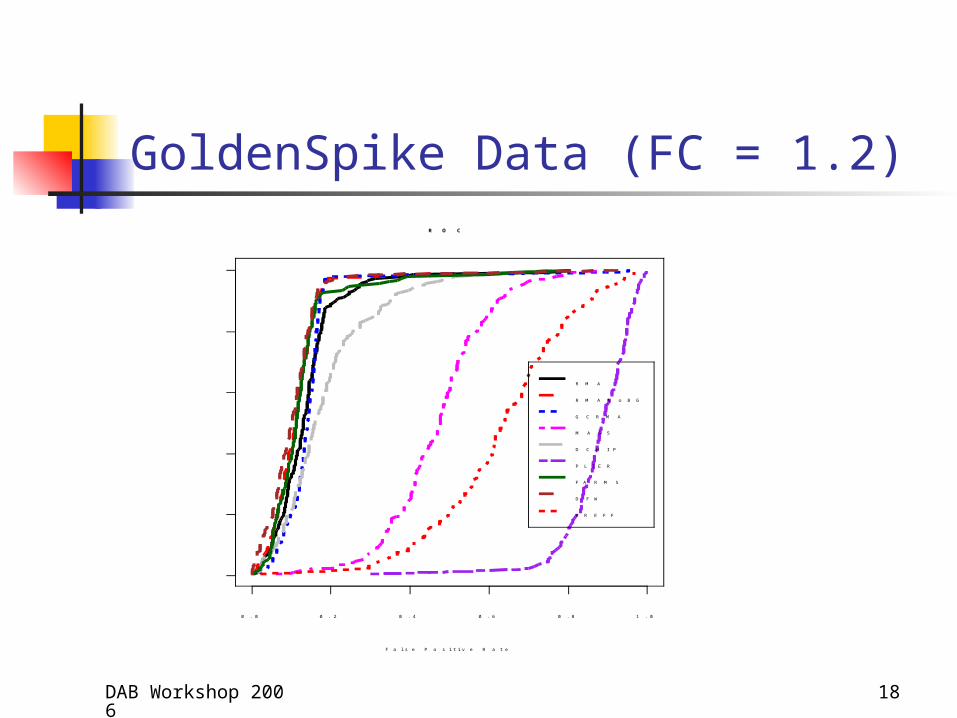
GoldenSpike Data (FC = 1.2)
0 . 0 0 . 2 0 . 4 0 . 6 0 . 8 1 . 0
0.0
0.2
0.4
0.6
0.8
1.0
R O C
F a l s e P o s i t i v e R a t e
True Positive Rate
R M A
R M A N o B G
G C R M A
M A S 5
D C H I P
P L I E R
F A R M S
D F W
P R E F F
DAB Workshop 2006 19
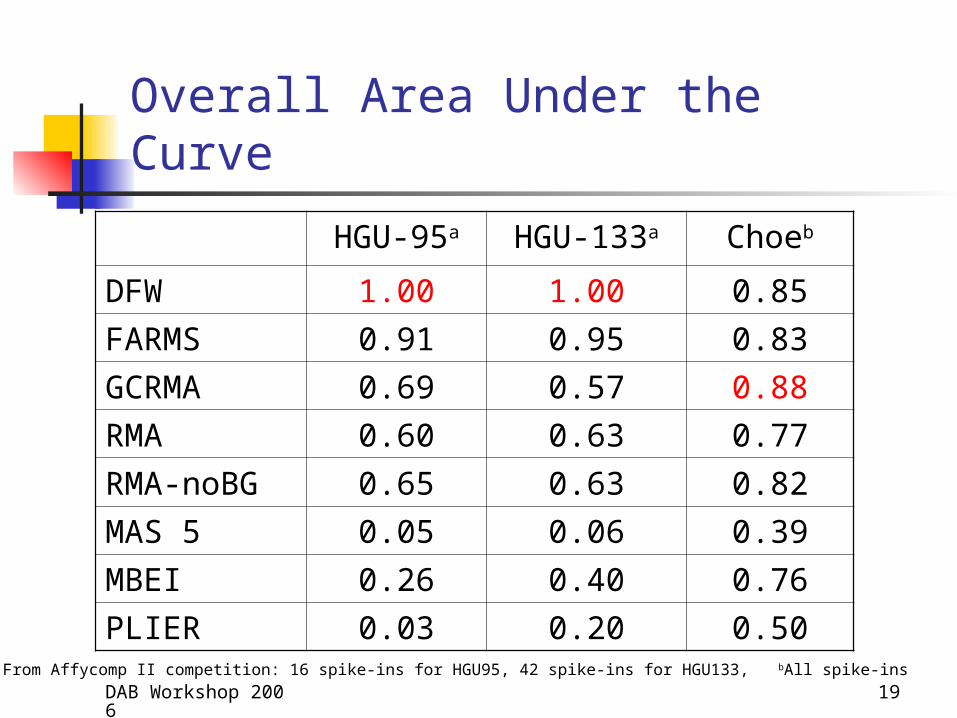
Overall Area Under the Curve
HGU-95a HGU-133a Choeb
DFW 1.00 1.00 0.85
FARMS 0.91 0.95 0.83
GCRMA 0.69 0.57 0.88
RMA 0.60 0.63 0.77
RMA-noBG 0.65 0.63 0.82
MAS 5 0.05 0.06 0.39
MBEI 0.26 0.40 0.76
PLIER 0.03 0.20 0.50a From Affycomp II competition: 16 spike-ins for HGU95, 42 spike-ins for HGU133, bAll spike-ins
DAB Workshop 2006 20
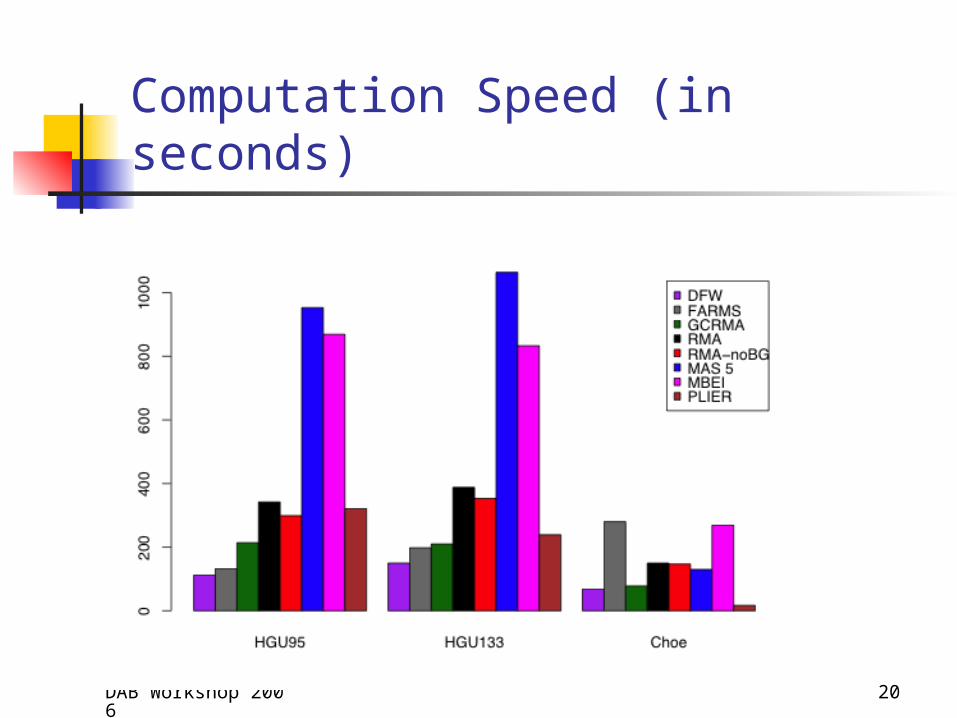
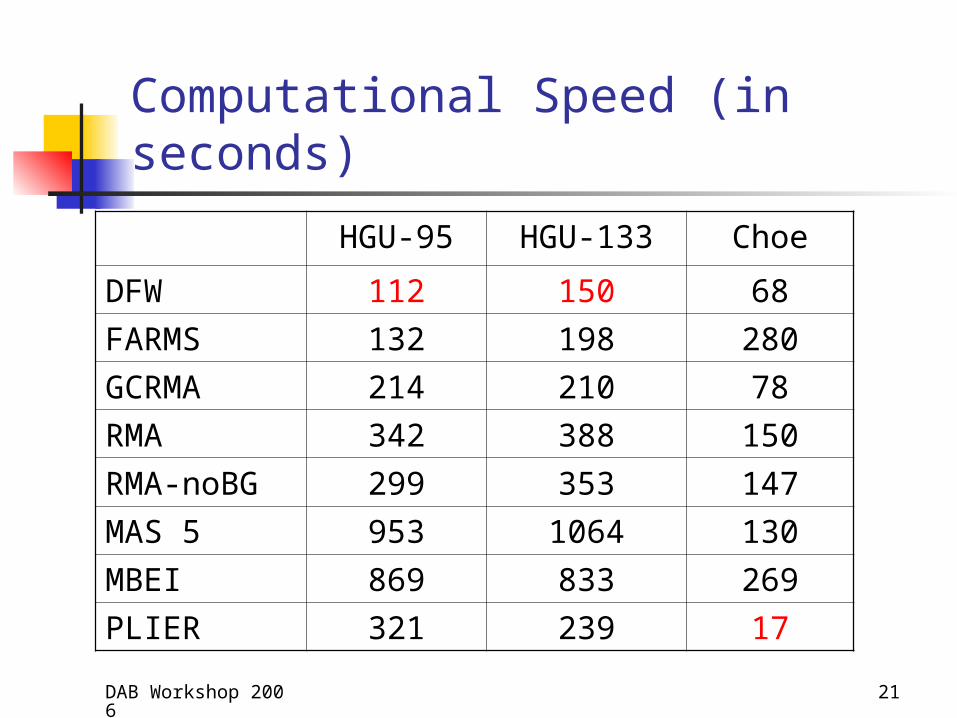
Computation Speed (in seconds)
DAB Workshop 2006 21
Computational Speed (in seconds)
HGU-95 HGU-133 Choe
DFW 112 150 68
FARMS 132 198 280
GCRMA 214 210 78
RMA 342 388 150
RMA-noBG 299 353 147
MAS 5 953 1064 130
MBEI 869 833 269
PLIER 321 239 17
DAB Workshop 2006 22
Further Comparisons• Affycomp II Competition
• Cope, et al., 2004; Irizarry et al., 2006• For Hgu95 spikein data, uses 16 spike-ins• For Hgu133 spikein data, uses 42 spike-ins
http://affycomp.biostat.jhsph.edu/AFFY2/TABLES.hgu/0.html
• SMU Technical Reporthttp://www.smu.edu/statistics/TechReports/TR344.pdf
• Monnie McGee’s websitehttp://faculty.smu.edu/mmcgee
DAB Workshop 2006 23
ReferencesAffymetrix, Inc.. (2002) Statistical algorithms description document. Affymetrix, Inc. (2005) Technical note: guide to probe logarithmic intensity error (PLIER) estimation.Baldi,P. and Long, A.D. (2001) A Bayesian framework for the analysis of microarray expression data:
regularized t-test and statistical inferences of gene changes. Bioinformatics, 17, 509-519.Bolstad, BM. (2004) Low Level Analysis of High-density oligonucleotide array data: Background, normalization
and summarization [dissertation]. Department of Statistics, University of California at Berkeley.Choe, S.E. et al. (2005) Preferred analysis methods for Affymetrix GeneChips revealed by a wholly defined
control datasets. Genome Biol., 6, R16.1-R16.6.Cope, L.M. et.al. (2004) A benchmark for Affymetrix GeneChip expression measures. Bioinformatics, 20, 323-
331. Hochreiter, S. et al. (2006) A new summarization method for Affymetrix probe level data. Bioinformatics, 22,
943-949Irizarry, R.A. et al. (2003) Exploration, normalization, and summaries of high density oligonucleotide array probe
level data. Biostatistics, 4, 249-264.Irizarry, R.A. et al. (2006) Comparison of Affymetrix GeneChip expression measures. Bioinformatics, 22, 789-
794. Li, C. and Wong, H.W. (2001a) Model-based analysis of oligonucleotide arrays: expression index computation
and outlier detection. Proc. Nat. Acad. Sci., 98, 31-36.Li, C and Wong, H.W. (2001b) Model-based analysis of oligonucleotide arrays: model validation, design issues
and standard error application. Genome Biol., 2, research0032.1-0032.11.McGee, M. and Chen, Z. (2006) New spiked-in probe sets for the Affymetrix HG-U133A Latin Square
experiment. COBRA Preprint Series, Article 5Wu, Z. et.al. (2004) A model-based background adjustment for oligonucleotide expression arrays. J. Am. Stat.
Assoc., 99, 909-917.