Embed Size (px)
Citation preview
THE ECONOMICS OF Bt MAIZE/YIELDGARD PRODUCTION: CASE OF
SMALLHOLDER FARMERS IN THE EASTERN CAPE PROVINCE.
A Dissertation Submitted in Fulfilment of the Requirement for the Degree of Master of
Science in Agriculture (Agricultural Economics)
MANDIKIANA BRIAN W.
Department of Agricultural Economics and Agribusiness
Faculty of Science and Agriculture
University of Fort Hare
Private Bag X1314
Alice, 5700
South Africa
SUPERVISOR: Prof Ajuruchukwu Obi
April 2011
i
DEDICATIONS
This work is dedicated to a remarkable woman, my late sister and friend, “Caroline Vimbai
Mandikiana” zorora murugare. You will always be in my thoughts and memories.
ii
DECLARATION
I, hereby declare that this thesis is my original work, and has not been submitted in partial or
entirety for degree purposes to any other university. All the work that was written by other
authors and used in the thesis is fully acknowledged.
Submitted for the Master of Science degree in Agricultural Economics at the University of
Fort Hare.
31 March 2011
..................................................... ..................................................................
Brian Washington Mandikiana Date
iii
ACKNOWLEDGEMENTS
Financial support is gratefully acknowledged from Prof Ajuruchukwu Obi for his role in
financing the collection of survey data reported in this study. Special acknowledgement goes
to Margaret, Motsi, Faith Mandikiana-Chakuya, Norman Mukaro, Kwindingwi and
Mandikiana families for standing by my side. Your encouragement and support through each
milestone along the road kept me going until the end; your input is much appreciated.
I am grateful to Dr A. Mushunje and Dr P. Muchaonyerwa, Mr S. Mabuza from Monsanto for
helpful suggestions and clarifications. Professor A. Obi, my supervisor whose door always
stood open for guidance and support, I would like to thank you for nurturing me during this
study. You really helped me organize my thoughts; it would have been very challenging
without your help.
To honourable Chief Mdutshane, Flagstaff Department of Agriculture extension officers
especially Mr L. Sikotoyi and all the respondents, I am thankful for your assistance in data
collection. Your contribution made it possible for me to compile this paper, it would have
been impossible without your willingness to cooperate. For data collection and English-
Xhosa translation, I would like to extend my gratitude to Pearl Makasi, P. Tito and B.
Ntshidi. You did an awesome job.
Fellow colleagues and friends you are all superstars, forgive me for not mentioning you by
names because you are many, but I would like to thank you for the moral support that you
provided.
Finally, I would like to thank God for wisdom, knowledge and understanding. I will exalt you
forever.
Thank you, ndinotenda, enkosi!
iv
ABSTRACT
Maize is the staple food for most South Africans. This implies that any damage to the maize
crop will affect food security of many South Africans. Although Eastern Cape Province is not
a traditionally maize producing area, smallholder farmers in the province produce it mostly
for subsistence purposes and some sell the surplus on the local market or use it to secure
other good through barter trading.
In South Africa, insect-resistant Bt maize/yieldgard has been used commercially for
approximately 10 years now. Available impact studies on Bt maize reveal that, this
technology is beneficial not only to farmers but consumers of maize products as well. Welfare
gains as well as positive effects for human health are realised by both groups. Due to the
costs and effectiveness associated with traditional and conventional maize stem borer control
methods, Bt technology has the potential to be part of the solution.
This thesis has attempted to investigate the economic viability of planting Bt maize seeds
under smallholder farming conditions and identify factors as well as perceptions relating to
attributes of Bt maize and to analyze the relationships between those perceptions and choices
regarding use of Bt technology. Data was collected from 90 households who were selected
using purposive sampling through the use of the snowball method. To collect data, a
questionnaire was administered through face-to-face interviews. Gross margin analysis
revealed that Bt maize is a more profitable option as compared to conventional maize seeds.
Furthermore, econometric analyses, through use of the binomial regression model revealed
that perceptions could be used to distinguish between users and non-users of Bt maize seed in
the Eastern Cape Province.
Results of inferential analysis indicate that the statistically significant variables at 5% level
are gene erosion, quality and nutrition of products and food labels for Bt maize products
perceptions. On the other hand, low expenses, seed market availability and farmers’
knowledge perceptions were significant at 10%.
These findings suggest that an adjustment in each one of the significant variables can
significantly influence the probability of Bt maize adoption. In view of the research findings,
several policy proposals are suggested to support policy formulation.
Key words: Bacillus thuringiensis (Bt) maize, yieldgard, smallholder farmers, perceptions,
Flagstaff, gross margin analysis, binomial logistic regression model, Eastern Cape Province.
v
TABLE OF CONTENTS
DEDICATIONS ........................................................................................................................ i
DECLARATION...................................................................................................................... ii
ABSTRACT ............................................................................................................................. iv
TABLE OF CONTENTS ........................................................................................................ v
LIST OF ACRONYMS .......................................................................................................... ix
LIST OF TABLES .................................................................................................................. xi
LIST OF FIGURES ............................................................................................................... xii
CHAPTER 1: INTRODUCTION ........................................................................................... 1
1.1. Background of study ....................................................................................................... 1
1.2. Role of improved maize varieties in South Africa‟s poverty alleviation strategy .......... 3
1.3. Problem statement ........................................................................................................... 7
1.4. Objectives ...................................................................................................................... 10
1.5. Main research questions ................................................................................................ 10
1.6. Hypothesis ..................................................................................................................... 11
1.7. Justification of the study ............................................................................................... 13
1.8. Outline of the study ....................................................................................................... 14
CHAPTER 2: LITERATURE REVIEW ............................................................................ 15
2.1. Introduction ................................................................................................................... 15
2.2. Background of Bt maize ................................................................................................ 15
2.3. The role of technology in agricultural development ..................................................... 16
2.3.1. Induced innovation model ...................................................................................... 17
2.3.1.1. Technical innovation ........................................................................................... 17
2.3.1.2. Institutional innovation ........................................................................................ 18
2.4. Factors shaping smallholder farmers‟ perceptions ........................................................ 19
2.4.1. Economic factors .................................................................................................... 20
2.4.1.1. Food security ....................................................................................................... 20
2.4.1.2. Higher productivity.............................................................................................. 20
2.4.1.3. Higher yields........................................................................................................ 21
2.4.1.4. Cost effectiveness ................................................................................................ 21
2.4.1.5. Farm management ............................................................................................... 22
2.4.1.6. Higher net farm income ....................................................................................... 22
2.4.1.7. Labour saving ...................................................................................................... 23
2.4.1.8. Risk and insurance ............................................................................................... 23
2.4.2. Social factors .......................................................................................................... 25
vi
2.4.2.1. Age....................................................................................................................... 25
2.4.2.2. Household income ............................................................................................... 25
2.4.2.3. Health................................................................................................................... 26
2.4.3. Agronomic factors .................................................................................................. 26
2.4.3.1. Plant biodiversity ................................................................................................. 27
2.4.3.2. Refuge requirements ............................................................................................ 27
2.4.3.3. Incidence of pests ................................................................................................ 28
2.4.3.4. Rainfall pattern .................................................................................................... 28
2.4.4. Institutional factors ................................................................................................. 29
2.4.4.1. Rural finance ........................................................................................................ 29
2.4.4.2. Input supply channels .......................................................................................... 31
2.4.4.3. Price and market liberalization ............................................................................ 31
2.4.4.4. Intellectual property rights ................................................................................... 32
2.5. Public-Private Partnerships ........................................................................................... 34
2.6. Summary ....................................................................................................................... 36
CHAPTER 3: DESCRIPTION OF THE STUDY AREA .................................................. 37
3.1. Introduction ................................................................................................................... 37
3.2. Description of the O. R. Tambo District Municipality ................................................. 37
3.2.1. Location of Flagstaff .............................................................................................. 38
3.2.2. Rainfall pattern ....................................................................................................... 39
3.2.3. Temperature ............................................................................................................ 39
3.2.4. Agricultural potential .............................................................................................. 40
CHAPTER 4: RESEARCH METHODOLOGY ................................................................ 42
4.1. Introduction ................................................................................................................... 42
4.2. Selection of the project area and sample size ................................................................ 42
4.3. Description and analysis of data ................................................................................... 43
4.3.1 Descriptive statistics, non parametric correlation and cross tabulation................... 44
4.3.2. Gross margin analysis ............................................................................................. 44
4.3.3. Binomial logistic regression model ........................................................................ 48
4.3.3.1. Description of the variables specified in the model ............................................ 50
4.4. Data collection............................................................................................................... 56
4.4.1. Questionnaire .......................................................................................................... 56
4.4.2. Checklist ................................................................................................................. 57
4.5. Summary ....................................................................................................................... 57
vii
CHAPTER 5: DESCRIPTIVE RESULTS AND GROSS MARGIN ANALYSIS .......... 58
5.1. Introduction ................................................................................................................... 58
5.2. Demographic and socio-economic characteristics of sample farmers .......................... 58
5.2.1. Gender distribution of household heads ................................................................. 58
5.2.2. Age distribution of respondents .............................................................................. 60
5.2.3. Marital status .......................................................................................................... 61
5.2.4. Household sizes ...................................................................................................... 62
5.2.5. Religious affiliation ................................................................................................ 63
5.2.6. Educational background of respondents ................................................................. 64
5.2.7. Labour supply ......................................................................................................... 65
5.2.8. Employment status (Economic activity) ................................................................. 65
5.2.9. Household income of respondents .......................................................................... 67
5.2.10. Source of capital ................................................................................................... 68
5.3. Land and maize production practices ............................................................................ 69
5.3.1. Farming activities ................................................................................................... 69
5.3.2. Crops and cropping systems ................................................................................... 70
5.3.3. Area under maize and yield .................................................................................... 70
5.3.4. Land tenure ............................................................................................................. 72
5.3.5. Yield loss to maize stem borer ............................................................................... 73
5.3.6. Source of maize seed .............................................................................................. 75
5.3.7. Reason for discontinuing production of Bt maize and trend of disadoption .......... 75
5.3.8. Pest control ............................................................................................................. 77
5.4. Institutional support....................................................................................................... 79
5.4.1. Organisational affiliation ........................................................................................ 79
5.4.2. Intellectual property rights...................................................................................... 82
5.5. Gross margin analysis ................................................................................................... 83
5.5.1. Gross incomes......................................................................................................... 86
5.5.2. Total variable costs ................................................................................................. 86
5.5.3. Gross margin........................................................................................................... 87
CHAPTER 6: RESULTS OF THE INFERENTIAL ANALYSIS .................................... 89
6.1. Introduction ................................................................................................................... 89
6.2. Model empirical results ................................................................................................. 89
6.3. Summary ....................................................................................................................... 93
CHAPTER 7: SUMMARY AND POLICY RECOMMENDATIONS ............................. 95
viii
7.1. Introduction ................................................................................................................... 95
7.2. Summary ....................................................................................................................... 95
7.2.1. Literature review ..................................................................................................... 96
7.2.2. Research methodology ........................................................................................... 97
7.2.3. Descriptive statistics results .................................................................................... 97
7.2.4. Gross margin analysis results ................................................................................. 98
7.2.5. Binomial logistic regression results ........................................................................ 98
7.3. Policy recommendations ............................................................................................... 99
7.4. Areas for further research ............................................................................................ 101
REFERENCES ..................................................................................................................... 103
ANNEXURE: 1..................................................................................................................... 110
ANNEXURE: 2..................................................................................................................... 116
ix
LIST OF ACRONYMS
ABET Adult Basic Education Training
BLR Binary logistic regression
Bt Bacillus thuringiensis
CBOs Community Based Organisations
DoA Department of Agriculture
ECB European Corn Borer
ECDC Economic Development and Cooperation
FAO Food and Agriculture Organisation
GDP Gross Domestic Product
GE Genetically Engineered
GI Gross Income
GM Gross Margin
GMO Genetically Modified Organisms
GURTs Genetic Use Restriction Technologies
IFAD International
IFPRI International Food Policy Research Institute
IPR Intellectual Property Rights
ITPGRFA International Treaty on Plant Genetic Resources for Food and Agriculture
MFIs Microfinance Institutions
NB Net Benefits
NDA National Department of Agriculture
NGOs Non-Governmental Organisations
OECD Organisation for Economic Cooperation and Development
OLS Ordinary Least Squares Regression
PGDP Provincial Growth and Development Plan
PLA Participatory Learning and Action
PRA Participatory Rural Appraisal
S.A. South Africa
SADC Southern Africa Development Cooperation
Sig. Significance
SSA Statistics South Africa
SPSS Statistical Package for Social Sciences
x
Std. Standard
TGVs Transgenic Varieties
TVC Total Variable Costs
xi
LIST OF TABLES
Table Title................................................................................................................... Page
Table 4. 1. Format for summarizing results of GM analysis for maize enterprise .................. 47
Table 4. 2: Variables used in the binary logistic regression model ......................................... 51
Table 4. 3: Summary of research objectives and analytical framework .................................. 57
Table 5. 1: Characteristics of sample farmers .......................................................................... 59
Table 5. 2: Household socio-economic characteristics ............................................................ 67
Table 5. 3: Relationship between household income and adoption ......................................... 68
Table 5. 4: Area under maize and yield ................................................................................... 71
Table 5. 5: Relationship between yield loss and adoption ....................................................... 74
Table 5. 6: Sources of maize seed ............................................................................................ 75
Table 5. 7: Reason for discontinuing production of Bt maize ................................................. 76
Table 5. 8: Usage of pesticides ................................................................................................ 77
Table 5. 9: Insect and pest management methods (IPMs) ....................................................... 78
Table 5. 10: Organisational affiliation of respondents............................................................. 80
Table 5. 11: Assisting organisations and support services ...................................................... 81
Table 5. 12: Challenges faced by smallholder farmers ............................................................ 82
Table 5. 13: Gross margin analysis for adopters of Bt maize .................................................. 84
Table 5. 14: Gross margin analysis for non-adopters of Bt maize........................................... 85
Table 5. 15: Summary of financial performance comparison .................................................. 88
Table 6. 1: Binary logistic results for adoption or non-adoption of Bt maize seed ................. 91
xii
LIST OF FIGURES
Figure Title Page
Figure 3. 1: Map showing location of Flagstaff ....................................................................... 37
Figure 3. 2: Average monthly rainfall (mm) ............................................................................ 39
Figure 3. 3: Map showing District Municipalities of the Eastern Cape Province ................... 41
Figure 5. 1: Gender of household heads .................................................................................. 60
Figure 5. 2: Age of household heads ....................................................................................... 61
Figure 5. 3: Marital status of respondents ................................................................................ 62
Figure 5. 4: Religion of sample farmers .................................................................................. 63
Figure 5. 5: Education of sample farmers ................................................................................ 64
Figure 5. 6: Employment status of household heads ............................................................... 66
Figure 5. 7: Source of capital ................................................................................................... 68
Figure 5. 8: Distribution according to farming system ............................................................ 69
Figure 5. 9: Distribution of farm size....................................................................................... 71
Figure 5. 10: Land tenure ......................................................................................................... 72
Figure 5. 11: Level of yield loss .............................................................................................. 74
Figure 5. 12: Decline of Bt maize production by season ......................................................... 76
Figure 5. 13: Source of pesticides ............................................................................................ 79
Figure 5. 14: Reason for affiliation .......................................................................................... 80
1
CHAPTER 1: INTRODUCTION
1.1. Background of study
White maize is the staple food throughout Southern Africa. However, in almost all of the
Southern Africa Development Community (SADC) countries maize is cropped on a
commercial basis except in Mauritius and Seychelles (Cutts & Hassan, 2003). There are
approximately 3 million communal or subsistence farmers in South Africa who, with their
dependents, rely on maize for survival (Keetch, Webster, Ngqaka, Akanbi & Mahlanga,
2005). According to Keetch et al. (2005), maize production in South Africa is hampered by
infestation of the stalk boring insects, Busseola fusca. Genetic modification to offer resistance
to this scourge was therefore identified as part of a broader food security strategy since a
decade ago (Hofs, Fok & Vaissayre, 2006). De Groote et al., (2004) defined genetically
modified organisms (GMO1s) as organisms with manipulated gene mechanisms through use
of biotechnology to introduce new, or alter existing characteristics in order to give the new
crop desired traits such as frost resistance, insect or disease resistance and higher yields.
South Africa‟s average yield of maize is consistently higher than that of most countries in the
region. In 1999, it produced 43 % of the total maize produced in the SADC region (Cutts &
Hassan, 2003). Therefore, any disease or pest that affects maize poses serious threats to food
security in the country and the SADC region as a whole. However, according to Gouse, Pray,
Schimmelpfennig and Kirsten (2006), South African incurs maize crops yield losses due to
the African maize stem borer Busseola fusca which amounts to an estimated average of 10
percent. This translates to an average annual loss of about one million tonnes of maize which
are valued at approximately US$ 130 million. FAO (2011) indicates that the current total
commercial maize production in South Africa increased by about 6 percent over last year‟s
output, to 12.8 million tonnes for the 2010/2011 season. On the other hand, the subsistence
sector production is estimated at 605 864 tonnes, marking a 17 percent increase compared to
the previous season‟s harvest, primarily due to increase in yields. Delmer (2005) argues that
in countries where costs of pesticides are prohibitive for the poorest farmers, the benefits are
obtained through yield increases when pests are controlled through Bt or yieldgard2
1 In this study the term GMO will be used interchangeably with GM and GE.
2 Yieldgard is technology that protects maize throughout the season from damage caused by maize stalk borers.
3 Transgenetic varieties (TGVs) are the same as genetically modified organisms (GMOs) which implies Bt
maize is classified as a (TGV) as well. 4 Massive Food Program is a rural economic development initiative that targets grain food production through
2 Yieldgard is technology that protects maize throughout the season from damage caused by maize stalk borers.
2
technology. This suggests that approval of genetically modified maize crucially helps
improve livelihoods of smallholder farmers.
South Africa is the first country in the world to introduce genetically modified (GM) crops to
the small-scale farming sector and is also one of the few developing countries in Africa that
have adopted biotechnology inputs mainly maize and cotton seeds (Hofs, Fok & Vaissayre,
2006). Agricultural biotechnology has over the past decade demonstrated that it can bolster
food production levels. According to Meese (2007), transgenic varieties (TGVs3) account for
approximately 92% of South Africa‟s cotton and 29% of maize. Bt maize is maize that has
been genetically modified to express the cry 1Ab gene that confers resistance to a number of
major Lepidopterian pests, especially the stem borer complex (Keetch et al., 2005). Hence
varieties of maize with the toxin gene from Bacillus thuringensis (Bt) can help significantly
fight against stalk borer infestations.
Gouse (2003) reported that there was substantial evidence that farmers in many different
locations and conditions could benefit from planting insect-resistant Bt maize. However,
benefits are mostly realised during periods of high stem borer infestation and growing Bt
maize in locations or years where maize stem borers are not a problem would not be
profitable (Gouse et al., 2006). A study conducted in the United States by Marra, Pardey and
Alston (2002) revealed that there were major benefits in terms of increased yields even when
maize stalk borer infestation levels were not great enough to control with insecticides.
According to Kirsten and Gouse (2003) small-scale farmers who spray pesticides frequently
risk exposure to the chemicals because they use unsuitable equipment and or fail to use the
protective clothing. Keetch et al. (2005) argues that most small-scale farmers do not control
stalk borers because of difficulty of detecting damage caused by stalk boring insects;
unpredictability of likelihood of heavy infestations; lack of the necessary time and skill for
monitoring the fields several times and that, conventional chemical treatment is expensive.
Results from a study conducted in the Makhatini flats in KwaZulu-Natal by Hofs et al. (2006)
show that large-scale farmers found cost saving on pesticide application and peace of mind
as the major benefits of using GM crops, whereas, small-scale farmers indicated saving on
pesticides and yield increases as the major benefits and reasons for adoption. Makinde,
3 Transgenetic varieties (TGVs) are the same as genetically modified organisms (GMOs) which implies Bt
maize is classified as a (TGV) as well.
3
Webster, Khumalo and Keetch (2007) note that proponents of GM crops perceive that
countries can benefit by:
Realizing increasing crop productivity and thus contributing to food security with
benefits to producers, consumers and society at large;
Conserving biodiversity as a land-saving technology capable of higher productivity
thereby reducing deforestation and protecting biodiversity in the environment;
Enabling the efficient use of external inputs thereby contributing to a safer
environment and more suitable agricultural systems;
Increasing stability of productivity and production to reduce suffering during famine
due to biotic and abiotic stress particularly drought, which is the major constraint to
increased productivity;
Improving economic, health and social benefits, food security and alleviating poverty,
hunger, malnutrition for the rural population dependent on agriculture in developing
countries.
Although there are benefits derived from GM technology, critics highlight that there would
be loss of biodiversity through contamination of non-GM varieties of plants through pollen
drift (ICMR, 2004). In addition, farmers fear losing access to the European market, not only
for commodities that have been genetically modified, but also for those that have not been
modified. Negative effects of the technology on non-target organisms, for example insects
and soil dwelling organisms, are not understood. A survey conducted by Viljoen, Dajee and
Botha (2006) on GMOs revealed presence of products of genetic modification in most food
stuffs on the market, with maize products inclusive. The effects of genetically modified
maize on human health have not been ascertained despite the fact that since the 2001/2002
season, South Africa has been producing white Bt maize for human consumption. The
Massive Food Programme4 is promoting the use of Bt maize seed from Monsanto seed
company in the Eastern Cape Province.
1.2. Role of improved maize varieties in South Africa’s poverty alleviation strategy
4 Massive Food Program is a rural economic development initiative that targets grain food production through
subsidizing input supplies, mechanization, marketing and agro-processing by means of a conditional grant
scheme.
4
The Green Revolution of the 1960s demonstrated that technological change in agriculture can
be a powerful force in reducing poverty. When dealing with issues of poverty alleviation it is
imperative to define poverty. Saunders (2004) defined poverty as the inability of individuals,
households or communities to command sufficient resources to satisfy a socially acceptable
minimum standard of living. Generally, poverty is viewed merely as income insufficiency.
However, it includes lack of adequate food, employment, lack of access to assets as well as
social exclusion. This concurs with the definition given by the Department of Social
Development (2009). The definition of poverty further points out that poverty is multi-
dimensional. This means that there exist many strategies in addressing it. In this section, the
socio-economic importance of improved maize varieties is highlighted and a link on how
they act as one of the many ways to fight poverty is established.
Poverty in South Africa is inter-generational and structural, with economic, social and
political dimensions. The Provincial Growth and Development plan (PGDP) states that
poverty eradication is only possible if the underlying structural causes of poverty are
addressed through i) Greater control over and access to decision-making processes by poor
people; ii) Poverty reduction initiatives that address the income, asset and skills capabilities
of the poor; and iii) Linkages between the micro and macro levels of intervention in a
mutually-reinforcing manner (Department of Social Development, 2009). In addition, the
National Department of Agriculture places strong emphasis on rural poverty reduction.
Strategies proposed to tackle the issue of poverty include the following;
an improvement in rural infrastructure, with the aim of giving rural or
resource-poor farmers better access to markets, transport, water and electricity,
employment opportunities within agriculture for the poor.
The latter can be interpreted either as the creation of employment opportunities within the
commercial farming sector by encouraging commercial farmers to increase employment
levels or the creation of new business opportunities for small farmers through a process of
land restitution. The Eastern Cape Province poverty rate of 68.7% is the highest in the
country and well above the national average, while the ultra-poverty rate is 45.5%. According
to the Department of Social Development (2009) the rural poverty rate estimated was at
82.2% compared to 42.1% in urban areas in 2009. This implies that, poverty is more
predominant in the rural areas. Besides, the poverty rate is also much higher among
5
agricultural households (80.3%) than non-agricultural households (65.9%). This implies that
the creation of economic opportunities aimed specifically for poor households to earn
improved incomes through jobs or self-employment are critical.
In South Africa, Eastern Cape Province ranks as one of the poorest provinces with a
predominantly rural population. Besides that, over 70% of all poor people reside in rural
areas and nearly half of these are chronically poor (Cousins, 2004). This indicates that rural
poverty in a major problem in South Africa although according to Saunders (2004), it is has
great agricultural potential. Although they are poor, most of the households spend more than
half of their available income on maize (Gouse et al., 2006). Therefore, use of improved high
yielding maize varieties such as Bt maize help increase disposable income of these poor
households. However, Baiphethi and Jacobs (2009) note that, in South Africa households are
moving from engaging in agricultural production as a main source of food to subsistence
production as a means of supplementing market purchases. On the other hand, in a study
conducted by Mugo et al. (2005) in Kenya, it was discovered that poor families benefited
from planting Bt maize which is an effective way of fighting stem borers that cause serious
problems in maize production. This suggests that smallholder farmers in South Africa are
also likely to benefit from planting improved maize varieties.
Maize (Zea mays) is a plant of enormous modern-day economic importance. Maize plays a
vital role in food security for many poor households and is a critical food and cash crop with
a per capita consumption of over 100 kg. Besides mealie meal, maize is used to produce
maize oil, starch and sweeteners which are common ingredients in many processed foods
such as breakfast cereals and dairy goods, and only a small amount is used for direct
consumption. In the European Union, as much as 80 percent is also used for animal feed and
20% for human consumption (Wesseler, Scatastra & Demont, 2006). On the other hand, the
increased volatility in fuel oil prices has resulted in much research on the fermentation of
maize to produce ethanol used to run car engines. This implies maize has three possible uses;
namely food for human consumption, feed for livestock and as raw material for industry.
Hence, maize is a crop of high economic importance as shortage in supply due to pests, could
have serious consequences for issues of food security and energy.
In South Africa, smallholder farmers are accustomed to planting white maize as human food
(Thirtle et al., 2003, p. 718). As much as 75% of harvested maize grain is stored for
6
household consumption and chicken feed, which is indicative of the level of poverty in the
region. Some smallholder farmers cannot afford milling costs and use a hammer mill or crush
their grain in a traditional way to consume the maize as samp (stampmielies) with beans or
with milk (amarhewu). Faced with this challenge, smallholder farmers use old hand mills for
milling maize into different degrees of fineness (Gouse, Piesse & Thirtle, 2006). According
to Gouse et al. (2006) a generally accepted rule of thumb commonly used for planning
purposes, a household of seven people in a rural area needs about 1480 kg bags of maize
meal per year for household consumption. Against the backdrop of increasing prices of food,
subsistence production is important to improve household food security. This will reduce
dependence on market purchases, especially among the rural poor, as they can exploit natural
resources for food or to generate income.
South Africa is a net exporter of maize with the Republic of Korea as its number one
importer of maize, importing 300 313 tonnes per annum. Like several other African
countries, maize is the primary staple food in South Africa (FAO/GIEWS, 2011). Current
estimates by FAO/GIEWS (2011) indicate that South Africa is expected to export
approximately 1.7 million tonnes of maize in 2011. The latest estimates for maize exports are
lower than initial figures forecast at the beginning of the marketing year, due to better than
anticipated maize production in South Africa‟s traditional importers. This implies that South
African farmers will earn lower prices for their crop. South Africa is the SADC region‟s main
surplus producer and exporter of maize. Maize contributes approximately 35% to the gross
value of South Africa‟s field crops, and the average annual gross value of maize for the past
five years amounts to R5.481 million (Chabane, 2002). About 130 million hectares of maize
are grown worldwide with an annual production of 450.4 million tonnes of grains and an
average yield of 3.5 tonnes per hectare. In South Africa, maize is mostly grown in Gauteng,
Mpumalanga, North-West Province and the Free State at large-scale basis (Chabane, 2002).
South Africa produces both white and yellow Bt maize. In Africa the production and
consumption of maize exceeds that of other cereals such as wheat or sorghum. Today maize
has become Africa's most important staple food crop and is grown by both large and small-
scale farmers. The developing countries have more area given to maize cultivation than
developed countries, but yield in the latter is about four times higher. Over the past five years
there has been a swing towards the production of white maize. The present ratio of
production is 71% white and 29% yellow maize (Keetch et al., 2005).
7
However, the smallholder agriculture sector‟s productivity is known to be very low, and thus
there is a need to significantly improve the productivity of the sub-sector if it is to achieve a
significant impact on food security (Baiphethi & Jacobs, 2009). However, of special interest
is the growth in acceptance of Bt white maize, an important staple food in South Africa.
According to Huesing and English (2004) Monsanto Seed Company estimates that 50% of
both white and yellow maize crops will be Bt maize by the year 2010. In 2003, Bt maize
varieties accounted for 3% of the harvest and were estimated to account for about 8% and
16% of the 2004 and 2005 harvests. Unlike the United States, in Argentina and South Africa
the technology fee charged for Bt maize production is considerably lower which implies that
farmers in both countries stand a chance to reap overall economic benefits (Wu, 2006).
Therefore, in South Africa introduction of Bt maize in the smallholder farming sector of the
Eastern Cape Province is likely to benefit with improved household food supply and on farm
incomes. This is in line with Government policy of food security and poverty eradication.
However, according to De Grassi (2003) it is difficult to conclude that Bt maize is poverty
focused. Besides stalk boring insects, farmers may well be more concerned by other
agronomic problems such as erratic rains, low soil fertility, fake seeds, storage, other pests,
lack of credit and lack of farm tools. The main sources of food for households are markets,
subsistence production and transfers from the public programmes or other households (De
Grassi, 2003). Looking at food security as being first and foremost a problem of access to
food, subsistence food production is the best readily available route to entitlement; directly to
the food producers and indirectly by driving down food prices.
1.3. Problem statement
In South Africa production of maize is hampered by a number of factors including infestation
of the stem boring insects. Stem borers are mainly African species that have moved over to
maize from related grasses. The most important of these are the maize stem borer, Busseola
fusca. According to Keetch et al. (2005) stem borer damage may reduce yields within the
range of 10 to 45% depending on the levels of infestation in a geographical location.
However, research has established that the Cry 1Ab gene in Bt maize has the potential to
increase yields by 5% in the temperate maize growing areas and 10% in the tropical areas of
Kenya (Mugo et al., 2005). Besides, Brookes and Barfoot (2005) found that Bt maize
producing countries in the European Union, such as Spain also reap yield benefits. However,
food production has continued to lag behind population growth. Stem borers have been
identified as one of the most destructive pests limiting maize productivity gains. Kenya alone
8
suffers crop losses due to stem borers that are estimated at 13.5 % of the harvest, amounting
to 400 000 tonnes of maize with a value of US $90 million (De Groote, 2002). Despite the
devastating effects of the pest, cash and labour constraints restrict the use of insecticides by
smallholder farmers. In addition, the resulting damage to the cob creates an environment
suitable for secondary fungal infection that in turn can lead to the production of mycotoxins5
– fungal toxins that are known to cause adverse medical problems such as cancer in people
that consume the contaminated product (Pray, Rheeder, Gouse, Volkwyn, van der
Westhuizen & Shephard, 2009). However, most small-scale farmers do not control stalk
borers because of the following reasons:
The damage caused by the caterpillars is hidden and difficult to detect;
Heavy infestations are unpredictable;
Checking the fields multiple times each summer takes time and skill;
It is difficult spraying in windy and wet conditions; and
High costs of conventional and organic chemical treatment.
On the other hand, smallholder farmers that spray pesticides, often risk their health due to
exposure to the chemicals as they use unsuitable equipment and/or fail to use protective
clothing.
Available evidence indicates that the current genetically modified crops can be beneficial to
small as well as large farmers. Bt maize contains a gene from the soil bacterium Bacillus
thuringiensis, which encodes for formation of a crystal (Cry) protein that is toxic to maize
stalk borer. When insect pressure is high, it is predicted that Bt maize crops will
economically outperform conventional crops, based on the cost of chemicals and their
application in most geographic locations. Since the 2001/2002 season, South Africa has been
producing white Bt maize for human consumption. According to Pray et al. (2009) Bt maize
has proved to be a safe and effective product, having undergone rigorous testing for food and
feed safety, providing environmentally friendly and effective control of targeted pests, with
resistance durability extending beyond seven years. The benefits of genetically modified
crops vary according to circumstances. In South Africa, Kenya and India, where costs of
pesticides are prohibitive for the poorest farmers, the benefits are more clearly seen in
5 Wu (2006) defines mycotoxins as toxins produced by fungi that colonise plants.
9
substantial yield increases when pests are controlled through Bt technology. In China, where
yields of conventional cotton and rice are maintained through heavy use of pesticides, the
benefits are in savings on the costs of these inputs and on the health of workers from
pesticide poisoning and protection of the environment through the use of fewer chemicals
(Delmer, 2005).
Traditionally, farmers have always saved their resilient traditional seeds from season to
season. During the 2004/2005 season however, Monsanto Seed Company convinced
traditional leaders in South Africa to abandon their traditional seeds in favour of its patented
pesticide-producing Bt maize by using an extensive and multimedia conference-style
marketing campaign entitled “iyasihluthisa” (the Xhosa word for "it fills our stomachs").
Though Eastern Cape has high diversity of „indigenous‟ maize varieties, the campaign
resulted in the proliferation of Bt maize seed (Wells, 2004). Furthermore, due to farm size
and also lack of information, smallholder farmers play a vital role in the containment of seed
contamination and crosspollination between Bt and non-Bt maize fields.
It should not be overlooked that a fierce debate continues over the potential of genetically
modified crops to solve the problems of hunger in the developing world. The parties involved
at one extreme argue that these new technologies are part of the solutions available to solve
hunger, whereas the other extreme argues that the technologies are unsafe to both humans
and the environment and are being promoted simply as a means to further the interests of the
large multinational companies that market them.
A number of documents on Bt maize have focused mostly on its use in the commercial
farming sector. However, there is a vast difference between what happens in the fields of a
farmer growing just one or two different crops on 100 hectares and another growing many
more different crops on 1 hectare. In most cases, the former will use seed varieties developed
from highly inbred lines adapted to temperate climates, sophisticated agronomic practices,
and optimal amounts of fertilizer and pesticides and, at least in most years, will operate with
reliable and adequate rainfall. On the other hand, the latter may grow many different crops
that will minimize her risk, growing for example some maize and beans in case rainfall will
be plentiful. Cost considerations will prevent the smallholder farmer from using even
marginally acceptable levels of fertilizer or pesticides. In addition the risk of purchase can
often be considered too high for a poor farmer who is also burdened with excessive fertilizer
10
prices and unpredictable rainfall when technology fees for genetically modified (GM) crops
are added on. This implies need to assess the cost and the benefits associated with the use of
Bt maize so that farmers and policy makers can make well informed choices.
According to Keetch et al. (2005), ways of minimizing risk such as microcredit and/or two-
tiered pricing schemes for smallholder farmers need to be investigated. Furthermore, Delmer
(2005) notes that there is slow growth of seed markets for poor farmers therefore expecting
the larger private-sector companies to spend much in the short term to optimize their products
for small-farm environments would not be realistic. This suggests that the institutional
environment is an important part when assessing ways to spread the adoption and eventual
dissemination of Bt technology in the smallholder farming sector.
With these arguments at hand, the focus of this project is assessing the worth of Bt maize as
one of many approaches available to solve rural hunger through increased yields, increase
household incomes and spurring smallholder farmers to move from growing for subsistence
to commercialization in Eastern Cape Province. This study also investigates the extent to
which economic, social, agronomic and institutional factors affect smallholder farmers‟
decision to adopt Bt maize in the Eastern Cape Province.
1.4. Objectives
The main objective of this project is to evaluate the worth of Bt maize as one of many
approaches available to improve smallholder farmers‟ livelihoods and solve rural hunger
minimizing exposure to hazardous chemical pesticides, increased yields, increased household
incomes and spurring smallholder farmers to move from growing for subsistence to
commercialization in Eastern Cape Province. This study also investigates the extent to which
economic, social, agronomic and institutional factors affect smallholder farmers‟ decision to
adopt Bt maize in the Eastern Cape Province. To achieve this, the following sub-objectives
will be attained:
1. To investigate the popularity of Bt maize amongst smallholder farmers.
2. To investigate present maize-based farming systems of smallholder farmers.
3. To study cost and returns of Bt maize production.
4. To identify the economic, social, agronomic and institutional factors influencing
adoption patterns and diffusion of Bt maize amongst smallholder farmers.
11
1.5. Main research questions
The research seeks to address the following questions:
1. How popular is Bt maize amongst smallholder farmers?
Sub-questions
How many farmers grow Bt maize in the sample population?
What factors affect the popularity of Bt maize in the smallholder farming sector?
2. In what way do smallholder farmers in the Eastern Cape Province produce maize?
Sub-questions
What size are the maize fields, do they irrigate or depend on rain, do they apply
fertilizers and pesticides and in what amounts?
What best practice farming methods are available to enable smallholder farmers to
segregate Bt and non-Bt crops?
3. What are the costs and returns associated with adopting Bt maize seeds?
Sub-questions
Do smallholder farmers earn profits or loss through growing Bt maize?
Besides profits what are the other economic, social, agronomics benefits smallholder
farmers enjoy through use of Bt maize.
1.6. Hypothesis
The main hypothesis of the study is that smallholder farmer perceptions, socio-economic,
agronomic and institutional background, costs and returns associated with adoption of Bt
maize influences their choice of maize seed. The perceptions held and extents to which they
affect farmers differ from environmental settings and from farmer to farmer within an area.
Generally, farmers who hold fewer negative perceptions are more likely to adopt Bt maize.
Economic, social, agronomic and institutional factors that shape smallholder farmers‟
perceptions are reflected in adoption decisions. This implies that the fewer the negative
perceptions, the higher the likelihood to adopt Bt maize amongst farmers, and vice versa.
12
Perceptions are mainly rooted in information availability and in turn awareness, resource
accessibility and household characteristics. The actual economic, social, agronomic and
institutional factors that comprise the perceptions are regarded as the specific hypotheses, and
these will be tested in order to investigate the extent to which perceptions influence adoption
of Bt maize.
Specific hypotheses:
The cost of Bt maize seed has a negative influence on its adoption by smallholder
farmers.
Bt maize seed comes along with extra technology fee that makes it more expensive in
comparison with conventional seed. This implies that profitability of growing Bt maize has
an influence on smallholder farmers about how they perceive purchasing Bt maize seed over
conventional maize seeds.
Farm size affects adoption of Bt maize.
A user guide prepared by Monsanto Seed Company stipulates that farmers are supposed to
separate Bt maize crops and conventional maize crops with distance of 200m. This implies
that a sizeable portion of the small farmers‟ holdings are devoted to Bt maize, hence making
it a less lucrative seed variety in the case of smallholder farmers.
The educational level of farmers influences adoption of Bt maize
Education allows correct interpretation of market information by farmers. Smallholder
farmers with higher educational levels are more likely to make well informed decisions than
those with lower education levels. Education allows farmers to adapt to market changes
easily and take advantage of opportunities that are brought about with new technology. The
education level is measured by the highest educational level attained by the farmer and
proficiency to communicate using international languages.
Terminator technology which comes with Bt maize seed has a negative impact on
adoption and diffusion of Bt maize.
The fact that most smallholder farmers are used to saving part of the previous season‟s grain
for replanting the following season makes Bt maize seed less attractive for smallholder
farmers. In addition to this, smallholder farmers face challenges in securing credit to purchase
13
inputs for production hence planting a maize variety that challenges them to use larger sums
of money is less lucrative.
Institutional support influences decisions to adopt Bt maize
The more the institutional support provided to the farmers, the higher the awareness level,
ceteris paribus. Farmers receiving institutional support are more likely to be aware of the
existence of Bt maize because the support they receive allows them to acquire information
from the institutions. In other words, farmers receiving institutional support are aware of the
existence and attributes of Bt maize. Farmers receive formal institutional support from either
governmental organizations, non-governmental organizations (NGOs), or farmer group
organizations.
The incidence of stalk borers in different geographic locations has an influence on
adoption.
Gouse et al. (2006) note that farmers incur yield loss of 5 – 75% range due to damage caused
by African maize stem borer Busseola fusca. In an area were the dominant insect problem on
maize is stem borers, smallholder farmers have an incentive to adopt Bt maize. Hence, Bt
maize can act as insurance against yield losses.
1.7. Justification of the study
Evaluating the economic importance of Bt maize that is resistant against the maize stem borer
worm is significant in the South African maize production industry as a whole, because South
African farms are constantly under attack by this pest. Better protection against the maize
stalk borer yields immense benefits for the smallholder farmer in terms of profit, higher
yields, an opportunity to increase the scale of production, less exposure to toxic chemicals as
well as for the consumer who enjoys lower prices and a steadier supply of maize. Besides the
points in favour of Bt maize noted above, the other extreme views Bt maize as a tool
employed by large multinational seed companies to exploit smallholder farmers with adverse
consequences for biodiversity.
If smallholder farmers are faced with a situation where they have to make a trade-off, it is
important to look at the benefits that come with such a change. At a macro-economic level,
the advocates of biotechnology predict that genetically modified crops are the answer in
feeding the rural poor through higher yields and using less herbicides and pesticides and
14
hence promoting food security. In the Bt maize context it is critical that the issues
surrounding its adoption following be scrutinised.
This study provides a basis for strategy formulation to educate farmers and other stakeholders
such as government officials about benefits and potential negative effects of genetically
modified crops. In addition, it is important that the role of institutions such as an effective
extension service and financial support is investigated in order to experience the full potential
of Bt maize. To sum up, if stakeholders are clearly informed they will be induced to invest
locally thus increasing living standards and finances of workers therefore improving poverty
alleviation.
1.8. Outline of the study
The thesis comprises seven chapters. The second chapter investigates the economic, social,
agronomic and institutional factors that influence the adoption of Bt maize in the smallholder
farming community. The third chapter gives an overview of the study area in terms of its
geographical location and the main agricultural and other productive activities. In the fourth
chapter, the methodology is presented. The chapter explains the sampling procedure, data
collection procedure and the variables collected. It further clarifies the method of data
analysis, pointing out the reasons for choosing such analytical methods. Chapter five presents
the research results on the socio-economic characteristics of the respondent, maize based
production systems and gross margin analysis. In chapter six, results of the empirical analysis
are presented. Finally, chapter seven presents the summary, recommendations and draws
conclusions.
15
CHAPTER 2: LITERATURE REVIEW
2.1. Introduction
This chapter reviews literature in an effort to explore the current issues surrounding
production of Bt maize by South African smallholder farmers. The issues reviewed include
the economic importance of Bt maize, poverty in the Eastern Cape Province, role of
technology in agricultural development, incentives to adopt Bt maize, its agronomic effects,
agrarian reform, intellectual property rights and how to forge public-private partnerships to
promote adoption of such technology. These issues are central when implementing various
policies related to Bt maize production. The chapter starts with a brief background discussion
of Bt maize. It goes further to highlight the role played by agricultural technology
development in the economy. Much emphasis in this section is devoted to the induced
innovation model. The next section focuses on smallholder farmers‟ incentives to adopt Bt
maize. In the following section, a discussion focusing on agronomic issues associated with
adoption of Bt maize is given. Then issues surrounding the agrarian reform and its link with
Bt maize production are highlighted. In the second last section, matters of intellectual
property rights are discussed. However, the chapter closes with a section focusing on how
public-private partnerships that bolster technology development can be forged.
2.2. Background of Bt maize
It is important to give an overview of Bt maize production since this study focuses on Bt
maize adoption. Organic farmers employ commercial preparations of the naturally occurring
soil bacterium, Bacillus thuringiesis (Bt), for their farming activities due to their capacity to
act as pesticides. The bacterium produces proteins that are toxic for a wide range of insect
species. When genes of Bt are inserted into maize seeds they allow plants to produce Bt
proteins that capacitates them to have dominion over insects such as Bussiola fusca (Keetch
et al., 2005). Hence Bt crops offer farmers a new tool for increasing agricultural productivity
and better pest control, thus reducing their reliance on more hazardous conventional
pesticides (Hurley, Barcock & Hellmich, 2001).
Genetically modified (GM) maize was introduced in 1997 to the South African agricultural
sector by multinational seed companies. However, during the 2003/2004 planting season,
16
there were thirteen yellow and six white GM maize hybrids grown in all the major local
cultivation areas (Haasbroek, 2004). According to Mugo, De Groote, Bergvinson, Mulaa,
Songa and Gichuki (2005), the Cartagena Protocol on Bio-safety6 emphasizes the need to
protect human health and the environment from possible adverse effects of products of
modern biotechnology. This suggests that it is imperative for South Africa to adhere to bio-
safety requirements to ensure that both the health of consumers and a safe environment are
not compromised. However, South African consumers generally consider other
characteristics such as food safety and bacteria or other contamination to be relatively
important compared to GMO content. Hence, most consumers express confidence in South
Africa‟s regulatory agencies‟ ability to ensure food safety (Kirsten & Gouse, 2003; Viljoen et
al., 2006).
In a study which stretched for three years, conducted in South Africa by Gouse et al. (2006) it
was found that farmers could benefit from the use of insect-resistant white Bt maize. Benefits
of Bt maize range from the potential to substantially increase yields, increase income for
farmers, improve the health of the farm workers by reducing their exposure to pesticide
poisoning, and also reduce oesophageal cancer caused by mycotoxins in maize (Gouse et al.,
2006).
Although Bt maize presents advantages, it also comes along with demerits. Kirsten and
Gouse (2003) revealed that maize producers are faced with fears of changes in biodiversity.
In addition, Brookes (2002), note that consumer acceptance is one of the risks which can be
faced by producers. Besides that, the high yield obtained can drive farmers to reduce the
acreage cultivated if there are no consumers for the surplus production.
There are many factors influencing the perceptions of farmers towards Bt maize crops. In this
study, factors which shape the perceptions of both large-scale farmers and small-scale
farmers are assessed. These factors are discussed separately in sections which include
economic, social, agronomic and institutional factors below.
6 The Cartagena Protocol on Biosafety to the Convention on Biological Diversity is an international agreement
which aims to ensure the safe handling, transport and use of living modified organisms (LMOs) resulting from
modern biotechnology that may have adverse effects on biological diversity, taking into account risks to human
health.
17
2.3. The role of technology in agricultural development
About three quarters of the world‟s poor people live and work in rural areas. Apart from its
direct role in sustaining incomes and employment, the role of agriculture and in particular
technological change in agriculture, in stimulating overall economic growth has been much
discussed by economists and policymakers. Raising productivity in agriculture can directly
increase the incomes and employment levels of the majority of poor people dependent on
agriculture. It can also help to reduce food prices (relatively or absolutely) for poor people in
both rural and urban sectors. In developed countries changes in technology and institutions in
the agricultural sector are regarded as having been instrumental in the industrial revolution.
Biotechnology applications provide potential contributions to sustainable agricultural
productivity and new inputs for poor and/or small-scale farmers in developing countries
(Huang, Rozell, Pray & Wang, 2002; Morris & Hoisington, 2000; OECD, 2003; Thirtle,
Beyers, Ismael & Piesse, 2003).
2.3.1. Induced innovation model
2.3.1.1. Technical innovation
Technology is a prerequisite for sustainable agricultural development. The surge in the
number of poor people, especially in the rural agricultural sector in the developing countries
of Asia and Africa, is at least partly linked to non-availability of appropriate, affordable and
accessible technologies of even a rudimentary nature. The majority, particularly in Africa, are
restricted to resource-extractive primitive farming practises, and thus condemned to a life of
perpetual low productivity, poverty and hunger. They also degrade the already complex,
risk-prone, and ecologically sensitive lands they cultivate because basic inputs such as
fertilisers, water, and tillage implements are not accessible (Raman, 2006: 399).
The levels achieved in each productivity groupings by farmers in the most advance countries
can be viewed as arranged along a productivity frontier. This frontier reflects the level of
technical progress achieved by the most advanced countries in each resource endowment
classification. These productivity levels are not immediately available to farmers in most
low-productivity countries. This concurs with Zilberman et al. (2007) who argue that due to
the prevailing economic and environmental conditions the same technology may have
different impacts in different locations. Ruttan and Hayami (1984) goes on to note that they
can only be made available by undertaking investment in the agricultural research capacity
18
needed to develop technologies appropriate to the countries‟ natural and institutional
environments and investment in the physical and institutional infrastructure needed to realise
the new production potential opened up by technological advances. New technologies
embodied in new crop varieties may not always be substitutes per se for land or labour.
Rather they are catalysts which facilitate the substitution of relatively abundant factors for
relatively scarce factors.
2.3.1.2. Institutional innovation
A developing country which fails to evolve a capacity for technical and institutional
innovation in agriculture consistent with its resource and cultural endowments suffers two
major constraints on its development of productive agriculture. Firstly, it is unable to take
advantage of advances in biological and chemical technologies suited to labour intensive
agricultural systems. Lastly, the mechanical technology it does import from more developed
countries will be productive only under conditions of large-scale agricultural organisation.
The lag in shifting from a natural-resource based to a science based system of agriculture
continues to be a source of national differences in land and labour productivity. Lags in the
development and application of knowledge are also important sources of regional
productivity differences within countries. For instance, in Mexico and India differential rates
of technical change have been an important source of the widening disparities in the rate of
growth in total agricultural output, in labour and land productivity and in incomes and wage
rates among regions.
Technical change requires the acquisition of new husbandry skills; acquisition from non-
traditional sources of additional sources such as new seeds, new chemicals and new
equipment; and development of new skills in dealing with both natural resources and input
and product market institutions linking agriculture with non-agricultural sector. This implies
that Bt maize could make a substantial impact in poverty reduction since poor families have
higher food expenses (Ruttan & Hayami, 1984).
De Grassi (2003) suggested that, if Bt maize provides protection against pests poor farmers
could gain by adopting the technology, but adopting the technology will depend upon
reforming seed systems that currently fail to reach the poorer, marginal farmers. A conscious
effort to improve these conditions can lead to substantial improvements in poverty and food
19
security, and possibly create further opportunities for employment and income. Technology
for the poor has to be affordable, appropriate and accessible especially in the case of small
family enterprises, because their resources to invest in technology are limited and it is
necessary for them to survive on tight margins in risky environments (Raman, 2006: 399).
The extent that this potential will be realised depends on implementation of policies and on
institutions that aim to enhance adoption. Even though the estimated gains are impressive,
they only make a small dent in world poverty, and the existing TGVs are only a small part of
a broader effort needed to enhance human welfare (Zilberman et al., 2007).
2.4. Factors shaping smallholder farmers’ perceptions
Few studies focusing on farmers‟ perceptions and their influence on the adoption process
particularly in maize production in South Africa. However, Rahman (2003), suggested that
farmers‟ perception are important because perceptions are a guiding concept of human
behaviour and or decision making. According to Hashemi and Dalamas (2011), perceptions
play a major role in the behaviour of farmers towards use of new technology. Therefore,
farmers‟ perceptions should receive special attention from extension services, policy makers
and other stakeholders in the farming industry. Assefa, van den Berg and Conlong (2008)
note that farmers‟ perceptions can act as a constraint to improved quality and high
production. Hence it is important that perceptions agricultural technologies, in this case Bt
maize, be evaluated at the farm level. This concurs with a study conducted in Iran by
Bagheri, Fami, Rezvanfar, Asadi and Yazdani (2008) who suggested that farmers‟ decisions
to adopt a new agricultural technology depends on complex factors inclusive of farmers‟
perceptions. Furthermore, empirical results from a study conducted in China by Wei, White,
Chen, Davidson and Zhang (2007) revealed that socio-economic factors influence farmers‟
perceptions.
Hence this section describes the factors which farmers may find useful to consider when
deciding whether to adopt Bt maize in their own environments. First, some background on
and the various demonstrated benefits of Bt maize are described: improved yield, reduction in
pesticide usage, and reduction of mycotoxins (toxins produced by fungi that colonise plants).
Then environmental risks are discussed, as well as potential market risks in the context of
current national and international policies on GM crops.
20
2.4.1. Economic factors
2.4.1.1. Food security
Increased subsistence production has the potential to improve the food security of poor
households in both rural and urban areas by increasing food supply, and by reducing
dependence on purchasing food in a context of high food price inflation. Until recently, South
Africa has been self-sufficient in food production, at least at the national level. In addition the
agricultural sector is highly dualistic: comprising a highly capitalised commercial sector and
subsistence sector, mostly found in the former homeland areas (May & Carter, 2009).
Agriculture contributes less than 3% of GDP and 7.2% of formal employment, but
downstream linkages increase its contribution to 15% of GDP (Baiphethi & Jacobs, 2009).
Peasant farmers have the potential to play an important role in reducing sub-Saharan Africa‟s
food deficit. Subsistence production and/or smallholder production can increase food supplies
and thus cushion households from food price shocks, thereby improving household food
security (Baiphethi & Jacobs, 2009).
Since food products absorb a relatively larger share of poor families‟ income, the yield
effects of Bt maize and the resulting lower prices will be relatively more beneficial to poorer
consumers. Zilberman et al. (2007).suggests that the introduction of Bt maize will improve
the overall market surplus and will likely have positive distributional impacts, in the sense
that relative gain to poorer individuals is likely to be greater. The results of Anderson (2005)
and Evenson (2005) suggest significant potential of economic welfare gains to low-income
countries from the introduction of existing transgenic varieties.
2.4.1.2. Higher productivity
Biotechnology has helped to increase crop productivity by introducing such qualities as
disease resistance and increased drought tolerance to the crops. Genes from naturally
drought-resistant plants can be used to increase drought tolerance in many crop varieties from
dry climates where crops must use water as efficiently as possible (Kirsten & Gouse, 2002).
Reporting the results of analysing a survey of smallholders growing maize in Hlabisa,
KwaZulu Natal, using both Bt and minimum tillage Gouse et al. (2006) note that, although
the output per hectare for Bt is 38% higher, the output per kg of seed is the same as for the
21
conventional seed. This suggests that for African smallholders, yield may not be a suitable
measure of performance. They are usually more concerned with output per kg of seed,
especially when it is expensive Bt seed (Gouse et al., 2006).
2.4.1.3. Higher yields
In a study conducted in the US in the state of Illinois, by Chimmiri, Tudor and Spaulding
(2006) to analyze farmers‟ perceptions of genetically modified crops, higher yields were
reported as one of the perceived benefits of Bt maize. A survey conducted in South Africa
revealed that both small-scale and the large-scale farmers believe Bt maize can increase
yields (Gouse et al., 2006). If the pests are prevalent to an economically damaging extent in
an area, their complete control can result in significant yield advantage and reduced risk.
Besides, increases in yield would lead to the creation of new jobs. In turn, income generated
from these jobs would increase the national income as a whole (Brink, 2003; Duffy, 2001).
Keetch et al. (2005) also note that, increased yield directly affects food security whereas
increased income, from higher yields, contributes to the alleviation of poverty in smallholder
farmer communities.
Higher yields reduce the dependence and burden of acquiring food from the market, in some
cases making up 90% of all the food consumed by both rural and urban households, and
implying that only 10% comes from the other two main sources (subsistence production and
transfers). This has led to an increase in the proportion of household income spent on food.
For low-income households the proportion ranges between 60% and 80% in some countries,
whereas in South Africa, the proportion is relatively small at 37% of household income. Due
to dependence on the market for food, the ability to earn cash income and the prices of food
are crucial for the achievement of household food security (Baiphethi & Jacobs, 2009).
2.4.1.4. Cost effectiveness
Employing Bt maize seed reduces the use of expensive insecticides and in turn cuts the
labour costs due to the fact that application costs are cut. A study conducted in Spain by
Brookes (2005) revealed that there are significant benefits from the use of Bt maize seed in
comparison to conventional maize seed. Kalaitzandonakes (2003) in Flannery et al. (2004)
reported that, the drive by farmers to adopt genetically modified seeds will be set under the
condition that production costs, including synthetic pesticides, fertilisers, labour, capital,
decrease or remain static.
22
2.4.1.5. Farm management
According to Chimmiri et al. (2006) easier management and time saving effects of Bt maize
seed influenced their adoption on some farms in the United States. Growing conventional
maize seed requires a significant amount of management such as correct timing of pesticides
application. In most cases, smallholder farmers tend not to keep records hence Bt maize seed
lowers the risks associated with inefficient pesticide application. An economic cost-benefit
analysis of GM crop cultivation conducted by Flannery et al. (2004) revealed that GM crop
cultivation is convenient to an extent that it affords farmers the opportunity to reduce labour
time, hence providing greater flexibility in their management practice.
Effective control required either systemic insecticides or careful scouting to time sprays for
maximum effect. When Bt maize became available, it was recognized as a timely solution to
control of stalk-boring lepidopteran maize pests, which could not be easily controlled any
other way (Huesing & English, 2004).
2.4.1.6. Higher net farm income
The impacts of genetically modified crops on farm profitability vary greatly by region, crop,
and technology. Impacts also vary with seed premiums, crop prices, and prices of alternative
pest control programs. However, Fernandez-Cornejo and Mc Bride (2002) note that some
factors that influence adoption of GM crops are difficult to measure (for example, the
economies in management time associated with the adoption of GM crops). Besides, profits
may be affected by factors other than Bt maize adoption, such as other cropping practices,
weather, or management ability, making it difficult to isolate the effect of GM crop varieties.
According to Fernandez-Cornejo and Mc Bride (2002) seed companies aim to set the seed
price high enough to obtain as much of the farmers‟ savings on stem borer control costs as
possible, while still inducing the producer to use the pest resistant seed. However, producers
of Bt crops versus traditional crops may benefit mainly from lower costs. They expect to
achieve at least the same output while lowering stem borer control costs for chemicals,
chemical applications and scouting. In return, producers pay more to seed companies for the
pest resistant seed (Wu, 2006). Therefore this implies that the profitability of pest resistant
seed depends on pest control cost savings compared with seed cost premiums.
23
2.4.1.7. Labour saving
Family labour which is supplemented by hired labour when needed help with on the farm,
undertaking activities such as planting, weeding and harvesting. Weeding especially is a
family labour task, whereas nonfamily labour is hired for specific activities. According to
Thirtle et al. (2003) most smallholder farmers hire a tractor and driver for ploughing, at a cost
of 350 Rand per hectare and most farmers hire labour for harvesting. Some of the small
farmers also hire someone for spraying as they cannot afford knapsack sprayers. In addition,
since labour scarcity is relative to land Thirtle et al. (2003) suggest that this may lead to
adoption of Bt technology due to its labour saving nature.
Bt maize can reduce pesticide use and in the process it cuts the number of labourers
especially in the case of small-scale farmers who have to walk carrying sprayers on their
backs when applying pesticides to their maize crop (Keetch et al., 2005). Since the South
African agricultural sector is of a dualistic nature, looking at the large-scale farmers, Gouse et
al. (2006) found out that there is also a significant reduction in labour costs compared to
small-scale farmers, since the need to spray the pesticides is reduced. According to Brookes
(2005) who assesses the significance of Bt technology in accordance to the level of pest
infestation, greater impact in labour reduction will result in cases where Bt maize is grown in
an area which is highly susceptible to pest infestation. Given the high level of
interdependency between the household and farm business, the combined labour supply of
the operator and spouse indicates the total amount of time available for farming and non-
farming activities. Operator and or spouse off-farm employment may constrain adoption of
management-intensive technologies because it competes for farm managerial time
(Fernandez-Cornejo & Mc Bride, 2002). Conversely, adoption by households with off-farm
employment may be encouraged if the technology is operator labour-saving, as may be the
case with genetically modified crops.
2.4.1.8. Risk and insurance
It is important to note however that, all of the above mentioned benefits depend on the level
of pest infestation and the profitability of adopting Bt seed thus vary between seasons and
areas (Chimmiri et al., 2006; Gouse et al., 2006; Brookes, 2002). A number of farmers in
South Africa have described the adoption of Bt technology as being like an insurance policy
against boll worms and stalk borers (Gouse et al., 2006). Crop insurance has been used by a
number of farmers as a mechanism to reduce farm income instability. A study conducted in
24
South Africa with regards to use of Bt maize seed by Gouse et al. (2006) gives results which
concurs with those of Brookes (2002), who noted that, farmers take away worries of
significant maize stalk borer damage on their maize crop.
In areas with great variation in pest damage and pest infestation levels between seasons,
farmers may adopt TGVs because of their positive impact on average profitability and risk
reducing effect, especially poorer farmers who have limited access to credit and are thus
more vulnerable to risk (Zilberman et al., 2007)
In agriculture, the notion that technological innovations are perceived to be more risky than
traditional practices has received considerable support in the literature. Many researchers
argue that the perception of increased risk inhibits adoption (Fernandez-Cornejo & Mc Bride,
2002). When an innovation first appears, potential users are generally uncertain of its
effectiveness and tend to view its use as experimental (Mansfield, 1966). However,
uncertainty declines with learning and experience, thus inducing more risk-averse farmers to
adopt an innovation provided it is profitable. Innovators and other early adopters are believed
to be more inclined to take risks than are the majority of farmers.
The role of risk aversion in producer behaviour in the adoption of genetically modified crops
is assessed by Alexander, Fernandez-Cornejo and Goodhue (2000). They found that among
maize and soybean producers, those who reduce their acreage in one GM crop are more likely
to reduce their acreage in the other GM crop, indicating that producer risk preferences are
independent of the crop. In addition, they also note that risk preferences, as measured by
responses to survey questions, are positively and significantly related to the decision to plant
GM maize. This suggests that risk and returns both support a reduction in GM maize acreage.
In contrast, risk preferences do not explain the share of GM soybeans, which is consistent
with the prediction that the production characteristics of GM soybeans dominate the price
uncertainty. These results are consistent with risk-averse or risk-neutral producers. In a
survey conducted by (Gouse et al., 2006), he concluded that Bt technology might serve as
affordable insurance against unforeseeable pest outbreaks, but increases in seed cost or
technology fees could easily outstrip that insurance value to small farmers in South Africa.
This suggests that when smallholder farmers are left to meet the full cost of Bt maize, they
also risk lose the insurance benefit which is inherent in Bt maize.
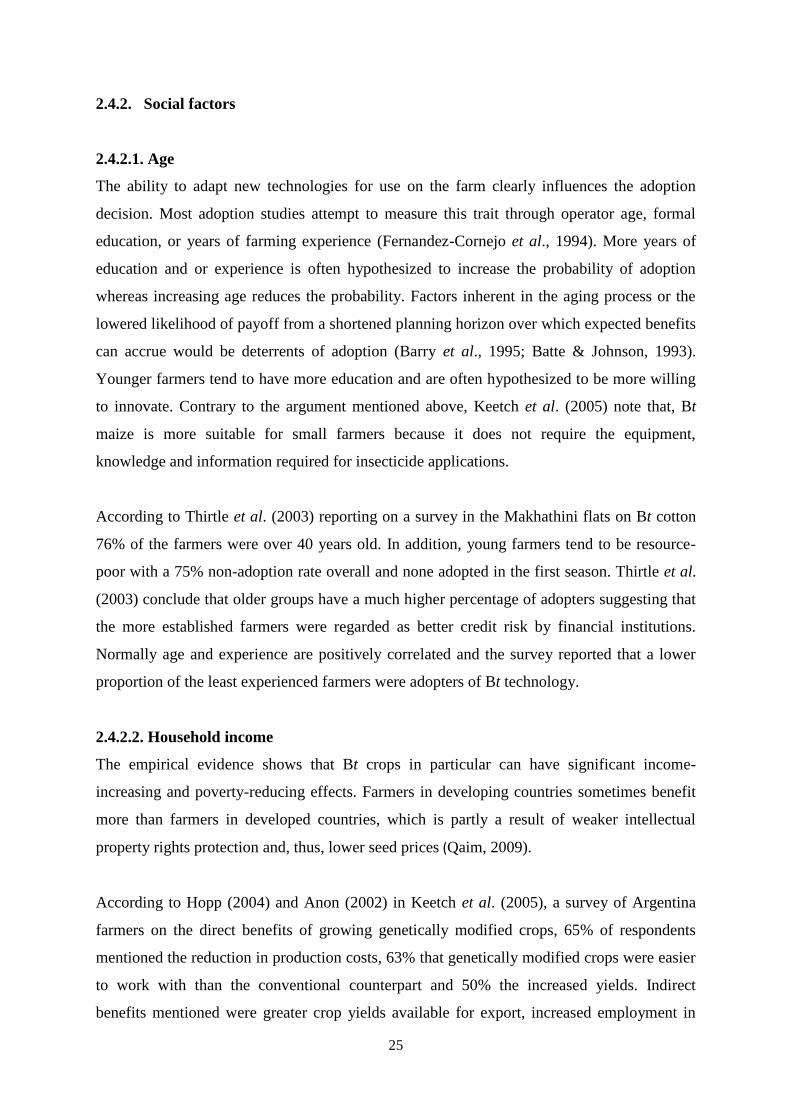
25
2.4.2. Social factors
2.4.2.1. Age
The ability to adapt new technologies for use on the farm clearly influences the adoption
decision. Most adoption studies attempt to measure this trait through operator age, formal
education, or years of farming experience (Fernandez-Cornejo et al., 1994). More years of
education and or experience is often hypothesized to increase the probability of adoption
whereas increasing age reduces the probability. Factors inherent in the aging process or the
lowered likelihood of payoff from a shortened planning horizon over which expected benefits
can accrue would be deterrents of adoption (Barry et al., 1995; Batte & Johnson, 1993).
Younger farmers tend to have more education and are often hypothesized to be more willing
to innovate. Contrary to the argument mentioned above, Keetch et al. (2005) note that, Bt
maize is more suitable for small farmers because it does not require the equipment,
knowledge and information required for insecticide applications.
According to Thirtle et al. (2003) reporting on a survey in the Makhathini flats on Bt cotton
76% of the farmers were over 40 years old. In addition, young farmers tend to be resource-
poor with a 75% non-adoption rate overall and none adopted in the first season. Thirtle et al.
(2003) conclude that older groups have a much higher percentage of adopters suggesting that
the more established farmers were regarded as better credit risk by financial institutions.
Normally age and experience are positively correlated and the survey reported that a lower
proportion of the least experienced farmers were adopters of Bt technology.
2.4.2.2. Household income
The empirical evidence shows that Bt crops in particular can have significant income-
increasing and poverty-reducing effects. Farmers in developing countries sometimes benefit
more than farmers in developed countries, which is partly a result of weaker intellectual
property rights protection and, thus, lower seed prices (Qaim, 2009).
According to Hopp (2004) and Anon (2002) in Keetch et al. (2005), a survey of Argentina
farmers on the direct benefits of growing genetically modified crops, 65% of respondents
mentioned the reduction in production costs, 63% that genetically modified crops were easier
to work with than the conventional counterpart and 50% the increased yields. Indirect
benefits mentioned were greater crop yields available for export, increased employment in
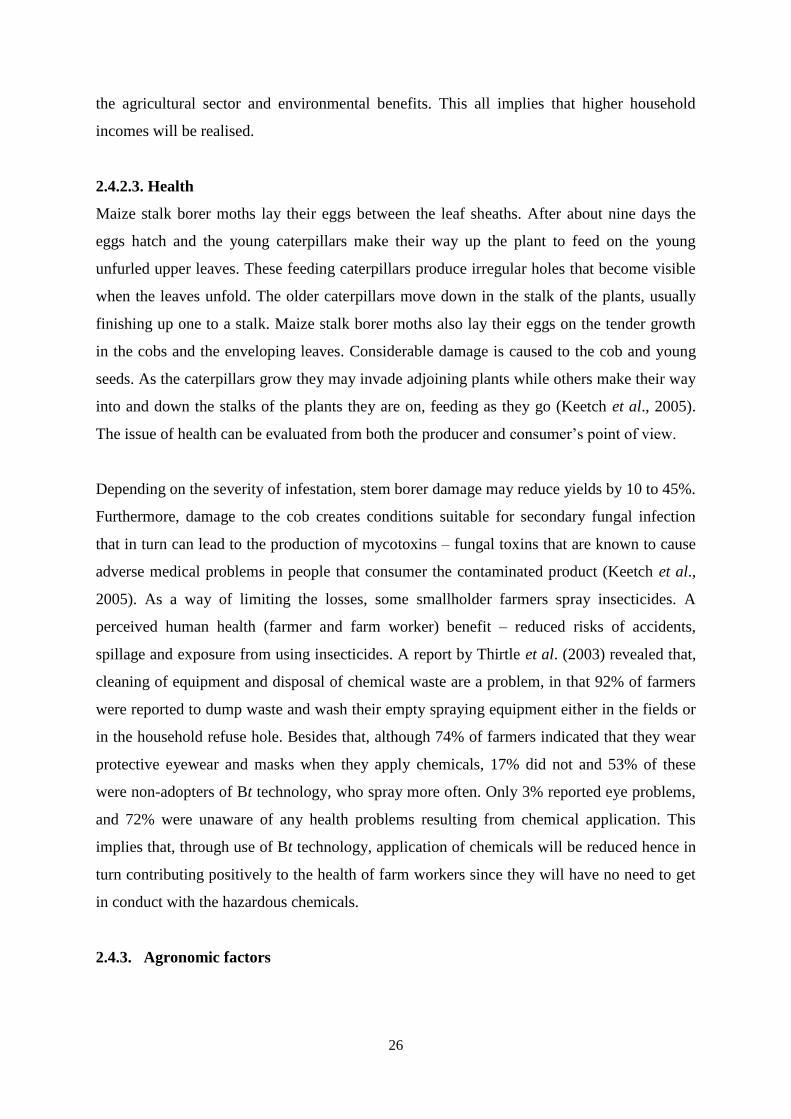
26
the agricultural sector and environmental benefits. This all implies that higher household
incomes will be realised.
2.4.2.3. Health
Maize stalk borer moths lay their eggs between the leaf sheaths. After about nine days the
eggs hatch and the young caterpillars make their way up the plant to feed on the young
unfurled upper leaves. These feeding caterpillars produce irregular holes that become visible
when the leaves unfold. The older caterpillars move down in the stalk of the plants, usually
finishing up one to a stalk. Maize stalk borer moths also lay their eggs on the tender growth
in the cobs and the enveloping leaves. Considerable damage is caused to the cob and young
seeds. As the caterpillars grow they may invade adjoining plants while others make their way
into and down the stalks of the plants they are on, feeding as they go (Keetch et al., 2005).
The issue of health can be evaluated from both the producer and consumer‟s point of view.
Depending on the severity of infestation, stem borer damage may reduce yields by 10 to 45%.
Furthermore, damage to the cob creates conditions suitable for secondary fungal infection
that in turn can lead to the production of mycotoxins – fungal toxins that are known to cause
adverse medical problems in people that consumer the contaminated product (Keetch et al.,
2005). As a way of limiting the losses, some smallholder farmers spray insecticides. A
perceived human health (farmer and farm worker) benefit – reduced risks of accidents,
spillage and exposure from using insecticides. A report by Thirtle et al. (2003) revealed that,
cleaning of equipment and disposal of chemical waste are a problem, in that 92% of farmers
were reported to dump waste and wash their empty spraying equipment either in the fields or
in the household refuse hole. Besides that, although 74% of farmers indicated that they wear
protective eyewear and masks when they apply chemicals, 17% did not and 53% of these
were non-adopters of Bt technology, who spray more often. Only 3% reported eye problems,
and 72% were unaware of any health problems resulting from chemical application. This
implies that, through use of Bt technology, application of chemicals will be reduced hence in
turn contributing positively to the health of farm workers since they will have no need to get
in conduct with the hazardous chemicals.
2.4.3. Agronomic factors
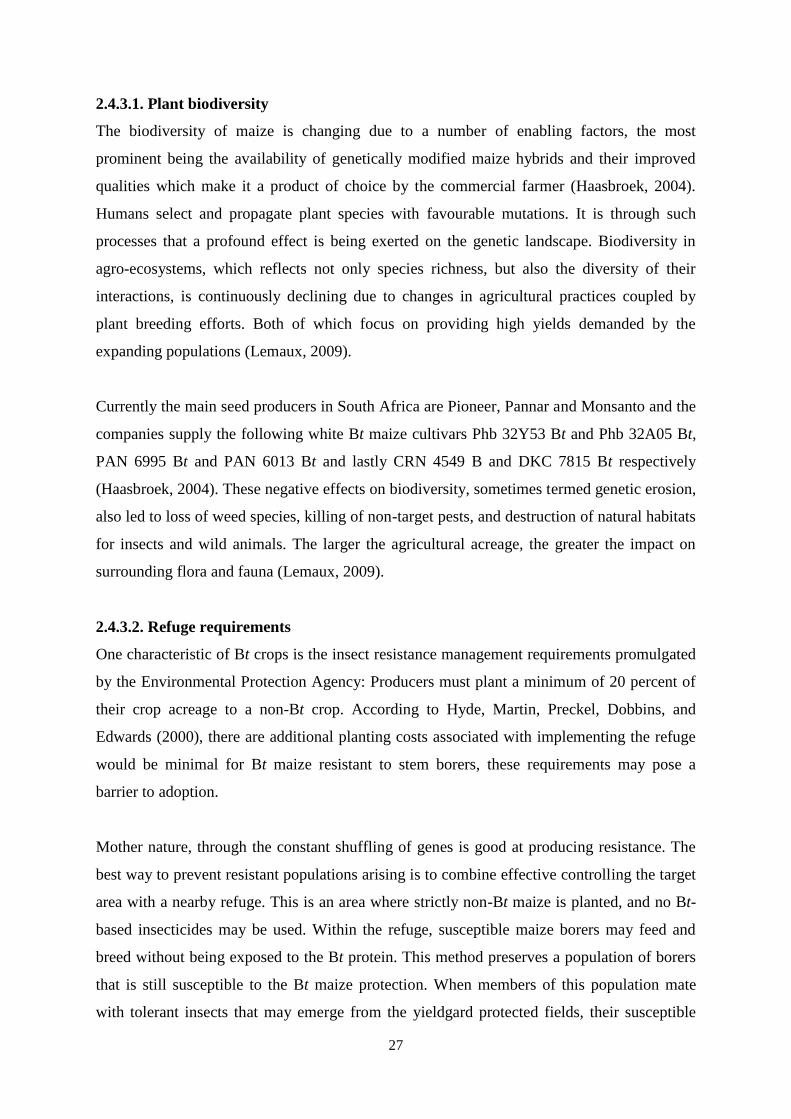
27
2.4.3.1. Plant biodiversity
The biodiversity of maize is changing due to a number of enabling factors, the most
prominent being the availability of genetically modified maize hybrids and their improved
qualities which make it a product of choice by the commercial farmer (Haasbroek, 2004).
Humans select and propagate plant species with favourable mutations. It is through such
processes that a profound effect is being exerted on the genetic landscape. Biodiversity in
agro-ecosystems, which reflects not only species richness, but also the diversity of their
interactions, is continuously declining due to changes in agricultural practices coupled by
plant breeding efforts. Both of which focus on providing high yields demanded by the
expanding populations (Lemaux, 2009).
Currently the main seed producers in South Africa are Pioneer, Pannar and Monsanto and the
companies supply the following white Bt maize cultivars Phb 32Y53 Bt and Phb 32A05 Bt,
PAN 6995 Bt and PAN 6013 Bt and lastly CRN 4549 B and DKC 7815 Bt respectively
(Haasbroek, 2004). These negative effects on biodiversity, sometimes termed genetic erosion,
also led to loss of weed species, killing of non-target pests, and destruction of natural habitats
for insects and wild animals. The larger the agricultural acreage, the greater the impact on
surrounding flora and fauna (Lemaux, 2009).
2.4.3.2. Refuge requirements
One characteristic of Bt crops is the insect resistance management requirements promulgated
by the Environmental Protection Agency: Producers must plant a minimum of 20 percent of
their crop acreage to a non-Bt crop. According to Hyde, Martin, Preckel, Dobbins, and
Edwards (2000), there are additional planting costs associated with implementing the refuge
would be minimal for Bt maize resistant to stem borers, these requirements may pose a
barrier to adoption.
Mother nature, through the constant shuffling of genes is good at producing resistance. The
best way to prevent resistant populations arising is to combine effective controlling the target
area with a nearby refuge. This is an area where strictly non-Bt maize is planted, and no Bt-
based insecticides may be used. Within the refuge, susceptible maize borers may feed and
breed without being exposed to the Bt protein. This method preserves a population of borers
that is still susceptible to the Bt maize protection. When members of this population mate
with tolerant insects that may emerge from the yieldgard protected fields, their susceptible
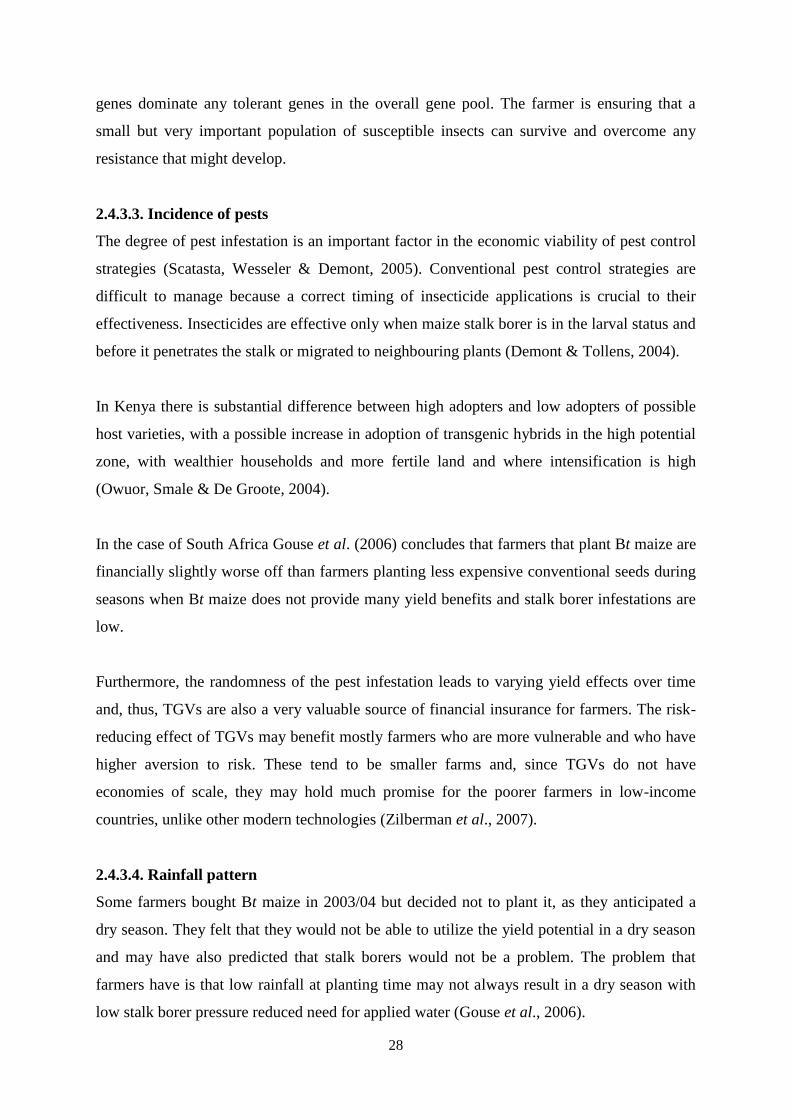
28
genes dominate any tolerant genes in the overall gene pool. The farmer is ensuring that a
small but very important population of susceptible insects can survive and overcome any
resistance that might develop.
2.4.3.3. Incidence of pests
The degree of pest infestation is an important factor in the economic viability of pest control
strategies (Scatasta, Wesseler & Demont, 2005). Conventional pest control strategies are
difficult to manage because a correct timing of insecticide applications is crucial to their
effectiveness. Insecticides are effective only when maize stalk borer is in the larval status and
before it penetrates the stalk or migrated to neighbouring plants (Demont & Tollens, 2004).
In Kenya there is substantial difference between high adopters and low adopters of possible
host varieties, with a possible increase in adoption of transgenic hybrids in the high potential
zone, with wealthier households and more fertile land and where intensification is high
(Owuor, Smale & De Groote, 2004).
In the case of South Africa Gouse et al. (2006) concludes that farmers that plant Bt maize are
financially slightly worse off than farmers planting less expensive conventional seeds during
seasons when Bt maize does not provide many yield benefits and stalk borer infestations are
low.
Furthermore, the randomness of the pest infestation leads to varying yield effects over time
and, thus, TGVs are also a very valuable source of financial insurance for farmers. The risk-
reducing effect of TGVs may benefit mostly farmers who are more vulnerable and who have
higher aversion to risk. These tend to be smaller farms and, since TGVs do not have
economies of scale, they may hold much promise for the poorer farmers in low-income
countries, unlike other modern technologies (Zilberman et al., 2007).
2.4.3.4. Rainfall pattern
Some farmers bought Bt maize in 2003/04 but decided not to plant it, as they anticipated a
dry season. They felt that they would not be able to utilize the yield potential in a dry season
and may have also predicted that stalk borers would not be a problem. The problem that
farmers have is that low rainfall at planting time may not always result in a dry season with
low stalk borer pressure reduced need for applied water (Gouse et al., 2006).
29
2.4.4. Institutional factors
This section focuses mostly on rural financing, input supply channels and lastly price and
market liberalization which all encompass agrarian reform. Besides that, it is important to
note that strengthening the tenure security of smallholder farmers can act as a catalyst
towards achieving farm improvements and a more effective use of local land resources. The
existing land tenure situation is a major impediment to investment and farm development; it
needs to be reformed so that smallholder farmers can compete equally with their commercial
counterparts for additional resources.
Problems of financing range from a lack of adequate financing for medium and operational
purposes, to exceedingly high interest rates where financing is available. Considerable efforts
have been made to make financing available to the smallholder sector, mainly through state
enterprises. However, very limited security is available for loans to smallholders. The credit
granted by state enterprises has been almost entirely on a short-term basis for the purchase of
seasonal inputs, with very little being made available for medium and long-term productive
investment. This means that no meaningful development has taken place in terms of land
improvement and other capital projects required in order to increase productivity.
2.4.4.1. Rural finance
According to van Zyl et al. (2005) rural finance and its limitations are very closely linked to
agricultural finance. Smallholder farmers need sustainable financial services the same way
large-scale farmers need them. Van Zyl et al. (2005) go on further to note the following
challenges that face both agricultural and rural finance in the South African context:
Inappropriate macroeconomic policy, distortions caused by rigid financial policy and
legal and regulatory limitations;
Government policy that favours urban inhabitants
A history of poor subsidised interventions in rural areas that resulted in a lack of
incentives for the development of rural financial markets,
Rural agricultural markets are characterised by features such as poverty, low
population density, high covariant risk and limited opportunities for risk
diversification. There are also fewer economic opportunities in rural areas compared
to urban areas.
30
Micro savings deposit facilities for: the safekeeping of savings, consumption-smoothing,
emergencies, accumulation of resources, self-financing of investments. Microcredit, with
access to loans of various sizes and maturities for: external financing of investments,
consumption-smoothing, emergencies. Micro insurance, including specialized insurance
services (life, health, accident or cattle insurance) and non-specialized services (providing
social protection through access to one‟s savings or to credit in cases of emergency) for: risk
management, social security, loan protection plus other financial services, for example micro
leasing, supplemented by nonfinancial services and microfinance institutions (MFIs) (IFAD,
2001).
Formal microfinance institutions, regulated by the financial authorities of a country (rural
banks, agricultural development banks and some commercial banks and finance companies
with special microfinance windows) semiformal MFIs under the control of nonfinancial
authorities (savings and credit cooperatives, unregulated village banks and credit NGOs)
informal MFIs, controlled by customary law and peer pressure (the ubiquitous rotating
savings and credit associations, savings and credit associations with permanent loan funds,
doorstep deposit collectors, and the large numbers of self-help groups with some limited
financial activities).
To provide these services reliably and cost-effectively:
mediating between savers and investors
allocating scarce resources for various purposes with different returns
lowering transaction costs
widening and deepening financial services to the poor.
To contribute to sustainable poverty reduction through increasing outreach, MFls themselves
must be viable, sustainable, and growing. Microfinance is business, not charity. This means:
MFls must offer attractive interest rates or profit-sharing margins on savings with positive
real returns (preventing the erosion of the value of savings) and mobilize their own resources;
rural MFls must charge rural market rates of interest on loans (which are considerably above
commercial prime rates of interest) and cover all their costs from the interest rate margin;
MFls must make a profit and finance their expansion from their returns.
31
Only those MFls that have demonstrated their capacity for resource mobilization, cost
coverage, profitability and dynamic growth deserve assistance. Such institutions may be
found in all financial sectors – formal, semiformal or informal. Governments, with the
support of donors, should be encouraged to provide an adequate legal framework for the
upgrading of informal to semiformal and semiformal to formal MFls; and for the
establishment of networks and their apex organizations for guidance, training, consultancy
services, self-regulation and supervision, liquidity exchange and refinancing (IFAD, 2001).
2.4.4.2. Input supply channels
Results from a survey conducted by Gouse et al. (2006) revealed that smallholder farmers
who wanted to plant Bt maize in the 2002/03 season faced a problem of limited supply of Bt
seed for purchase. The main parties which contributed to this shortage were Monsanto South
Africa, commercial farmers‟ increased demand for white Bt seed and sometimes late seed
ordering by either small-scale farmers or their farmer associations. This explains why the area
under Bt maize cultivation was so low as noted by (Haasbroek, 2004).
However, Gouse et al. (2003) suggested that, the area under Bt maize could be expanded if
companies are willing to segment the Bt maize seed market and charge a lower price to small
farmers than they are currently charging to large farmers. Gouse et al. (2003) goes on further
to note that, Pannar Seed Company employed a programme with conventional hybrid maize
seed. The company produces high cost types of hybrids and charges premium to large
commercial farmers and on the other hand inexpensive seeds for smallholder farmers and it
sells them at low prices.
2.4.4.3. Price and market liberalization
Problems in marketing range from high input costs, low producer prices due to unfair grading
by commodity buyers to push down prices, to limited processing capacity which would have
added value and reduced transport costs of bulk raw materials. In the Eastern Cape Province
the majority of smallholder farmers live in areas with poor road networks which render
transport services not only unavailable, but also highly priced.
Widespread production and consumption of the Bt maize crop could reduce micronutrient
deficiencies, improve health outcomes, and provide economic benefits. Although there are
many documented benefits on Bt maize, it is uncertain whether they command higher market
prices as the poor who supplement their food requirements may not possess the financial
32
wherewithal to pay a quality premium (Qaim et al., 2009). Besides that, privatization of
marketing boards in places like Zimbabwe, and the market liberalization occurring in most
commodities, smallholder farmers have become vulnerable to traders preying on their
weaknesses. These weaknesses include: inadequate pricing information, lack of storage
facilities and reliable transportation, and the need to repay high interest bearing loans.
The situation puts big buyers in a position to dictate prices, as well as employ manipulative
grading systems to their advantage. Farmers function as individuals and therefore they do not
have bargaining power. It is logical to conclude that under the circumstances described
above, poverty is certainly not being eradicated through agriculture. Since the majority of the
population in the developing world, lives in rural areas and is directly dependent on
agriculture for its livelihood, Africa is doomed to poverty unless long-term sustainable
interventions can be developed.
2.4.4.4. Intellectual property rights
Farmers have traditionally replanted, exchanged or sold seed from the previous years‟ crop
which means that breeders have difficulty in recouping the investments made in improved
varieties through repeat sales. Patents normally impose restrictions on farmers‟ ability to sell
grown seed and thus enhance the market for the breeder‟s seed. In developing countries the
majority of farmers reuse, exchange or sell informally to neighbours, and annual purchase of
new seed is relatively rare in most countries. With the adoption of the TRIPS Agreement,
developing countries have been obliged to adopt protection of plant varieties, by patents or by
other means, without any serious consideration being given to whether such protection would
be beneficial, both to producers and consumers, or its possible impact on food security. New
technologies need to be controlled by guidelines or regulations so as to maximise benefits and
minimise risks to humans and the environment (ITPGRFA, 2002).
The ability to enforce intellectual property rights (IPRs) and transaction costs incurred
determine the strategy which private seed companies use to introduce of transgenetically
modified maize varieties (TGVs) in a country (Zilberman et al., 2007). Historically, systems
for the protection of intellectual property were applied principally to mechanical inventions
of one kind or another, or to artistic creations. The assignment of IPRs to living things is of
relatively recent origin in developed countries (ITPGRFA, 2002). This section focuses on the
33
practical and economic consequences of patenting in agriculture and how this affects the
livelihoods of poor people and the implications for policy.
According to Zilberman et al. (2007) there are two main approaches they may pursue. Firstly,
is to either import TGVs from other countries or to own or control companies that supplies
farmers with a subset of the local seed varieties and offer a small number of TGVs. In South
Africa multinational seed companies sell the rights to transgenetically modify local varieties
to existing seed companies and charge a royalty termed “technology fee”. The second
strategy, which is inserting the Bt gene in a broad range of local varieties and sell them
cheaply if the local public sector has the required capacity and is not concerned about IPRs
(Zilberman et al., 2007). This implies that there will be more crop biodiversity preservation.
Genetic Use Restriction Technologies (known as GURTs) is a term used to describe different
forms of controlling the action of genes in plants. The so-called “terminator” technology,
which would render the seed sterile so that it is not physically possible to grow a second crop,
is well known but other characteristics can also be controlled, either for agronomic or
commercial reasons. The effect of technological protection is similar to that of IP protection,
but possibly cheaper and certainly more effective in the sense that it is self-enforcing. A field
study conducted by Mandikiana and Mushunje (2008) in Mqanduli revealed that, after
replanting Bt maize seed smallholder farmers attained very low yields. This indicates that
smallholder farmers are not aware of the terminator technology and in addition to that, for
them to achieve high yields every season they have to purchase seeds. In conclusion,
ITPGRFA (2002) perceive the main beneficiaries from use of technology protection as
commercial farmers and seed companies. Therefore, this implies that sustainability of Bt
maize in the smallholder farming sector is questionable since these farmers face restrictions
on seed saving and exchange.
Patents are the strongest form of intellectual property protection in the sense that they
normally allow the rights-holder to exert the greatest control over the use of patented material
by limiting the rights of farmers to sell, or reuse seed they have grown, or other breeders to
use the seed (or patented intermediate technologies) for further research and breeding
purpose. For example, the EU Biotechnology Directive, while not permitting the patenting of
plant varieties, provides for a farmer‟s exception where a patent on genetic material would
otherwise prevent reuse on the farm. It also contains a provision for compulsory licensing,
34
subject to certain conditions, where a breeder‟s use of material would otherwise infringe the
patent right (ITPGRFA, 2002).
Mugo et al. (2005) note that, it is imperative to analyze the intellectual property rights (IPRs)
that are involved before engaging in developing new technology. Intellectual property rights
are designed to protect one‟s investment into intellectual property and the products that are
derived from these advances so as to provide economic returns to research to stimulate
additional investment in research and product development. Companies usually increase the
cost of using the technology as a way to cover both defending intellectual property claims
and development costs. In South Africa, every farmer who plants Bt crops must sign a
contract with the companies that are selling genetically modified seeds to ensure that the
farmer plants the seed where he says he will plant it, and abides by the proper refuge
requirements. This is relatively easy for large companies who are selling directly through
their marketing agents to large producers. However, Gouse et al. (2003) highlight that when
companies are dealing with thousands of small farmers this is an expensive requirement and
could result to a decision not to sell genetically modified seeds to the smaller subsistence
farmer at all.
One way to keep costs lower is to promote standards that are accepted not just in one country
but in the entire region where growth of the crop is predicted. Another issue that has not been
addressed sufficiently is the big difference between carrying out a limited field trial to test for
the efficacy of a transgenic event and, depending upon the crop and the trait, more extensive
trials that might be needed before final approval for release to farmers. De Grassi (2003),
argue that not all Bt projects will yield useful products especially those developed by the
relatively inexperienced public sector. Therefore, developing countries should find ways to
allow limited efficacy trials under appropriately contained conditions that are simple in
design to keep costs low but responsible in concept. Only when events are deemed worthy of
further development and depending upon the crop and trait in question would it is necessary
to invoke more extensive trials on a final chosen event. Another suggestion is to create
regulatory classes in proportion to potential risk (Delmer, 2005).
2.5. Public-Private Partnerships
Patents of living organisms and parts thereof have spurred a tremendous amount of private
sector biotechnology research. Baiphethi and Jacobs (2009), highlight the importance of
35
research and development in bolstering subsistence agriculture. In Eastern Cape Province,
substantial or improved investments and support into, extension, other agricultural services
such as access to credit, markets and retooling of extension officers. For the developing
world, the key would seem to be to find ways to make field trials responsible but as low in
cost as possible; otherwise, no public-sector effort will be able to participate (Delmer, 2005).
Genetically modified crops can contribute significantly to food security and sustainable
development in many geographic locations against the background of a gradually diminishing
natural resource base and growing demand for agricultural products. This implies that new
technologies are crucial for the necessary production increases. Overregulation has become a
real threat for the further development and use of genetically modified crops. The costs of
regulation in terms of foregone benefits may be large, especially for developing countries.
This does not mean that zero regulation would be desirable, but the trade-offs associated with
regulation should be considered. In the public arena, the risks of genetically modified crops
seem to be overrated, while the benefits are underrated (Qaim, 2009).
In the private sector, obtaining enabling rights has often been accomplished by bringing key
technologies and materials under the control of the company through mergers and
acquisitions. Large agricultural biotechnology companies amassed intellectual property assets
through these means or through their own research efforts into the development of new
genetically modified crops. However, the development of genetically modified agricultural
products for farmers in developing economies and of genetically modified seed for low
acreage crops in developed countries will most likely be performed, if at all, by non-profit
organizations with public funding (Lemaux, 2009).
Genetically modified crops Bt maize could be developed through concerted public-sector
efforts. In fact, the public sector seems to be hard at work in many places doing transgenic
research for the developing world. Delmer (2005) argues that plenty of public-sector
scientists can create transgenic plants unfortunately an understanding of how to make
strategic assessments of which projects can have the highest impact; how to choose the best
varieties for transformation and to design the best constructs to ensure the freedom to operate
and gain regulatory approval; the recognition of the need to generate very large numbers of
transformants to ensure high levels of expression and the stability of the inserts and to
determine the optimal promoter; and a clear plan for the stewardship, uptake, and
36
dissemination of new varieties is lacking in the public sector. In addition to that, Qaim (2009)
note that public sector research organizations, in particular, are at a disadvantage because
they often have relatively little to offer in return for licenses from private companies. The
seed price or technology fee charged by monopolies is larger than the price under
competition. Development and introduction of new genetically modified crops by the public
sector requires that the public sector has the expertise and skill. In most cases the public
sector does not have the know-how and capacity to introduce genetically modified crops and
reliance on the private sector may lead to less costly genetically modified crops (Zilberman,
Ameden & Qaim, 2007).
In conclusion, Qaim (2009) suggest that, economics research has an important role to play in
finding ways to maximize the net social benefits. More work is needed to quantify possible
indirect effects of genetically modified crops, including socio-economic outcomes as well as
environmental and health impacts. Furthermore, economists need to contribute to the design
of efficient regulations and innovation systems in light of changing framework conditions.
Although the gradual move from public to private crop improvement research is a positive
sign of better-functioning markets, certain institutional factors seem to contribute to
increasing industry concentration. This could lead to adverse outcomes in terms of
technology development and access (Qaim, 2009).
2.6. Summary
The first section gave the background of Bt maize production. In the second section focused
on discussing the role of technology in agricultural development. This was done through the
use of the Induced Innovation model of agricultural development which was invented by
Ruttan and Hayami. The fourth section investigates the factors that influence adoption of
genetically modified seeds and how they influence smallholder farmers‟ perceptions towards
use of Bt maize seeds. In this section the economic, social, agronomic and factors that
influence adoption of genetically modified seeds and how they influence smallholder
farmers‟ perceptions towards use of Bt maize seeds were assessed. The fifth section looked at
public-private partnerships and how they can be employed to develop and disseminate Bt
maize seeds suited to the smallholder farming environment.
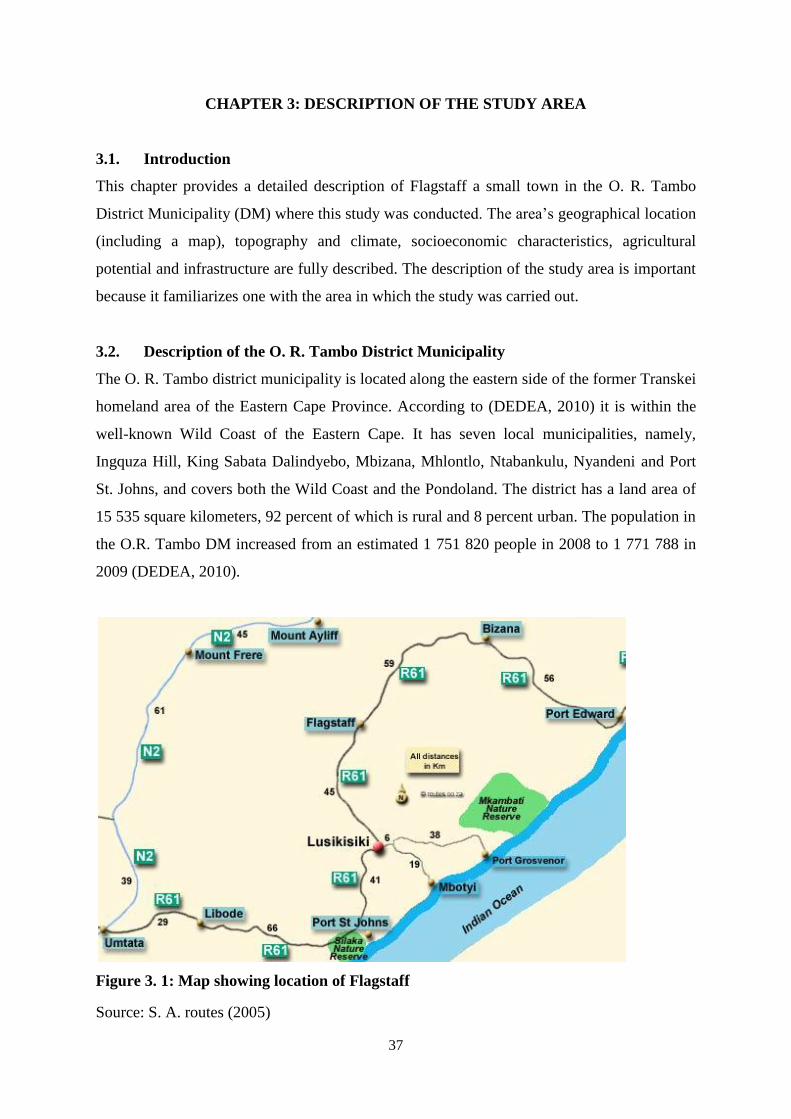
37
CHAPTER 3: DESCRIPTION OF THE STUDY AREA
3.1. Introduction
This chapter provides a detailed description of Flagstaff a small town in the O. R. Tambo
District Municipality (DM) where this study was conducted. The area‟s geographical location
(including a map), topography and climate, socioeconomic characteristics, agricultural
potential and infrastructure are fully described. The description of the study area is important
because it familiarizes one with the area in which the study was carried out.
3.2. Description of the O. R. Tambo District Municipality
The O. R. Tambo district municipality is located along the eastern side of the former Transkei
homeland area of the Eastern Cape Province. According to (DEDEA, 2010) it is within the
well-known Wild Coast of the Eastern Cape. It has seven local municipalities, namely,
Ingquza Hill, King Sabata Dalindyebo, Mbizana, Mhlontlo, Ntabankulu, Nyandeni and Port
St. Johns, and covers both the Wild Coast and the Pondoland. The district has a land area of
15 535 square kilometers, 92 percent of which is rural and 8 percent urban. The population in
the O.R. Tambo DM increased from an estimated 1 751 820 people in 2008 to 1 771 788 in
2009 (DEDEA, 2010).
Figure 3. 1: Map showing location of Flagstaff
Source: S. A. routes (2005)
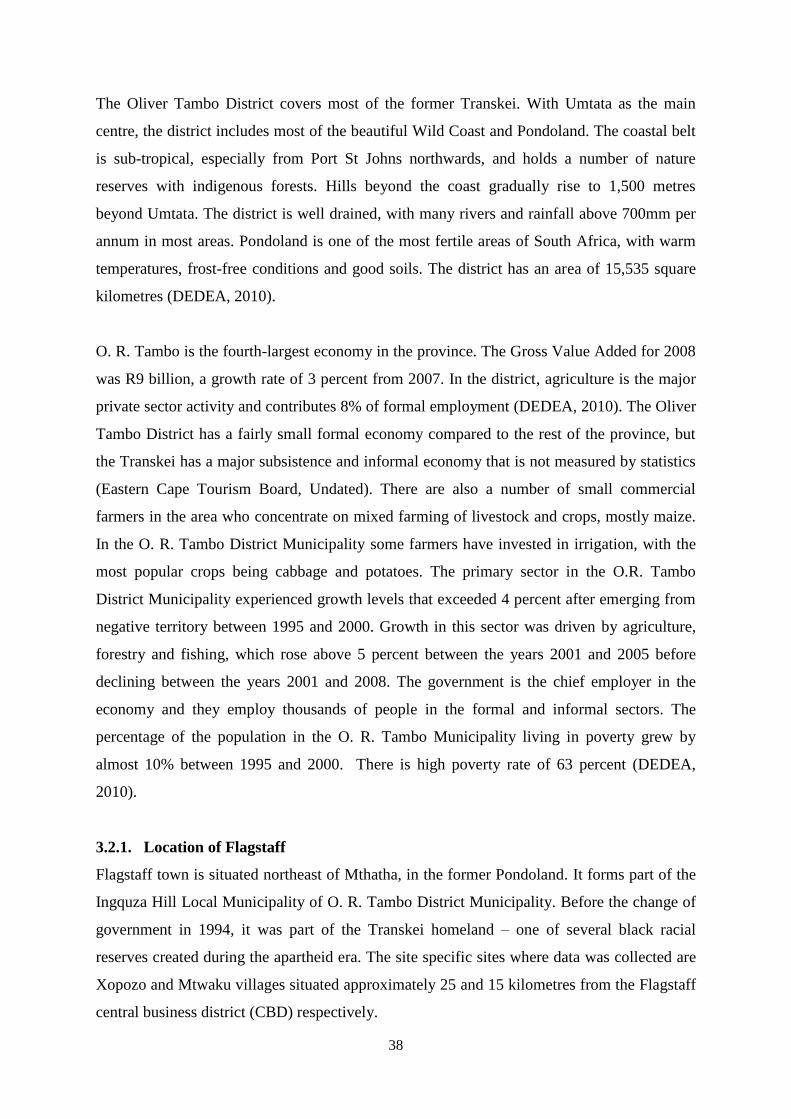
38
The Oliver Tambo District covers most of the former Transkei. With Umtata as the main
centre, the district includes most of the beautiful Wild Coast and Pondoland. The coastal belt
is sub-tropical, especially from Port St Johns northwards, and holds a number of nature
reserves with indigenous forests. Hills beyond the coast gradually rise to 1,500 metres
beyond Umtata. The district is well drained, with many rivers and rainfall above 700mm per
annum in most areas. Pondoland is one of the most fertile areas of South Africa, with warm
temperatures, frost-free conditions and good soils. The district has an area of 15,535 square
kilometres (DEDEA, 2010).
O. R. Tambo is the fourth-largest economy in the province. The Gross Value Added for 2008
was R9 billion, a growth rate of 3 percent from 2007. In the district, agriculture is the major
private sector activity and contributes 8% of formal employment (DEDEA, 2010). The Oliver
Tambo District has a fairly small formal economy compared to the rest of the province, but
the Transkei has a major subsistence and informal economy that is not measured by statistics
(Eastern Cape Tourism Board, Undated). There are also a number of small commercial
farmers in the area who concentrate on mixed farming of livestock and crops, mostly maize.
In the O. R. Tambo District Municipality some farmers have invested in irrigation, with the
most popular crops being cabbage and potatoes. The primary sector in the O.R. Tambo
District Municipality experienced growth levels that exceeded 4 percent after emerging from
negative territory between 1995 and 2000. Growth in this sector was driven by agriculture,
forestry and fishing, which rose above 5 percent between the years 2001 and 2005 before
declining between the years 2001 and 2008. The government is the chief employer in the
economy and they employ thousands of people in the formal and informal sectors. The
percentage of the population in the O. R. Tambo Municipality living in poverty grew by
almost 10% between 1995 and 2000. There is high poverty rate of 63 percent (DEDEA,
2010).
3.2.1. Location of Flagstaff
Flagstaff town is situated northeast of Mthatha, in the former Pondoland. It forms part of the
Ingquza Hill Local Municipality of O. R. Tambo District Municipality. Before the change of
government in 1994, it was part of the Transkei homeland – one of several black racial
reserves created during the apartheid era. The site specific sites where data was collected are
Xopozo and Mtwaku villages situated approximately 25 and 15 kilometres from the Flagstaff
central business district (CBD) respectively.
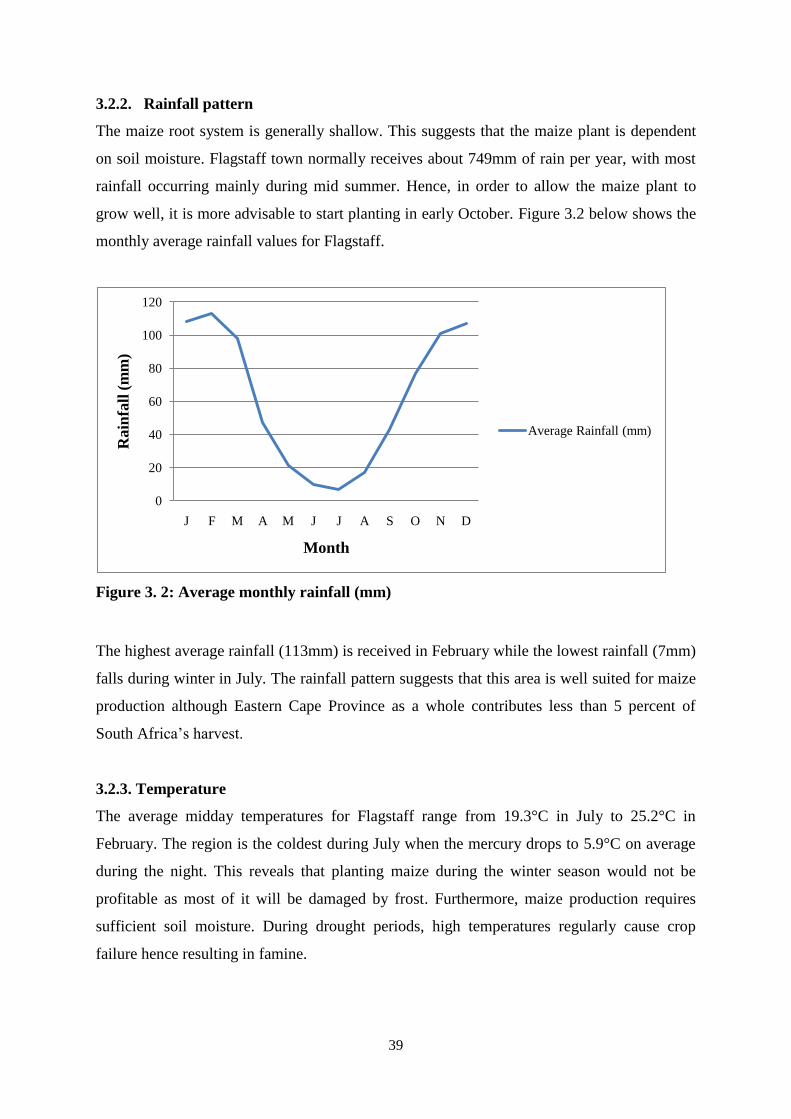
39
3.2.2. Rainfall pattern
The maize root system is generally shallow. This suggests that the maize plant is dependent
on soil moisture. Flagstaff town normally receives about 749mm of rain per year, with most
rainfall occurring mainly during mid summer. Hence, in order to allow the maize plant to
grow well, it is more advisable to start planting in early October. Figure 3.2 below shows the
monthly average rainfall values for Flagstaff.
Figure 3. 2: Average monthly rainfall (mm)
The highest average rainfall (113mm) is received in February while the lowest rainfall (7mm)
falls during winter in July. The rainfall pattern suggests that this area is well suited for maize
production although Eastern Cape Province as a whole contributes less than 5 percent of
South Africa‟s harvest.
3.2.3. Temperature
The average midday temperatures for Flagstaff range from 19.3°C in July to 25.2°C in
February. The region is the coldest during July when the mercury drops to 5.9°C on average
during the night. This reveals that planting maize during the winter season would not be
profitable as most of it will be damaged by frost. Furthermore, maize production requires
sufficient soil moisture. During drought periods, high temperatures regularly cause crop
failure hence resulting in famine.
0
20
40
60
80
100
120
J F M A M J J A S O N D
Rain
fall
(m
m)
Month
Average Rainfall (mm)
40
3.2.4. Agricultural potential
Flagstaff is characterised by a variety of land use patterns ranging from timber plantation,
commercially oriented rangeland stock farming to small-scale vegetable and crop production
and stock farming. Vegetable gardening is an important occupation amongst smallholder
farmers in the area as it helps supplement their low incomes. Most of these vegetables are
grown in home gardens which are fertilised with manure. Irrigation is not commonly
practised in the area as most farmers are highly dependent on rain-fed crop production
systems. This also indicates lack of capital to purchase irrigation infrastructure by farmers.
The soil, on which most cultivation occurs in the valley, is alluvium, which is suitable for
agriculture. Furthermore, Gichangi, Mnkeni and Brookes (2007) explained that even though
the soil is suitable for agriculture, phosphorous and potassium deficiencies have been
identified in the alluvial soil profiles of Flagstaff. Smallholder farmers in the Flagstaff
therefore have potential to boost their production size if production challenges are reduced.
One of the main production difficulties that they face is lack of fencing which has resulted in
reduction of plot sizes.
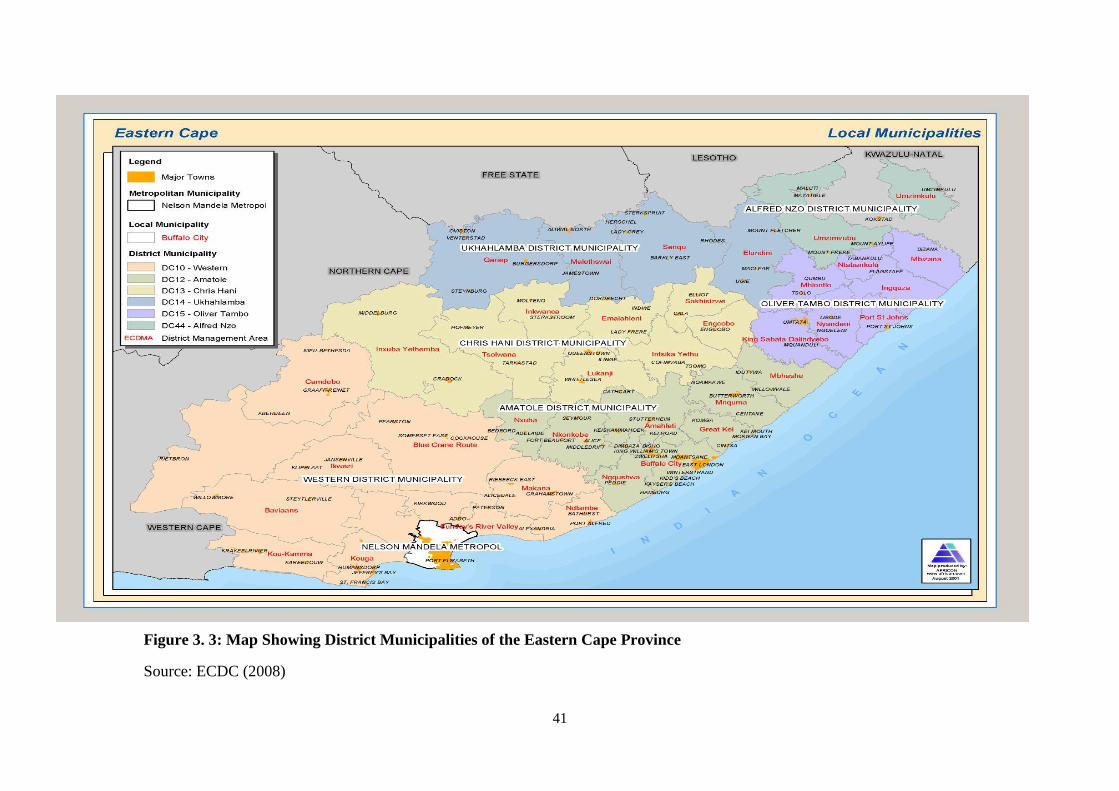
41
Figure 3. 3: Map Showing District Municipalities of the Eastern Cape Province
Source: ECDC (2008)
42
CHAPTER 4: RESEARCH METHODOLOGY
4.1. Introduction
This chapter reviews the research methods used in collecting and analyzing data from
smallholder farmers in the Eastern Cape Province. The chapter is intended to show how the
study area was chosen and the sampling techniques used to draw the sampling frame from
which data were collected. Furthermore, it highlights how the data were collected using
research instruments. Besides describing how the data were collected, an analytical
framework follows, outlining descriptive statistics and the model for data processing, giving
reasons why the model was chosen.
4.2. Selection of the project area and sample size
The town of Flagstaff was chosen based literature by Gouse et al. (2005) who indicated that
villages surrounding Flagstaff were part of the sites trials for Bt maize in the Eastern Cape
Province. Two villages namely Mtwaku and Xopozo were then selected purposively on the
basis of the information obtained after having a brief participatory learning and action (PLA)
workshop involving members of the community and Department of Agriculture (DoA)
officials. According to The International Institute for Environment and Development (IIED)
(2010), PLA also known as participatory rural appraisal allows full participation of people in
the processes of learning about their needs and opportunities, and the action required to
address them. Furthermore, participatory learning and action recognises the importance of
analysing and overcoming power differentials which work to exclude society‟s poor and
marginalised. Therefore, PLA helps people talk freely, understand things better and make
good decisions. Interviews with key informants from a technical level (extension officers) to
grass root level (respondents) were the main method employed to gather information.
However, since the focus of this study was comparing to groups, namely adopters and non-
adopters of Bt maize seed, two strata of 45 maize producing households were drawn based on
the figures obtained from the PLA workshop. Therefore a sampling frame of 90 households
was drawn. Sampling is a process of selecting units from a population of interest, so that by
studying the sample, the results obtained from the sample may be generalized to the
population from which the sample had been drawn (Leedy & Ormrod, 2004). Thus, the
characteristics obtained from the sample should reflect approximately the same
characteristics as the population. Since the data obtained from a sample will be generalized to
43
the whole population, the manner in which the sample units are selected is important. A
sample should be representative; therefore, the sample size should be large enough to conduct
reliable statistical analysis. According to Bless and Smith (2000), in order to get reliable
prediction, a sample should have at least 30 units. Furthermore, focus group discussions were
held only in Mtwaku village and 18 adopters who are known to be part of a co-operative
which grow Bt maize seed were randomly selected and interviewed. All the farmers who
grew Bt maize seed which was obtained during field trials of the 2001/2002 to 2005/2006
seasons and who were willing to participate were interviewed. According to Bless and Smith
(2000), there are merits associated with interviewing the whole population. Data obtained
from the whole population is more reliable, when compared to sample data. In addition to the
adopters, 13 non-adopters were also randomly selected and interviewed to make a total of 31
respondents from Mtwaku village. On the other hand, simple random sampling was also used
to draw 27 more adopters in Xopozo village and 32 non-adopters as well to make a total of 59
respondents from the village.
4.3. Description and analysis of data
After the brief participatory learning and action (PLA) workshop, the second phase (face to
face interviews) of the study which was a much more substantive baseline survey targeting
both qualitative and quantitative data was conducted. The data included data on the
following:
(a) Demographic and socio-economic characteristics
(b) Maize based cropping systems
(c) Institutional arrangements
(d) Perceptions on attributes of Bt maize
The main instrument that was used to gather data pertaining to the above-mentioned
information was a questionnaire as shown in annexure 1. The Statistical Package for Social
Scientists (SPSS version 18.0) was used to run the data collected from smallholder farmers in
Flagstaff. To analyze data, descriptive statistics, gross margin analysis and the binomial
logistic regression model were used to test the hypotheses.
44
4.3.1. Descriptive statistics, non parametric correlation and cross tabulation
Descriptive statistics were used to describe the basic features of the sample households by
means of simple summaries and measures of central tendency. These are useful in analyzing
household characteristics as well as analyzing the relationship between variables. This means
that they describe what is being shown by the data. Therefore, descriptive statistics were used
because they present quantitative data in a manageable form. In this study there were three
major characteristics of a variable that were employed, namely; the distribution, central
tendency and dispersion.
For the purpose of estimating whether farm size, education level and incidence of maize stem
borers affect adoption of Bt maize non parametric correlation was employed to establish
whether there were relationships existing. Spearman‟s analyses was computed which gives
correlation coefficients that indicate the strength and direction of the linear relationship.
Although it is closely related to correlation, cross tabulation is a type of bivariate analysis that
involves testing whether a relationship or an association exists between two categorical
variables to make sure that the direction of association is made obvious. Hence, in this study
it was employed to cross check the systematic relationships inferred by correlation.
The data that were collected included:
demographic data (age, sex, highest educational level attained, family size and income
level of household heads),
farming system data (types of crops grown, cropping patterns tenure, yield loss, type of
seed variety grown, use of pesticides)
marketing and post-harvest activities data (quantity of output both sold and consumed,
price of inputs, marketing costs)
Institutional data (organisational affiliation, institutional arrangements and challenges
encountered)
performance data (gross income, total variable cost, gross margin)
4.3.2. Gross margin analysis
When acquiring new technology, it is important to consider the economic value of the new
practice. As a rule of thumb, an enterprise with higher or positive gross margin is deemed
viable. Hence, gross margin analysis was used to assess the viability of Bt maize seed.
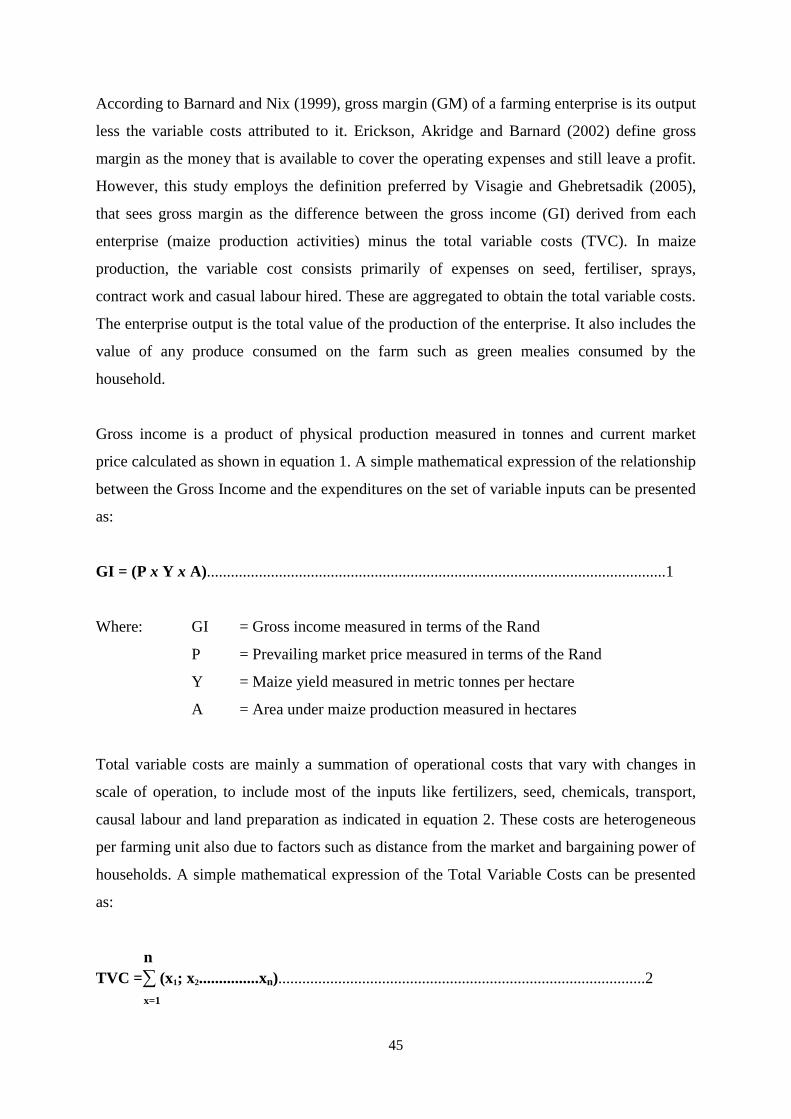
45
According to Barnard and Nix (1999), gross margin (GM) of a farming enterprise is its output
less the variable costs attributed to it. Erickson, Akridge and Barnard (2002) define gross
margin as the money that is available to cover the operating expenses and still leave a profit.
However, this study employs the definition preferred by Visagie and Ghebretsadik (2005),
that sees gross margin as the difference between the gross income (GI) derived from each
enterprise (maize production activities) minus the total variable costs (TVC). In maize
production, the variable cost consists primarily of expenses on seed, fertiliser, sprays,
contract work and casual labour hired. These are aggregated to obtain the total variable costs.
The enterprise output is the total value of the production of the enterprise. It also includes the
value of any produce consumed on the farm such as green mealies consumed by the
household.
Gross income is a product of physical production measured in tonnes and current market
price calculated as shown in equation 1. A simple mathematical expression of the relationship
between the Gross Income and the expenditures on the set of variable inputs can be presented
as:
GI = (P x Y x A)...................................................................................................................1
Where: GI = Gross income measured in terms of the Rand
P = Prevailing market price measured in terms of the Rand
Y = Maize yield measured in metric tonnes per hectare
A = Area under maize production measured in hectares
Total variable costs are mainly a summation of operational costs that vary with changes in
scale of operation, to include most of the inputs like fertilizers, seed, chemicals, transport,
causal labour and land preparation as indicated in equation 2. These costs are heterogeneous
per farming unit also due to factors such as distance from the market and bargaining power of
households. A simple mathematical expression of the Total Variable Costs can be presented
as:
n
TVC =∑ (x1; x2...............xn)............................................................................................2
x=1
46
Where: TVC = Total variable costs measured in terms of the Rand
x1 = First variable cost to be used during the production process
xn = Last variable cost to be used during the production process
The gross margin (GM) is a measure of economic performance of an enterprise (maize). In
simple terms, the GM of an enterprise is gross income less the total variable costs. However,
the GM per farming unit differs due to the differences in maize enterprise production
arrangements. Equation 3 below shows a simple mathematical expression of Gross Margin
for an enterprise which can be presented as:
GM = (GI – TVC).............................................................................................................3
Where: GM = Gross margin measured in terms of the Rand
GI = Gross income measured in terms of the Rand
TVC = Total variable costs measured in terms of the Rand
In order to capture maize production data from each farmer, the gross margin model was
used. In addition, equations 1 to 3 indicate the steps taken to arrive at the actual gross margin
for each farming unit. Table 4.1 below illustrates the format for summarizing the results of
gross margin analysis for a typical agricultural enterprise.
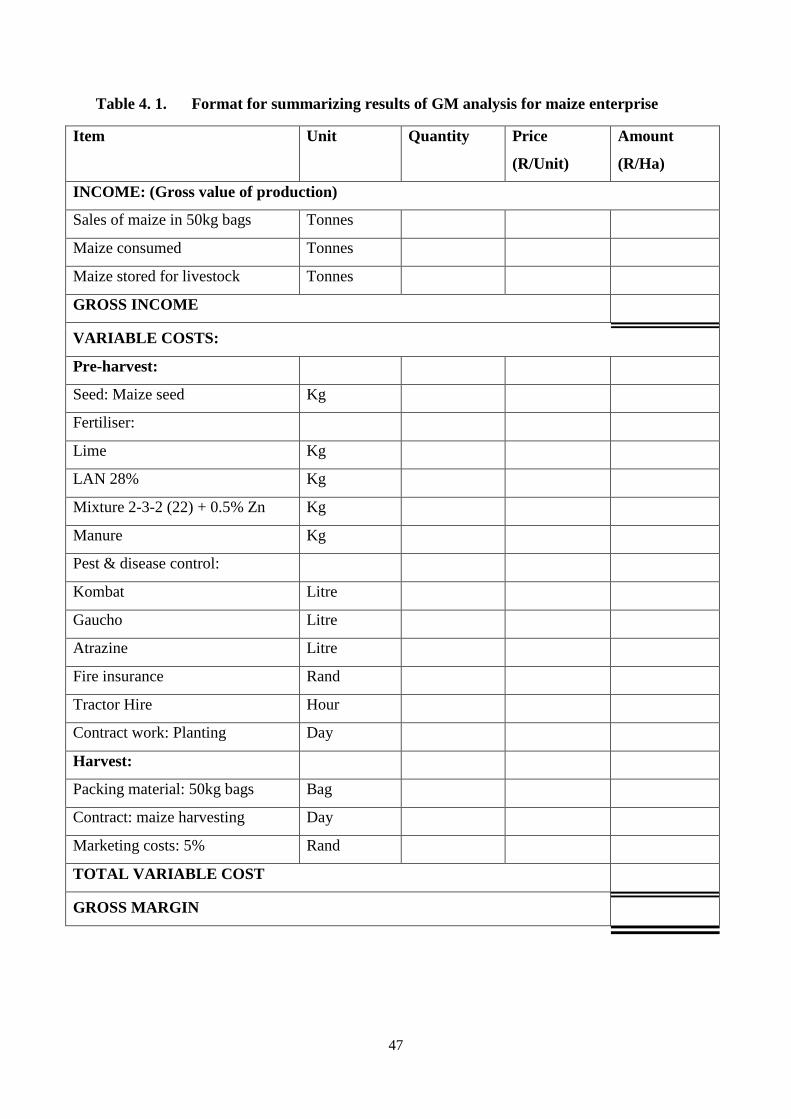
47
Table 4. 1. Format for summarizing results of GM analysis for maize enterprise
Item Unit Quantity Price
(R/Unit)
Amount
(R/Ha)
INCOME: (Gross value of production)
Sales of maize in 50kg bags Tonnes
Maize consumed Tonnes
Maize stored for livestock Tonnes
GROSS INCOME
VARIABLE COSTS:
Pre-harvest:
Seed: Maize seed Kg
Fertiliser:
Lime Kg
LAN 28% Kg
Mixture 2-3-2 (22) + 0.5% Zn Kg
Manure Kg
Pest & disease control:
Kombat Litre
Gaucho Litre
Atrazine Litre
Fire insurance Rand
Tractor Hire Hour
Contract work: Planting Day
Harvest:
Packing material: 50kg bags Bag
Contract: maize harvesting Day
Marketing costs: 5% Rand
TOTAL VARIABLE COST
GROSS MARGIN
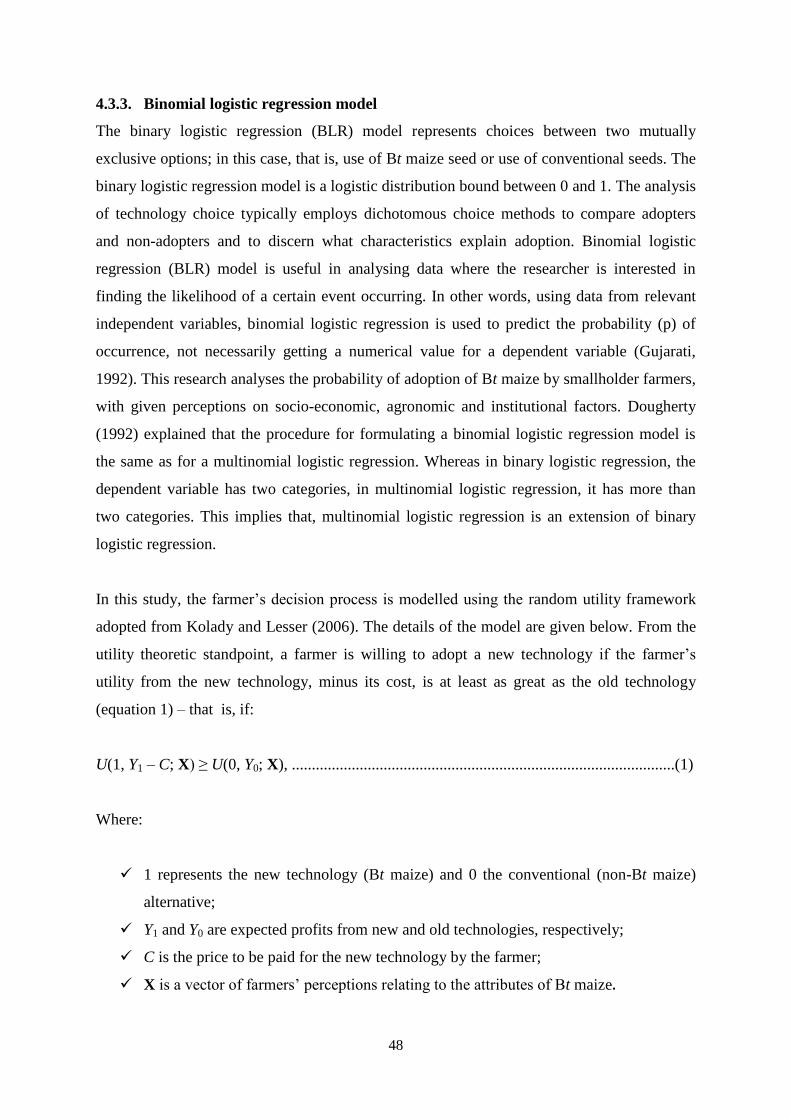
48
4.3.3. Binomial logistic regression model
The binary logistic regression (BLR) model represents choices between two mutually
exclusive options; in this case, that is, use of Bt maize seed or use of conventional seeds. The
binary logistic regression model is a logistic distribution bound between 0 and 1. The analysis
of technology choice typically employs dichotomous choice methods to compare adopters
and non-adopters and to discern what characteristics explain adoption. Binomial logistic
regression (BLR) model is useful in analysing data where the researcher is interested in
finding the likelihood of a certain event occurring. In other words, using data from relevant
independent variables, binomial logistic regression is used to predict the probability (p) of
occurrence, not necessarily getting a numerical value for a dependent variable (Gujarati,
1992). This research analyses the probability of adoption of Bt maize by smallholder farmers,
with given perceptions on socio-economic, agronomic and institutional factors. Dougherty
(1992) explained that the procedure for formulating a binomial logistic regression model is
the same as for a multinomial logistic regression. Whereas in binary logistic regression, the
dependent variable has two categories, in multinomial logistic regression, it has more than
two categories. This implies that, multinomial logistic regression is an extension of binary
logistic regression.
In this study, the farmer‟s decision process is modelled using the random utility framework
adopted from Kolady and Lesser (2006). The details of the model are given below. From the
utility theoretic standpoint, a farmer is willing to adopt a new technology if the farmer‟s
utility from the new technology, minus its cost, is at least as great as the old technology
(equation 1) – that is, if:
U(1, Y1 – C; X) ≥ U(0, Y0; X), ................................................................................................(1)
Where:
1 represents the new technology (Bt maize) and 0 the conventional (non-Bt maize)
alternative;
Y1 and Y0 are expected profits from new and old technologies, respectively;
C is the price to be paid for the new technology by the farmer;
X is a vector of farmers‟ perceptions relating to the attributes of Bt maize.
49
In the BLR model, adoption of Bt maize is a function of the probability that a particular
subject will be in one of the categories. In this study, decisions are dichotomous criterion
variables and farmers‟ economic, social, agronomic and institutional perceptions towards Bt
maize are the predictor variables. It follows that Pi represents the probability of adopting Bt
maize and (1 – Pi) represents the probability of not adopting. A typical logistic regression
model, is of the form:
Logit (Pi) = ln (Pi / 1 – Pi) = α + β1X1 +.... + βnXn .................................................................(2)
Where:
ln (Pi / 1 – Pi) = logit for seed choice
Pi = adopting Bt maize
1 - Pi = not adopting Bt maize
β = coefficient
X represents covariates
Ut = error term
Several methods can be used to explain the relationship between dependent and independent
variables. Such methods include linear regression models, probit analysis, log-linear
regression and discriminant analysis (Mohammed & Ortmann, 2005). However, binomial
logistic regression was chosen because it has more advantages, especially when dealing with
qualitative dependent variables and when the dependent variable has two categories.
Linear regression model (also known as Ordinary least squares regression (OLS)) is the most
widely used modelling method for data analysis and has been successfully applied in most
studies (Montshwe, 2006). However, Gujarati (1992) pointed out that the method is useful in
analysing data with a quantitative (numerical) dependent variable but has a tendency of
creating problems if the dependent variable is qualitative (categorical), as implied by this
study. Amongst other problems, the OLS cannot be used in this study because it can violate
the fact that the probability has to lie between 0 and 1, if there are no restrictions on the
values of the independent variables. Furthermore, binomial logistic regression guarantees that
probabilities estimated from the logit model will always lie within the logical bounds of 0 and
1 (Gujarati, 1992). Also, OLS is not practical because it assumes that the rate of change of
50
probability per unit change in the value of the explanatory variable is constant. With logit
models, probability does not increase by a constant amount but approaches 0 at a slower rate
as the value of an explanatory variable gets smaller.
When compared to log-linear regression and discriminant analysis, logistic regression proves
to be more useful. Log-linear regression requires that all independent variables be categorical
and discriminant analysis requires them all to be numerical, but logistic regression can be
used when there is a mixture of numerical and categorical independent variables (Dougherty,
1992). Also, discriminant analysis assumes multivariate normality, and this limits its usage
because the assumption may be violated (Klecka, 1980). According to Gujarati (1992), probit
analysis gives the same results as the logistic model. In this study, the logistic model was
preferred because of its relative mathematical simplicity and few assumptions in theory.
Moreover, logistic regression analysis is more statistically robust in practice, and is easier to
use and understand than other methods.
4.3.3.1. Description of the variables specified in the model
The variables examined in the study are presented in Table 4.1. Previous research has shown
that adoption of Bt maize is influenced by farmers perceptions of the attributes of Bt maize.
Hence this section presents perception statements and it also goes on to indicate the
anticipated effect on adoption of Bt maize.
(a) SURPL: This variable measure surplus obtained through use of Bt maize. The
amount of surplus is an indicator of how well the seed performs. It can therefore
be hypothesized that adoption of Bt maize and increases in surplus will move in
the same direction; the more surplus smallholder farmers obtain, the higher the
likelihood to adopt Bt maize. Conversely, farmers whose yields declined are likely
to be less eager to adopt.
(b) ELIMPESTS: This variable measures the effect of Bt maize in maize crop
protection. One of the main reasons for developing Bt maize was fighting against
pests so as to reduce production costs (Gouse et al., 2006). Thus, it can be
hypothesized that there is a positive correlation between adoption of Bt maize and
elimination of pests.
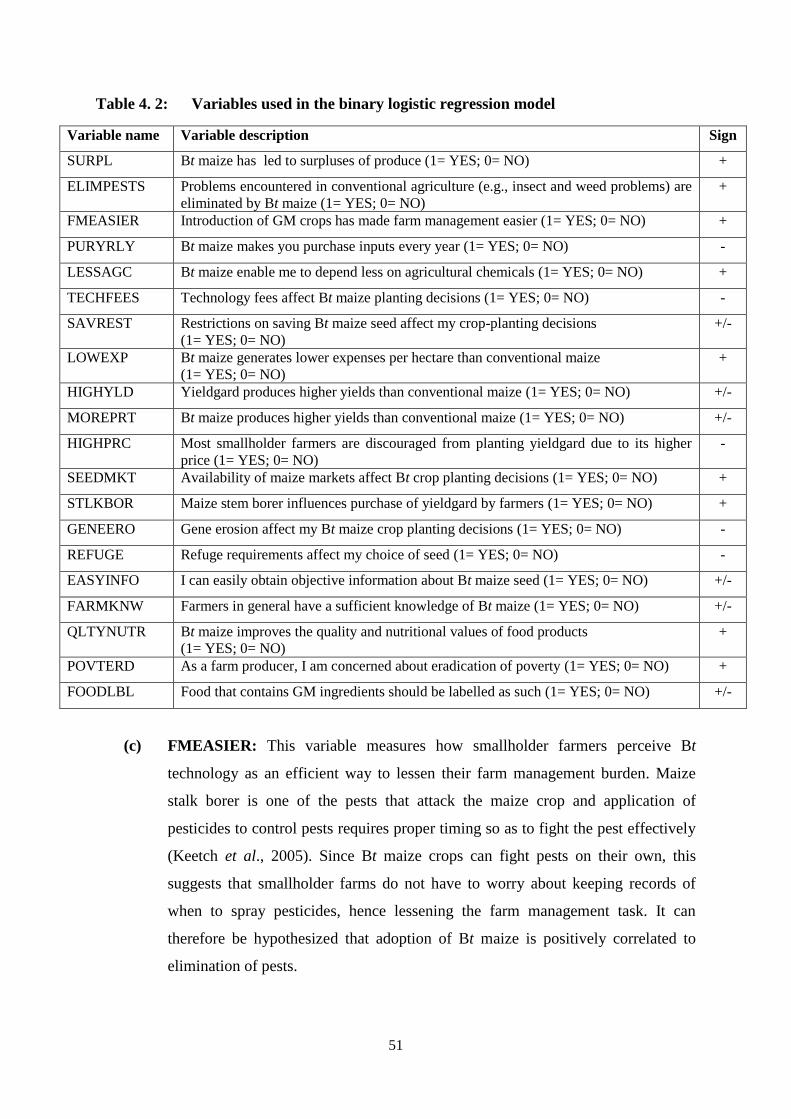
51
Table 4. 2: Variables used in the binary logistic regression model
Variable name Variable description Sign
SURPL Bt maize has led to surpluses of produce (1= YES; 0= NO) +
ELIMPESTS Problems encountered in conventional agriculture (e.g., insect and weed problems) are
eliminated by Bt maize (1= YES; 0= NO)
+
FMEASIER Introduction of GM crops has made farm management easier (1= YES; 0= NO) +
PURYRLY Bt maize makes you purchase inputs every year (1= YES; 0= NO) -
LESSAGC Bt maize enable me to depend less on agricultural chemicals (1= YES; 0= NO) +
TECHFEES Technology fees affect Bt maize planting decisions (1= YES; 0= NO) -
SAVREST Restrictions on saving Bt maize seed affect my crop-planting decisions
(1= YES; 0= NO)
+/-
LOWEXP Bt maize generates lower expenses per hectare than conventional maize
(1= YES; 0= NO)
+
HIGHYLD Yieldgard produces higher yields than conventional maize (1= YES; 0= NO) +/-
MOREPRT Bt maize produces higher yields than conventional maize (1= YES; 0= NO) +/-
HIGHPRC Most smallholder farmers are discouraged from planting yieldgard due to its higher
price (1= YES; 0= NO)
-
SEEDMKT Availability of maize markets affect Bt crop planting decisions (1= YES; 0= NO) +
STLKBOR Maize stem borer influences purchase of yieldgard by farmers (1= YES; 0= NO) +
GENEERO Gene erosion affect my Bt maize crop planting decisions (1= YES; 0= NO) -
REFUGE Refuge requirements affect my choice of seed (1= YES; 0= NO) -
EASYINFO I can easily obtain objective information about Bt maize seed (1= YES; 0= NO) +/-
FARMKNW Farmers in general have a sufficient knowledge of Bt maize (1= YES; 0= NO) +/-
QLTYNUTR Bt maize improves the quality and nutritional values of food products
(1= YES; 0= NO)
+
POVTERD As a farm producer, I am concerned about eradication of poverty (1= YES; 0= NO) +
FOODLBL Food that contains GM ingredients should be labelled as such (1= YES; 0= NO) +/-
(c) FMEASIER: This variable measures how smallholder farmers perceive Bt
technology as an efficient way to lessen their farm management burden. Maize
stalk borer is one of the pests that attack the maize crop and application of
pesticides to control pests requires proper timing so as to fight the pest effectively
(Keetch et al., 2005). Since Bt maize crops can fight pests on their own, this
suggests that smallholder farms do not have to worry about keeping records of
when to spray pesticides, hence lessening the farm management task. It can
therefore be hypothesized that adoption of Bt maize is positively correlated to
elimination of pests.
52
(d) PURYRLY: Bt maize comes along with terminator technology. This variable
therefore measures the effect of purchasing seed every production season which
goes against the tradition of replanting grain harvested from the previous season.
Thus, there is a negative correlation between adoption of Bt maize and purchasing
seed every year.
(e) LESSAGC: This variable measures the effect of less use of chemical pesticides
on the likelihood of adopting Bt maize. Smallholder farmers do not use protective
clothing most of the time hence exposing them to toxic agricultural chemicals
which increases the likelihood of developing sickness. This suggests that, Bt
maize will reduce exposure to these toxic pesticides and in turn promote better
health for the smallholder farmers. This is also supported by Keetch et al. (2005).
Thus, it can be hypothesized that there is a positive correlation between less use of
agricultural chemicals and adoption of Bt maize.
(f) TECHFEES: The price of Bt maize seed is higher in comparison to non-Bt maize
seed because of the Bt technology which the maize seed come along with. This
variable measures the likelihood of choosing Bt maize over conventional maize
seeds given that it has a higher price. Paying a higher price than usual can be a
challenge for smallholder farmer as most of them struggle to raise capital for
production. It is therefore expected that the paying a higher price will be
negatively correlated to adoption of Bt maize.
(g) SAVREST: This variable measures how saving restrictions affect adoption of Bt
maize. Since smallholder farmers are used to the tradition of saving seed. This
suggests that if they are not well informed about Bt maize they might as well save
grain from the Bt maize crop as seed for next season. However, if they are well
informed, it means that if they plant Bt maize this season they have to buy seed
again in the following season. Therefore, it is possible for either positive or
negative relationships to exist between saving restrictions and adoption of Bt
maize.
(h) LOWEXP: This variable measures the effect of Bt maize in reducing costs of
maize production. One of the necessary conditions for profit maximization is the
53
reduction in production costs. Farmers are therefore inclined to choose inputs
which reduce their cost of production. Since Bt maize reduces cost of labour and
allows the farmer to spend less on purchasing agricultural chemicals it can thus be
hypothesized that there is a positive correlation between generation of lower
expenses and adoption.
(i) HIGHYLD: This variable measures whether farmers obtain higher yields with Bt
maize in comparison with conventional seeds. In Eastern Cape Province, stalk
boring pests are some of the major challenge smallholder farmers face in the
production process. This is also supported by Gouse et al. (2006). Thus, fighting
pest through planting Bt maize using recommended practices will increase yields
and promote household food security. However, although Bt maize gives higher
yields, its high price is prohibitive for smallholder farmers due to their low
disposable incomes. Therefore, it is possible for either positive or negative
relationships to exist between high yield and adoption of Bt maize.
(j) MOREPRT: This variable measures the profitability of planting Bt maize. Gouse
et al. (2005) note that, Bt maize has the potential to substantially increase yields
and in turn to increase income for farmers. However, economic theory suggests
that when supply goes up without demand when everything is held constant the
price of the product will decrease. Furthermore, since Bt maize is targeted at
controlling stalk boring pests income gains are lower in low pest infestation
seasons. This suggests that, it is possible for either positive or negative
relationships to exist between more profit and adoption of Bt maize depending on
the levels of pest infestation.
(k) SEEDMKT: There is a link between availability and supply of seed. A sufficient
quantity of seed must be found within reasonable proximity to farmers and in time
for planting. To reap the benefits of Bt maize seed, smallholder farmers must have
access to it, which means that they must have adequate resources to secure seed
through purchase or barter trade. This variable therefore measures whether the
availability of seed markets influence adoption of Bt maize. A research conducted
by Gouse et al. (2005) indicated that there were more smallholder farmers who
planted Bt maize in the Eastern Cape Province when they obtained free seed
54
during the trial period. This suggests that there was easy access to Bt maize seed.
Thus, it can be hypothesized that there is a positive correlation between
availability and adoption of Bt maize.
(l) STLKBOR: This variable measures the effect of pest infestation on adoption of
Bt maize. Brookes (2005) indicates that Bt maize results in significant gains in
farm level income in both highly pest infected regions and those that are
moderately infested. This suggests that pest infestation does influence livelihoods
of smallholder farmers. It can therefore be hypothesized that pest infestation is
positively correlated to adoption of Bt maize.
(m) GENEERO: This variable measures whether gene erosion affects planting of Bt
maize. There risks of contaminating the local varieties with Bt maize through
cross pollination. Since smallholder farmers tend to plant local varieties due to
lack of resources to secure improved varieties, having these local varieties which
are suited to the local conditions would not be desirable. It is therefore expected
that gene erosion and adoption of Bt maize will be negatively related.
(n) REFUGE: This variable indicates whether refuge requirements influence planting
of Bt maize. When planting Bt maize farmers are required to plant non-Bt maize
crops on another field which is an average of 200 metres away from the Bt maize
field. This implies that, if farmers were used to plant maize on the whole field
they have to forego a portion of their fields and such a situation is not favourable
for smallholder farmers who normally have fields which average 2 hectares. It can
therefore be hypothesized that refuge requirement is negatively correlated to
adoption of Bt maize.
(o) EASYINFO: This variable measures how easy it is for smallholder farmers to
obtain information on Bt maize. Information to a great extent determines the
perceptions which farmers hold about Bt maize. This suggests that, if smallholder
farmers are exposed to information which is not in favour of Bt maize, it implies
that they will not have motivation to adopt Bt maize seed and vice versa. It is
therefore expected for either a positive or negative relationship to exist between
access to information and adoption of Bt maize.
55
(p) FARMKNW: This variable measures the level of knowledge of farmers.
According to Bembridge (1988), knowledge is a crucial part in the adoption
process. Having knowledge means that a farmer has heard about a new idea and
does have detailed information about it. It is therefore expected for either a
positive or negative relationship to exist between knowledge of Bt maize and
adoption depending on how well the farmer understands the knowledge he has
acquired.
(q) QLTYNUTR: This variable indicates how much quality and nutrition of Bt maize
by-products influence its adoption. Bt maize improves quality and nutritional
quality value of maize products since it prevents build up of fumonisin. Therefore
it is hypothesized that a better quality and nutritional value is positively related to
adoption of Bt maize.
(r) POVTERD: This variable indicates how concerns about poverty influence
adoption of Bt maize. Since Bt maize gives high yields and in turn high net farm
income, it is therefore hypothesized that there is a positive correlation between
adoption and aiming to fight poverty.
(s) FOODLBL: Consumers need to be empowered to make informed choices about
GMOs. However, South Africa took the position that labelling is only mandatory
if the food products differ significantly from its conventional counterpart
(Haasbroek, 2004). Therefore, it is possible for either a positive or negative
relationship to exist between labelling of food containing GM ingredients and
adoption of Bt maize.
(t) HIGHYLD: This variable measures whether farmers obtain higher yields with Bt
maize in comparison with conventional seeds. In Eastern Cape Province, stalk
boring pests are some of the major challenge smallholder farmers face in the
production process. This is also supported by Gouse et al. (2006). Thus, fighting
pest through planting Bt maize using recommended practices will increase yields
and promote household food security. However, although Bt maize gives higher
yields, its high price is prohibitive for smallholder farmers due to their low
56
disposable incomes. Therefore, it is possible for either positive or negative
relationships to exist between high yield and adoption of Bt maize.
4.4. Data collection
There were two data collection tools used to collect data from the respondents, namely a
questionnaire and a checklist. The questionnaire was the main data collection tool for this
study. However, a checklist was used during the focus group discussion as well as during the
participatory learning and action workshop.
4.4.1. Questionnaire
A questionnaire was designed as a tool for primary data collection. The questionnaire was
designed in order to collect both qualitative and quantitative data. The questionnaire was then
administered to respondents (farmers) through face-to-face interviews. There are other ways
in which questionnaires can be administered, such as self-administered questionnaires and
telephone surveys (Leedy & Ormrod, 2004).
However, face-to-face interviews were chosen because they have several advantages over the
other methods. According to Bless and Smith (2000), an interviewer administered interview
is an important tool of data collection because it reduces omission of difficult questions by
respondents. In addition, it reduces the problem of word or question misinterpretation
(misunderstandings) by respondents and can be administered to farmers who can neither read
nor write. In addition, the presence of the interviewer increases the quality of the responses
since the interviewer can probe for more specific answers (Leedy & Ormrod, 2004). In other
words, the use of interviewer-administered questionnaires ensures minimal loss of data when
compared to the other methods.
The heads of the households for the families will be chosen to be part of the sample were
interviewed. In the absence of the head, the spouse or any family member who is directly
involved in the farming activities and management was interviewed. The main respondent
provided most of the information, but was allowed to consult other household members
where necessary.
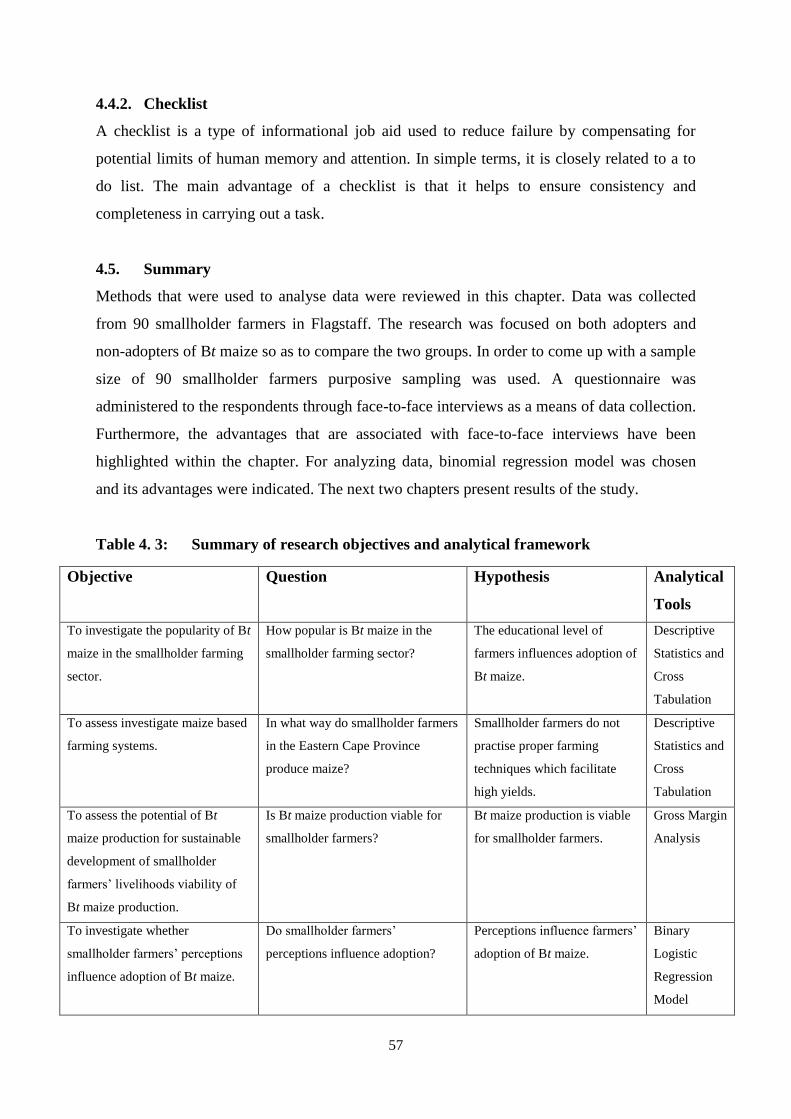
57
4.4.2. Checklist
A checklist is a type of informational job aid used to reduce failure by compensating for
potential limits of human memory and attention. In simple terms, it is closely related to a to
do list. The main advantage of a checklist is that it helps to ensure consistency and
completeness in carrying out a task.
4.5. Summary
Methods that were used to analyse data were reviewed in this chapter. Data was collected
from 90 smallholder farmers in Flagstaff. The research was focused on both adopters and
non-adopters of Bt maize so as to compare the two groups. In order to come up with a sample
size of 90 smallholder farmers purposive sampling was used. A questionnaire was
administered to the respondents through face-to-face interviews as a means of data collection.
Furthermore, the advantages that are associated with face-to-face interviews have been
highlighted within the chapter. For analyzing data, binomial regression model was chosen
and its advantages were indicated. The next two chapters present results of the study.
Table 4. 3: Summary of research objectives and analytical framework
Objective Question Hypothesis Analytical
Tools
To investigate the popularity of Bt
maize in the smallholder farming
sector.
How popular is Bt maize in the
smallholder farming sector?
The educational level of
farmers influences adoption of
Bt maize.
Descriptive
Statistics and
Cross
Tabulation
To assess investigate maize based
farming systems.
In what way do smallholder farmers
in the Eastern Cape Province
produce maize?
Smallholder farmers do not
practise proper farming
techniques which facilitate
high yields.
Descriptive
Statistics and
Cross
Tabulation
To assess the potential of Bt
maize production for sustainable
development of smallholder
farmers‟ livelihoods viability of
Bt maize production.
Is Bt maize production viable for
smallholder farmers?
Bt maize production is viable
for smallholder farmers.
Gross Margin
Analysis
To investigate whether
smallholder farmers‟ perceptions
influence adoption of Bt maize.
Do smallholder farmers‟
perceptions influence adoption?
Perceptions influence farmers‟
adoption of Bt maize.
Binary
Logistic
Regression
Model
58
CHAPTER 5: DESCRIPTIVE RESULTS AND GROSS MARGIN ANALYSIS
5.1. Introduction
This chapter discusses and analyses the results of the field survey that was carried out in the
villages of Xopozo and Mtwaku. The data under analysis were collected from 90 smallholder
farmers. The sample was made up of 45 adopters and non-adopters of Bt maize each. The
chapter begins with brief explanations of the demographic and socio-economic characteristics
of the sampled households, which is then followed by an overview of households‟ farming
characteristics. It goes on to discuss institutional aspects but giving special attention to issues
related to Bt maize production. Within the chapter, descriptive statistics such as mean,
maximum and minimum values, frequencies and standard deviation are employed.
5.2. Demographic and socio-economic characteristics of sample farmers
Since the participants were household representatives, they all had to be 18 years and older
and had to reside in villages of Xopozo and Mtwaku which are 25km and 15km from
Flagstaff respectively. The age limitation was to ensure that only individuals who influence
household food production decisions were included in the study. Hence, in this section,
household head‟s aspects such as gender, age, marital status, highest educational levels and
household size are discussed.
5.2.1. Gender distribution of household heads
Farmers were divided according to their choice of maize in order to investigate whether
gender influences the choice of seed. However, the similarities or differences between
proportions of men and women may lead to inequitable responses from supplier of seed and
discrimination against either of the two sexes. Figure 5.1 below reveals that the majority of
study respondents were females. Furthermore, details of the sample distribution according to
the maize seed variety used are shown in Table 5.1 below.
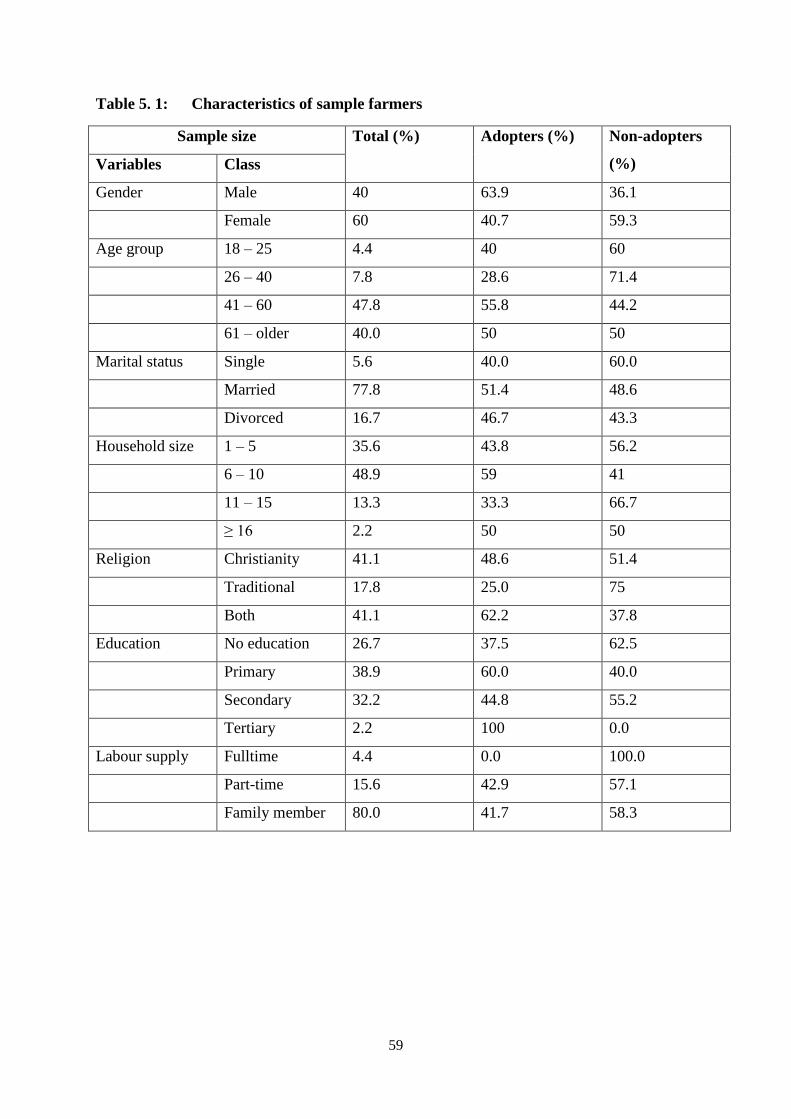
59
Table 5. 1: Characteristics of sample farmers
Sample size Total (%) Adopters (%) Non-adopters
(%) Variables Class
Gender Male 40 63.9 36.1
Female 60 40.7 59.3
Age group 18 – 25 4.4 40 60
26 – 40 7.8 28.6 71.4
41 – 60 47.8 55.8 44.2
61 – older 40.0 50 50
Marital status Single 5.6 40.0 60.0
Married 77.8 51.4 48.6
Divorced 16.7 46.7 43.3
Household size 1 – 5 35.6 43.8 56.2
6 – 10 48.9 59 41
11 – 15 13.3 33.3 66.7
≥ 16 2.2 50 50
Religion Christianity 41.1 48.6 51.4
Traditional 17.8 25.0 75
Both 41.1 62.2 37.8
Education No education 26.7 37.5 62.5
Primary 38.9 60.0 40.0
Secondary 32.2 44.8 55.2
Tertiary 2.2 100 0.0
Labour supply Fulltime 4.4 0.0 100.0
Part-time 15.6 42.9 57.1
Family member 80.0 41.7 58.3
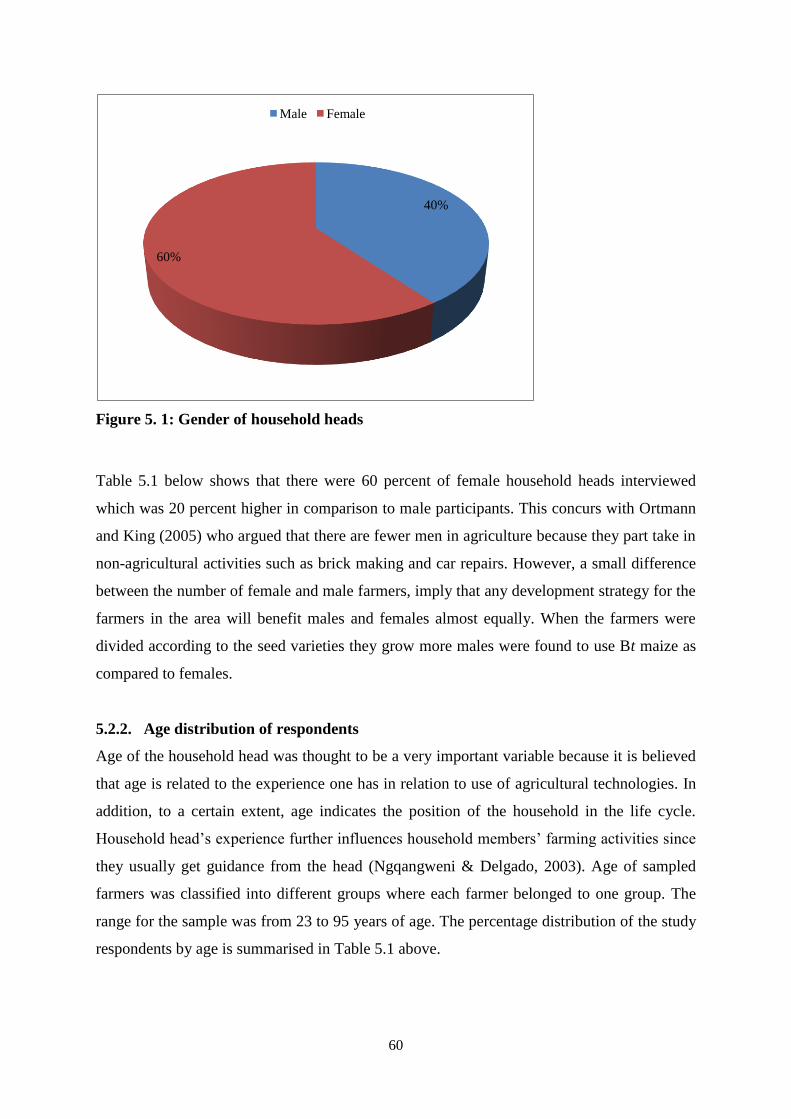
60
Figure 5. 1: Gender of household heads
Table 5.1 below shows that there were 60 percent of female household heads interviewed
which was 20 percent higher in comparison to male participants. This concurs with Ortmann
and King (2005) who argued that there are fewer men in agriculture because they part take in
non-agricultural activities such as brick making and car repairs. However, a small difference
between the number of female and male farmers, imply that any development strategy for the
farmers in the area will benefit males and females almost equally. When the farmers were
divided according to the seed varieties they grow more males were found to use Bt maize as
compared to females.
5.2.2. Age distribution of respondents
Age of the household head was thought to be a very important variable because it is believed
that age is related to the experience one has in relation to use of agricultural technologies. In
addition, to a certain extent, age indicates the position of the household in the life cycle.
Household head‟s experience further influences household members‟ farming activities since
they usually get guidance from the head (Ngqangweni & Delgado, 2003). Age of sampled
farmers was classified into different groups where each farmer belonged to one group. The
range for the sample was from 23 to 95 years of age. The percentage distribution of the study
respondents by age is summarised in Table 5.1 above.
40%
60%
Male Female
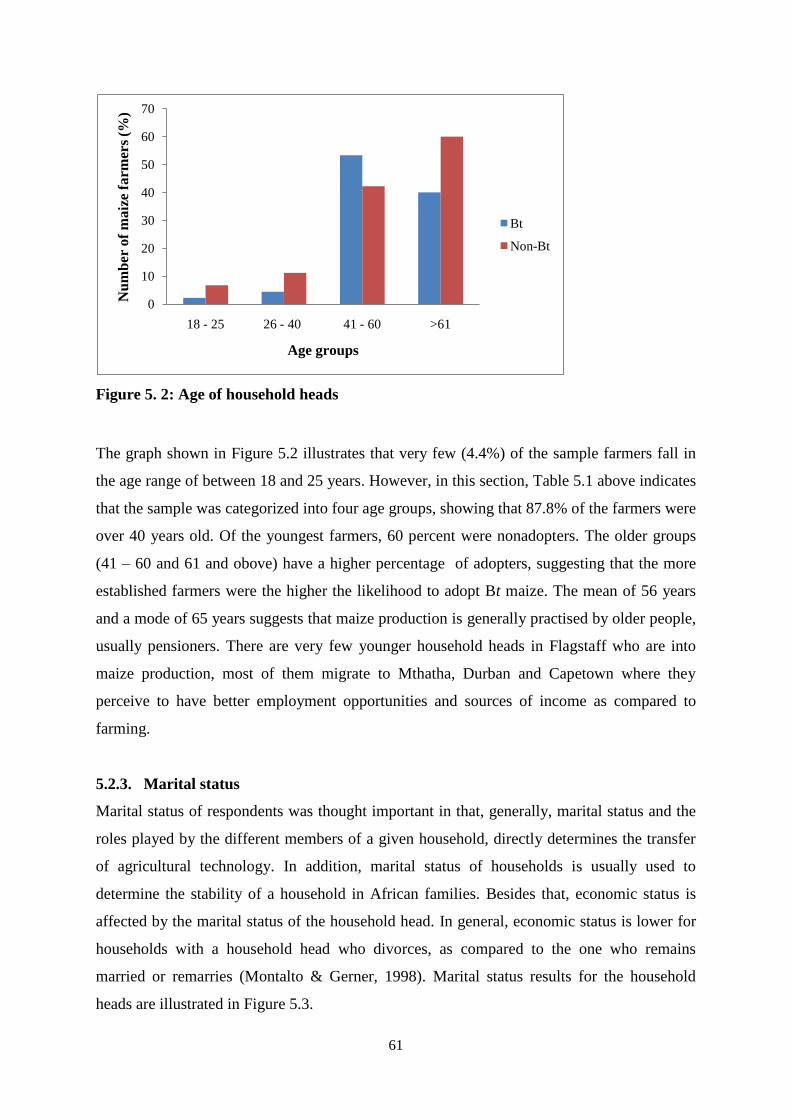
61
Figure 5. 2: Age of household heads
The graph shown in Figure 5.2 illustrates that very few (4.4%) of the sample farmers fall in
the age range of between 18 and 25 years. However, in this section, Table 5.1 above indicates
that the sample was categorized into four age groups, showing that 87.8% of the farmers were
over 40 years old. Of the youngest farmers, 60 percent were nonadopters. The older groups
(41 – 60 and 61 and obove) have a higher percentage of adopters, suggesting that the more
established farmers were the higher the likelihood to adopt Bt maize. The mean of 56 years
and a mode of 65 years suggests that maize production is generally practised by older people,
usually pensioners. There are very few younger household heads in Flagstaff who are into
maize production, most of them migrate to Mthatha, Durban and Capetown where they
perceive to have better employment opportunities and sources of income as compared to
farming.
5.2.3. Marital status
Marital status of respondents was thought important in that, generally, marital status and the
roles played by the different members of a given household, directly determines the transfer
of agricultural technology. In addition, marital status of households is usually used to
determine the stability of a household in African families. Besides that, economic status is
affected by the marital status of the household head. In general, economic status is lower for
households with a household head who divorces, as compared to the one who remains
married or remarries (Montalto & Gerner, 1998). Marital status results for the household
heads are illustrated in Figure 5.3.
0
10
20
30
40
50
60
70
18 - 25 26 - 40 41 - 60 >61
Nu
mb
er o
f m
aiz
e f
arm
ers
(%)
Age groups
Bt
Non-Bt
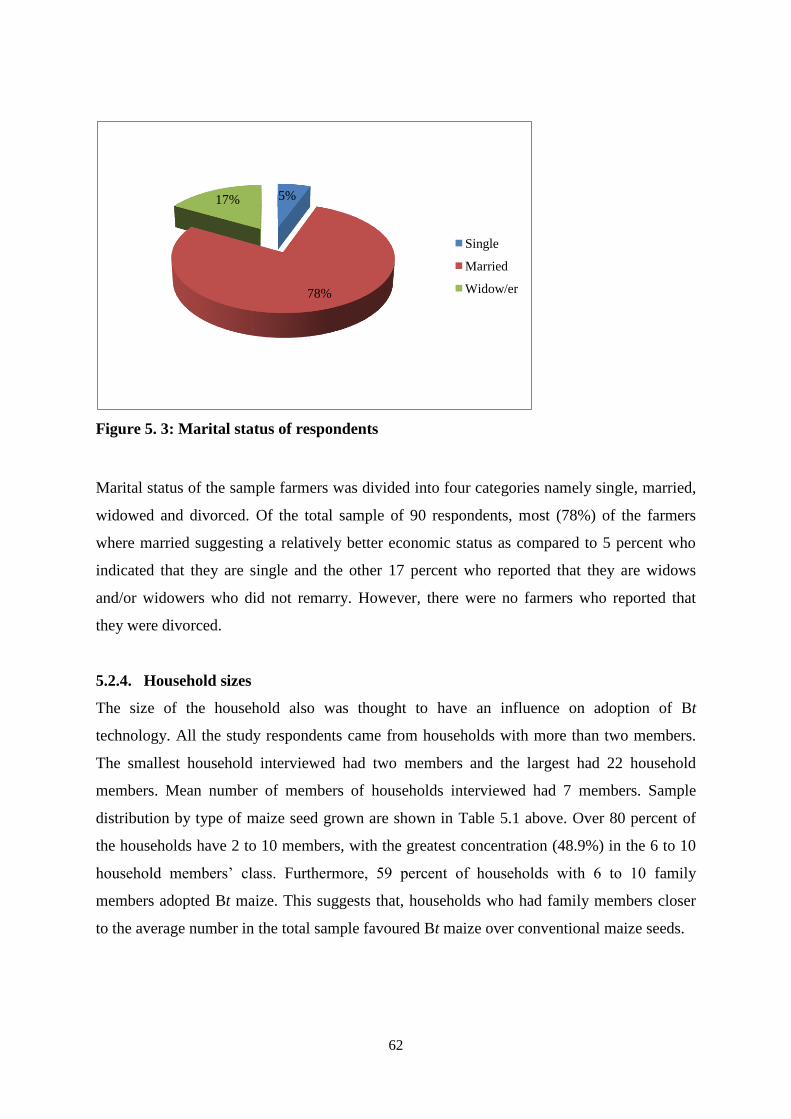
62
Figure 5. 3: Marital status of respondents
Marital status of the sample farmers was divided into four categories namely single, married,
widowed and divorced. Of the total sample of 90 respondents, most (78%) of the farmers
where married suggesting a relatively better economic status as compared to 5 percent who
indicated that they are single and the other 17 percent who reported that they are widows
and/or widowers who did not remarry. However, there were no farmers who reported that
they were divorced.
5.2.4. Household sizes
The size of the household also was thought to have an influence on adoption of Bt
technology. All the study respondents came from households with more than two members.
The smallest household interviewed had two members and the largest had 22 household
members. Mean number of members of households interviewed had 7 members. Sample
distribution by type of maize seed grown are shown in Table 5.1 above. Over 80 percent of
the households have 2 to 10 members, with the greatest concentration (48.9%) in the 6 to 10
household members‟ class. Furthermore, 59 percent of households with 6 to 10 family
members adopted Bt maize. This suggests that, households who had family members closer
to the average number in the total sample favoured Bt maize over conventional maize seeds.
5%
78%
17%
Single
Married
Widow/er
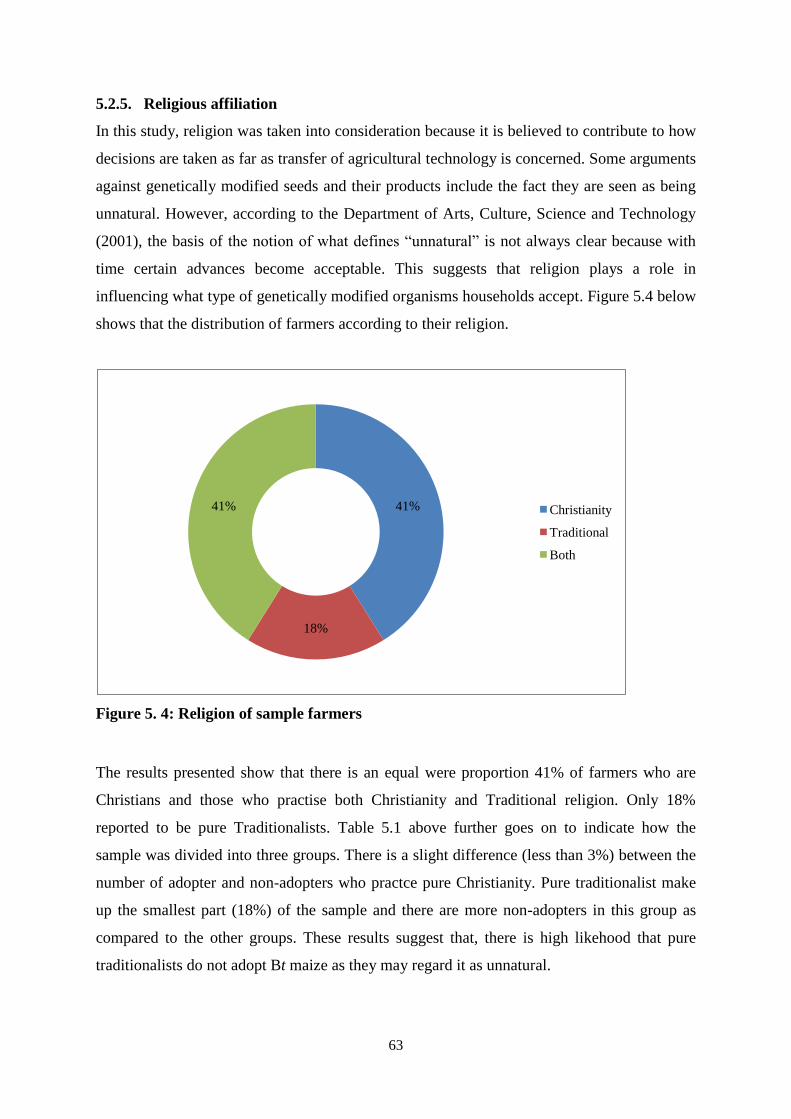
63
5.2.5. Religious affiliation
In this study, religion was taken into consideration because it is believed to contribute to how
decisions are taken as far as transfer of agricultural technology is concerned. Some arguments
against genetically modified seeds and their products include the fact they are seen as being
unnatural. However, according to the Department of Arts, Culture, Science and Technology
(2001), the basis of the notion of what defines “unnatural” is not always clear because with
time certain advances become acceptable. This suggests that religion plays a role in
influencing what type of genetically modified organisms households accept. Figure 5.4 below
shows that the distribution of farmers according to their religion.
Figure 5. 4: Religion of sample farmers
The results presented show that there is an equal were proportion 41% of farmers who are
Christians and those who practise both Christianity and Traditional religion. Only 18%
reported to be pure Traditionalists. Table 5.1 above further goes on to indicate how the
sample was divided into three groups. There is a slight difference (less than 3%) between the
number of adopter and non-adopters who practce pure Christianity. Pure traditionalist make
up the smallest part (18%) of the sample and there are more non-adopters in this group as
compared to the other groups. These results suggest that, there is high likehood that pure
traditionalists do not adopt Bt maize as they may regard it as unnatural.
41%
18%
41% Christianity
Traditional
Both
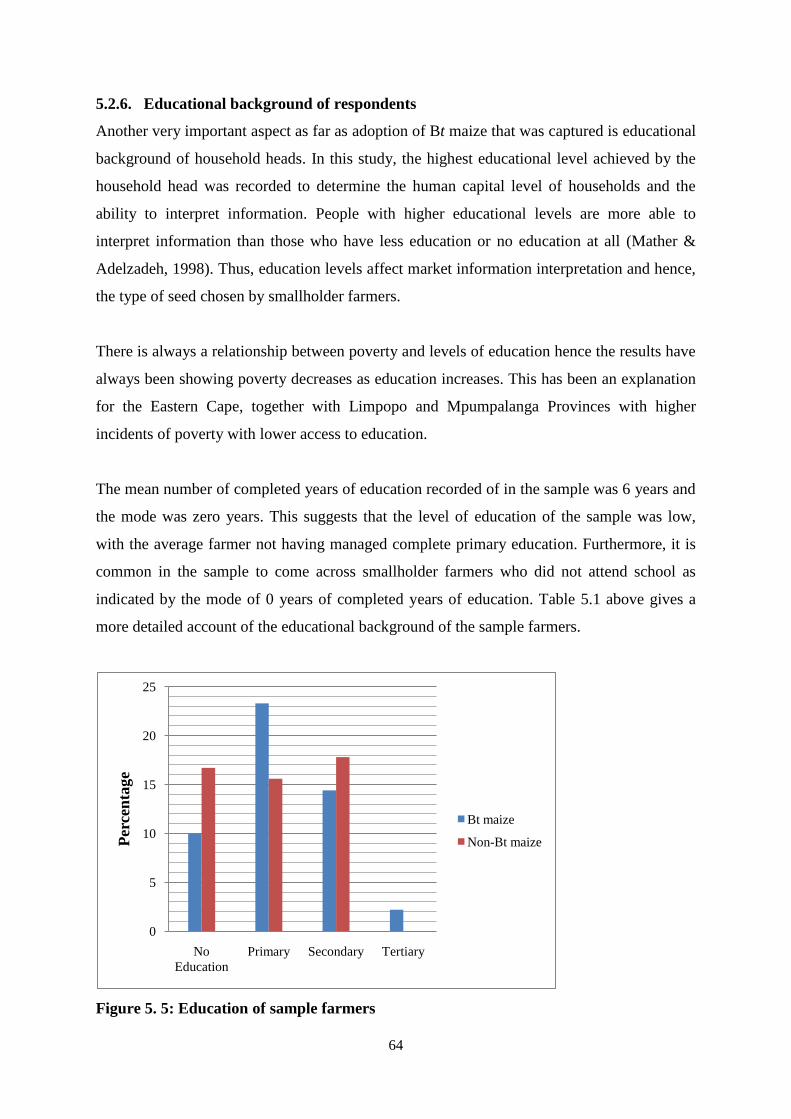
64
5.2.6. Educational background of respondents
Another very important aspect as far as adoption of Bt maize that was captured is educational
background of household heads. In this study, the highest educational level achieved by the
household head was recorded to determine the human capital level of households and the
ability to interpret information. People with higher educational levels are more able to
interpret information than those who have less education or no education at all (Mather &
Adelzadeh, 1998). Thus, education levels affect market information interpretation and hence,
the type of seed chosen by smallholder farmers.
There is always a relationship between poverty and levels of education hence the results have
always been showing poverty decreases as education increases. This has been an explanation
for the Eastern Cape, together with Limpopo and Mpumpalanga Provinces with higher
incidents of poverty with lower access to education.
The mean number of completed years of education recorded of in the sample was 6 years and
the mode was zero years. This suggests that the level of education of the sample was low,
with the average farmer not having managed complete primary education. Furthermore, it is
common in the sample to come across smallholder farmers who did not attend school as
indicated by the mode of 0 years of completed years of education. Table 5.1 above gives a
more detailed account of the educational background of the sample farmers.
Figure 5. 5: Education of sample farmers
0
5
10
15
20
25
No
Education
Primary Secondary Tertiary
Per
cen
tage
Bt maize
Non-Bt maize
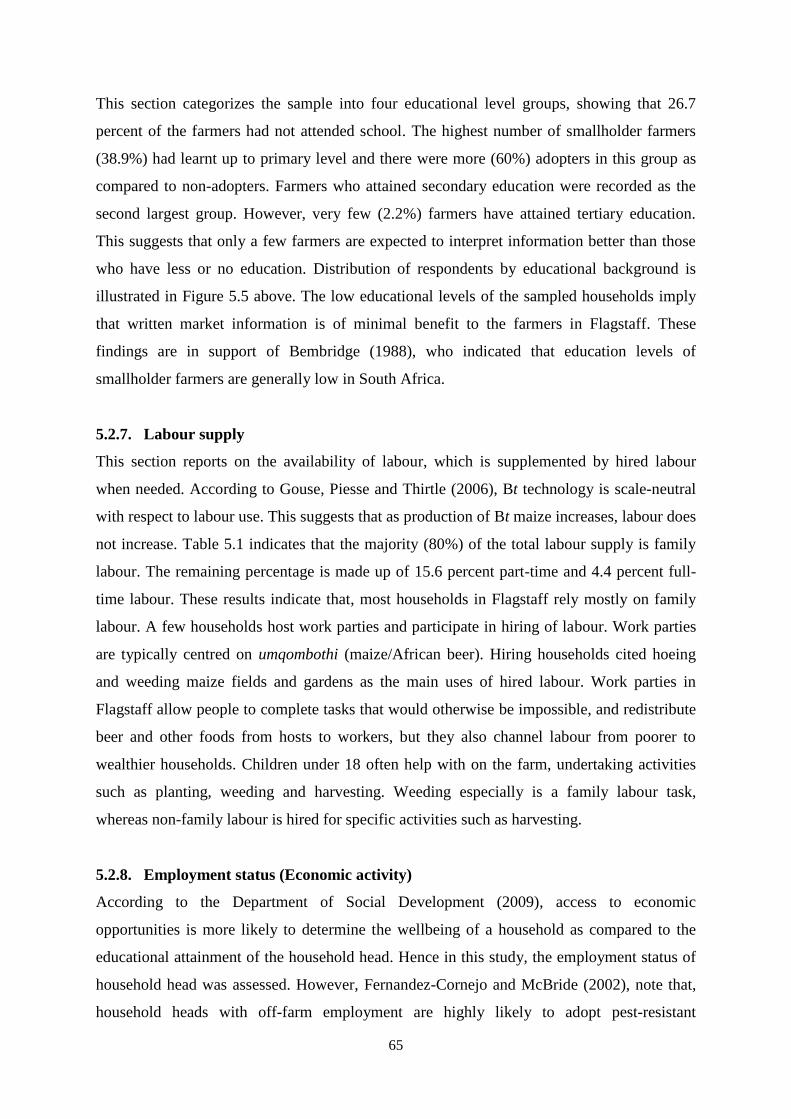
65
This section categorizes the sample into four educational level groups, showing that 26.7
percent of the farmers had not attended school. The highest number of smallholder farmers
(38.9%) had learnt up to primary level and there were more (60%) adopters in this group as
compared to non-adopters. Farmers who attained secondary education were recorded as the
second largest group. However, very few (2.2%) farmers have attained tertiary education.
This suggests that only a few farmers are expected to interpret information better than those
who have less or no education. Distribution of respondents by educational background is
illustrated in Figure 5.5 above. The low educational levels of the sampled households imply
that written market information is of minimal benefit to the farmers in Flagstaff. These
findings are in support of Bembridge (1988), who indicated that education levels of
smallholder farmers are generally low in South Africa.
5.2.7. Labour supply
This section reports on the availability of labour, which is supplemented by hired labour
when needed. According to Gouse, Piesse and Thirtle (2006), Bt technology is scale-neutral
with respect to labour use. This suggests that as production of Bt maize increases, labour does
not increase. Table 5.1 indicates that the majority (80%) of the total labour supply is family
labour. The remaining percentage is made up of 15.6 percent part-time and 4.4 percent full-
time labour. These results indicate that, most households in Flagstaff rely mostly on family
labour. A few households host work parties and participate in hiring of labour. Work parties
are typically centred on umqombothi (maize/African beer). Hiring households cited hoeing
and weeding maize fields and gardens as the main uses of hired labour. Work parties in
Flagstaff allow people to complete tasks that would otherwise be impossible, and redistribute
beer and other foods from hosts to workers, but they also channel labour from poorer to
wealthier households. Children under 18 often help with on the farm, undertaking activities
such as planting, weeding and harvesting. Weeding especially is a family labour task,
whereas non-family labour is hired for specific activities such as harvesting.
5.2.8. Employment status (Economic activity)
According to the Department of Social Development (2009), access to economic
opportunities is more likely to determine the wellbeing of a household as compared to the
educational attainment of the household head. Hence in this study, the employment status of
household head was assessed. However, Fernandez-Cornejo and McBride (2002), note that,
household heads with off-farm employment are highly likely to adopt pest-resistant
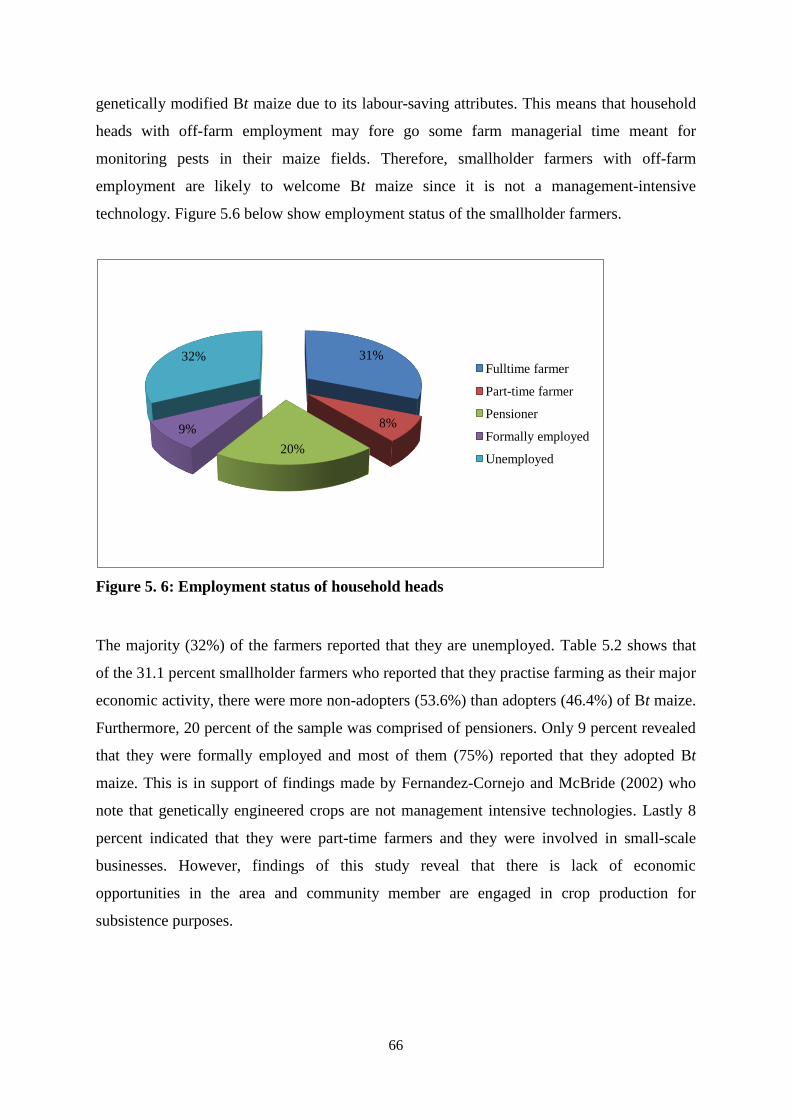
66
genetically modified Bt maize due to its labour-saving attributes. This means that household
heads with off-farm employment may fore go some farm managerial time meant for
monitoring pests in their maize fields. Therefore, smallholder farmers with off-farm
employment are likely to welcome Bt maize since it is not a management-intensive
technology. Figure 5.6 below show employment status of the smallholder farmers.
Figure 5. 6: Employment status of household heads
The majority (32%) of the farmers reported that they are unemployed. Table 5.2 shows that
of the 31.1 percent smallholder farmers who reported that they practise farming as their major
economic activity, there were more non-adopters (53.6%) than adopters (46.4%) of Bt maize.
Furthermore, 20 percent of the sample was comprised of pensioners. Only 9 percent revealed
that they were formally employed and most of them (75%) reported that they adopted Bt
maize. This is in support of findings made by Fernandez-Cornejo and McBride (2002) who
note that genetically engineered crops are not management intensive technologies. Lastly 8
percent indicated that they were part-time farmers and they were involved in small-scale
businesses. However, findings of this study reveal that there is lack of economic
opportunities in the area and community member are engaged in crop production for
subsistence purposes.
31%
8%
20%
9%
32%Fulltime farmer
Part-time farmer
Pensioner
Formally employed
Unemployed
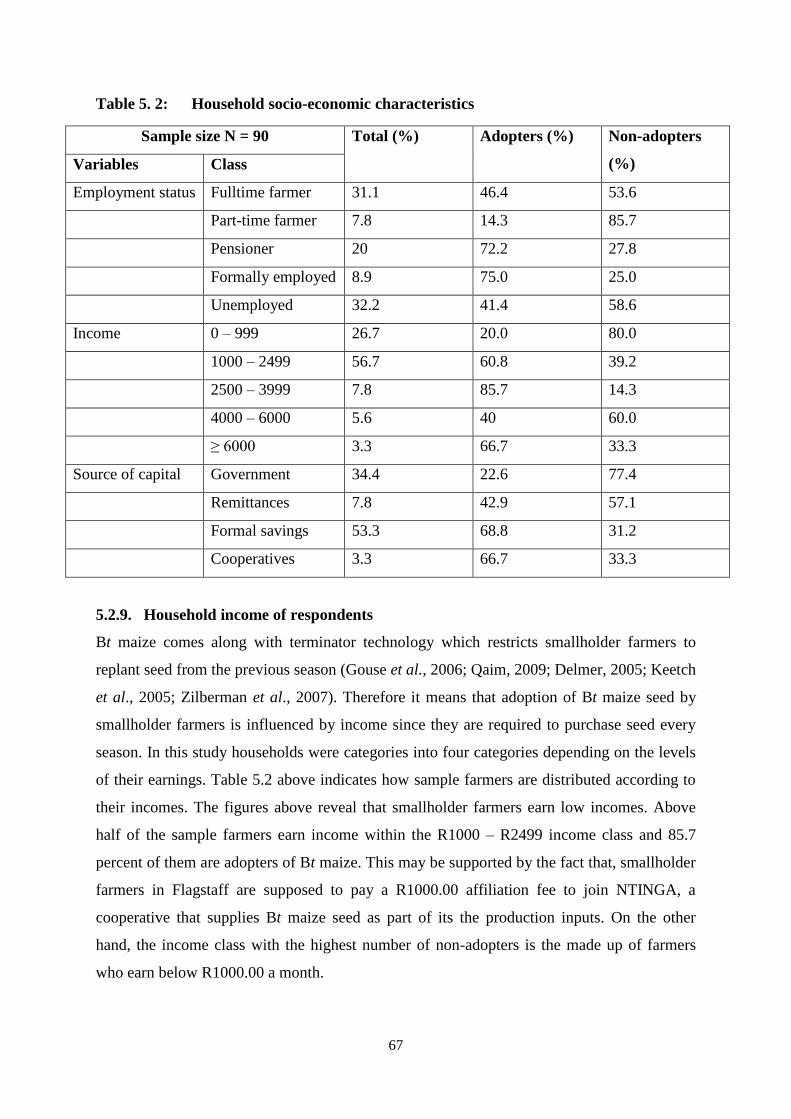
67
Table 5. 2: Household socio-economic characteristics
Sample size N = 90 Total (%) Adopters (%) Non-adopters
(%) Variables Class
Employment status Fulltime farmer 31.1 46.4 53.6
Part-time farmer 7.8 14.3 85.7
Pensioner 20 72.2 27.8
Formally employed 8.9 75.0 25.0
Unemployed 32.2 41.4 58.6
Income 0 – 999 26.7 20.0 80.0
1000 – 2499 56.7 60.8 39.2
2500 – 3999 7.8 85.7 14.3
4000 – 6000 5.6 40 60.0
≥ 6000 3.3 66.7 33.3
Source of capital Government 34.4 22.6 77.4
Remittances 7.8 42.9 57.1
Formal savings 53.3 68.8 31.2
Cooperatives 3.3 66.7 33.3
5.2.9. Household income of respondents
Bt maize comes along with terminator technology which restricts smallholder farmers to
replant seed from the previous season (Gouse et al., 2006; Qaim, 2009; Delmer, 2005; Keetch
et al., 2005; Zilberman et al., 2007). Therefore it means that adoption of Bt maize seed by
smallholder farmers is influenced by income since they are required to purchase seed every
season. In this study households were categories into four categories depending on the levels
of their earnings. Table 5.2 above indicates how sample farmers are distributed according to
their incomes. The figures above reveal that smallholder farmers earn low incomes. Above
half of the sample farmers earn income within the R1000 – R2499 income class and 85.7
percent of them are adopters of Bt maize. This may be supported by the fact that, smallholder
farmers in Flagstaff are supposed to pay a R1000.00 affiliation fee to join NTINGA, a
cooperative that supplies Bt maize seed as part of its the production inputs. On the other
hand, the income class with the highest number of non-adopters is the made up of farmers
who earn below R1000.00 a month.
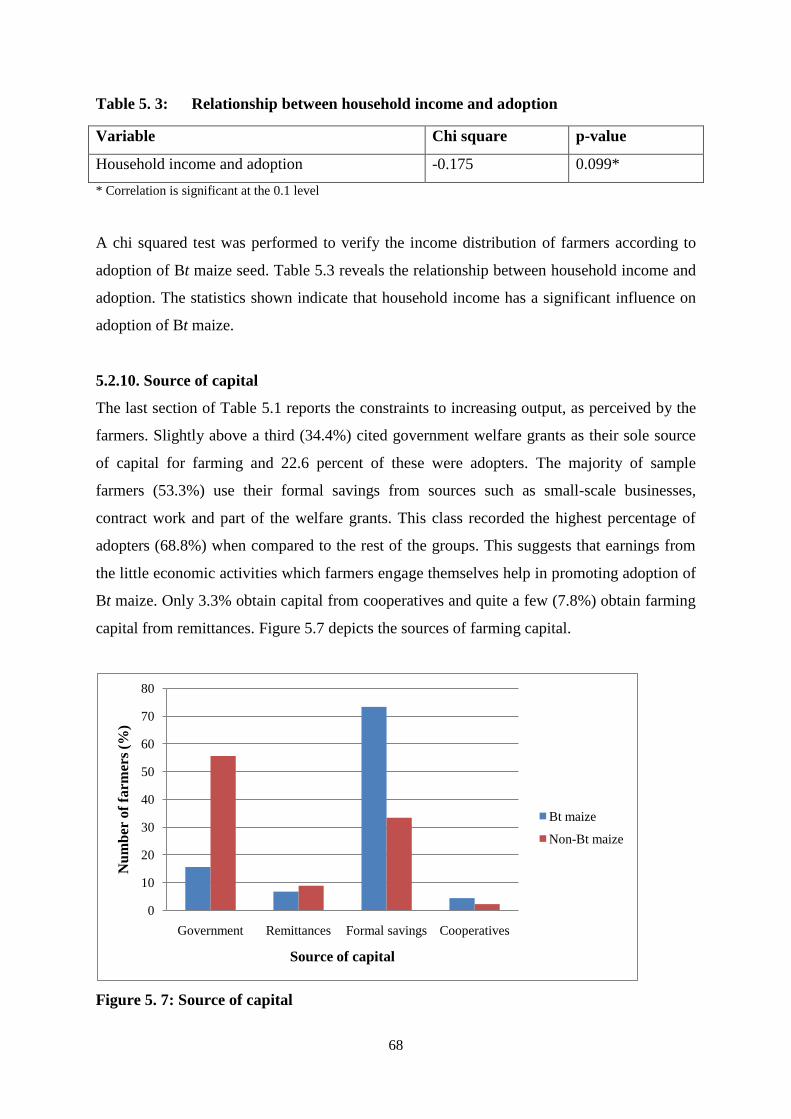
68
Table 5. 3: Relationship between household income and adoption
Variable Chi square p-value
Household income and adoption -0.175 0.099*
* Correlation is significant at the 0.1 level
A chi squared test was performed to verify the income distribution of farmers according to
adoption of Bt maize seed. Table 5.3 reveals the relationship between household income and
adoption. The statistics shown indicate that household income has a significant influence on
adoption of Bt maize.
5.2.10. Source of capital
The last section of Table 5.1 reports the constraints to increasing output, as perceived by the
farmers. Slightly above a third (34.4%) cited government welfare grants as their sole source
of capital for farming and 22.6 percent of these were adopters. The majority of sample
farmers (53.3%) use their formal savings from sources such as small-scale businesses,
contract work and part of the welfare grants. This class recorded the highest percentage of
adopters (68.8%) when compared to the rest of the groups. This suggests that earnings from
the little economic activities which farmers engage themselves help in promoting adoption of
Bt maize. Only 3.3% obtain capital from cooperatives and quite a few (7.8%) obtain farming
capital from remittances. Figure 5.7 depicts the sources of farming capital.
Figure 5. 7: Source of capital
0
10
20
30
40
50
60
70
80
Government Remittances Formal savings Cooperatives
Nu
mb
er o
f fa
rmer
s (%
)
Source of capital
Bt maize
Non-Bt maize
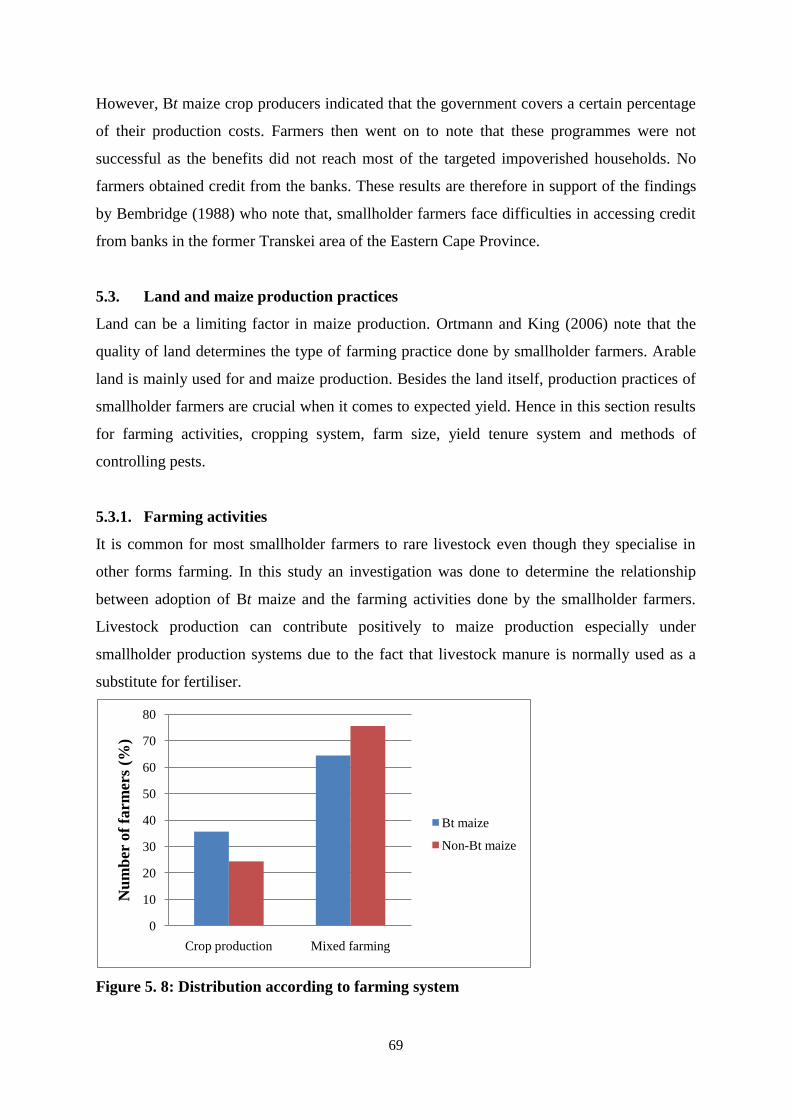
69
However, Bt maize crop producers indicated that the government covers a certain percentage
of their production costs. Farmers then went on to note that these programmes were not
successful as the benefits did not reach most of the targeted impoverished households. No
farmers obtained credit from the banks. These results are therefore in support of the findings
by Bembridge (1988) who note that, smallholder farmers face difficulties in accessing credit
from banks in the former Transkei area of the Eastern Cape Province.
5.3. Land and maize production practices
Land can be a limiting factor in maize production. Ortmann and King (2006) note that the
quality of land determines the type of farming practice done by smallholder farmers. Arable
land is mainly used for and maize production. Besides the land itself, production practices of
smallholder farmers are crucial when it comes to expected yield. Hence in this section results
for farming activities, cropping system, farm size, yield tenure system and methods of
controlling pests.
5.3.1. Farming activities
It is common for most smallholder farmers to rare livestock even though they specialise in
other forms farming. In this study an investigation was done to determine the relationship
between adoption of Bt maize and the farming activities done by the smallholder farmers.
Livestock production can contribute positively to maize production especially under
smallholder production systems due to the fact that livestock manure is normally used as a
substitute for fertiliser.
Figure 5. 8: Distribution according to farming system
0
10
20
30
40
50
60
70
80
Crop production Mixed farming
Nu
mb
er o
f fa
rmer
s (%
)
Bt maize
Non-Bt maize
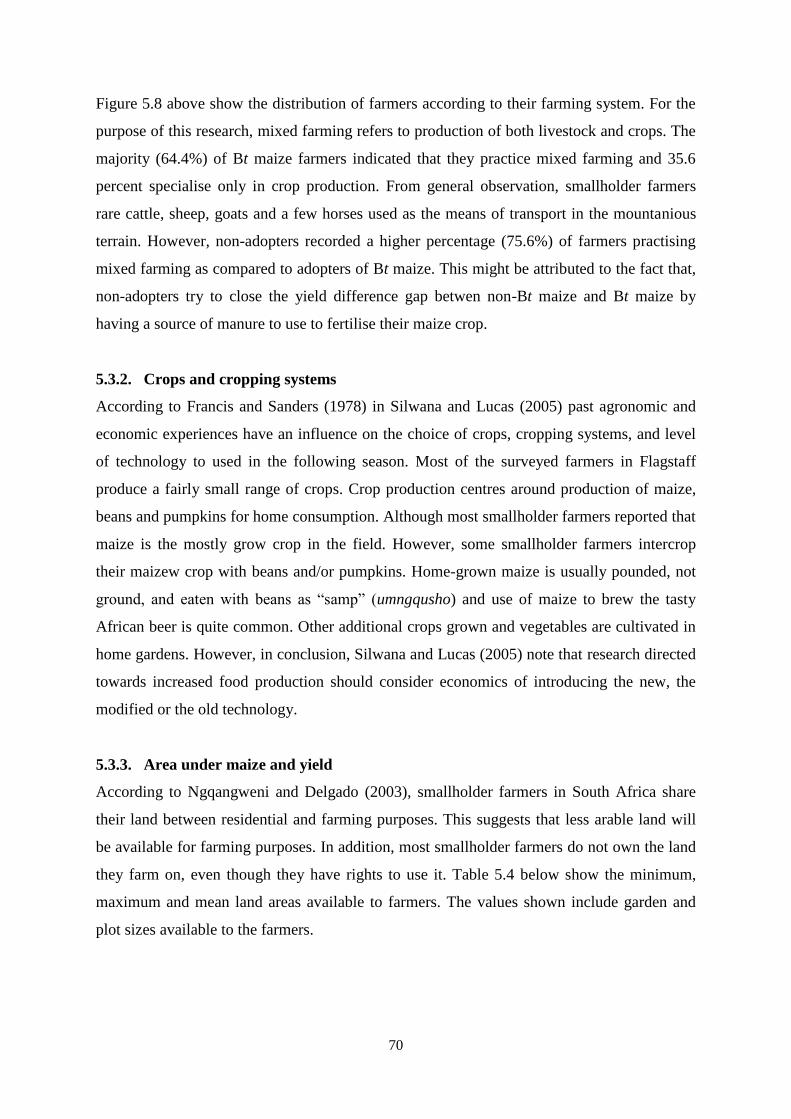
70
Figure 5.8 above show the distribution of farmers according to their farming system. For the
purpose of this research, mixed farming refers to production of both livestock and crops. The
majority (64.4%) of Bt maize farmers indicated that they practice mixed farming and 35.6
percent specialise only in crop production. From general observation, smallholder farmers
rare cattle, sheep, goats and a few horses used as the means of transport in the mountanious
terrain. However, non-adopters recorded a higher percentage (75.6%) of farmers practising
mixed farming as compared to adopters of Bt maize. This might be attributed to the fact that,
non-adopters try to close the yield difference gap betwen non-Bt maize and Bt maize by
having a source of manure to use to fertilise their maize crop.
5.3.2. Crops and cropping systems
According to Francis and Sanders (1978) in Silwana and Lucas (2005) past agronomic and
economic experiences have an influence on the choice of crops, cropping systems, and level
of technology to used in the following season. Most of the surveyed farmers in Flagstaff
produce a fairly small range of crops. Crop production centres around production of maize,
beans and pumpkins for home consumption. Although most smallholder farmers reported that
maize is the mostly grow crop in the field. However, some smallholder farmers intercrop
their maizew crop with beans and/or pumpkins. Home-grown maize is usually pounded, not
ground, and eaten with beans as “samp” (umngqusho) and use of maize to brew the tasty
African beer is quite common. Other additional crops grown and vegetables are cultivated in
home gardens. However, in conclusion, Silwana and Lucas (2005) note that research directed
towards increased food production should consider economics of introducing the new, the
modified or the old technology.
5.3.3. Area under maize and yield
According to Ngqangweni and Delgado (2003), smallholder farmers in South Africa share
their land between residential and farming purposes. This suggests that less arable land will
be available for farming purposes. In addition, most smallholder farmers do not own the land
they farm on, even though they have rights to use it. Table 5.4 below show the minimum,
maximum and mean land areas available to farmers. The values shown include garden and
plot sizes available to the farmers.
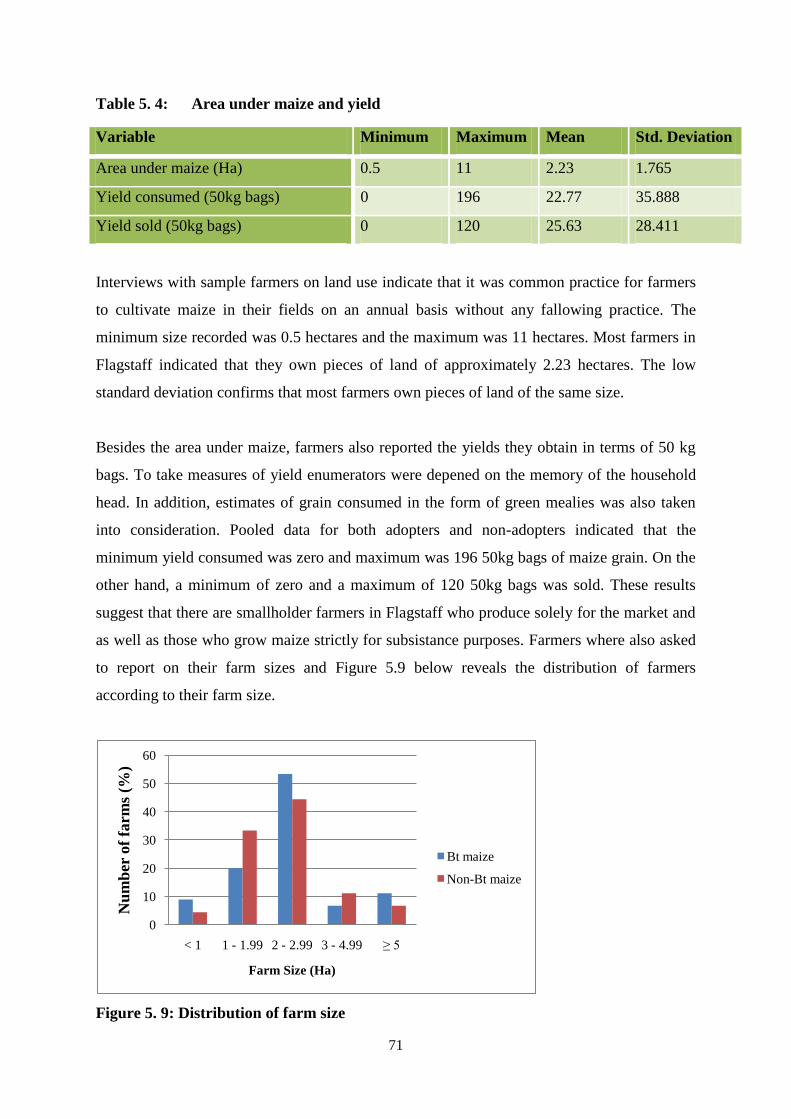
71
Table 5. 4: Area under maize and yield
Variable Minimum Maximum Mean Std. Deviation
Area under maize (Ha) 0.5 11 2.23 1.765
Yield consumed (50kg bags) 0 196 22.77 35.888
Yield sold (50kg bags) 0 120 25.63 28.411
Interviews with sample farmers on land use indicate that it was common practice for farmers
to cultivate maize in their fields on an annual basis without any fallowing practice. The
minimum size recorded was 0.5 hectares and the maximum was 11 hectares. Most farmers in
Flagstaff indicated that they own pieces of land of approximately 2.23 hectares. The low
standard deviation confirms that most farmers own pieces of land of the same size.
Besides the area under maize, farmers also reported the yields they obtain in terms of 50 kg
bags. To take measures of yield enumerators were depened on the memory of the household
head. In addition, estimates of grain consumed in the form of green mealies was also taken
into consideration. Pooled data for both adopters and non-adopters indicated that the
minimum yield consumed was zero and maximum was 196 50kg bags of maize grain. On the
other hand, a minimum of zero and a maximum of 120 50kg bags was sold. These results
suggest that there are smallholder farmers in Flagstaff who produce solely for the market and
as well as those who grow maize strictly for subsistance purposes. Farmers where also asked
to report on their farm sizes and Figure 5.9 below reveals the distribution of farmers
according to their farm size.
Figure 5. 9: Distribution of farm size
0
10
20
30
40
50
60
< 1 1 - 1.99 2 - 2.99 3 - 4.99 ≥ 5
Nu
mb
er o
f fa
rms
(%)
Farm Size (Ha)
Bt maize
Non-Bt maize
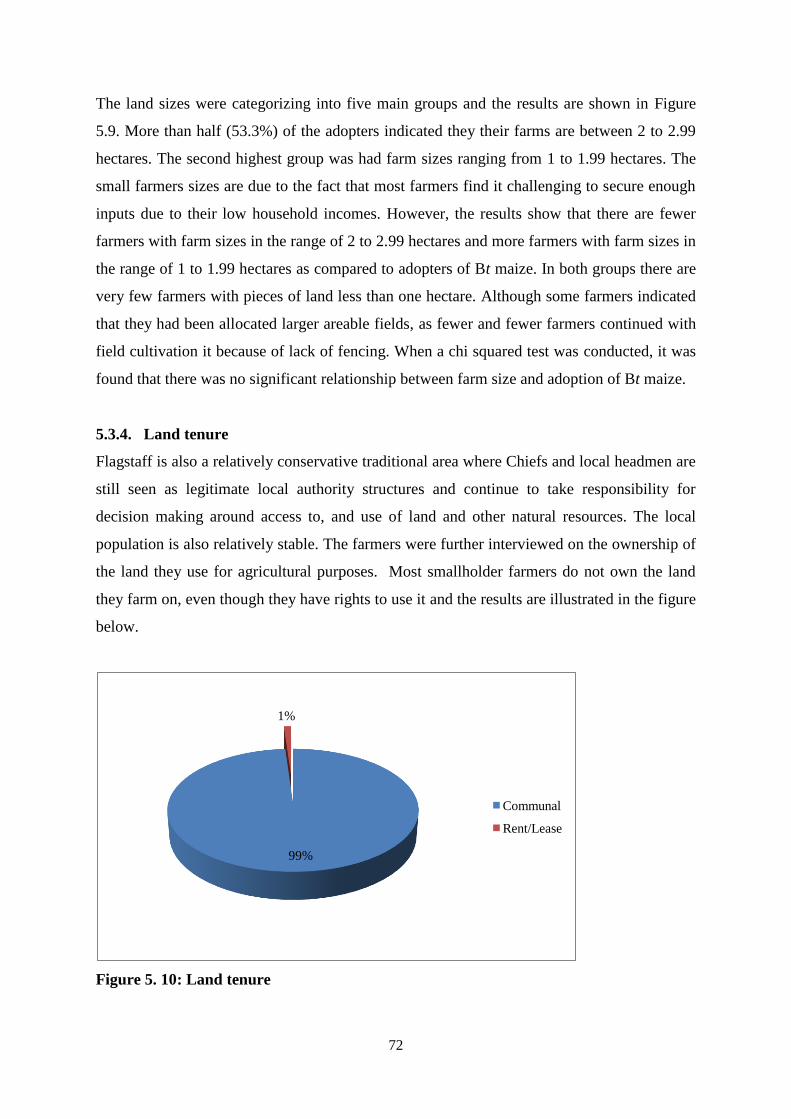
72
The land sizes were categorizing into five main groups and the results are shown in Figure
5.9. More than half (53.3%) of the adopters indicated they their farms are between 2 to 2.99
hectares. The second highest group was had farm sizes ranging from 1 to 1.99 hectares. The
small farmers sizes are due to the fact that most farmers find it challenging to secure enough
inputs due to their low household incomes. However, the results show that there are fewer
farmers with farm sizes in the range of 2 to 2.99 hectares and more farmers with farm sizes in
the range of 1 to 1.99 hectares as compared to adopters of Bt maize. In both groups there are
very few farmers with pieces of land less than one hectare. Although some farmers indicated
that they had been allocated larger areable fields, as fewer and fewer farmers continued with
field cultivation it because of lack of fencing. When a chi squared test was conducted, it was
found that there was no significant relationship between farm size and adoption of Bt maize.
5.3.4. Land tenure
Flagstaff is also a relatively conservative traditional area where Chiefs and local headmen are
still seen as legitimate local authority structures and continue to take responsibility for
decision making around access to, and use of land and other natural resources. The local
population is also relatively stable. The farmers were further interviewed on the ownership of
the land they use for agricultural purposes. Most smallholder farmers do not own the land
they farm on, even though they have rights to use it and the results are illustrated in the figure
below.
Figure 5. 10: Land tenure
99%
1%
Communal
Rent/Lease
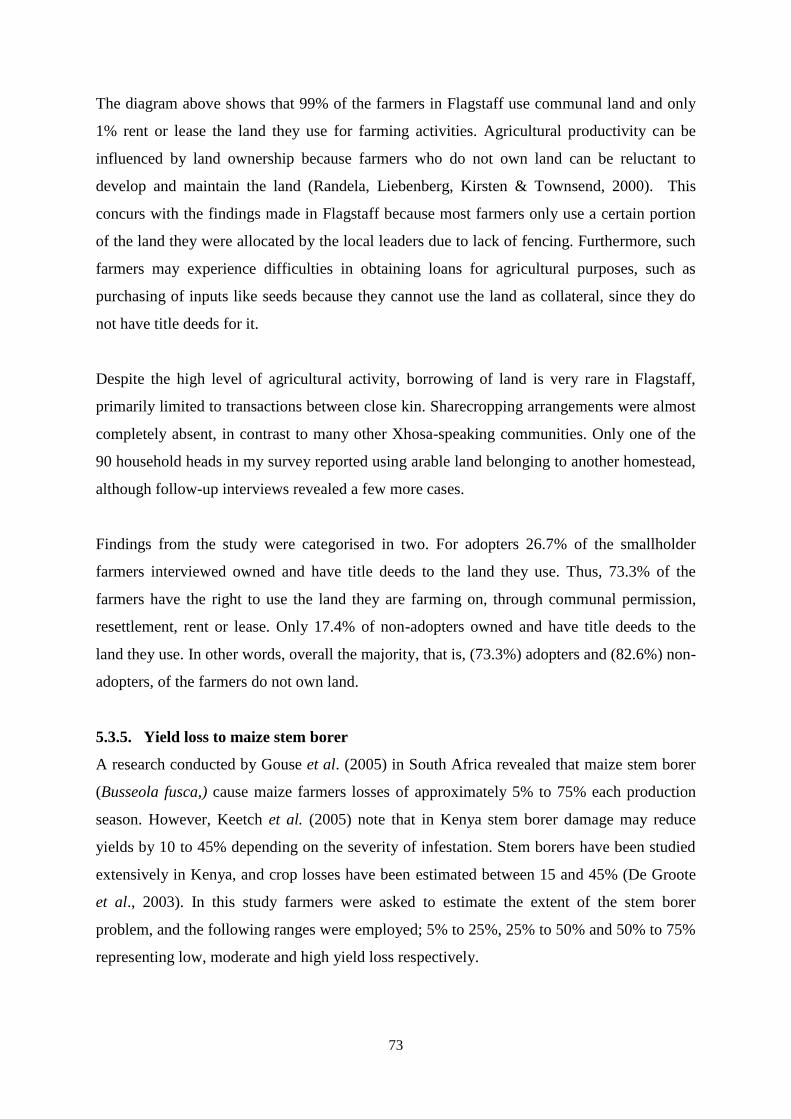
73
The diagram above shows that 99% of the farmers in Flagstaff use communal land and only
1% rent or lease the land they use for farming activities. Agricultural productivity can be
influenced by land ownership because farmers who do not own land can be reluctant to
develop and maintain the land (Randela, Liebenberg, Kirsten & Townsend, 2000). This
concurs with the findings made in Flagstaff because most farmers only use a certain portion
of the land they were allocated by the local leaders due to lack of fencing. Furthermore, such
farmers may experience difficulties in obtaining loans for agricultural purposes, such as
purchasing of inputs like seeds because they cannot use the land as collateral, since they do
not have title deeds for it.
Despite the high level of agricultural activity, borrowing of land is very rare in Flagstaff,
primarily limited to transactions between close kin. Sharecropping arrangements were almost
completely absent, in contrast to many other Xhosa-speaking communities. Only one of the
90 household heads in my survey reported using arable land belonging to another homestead,
although follow-up interviews revealed a few more cases.
Findings from the study were categorised in two. For adopters 26.7% of the smallholder
farmers interviewed owned and have title deeds to the land they use. Thus, 73.3% of the
farmers have the right to use the land they are farming on, through communal permission,
resettlement, rent or lease. Only 17.4% of non-adopters owned and have title deeds to the
land they use. In other words, overall the majority, that is, (73.3%) adopters and (82.6%) non-
adopters, of the farmers do not own land.
5.3.5. Yield loss to maize stem borer
A research conducted by Gouse et al. (2005) in South Africa revealed that maize stem borer
(Busseola fusca,) cause maize farmers losses of approximately 5% to 75% each production
season. However, Keetch et al. (2005) note that in Kenya stem borer damage may reduce
yields by 10 to 45% depending on the severity of infestation. Stem borers have been studied
extensively in Kenya, and crop losses have been estimated between 15 and 45% (De Groote
et al., 2003). In this study farmers were asked to estimate the extent of the stem borer
problem, and the following ranges were employed; 5% to 25%, 25% to 50% and 50% to 75%
representing low, moderate and high yield loss respectively.
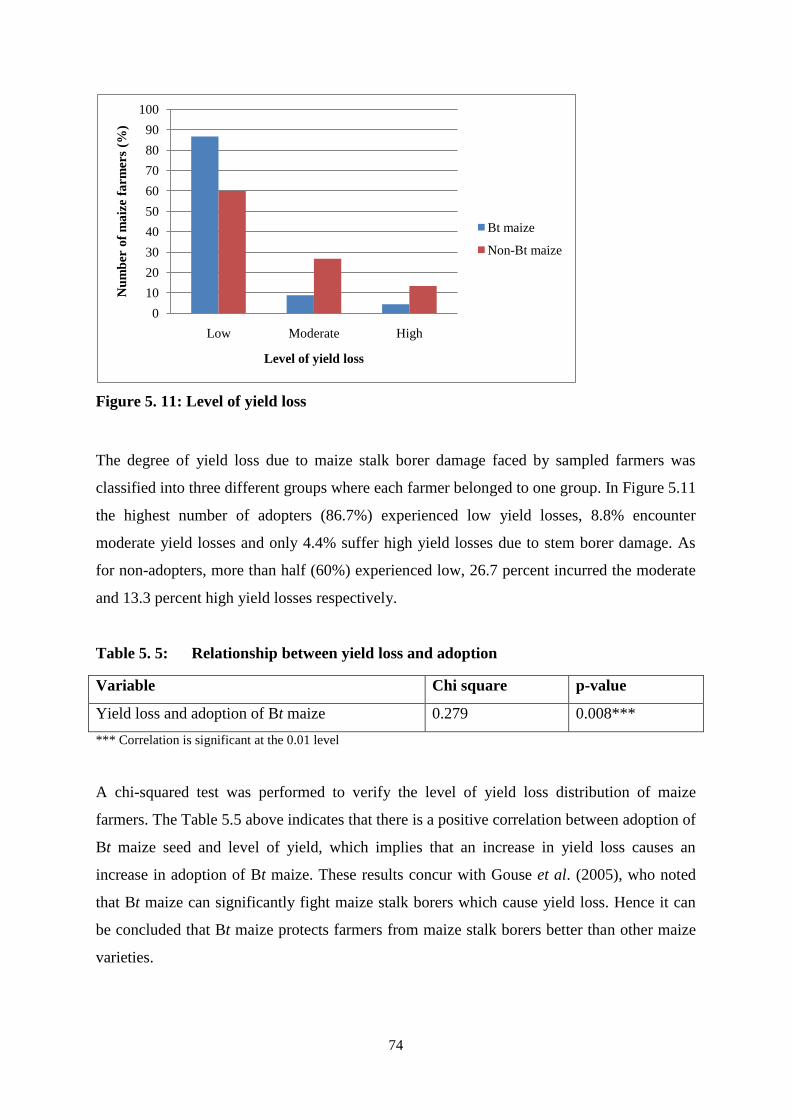
74
Figure 5. 11: Level of yield loss
The degree of yield loss due to maize stalk borer damage faced by sampled farmers was
classified into three different groups where each farmer belonged to one group. In Figure 5.11
the highest number of adopters (86.7%) experienced low yield losses, 8.8% encounter
moderate yield losses and only 4.4% suffer high yield losses due to stem borer damage. As
for non-adopters, more than half (60%) experienced low, 26.7 percent incurred the moderate
and 13.3 percent high yield losses respectively.
Table 5. 5: Relationship between yield loss and adoption
Variable Chi square p-value
Yield loss and adoption of Bt maize 0.279 0.008***
*** Correlation is significant at the 0.01 level
A chi-squared test was performed to verify the level of yield loss distribution of maize
farmers. The Table 5.5 above indicates that there is a positive correlation between adoption of
Bt maize seed and level of yield, which implies that an increase in yield loss causes an
increase in adoption of Bt maize. These results concur with Gouse et al. (2005), who noted
that Bt maize can significantly fight maize stalk borers which cause yield loss. Hence it can
be concluded that Bt maize protects farmers from maize stalk borers better than other maize
varieties.
0
10
20
30
40
50
60
70
80
90
100
Low Moderate High
Nu
mb
er o
f m
aiz
e fa
rmer
s (%
)
Level of yield loss
Bt maize
Non-Bt maize
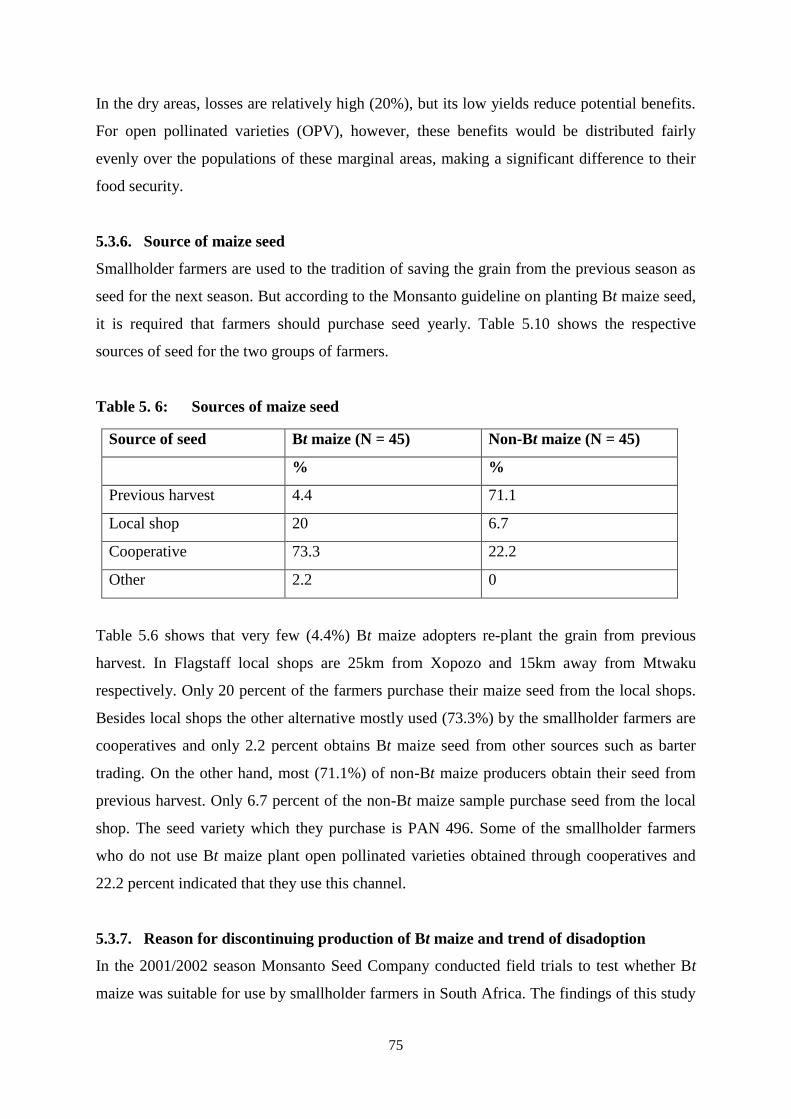
75
In the dry areas, losses are relatively high (20%), but its low yields reduce potential benefits.
For open pollinated varieties (OPV), however, these benefits would be distributed fairly
evenly over the populations of these marginal areas, making a significant difference to their
food security.
5.3.6. Source of maize seed
Smallholder farmers are used to the tradition of saving the grain from the previous season as
seed for the next season. But according to the Monsanto guideline on planting Bt maize seed,
it is required that farmers should purchase seed yearly. Table 5.10 shows the respective
sources of seed for the two groups of farmers.
Table 5. 6: Sources of maize seed
Source of seed Bt maize (N = 45) Non-Bt maize (N = 45)
% %
Previous harvest 4.4 71.1
Local shop 20 6.7
Cooperative 73.3 22.2
Other 2.2 0
Table 5.6 shows that very few (4.4%) Bt maize adopters re-plant the grain from previous
harvest. In Flagstaff local shops are 25km from Xopozo and 15km away from Mtwaku
respectively. Only 20 percent of the farmers purchase their maize seed from the local shops.
Besides local shops the other alternative mostly used (73.3%) by the smallholder farmers are
cooperatives and only 2.2 percent obtains Bt maize seed from other sources such as barter
trading. On the other hand, most (71.1%) of non-Bt maize producers obtain their seed from
previous harvest. Only 6.7 percent of the non-Bt maize sample purchase seed from the local
shop. The seed variety which they purchase is PAN 496. Some of the smallholder farmers
who do not use Bt maize plant open pollinated varieties obtained through cooperatives and
22.2 percent indicated that they use this channel.
5.3.7. Reason for discontinuing production of Bt maize and trend of disadoption
In the 2001/2002 season Monsanto Seed Company conducted field trials to test whether Bt
maize was suitable for use by smallholder farmers in South Africa. The findings of this study
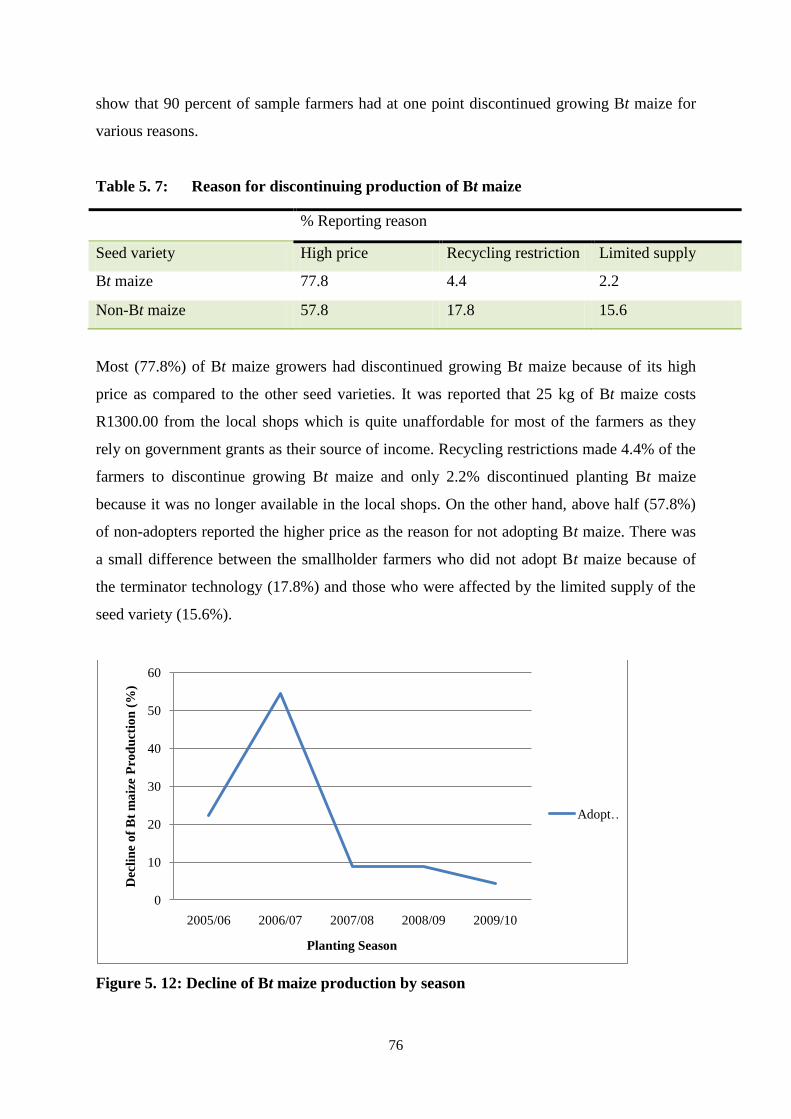
76
show that 90 percent of sample farmers had at one point discontinued growing Bt maize for
various reasons.
Table 5. 7: Reason for discontinuing production of Bt maize
% Reporting reason
Seed variety High price Recycling restriction Limited supply
Bt maize 77.8 4.4 2.2
Non-Bt maize 57.8 17.8 15.6
Most (77.8%) of Bt maize growers had discontinued growing Bt maize because of its high
price as compared to the other seed varieties. It was reported that 25 kg of Bt maize costs
R1300.00 from the local shops which is quite unaffordable for most of the farmers as they
rely on government grants as their source of income. Recycling restrictions made 4.4% of the
farmers to discontinue growing Bt maize and only 2.2% discontinued planting Bt maize
because it was no longer available in the local shops. On the other hand, above half (57.8%)
of non-adopters reported the higher price as the reason for not adopting Bt maize. There was
a small difference between the smallholder farmers who did not adopt Bt maize because of
the terminator technology (17.8%) and those who were affected by the limited supply of the
seed variety (15.6%).
Figure 5. 12: Decline of Bt maize production by season
0
10
20
30
40
50
60
2005/06 2006/07 2007/08 2008/09 2009/10
Dec
lin
e o
f B
t m
aiz
e P
rod
uct
ion
(%
)
Planting Season
Adopt…
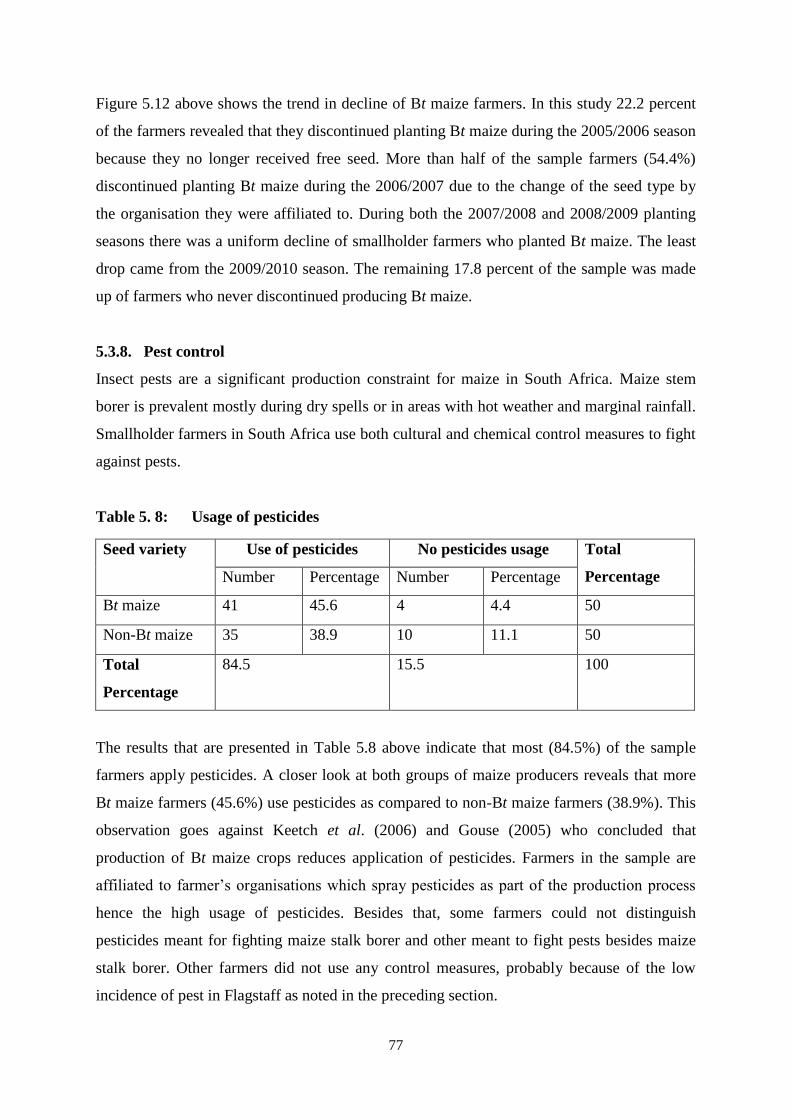
77
Figure 5.12 above shows the trend in decline of Bt maize farmers. In this study 22.2 percent
of the farmers revealed that they discontinued planting Bt maize during the 2005/2006 season
because they no longer received free seed. More than half of the sample farmers (54.4%)
discontinued planting Bt maize during the 2006/2007 due to the change of the seed type by
the organisation they were affiliated to. During both the 2007/2008 and 2008/2009 planting
seasons there was a uniform decline of smallholder farmers who planted Bt maize. The least
drop came from the 2009/2010 season. The remaining 17.8 percent of the sample was made
up of farmers who never discontinued producing Bt maize.
5.3.8. Pest control
Insect pests are a significant production constraint for maize in South Africa. Maize stem
borer is prevalent mostly during dry spells or in areas with hot weather and marginal rainfall.
Smallholder farmers in South Africa use both cultural and chemical control measures to fight
against pests.
Table 5. 8: Usage of pesticides
Seed variety Use of pesticides No pesticides usage Total
Percentage Number Percentage Number Percentage
Bt maize 41 45.6 4 4.4 50
Non-Bt maize 35 38.9 10 11.1 50
Total
Percentage
84.5 15.5 100
The results that are presented in Table 5.8 above indicate that most (84.5%) of the sample
farmers apply pesticides. A closer look at both groups of maize producers reveals that more
Bt maize farmers (45.6%) use pesticides as compared to non-Bt maize farmers (38.9%). This
observation goes against Keetch et al. (2006) and Gouse (2005) who concluded that
production of Bt maize crops reduces application of pesticides. Farmers in the sample are
affiliated to farmer‟s organisations which spray pesticides as part of the production process
hence the high usage of pesticides. Besides that, some farmers could not distinguish
pesticides meant for fighting maize stalk borer and other meant to fight pests besides maize
stalk borer. Other farmers did not use any control measures, probably because of the low
incidence of pest in Flagstaff as noted in the preceding section.
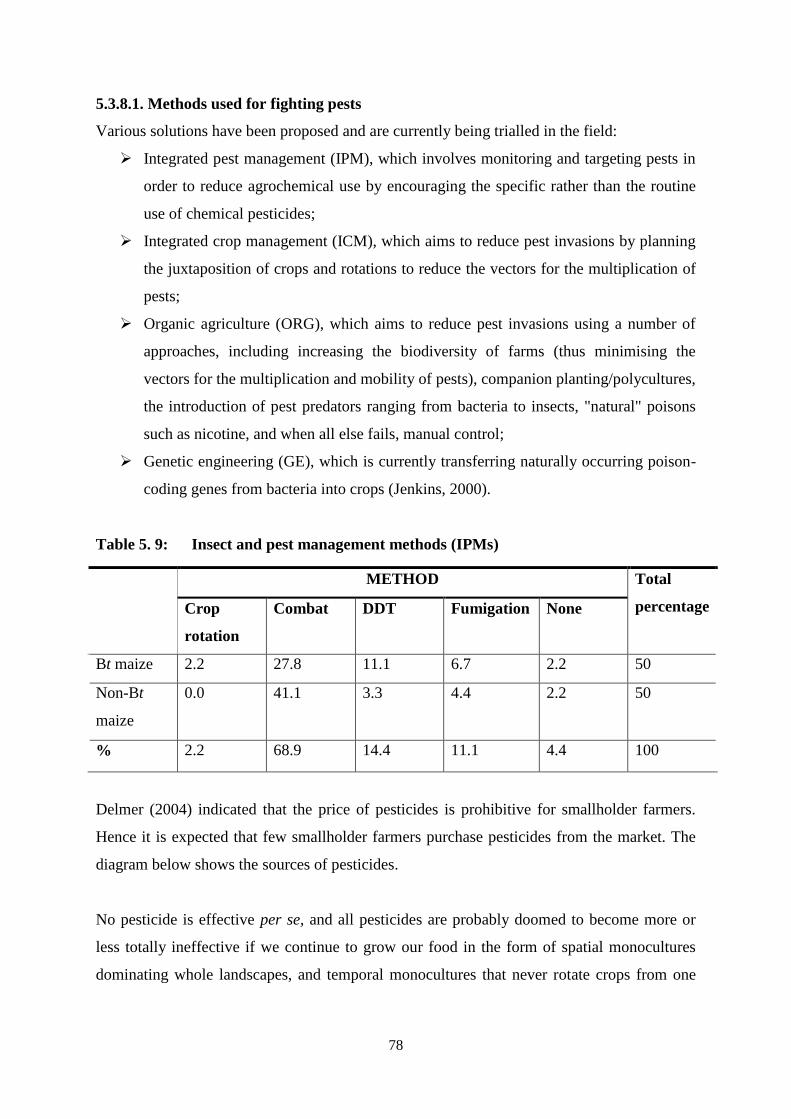
78
5.3.8.1. Methods used for fighting pests
Various solutions have been proposed and are currently being trialled in the field:
Integrated pest management (IPM), which involves monitoring and targeting pests in
order to reduce agrochemical use by encouraging the specific rather than the routine
use of chemical pesticides;
Integrated crop management (ICM), which aims to reduce pest invasions by planning
the juxtaposition of crops and rotations to reduce the vectors for the multiplication of
pests;
Organic agriculture (ORG), which aims to reduce pest invasions using a number of
approaches, including increasing the biodiversity of farms (thus minimising the
vectors for the multiplication and mobility of pests), companion planting/polycultures,
the introduction of pest predators ranging from bacteria to insects, "natural" poisons
such as nicotine, and when all else fails, manual control;
Genetic engineering (GE), which is currently transferring naturally occurring poison-
coding genes from bacteria into crops (Jenkins, 2000).
Table 5. 9: Insect and pest management methods (IPMs)
METHOD Total
percentage Crop
rotation
Combat DDT Fumigation None
Bt maize 2.2 27.8 11.1 6.7 2.2 50
Non-Bt
maize
0.0 41.1 3.3 4.4 2.2 50
% 2.2 68.9 14.4 11.1 4.4 100
Delmer (2004) indicated that the price of pesticides is prohibitive for smallholder farmers.
Hence it is expected that few smallholder farmers purchase pesticides from the market. The
diagram below shows the sources of pesticides.
No pesticide is effective per se, and all pesticides are probably doomed to become more or
less totally ineffective if we continue to grow our food in the form of spatial monocultures
dominating whole landscapes, and temporal monocultures that never rotate crops from one
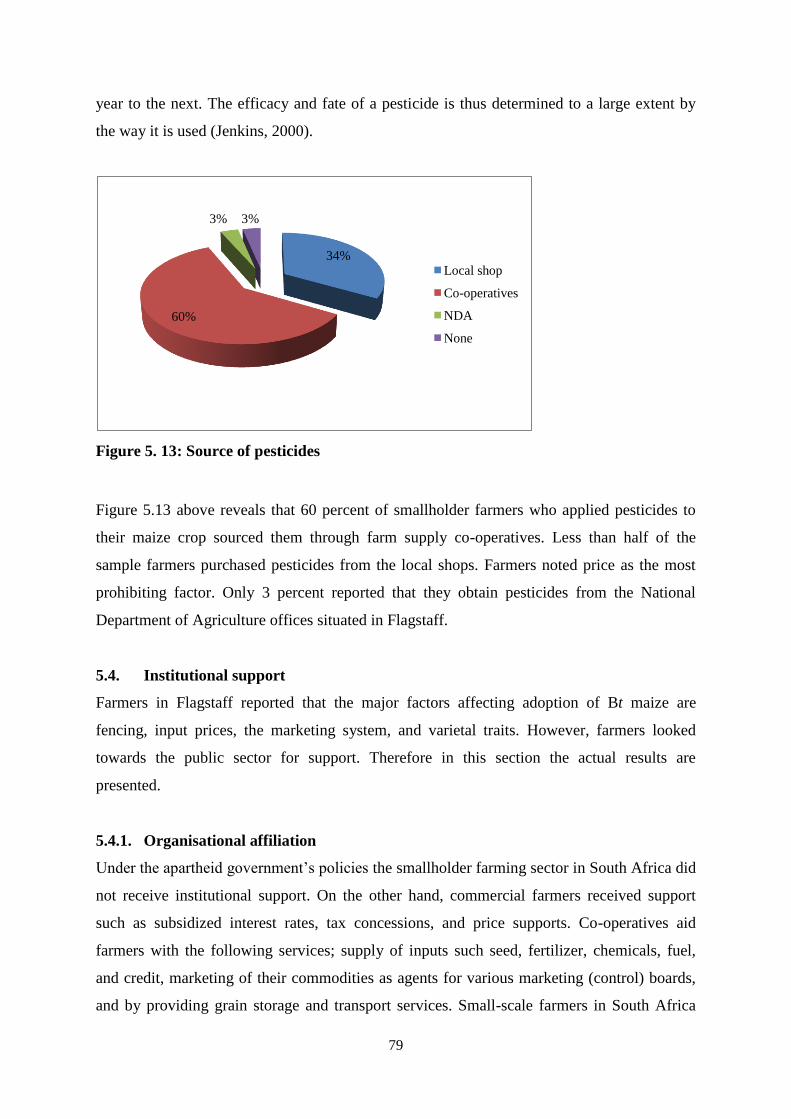
79
year to the next. The efficacy and fate of a pesticide is thus determined to a large extent by
the way it is used (Jenkins, 2000).
Figure 5. 13: Source of pesticides
Figure 5.13 above reveals that 60 percent of smallholder farmers who applied pesticides to
their maize crop sourced them through farm supply co-operatives. Less than half of the
sample farmers purchased pesticides from the local shops. Farmers noted price as the most
prohibiting factor. Only 3 percent reported that they obtain pesticides from the National
Department of Agriculture offices situated in Flagstaff.
5.4. Institutional support
Farmers in Flagstaff reported that the major factors affecting adoption of Bt maize are
fencing, input prices, the marketing system, and varietal traits. However, farmers looked
towards the public sector for support. Therefore in this section the actual results are
presented.
5.4.1. Organisational affiliation
Under the apartheid government‟s policies the smallholder farming sector in South Africa did
not receive institutional support. On the other hand, commercial farmers received support
such as subsidized interest rates, tax concessions, and price supports. Co-operatives aid
farmers with the following services; supply of inputs such seed, fertilizer, chemicals, fuel,
and credit, marketing of their commodities as agents for various marketing (control) boards,
and by providing grain storage and transport services. Small-scale farmers in South Africa
34%
60%
3% 3%
Local shop
Co-operatives
NDA
None
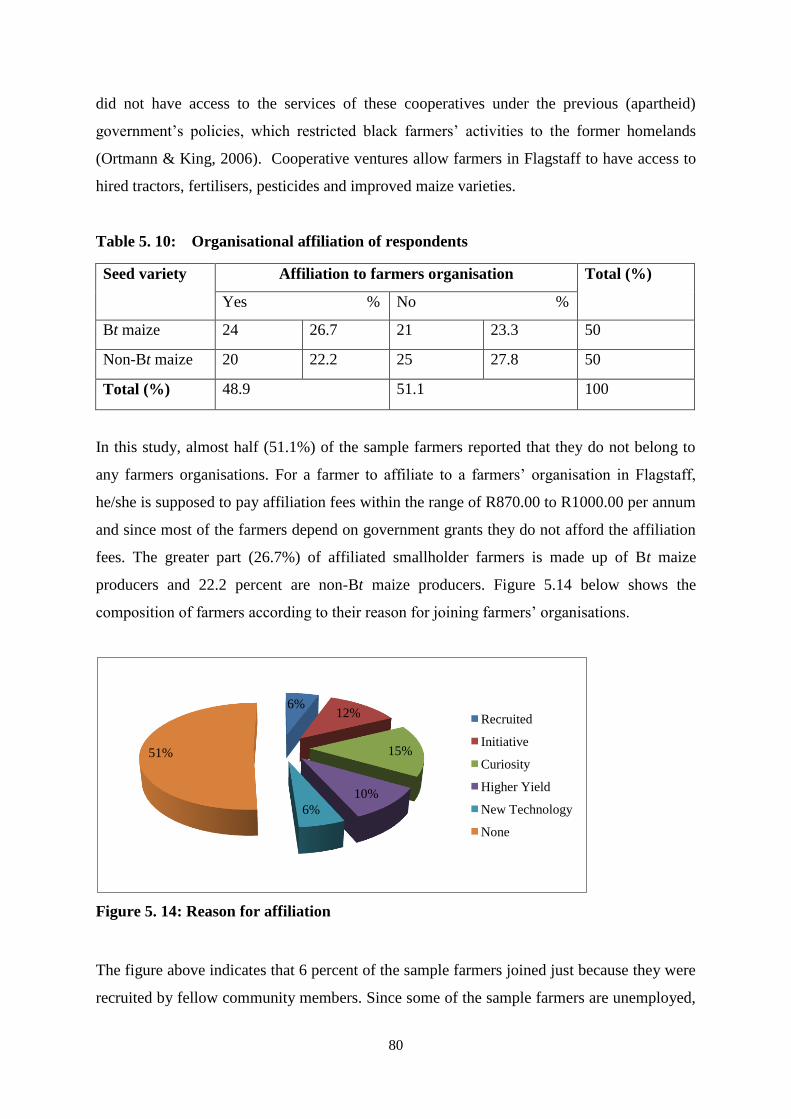
80
did not have access to the services of these cooperatives under the previous (apartheid)
government‟s policies, which restricted black farmers‟ activities to the former homelands
(Ortmann & King, 2006). Cooperative ventures allow farmers in Flagstaff to have access to
hired tractors, fertilisers, pesticides and improved maize varieties.
Table 5. 10: Organisational affiliation of respondents
Seed variety Affiliation to farmers organisation Total (%)
Yes % No %
Bt maize 24 26.7 21 23.3 50
Non-Bt maize 20 22.2 25 27.8 50
Total (%) 48.9 51.1 100
In this study, almost half (51.1%) of the sample farmers reported that they do not belong to
any farmers organisations. For a farmer to affiliate to a farmers‟ organisation in Flagstaff,
he/she is supposed to pay affiliation fees within the range of R870.00 to R1000.00 per annum
and since most of the farmers depend on government grants they do not afford the affiliation
fees. The greater part (26.7%) of affiliated smallholder farmers is made up of Bt maize
producers and 22.2 percent are non-Bt maize producers. Figure 5.14 below shows the
composition of farmers according to their reason for joining farmers‟ organisations.
Figure 5. 14: Reason for affiliation
The figure above indicates that 6 percent of the sample farmers joined just because they were
recruited by fellow community members. Since some of the sample farmers are unemployed,
6%12%
15%
10%
6%
51%
Recruited
Initiative
Curiosity
Higher Yield
New Technology
None
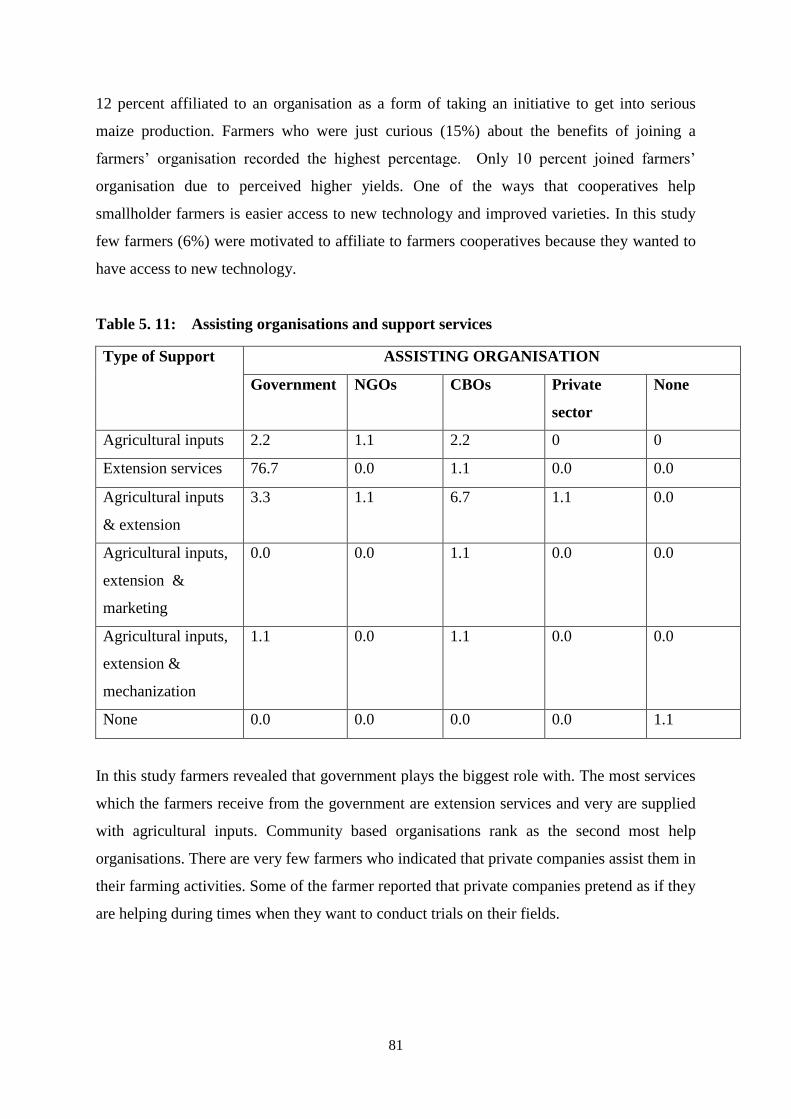
81
12 percent affiliated to an organisation as a form of taking an initiative to get into serious
maize production. Farmers who were just curious (15%) about the benefits of joining a
farmers‟ organisation recorded the highest percentage. Only 10 percent joined farmers‟
organisation due to perceived higher yields. One of the ways that cooperatives help
smallholder farmers is easier access to new technology and improved varieties. In this study
few farmers (6%) were motivated to affiliate to farmers cooperatives because they wanted to
have access to new technology.
Table 5. 11: Assisting organisations and support services
Type of Support ASSISTING ORGANISATION
Government NGOs CBOs Private
sector
None
Agricultural inputs 2.2 1.1 2.2 0 0
Extension services 76.7 0.0 1.1 0.0 0.0
Agricultural inputs
& extension
3.3 1.1 6.7 1.1 0.0
Agricultural inputs,
extension &
marketing
0.0 0.0 1.1 0.0 0.0
Agricultural inputs,
extension &
mechanization
1.1 0.0 1.1 0.0 0.0
None 0.0 0.0 0.0 0.0 1.1
In this study farmers revealed that government plays the biggest role with. The most services
which the farmers receive from the government are extension services and very are supplied
with agricultural inputs. Community based organisations rank as the second most help
organisations. There are very few farmers who indicated that private companies assist them in
their farming activities. Some of the farmer reported that private companies pretend as if they
are helping during times when they want to conduct trials on their fields.
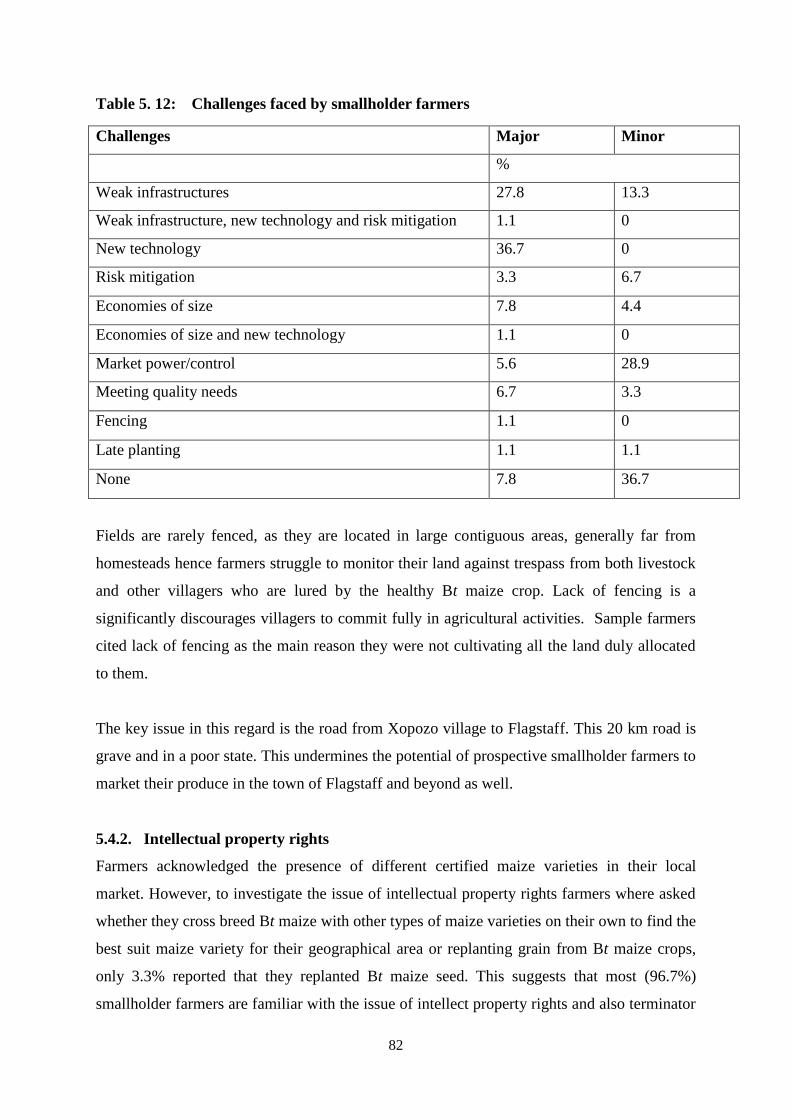
82
Table 5. 12: Challenges faced by smallholder farmers
Challenges Major Minor
%
Weak infrastructures 27.8 13.3
Weak infrastructure, new technology and risk mitigation 1.1 0
New technology 36.7 0
Risk mitigation 3.3 6.7
Economies of size 7.8 4.4
Economies of size and new technology 1.1 0
Market power/control 5.6 28.9
Meeting quality needs 6.7 3.3
Fencing 1.1 0
Late planting 1.1 1.1
None 7.8 36.7
Fields are rarely fenced, as they are located in large contiguous areas, generally far from
homesteads hence farmers struggle to monitor their land against trespass from both livestock
and other villagers who are lured by the healthy Bt maize crop. Lack of fencing is a
significantly discourages villagers to commit fully in agricultural activities. Sample farmers
cited lack of fencing as the main reason they were not cultivating all the land duly allocated
to them.
The key issue in this regard is the road from Xopozo village to Flagstaff. This 20 km road is
grave and in a poor state. This undermines the potential of prospective smallholder farmers to
market their produce in the town of Flagstaff and beyond as well.
5.4.2. Intellectual property rights
Farmers acknowledged the presence of different certified maize varieties in their local
market. However, to investigate the issue of intellectual property rights farmers where asked
whether they cross breed Bt maize with other types of maize varieties on their own to find the
best suit maize variety for their geographical area or replanting grain from Bt maize crops,
only 3.3% reported that they replanted Bt maize seed. This suggests that most (96.7%)
smallholder farmers are familiar with the issue of intellect property rights and also terminator
83
technology which is one of the most important attribute of Bt maize seeds. Furthermore,
farmers indicated that extension officers coupled with sale agents of seed producing
companies educated them as far as the issue of intellectual property rights is concerned
during field trials. The issue of intellectual property rights concurs with Qaim (2009) who
indicated that in developing countries there may be enormous foregone benefits due to
disadoption as Bt maize goes against the tradition of replanting grain from previous harvest.
5.5. Gross margin analysis
One of the most important aspects of this study was evaluation of the financial and economic
impact of Bt technology in maize production under smallholder conditions. It is paramount to
consider the economic value when acquiring new technology on a farm as it will have ripple
effects on the business as a whole. A quick way to assess how well Bt maize seed performs
under smallholder conditions is to calculate gross margin. Table 5.16 present the average
figures of the yield per hectare, total cost per hectare, total revenue per hectare and gross
margin per hectare for both adopters and non-adopters. In maize production crops the
variable costs consists primarily of seed, fertiliser, pesticides and contract work and casual
labour.
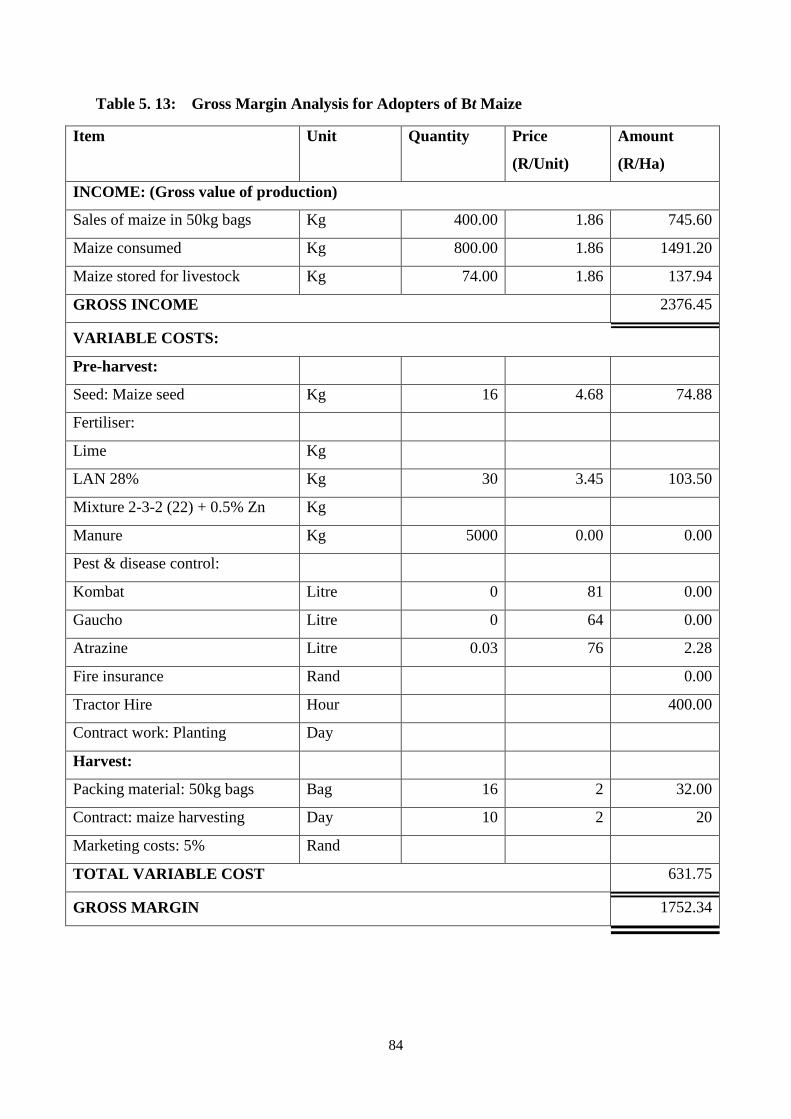
84
Table 5. 13: Gross Margin Analysis for Adopters of Bt Maize
Item Unit Quantity Price
(R/Unit)
Amount
(R/Ha)
INCOME: (Gross value of production)
Sales of maize in 50kg bags Kg 400.00 1.86 745.60
Maize consumed Kg 800.00 1.86 1491.20
Maize stored for livestock Kg 74.00 1.86 137.94
GROSS INCOME 2376.45
VARIABLE COSTS:
Pre-harvest:
Seed: Maize seed Kg 16 4.68 74.88
Fertiliser:
Lime Kg
LAN 28% Kg 30 3.45 103.50
Mixture 2-3-2 (22) + 0.5% Zn Kg
Manure Kg 5000 0.00 0.00
Pest & disease control:
Kombat Litre 0 81 0.00
Gaucho Litre 0 64 0.00
Atrazine Litre 0.03 76 2.28
Fire insurance Rand 0.00
Tractor Hire Hour 400.00
Contract work: Planting Day
Harvest:
Packing material: 50kg bags Bag 16 2 32.00
Contract: maize harvesting Day 10 2 20
Marketing costs: 5% Rand
TOTAL VARIABLE COST 631.75
GROSS MARGIN 1752.34
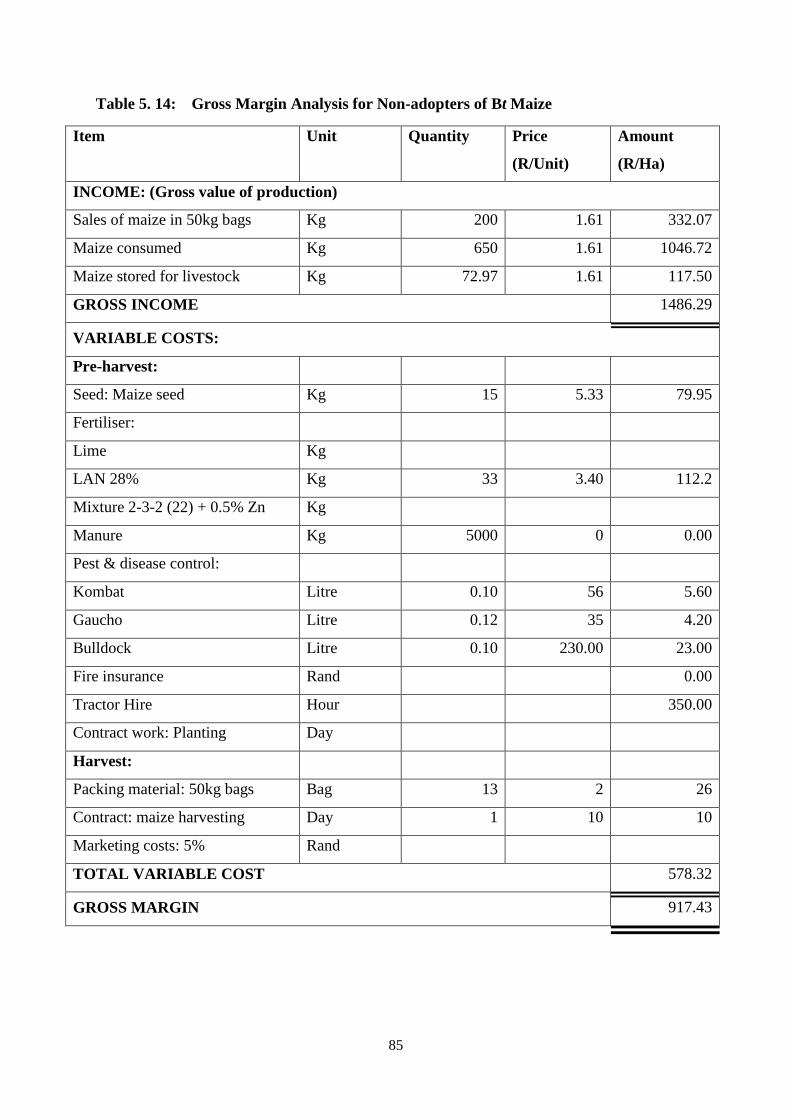
85
Table 5. 14: Gross Margin Analysis for Non-adopters of Bt Maize
Item Unit Quantity Price
(R/Unit)
Amount
(R/Ha)
INCOME: (Gross value of production)
Sales of maize in 50kg bags Kg 200 1.61 332.07
Maize consumed Kg 650 1.61 1046.72
Maize stored for livestock Kg 72.97 1.61 117.50
GROSS INCOME 1486.29
VARIABLE COSTS:
Pre-harvest:
Seed: Maize seed Kg 15 5.33 79.95
Fertiliser:
Lime Kg
LAN 28% Kg 33 3.40 112.2
Mixture 2-3-2 (22) + 0.5% Zn Kg
Manure Kg 5000 0 0.00
Pest & disease control:
Kombat Litre 0.10 56 5.60
Gaucho Litre 0.12 35 4.20
Bulldock Litre 0.10 230.00 23.00
Fire insurance Rand 0.00
Tractor Hire Hour 350.00
Contract work: Planting Day
Harvest:
Packing material: 50kg bags Bag 13 2 26
Contract: maize harvesting Day 1 10 10
Marketing costs: 5% Rand
TOTAL VARIABLE COST 578.32
GROSS MARGIN 917.43
86
5.5.1. Gross incomes
Table 5.13 and Table 5.14 above reveal the average gross margins per hectare for both Bt and
non-Bt maize enterprises. On average, the gross income for Bt maize production was
R2376.45 per hectare. This amount was made up of sales of maize in 50kg bags, maize
consumed by the farmers and maize fed to livestock. However, of these three components of
gross income per hectare in both groups of farmers, maize for subsistence purposes was the
largest of them all. This suggests that, production of Bt maize by smallholder farmers is
mainly meant for subsistence purposes. These findings concur with (Delmer, 2005; Keetch et
al., 2005; Gouse et al., 2006; Pray et al., 2009; Qaim, 2009). In general, the low output per
recorded for both groups of farmers are attributed to losses through theft since fencing is a
problem in the area. In addition to that, farmers reported that late planting is also a problem
that reduces their yields.
5.5.2. Total variable costs
The cost making total variable costs for the two groups of farmers differ as shown in Tables
5.13 and 5.14 above. The average cost for seed per hectare for smallholder farmers who use
Bt maize in Flagstaff is 6.3% lower than that for non-Bt maize farmers. This observation goes
against Gouse et al. (2006), who note that price for Bt maize seed per hectare is higher than
that for non-Bt maize. This might have been caused by smallholder farmers in Flagstaff
affiliated to farmers‟ cooperatives who get farming inputs inclusive of seed at discounted
rates which are at least 90 percent going further below. Therefore, resulting in a low average
seed price for Bt maize. On the other hand, the average price of seed per hectare for
smallholder farmers who plant non-Bt maize is lower compared to the prevailing market
prices because in calculating the average price, farmers who use grains from previous harvest
do not purchase seed are included as well. This therefore results in the low seed per hectare
price of seed (R79.95).
Furthermore, the price for Limestone Ammonium Nitrate 28% (L.A.N) fertiliser reported by
Bt maize growers was slightly lower different than that for non-Bt maize growers.
Smallholder farmers use LAN 28% for side dressing. Besides LAN 28% they also use same
amounts cattle manure per hectare as a substitute for inorganic fertilisers. Unlike non Bt
maize farmers, smallholder farmers using Bt maize did not incur costs for maize stem borer
controlling pesticides. The cost of pesticides for control of maize stem borer made up
approximately 6 percent of the total variable costs for non Bt maize farmers. This suggests
87
that, smallholder farmers in Flagstaff do not apply pesticides a lot as can also be confirmed
by the average quantity applied per hectare. This observation is in support of Delmer (2005)
who note that smallholder farmers do not apply the required quantity of pesticides when the
prices are prohibitive and this leads to low yields when the maize crop is attacked by maize
stem borer. Although maize is critical to the growth of maize, no irrigation costs were
incurred by the farmers due to the good rainfall patterns in Flagstaff and besides that, the was
lack of irrigation infrastructure in the area.
However, the highest expense recorded for both groups was tractor hire which made up more
than 50 percent of the total variable costs for both groups. The average price for tractor hire
was below the common prevailing price indicated by most smallholder farmers in the area,
which was R600.00 to plough an area of approximately 2 hectares. Therefore farmers
incurred the bulk of these costs prior to harvesting. In both groups, major variable costs at
pre-harvest stage were seed, fertilizers and land preparation as shown in table above.
Harvesting and marketing costs were much lower as shown in the tables above. Since most
smallholder farmers produce for subsistence, they did not incur marketing costs after
harvesting. In addition, the average cost for casual labour hired for harvesting was low
because hiring labour was not a very common practice.
Land area was measured in hectares. Gouse et al. (2006) reported that farmers tend to give
over estimates of their plot sizes. In an attempt to minimize collecting extremely inaccurate
estimates of plot sizes, a face to face interview with the local headman (Inkosi) was done and
he indicated that most people have plot sizes of 2 hectares. However, adopters of Bt maize
recorded an average farm size of 2.09 hectares where as non-adopters had 2.35 hectares.
Unlike the argument noted by Gouse et al. (2006), smallholder farmers in Flagstaff were able
to give an accurate account of their land sizes hence rendering measures on per hectare basis
valid in this study.
5.5.3. Gross margin
The smallholder farmers who used Bt seed and those who did not adopt it averaged 1274.80
and 922.97 kg per hectare, respectively. This reveals that, adopters of Bt maize seed were
27.6 percent better off in terms of yield as compared to non-adopters. This suggests that Bt
maize can contribute positively to household food security for farmers who produce mainly
for own consumption and increased incomes for those who sell on the market. Although Bt
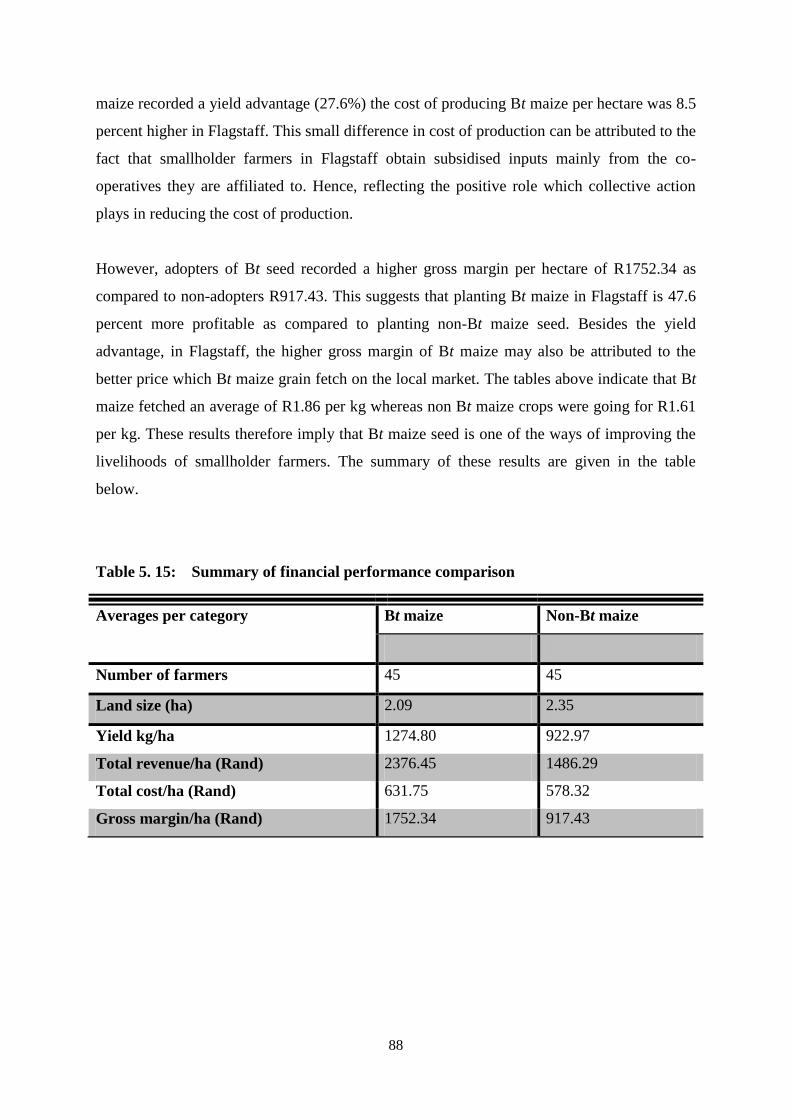
88
maize recorded a yield advantage (27.6%) the cost of producing Bt maize per hectare was 8.5
percent higher in Flagstaff. This small difference in cost of production can be attributed to the
fact that smallholder farmers in Flagstaff obtain subsidised inputs mainly from the co-
operatives they are affiliated to. Hence, reflecting the positive role which collective action
plays in reducing the cost of production.
However, adopters of Bt seed recorded a higher gross margin per hectare of R1752.34 as
compared to non-adopters R917.43. This suggests that planting Bt maize in Flagstaff is 47.6
percent more profitable as compared to planting non-Bt maize seed. Besides the yield
advantage, in Flagstaff, the higher gross margin of Bt maize may also be attributed to the
better price which Bt maize grain fetch on the local market. The tables above indicate that Bt
maize fetched an average of R1.86 per kg whereas non Bt maize crops were going for R1.61
per kg. These results therefore imply that Bt maize seed is one of the ways of improving the
livelihoods of smallholder farmers. The summary of these results are given in the table
below.
Table 5. 15: Summary of financial performance comparison
Averages per category Bt maize Non-Bt maize
Number of farmers 45 45
Land size (ha) 2.09 2.35
Yield kg/ha 1274.80 922.97
Total revenue/ha (Rand) 2376.45 1486.29
Total cost/ha (Rand) 631.75 578.32
Gross margin/ha (Rand) 1752.34 917.43
89
CHAPTER 6: RESULTS OF THE INFERENTIAL ANALYSIS
6.1. Introduction
The previous chapter presented the descriptive statistics and gross margin analysis results. It
gave an overview of socio-economic characteristics of sample farmers, their farming systems,
institutional environment and gross margins which they reap. This chapter focuses on the
perceptions towards attributes of Bt maize that influence smallholder farmers‟ seed choices.
The main objective of this chapter is to present inferential results of the model that was
formulated in Chapter 4, in accordance with the research objectives. Within the chapter, the
independent variables (perceptions) are tested for their significance and conclusions are
drawn using these results. The chapter give emphasis on model specification, where the
variables are fitted into the model. These variables are then defined, giving their anticipated
signs. In total, 20 predictor variables were used in the model. Furthermore, the chapter goes
on to indicate empirical results of the binomial logistic regression model, commenting on the
significance of the given variables. An in-depth explanation is provided for the significant
variables and the conclusion to sum up the chapter.
6.2. Model empirical results
This section presents the results of the binomial logistic regression model and discusses
results of the significant variables determining maize seed choices made by smallholder
farmers in the Flagstaff area of the Eastern Cape Province. All the variables that were
discussed in the previous section were considered for the model and tested for their
significance. The binomial logistic results are presented in Table 6. 1. The table shows the
estimated coefficients (β values), standard error, significance values and odd ratio of the
predictor or independent variables in the model.
According to Gujarati (1992), the coefficient values measure the expected change in the logit
for a unit change in each independent variable, all other independent variables being equal.
The sign of the coefficient shows the direction of influence of the variable on the logit. It
follows that a positive value indicates an increase in the likelihood that a household will
change to the alternative option, that is, adopt Bt maize. On the other hand, a negative value
shows that it is less likely that a household will consider the alternative (Gujarati, 1992).
Therefore, in this study, a positive value implies an increase in the likelihood of adopting Bt
maize.
90
The significance values (also known as p-values) show whether or not a change in the
independent variable significantly influences the logit at a given level. It should be noted that
in this study, the variables were tested at 5% significance level. Thus, if the significance
value is greater than 0.05, then it shows that there is insufficient evidence to support that the
independent variable influence a change from not adopting Bt maize. If the significance value
is equal to or less than 0.05, then there is enough evidence to support a claim presented by the
coefficient value. The odds ratio indicates the extent of the effect on the dependent variable
caused by the predictor variables. Its value is obtained by calculating the anti-logarithm of
each slope coefficient of predictor variables. A value greater than one implies greater
probability of variable influence on the logit and a value less than one indicates that the
variable is less likely to influence the logit. The standard error measures the standard
deviation of the error in the value of a given variable (Gujarati, 1992).
As shown in table 6. 1. some perceptions used as predictor variables influence Bt production
choices significantly. Out of the 20 independent variables used in the model, four variables
are statistically significant at the 10% significance level and two variables at 5% significance
level. The goodness-of-fit test for a logistic regression model measures the suitability of the
model to a given data set. An adequate fit corresponds to a finding of non-significance for the
tests (Hill et al., 2001).
The logistic regression of the technology adoption on a suite of explanatory variables
correctly predicted more than 71.1% of the observed variation in comparing adoption and
non-adoption. Other reported statistics included chi-square values for the Hosmer and
Lemeshow goodness of-fit test, Nagelkerke R-square values, and finally, percentages of
correctly classified cases.
Goodness-of-fit statistics assess the fit of a logistic model against actual outcomes. One
inferential test and two descriptive measures are presented in Table 6. 1. below. The
inferential goodness-of-fit test is the Hosmer and Lemeshow (H–L) test that yielded a x2(8) of
9.349 and was insignificant (p > 0.05), suggesting that the model was fit to the data well. In
other words, a non-significant Hosmer and Lemeshow chi-square statistic indicated that a
model had adequate fit. Hence, the null hypothesis of a good model fit to data was tenable.
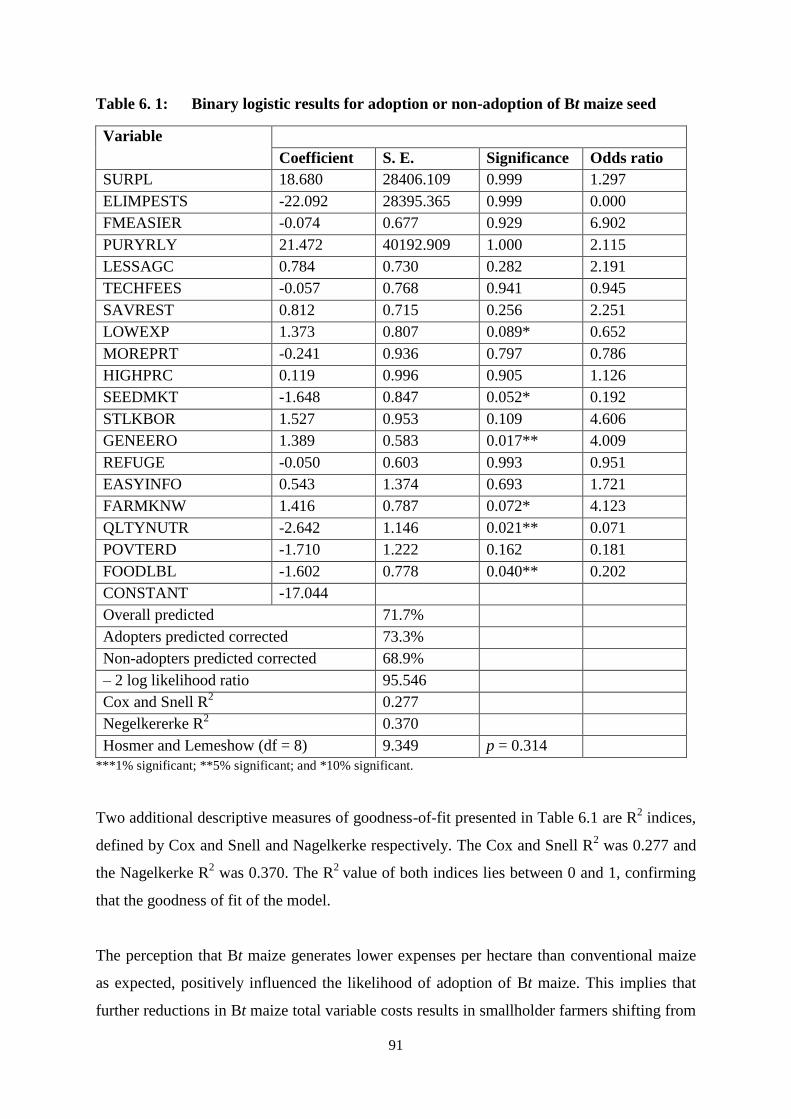
91
Table 6. 1: Binary logistic results for adoption or non-adoption of Bt maize seed
Variable
Coefficient S. E. Significance Odds ratio
SURPL 18.680 28406.109 0.999 1.297
ELIMPESTS -22.092 28395.365 0.999 0.000
FMEASIER -0.074 0.677 0.929 6.902
PURYRLY 21.472 40192.909 1.000 2.115
LESSAGC 0.784 0.730 0.282 2.191
TECHFEES -0.057 0.768 0.941 0.945
SAVREST 0.812 0.715 0.256 2.251
LOWEXP 1.373 0.807 0.089* 0.652
MOREPRT -0.241 0.936 0.797 0.786
HIGHPRC 0.119 0.996 0.905 1.126
SEEDMKT -1.648 0.847 0.052* 0.192
STLKBOR 1.527 0.953 0.109 4.606
GENEERO 1.389 0.583 0.017** 4.009
REFUGE -0.050 0.603 0.993 0.951
EASYINFO 0.543 1.374 0.693 1.721
FARMKNW 1.416 0.787 0.072* 4.123
QLTYNUTR -2.642 1.146 0.021** 0.071
POVTERD -1.710 1.222 0.162 0.181
FOODLBL -1.602 0.778 0.040** 0.202
CONSTANT -17.044
Overall predicted 71.7%
Adopters predicted corrected 73.3%
Non-adopters predicted corrected 68.9%
– 2 log likelihood ratio 95.546
Cox and Snell R2 0.277
Negelkererke R2 0.370
Hosmer and Lemeshow (df = 8) 9.349 p = 0.314
***1% significant; **5% significant; and *10% significant.
Two additional descriptive measures of goodness-of-fit presented in Table 6.1 are R2 indices,
defined by Cox and Snell and Nagelkerke respectively. The Cox and Snell R2 was 0.277 and
the Nagelkerke R2 was 0.370. The R
2 value of both indices lies between 0 and 1, confirming
that the goodness of fit of the model.
The perception that Bt maize generates lower expenses per hectare than conventional maize
as expected, positively influenced the likelihood of adoption of Bt maize. This implies that
further reductions in Bt maize total variable costs results in smallholder farmers shifting from
92
non-Bt maize seed varieties to Bt maize. In other words, the maize production methods used
significantly results in a 0.652 fold increase in the odds of adopting Bt maize. In addition,
ability to meet low expenses per hectare for Bt maize crop production can further draw
farmers towards Bt maize. Hence, Bt maize had a positive impact on household income
derived from a combination of improved productivity and efficiency gains. This is not
surprising since Bt maize reduce the amount of pesticide application. This is consistent with
the expectation that farmers are likely to invest in technologies that enable them to maximize
production and are compatible with their farming systems (Keetch et al., 2005; Brookes &
Barfoot, 2005; Gouse et al., 2006, Huesing & English, 2004).
The significant but negative effect of the perception that availability of markets affects Bt
maize crop planting decision suggests that, households who plant Bt maize for subsistence
are 0.192 fold more inclined to adopt Bt maize as compared to households who produce for
the market. This consistent with the expectation those smallholder farmers are more likely to
produce for their own subsistence. In a study by Baiphethi and Jacobs (2009) on the
contribution of subsistence farming to food security in South Africa, it was concluded that to
achieve a significant impact on food security the low productivity of smallholder/subsistence
agriculture sector needs to be improved through use of improved inputs. This further suggests
that Bt maize is one of the ways through which smallholder farmers can be more food secure.
In addition, this observation reveals lack of emphasis on focusing to produce for the market
by co-operatives and smallholder farmers as well.
An unexpected sign was made on the perception that gene erosion affects my Bt maize crop
planting decisions which was significant at the 5 percent significance level. The positive
relationship implies that smallholder farmers who are concerned about gene erosion have
4.009 fold chance to produce Bt maize as compared to those who are not. Farmers in
Flagstaff also indicated that they did not notice any signs of gene erosion through cross
pollination and/or farmers completely dumping their traditional seeds and other improved
hybrids for Bt maize.
As anticipated, the perception that farmers in general have a sufficient knowledge of
yieldgard/Bt maize proved to be significant (0.072). The positive coefficient suggests that
smallholder farmers who are well informed or more knowledgeable about the attributes of Bt
maize have a 4.123 fold chance of adopting Bt maize as compared to those who are not well
93
informed. The high odds ratio of 4.123 reveals that farmers‟ knowledge of Bt maize has a
strong influence on adoption of Bt maize. This concurs with the observation made by Khan et
al. (2008) in a related study who concluded that extension to address the information
disequilibrium significantly influences adoption of a new technology. In Flagstaff, the
farmers who did not use Bt maize proved only to have abstract knowledge of the technology.
Unlike prior expectations that the perception that Bt maize improves the overall quality and
nutritional values of food products would positively influence adoption of the technology,
there was a negative and significant relationship. Thus the perception that Bt maize improves
the overall quality and nutrition values of food products was associated with a 0.071 fold
decrease in the odds that a smallholder farmer had adopted Bt maize. This suggests that
overall quality and nutrition of Bt maize is not the chief driver amongst the attributes of Bt
maize to result in higher adoption of the technology. Since most of the household heads are
older farmers, perhaps the new different taste rather than nutrition partly reduces appreciation
of the technology.
The perception that food containing genetically modified ingredients should be labelled as
such (a one-unit increase in the weighted factor score) was associated with a 0.202-fold
decrease in the odds that a smallholder farmer had grown Bt maize. This suggests that
smallholder farmers do not accept use of gene technology in food production. The low odds
ratio indicates that genetic modification of food products has low influence on adoption of
GM inputs.
6.3. Summary
This chapter provided empirical evidence of perceptions factors influencing seed variety
choices among smallholder and emerging farmers in Flagstaff. These perceptions influencing
choices were defined and tested using the binomial logistic regression model. The statistically
significant predictor variables, at the 5% level are as follows; Bt maize generates lower
expenses per hectare than conventional maize, availability of markets affects Bt maize crop
planting decision, gene erosion affects my Bt maize crop planting decisions, farmers in
general have a sufficient knowledge of yieldgard/Bt maize, Bt maize improves the overall
quality and nutritional values of food products and food containing genetically modified
ingredients should be labelled as such.
94
Based on the results of this study, several suggestions can be made on how smallholder
farmers can benefit from the production of Bt maize. Generally, the findings suggest that an
adjustment in each one of the significant variables can significantly influence the probability
of adopting the technology. That is production methods that affect such variables can help
farmers encourage adoption of Bt maize. It is important to identify the ideal production
changes and institutional development pathways that suit the smallholder farmers. In coming
up with different ways of incorporating smallholder farmers in mainstream agriculture, it has
to be accepted that smallholder farmers cannot individually compete against commercial
farmers in reaping benefits. In addition, it is difficult for them source Bt maize seed
individually, owing to a small quantities they purchase. This leads to the next chapter were
policy recommendations for increasing Bt maize production are suggested.
95
CHAPTER 7: SUMMARY AND POLICY RECOMMENDATIONS
7.1. Introduction
Technology availability, institutional support and the participation of the farmers in the
process of technology generation and transfer provided incentives that enhanced the
technology transfer and adoption. However, expansion in production depended on availability
and affordability of improved technologies, particularly seed and fertilisers.
Smallholder farmers in Eastern Cape Province have potential to contribute to food security in
the rural areas, reduce poverty and income disparity, and hence contribute to economic
growth. Farmers have not yet reaped the full benefits potential of this technology since due to
the small scale of production. It is argued that there is need for smallholder farmers to
increase adoption of improved maize varieties such as Bt maize and venture into commercial
farming, if they are to contribute to the economic growth. However, it has observed that
smallholder farmers are restricted by a number of institutional arrangements, technical factors
and perceptions, making it difficult for them to commercialise.
The purpose of this study was to explore Flagstaff, smallholder farmers‟ production
characteristics, institutional factors and their perceptions of Bt maize and analyze the impact
of they pose on choices pertaining to the genetically modified maize seed. The results of this
study however shown that although the geographic area was small where household heads are
relatively homogeneous, perceptions can be used to distinguish between those who plant Bt
maize and those who do not. In other words, it considered perceptions that guide farmers in
deciding whether to adopt or not. Besides that, an investigation into factors and institutional
arrangements that influence the choice was conducted. The empirical results of this study
agree with literature that identifies that smallholder farmers face a number of are restricted by
perceptions relating to attributes of Bt maize, institutional arrangements and factors in
adopting the technology. Hence this forces them to discontinue use of Bt maize or even not to
plant it completely.
7.2. Summary
All the chapters that were included in the study are summarized in this section, which include
the literature review, the methodology and the study results.
96
7.2.1. Literature review
Maize is the staple food for most South Africans. This reveals how maize plays a critical role
in food security for many poor households. The per capita consumption of maize is above
100kg. On a yearly basis, a household of seven people in the rural areas consumes
approximately 1.5 tonnes. Although smallholder farmers produce mostly for subsistence, in
some instances they fail to meet production levels which guarantee household food security
due to maize stalk borer damage. Furthermore, damage of the maize crop does not only affect
household food security but it goes on to reduce household savings as smallholder farmers
find themselves in a situation where they have to supplement own production with maize
meal purchases from the local shops.
Bt maize has proved to be a safe and effective product, having undergone rigorous testing for
food and feed safety, providing environmentally friendly and effective control of targeted
pests, with resistance durability extending beyond seven years. However, smallholder farmers
rarely follow the right Bt maize production measures such as having a refuge to minimize
resistance by stalk boring pests.
Many authors concur that smallholder farmers reap many benefits through production of Bt
maize. However, the cost of Bt maize seeds is quite prohibitive. Although Bt maize is
regarded as a scale neutral technology due to its divisibility, smallholder farmers are faced
with the challenge of raising enough money to purchase the commonly found 25 kg bags.
Furthermore, it is argued that it is planting Bt maize during years of low pest infestation is not
profitable. This suggests that, although Bt maize acts as insurance against economic losses
from damage by stalk boring insects smallholder farmers are discouraged to produce Bt
maize crops. When smallholder farmers encounter such high input costs, they end up
discontinuing planting Bt maize seeds or even broadening their activities to non-agricultural
sources of income. Such actions have negative impact not only on household level food
security but on the agricultural sector as a whole.
Governments, with the support of donors, should be encouraged to provide an adequate legal
framework for the upgrading of informal to semiformal and semiformal to formal
microfinance institutions; and for the establishment of networks and their apex organizations
for guidance, training, consultancy services, self-regulation and supervision, liquidity
exchange and refinancing. If this is achieved, it implies that access to credit for smallholder
97
farmers will improve and probably lead to an increase in adoption of Bt maize and other
improved inputs in production. Furthermore, it is argued that establishment of co-operatives
can help facilitate better access to improved inputs such as Bt maize.
7.2.2. Research methodology
The study was carried out in two villages near Flagstaff town, which is situated in the O. R.
Tambo District Municipality which falls under the Eastern Cape Province of South Africa.
Farmers were divided into two groups depending on adoption of Bt maize. Purposive
sampling technique was used to select the two villages, namely Xopozo and Mtwaku. The
random sampling method was then used to select 59 smallholder farmers in Xopozo village
and 31 in Mtwaku village in order to come up with 90 farmers. In total 45 smallholder
farmers who adopted Bt maize were interviewed and the other 45 were non-adopters. A
questionnaire and a checklist were used as the primary tool for data collection and the process
of collecting data involved focus group discussions as well as face-to-face interviews with the
household head.
Data analysis involved use of descriptive statistics, gross margin analysis and the binomial
logistic regression model. The main descriptive indicators that were employed were
frequency and mean values. According to Barnard and Nix (1999) gross margin of farming
enterprise is its output less the variable cots attributed to it. This suggests that, to evaluate the
economic viability of adopting Bt maize gross margins had to be calculated for each farming
unit. The binomial logistic regression model was used to test the farmers‟ perceptions to
attributes of Bt maize that influence households from adopting Bt maize. Binomial logistic
regression model was chosen because it is useful in analysing data where the researcher is
interested in finding the likelihood of a certain event occurring. In addition to that, decisions are the
dichotomous criterion variables and their perceptions are the predictor variables.
7.2.3. Descriptive statistics results
The descriptive results provided information related to demographic, socio-economic, crop
production and institutional arrangements. The results indicate that the majority of the
sampled household heads are above 56 years of age and relatively older farmers were the
most adopters of Bt maize. The educational levels of all the farmers are generally low, where
18 percent never attended school and 39 percent have achieved primary education only. Most
farmers in the sample were females. Due to low levels of education, there were very few
98
farmers who earned above R6000 and government welfare grants major source of household
income in both the two villages. The majority of the sampled farmers had access to relatively
small arable land areas of approximately 2 hectares and had no title deeds for the land.
However, the minimum area under maize was found to be 0.5 hectares and the maximum was
11 hectares. Generally, yields are slightly above tonne per hectare.
More than half of farmers in both categories indicated that they practice mixed farming and it
is common for smallholder farmers to intercrop maize with other crops. Adopters were found
to experience relatively low yield loss due to maize stalk borer damage as compared to non-
adopters of Bt maize. Although farmers use Bt maize to fight pest they still make use of other
forms of fighting pests. Furthermore, most households who adopted Bt maize tend to
discontinue planting it most due to its higher price. In addition, although farmers find it easier
to access Bt maize through affiliating to co-operatives, contractors plant the fields late
therefore affecting the yields obtained by farmers.
7.2.4. Gross margin analysis results
The results of the gross margin analysis revealed that adopters of Bt maize seed had 27.6
percent yield advantage as compared to non-adopters. However, the cost of producing Bt
maize per hectare was 8.5 percent higher which was relatively lower than expected.
Furthermore, co-operatives are important in reduction production costs.
Adopters of Bt maize had a higher gross margin as compared to non-adopters. Bt technology
contributed to a gross margin per hectare of R1752.34 as compared to non-adopters R917.43.
These findings therefore indicate that planting Bt maize in Flagstaff is 47.6 percent more
profitable as compared to planting non-Bt maize seed. Hence, it is economically feasible to
produce Bt maize crops under smallholder conditions in Flagstaff.
7.2.5. Binomial logistic regression results
The results of the binomial logistic regression model revealed that the choice of seed is
significantly influenced by farmers‟ perceptions. The statistically significant predictor
variables, at the 5% level are the perceptions that; Bt maize improves the quality and
nutritional values of food products, Gene erosion affect my Bt maize crop planting decisions
and food that contains genetically modified ingredients should be labelled as such. The
99
explanations for the relationship between the significant variables and adoption of Bt maize
can be summarised as follows:
Smallholder farmers who are concerned about gene erosion are more inclined to
produce Bt maize as compared to those who are not.
Overall quality and nutrition of Bt maize is not the chief driver amongst the attributes
of Bt maize to result in higher adoption of the technology.
Smallholder farmers do not accept use of gene technology in food production and as a
result they are not willing to adopt Bt maize.
The statistically significant predictor variables, at the 10% level are the perceptions that; Bt
maize generates lower expenses per hectare than conventional maize, availability of maize
markets affect Bt maize planting decisions and Farmers in general have a sufficient
knowledge of Bt maize. The explanations for the relationship between the significant
variables and adoption of Bt maize can be summarised as follows:
Households who plant Bt maize for subsistence are more inclined to adopt Bt maize
as compared to households who produce for the market.
Smallholder farmers who are well informed or more knowledgeable about the
attributes of Bt maize are more likely to adopt it as compared to those who are not
well informed.
Ability to meet low expenses per hectare for Bt maize crop production can further
draw farmers towards Bt maize.
Policy targeted at improving adoption of Bt maize seed as are discussed in the following
section. It is also important for the farmers to identify the areas where they can have a direct
impact and make efforts to address them.
7.3. Policy recommendations
The primary policy challenges revealed by the empirical results are suggested in this section.
A number of options to develop policies and mechanisms that will harness the potential of Bt
maize in the Eastern Cape Province and South Africa as a whole to benefit smallholder maize
farmers are given below.
The range of biotechnology applications has to be expanded
100
To address constraints that affect farmers in poor countries: drought-resistant and salt-tolerant
varieties as well as varieties that will nutritionally enrich staple foods.
Improve credit availability
The results of this study revealed that farmers did not use institutions such as banks to source
credit. However, they rely heavily on government welfare grants. These results also suggest
that limited access to credit may slow or reduce adoption of Bt maize by smallholder farmers
owning small farms. Thus, institutional policies that increase availability of credit are needed.
For example, instalment plans that require payment of biotechnology „fees‟ on a season-by-
season basis for farmers utilising transgenic seeds, rather than significant up-front fees, will
improve adoption substantially for poor farmers.
Reduction in the cost of intellectual property rights (IPRs) for agricultural
biotechnology
It has been highlighted in the study that smallholder farmers are continuously discontinuing
planting Bt maize mainly due to the seed‟s higher price relative to non-Bt maize varieties.
Hence this leads reduction in access of Bt technology under smallholder farmers‟ sector. In
an effort to make increase access to Bt maize, formation of organisations that aim to reduce
the cost of IPRs for agricultural biotechnology for smallholder farmers. However, in their
planning process, it is imperative for these organisations to consider the non-homogeneity of
smallholder farmers mainly in terms their age, incomes, sources of farming capital and levels
of pest infestation in their respective geographic locations
Promote ways of collective action through formation of farmers’ organizations.
Results of this study revealed that smallholder farmers have better access to Bt maize when
they are part of an organisation. Besides that, it was also revealed that although Bt maize is
divisible technology it is still a challenge for smallholder farmers to source Bt maize
individually. Having noted that, it is important to establish collective action as institutional
means to bolster adoption of Bt maize by smallholder farmers. On the inputs market,
collective action is encouraged because it establish a base for which smallholder farmers can
employ for bargaining power purposes. In addition to that, the transaction costs for both
parties, that is, seed company and the farmer are reduced.
Poverty alleviation
101
If poverty alleviation is also part of the objectives of adopting Bt maize in the smallholder
farming environment then there is need to do more than promote subsistence. Adoption of Bt
maize must provide opportunities for rural households to improve and diversify their
livelihood options and, in particular, enhance the contribution that maize production make to
household incomes. However, these incomes do not have to be large or equivalent to full time
wage employment but should also supplement incomes derived from a number of other non-
agricultural activities or remittances. In order to achieve this, rural people in areas like
Flagstaff need more support services and effective access to markets for inputs and outputs.
Ensure the availability of information to smallholder farmers
It has been highlighted in the study that farmers‟ knowledge is has significant influence on
adoption of Bt maize. These results therefore suggest that market information should be
consistently supplied to the farmers through the help of both private and governmental
organizations such as the National Department of Agriculture. In an effort to make
information available, it is important to know the all the relevant attributes of Bt technology
and educate the farmers on how to use the information. In addition, it is vital to devise ways
of disseminating the information, in order to reach all the smallholder farmers. However,
when formulating such ways, it is important to consider the non-homogeneity of smallholder
farmers, in terms of education, location and the availability of communication assets such as
television sets and radios with programs conducted in different languages and farmer
workshops can be considered for information dissemination. Besides that, the importance of
labels as a source of information in capacitating informed choices amongst smallholder
farmers should not be neglected.
7.4. Areas for further research
Most of the sampled farmers in the studied area have low household. Therefore, there is need
for further research, in order to ensure the influence of household income on adoption of Bt
maize. That is, there is need to ensure whether high incomes will result in increased adoption.
It has been identified, under the policy recommendations that farmer co-operation can
improve adoption of Bt maize. Future research which involves identifying the methods of
introducing successful farmer groups can be beneficial, because farmer co-operations also
have their challenge. In addition, the ways of linking the farmer groups to contractors and
reducing transaction costs needs to be researched.
102
This study mainly focused on characteristics of smallholder farmer, profitability of planting
Bt maize and influence of perceptions pertaining to attributes of Bt maize. There is need for
further research on the influence of institutions.
103
REFERENCES
Aerni, P. 2004. Stakeholder perceptions towards agricultural biotechnology in Mexico. Int.
Journal of Agricultural Resources, Governance and Ecology 3(2): 95 – 115. Online:
http://agecon.lib.umn.edu. Accessed: 16 March 2008.
Assefa, Y., van den Berg, J. and Conlong, D. E. 2008. Farmers‟ perceptions of sugar cane
stem borers and farm management practices in the Amhara region of Ethiopia.
International Journal of Pest Management 54: 210 – 226.
Bagheri, A., Fami, H. S., Rezvanfar, A. A, and Yazdani, S. 2008. Perceptions of paddy
farmers towards sustainable agricultural technologies: Case of Haraz catchments area
in Mazandaran Province of Iran. American Journal of Applied Sciences 5(10): 1384 –
1391.
Baiphethi M. N. and Jacobs, P. T. 2009. The contribution of subsistence farming to food
security in South Africa. Agrekon 48(4): 459 – 482.
Barnard, C. S. and Nix, J. S. 1999. Farm planning and control. New York: Cambridge
University Press.
Bembridge, T. J. 1988. Considerations in technology transfer in less developed areas of
Southern Africa. Development Southern Africa 5(2): 212 – 227.
Bielders, C. L., Ramelot, C. and Persoons, E. 2003. Farmer perception of runoff and erosion
and extent of flooding in the silt-loam belt of the Belgian Walloon Region,
Bless, C. and Smith, H. C. 2000. Fundamentals of Social Research Methods: An African
Experience (3rd
Edition). Cape Town: Juta Publishers.
Brookes, G. 2002. The farm level impact of using Bt maize in Spain. Brussels: EuropaBio.
Online: www.europabio.org/documents/gbgmcrops/BT. Accessed: 2 May 2010.
Brookes, G. and Barfoot, P. 2005. GM Crops: The Global Economic and Environmental
Impact – The first nine years 1996 – 2004. AgBioForum 8(3): 187 – 196. Online:
www.agbioforum.org/v8n23/v8n23a15-brookes.pdf. Accessed: 09 March 2008.
Chabane, N. 2002. An Evaluation of the Influences on Price and Production in the Maize
Market following Liberalisation. Annual Trade and Industrial Policy Strategies,
Muldersdrift, South Africa. Online: http://www.tips.org.za/files/566.pdf. Accessed: 15
September 2010.
104
Chimmiri, N., Tudor, K. W. and Spaulding, A. D. 2006. An analysis of McLean County,
Illinois farmers‟ perceptions of Genetically Modified Crops. AgBioForum 9(3): 152 –
165. Online: www.agbioforum.org. Accessed: 20 March 2010.
Cutts, M., Hassan, R. and Rashid, M. 2003. An Econometric Model of the SADC Maize
Sector. Symposium Proceedings 41st Annual Conference of the Agricultural
Economic Association of South Africa (AEASA), Pretoria, South Africa. Online:
http://ageconsearch.umn.edu/bitstream/19075/1/cp03cu01.pdf. Accessed: 06 January
2011.
De Grassi, A. 2003. Genetically Modified Crops and Sustainable Poverty Alleviation in Sub-
Saharan Africa: An Assessment of Current Evidence. Third World Network – Africa.
De Groote, H., Hugo, S., Bervinson, D. and Odhiambo, B. 2004. Debunking the myths of
GMO crops in Africa: The case of Bt maize in Kenya. Kenya Agricultural Research
Institute (KARI), Nairobi, Kenya. Online: http://agecon.lib.umn.edu. Accessed: 15
April 2010.
De Lange, A. 2004. The evaluation of empowerment policies, strategies and performance
within the agricultural sector. National Department of Agriculture (NDA), Eastern
Cape.
Delgado, C. 1999. Sources of growth in smallholder agriculture in Sub-Saharan Africa: The
role of vertical integration of smallholders with processors and marketers of high-
value added items. Agrekon 38(Special Issue): 165 – 189.
Delmer, D. P. 2005. Agriculture in the developing world: Connecting innovations in plant
research to downstream applications. PNAS. Online: www.pnas.org. Accessed: 05
June 2010.
Dent, D., 2000. Insect Pest Management. London: CABI Publishing.
DST (Department of Arts, Culture, Science and Technology). 2001. Annual report. Pretoria.
DEDEA (Department of Economic Development and Environmental Affairs). 2010. The
Eastern Cape: Economic Profile and Outlook. Online:
www.dedea.gov.za/Newsletters%20and%20Publications/EC%20Economic%20Outlo
ok%20Book.pdf. Accessed: 10 May 2010.
Department of Social Development, 2009. Draft Conceptual Framework Towards Poverty
Eradication in the Eastern Cape. Online: www.socdev.ecprov.gov.za. Accessed: 22
May 2010.
Dougherty, C. 1992. Introduction to Econometrics. New York: Oxford University Press.
105
Erickson, S. P., Akridge, J. T. and Barnard, F. L. 2002. Agribusiness Management 3rd
edition.
New York: McGraw Hill.
ECDC (Eastern Cape Province Development Corporation). 2008. The Eastern Cape Province
Map. Online: www.ecdc.co.za/files/documents/120608151855.jpg. Accessed: 15
September 2008.
FAO (Food and Agricultural Organisation of the United Nations). 2011. GIEWS Country
Briefs: South Africa. Rome. Online:
www.fao.org/giews/countrybrief/country.jsp?code=ZAF. Accessed: 06 January 2011.
Fernandez-cornejo, J. and Mc Bride, W. D. 2002. Adoption of bioengineered crops.
Agricultural Economic Report. 810: Economic Research Service, United States
Department of Agriculture. Washington, D. C. Online:
www.ers.usda.gov/Publications/AER810. Accessed: 28 April 2010.
Flannery, M., Thorne, F. S., Kelly, P. W. and Mullins, E. 2004. An economic cost-benefit
analysis of GM Crop cultivation: An Irish case study. AgBioForum 7(4): 149 – 157.
Online: www.agbioforum.org/v7n4/v7n4a01-mullins.pdf. Accessed: 22 April 2008.
Gouse, M., Pray, C. and Schimmelpfennig, D. 2004. The distribution of benefits from Bt
cotton adoption in South Africa. AgBioForum 7(4): 187 – 194. Online:
www.agbioforum.org. Accessed 27 April 2010.
Gouse, M., Pray, C., Kirsten, J. F. and Schimmelpfennig, D. 2005. A GM subsistence crop in
Africa: the case of Bt white maize in South Africa. International Journal of
Biotechnology 7(2): 84 – 94.
Gouse, M., Pray, C., Schimmelpfennig, D. and Kirsten, J. 2006. Three seasons of subsistence
insect-resistant maize in South Africa: Have smallholders benefited? AgBioForum
9(1): 15 – 22.
Gujarati, D. 1992. Essentials of Econometrics. New York: McGraw–Hill.
Haasbroek, L. F. 2004. The effect of genetically modified maize on biodiversity in South
Africa. Unpublished MSc Thesis, Department of Geography, Environmental
Management and Energy Studies University of Johannesburg, Johannesburg, South
Africa.
Hill, R. C., Griffiths, W. E. and Judge, G. G. 2001. Econometrics (2nd
Edition). New York:
John Wiley & Sons.
106
Hofs, J., Fok, M. and Vaissayre, M. 2006. Impact of Bt cotton adoption on pesticide use by
smallholders: A 2-year survey in Makhatini Flats (South Africa). Crop Protection
25(1): 984 – 988. Online: www.sciencedirect.com. Accessed: 20 April 2010.
Huesing, J. and English, L. 2004. The Impact of Bt Crops on the developing world.
AgBioForum 7(1&2): 84 – 95. Online: www.agbioforum.org/v7n12/v7n12a16-
huesing.pdf. Accessed: 15 September 2010.
ICMR (Indian Council of Medical Research). 2004. Regulatory regimen for genetically
modified foods the way ahead. Online:
www.tccouncil.org/reports/ICMR_GM_foods.pdf. Accessed: 28 February 2008.
IFAD (International Fund for Agricultural Development). 2001. Rural Finance: from
unsustainable projects to sustainable institutions. Online: www.ifad.org. Accessed: 04
June 2010.
IIED (International Institute for Environment and Development). 2010. Participatory
Learning and Action: Community-based adaptation to climate change. 60: 1 – 221.
Online: http://pubs.iied.org/pdfs/14573IIED.pdf. Accessed 7 January 2010.
Ismael, Y., Bennett, R. and Morse, S. 2002. Farm-level economic impact of biotechnology:
Smallholder Bt cotton farmers in South Africa. Outlook on Agriculture 31(2): 107 –
111.
Keetch D. P., Webster, J. W., Ngqaka, A., Akanbi, R. and Mahlanga, P. 2005. Bt maize for
small scale farmers: A case study. African Journal of Biotechnology 12(4): 1505 –
1509. Online: www.biw.kuleuven.be/aee/clo/euwab_files/Keetch2005.pdf. Accessed:
20 April 2010.
Kfir, R. 1997. Natural control of the cereal stem borers Busseola fusca and Chilo partellus
in South Africa. Insect Science and its Application 17(1): 61 – 67. Online:
http://agecon.lib.umn.edu. Accessed: 15 May 2010.
Khan, Z. R., Amudavi, D. M., Midega, C. A. O., Wanyama, J. M. and Pickett, J. A. 2008.
Farmers‟ perceptions of a „push–pull‟ technology for control of cereal stem borers and
striga weed in western Kenya. Crop protection 27: 976 – 987.
Kolady, D. E. and Lesser, W. 2006. Who adopts what kind of technologies? The case of Bt
eggplant in India. AgBioForum 9(2): 94 – 103.
Leedy, P. and Ormrod, J. 2004. Practical Research: Planning and Design (8th
Edition). New
York: Prentice Hall
107
Lemaux, P. G. 2009. Genetically engineered plants and foods: A scientist‟s analysis of the
issues (Part II). Annual Reviews of Plant Biology 60(3): 511 – 559. Online:
www.plant.annualreviews.org. Accessed: 02 June 2010.
Makinde, M. O., Webster, J. R., Khumalo, N. and Keetch, D. P. 2007. Role of agricultural
biotechnology in hunger and poverty alleviation for developing countries.
Online:www.europabio.org/GreenManifesto/South%20African%20REPORT%20%20
FINAL.pdf. Accessed 02 April 2010.
Mohammed, M. A. and Ortmann, G. F. 2005. Factors influencing adoption of livestock
insurance by commercial dairy farmers in Three Zobatat of Eritrea. Agrekon 44(2):
172 – 186.
Montalto, C. P. and Gerner, J. L. 1998. The effect of expected changes in marital status on
labour supply decisions of women and men. Journal of Divorce and Remarriage
28(3/4): 25 – 51.
Mugo, S., De Groote, H., Bergvinson, D., Mulaa, M., Songa, J. and Gichuki, S. 2005.
Developing Bt maize for resource-poor farmers – Recent advances in the IRMA
project. African Journal of Biotechnology 13(4): 1490 – 1504. Online:
www.academicjournals.org/AJB. Accessed 23 April 2010.
Ngqangweni, S. 1999. Rural growth linkages in the Eastern Cape Province of South Africa.
International Food Policy Research Institute (IFPRI), Washington D.C. Online:
www.ifpri.org/divs/mtid/dp/papers/dp33.pdf. Accessed: 05 April 2010.
Ngqangweni, S. and Delgado, C. 2003. Decisions on livestock keeping in the semi-arid areas
of Limpopo Province. Working Paper, Department of Agricultural Economics,
Extension and Rural Development, University of Pretoria, Pretoria.
Ortmann, G. F. and King, R. P. 2006. Small-scale farmers in South Africa: Can agricultural
cooperatives facilitate access to input and product markets? Agrekon 46(2): 219 –
244.
Owuor, G., Smale, M. and De Groote, H. 2004. Crop biotechnology for Africa: Who will
gain from adopting Bt maize in Kenya? Paper presented at the American Agricultural
Economics Association Annual Meeting, Denver, Colorado. Online:
http://ageconsearch.umn.edu/bitstream/20379/1/sp04ow01.pdf. Accessed: 08 July
2010.
108
Pray, C., Rheeder, J., Gouse, M., Volkwyn, Y., van der Westhuizen, L. and Shephard, G. S.
2009. Can Bt maize reduce exposure to the mycotoxin fumonisin in South Africa?
Symposium Proceedings International Association of Agricultural Economists,
Beijing, China. Online: http://purl.umn.edu/51739. Accessed: 2 April 2010.
Qaim, M. 2009. The economics of genetically modified crops. Annual Review of Resource
Economics 1(3): 665 – 694.
Raman. S. 2006. Agricultural sustainability: Principles, processes and prospects. New York:
Haworth Press.
Randela, R., Liebenberg, C. F., Kirsten, J. F. and Townsend, R. F. 2000. Demand for
livestock tick control service in the Venda region, Northern Province. Agrekon 39(4):
644 – 655.
Ruttan, V. W. and Hayami, Y. 1984. Induced Innovation Model of Agricultural Development.
In Eicher, C. K., & Staatz, J. M. (Eds). London: UK. John Hopkins University Press.
Saunders, J. 2004. Sowing the seeds: Supporting smallholder farmers in South Africa.
FARM-Africa, South Africa. Online: www.farmafrica.org.uk. Accessed: 25 May
2010.
Scatasta, S., Wesseler, J. and Demont, M. 2005. Irreversibility, uncertainty, and the adoption
of transgenic crops: Experiences from applications to HT sugar beet, HT maize, and
Bt maize. Paper presented at the European Association of Agricultural Economists,
International Congress, Copenhagen, Denmark. Online:
http://ageconsearch.umn.edu/bitstream/24758/1/cp05sc03.pdf. Accessed: 03 June
2010.
Thirtle, C., Beyers, L., Ismael, Y. and Piesse, J. 2003. Can GM-technologies help the poor?
The impact of Bt cotton in Makhathini Flats, KwaZulu-Natal. World Development
31(4): 717 – 732.
Van Zyl, J., Coetzee, G. K., Blignaut, C. S., Kirsten, J. K. and Geyser, M. 2005. Finance and
Farmers: A financial management guide for farmers. Johannesburg: Standard Bank.
Viljoen, C. D., Dajee, B. K. and Botha, G. M. 2006. Detection of GMO in food products in
South Africa: Implications of GMO labelling. Africa Journal of Biotechnology 5(2):
73 – 82.
Visagie, S. E. and Ghebretsadik, A. H. 2005. Modelling risk in farm planning. Agrekon 44(4):
561 – 585.
109
Wells, M. 2004. South Africa hands over Africa’s future food security to a dishonest foreign
company. TWIG: TWIG Publication. Online:
http://twig.org.za/docs/Vuka%20Africa.pdf. Accessed: 18 April 2010.
Wu, F. 2006. An analysis of Bt corn‟s benefits and risks for national and regional
policymakers considering Bt corn adoption. Int. J. Technology and Globalisation 2
(2): 115 – 136. Online: http://ucbiotech.org/issues_pgl/ARTICLES/Wu_IntlJ_06.pdf.
Accessed: 01 December 2010.
Zilberman, D., Ameden, H. and Qaim, M. 2007. The Impact of Agricultural Biotechnology
on Yields, Risks, and Biodiversity in Low-Income Countries. Journal of Development
Studies 43(1): 63 – 78.

110
ANNEXURE: 1
QUESTIONNAIRE FOR ECONOMICS OF Bt MAIZE/YIELDGARD PRODUCTION IN
SELECTED AREAS OF THE EASTERN CAPE PROVINCE.
Please also be aware that the survey is completely non-discriminatory and the information that you are
about to give merely helps in the interpretation of the results.
BACKGROUND INFORMATION
Date…………………………………………………………
Interviewer………………………………………………….
Province…………………………………………….............
District...................................................................................
Village...................................................................................
A. DEMOGRAPHICS
Fill in the relevant information and where possible mark with an X.
A.1. What is your gender ?
1: Male 2: Female
A.2. What is your age?......................
A.3. Which of the following best describes your marital status?
1: Single 2: Married 3: Widowed 4: Divorced
A.4. What is the size of your household?......................
A.5. Which of the following best describes your religion?
1: Christianity 2: Traditional 3: Other
A.6. How many years of education did you complete?..............
A.7. Indicate the number of employees who assist with farm work
Type of
employee
Full-time Part-time Unpaid family
members
TOTAL
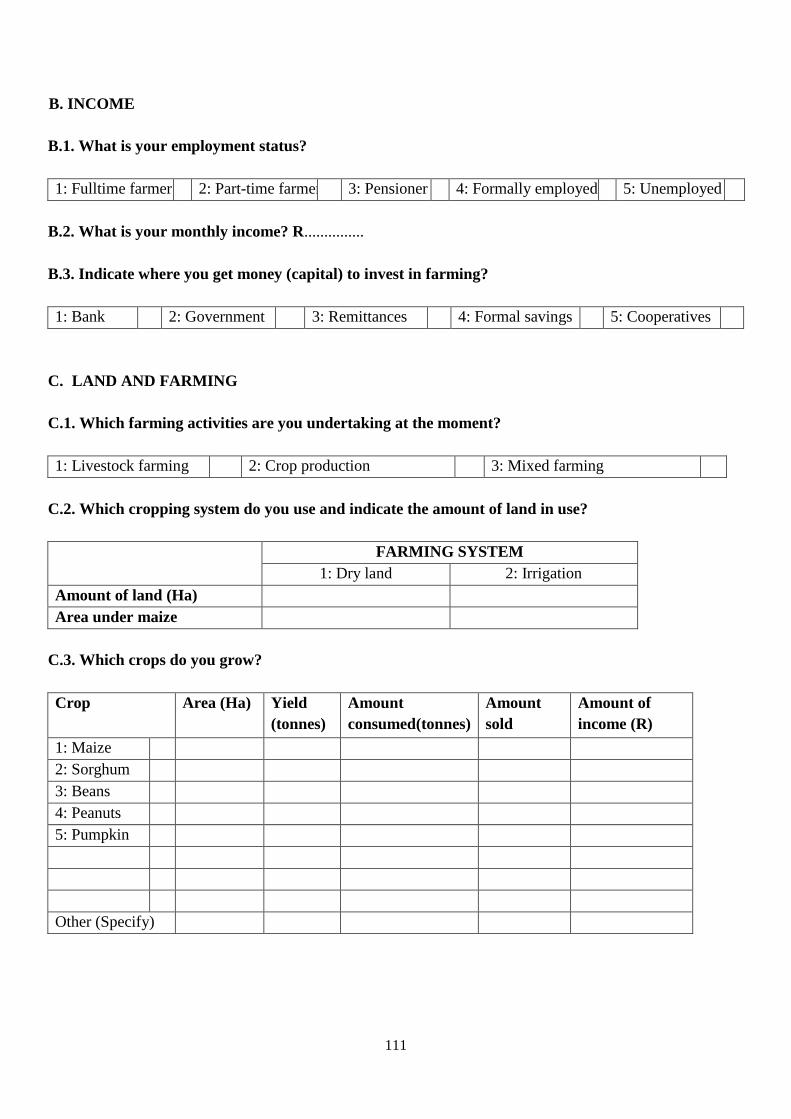
111
B. INCOME
B.1. What is your employment status?
1: Fulltime farmer 2: Part-time farmer 3: Pensioner 4: Formally employed 5: Unemployed
B.2. What is your monthly income? R...............
B.3. Indicate where you get money (capital) to invest in farming?
1: Bank 2: Government 3: Remittances 4: Formal savings 5: Cooperatives
C. LAND AND FARMING
C.1. Which farming activities are you undertaking at the moment?
1: Livestock farming 2: Crop production 3: Mixed farming
C.2. Which cropping system do you use and indicate the amount of land in use?
FARMING SYSTEM
1: Dry land 2: Irrigation
Amount of land (Ha)
Area under maize
C.3. Which crops do you grow?
Crop Area (Ha) Yield
(tonnes)
Amount
consumed(tonnes)
Amount
sold
Amount of
income (R)
1: Maize
2: Sorghum
3: Beans
4: Peanuts
5: Pumpkin
Other (Specify)
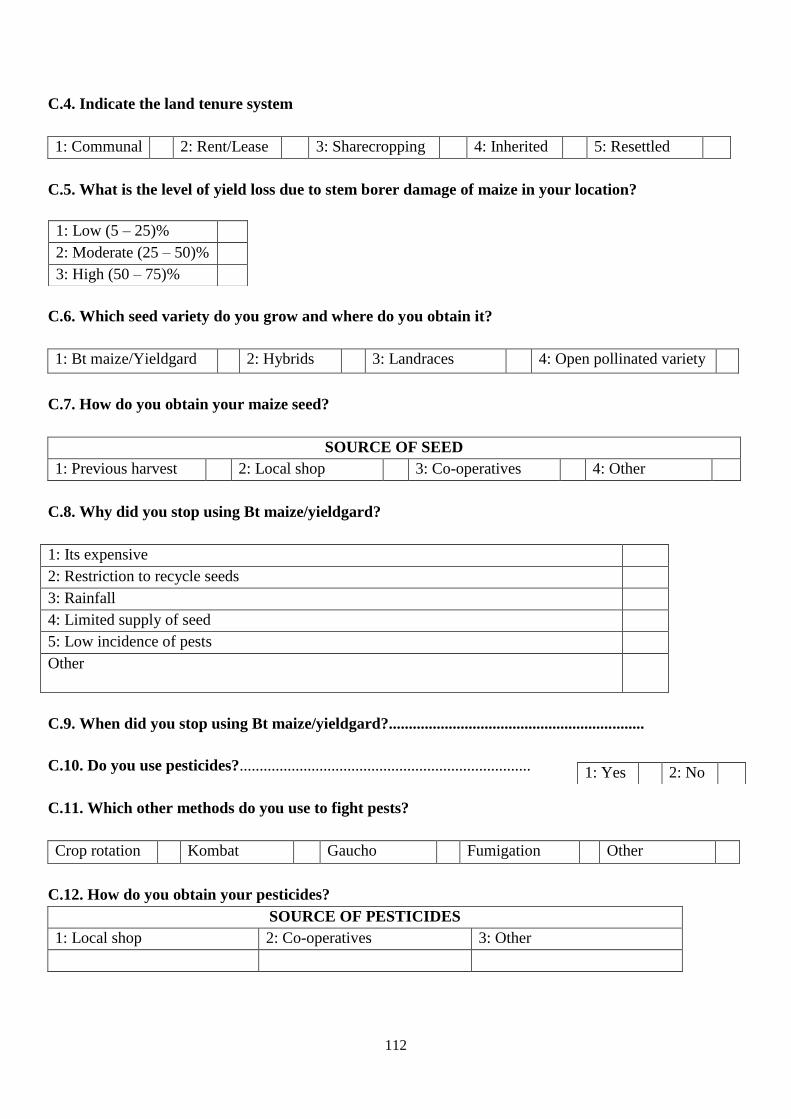
112
C.4. Indicate the land tenure system
1: Communal 2: Rent/Lease 3: Sharecropping 4: Inherited 5: Resettled
C.5. What is the level of yield loss due to stem borer damage of maize in your location?
C.6. Which seed variety do you grow and where do you obtain it?
1: Bt maize/Yieldgard 2: Hybrids 3: Landraces 4: Open pollinated variety
C.7. How do you obtain your maize seed?
SOURCE OF SEED
1: Previous harvest 2: Local shop 3: Co-operatives 4: Other
C.8. Why did you stop using Bt maize/yieldgard?
1: Its expensive
2: Restriction to recycle seeds
3: Rainfall
4: Limited supply of seed
5: Low incidence of pests
Other
C.9. When did you stop using Bt maize/yieldgard?................................................................
C.10. Do you use pesticides?.........................................................................
C.11. Which other methods do you use to fight pests?
Crop rotation Kombat Gaucho Fumigation Other
C.12. How do you obtain your pesticides?
SOURCE OF PESTICIDES
1: Local shop 2: Co-operatives 3: Other
1: Low (5 – 25)%
2: Moderate (25 – 50)%
3: High (50 – 75)%
1: Yes 2: No

113
D. INSTITUTIONAL SUPPORT
D.1. Do you belong to any organisation?
D.2. What motivated you to join the organisation?.....................................................................................
............................................................................................................................................................................
............................................................................................................................................................................
................................
D.3. Indicate which of the following organisations assists you the most in your farming activities
1: Government
2: International non-governmental organisations (NGOs),
3: Community-based organisations (CBOs)
4: Private sector
5: National/provincial NGOs,
6: Donors
7: Other
D.4. Which of the following services do you receive from the organisation as a farmer?
1: Agricultural inputs
2: Extension services
3: Credit
4: Marketing
5: Mechanization
D.5. Indicate challenges which you are facing as a farmer.
1: Major challenge 2: Minor challenge
a) Weak infrastructures
b) New technology
c) Risk mitigation
d) Economies of size and scope in production and distribution
e) Market power/control
f) Meeting quality needs
D.6. Do villagers stick to the enforcement of property rights?
1: Yes 2: No
1: Yes 2: No
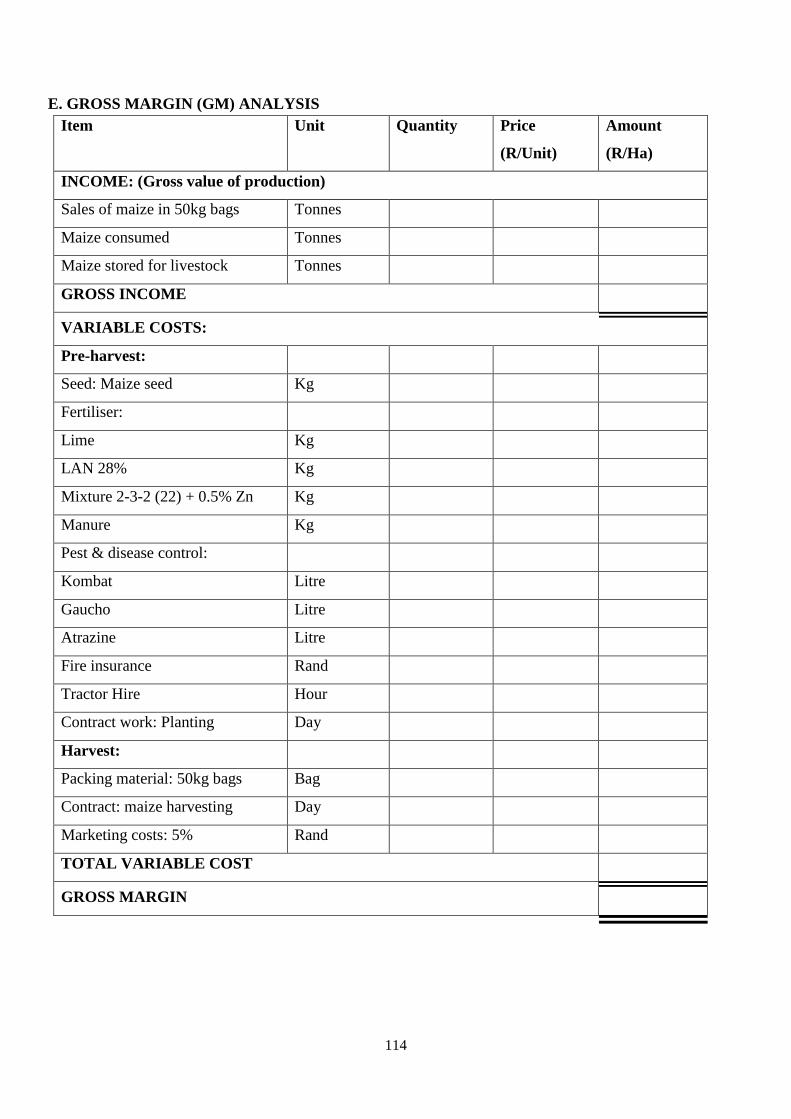
114
E. GROSS MARGIN (GM) ANALYSIS
Item Unit Quantity Price
(R/Unit)
Amount
(R/Ha)
INCOME: (Gross value of production)
Sales of maize in 50kg bags Tonnes
Maize consumed Tonnes
Maize stored for livestock Tonnes
GROSS INCOME
VARIABLE COSTS:
Pre-harvest:
Seed: Maize seed Kg
Fertiliser:
Lime Kg
LAN 28% Kg
Mixture 2-3-2 (22) + 0.5% Zn Kg
Manure Kg
Pest & disease control:
Kombat Litre
Gaucho Litre
Atrazine Litre
Fire insurance Rand
Tractor Hire Hour
Contract work: Planting Day
Harvest:
Packing material: 50kg bags Bag
Contract: maize harvesting Day
Marketing costs: 5% Rand
TOTAL VARIABLE COST
GROSS MARGIN
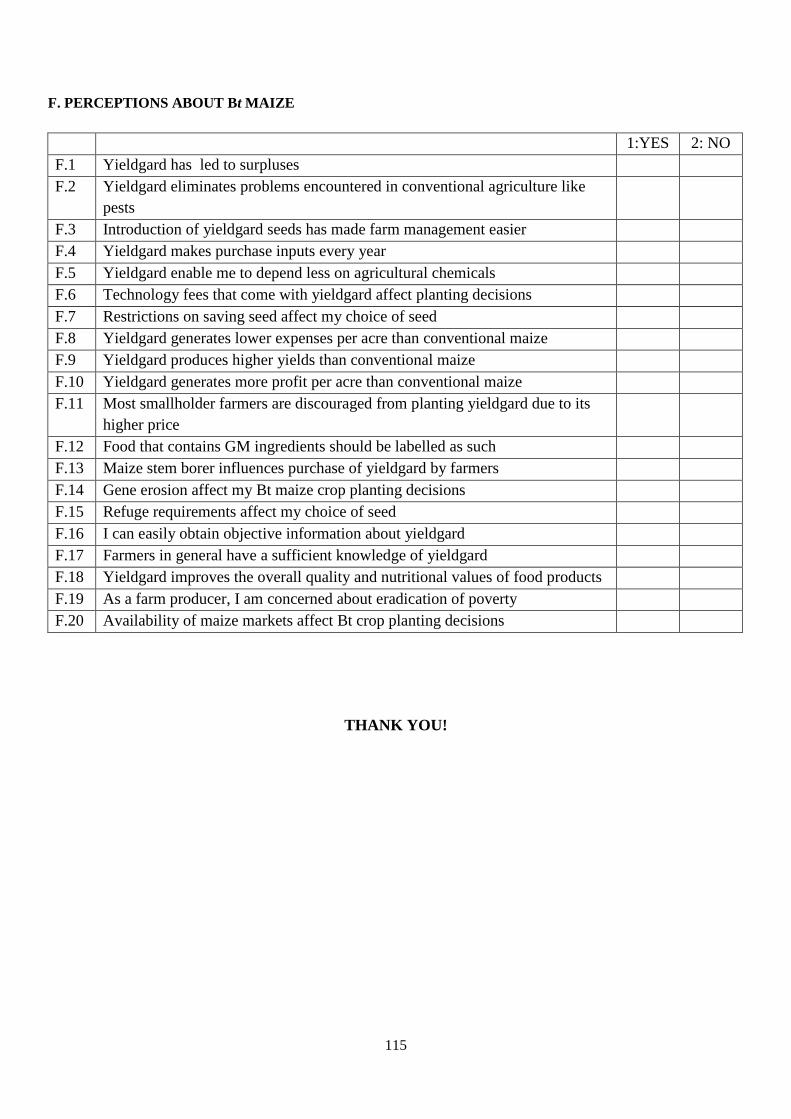
115
F. PERCEPTIONS ABOUT Bt MAIZE
1:YES 2: NO
F.1 Yieldgard has led to surpluses
F.2 Yieldgard eliminates problems encountered in conventional agriculture like
pests
F.3 Introduction of yieldgard seeds has made farm management easier
F.4 Yieldgard makes purchase inputs every year
F.5 Yieldgard enable me to depend less on agricultural chemicals
F.6 Technology fees that come with yieldgard affect planting decisions
F.7 Restrictions on saving seed affect my choice of seed
F.8 Yieldgard generates lower expenses per acre than conventional maize
F.9 Yieldgard produces higher yields than conventional maize
F.10 Yieldgard generates more profit per acre than conventional maize
F.11 Most smallholder farmers are discouraged from planting yieldgard due to its
higher price
F.12 Food that contains GM ingredients should be labelled as such
F.13 Maize stem borer influences purchase of yieldgard by farmers
F.14 Gene erosion affect my Bt maize crop planting decisions
F.15 Refuge requirements affect my choice of seed
F.16 I can easily obtain objective information about yieldgard
F.17 Farmers in general have a sufficient knowledge of yieldgard
F.18 Yieldgard improves the overall quality and nutritional values of food products
F.19 As a farm producer, I am concerned about eradication of poverty
F.20 Availability of maize markets affect Bt crop planting decisions
THANK YOU!

116
ANNEXURE: 2
Bt MAIZE PRODUCTION CHECKLIST
Are maize stem borers a problem in your location?
Which village do you come from?
Which maize variety do you plant?
Where do you obtain your maize seed?
Have you heard of Bt maize?
Is there any other name which you use for Bt maize?
Are there trials going on at present in your location?
Have you purchased Bt maize before?
COMMENTS